Russell Springs, KY Map & Demographics
Russell Springs Map
Russell Springs Overview
$22,057
PER CAPITA INCOME
$68,000
AVG FAMILY INCOME
$34,219
AVG HOUSEHOLD INCOME
14.2%
WAGE / INCOME GAP [ % ]
85.8¢/ $1
WAGE / INCOME GAP [ $ ]
0.49
INEQUALITY / GINI INDEX
2,713
TOTAL POPULATION
1,368
MALE POPULATION
1,345
FEMALE POPULATION
101.71
MALES / 100 FEMALES
98.32
FEMALES / 100 MALES
44.8
MEDIAN AGE
3.5
AVG FAMILY SIZE
2.6
AVG HOUSEHOLD SIZE
1,255
LABOR FORCE [ PEOPLE ]
53.5%
PERCENT IN LABOR FORCE
8.1%
UNEMPLOYMENT RATE
Russell Springs Zip Codes
Russell Springs Area Codes
Income in Russell Springs
Income Overview in Russell Springs
Per Capita Income in Russell Springs is $22,057, while median incomes of families and households are $68,000 and $34,219 respectively.
| Characteristic | Number | Measure |
| Per Capita Income | 2,713 | $22,057 |
| Median Family Income | 632 | $68,000 |
| Mean Family Income | 632 | $68,352 |
| Median Household Income | 1,024 | $34,219 |
| Mean Household Income | 1,024 | $50,289 |
| Income Deficit | 632 | $0 |
| Wage / Income Gap (%) | 2,713 | 14.25% |
| Wage / Income Gap ($) | 2,713 | 85.75¢ per $1 |
| Gini / Inequality Index | 2,713 | 0.49 |
Earnings by Sex in Russell Springs
Average Earnings in Russell Springs are $17,485, $20,188 for men and $17,312 for women, a difference of 14.2%.
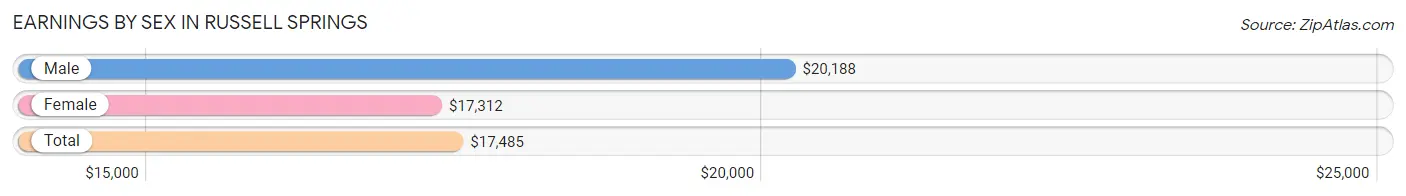
| Sex | Number | Average Earnings |
| Male | 769 (54.2%) | $20,188 |
| Female | 649 (45.8%) | $17,312 |
| Total | 1,418 (100.0%) | $17,485 |
Earnings by Sex by Income Bracket in Russell Springs
The most common earnings brackets in Russell Springs are $5,000 to $7,499 for men (142 | 18.5%) and $15,000 to $17,499 for women (166 | 25.6%).
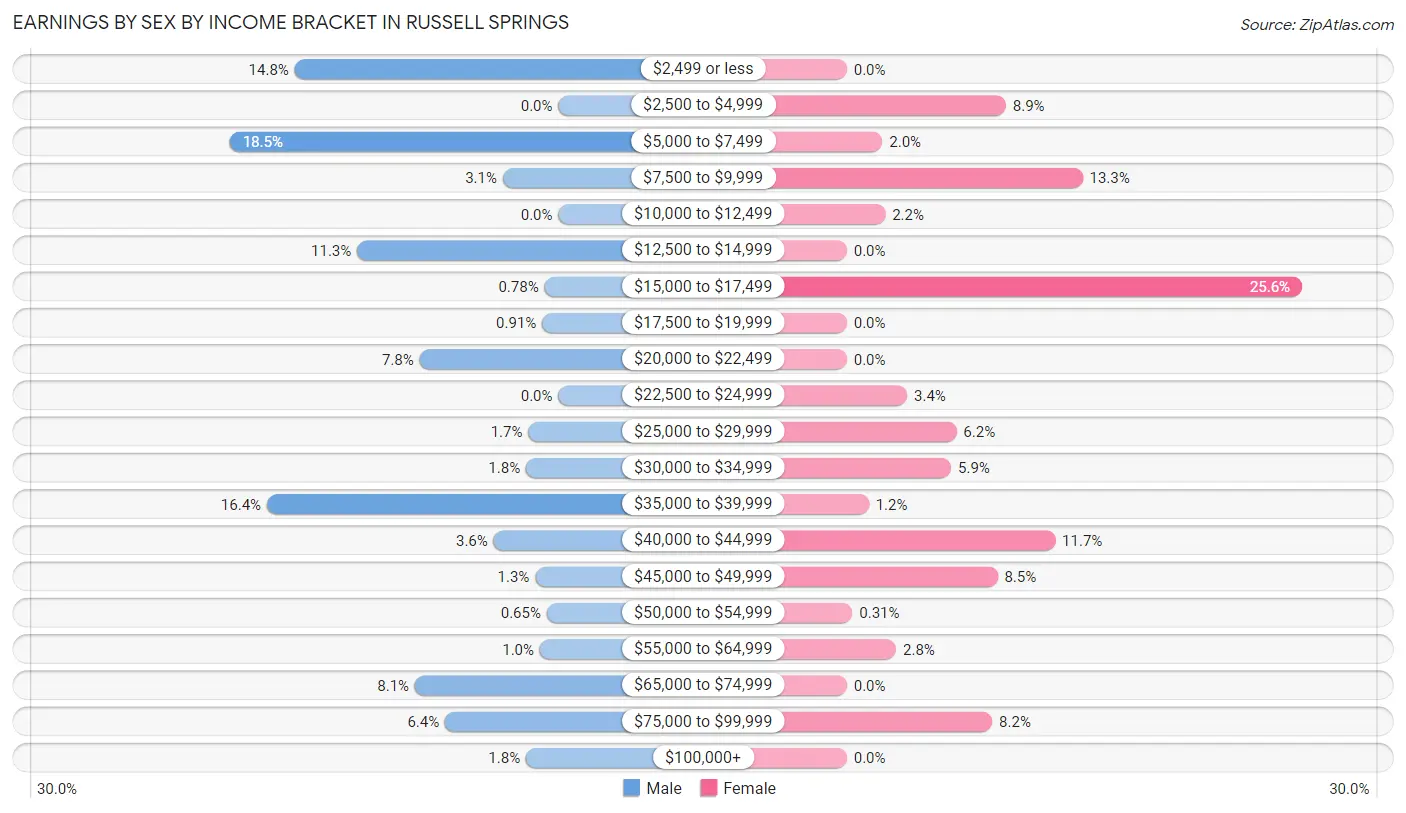
| Income | Male | Female |
| $2,499 or less | 114 (14.8%) | 0 (0.0%) |
| $2,500 to $4,999 | 0 (0.0%) | 58 (8.9%) |
| $5,000 to $7,499 | 142 (18.5%) | 13 (2.0%) |
| $7,500 to $9,999 | 24 (3.1%) | 86 (13.3%) |
| $10,000 to $12,499 | 0 (0.0%) | 14 (2.2%) |
| $12,500 to $14,999 | 87 (11.3%) | 0 (0.0%) |
| $15,000 to $17,499 | 6 (0.8%) | 166 (25.6%) |
| $17,500 to $19,999 | 7 (0.9%) | 0 (0.0%) |
| $20,000 to $22,499 | 60 (7.8%) | 0 (0.0%) |
| $22,500 to $24,999 | 0 (0.0%) | 22 (3.4%) |
| $25,000 to $29,999 | 13 (1.7%) | 40 (6.2%) |
| $30,000 to $34,999 | 14 (1.8%) | 38 (5.9%) |
| $35,000 to $39,999 | 126 (16.4%) | 8 (1.2%) |
| $40,000 to $44,999 | 28 (3.6%) | 76 (11.7%) |
| $45,000 to $49,999 | 10 (1.3%) | 55 (8.5%) |
| $50,000 to $54,999 | 5 (0.6%) | 2 (0.3%) |
| $55,000 to $64,999 | 8 (1.0%) | 18 (2.8%) |
| $65,000 to $74,999 | 62 (8.1%) | 0 (0.0%) |
| $75,000 to $99,999 | 49 (6.4%) | 53 (8.2%) |
| $100,000+ | 14 (1.8%) | 0 (0.0%) |
| Total | 769 (100.0%) | 649 (100.0%) |
Earnings by Sex by Educational Attainment in Russell Springs
Average earnings in Russell Springs are $38,677 for men and $28,229 for women, a difference of 27.0%. Men with an educational attainment of high school diploma enjoy the highest average annual earnings of $67,743, while those with less than high school education earn the least with $26,250. Women with an educational attainment of graduate degree earn the most with the average annual earnings of $85,056, while those with college or associate's degree education have the smallest earnings of $16,650.
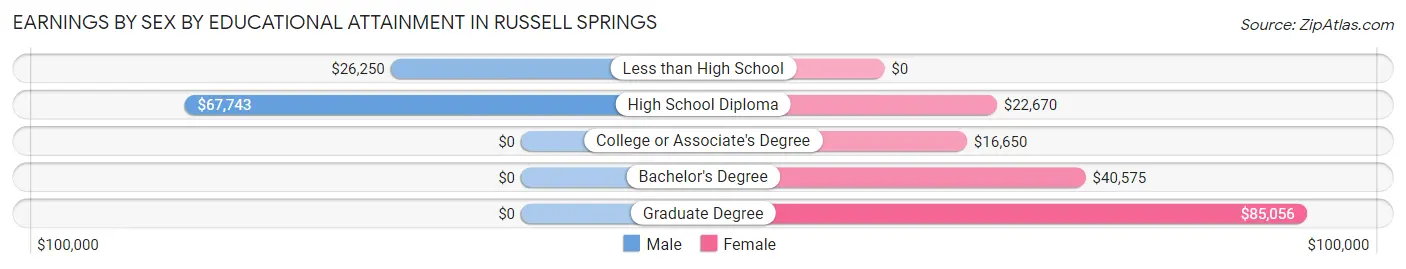
| Educational Attainment | Male Income | Female Income |
| Less than High School | $26,250 | $0 |
| High School Diploma | $67,743 | $22,670 |
| College or Associate's Degree | - | - |
| Bachelor's Degree | - | - |
| Graduate Degree | - | - |
| Total | $38,677 | $28,229 |
Family Income in Russell Springs
Family Income Brackets in Russell Springs
According to the Russell Springs family income data, there are 147 families falling into the $100,000 to $149,999 income range, which is the most common income bracket and makes up 23.3% of all families.
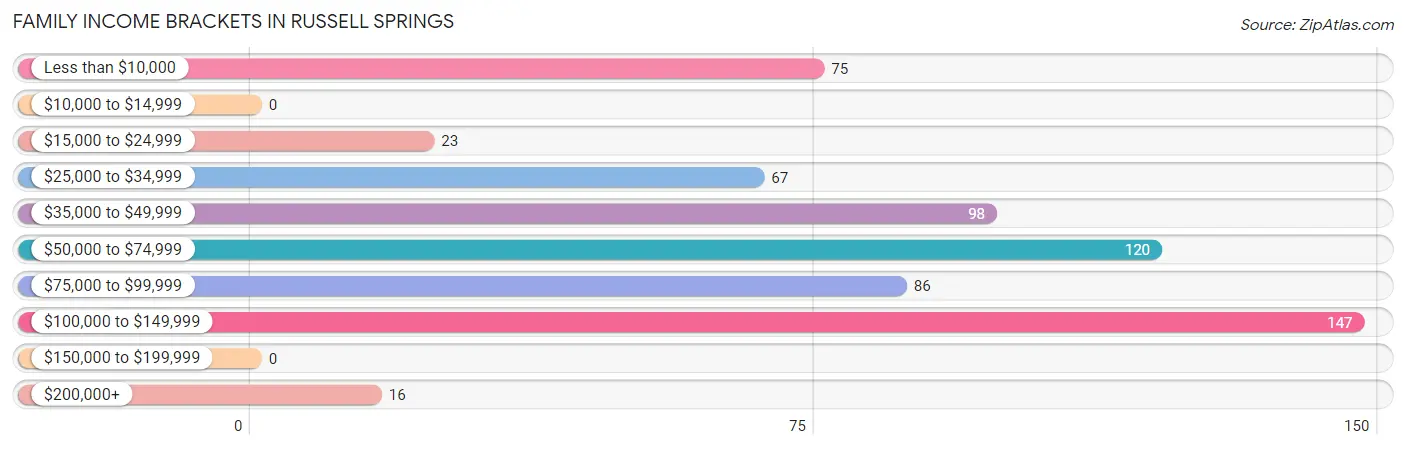
| Income Bracket | # Families | % Families |
| Less than $10,000 | 75 | 11.9% |
| $10,000 to $14,999 | 0 | 0.0% |
| $15,000 to $24,999 | 23 | 3.6% |
| $25,000 to $34,999 | 67 | 10.6% |
| $35,000 to $49,999 | 98 | 15.5% |
| $50,000 to $74,999 | 120 | 19.0% |
| $75,000 to $99,999 | 86 | 13.6% |
| $100,000 to $149,999 | 147 | 23.3% |
| $150,000 to $199,999 | 0 | 0.0% |
| $200,000+ | 16 | 2.5% |
Family Income by Famaliy Size in Russell Springs
3-person families (222 | 35.1%) account for the highest median family income in Russell Springs with $89,167 per family, while 3-person families (222 | 35.1%) have the highest median income of $29,722 per family member.
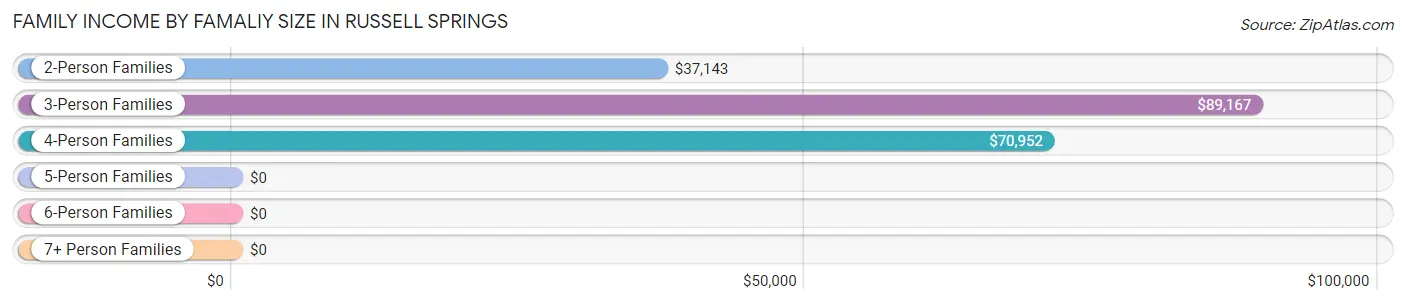
| Income Bracket | # Families | Median Income |
| 2-Person Families | 246 (38.9%) | $37,143 |
| 3-Person Families | 222 (35.1%) | $89,167 |
| 4-Person Families | 132 (20.9%) | $70,952 |
| 5-Person Families | 8 (1.3%) | $0 |
| 6-Person Families | 18 (2.9%) | $0 |
| 7+ Person Families | 6 (0.9%) | $0 |
| Total | 632 (100.0%) | $68,000 |
Family Income by Number of Earners in Russell Springs
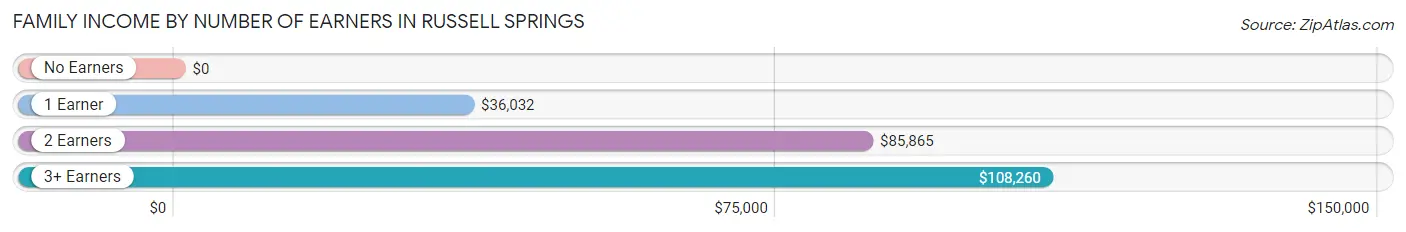
| Number of Earners | # Families | Median Income |
| No Earners | 156 (24.7%) | $0 |
| 1 Earner | 138 (21.8%) | $36,032 |
| 2 Earners | 139 (22.0%) | $85,865 |
| 3+ Earners | 199 (31.5%) | $108,260 |
| Total | 632 (100.0%) | $68,000 |
Household Income in Russell Springs
Household Income Brackets in Russell Springs
With 175 households falling in the category, the $15,000 to $24,999 income range is the most frequent in Russell Springs, accounting for 17.1% of all households. In contrast, only 5 households (0.5%) fall into the $150,000 to $199,999 income bracket, making it the least populous group.
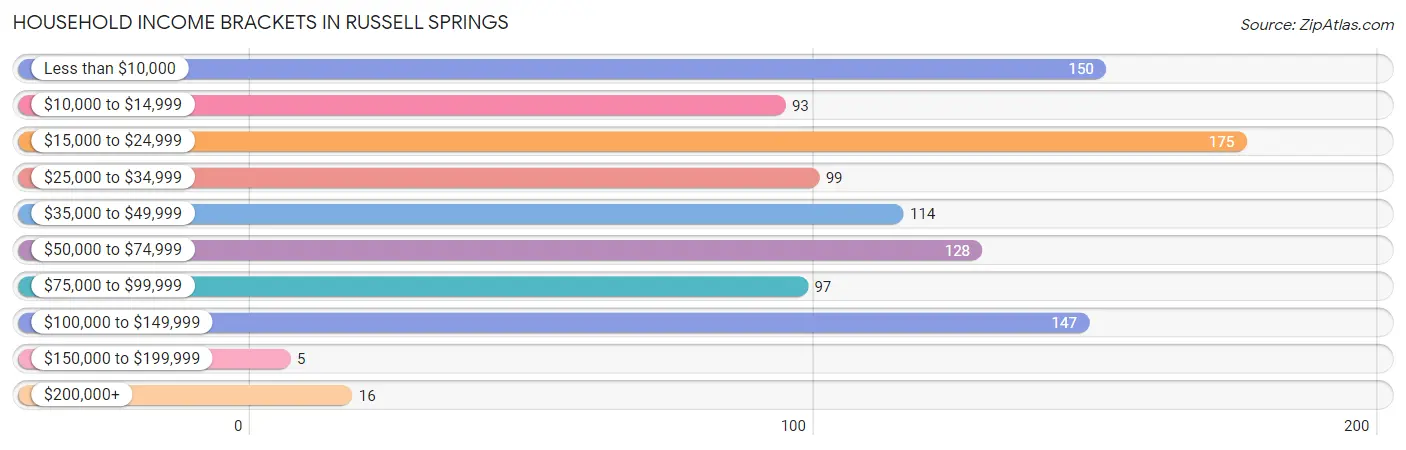
| Income Bracket | # Households | % Households |
| Less than $10,000 | 150 | 14.6% |
| $10,000 to $14,999 | 93 | 9.1% |
| $15,000 to $24,999 | 175 | 17.1% |
| $25,000 to $34,999 | 99 | 9.7% |
| $35,000 to $49,999 | 114 | 11.1% |
| $50,000 to $74,999 | 128 | 12.5% |
| $75,000 to $99,999 | 97 | 9.5% |
| $100,000 to $149,999 | 147 | 14.4% |
| $150,000 to $199,999 | 5 | 0.5% |
| $200,000+ | 16 | 1.6% |
Household Income by Householder Age in Russell Springs
The median household income in Russell Springs is $34,219, with the highest median household income of $70,337 found in the 25 to 44 years age bracket for the primary householder. A total of 287 households (28.0%) fall into this category.
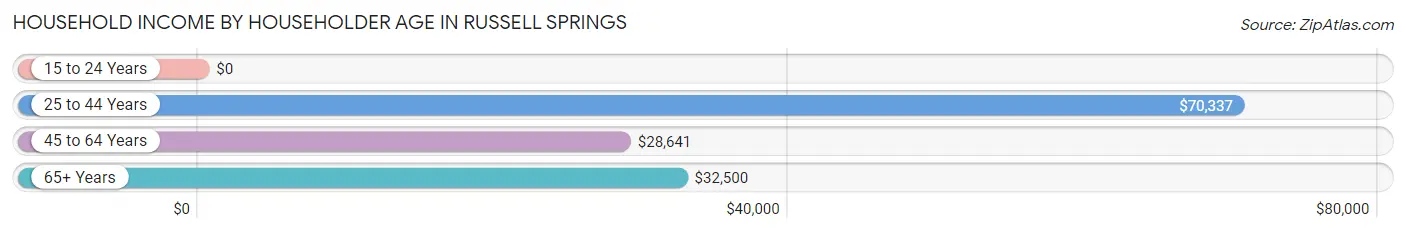
| Income Bracket | # Households | Median Income |
| 15 to 24 Years | 0 (0.0%) | $0 |
| 25 to 44 Years | 287 (28.0%) | $70,337 |
| 45 to 64 Years | 373 (36.4%) | $28,641 |
| 65+ Years | 364 (35.5%) | $32,500 |
| Total | 1,024 (100.0%) | $34,219 |
Poverty in Russell Springs
Income Below Poverty by Sex and Age in Russell Springs
With 21.5% poverty level for males and 32.7% for females among the residents of Russell Springs, 12 to 14 year old males and under 5 year old females are the most vulnerable to poverty, with 25 males (51.0%) and 37 females (100.0%) in their respective age groups living below the poverty level.
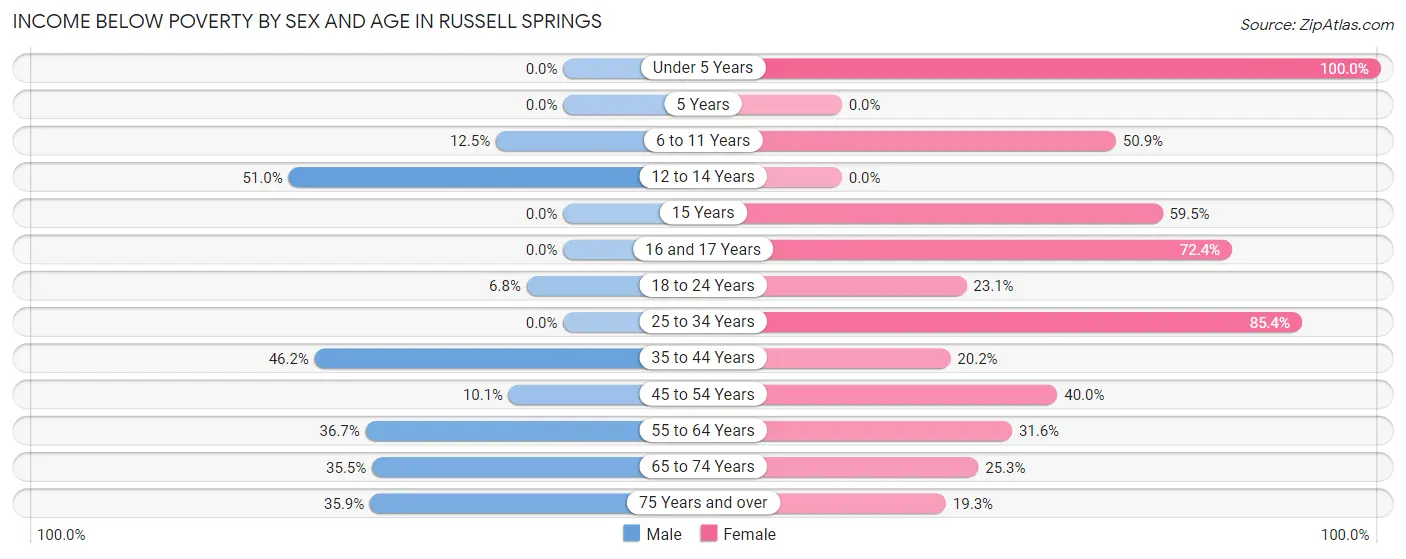
| Age Bracket | Male | Female |
| Under 5 Years | 0 (0.0%) | 37 (100.0%) |
| 5 Years | 0 (0.0%) | 0 (0.0%) |
| 6 to 11 Years | 5 (12.5%) | 29 (50.9%) |
| 12 to 14 Years | 25 (51.0%) | 0 (0.0%) |
| 15 Years | 0 (0.0%) | 25 (59.5%) |
| 16 and 17 Years | 0 (0.0%) | 21 (72.4%) |
| 18 to 24 Years | 20 (6.8%) | 31 (23.1%) |
| 25 to 34 Years | 0 (0.0%) | 70 (85.4%) |
| 35 to 44 Years | 24 (46.2%) | 50 (20.2%) |
| 45 to 54 Years | 20 (10.1%) | 36 (40.0%) |
| 55 to 64 Years | 80 (36.7%) | 60 (31.6%) |
| 65 to 74 Years | 71 (35.5%) | 58 (25.3%) |
| 75 Years and over | 33 (35.9%) | 23 (19.3%) |
| Total | 278 (21.5%) | 440 (32.7%) |
Income Above Poverty by Sex and Age in Russell Springs
According to the poverty statistics in Russell Springs, males aged under 5 years and females aged 12 to 14 years are the age groups that are most secure financially, with 100.0% of males and 100.0% of females in these age groups living above the poverty line.
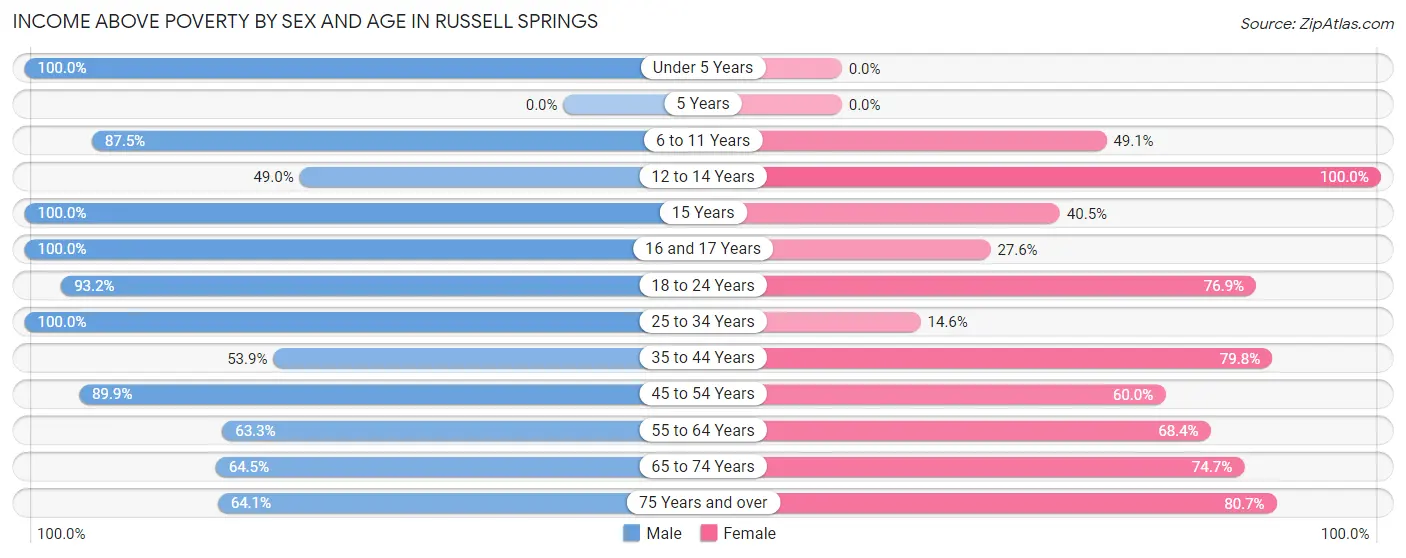
| Age Bracket | Male | Female |
| Under 5 Years | 24 (100.0%) | 0 (0.0%) |
| 5 Years | 0 (0.0%) | 0 (0.0%) |
| 6 to 11 Years | 35 (87.5%) | 28 (49.1%) |
| 12 to 14 Years | 24 (49.0%) | 88 (100.0%) |
| 15 Years | 30 (100.0%) | 17 (40.5%) |
| 16 and 17 Years | 65 (100.0%) | 8 (27.6%) |
| 18 to 24 Years | 274 (93.2%) | 103 (76.9%) |
| 25 to 34 Years | 28 (100.0%) | 12 (14.6%) |
| 35 to 44 Years | 28 (53.8%) | 198 (79.8%) |
| 45 to 54 Years | 178 (89.9%) | 54 (60.0%) |
| 55 to 64 Years | 138 (63.3%) | 130 (68.4%) |
| 65 to 74 Years | 129 (64.5%) | 171 (74.7%) |
| 75 Years and over | 59 (64.1%) | 96 (80.7%) |
| Total | 1,012 (78.4%) | 905 (67.3%) |
Income Below Poverty Among Married-Couple Families in Russell Springs
The poverty statistics for married-couple families in Russell Springs show that 28.3% or 112 of the total 396 families live below the poverty line. Families with 1 or 2 children have the highest poverty rate of 62.4%, comprising of 53 families. On the other hand, families with 3 or 4 children have the lowest poverty rate of 0.0%, which includes 0 families.
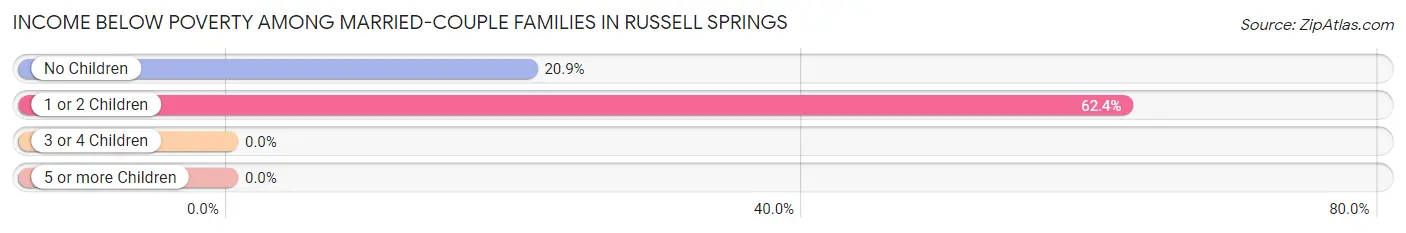
| Children | Above Poverty | Below Poverty |
| No Children | 224 (79.1%) | 59 (20.8%) |
| 1 or 2 Children | 32 (37.7%) | 53 (62.4%) |
| 3 or 4 Children | 28 (100.0%) | 0 (0.0%) |
| 5 or more Children | 0 (0.0%) | 0 (0.0%) |
| Total | 284 (71.7%) | 112 (28.3%) |
Income Below Poverty Among Single-Parent Households in Russell Springs
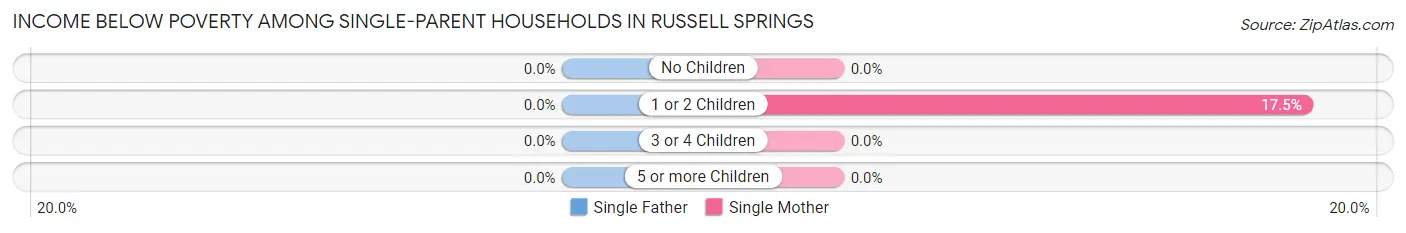
| Children | Single Father | Single Mother |
| No Children | 0 (0.0%) | 0 (0.0%) |
| 1 or 2 Children | 0 (0.0%) | 28 (17.5%) |
| 3 or 4 Children | 0 (0.0%) | 0 (0.0%) |
| 5 or more Children | 0 (0.0%) | 0 (0.0%) |
| Total | 0 (0.0%) | 28 (16.3%) |
Income Below Poverty Among Married-Couple vs Single-Parent Households in Russell Springs
The poverty data for Russell Springs shows that 112 of the married-couple family households (28.3%) and 28 of the single-parent households (11.9%) are living below the poverty level. Within the married-couple family households, those with 1 or 2 children have the highest poverty rate, with 53 households (62.4%) falling below the poverty line. Among the single-parent households, those with 1 or 2 children have the highest poverty rate, with 28 household (17.5%) living below poverty.
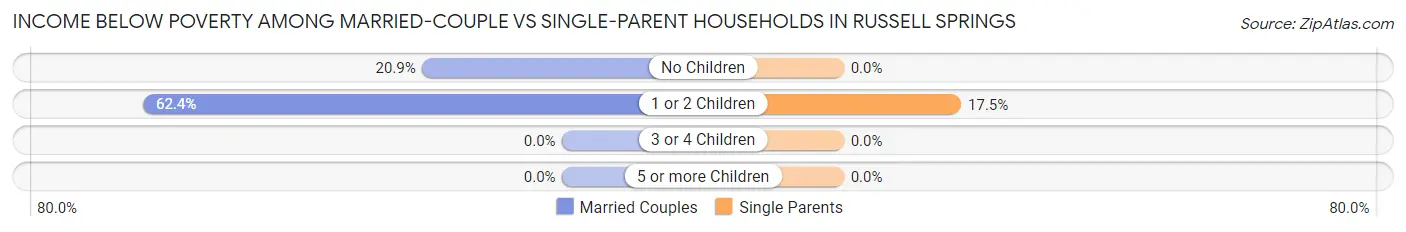
| Children | Married-Couple Families | Single-Parent Households |
| No Children | 59 (20.8%) | 0 (0.0%) |
| 1 or 2 Children | 53 (62.4%) | 28 (17.5%) |
| 3 or 4 Children | 0 (0.0%) | 0 (0.0%) |
| 5 or more Children | 0 (0.0%) | 0 (0.0%) |
| Total | 112 (28.3%) | 28 (11.9%) |
Race in Russell Springs
The most populous races in Russell Springs are White / Caucasian (2,467 | 90.9%), Two or more Races (227 | 8.4%), and Hispanic or Latino (91 | 3.4%).
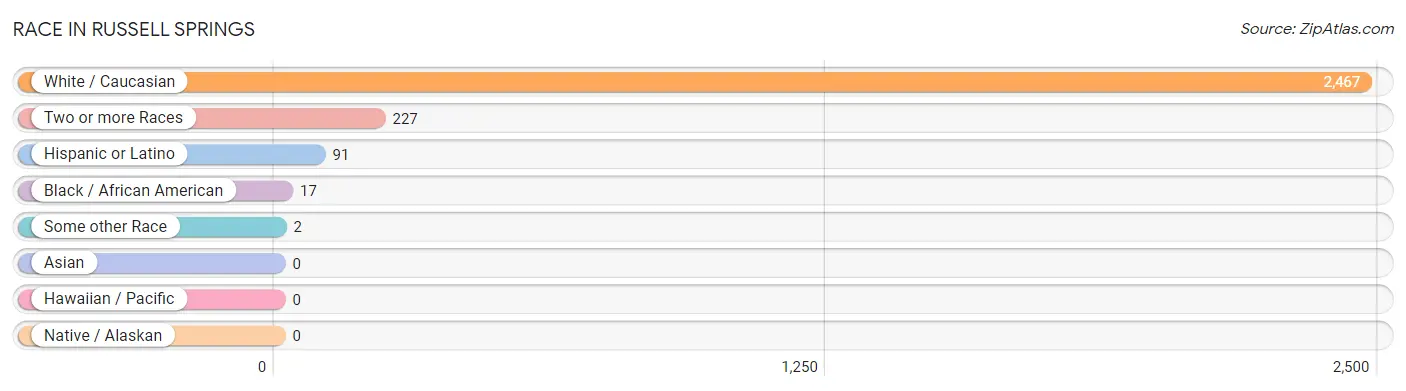
| Race | # Population | % Population |
| Asian | 0 | 0.0% |
| Black / African American | 17 | 0.6% |
| Hawaiian / Pacific | 0 | 0.0% |
| Hispanic or Latino | 91 | 3.4% |
| Native / Alaskan | 0 | 0.0% |
| White / Caucasian | 2,467 | 90.9% |
| Two or more Races | 227 | 8.4% |
| Some other Race | 2 | 0.1% |
| Total | 2,713 | 100.0% |
Ancestry in Russell Springs
The most populous ancestries reported in Russell Springs are American (461 | 17.0%), English (375 | 13.8%), German (360 | 13.3%), Irish (335 | 12.3%), and British (283 | 10.4%), together accounting for 66.9% of all Russell Springs residents.
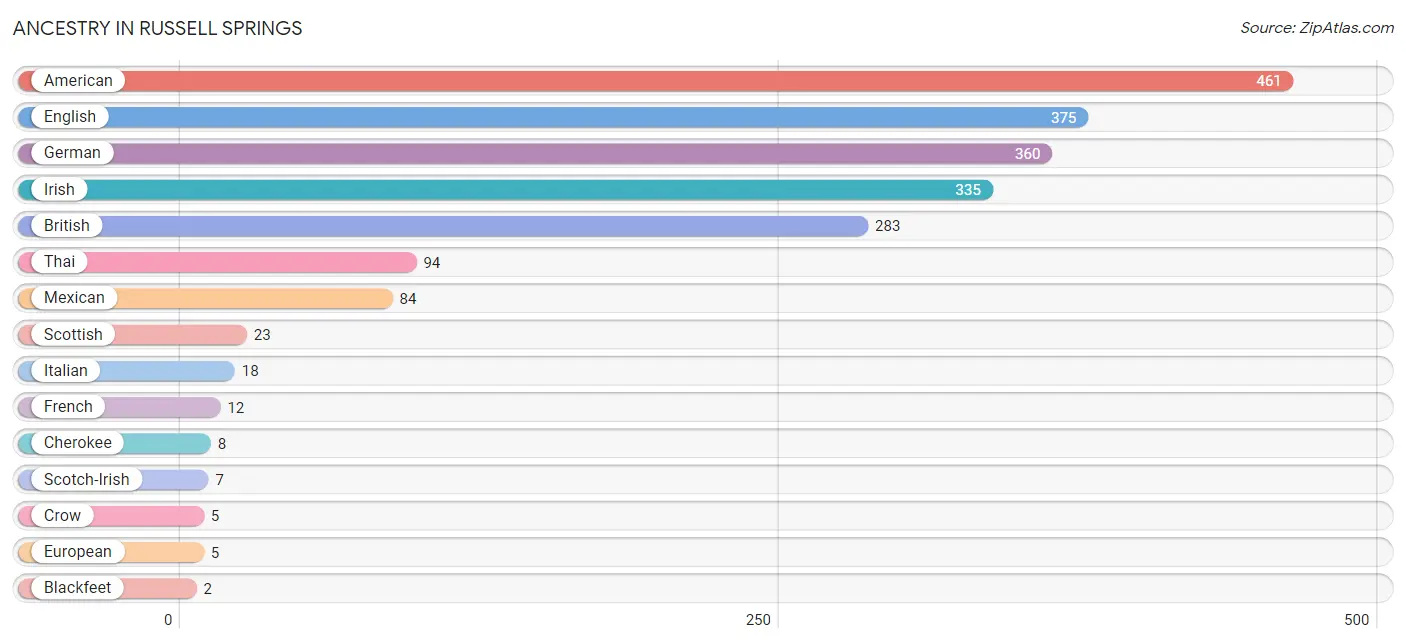
| Ancestry | # Population | % Population |
| American | 461 | 17.0% |
| Blackfeet | 2 | 0.1% |
| British | 283 | 10.4% |
| Cherokee | 8 | 0.3% |
| Crow | 5 | 0.2% |
| English | 375 | 13.8% |
| European | 5 | 0.2% |
| French | 12 | 0.4% |
| German | 360 | 13.3% |
| Irish | 335 | 12.3% |
| Iroquois | 2 | 0.1% |
| Italian | 18 | 0.7% |
| Mexican | 84 | 3.1% |
| Scotch-Irish | 7 | 0.3% |
| Scottish | 23 | 0.9% |
| Thai | 94 | 3.5% | View All 16 Rows |
Immigrants in Russell Springs

| Immigration Origin | # Population | % Population | View All 0 Rows |
Sex and Age in Russell Springs
Sex and Age in Russell Springs
The most populous age groups in Russell Springs are 15 to 19 Years (246 | 18.0%) for men and 40 to 44 Years (203 | 15.1%) for women.
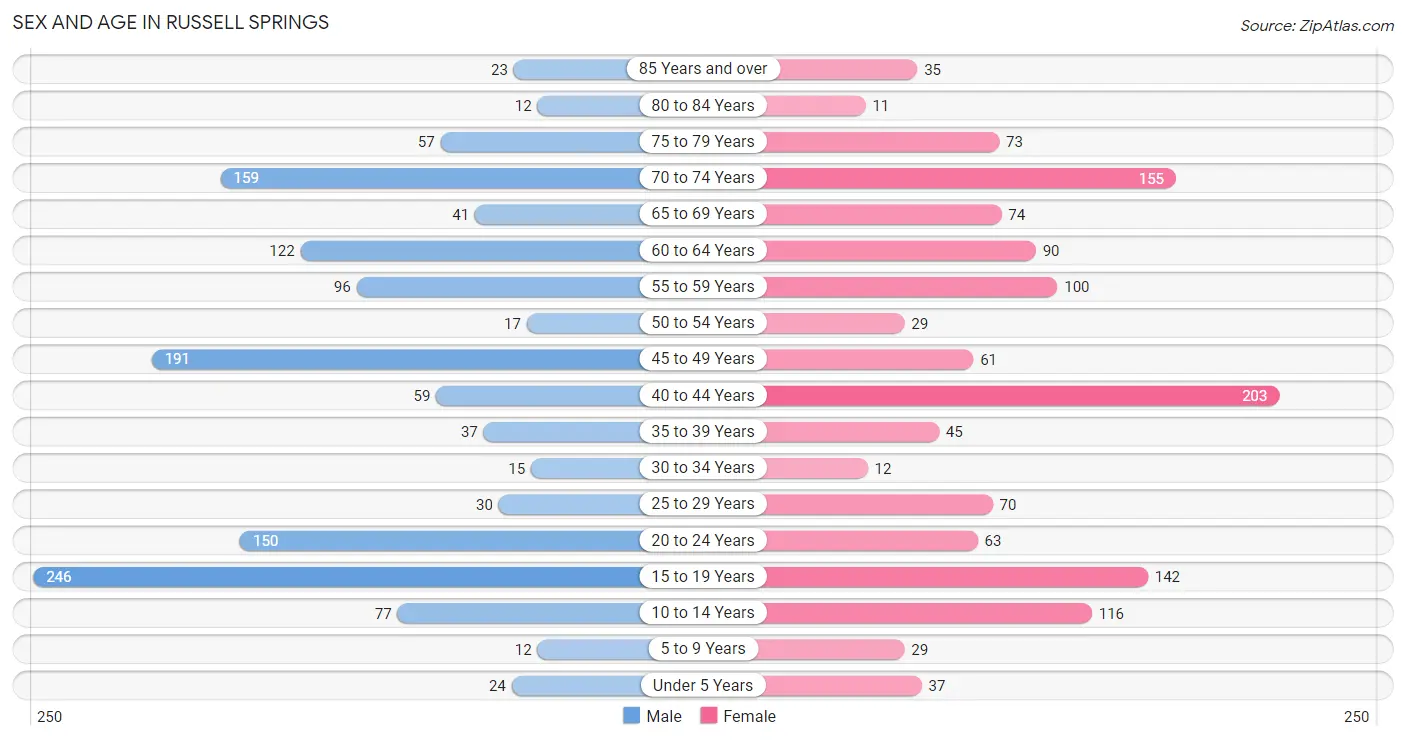
| Age Bracket | Male | Female |
| Under 5 Years | 24 (1.8%) | 37 (2.8%) |
| 5 to 9 Years | 12 (0.9%) | 29 (2.2%) |
| 10 to 14 Years | 77 (5.6%) | 116 (8.6%) |
| 15 to 19 Years | 246 (18.0%) | 142 (10.6%) |
| 20 to 24 Years | 150 (11.0%) | 63 (4.7%) |
| 25 to 29 Years | 30 (2.2%) | 70 (5.2%) |
| 30 to 34 Years | 15 (1.1%) | 12 (0.9%) |
| 35 to 39 Years | 37 (2.7%) | 45 (3.4%) |
| 40 to 44 Years | 59 (4.3%) | 203 (15.1%) |
| 45 to 49 Years | 191 (14.0%) | 61 (4.5%) |
| 50 to 54 Years | 17 (1.2%) | 29 (2.2%) |
| 55 to 59 Years | 96 (7.0%) | 100 (7.4%) |
| 60 to 64 Years | 122 (8.9%) | 90 (6.7%) |
| 65 to 69 Years | 41 (3.0%) | 74 (5.5%) |
| 70 to 74 Years | 159 (11.6%) | 155 (11.5%) |
| 75 to 79 Years | 57 (4.2%) | 73 (5.4%) |
| 80 to 84 Years | 12 (0.9%) | 11 (0.8%) |
| 85 Years and over | 23 (1.7%) | 35 (2.6%) |
| Total | 1,368 (100.0%) | 1,345 (100.0%) |
Families and Households in Russell Springs
Median Family Size in Russell Springs
The median family size in Russell Springs is 3.46 persons per family, with single male/father families (64 | 10.1%) accounting for the largest median family size of 4.39 persons per family. On the other hand, married-couple families (396 | 62.7%) represent the smallest median family size with 3.09 persons per family.
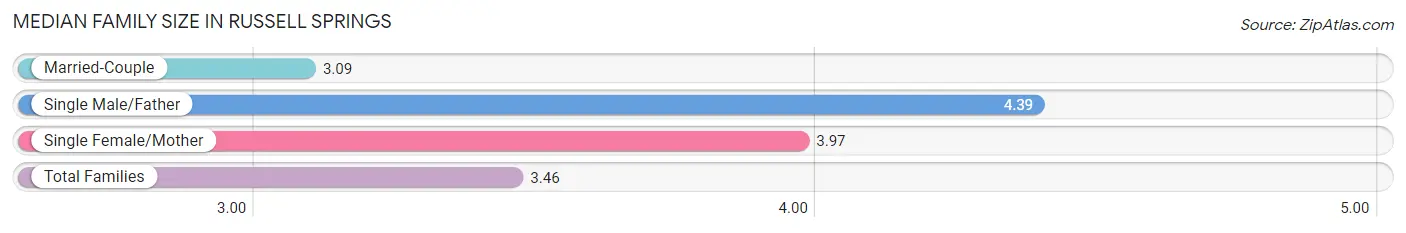
| Family Type | # Families | Family Size |
| Married-Couple | 396 (62.7%) | 3.09 |
| Single Male/Father | 64 (10.1%) | 4.39 |
| Single Female/Mother | 172 (27.2%) | 3.97 |
| Total Families | 632 (100.0%) | 3.46 |
Median Household Size in Russell Springs
The median household size in Russell Springs is 2.57 persons per household, with single male/father households (64 | 6.2%) accounting for the largest median household size of 4.39 persons per household. non-family households (392 | 38.3%) represent the smallest median household size with 1.12 persons per household.
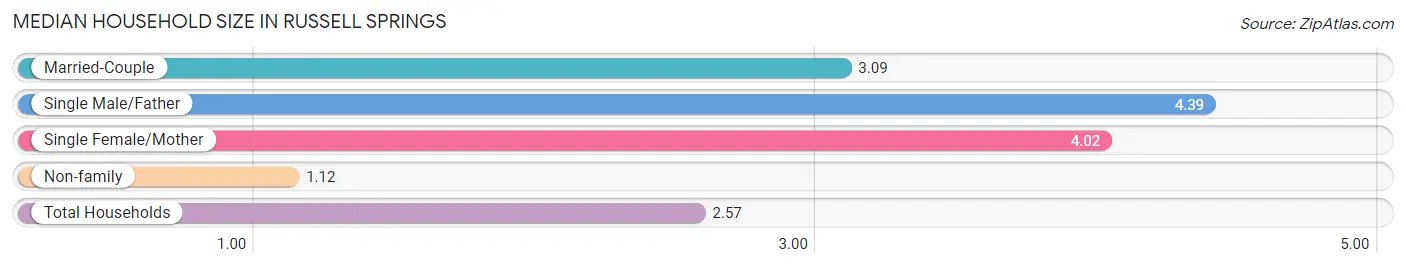
| Household Type | # Households | Household Size |
| Married-Couple | 396 (38.7%) | 3.09 |
| Single Male/Father | 64 (6.2%) | 4.39 |
| Single Female/Mother | 172 (16.8%) | 4.02 |
| Non-family | 392 (38.3%) | 1.12 |
| Total Households | 1,024 (100.0%) | 2.57 |
Household Size by Marriage Status in Russell Springs
Out of a total of 1,024 households in Russell Springs, 632 (61.7%) are family households, while 392 (38.3%) are nonfamily households. The most numerous type of family households are 2-person households, comprising 246, and the most common type of nonfamily households are 1-person households, comprising 374.
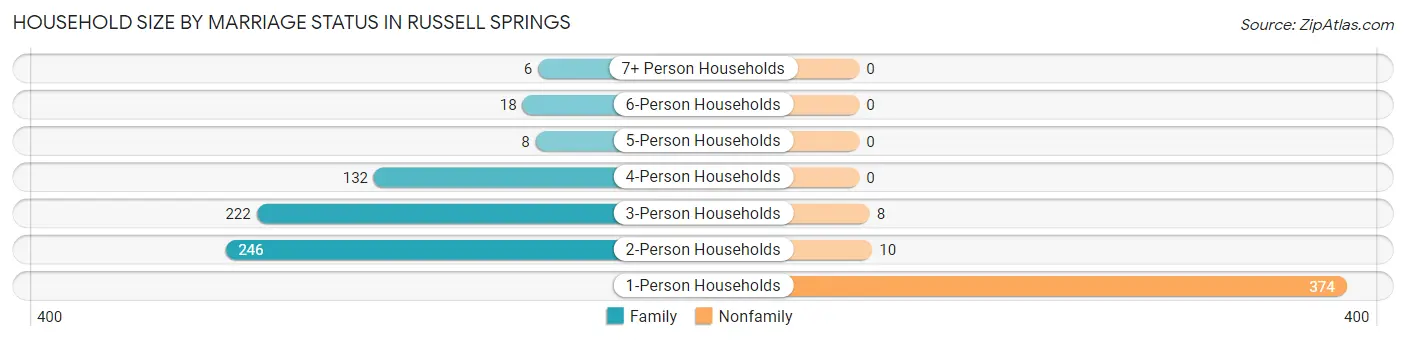
| Household Size | Family Households | Nonfamily Households |
| 1-Person Households | - | 374 (36.5%) |
| 2-Person Households | 246 (24.0%) | 10 (1.0%) |
| 3-Person Households | 222 (21.7%) | 8 (0.8%) |
| 4-Person Households | 132 (12.9%) | 0 (0.0%) |
| 5-Person Households | 8 (0.8%) | 0 (0.0%) |
| 6-Person Households | 18 (1.8%) | 0 (0.0%) |
| 7+ Person Households | 6 (0.6%) | 0 (0.0%) |
| Total | 632 (61.7%) | 392 (38.3%) |
Female Fertility in Russell Springs
Fertility by Age in Russell Springs
Average fertility rate in Russell Springs is 38.0 births per 1,000 women. Women in the age bracket of 35 to 50 years have the highest fertility rate with 71.0 births per 1,000 women. Women in the age bracket of 35 to 50 years acount for 100.0% of all women with births.
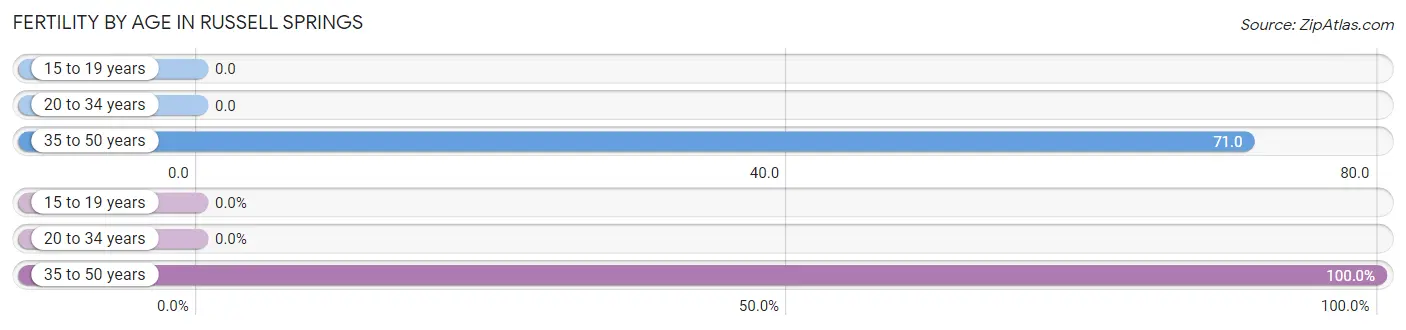
| Age Bracket | Women with Births | Births / 1,000 Women |
| 15 to 19 years | 0 (0.0%) | 0.0 |
| 20 to 34 years | 0 (0.0%) | 0.0 |
| 35 to 50 years | 23 (100.0%) | 71.0 |
| Total | 23 (100.0%) | 38.0 |
Fertility by Age by Marriage Status in Russell Springs
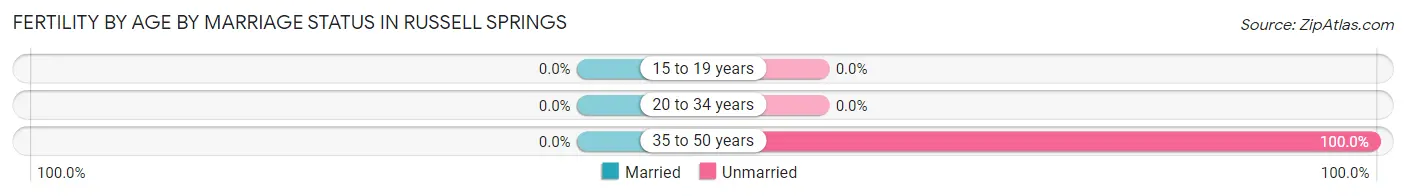
| Age Bracket | Married | Unmarried |
| 15 to 19 years | 0 (0.0%) | 0 (0.0%) |
| 20 to 34 years | 0 (0.0%) | 0 (0.0%) |
| 35 to 50 years | 0 (0.0%) | 23 (100.0%) |
| Total | 0 (0.0%) | 23 (100.0%) |
Fertility by Education in Russell Springs
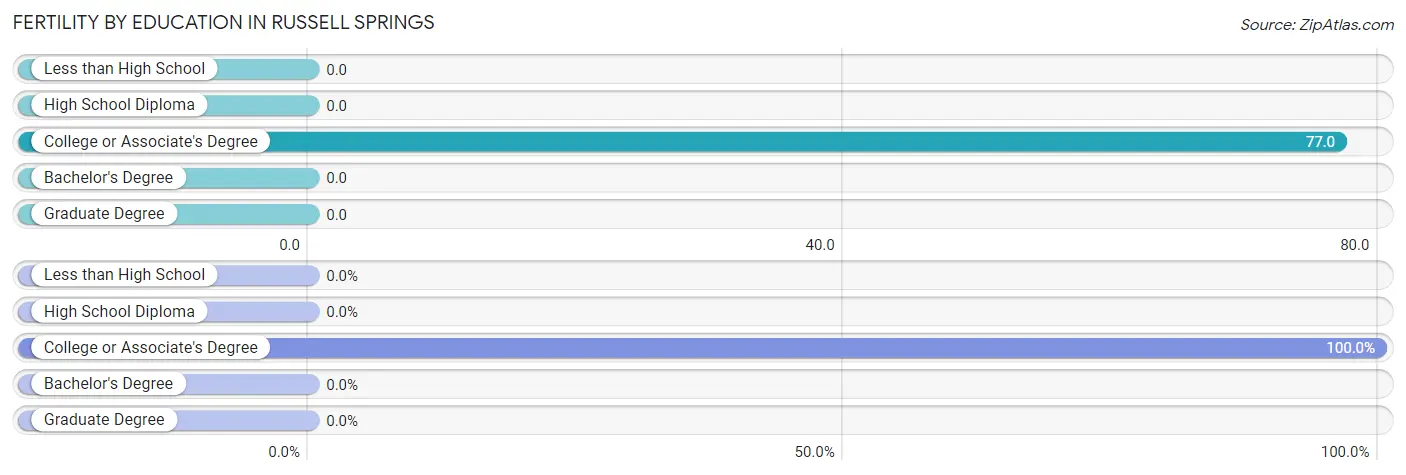
| Educational Attainment | Women with Births | Births / 1,000 Women |
| Less than High School | 0 (0.0%) | 0.0 |
| High School Diploma | 0 (0.0%) | 0.0 |
| College or Associate's Degree | 23 (100.0%) | 77.0 |
| Bachelor's Degree | 0 (0.0%) | 0.0 |
| Graduate Degree | 0 (0.0%) | 0.0 |
| Total | 23 (100.0%) | 38.0 |
Fertility by Education by Marriage Status in Russell Springs
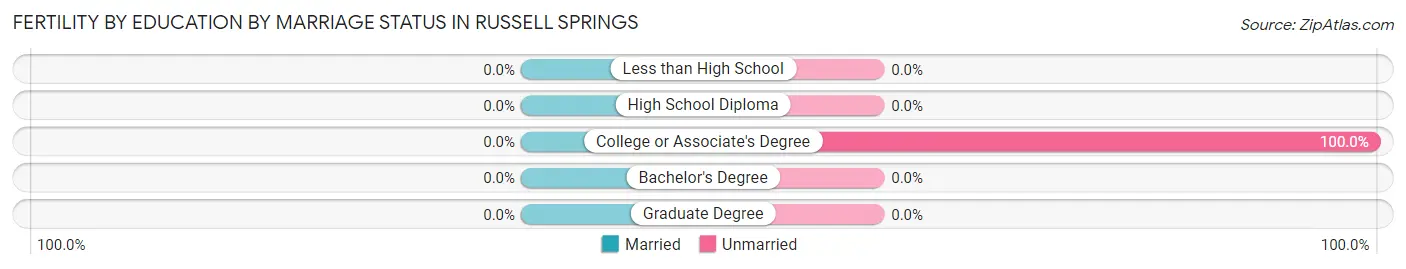
| Educational Attainment | Married | Unmarried |
| Less than High School | 0 (0.0%) | 0 (0.0%) |
| High School Diploma | 0 (0.0%) | 0 (0.0%) |
| College or Associate's Degree | 0 (0.0%) | 23 (100.0%) |
| Bachelor's Degree | 0 (0.0%) | 0 (0.0%) |
| Graduate Degree | 0 (0.0%) | 0 (0.0%) |
| Total | 0 (0.0%) | 23 (100.0%) |
Employment Characteristics in Russell Springs
Employment by Class of Employer in Russell Springs
Among the 1,130 employed individuals in Russell Springs, private company employees (827 | 73.2%), local government employees (109 | 9.7%), and self-employed (incorporated) (105 | 9.3%) make up the most common classes of employment.
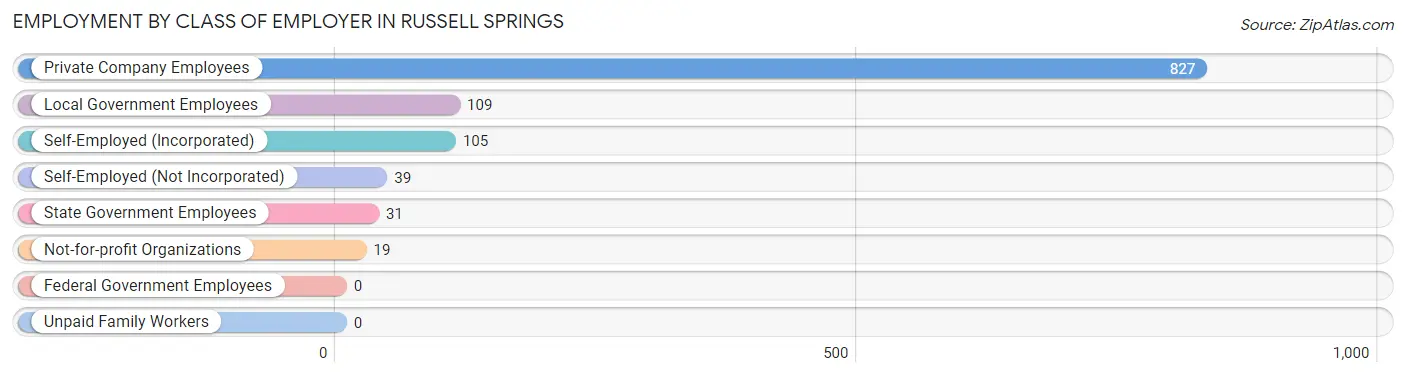
| Employer Class | # Employees | % Employees |
| Private Company Employees | 827 | 73.2% |
| Self-Employed (Incorporated) | 105 | 9.3% |
| Self-Employed (Not Incorporated) | 39 | 3.5% |
| Not-for-profit Organizations | 19 | 1.7% |
| Local Government Employees | 109 | 9.7% |
| State Government Employees | 31 | 2.7% |
| Federal Government Employees | 0 | 0.0% |
| Unpaid Family Workers | 0 | 0.0% |
| Total | 1,130 | 100.0% |
Employment Status by Age in Russell Springs
According to the labor force statistics for Russell Springs, out of the total population over 16 years of age (2,346), 53.5% or 1,255 individuals are in the labor force, with 8.1% or 102 of them unemployed. The age group with the highest labor force participation rate is 25 to 29 years, with 93.0% or 93 individuals in the labor force. Within the labor force, the 65 to 74 years age range has the highest percentage of unemployed individuals, with 62.2% or 51 of them being unemployed.
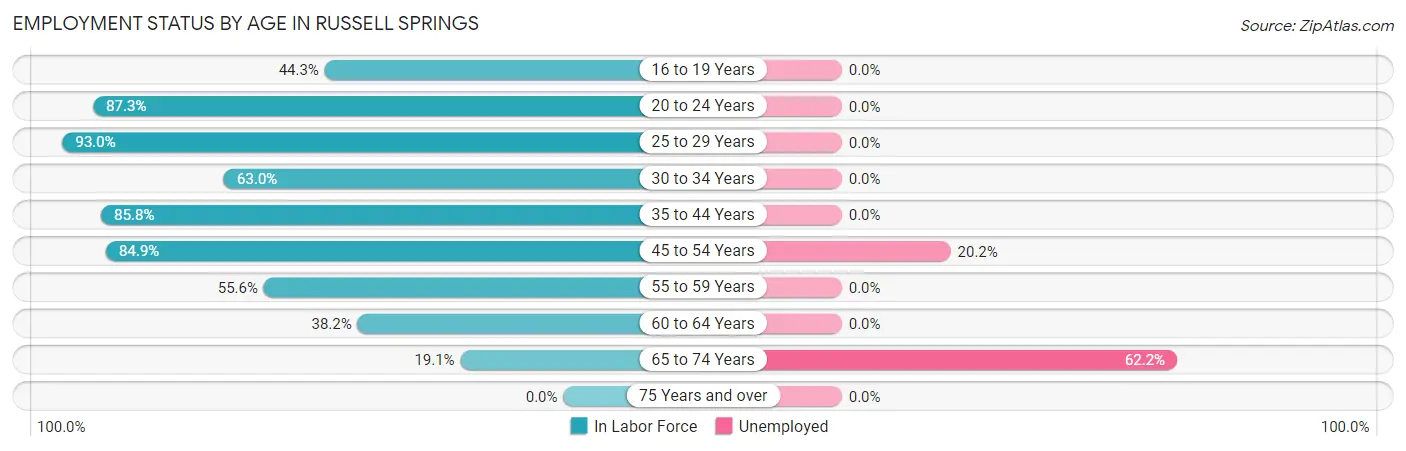
| Age Bracket | In Labor Force | Unemployed |
| 16 to 19 Years | 140 (44.3%) | 0 (0.0%) |
| 20 to 24 Years | 186 (87.3%) | 0 (0.0%) |
| 25 to 29 Years | 93 (93.0%) | 0 (0.0%) |
| 30 to 34 Years | 17 (63.0%) | 0 (0.0%) |
| 35 to 44 Years | 295 (85.8%) | 0 (0.0%) |
| 45 to 54 Years | 253 (84.9%) | 51 (20.2%) |
| 55 to 59 Years | 109 (55.6%) | 0 (0.0%) |
| 60 to 64 Years | 81 (38.2%) | 0 (0.0%) |
| 65 to 74 Years | 82 (19.1%) | 51 (62.2%) |
| 75 Years and over | 0 (0.0%) | 0 (0.0%) |
| Total | 1,255 (53.5%) | 102 (8.1%) |
Employment Status by Educational Attainment in Russell Springs
According to labor force statistics for Russell Springs, 72.0% of individuals (847) out of the total population between 25 and 64 years of age (1,177) are in the labor force, with 6.0% or 51 of them being unemployed. The group with the highest labor force participation rate are those with the educational attainment of bachelor's degree or higher, with 99.7% or 346 individuals in the labor force. Within the labor force, individuals with less than high school education have the highest percentage of unemployment, with 31.3% or 20 of them being unemployed.
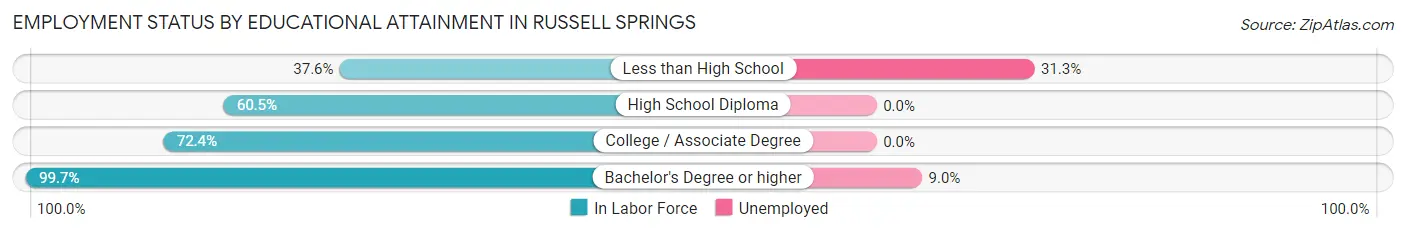
| Educational Attainment | In Labor Force | Unemployed |
| Less than High School | 64 (37.6%) | 53 (31.3%) |
| High School Diploma | 202 (60.5%) | 0 (0.0%) |
| College / Associate Degree | 236 (72.4%) | 0 (0.0%) |
| Bachelor's Degree or higher | 346 (99.7%) | 31 (9.0%) |
| Total | 847 (72.0%) | 71 (6.0%) |
Employment Occupations by Sex in Russell Springs
Management, Business, Science and Arts Occupations
The most common Management, Business, Science and Arts occupations in Russell Springs are Community & Social Service (224 | 19.4%), Health Diagnosing & Treating (108 | 9.4%), Education Instruction & Library (103 | 8.9%), Arts, Media & Entertainment (103 | 8.9%), and Health Technologists (53 | 4.6%).
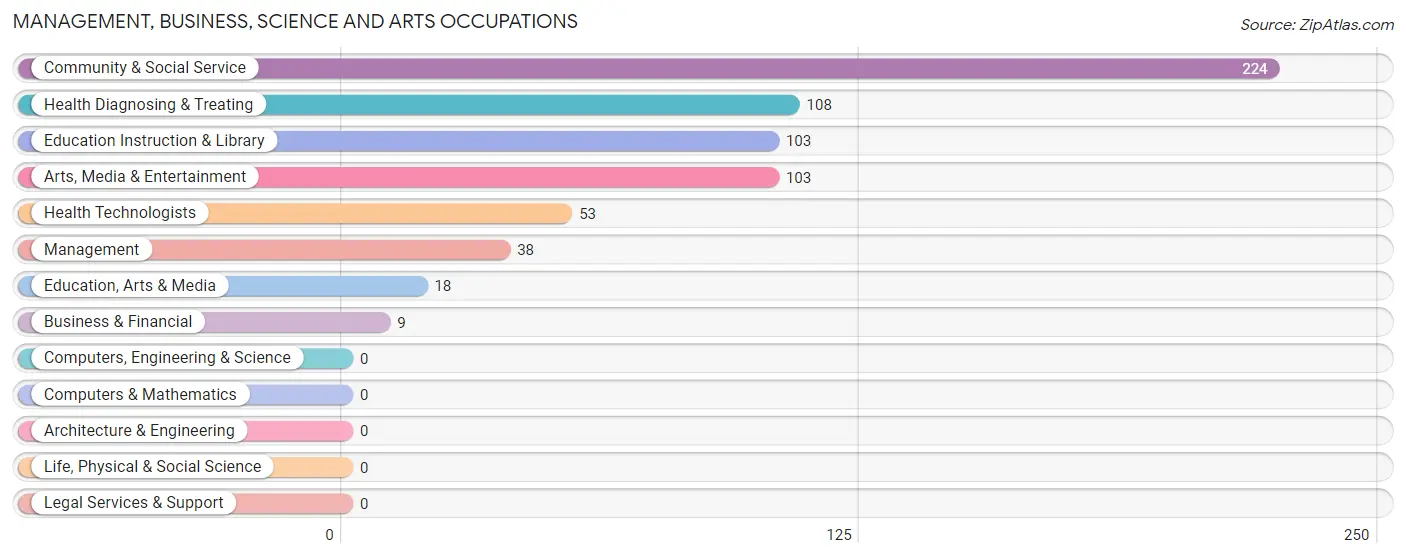
Management, Business, Science and Arts Occupations by Sex
Within the Management, Business, Science and Arts occupations in Russell Springs, the most male-oriented occupations are Business & Financial (100.0%), Arts, Media & Entertainment (100.0%), and Management (65.8%), while the most female-oriented occupations are Education, Arts & Media (100.0%), Education Instruction & Library (100.0%), and Health Technologists (100.0%).
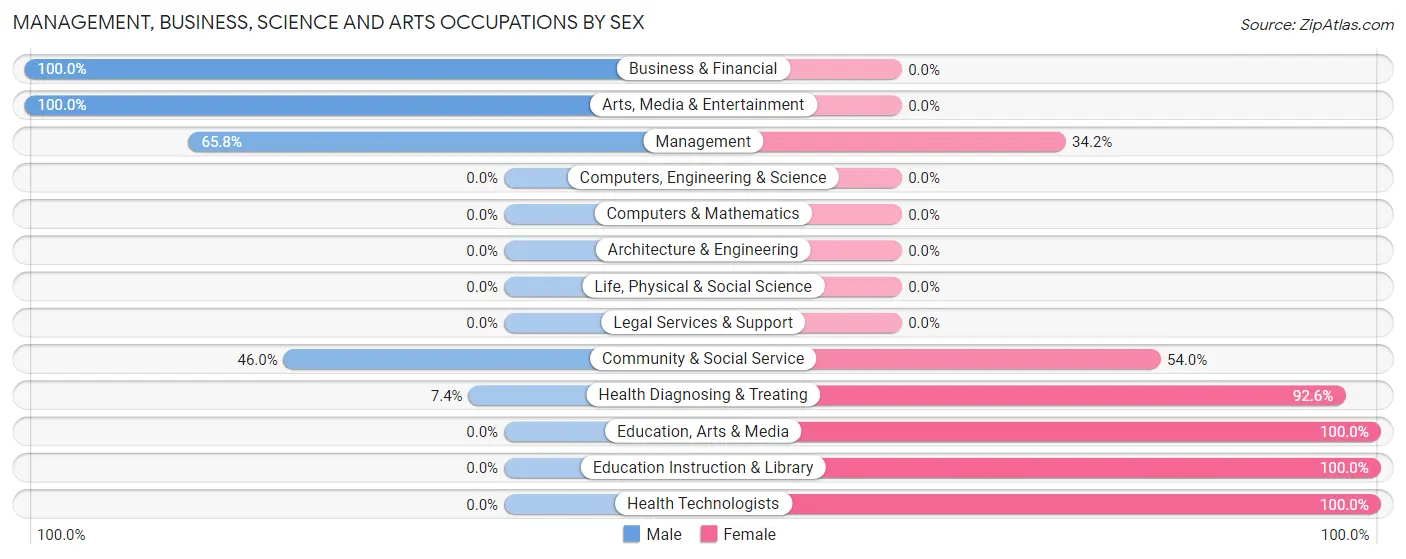
| Occupation | Male | Female |
| Management | 25 (65.8%) | 13 (34.2%) |
| Business & Financial | 9 (100.0%) | 0 (0.0%) |
| Computers, Engineering & Science | 0 (0.0%) | 0 (0.0%) |
| Computers & Mathematics | 0 (0.0%) | 0 (0.0%) |
| Architecture & Engineering | 0 (0.0%) | 0 (0.0%) |
| Life, Physical & Social Science | 0 (0.0%) | 0 (0.0%) |
| Community & Social Service | 103 (46.0%) | 121 (54.0%) |
| Education, Arts & Media | 0 (0.0%) | 18 (100.0%) |
| Legal Services & Support | 0 (0.0%) | 0 (0.0%) |
| Education Instruction & Library | 0 (0.0%) | 103 (100.0%) |
| Arts, Media & Entertainment | 103 (100.0%) | 0 (0.0%) |
| Health Diagnosing & Treating | 8 (7.4%) | 100 (92.6%) |
| Health Technologists | 0 (0.0%) | 53 (100.0%) |
| Total (Category) | 145 (38.3%) | 234 (61.7%) |
| Total (Overall) | 565 (49.0%) | 589 (51.0%) |
Services Occupations
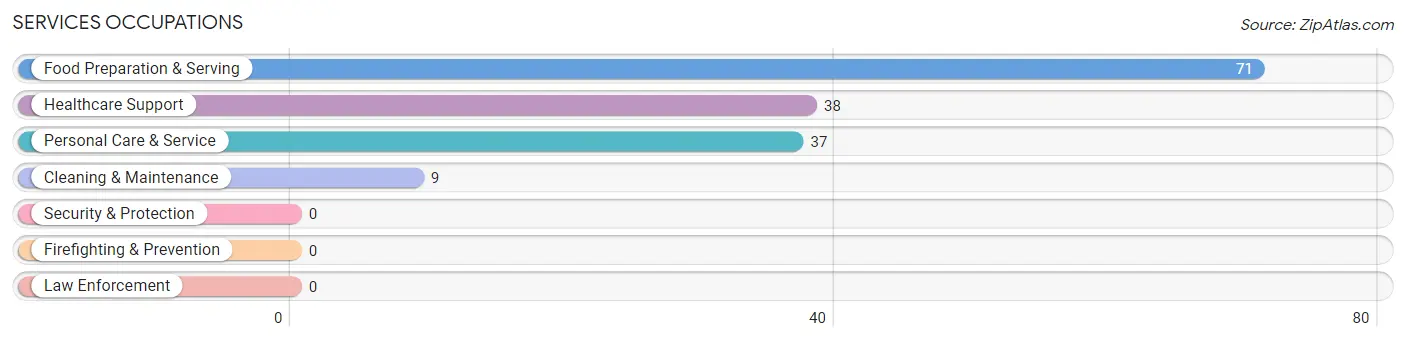
The most common Services occupations in Russell Springs are Food Preparation & Serving (71 | 6.1%), Healthcare Support (38 | 3.3%), Personal Care & Service (37 | 3.2%), and Cleaning & Maintenance (9 | 0.8%).
Services Occupations by Sex
Within the Services occupations in Russell Springs, the most male-oriented occupations are Food Preparation & Serving (100.0%), and Cleaning & Maintenance (100.0%), while the most female-oriented occupations are Healthcare Support (100.0%), and Personal Care & Service (100.0%).
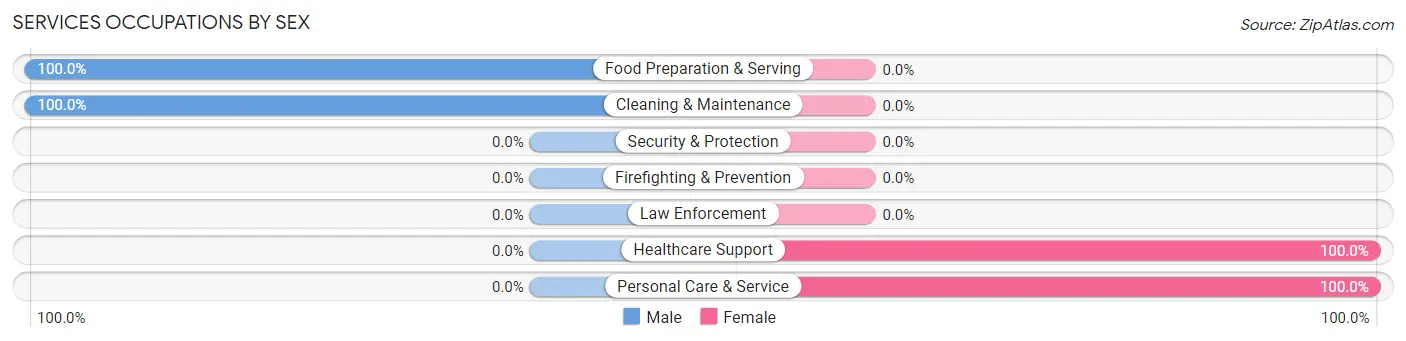
| Occupation | Male | Female |
| Healthcare Support | 0 (0.0%) | 38 (100.0%) |
| Security & Protection | 0 (0.0%) | 0 (0.0%) |
| Firefighting & Prevention | 0 (0.0%) | 0 (0.0%) |
| Law Enforcement | 0 (0.0%) | 0 (0.0%) |
| Food Preparation & Serving | 71 (100.0%) | 0 (0.0%) |
| Cleaning & Maintenance | 9 (100.0%) | 0 (0.0%) |
| Personal Care & Service | 0 (0.0%) | 37 (100.0%) |
| Total (Category) | 80 (51.6%) | 75 (48.4%) |
| Total (Overall) | 565 (49.0%) | 589 (51.0%) |
Sales and Office Occupations
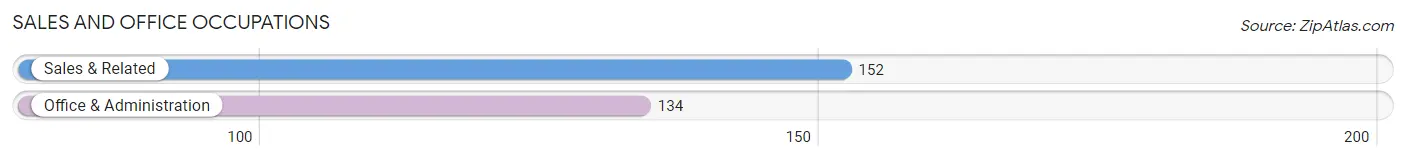
The most common Sales and Office occupations in Russell Springs are Sales & Related (152 | 13.2%), and Office & Administration (134 | 11.6%).
Sales and Office Occupations by Sex
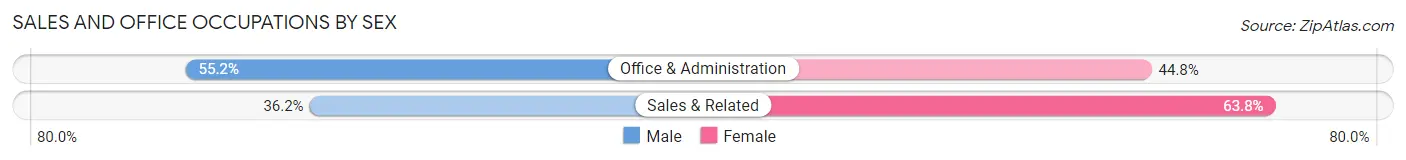
| Occupation | Male | Female |
| Sales & Related | 55 (36.2%) | 97 (63.8%) |
| Office & Administration | 74 (55.2%) | 60 (44.8%) |
| Total (Category) | 129 (45.1%) | 157 (54.9%) |
| Total (Overall) | 565 (49.0%) | 589 (51.0%) |
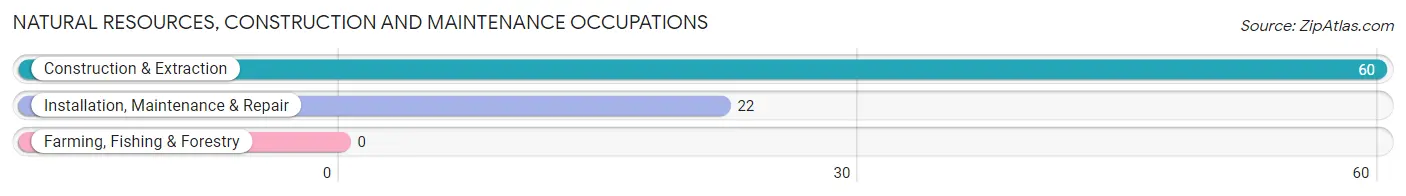
Natural Resources, Construction and Maintenance Occupations
The most common Natural Resources, Construction and Maintenance occupations in Russell Springs are Construction & Extraction (60 | 5.2%), and Installation, Maintenance & Repair (22 | 1.9%).
Natural Resources, Construction and Maintenance Occupations by Sex
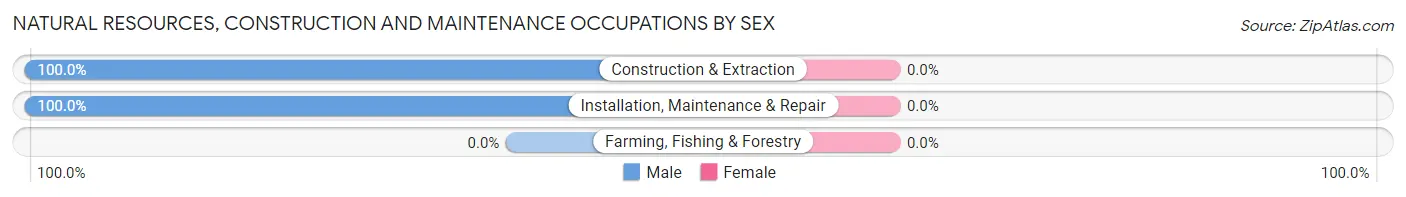
| Occupation | Male | Female |
| Farming, Fishing & Forestry | 0 (0.0%) | 0 (0.0%) |
| Construction & Extraction | 60 (100.0%) | 0 (0.0%) |
| Installation, Maintenance & Repair | 22 (100.0%) | 0 (0.0%) |
| Total (Category) | 82 (100.0%) | 0 (0.0%) |
| Total (Overall) | 565 (49.0%) | 589 (51.0%) |
Production, Transportation and Moving Occupations
The most common Production, Transportation and Moving occupations in Russell Springs are Production (166 | 14.4%), Transportation (51 | 4.4%), and Material Moving (35 | 3.0%).
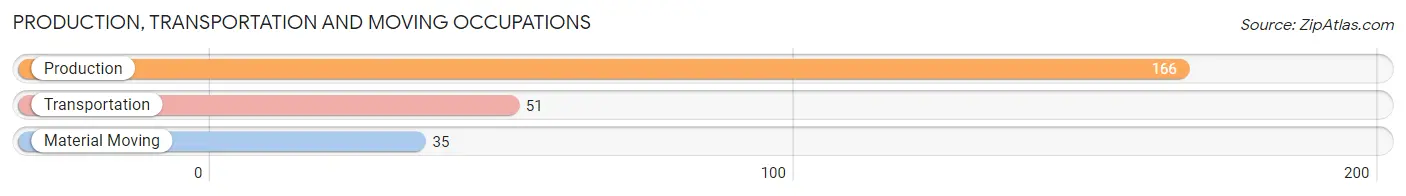
Production, Transportation and Moving Occupations by Sex
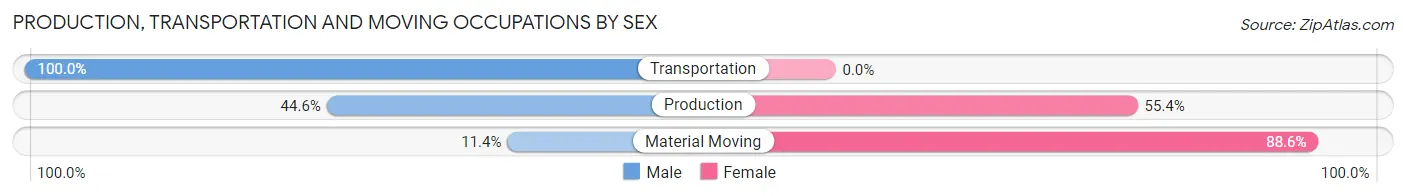
| Occupation | Male | Female |
| Production | 74 (44.6%) | 92 (55.4%) |
| Transportation | 51 (100.0%) | 0 (0.0%) |
| Material Moving | 4 (11.4%) | 31 (88.6%) |
| Total (Category) | 129 (51.2%) | 123 (48.8%) |
| Total (Overall) | 565 (49.0%) | 589 (51.0%) |
Employment Industries by Sex in Russell Springs
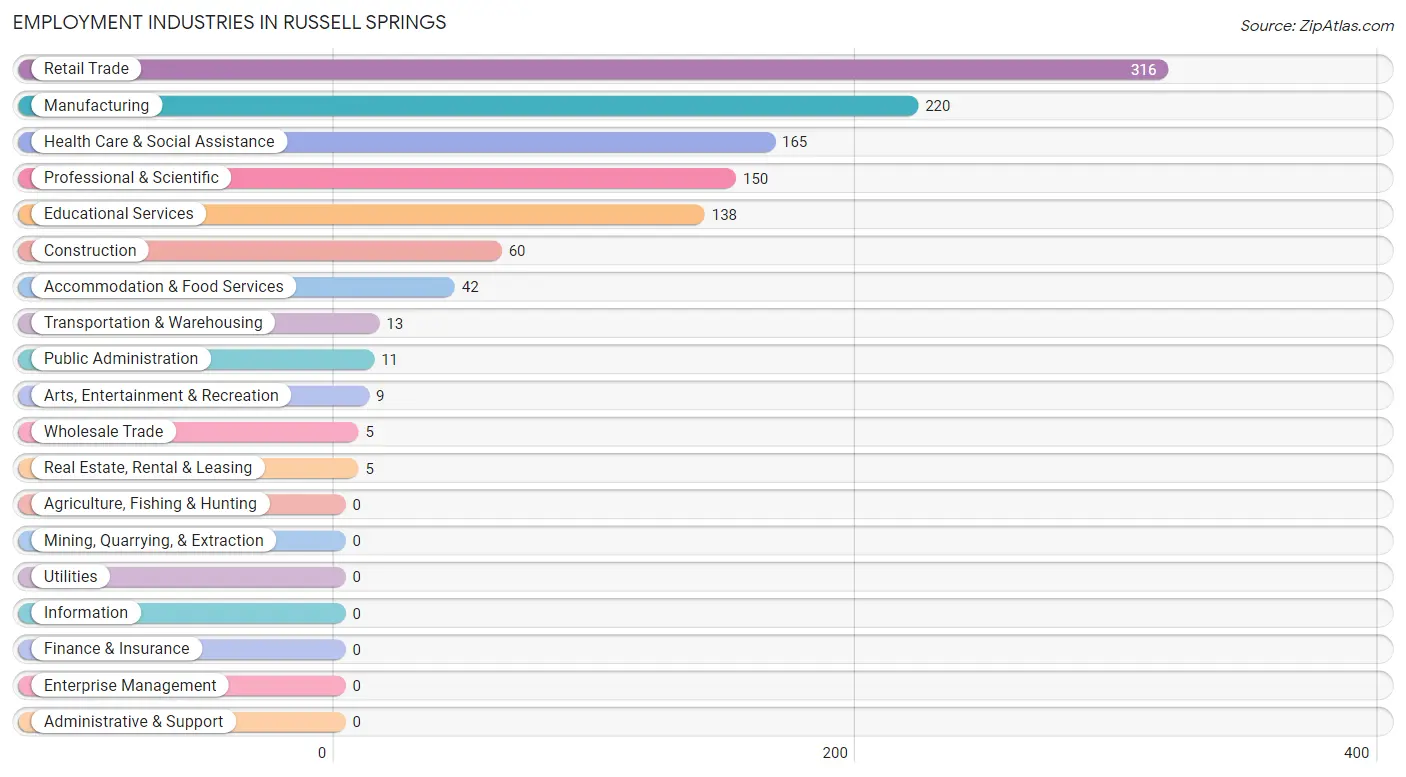
Employment Industries in Russell Springs
The major employment industries in Russell Springs include Retail Trade (316 | 27.4%), Manufacturing (220 | 19.1%), Health Care & Social Assistance (165 | 14.3%), Professional & Scientific (150 | 13.0%), and Educational Services (138 | 12.0%).
Employment Industries by Sex in Russell Springs
The Russell Springs industries that see more men than women are Construction (100.0%), Wholesale Trade (100.0%), and Real Estate, Rental & Leasing (100.0%), whereas the industries that tend to have a higher number of women are Public Administration (100.0%), Accommodation & Food Services (95.2%), and Health Care & Social Assistance (91.5%).
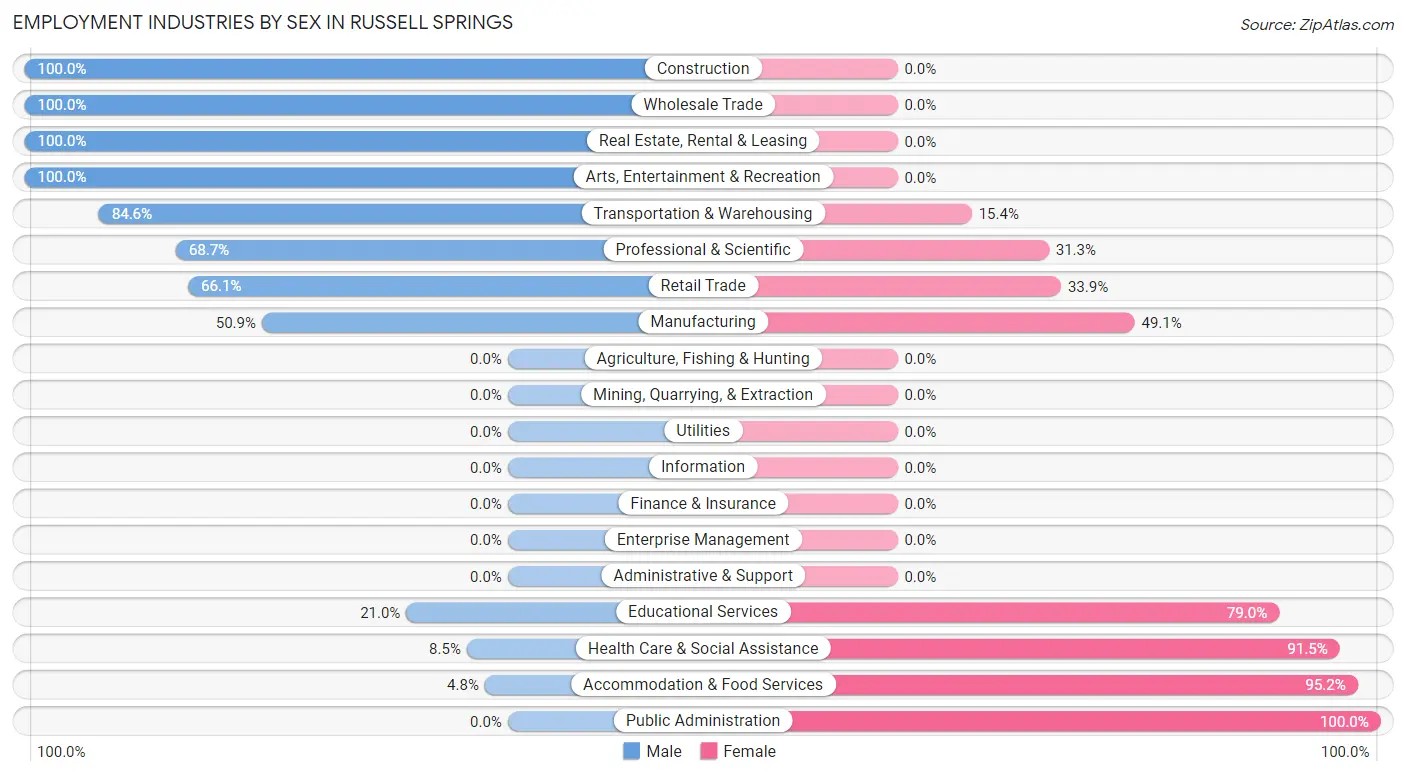
| Industry | Male | Female |
| Agriculture, Fishing & Hunting | 0 (0.0%) | 0 (0.0%) |
| Mining, Quarrying, & Extraction | 0 (0.0%) | 0 (0.0%) |
| Construction | 60 (100.0%) | 0 (0.0%) |
| Manufacturing | 112 (50.9%) | 108 (49.1%) |
| Wholesale Trade | 5 (100.0%) | 0 (0.0%) |
| Retail Trade | 209 (66.1%) | 107 (33.9%) |
| Transportation & Warehousing | 11 (84.6%) | 2 (15.4%) |
| Utilities | 0 (0.0%) | 0 (0.0%) |
| Information | 0 (0.0%) | 0 (0.0%) |
| Finance & Insurance | 0 (0.0%) | 0 (0.0%) |
| Real Estate, Rental & Leasing | 5 (100.0%) | 0 (0.0%) |
| Professional & Scientific | 103 (68.7%) | 47 (31.3%) |
| Enterprise Management | 0 (0.0%) | 0 (0.0%) |
| Administrative & Support | 0 (0.0%) | 0 (0.0%) |
| Educational Services | 29 (21.0%) | 109 (79.0%) |
| Health Care & Social Assistance | 14 (8.5%) | 151 (91.5%) |
| Arts, Entertainment & Recreation | 9 (100.0%) | 0 (0.0%) |
| Accommodation & Food Services | 2 (4.8%) | 40 (95.2%) |
| Public Administration | 0 (0.0%) | 11 (100.0%) |
| Total | 565 (49.0%) | 589 (51.0%) |
Education in Russell Springs
School Enrollment in Russell Springs
The most common levels of schooling among the 777 students in Russell Springs are college / undergraduate (332 | 42.7%), high school (179 | 23.0%), and middle school (160 | 20.6%).
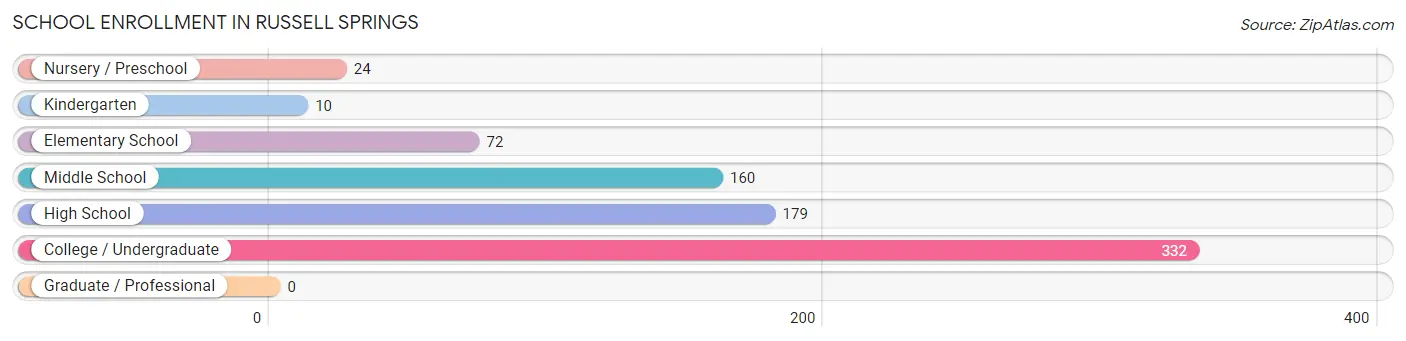
| School Level | # Students | % Students |
| Nursery / Preschool | 24 | 3.1% |
| Kindergarten | 10 | 1.3% |
| Elementary School | 72 | 9.3% |
| Middle School | 160 | 20.6% |
| High School | 179 | 23.0% |
| College / Undergraduate | 332 | 42.7% |
| Graduate / Professional | 0 | 0.0% |
| Total | 777 | 100.0% |
School Enrollment by Age by Funding Source in Russell Springs
Out of a total of 777 students who are enrolled in schools in Russell Springs, 154 (19.8%) attend a private institution, while the remaining 623 (80.2%) are enrolled in public schools. The age group of 3 to 4 year olds has the highest likelihood of being enrolled in private schools, with 24 (100.0% in the age bracket) enrolled. Conversely, the age group of 15 to 17 year olds has the lowest likelihood of being enrolled in a private school, with 166 (100.0% in the age bracket) attending a public institution.
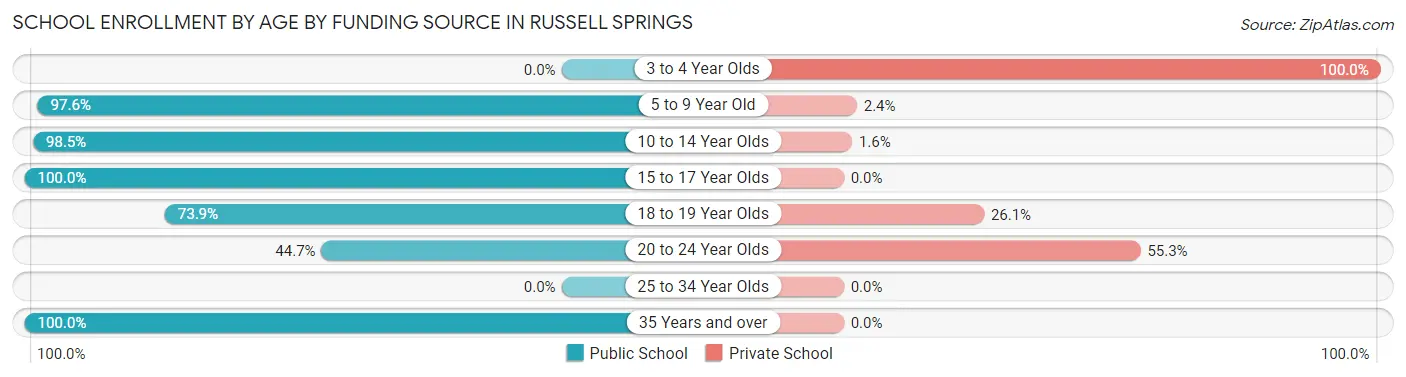
| Age Bracket | Public School | Private School |
| 3 to 4 Year Olds | 0 (0.0%) | 24 (100.0%) |
| 5 to 9 Year Old | 40 (97.6%) | 1 (2.4%) |
| 10 to 14 Year Olds | 190 (98.5%) | 3 (1.5%) |
| 15 to 17 Year Olds | 166 (100.0%) | 0 (0.0%) |
| 18 to 19 Year Olds | 164 (73.9%) | 58 (26.1%) |
| 20 to 24 Year Olds | 55 (44.7%) | 68 (55.3%) |
| 25 to 34 Year Olds | 0 (0.0%) | 0 (0.0%) |
| 35 Years and over | 8 (100.0%) | 0 (0.0%) |
| Total | 623 (80.2%) | 154 (19.8%) |
Educational Attainment by Field of Study in Russell Springs
Education (182 | 34.7%), liberal arts & history (103 | 19.6%), engineering (53 | 10.1%), psychology (45 | 8.6%), and communications (31 | 5.9%) are the most common fields of study among 525 individuals in Russell Springs who have obtained a bachelor's degree or higher.
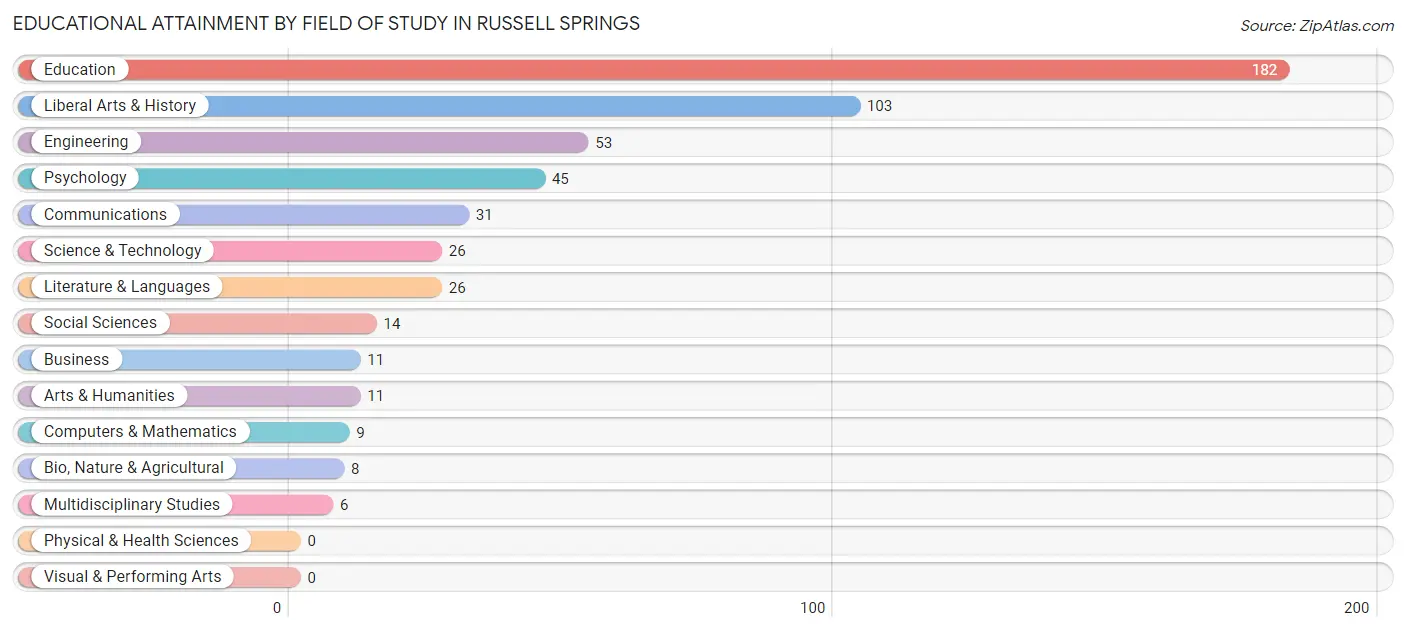
| Field of Study | # Graduates | % Graduates |
| Computers & Mathematics | 9 | 1.7% |
| Bio, Nature & Agricultural | 8 | 1.5% |
| Physical & Health Sciences | 0 | 0.0% |
| Psychology | 45 | 8.6% |
| Social Sciences | 14 | 2.7% |
| Engineering | 53 | 10.1% |
| Multidisciplinary Studies | 6 | 1.1% |
| Science & Technology | 26 | 5.0% |
| Business | 11 | 2.1% |
| Education | 182 | 34.7% |
| Literature & Languages | 26 | 5.0% |
| Liberal Arts & History | 103 | 19.6% |
| Visual & Performing Arts | 0 | 0.0% |
| Communications | 31 | 5.9% |
| Arts & Humanities | 11 | 2.1% |
| Total | 525 | 100.0% |
Transportation & Commute in Russell Springs
Vehicle Availability by Sex in Russell Springs
The most prevalent vehicle ownership categories in Russell Springs are males with 3 vehicles (395, accounting for 70.2%) and females with 3 vehicles (212, making up 69.7%).
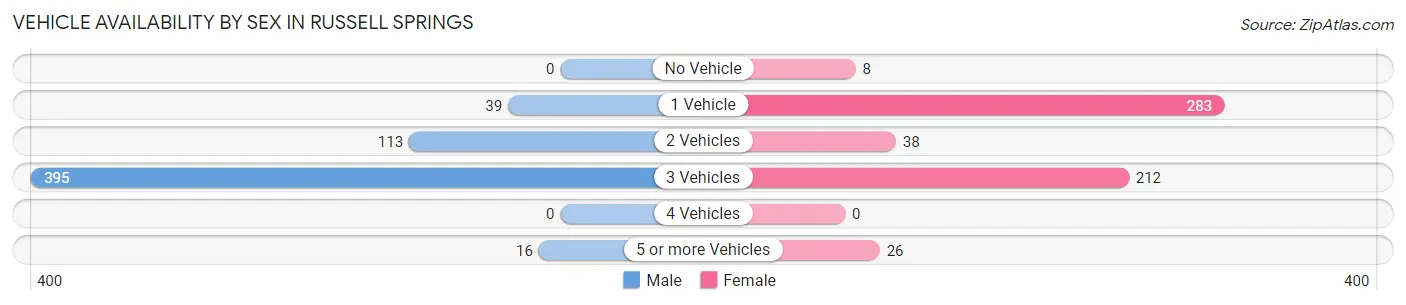
| Vehicles Available | Male | Female |
| No Vehicle | 0 (0.0%) | 8 (1.4%) |
| 1 Vehicle | 39 (6.9%) | 283 (49.9%) |
| 2 Vehicles | 113 (20.1%) | 38 (6.7%) |
| 3 Vehicles | 395 (70.2%) | 212 (37.4%) |
| 4 Vehicles | 0 (0.0%) | 0 (0.0%) |
| 5 or more Vehicles | 16 (2.8%) | 26 (4.6%) |
| Total | 563 (100.0%) | 567 (100.0%) |
Commute Time in Russell Springs
The most frequently occuring commute durations in Russell Springs are 5 to 9 minutes (543 commuters, 48.3%), 10 to 14 minutes (194 commuters, 17.3%), and 30 to 34 minutes (119 commuters, 10.6%).
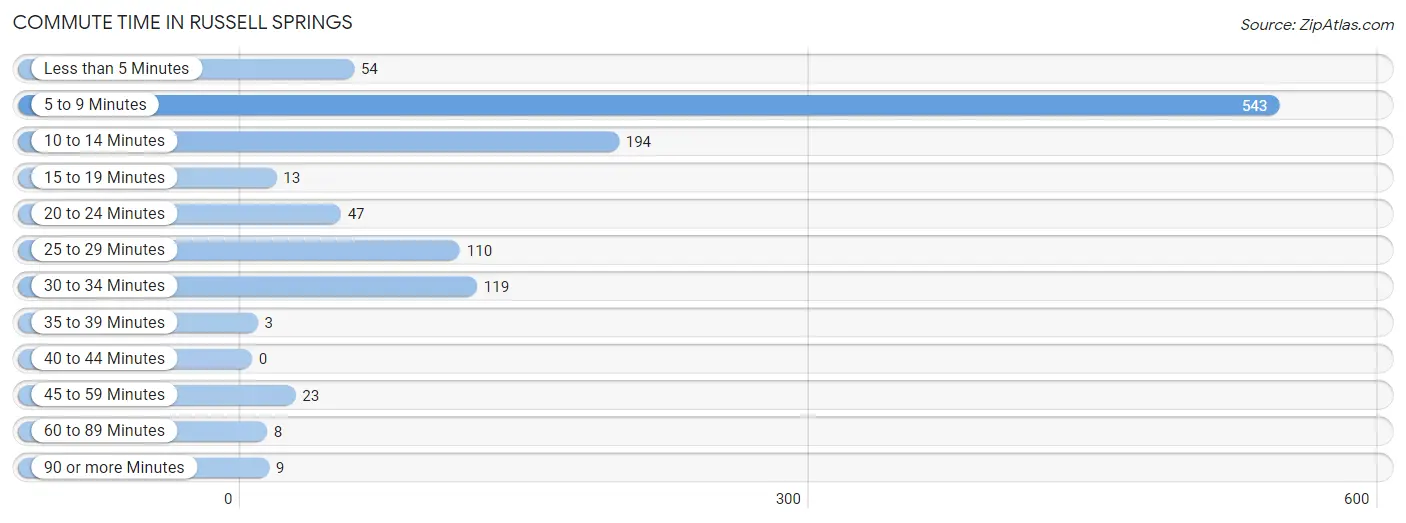
| Commute Time | # Commuters | % Commuters |
| Less than 5 Minutes | 54 | 4.8% |
| 5 to 9 Minutes | 543 | 48.3% |
| 10 to 14 Minutes | 194 | 17.3% |
| 15 to 19 Minutes | 13 | 1.2% |
| 20 to 24 Minutes | 47 | 4.2% |
| 25 to 29 Minutes | 110 | 9.8% |
| 30 to 34 Minutes | 119 | 10.6% |
| 35 to 39 Minutes | 3 | 0.3% |
| 40 to 44 Minutes | 0 | 0.0% |
| 45 to 59 Minutes | 23 | 2.1% |
| 60 to 89 Minutes | 8 | 0.7% |
| 90 or more Minutes | 9 | 0.8% |
Commute Time by Sex in Russell Springs
The most common commute times in Russell Springs are 5 to 9 minutes (273 commuters, 48.9%) for males and 5 to 9 minutes (270 commuters, 47.8%) for females.
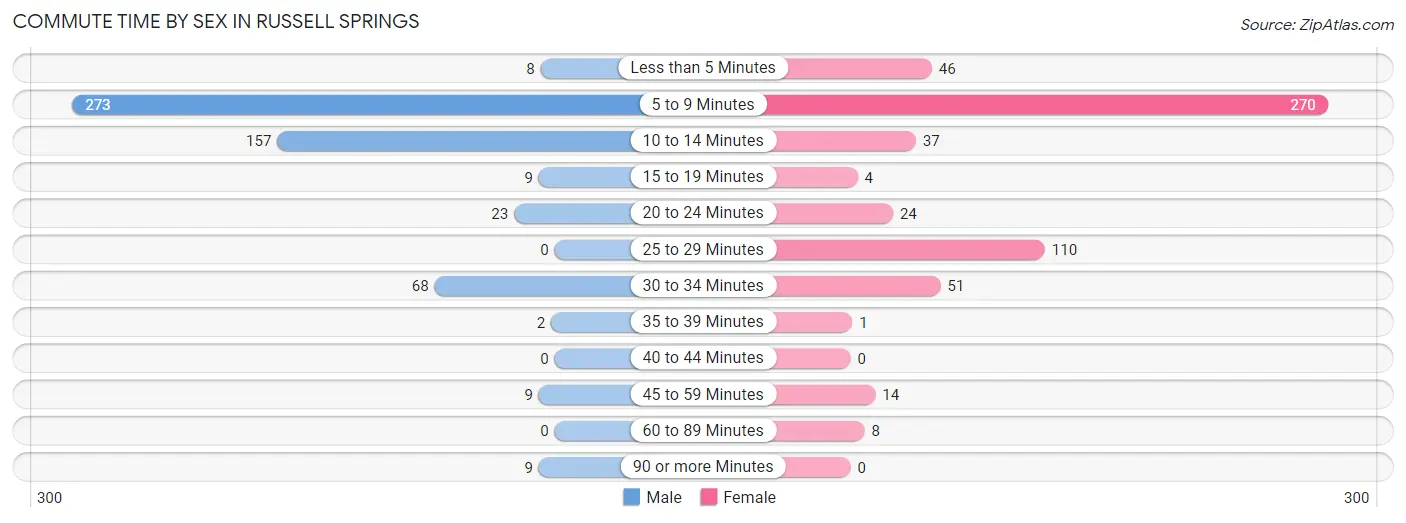
| Commute Time | Male | Female |
| Less than 5 Minutes | 8 (1.4%) | 46 (8.1%) |
| 5 to 9 Minutes | 273 (48.9%) | 270 (47.8%) |
| 10 to 14 Minutes | 157 (28.1%) | 37 (6.6%) |
| 15 to 19 Minutes | 9 (1.6%) | 4 (0.7%) |
| 20 to 24 Minutes | 23 (4.1%) | 24 (4.3%) |
| 25 to 29 Minutes | 0 (0.0%) | 110 (19.5%) |
| 30 to 34 Minutes | 68 (12.2%) | 51 (9.0%) |
| 35 to 39 Minutes | 2 (0.4%) | 1 (0.2%) |
| 40 to 44 Minutes | 0 (0.0%) | 0 (0.0%) |
| 45 to 59 Minutes | 9 (1.6%) | 14 (2.5%) |
| 60 to 89 Minutes | 0 (0.0%) | 8 (1.4%) |
| 90 or more Minutes | 9 (1.6%) | 0 (0.0%) |
Time of Departure to Work by Sex in Russell Springs
The most frequent times of departure to work in Russell Springs are 4:00 PM to 11:59 PM (230, 41.2%) for males and 5:30 AM to 5:59 AM (140, 24.8%) for females.
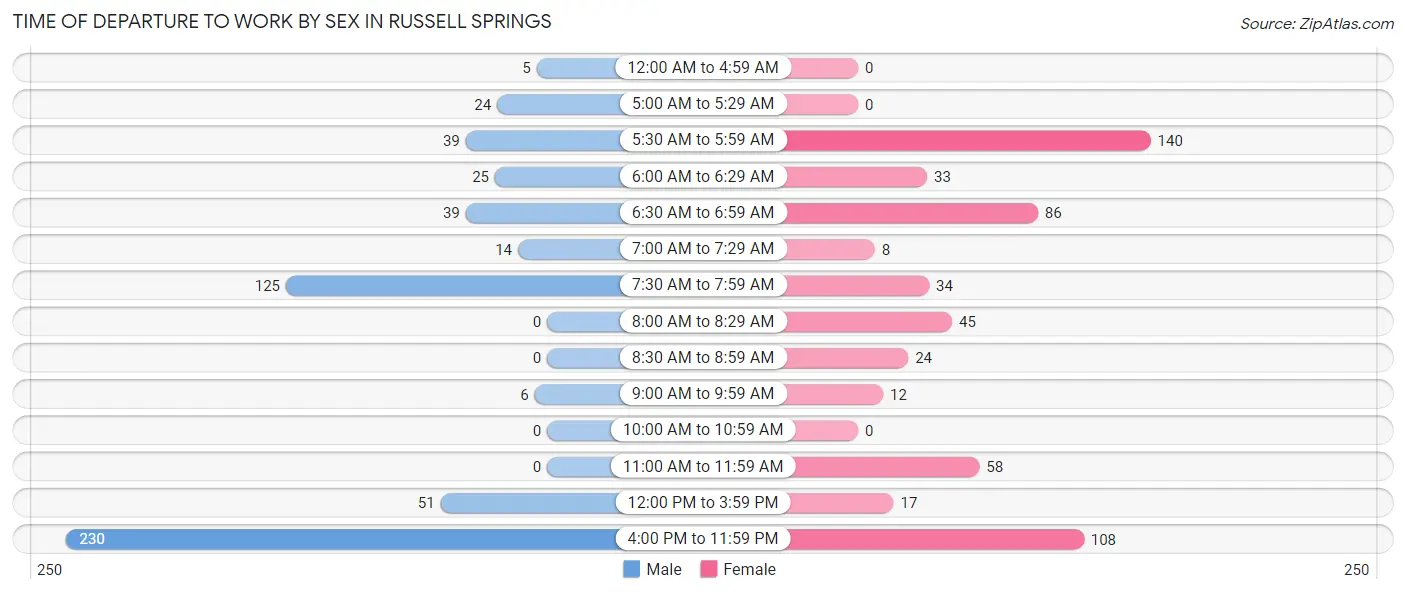
| Time of Departure | Male | Female |
| 12:00 AM to 4:59 AM | 5 (0.9%) | 0 (0.0%) |
| 5:00 AM to 5:29 AM | 24 (4.3%) | 0 (0.0%) |
| 5:30 AM to 5:59 AM | 39 (7.0%) | 140 (24.8%) |
| 6:00 AM to 6:29 AM | 25 (4.5%) | 33 (5.8%) |
| 6:30 AM to 6:59 AM | 39 (7.0%) | 86 (15.2%) |
| 7:00 AM to 7:29 AM | 14 (2.5%) | 8 (1.4%) |
| 7:30 AM to 7:59 AM | 125 (22.4%) | 34 (6.0%) |
| 8:00 AM to 8:29 AM | 0 (0.0%) | 45 (8.0%) |
| 8:30 AM to 8:59 AM | 0 (0.0%) | 24 (4.3%) |
| 9:00 AM to 9:59 AM | 6 (1.1%) | 12 (2.1%) |
| 10:00 AM to 10:59 AM | 0 (0.0%) | 0 (0.0%) |
| 11:00 AM to 11:59 AM | 0 (0.0%) | 58 (10.3%) |
| 12:00 PM to 3:59 PM | 51 (9.1%) | 17 (3.0%) |
| 4:00 PM to 11:59 PM | 230 (41.2%) | 108 (19.1%) |
| Total | 558 (100.0%) | 565 (100.0%) |
Housing Occupancy in Russell Springs
Occupancy by Ownership in Russell Springs
Of the total 1,024 dwellings in Russell Springs, owner-occupied units account for 547 (53.4%), while renter-occupied units make up 477 (46.6%).
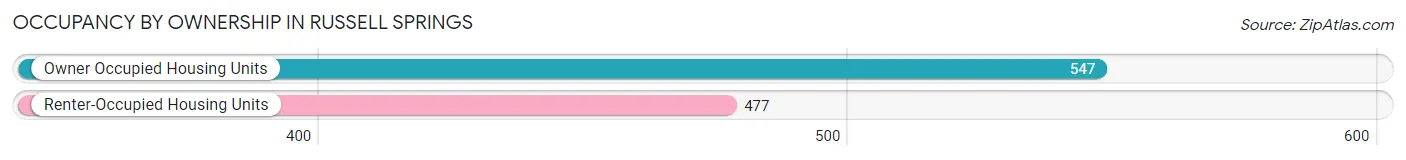
| Occupancy | # Housing Units | % Housing Units |
| Owner Occupied Housing Units | 547 | 53.4% |
| Renter-Occupied Housing Units | 477 | 46.6% |
| Total Occupied Housing Units | 1,024 | 100.0% |
Occupancy by Household Size in Russell Springs
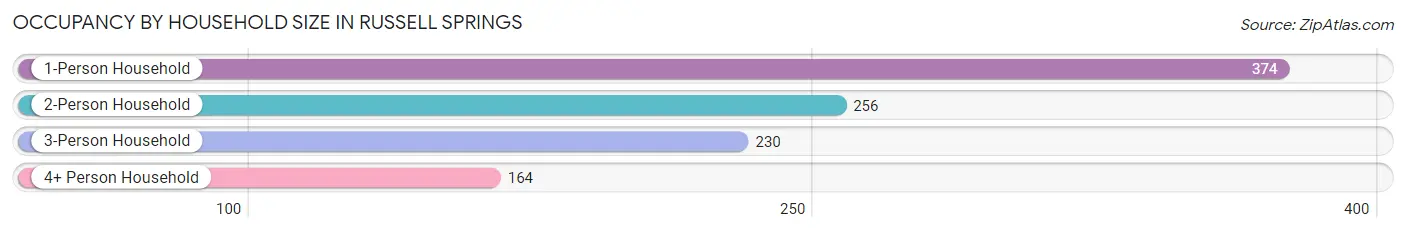
| Household Size | # Housing Units | % Housing Units |
| 1-Person Household | 374 | 36.5% |
| 2-Person Household | 256 | 25.0% |
| 3-Person Household | 230 | 22.5% |
| 4+ Person Household | 164 | 16.0% |
| Total Housing Units | 1,024 | 100.0% |
Occupancy by Ownership by Household Size in Russell Springs
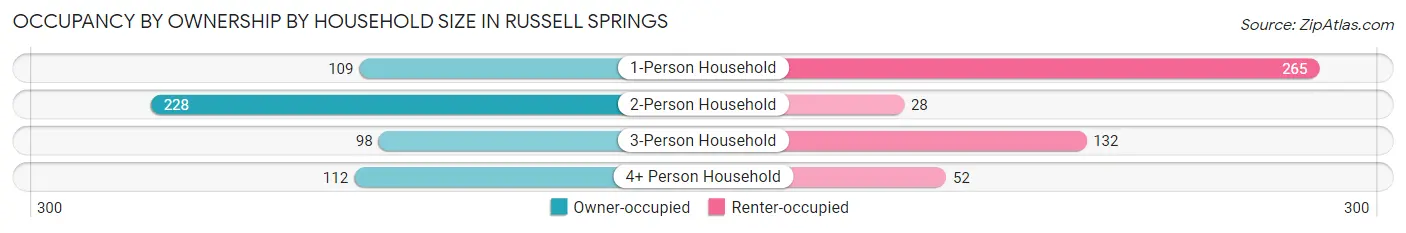
| Household Size | Owner-occupied | Renter-occupied |
| 1-Person Household | 109 (29.1%) | 265 (70.9%) |
| 2-Person Household | 228 (89.1%) | 28 (10.9%) |
| 3-Person Household | 98 (42.6%) | 132 (57.4%) |
| 4+ Person Household | 112 (68.3%) | 52 (31.7%) |
| Total Housing Units | 547 (53.4%) | 477 (46.6%) |
Occupancy by Educational Attainment in Russell Springs
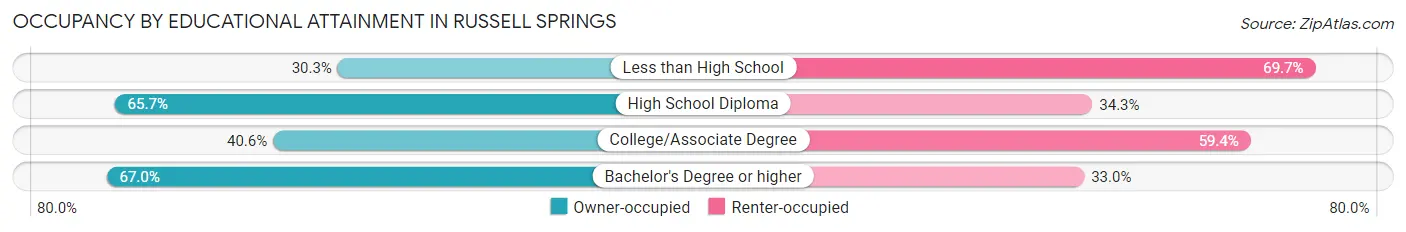
| Household Size | Owner-occupied | Renter-occupied |
| Less than High School | 54 (30.3%) | 124 (69.7%) |
| High School Diploma | 184 (65.7%) | 96 (34.3%) |
| College/Associate Degree | 108 (40.6%) | 158 (59.4%) |
| Bachelor's Degree or higher | 201 (67.0%) | 99 (33.0%) |
Occupancy by Age of Householder in Russell Springs
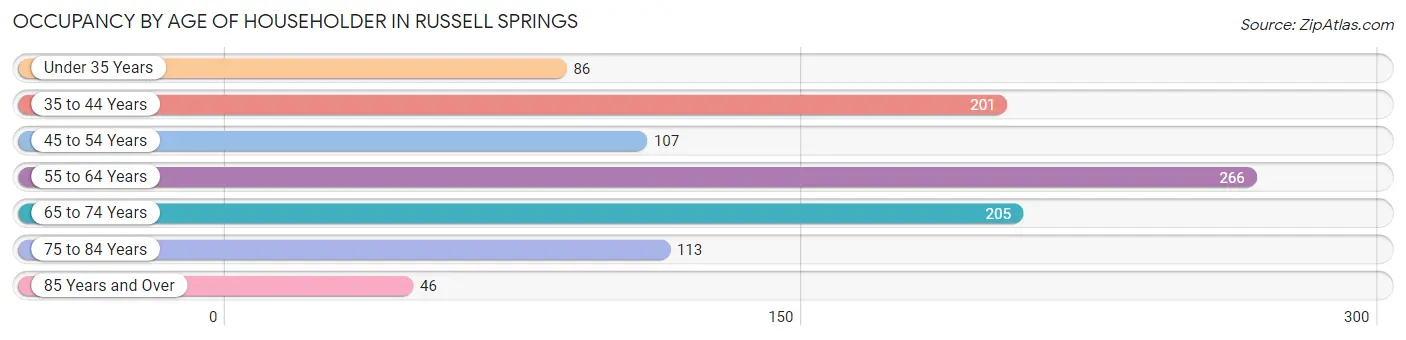
| Age Bracket | # Households | % Households |
| Under 35 Years | 86 | 8.4% |
| 35 to 44 Years | 201 | 19.6% |
| 45 to 54 Years | 107 | 10.4% |
| 55 to 64 Years | 266 | 26.0% |
| 65 to 74 Years | 205 | 20.0% |
| 75 to 84 Years | 113 | 11.0% |
| 85 Years and Over | 46 | 4.5% |
| Total | 1,024 | 100.0% |
Housing Finances in Russell Springs
Median Income by Occupancy in Russell Springs
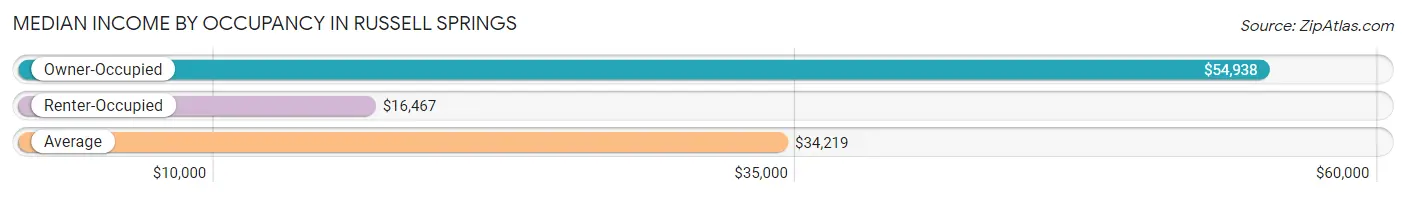
| Occupancy Type | # Households | Median Income |
| Owner-Occupied | 547 (53.4%) | $54,938 |
| Renter-Occupied | 477 (46.6%) | $16,467 |
| Average | 1,024 (100.0%) | $34,219 |
Occupancy by Householder Income Bracket in Russell Springs
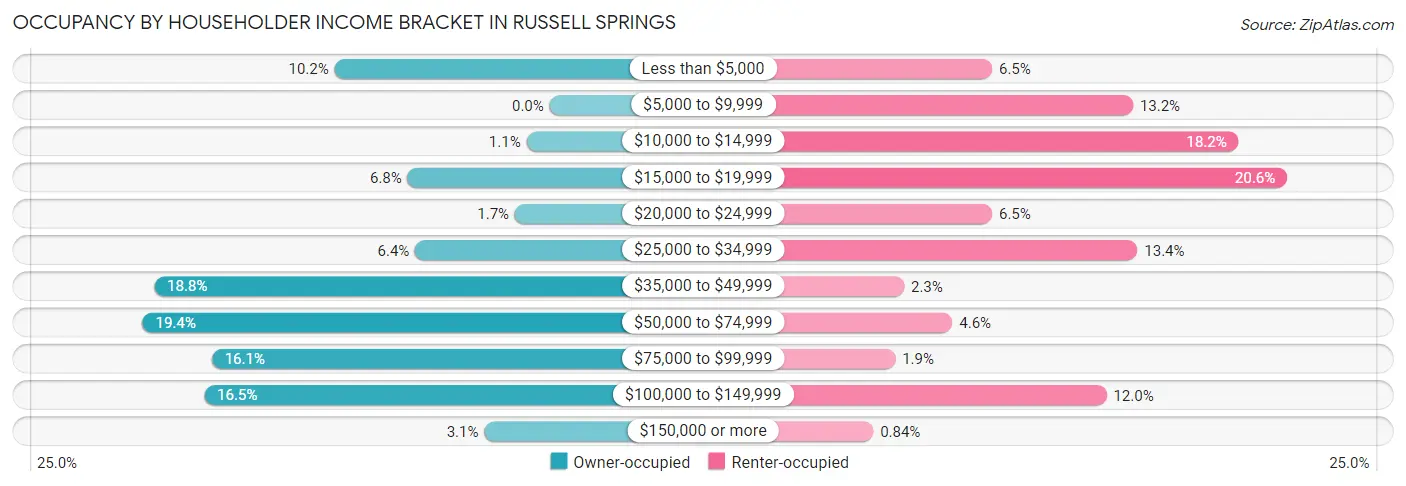
| Income Bracket | Owner-occupied | Renter-occupied |
| Less than $5,000 | 56 (10.2%) | 31 (6.5%) |
| $5,000 to $9,999 | 0 (0.0%) | 63 (13.2%) |
| $10,000 to $14,999 | 6 (1.1%) | 87 (18.2%) |
| $15,000 to $19,999 | 37 (6.8%) | 98 (20.5%) |
| $20,000 to $24,999 | 9 (1.7%) | 31 (6.5%) |
| $25,000 to $34,999 | 35 (6.4%) | 64 (13.4%) |
| $35,000 to $49,999 | 103 (18.8%) | 11 (2.3%) |
| $50,000 to $74,999 | 106 (19.4%) | 22 (4.6%) |
| $75,000 to $99,999 | 88 (16.1%) | 9 (1.9%) |
| $100,000 to $149,999 | 90 (16.5%) | 57 (11.9%) |
| $150,000 or more | 17 (3.1%) | 4 (0.8%) |
| Total | 547 (100.0%) | 477 (100.0%) |
Monthly Housing Cost Tiers in Russell Springs
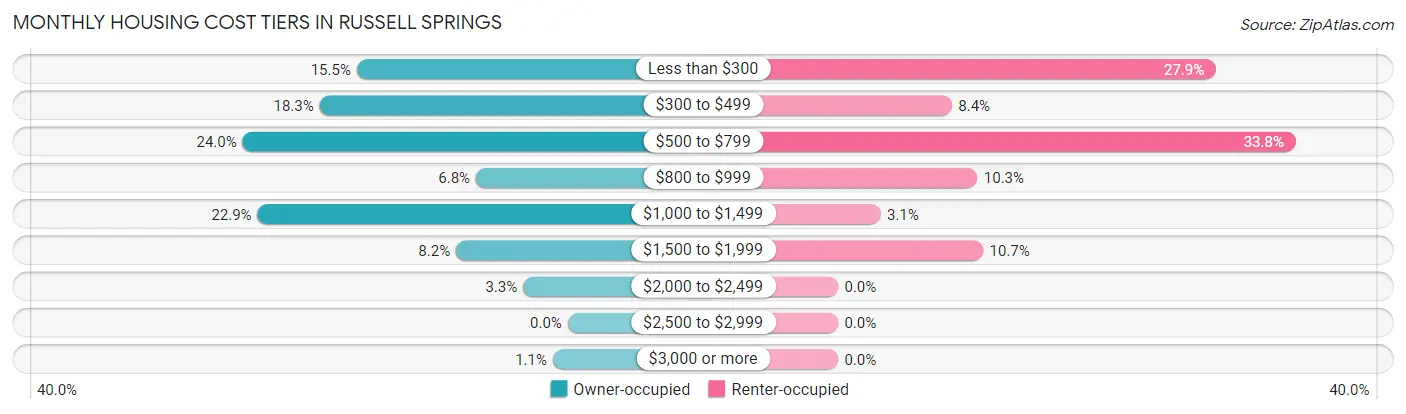
| Monthly Cost | Owner-occupied | Renter-occupied |
| Less than $300 | 85 (15.5%) | 133 (27.9%) |
| $300 to $499 | 100 (18.3%) | 40 (8.4%) |
| $500 to $799 | 131 (23.9%) | 161 (33.8%) |
| $800 to $999 | 37 (6.8%) | 49 (10.3%) |
| $1,000 to $1,499 | 125 (22.9%) | 15 (3.1%) |
| $1,500 to $1,999 | 45 (8.2%) | 51 (10.7%) |
| $2,000 to $2,499 | 18 (3.3%) | 0 (0.0%) |
| $2,500 to $2,999 | 0 (0.0%) | 0 (0.0%) |
| $3,000 or more | 6 (1.1%) | 0 (0.0%) |
| Total | 547 (100.0%) | 477 (100.0%) |
Physical Housing Characteristics in Russell Springs
Housing Structures in Russell Springs
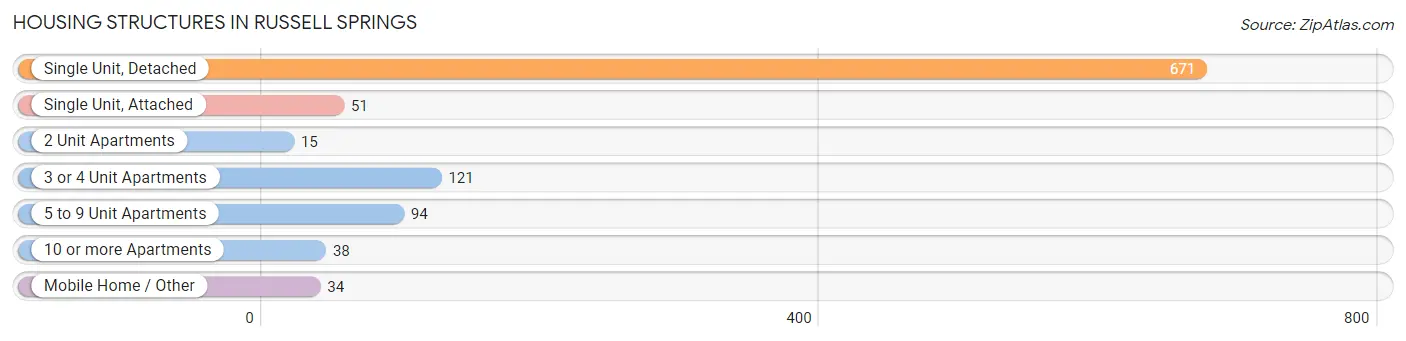
| Structure Type | # Housing Units | % Housing Units |
| Single Unit, Detached | 671 | 65.5% |
| Single Unit, Attached | 51 | 5.0% |
| 2 Unit Apartments | 15 | 1.5% |
| 3 or 4 Unit Apartments | 121 | 11.8% |
| 5 to 9 Unit Apartments | 94 | 9.2% |
| 10 or more Apartments | 38 | 3.7% |
| Mobile Home / Other | 34 | 3.3% |
| Total | 1,024 | 100.0% |
Housing Structures by Occupancy in Russell Springs
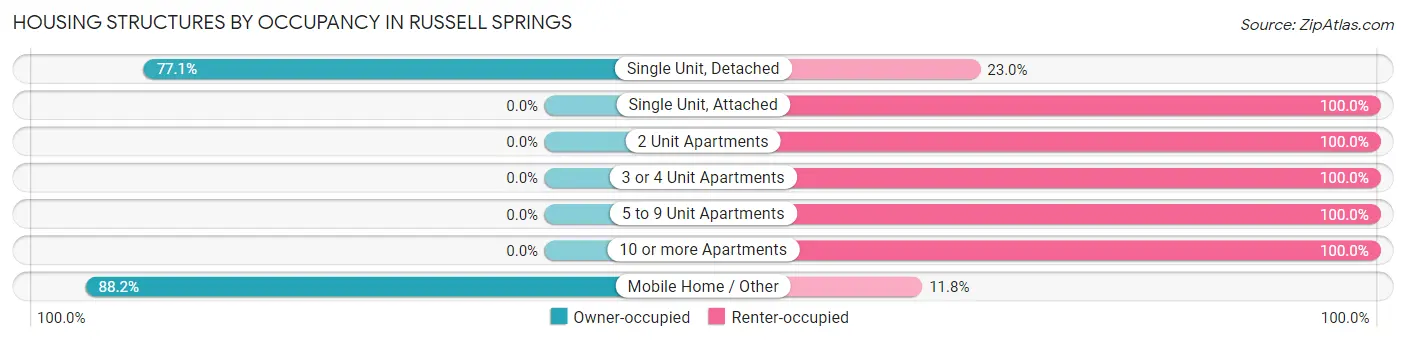
| Structure Type | Owner-occupied | Renter-occupied |
| Single Unit, Detached | 517 (77.0%) | 154 (23.0%) |
| Single Unit, Attached | 0 (0.0%) | 51 (100.0%) |
| 2 Unit Apartments | 0 (0.0%) | 15 (100.0%) |
| 3 or 4 Unit Apartments | 0 (0.0%) | 121 (100.0%) |
| 5 to 9 Unit Apartments | 0 (0.0%) | 94 (100.0%) |
| 10 or more Apartments | 0 (0.0%) | 38 (100.0%) |
| Mobile Home / Other | 30 (88.2%) | 4 (11.8%) |
| Total | 547 (53.4%) | 477 (46.6%) |
Housing Structures by Number of Rooms in Russell Springs
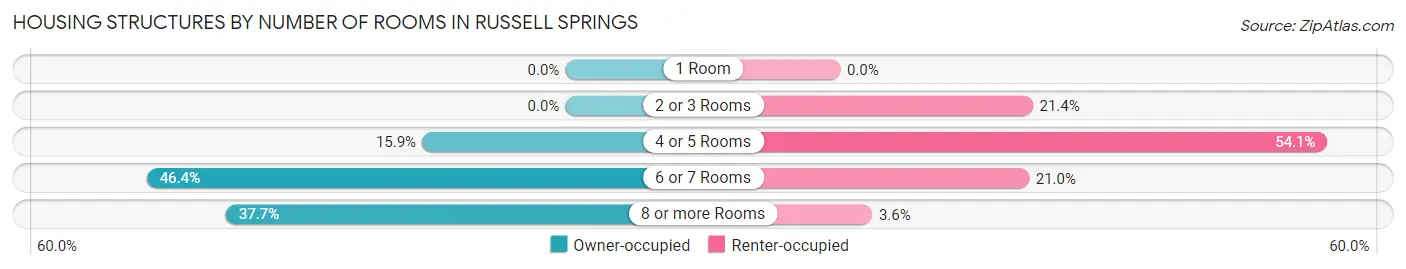
| Number of Rooms | Owner-occupied | Renter-occupied |
| 1 Room | 0 (0.0%) | 0 (0.0%) |
| 2 or 3 Rooms | 0 (0.0%) | 102 (21.4%) |
| 4 or 5 Rooms | 87 (15.9%) | 258 (54.1%) |
| 6 or 7 Rooms | 254 (46.4%) | 100 (21.0%) |
| 8 or more Rooms | 206 (37.7%) | 17 (3.6%) |
| Total | 547 (100.0%) | 477 (100.0%) |
Housing Structure by Heating Type in Russell Springs
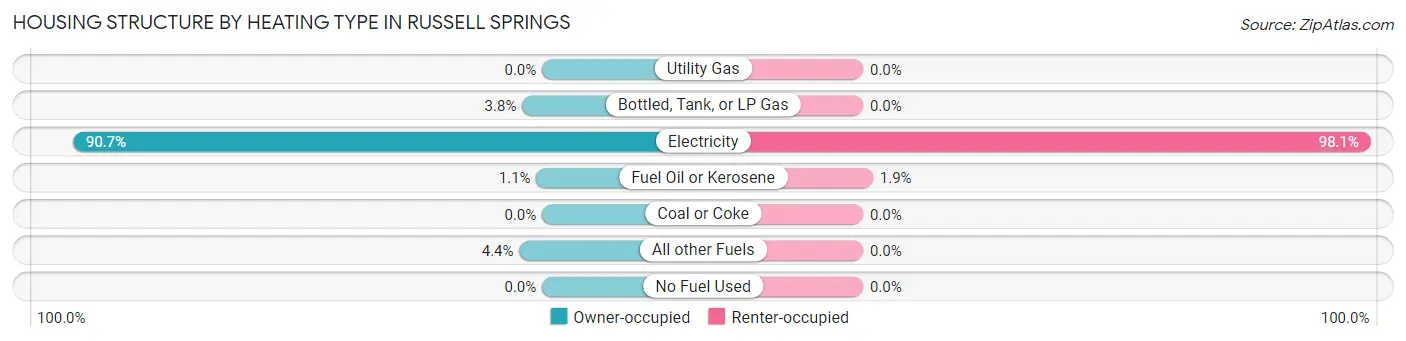
| Heating Type | Owner-occupied | Renter-occupied |
| Utility Gas | 0 (0.0%) | 0 (0.0%) |
| Bottled, Tank, or LP Gas | 21 (3.8%) | 0 (0.0%) |
| Electricity | 496 (90.7%) | 468 (98.1%) |
| Fuel Oil or Kerosene | 6 (1.1%) | 9 (1.9%) |
| Coal or Coke | 0 (0.0%) | 0 (0.0%) |
| All other Fuels | 24 (4.4%) | 0 (0.0%) |
| No Fuel Used | 0 (0.0%) | 0 (0.0%) |
| Total | 547 (100.0%) | 477 (100.0%) |
Household Vehicle Usage in Russell Springs
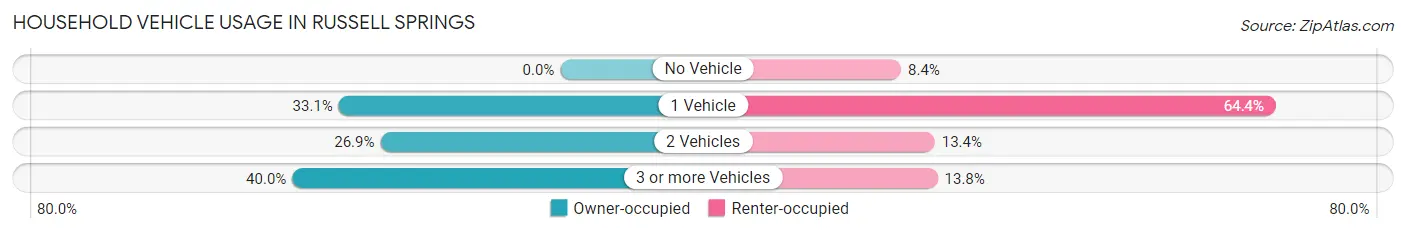
| Vehicles per Household | Owner-occupied | Renter-occupied |
| No Vehicle | 0 (0.0%) | 40 (8.4%) |
| 1 Vehicle | 181 (33.1%) | 307 (64.4%) |
| 2 Vehicles | 147 (26.9%) | 64 (13.4%) |
| 3 or more Vehicles | 219 (40.0%) | 66 (13.8%) |
| Total | 547 (100.0%) | 477 (100.0%) |
Real Estate & Mortgages in Russell Springs
Real Estate and Mortgage Overview in Russell Springs
| Characteristic | Without Mortgage | With Mortgage |
| Housing Units | 315 | 232 |
| Median Property Value | $158,700 | $145,000 |
| Median Household Income | $35,841 | $5 |
| Monthly Housing Costs | $363 | $0 |
| Real Estate Taxes | $599 | $0 |
Property Value by Mortgage Status in Russell Springs
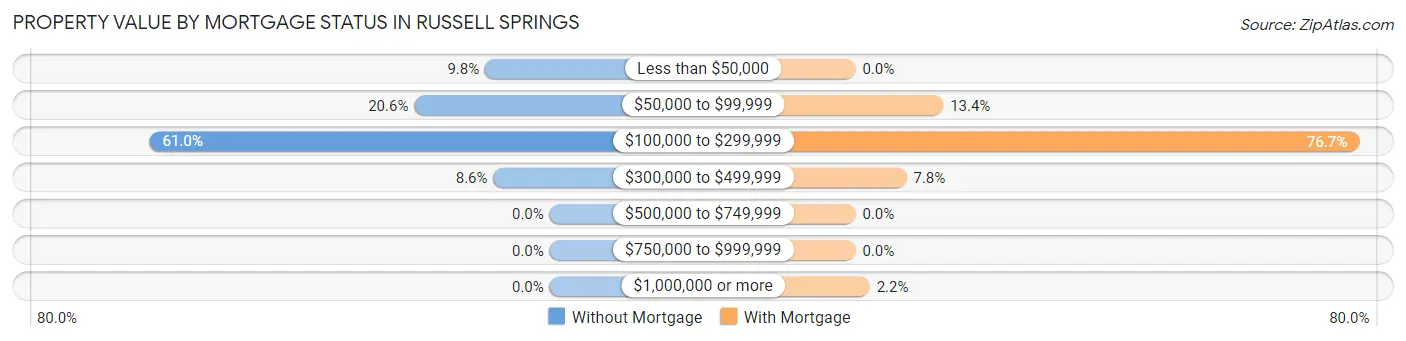
| Property Value | Without Mortgage | With Mortgage |
| Less than $50,000 | 31 (9.8%) | 0 (0.0%) |
| $50,000 to $99,999 | 65 (20.6%) | 31 (13.4%) |
| $100,000 to $299,999 | 192 (61.0%) | 178 (76.7%) |
| $300,000 to $499,999 | 27 (8.6%) | 18 (7.8%) |
| $500,000 to $749,999 | 0 (0.0%) | 0 (0.0%) |
| $750,000 to $999,999 | 0 (0.0%) | 0 (0.0%) |
| $1,000,000 or more | 0 (0.0%) | 5 (2.2%) |
| Total | 315 (100.0%) | 232 (100.0%) |
Household Income by Mortgage Status in Russell Springs
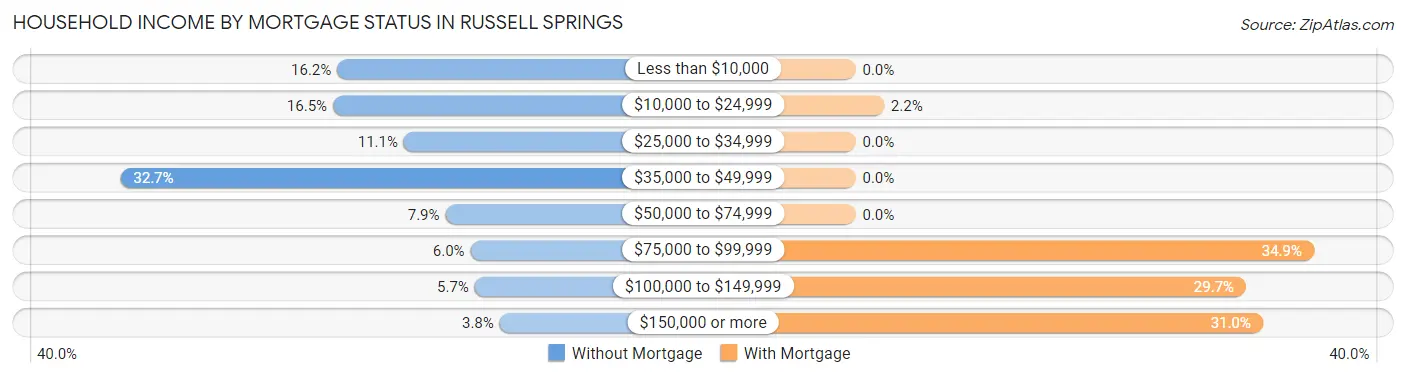
| Household Income | Without Mortgage | With Mortgage |
| Less than $10,000 | 51 (16.2%) | 0 (0.0%) |
| $10,000 to $24,999 | 52 (16.5%) | 5 (2.2%) |
| $25,000 to $34,999 | 35 (11.1%) | 0 (0.0%) |
| $35,000 to $49,999 | 103 (32.7%) | 0 (0.0%) |
| $50,000 to $74,999 | 25 (7.9%) | 0 (0.0%) |
| $75,000 to $99,999 | 19 (6.0%) | 81 (34.9%) |
| $100,000 to $149,999 | 18 (5.7%) | 69 (29.7%) |
| $150,000 or more | 12 (3.8%) | 72 (31.0%) |
| Total | 315 (100.0%) | 232 (100.0%) |
Property Value to Household Income Ratio in Russell Springs
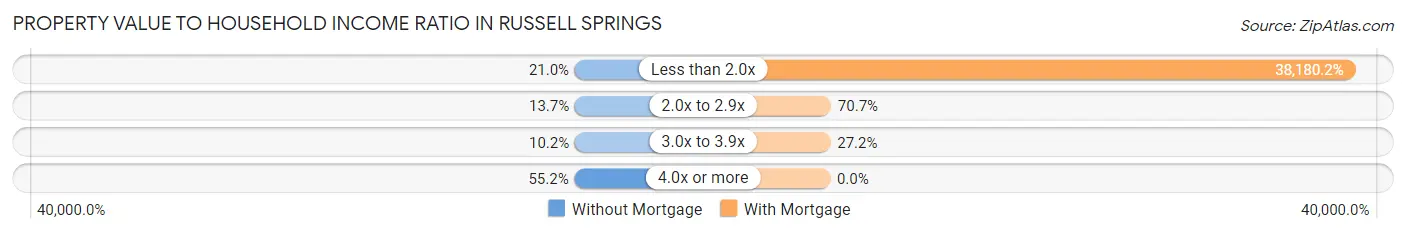
| Value-to-Income Ratio | Without Mortgage | With Mortgage |
| Less than 2.0x | 66 (20.9%) | 88,578 (38,180.2%) |
| 2.0x to 2.9x | 43 (13.7%) | 164 (70.7%) |
| 3.0x to 3.9x | 32 (10.2%) | 63 (27.2%) |
| 4.0x or more | 174 (55.2%) | 0 (0.0%) |
| Total | 315 (100.0%) | 232 (100.0%) |
Real Estate Taxes by Mortgage Status in Russell Springs
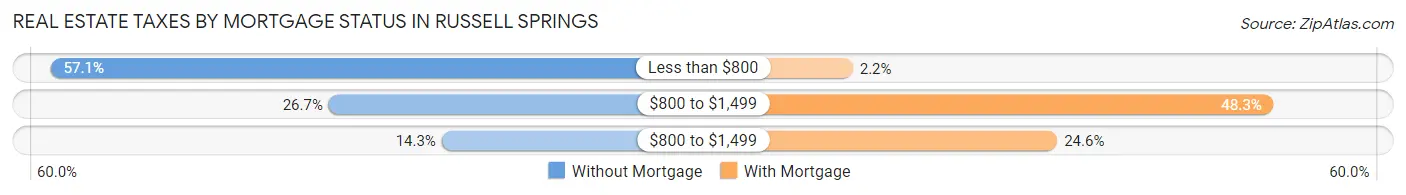
| Property Taxes | Without Mortgage | With Mortgage |
| Less than $800 | 180 (57.1%) | 5 (2.2%) |
| $800 to $1,499 | 84 (26.7%) | 112 (48.3%) |
| $800 to $1,499 | 45 (14.3%) | 57 (24.6%) |
| Total | 315 (100.0%) | 232 (100.0%) |
Health & Disability in Russell Springs
Health Insurance Coverage by Age in Russell Springs
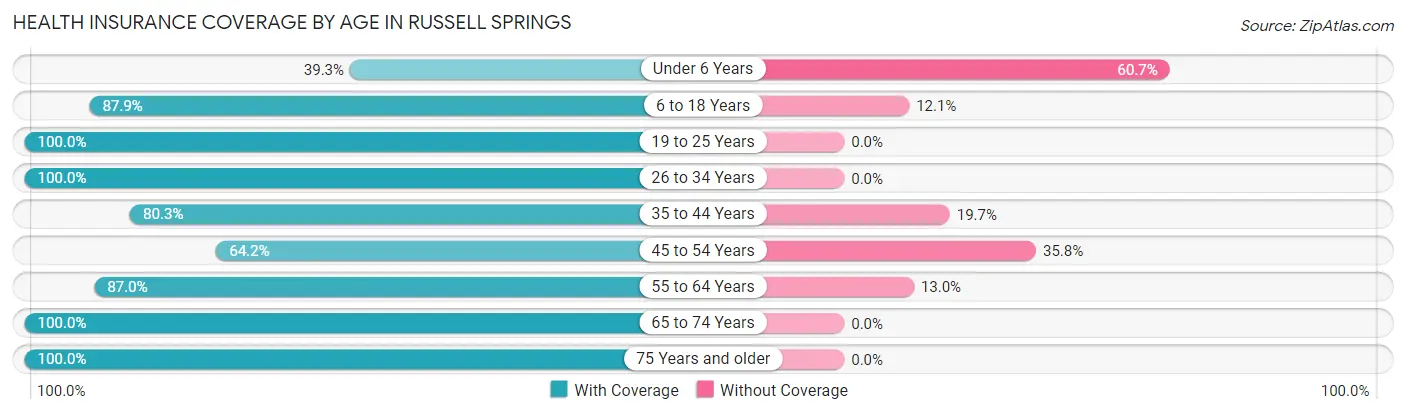
| Age Bracket | With Coverage | Without Coverage |
| Under 6 Years | 24 (39.3%) | 37 (60.7%) |
| 6 to 18 Years | 414 (87.9%) | 57 (12.1%) |
| 19 to 25 Years | 380 (100.0%) | 0 (0.0%) |
| 26 to 34 Years | 87 (100.0%) | 0 (0.0%) |
| 35 to 44 Years | 241 (80.3%) | 59 (19.7%) |
| 45 to 54 Years | 185 (64.2%) | 103 (35.8%) |
| 55 to 64 Years | 355 (87.0%) | 53 (13.0%) |
| 65 to 74 Years | 429 (100.0%) | 0 (0.0%) |
| 75 Years and older | 211 (100.0%) | 0 (0.0%) |
| Total | 2,326 (88.3%) | 309 (11.7%) |
Health Insurance Coverage by Citizenship Status in Russell Springs
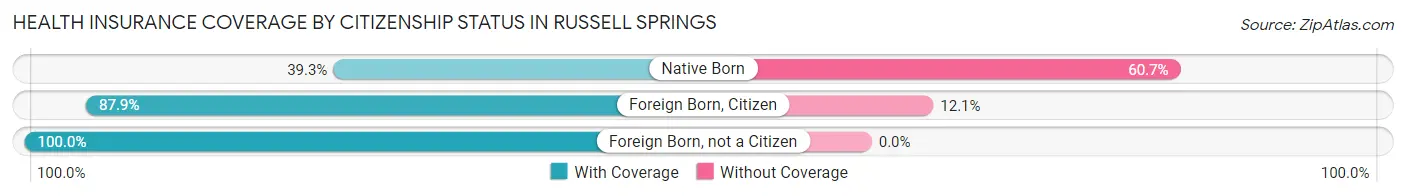
| Citizenship Status | With Coverage | Without Coverage |
| Native Born | 24 (39.3%) | 37 (60.7%) |
| Foreign Born, Citizen | 414 (87.9%) | 57 (12.1%) |
| Foreign Born, not a Citizen | 380 (100.0%) | 0 (0.0%) |
Health Insurance Coverage by Household Income in Russell Springs
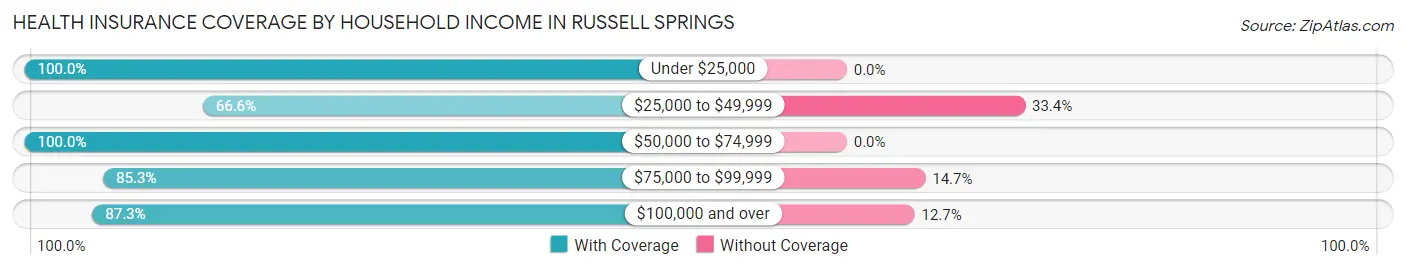
| Household Income | With Coverage | Without Coverage |
| Under $25,000 | 566 (100.0%) | 0 (0.0%) |
| $25,000 to $49,999 | 329 (66.6%) | 165 (33.4%) |
| $50,000 to $74,999 | 485 (100.0%) | 0 (0.0%) |
| $75,000 to $99,999 | 238 (85.3%) | 41 (14.7%) |
| $100,000 and over | 708 (87.3%) | 103 (12.7%) |
Public vs Private Health Insurance Coverage by Age in Russell Springs
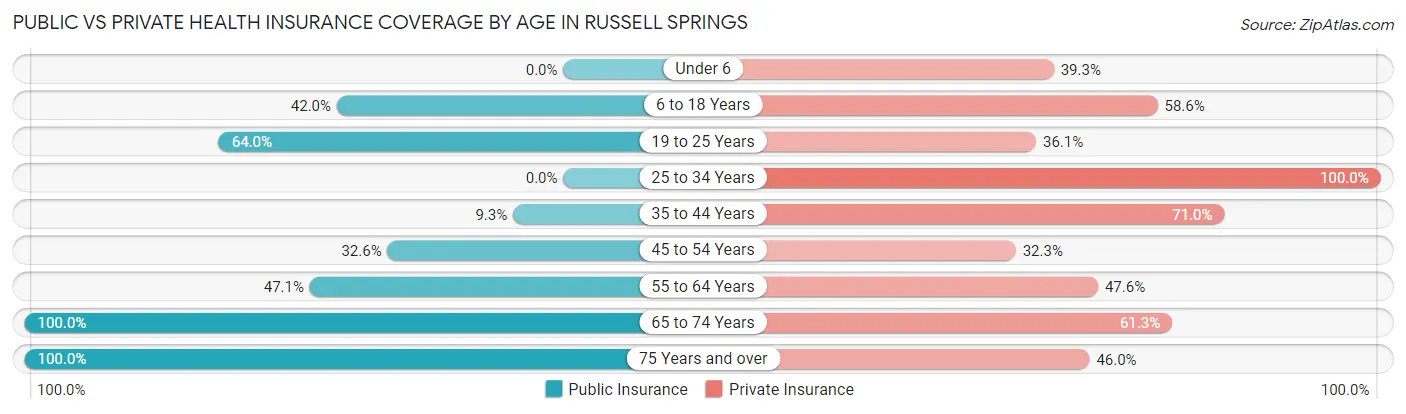
| Age Bracket | Public Insurance | Private Insurance |
| Under 6 | 0 (0.0%) | 24 (39.3%) |
| 6 to 18 Years | 198 (42.0%) | 276 (58.6%) |
| 19 to 25 Years | 243 (63.9%) | 137 (36.0%) |
| 25 to 34 Years | 0 (0.0%) | 87 (100.0%) |
| 35 to 44 Years | 28 (9.3%) | 213 (71.0%) |
| 45 to 54 Years | 94 (32.6%) | 93 (32.3%) |
| 55 to 64 Years | 192 (47.1%) | 194 (47.5%) |
| 65 to 74 Years | 429 (100.0%) | 263 (61.3%) |
| 75 Years and over | 211 (100.0%) | 97 (46.0%) |
| Total | 1,395 (52.9%) | 1,384 (52.5%) |
Disability Status by Sex by Age in Russell Springs
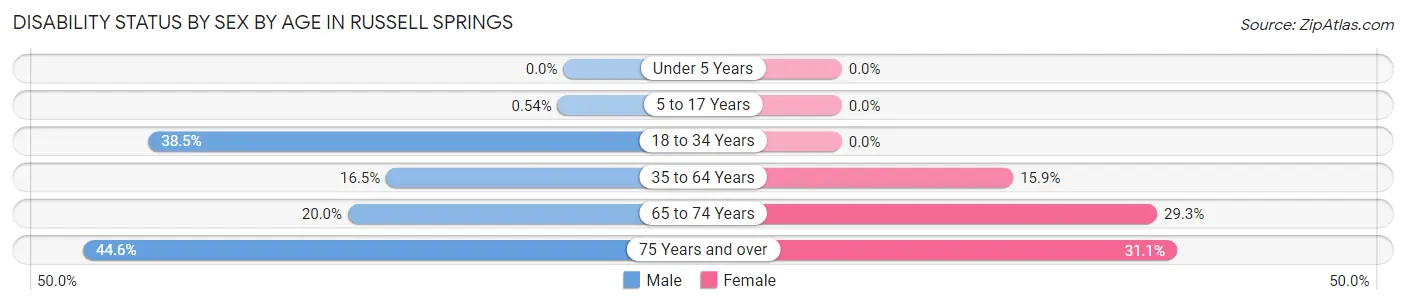
| Age Bracket | Male | Female |
| Under 5 Years | 0 (0.0%) | 0 (0.0%) |
| 5 to 17 Years | 1 (0.5%) | 0 (0.0%) |
| 18 to 34 Years | 124 (38.5%) | 0 (0.0%) |
| 35 to 64 Years | 77 (16.5%) | 84 (15.9%) |
| 65 to 74 Years | 40 (20.0%) | 67 (29.3%) |
| 75 Years and over | 41 (44.6%) | 37 (31.1%) |
Disability Class by Sex by Age in Russell Springs
Disability Class: Hearing Difficulty
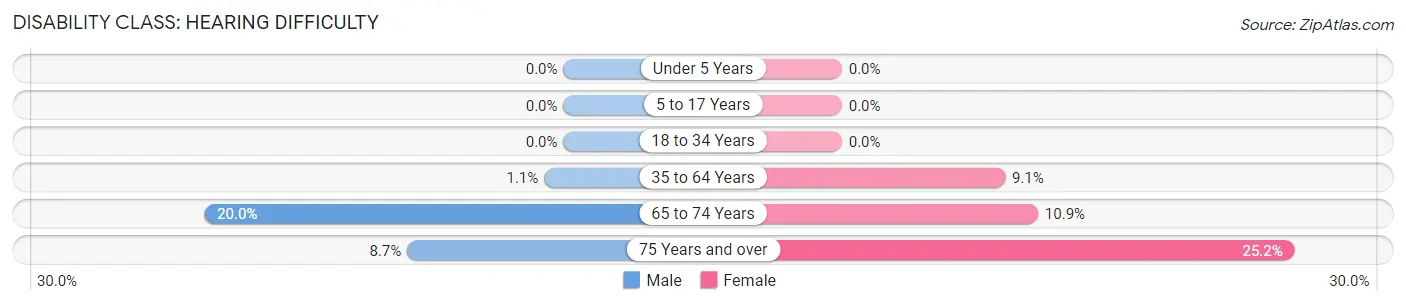
| Age Bracket | Male | Female |
| Under 5 Years | 0 (0.0%) | 0 (0.0%) |
| 5 to 17 Years | 0 (0.0%) | 0 (0.0%) |
| 18 to 34 Years | 0 (0.0%) | 0 (0.0%) |
| 35 to 64 Years | 5 (1.1%) | 48 (9.1%) |
| 65 to 74 Years | 40 (20.0%) | 25 (10.9%) |
| 75 Years and over | 8 (8.7%) | 30 (25.2%) |
Disability Class: Vision Difficulty
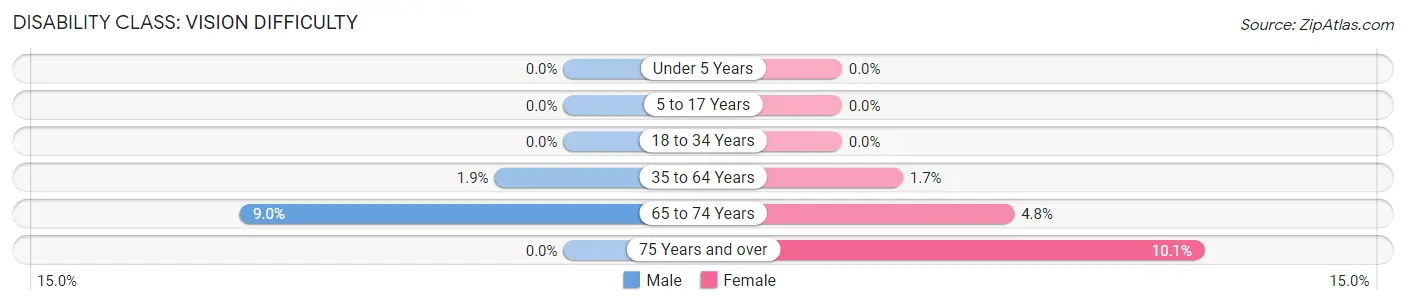
| Age Bracket | Male | Female |
| Under 5 Years | 0 (0.0%) | 0 (0.0%) |
| 5 to 17 Years | 0 (0.0%) | 0 (0.0%) |
| 18 to 34 Years | 0 (0.0%) | 0 (0.0%) |
| 35 to 64 Years | 9 (1.9%) | 9 (1.7%) |
| 65 to 74 Years | 18 (9.0%) | 11 (4.8%) |
| 75 Years and over | 0 (0.0%) | 12 (10.1%) |
Disability Class: Cognitive Difficulty
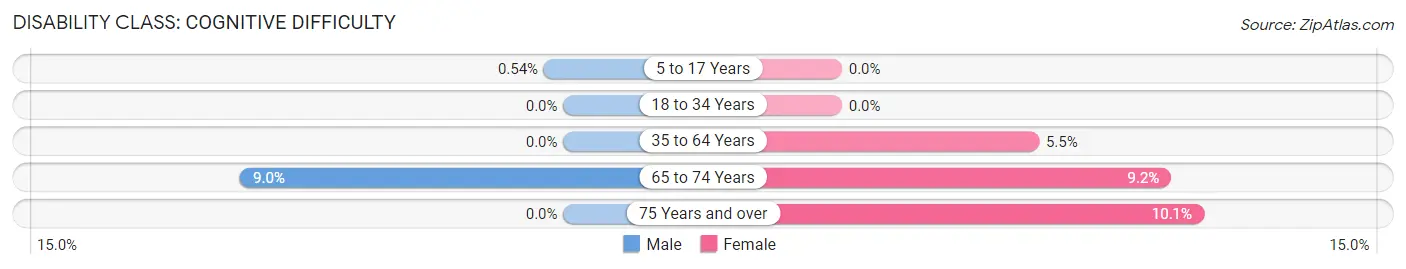
| Age Bracket | Male | Female |
| 5 to 17 Years | 1 (0.5%) | 0 (0.0%) |
| 18 to 34 Years | 0 (0.0%) | 0 (0.0%) |
| 35 to 64 Years | 0 (0.0%) | 29 (5.5%) |
| 65 to 74 Years | 18 (9.0%) | 21 (9.2%) |
| 75 Years and over | 0 (0.0%) | 12 (10.1%) |
Disability Class: Ambulatory Difficulty
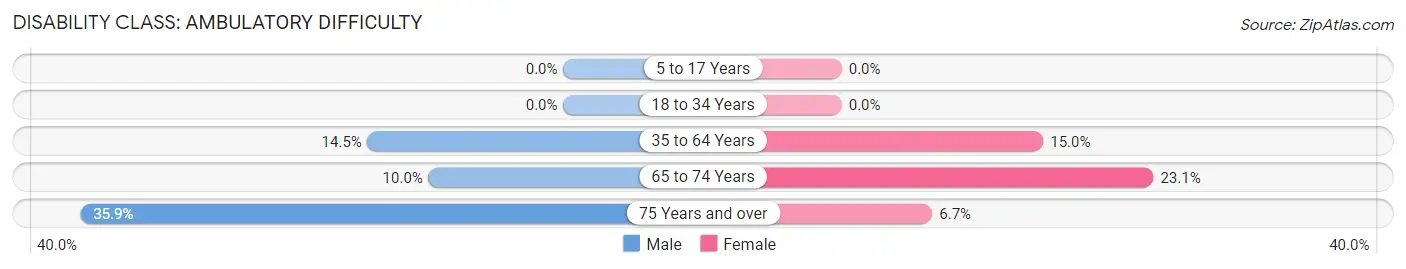
| Age Bracket | Male | Female |
| 5 to 17 Years | 0 (0.0%) | 0 (0.0%) |
| 18 to 34 Years | 0 (0.0%) | 0 (0.0%) |
| 35 to 64 Years | 68 (14.5%) | 79 (15.0%) |
| 65 to 74 Years | 20 (10.0%) | 53 (23.1%) |
| 75 Years and over | 33 (35.9%) | 8 (6.7%) |
Disability Class: Self-Care Difficulty
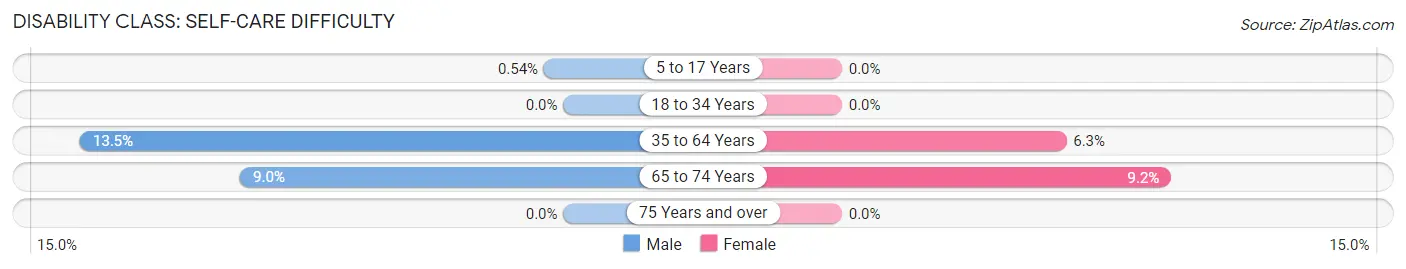
| Age Bracket | Male | Female |
| 5 to 17 Years | 1 (0.5%) | 0 (0.0%) |
| 18 to 34 Years | 0 (0.0%) | 0 (0.0%) |
| 35 to 64 Years | 63 (13.5%) | 33 (6.2%) |
| 65 to 74 Years | 18 (9.0%) | 21 (9.2%) |
| 75 Years and over | 0 (0.0%) | 0 (0.0%) |
Technology Access in Russell Springs
Computing Device Access in Russell Springs
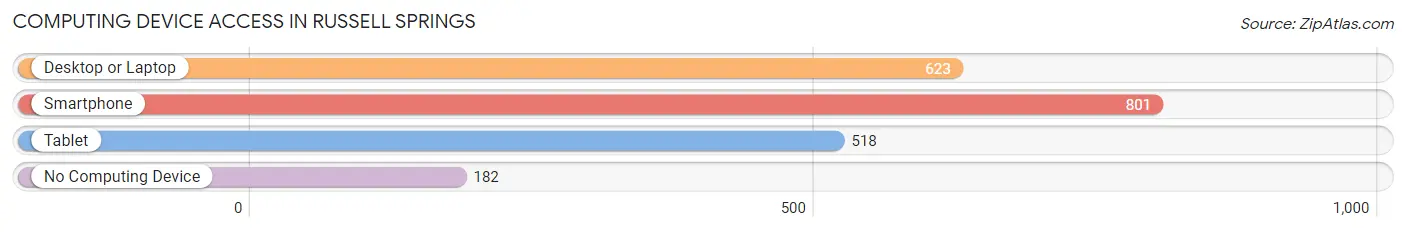
| Device Type | # Households | % Households |
| Desktop or Laptop | 623 | 60.8% |
| Smartphone | 801 | 78.2% |
| Tablet | 518 | 50.6% |
| No Computing Device | 182 | 17.8% |
| Total | 1,024 | 100.0% |
Internet Access in Russell Springs
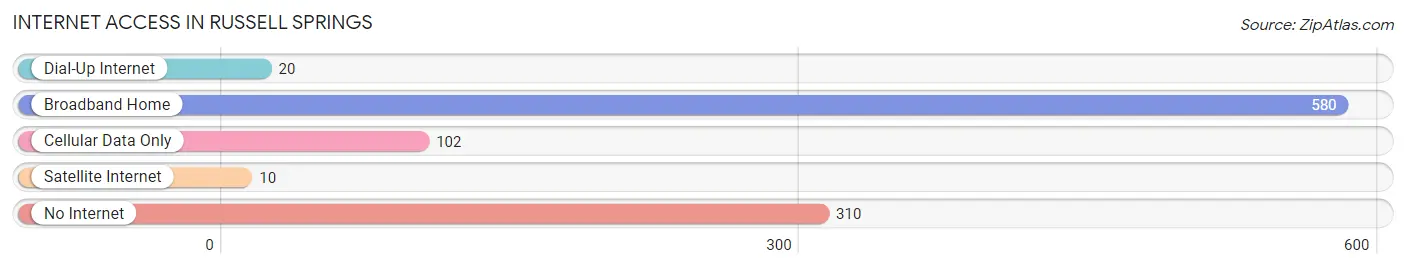
| Internet Type | # Households | % Households |
| Dial-Up Internet | 20 | 1.9% |
| Broadband Home | 580 | 56.6% |
| Cellular Data Only | 102 | 10.0% |
| Satellite Internet | 10 | 1.0% |
| No Internet | 310 | 30.3% |
| Total | 1,024 | 100.0% |
Russell Springs Summary
History
Russell Springs is a small city located in Russell County, Kentucky. It is situated on the banks of Lake Cumberland and is the county seat of Russell County. The city was founded in 1826 and was named after Colonel William Russell, a Revolutionary War veteran. The city was incorporated in 1872 and has a population of approximately 2,500 people.
The city of Russell Springs has a rich history that dates back to the early 1800s. The first settlers in the area were Native Americans, who were drawn to the area due to its abundance of natural resources. The first white settlers arrived in the area in the early 1800s and began to establish farms and businesses. The city was officially founded in 1826 and was named after Colonel William Russell, a Revolutionary War veteran.
The city of Russell Springs experienced a period of growth and prosperity in the late 1800s and early 1900s. The city was home to several businesses, including a flour mill, a sawmill, a gristmill, and a distillery. The city also had a railroad line that connected it to other cities in the region.
The city of Russell Springs experienced a period of decline in the mid-1900s due to the decline of the railroad industry. The city was also affected by the Great Depression and World War II. However, the city has experienced a resurgence in recent years due to the growth of tourism in the area.
Geography
Russell Springs is located in Russell County, Kentucky. It is situated on the banks of Lake Cumberland and is the county seat of Russell County. The city is located in the foothills of the Appalachian Mountains and is surrounded by rolling hills and forests. The city has a total area of 2.2 square miles and has an elevation of 845 feet.
The climate in Russell Springs is humid subtropical, with hot summers and mild winters. The average temperature in the summer is around 80 degrees Fahrenheit and the average temperature in the winter is around 40 degrees Fahrenheit. The city receives an average of 45 inches of precipitation per year.
Economy
The economy of Russell Springs is largely based on tourism and agriculture. The city is home to several tourist attractions, including the Lake Cumberland State Resort Park, the Russell County Museum, and the Russell County Historical Society. The city also has several wineries and distilleries that attract visitors from all over the region.
Agriculture is also an important part of the economy of Russell Springs. The city is home to several farms that produce a variety of crops, including corn, soybeans, wheat, and hay. The city also has several livestock farms that produce beef, pork, and poultry.
Demographics
As of the 2010 census, the population of Russell Springs was 2,521. The racial makeup of the city was 95.3% White, 0.7% African American, 0.3% Native American, 0.2% Asian, 0.1% Pacific Islander, and 3.4% from other races. The median household income in the city was $30,938 and the median family income was $37,813. The per capita income in the city was $17,845.
Conclusion
Russell Springs is a small city located in Russell County, Kentucky. It is situated on the banks of Lake Cumberland and is the county seat of Russell County. The city was founded in 1826 and was named after Colonel William Russell, a Revolutionary War veteran. The city has a rich history and has experienced a period of growth and decline throughout its history. The economy of Russell Springs is largely based on tourism and agriculture. The city has a population of approximately 2,500 people and has a diverse racial makeup.
Common Questions
What is Per Capita Income in Russell Springs?
Per Capita income in Russell Springs is $22,057.
What is the Median Family Income in Russell Springs?
Median Family Income in Russell Springs is $68,000.
What is the Median Household income in Russell Springs?
Median Household Income in Russell Springs is $34,219.
What is Income or Wage Gap in Russell Springs?
Income or Wage Gap in Russell Springs is 14.2%.
Women in Russell Springs earn 85.8 cents for every dollar earned by a man.
What is Inequality or Gini Index in Russell Springs?
Inequality or Gini Index in Russell Springs is 0.49.
What is the Total Population of Russell Springs?
Total Population of Russell Springs is 2,713.
What is the Total Male Population of Russell Springs?
Total Male Population of Russell Springs is 1,368.
What is the Total Female Population of Russell Springs?
Total Female Population of Russell Springs is 1,345.
What is the Ratio of Males per 100 Females in Russell Springs?
There are 101.71 Males per 100 Females in Russell Springs.
What is the Ratio of Females per 100 Males in Russell Springs?
There are 98.32 Females per 100 Males in Russell Springs.
What is the Median Population Age in Russell Springs?
Median Population Age in Russell Springs is 44.8 Years.
What is the Average Family Size in Russell Springs
Average Family Size in Russell Springs is 3.5 People.
What is the Average Household Size in Russell Springs
Average Household Size in Russell Springs is 2.6 People.
How Large is the Labor Force in Russell Springs?
There are 1,255 People in the Labor Forcein in Russell Springs.
What is the Percentage of People in the Labor Force in Russell Springs?
53.5% of People are in the Labor Force in Russell Springs.
What is the Unemployment Rate in Russell Springs?
Unemployment Rate in Russell Springs is 8.1%.