Zip Codes with the Highest Percentage of Population with a Degree in Engineering in Louisville, KY
RELATED REPORTS & OPTIONS
Engineering
Louisville
Compare Zip Codes
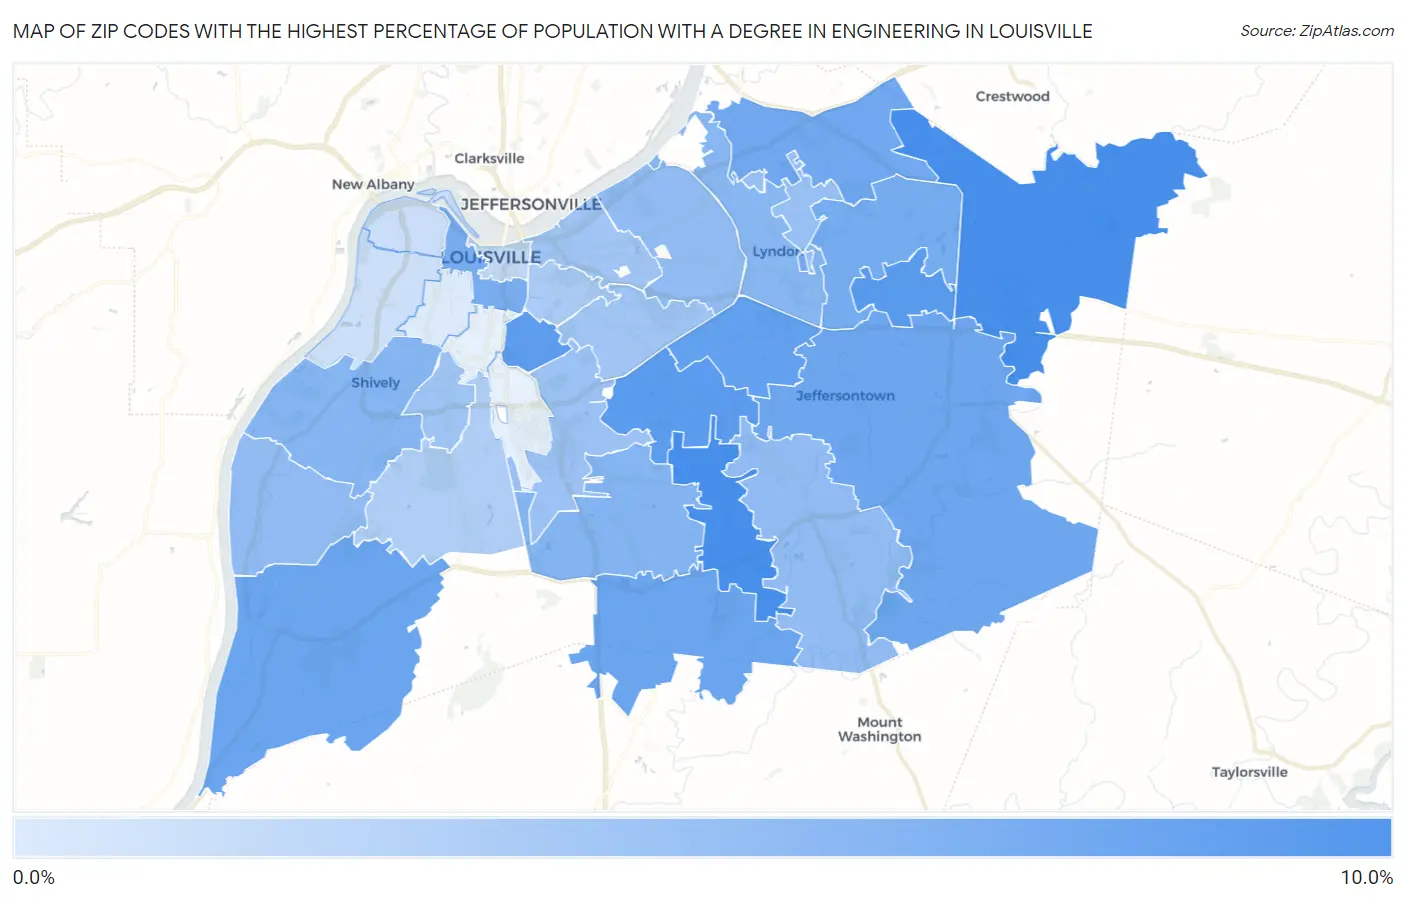
Map of Zip Codes with the Highest Percentage of Population with a Degree in Engineering in Louisville
0.74%
9.8%
Zip Codes with the Highest Percentage of Population with a Degree in Engineering in Louisville, KY
| Zip Code | % Graduates | vs State | vs National | |
| 1. | 40228 | 9.8% | 5.5%(+4.31)#56 | 7.6%(+2.19)#4,581 |
| 2. | 40245 | 9.8% | 5.5%(+4.29)#57 | 7.6%(+2.17)#4,612 |
| 3. | 40243 | 8.8% | 5.5%(+3.26)#79 | 7.6%(+1.14)#5,891 |
| 4. | 40218 | 8.5% | 5.5%(+3.01)#80 | 7.6%(+0.886)#6,230 |
| 5. | 40217 | 8.4% | 5.5%(+2.89)#83 | 7.6%(+0.765)#6,399 |
| 6. | 40220 | 8.1% | 5.5%(+2.60)#90 | 7.6%(+0.478)#6,885 |
| 7. | 40272 | 7.5% | 5.5%(+2.02)#96 | 7.6%(-0.103)#7,919 |
| 8. | 40229 | 7.5% | 5.5%(+1.93)#99 | 7.6%(-0.189)#8,086 |
| 9. | 40299 | 7.3% | 5.5%(+1.79)#101 | 7.6%(-0.328)#8,352 |
| 10. | 40241 | 7.2% | 5.5%(+1.70)#103 | 7.6%(-0.424)#8,537 |
| 11. | 40223 | 6.9% | 5.5%(+1.36)#111 | 7.6%(-0.758)#9,233 |
| 12. | 40203 | 6.7% | 5.5%(+1.20)#117 | 7.6%(-0.925)#9,571 |
| 13. | 40219 | 6.1% | 5.5%(+0.575)#129 | 7.6%(-1.55)#10,946 |
| 14. | 40216 | 5.9% | 5.5%(+0.415)#133 | 7.6%(-1.71)#11,339 |
| 15. | 40222 | 5.9% | 5.5%(+0.351)#134 | 7.6%(-1.77)#11,496 |
| 16. | 40207 | 5.3% | 5.5%(-0.243)#157 | 7.6%(-2.36)#12,985 |
| 17. | 40258 | 5.3% | 5.5%(-0.268)#158 | 7.6%(-2.39)#13,049 |
| 18. | 40291 | 5.2% | 5.5%(-0.290)#160 | 7.6%(-2.41)#13,101 |
| 19. | 40242 | 4.9% | 5.5%(-0.656)#176 | 7.6%(-2.78)#14,054 |
| 20. | 40213 | 4.6% | 5.5%(-0.919)#189 | 7.6%(-3.04)#14,780 |
| 21. | 40215 | 4.4% | 5.5%(-1.16)#198 | 7.6%(-3.28)#15,416 |
| 22. | 40205 | 4.3% | 5.5%(-1.18)#200 | 7.6%(-3.30)#15,477 |
| 23. | 40206 | 4.3% | 5.5%(-1.19)#202 | 7.6%(-3.31)#15,493 |
| 24. | 40204 | 3.8% | 5.5%(-1.77)#225 | 7.6%(-3.89)#16,979 |
| 25. | 40214 | 3.5% | 5.5%(-2.05)#237 | 7.6%(-4.17)#17,694 |
| 26. | 40202 | 2.4% | 5.5%(-3.16)#279 | 7.6%(-5.28)#20,257 |
| 27. | 40212 | 1.8% | 5.5%(-3.74)#295 | 7.6%(-5.87)#21,378 |
| 28. | 40211 | 1.7% | 5.5%(-3.83)#300 | 7.6%(-5.95)#21,517 |
| 29. | 40210 | 0.74% | 5.5%(-4.79)#335 | 7.6%(-6.91)#22,950 |
1
Common Questions
What are the Top 10 Zip Codes with the Highest Percentage of Population with a Degree in Engineering in Louisville, KY?
Top 10 Zip Codes with the Highest Percentage of Population with a Degree in Engineering in Louisville, KY are:
What zip code has the Highest Percentage of Population with a Degree in Engineering in Louisville, KY?
40228 has the Highest Percentage of Population with a Degree in Engineering in Louisville, KY with 9.8%.
What is the Percentage of Population with a Degree in Engineering in Louisville, KY?
Percentage of Population with a Degree in Engineering in Louisville is 6.2%.
What is the Percentage of Population with a Degree in Engineering in Kentucky?
Percentage of Population with a Degree in Engineering in Kentucky is 5.5%.
What is the Percentage of Population with a Degree in Engineering in the United States?
Percentage of Population with a Degree in Engineering in the United States is 7.6%.