Zip Codes with the Highest Percentage of Population Employed in Real Estate, Rental & Leasing in Louisville, KY
RELATED REPORTS & OPTIONS
Real Estate, Rental & Leasing
Louisville
Compare Zip Codes
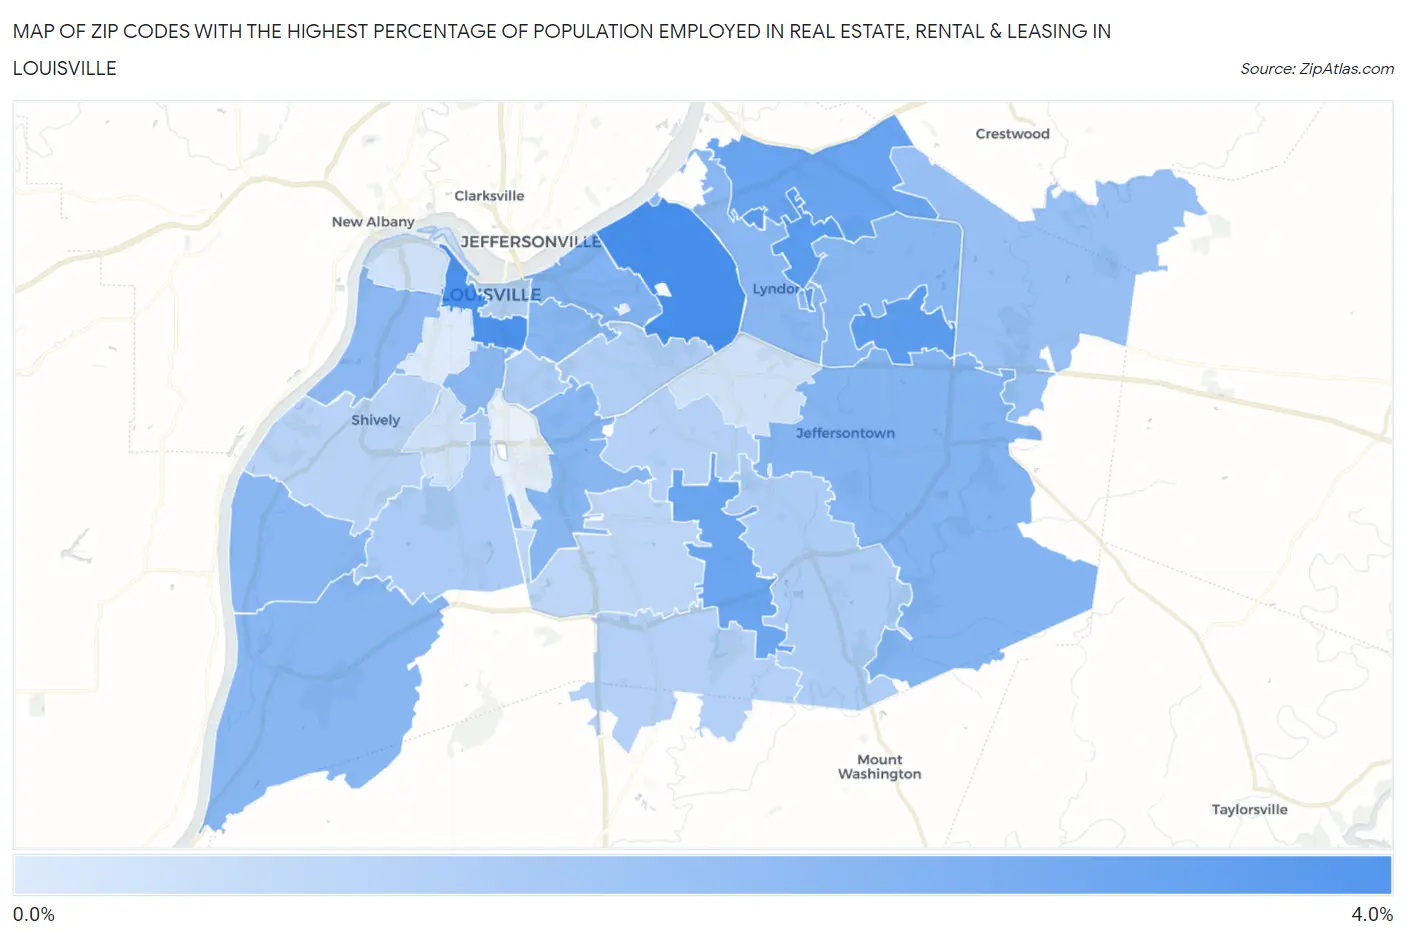
Map of Zip Codes with the Highest Percentage of Population Employed in Real Estate, Rental & Leasing in Louisville
0.48%
3.4%
Zip Codes with the Highest Percentage of Population Employed in Real Estate, Rental & Leasing in Louisville, KY
| Zip Code | % Employed | vs State | vs National | |
| 1. | 40207 | 3.4% | 1.4%(+1.99)#39 | 1.9%(+1.46)#3,127 |
| 2. | 40203 | 3.3% | 1.4%(+1.91)#42 | 1.9%(+1.38)#3,277 |
| 3. | 40242 | 3.0% | 1.4%(+1.67)#47 | 1.9%(+1.14)#3,798 |
| 4. | 40243 | 2.9% | 1.4%(+1.57)#48 | 1.9%(+1.04)#4,088 |
| 5. | 40241 | 2.7% | 1.4%(+1.31)#54 | 1.9%(+0.779)#4,850 |
| 6. | 40228 | 2.6% | 1.4%(+1.27)#58 | 1.9%(+0.734)#5,018 |
| 7. | 40206 | 2.2% | 1.4%(+0.861)#80 | 1.9%(+0.328)#6,718 |
| 8. | 40299 | 2.2% | 1.4%(+0.834)#83 | 1.9%(+0.302)#6,839 |
| 9. | 40223 | 2.1% | 1.4%(+0.746)#86 | 1.9%(+0.213)#7,299 |
| 10. | 40204 | 2.1% | 1.4%(+0.741)#87 | 1.9%(+0.209)#7,315 |
| 11. | 40272 | 2.1% | 1.4%(+0.732)#88 | 1.9%(+0.200)#7,362 |
| 12. | 40213 | 2.1% | 1.4%(+0.730)#89 | 1.9%(+0.198)#7,373 |
| 13. | 40222 | 2.1% | 1.4%(+0.715)#91 | 1.9%(+0.183)#7,447 |
| 14. | 40258 | 2.1% | 1.4%(+0.704)#92 | 1.9%(+0.172)#7,516 |
| 15. | 40208 | 2.1% | 1.4%(+0.703)#94 | 1.9%(+0.170)#7,524 |
| 16. | 40211 | 2.0% | 1.4%(+0.635)#99 | 1.9%(+0.102)#7,875 |
| 17. | 40245 | 1.8% | 1.4%(+0.432)#110 | 1.9%(-0.101)#9,194 |
| 18. | 40214 | 1.5% | 1.4%(+0.092)#140 | 1.9%(-0.440)#11,562 |
| 19. | 40291 | 1.4% | 1.4%(+0.054)#149 | 1.9%(-0.478)#11,868 |
| 20. | 40217 | 1.4% | 1.4%(+0.051)#150 | 1.9%(-0.481)#11,901 |
| 21. | 40205 | 1.4% | 1.4%(+0.010)#160 | 1.9%(-0.522)#12,208 |
| 22. | 40202 | 1.3% | 1.4%(-0.036)#164 | 1.9%(-0.568)#12,550 |
| 23. | 40218 | 1.3% | 1.4%(-0.089)#172 | 1.9%(-0.621)#12,952 |
| 24. | 40229 | 1.3% | 1.4%(-0.098)#173 | 1.9%(-0.630)#13,006 |
| 25. | 40216 | 1.2% | 1.4%(-0.171)#185 | 1.9%(-0.703)#13,577 |
| 26. | 40219 | 1.1% | 1.4%(-0.260)#195 | 1.9%(-0.793)#14,298 |
| 27. | 40212 | 0.75% | 1.4%(-0.609)#245 | 1.9%(-1.14)#17,085 |
| 28. | 40220 | 0.75% | 1.4%(-0.610)#246 | 1.9%(-1.14)#17,087 |
| 29. | 40215 | 0.73% | 1.4%(-0.634)#250 | 1.9%(-1.17)#17,280 |
| 30. | 40210 | 0.48% | 1.4%(-0.884)#279 | 1.9%(-1.42)#19,269 |
1
Common Questions
What are the Top 10 Zip Codes with the Highest Percentage of Population Employed in Real Estate, Rental & Leasing in Louisville, KY?
Top 10 Zip Codes with the Highest Percentage of Population Employed in Real Estate, Rental & Leasing in Louisville, KY are:
What zip code has the Highest Percentage of Population Employed in Real Estate, Rental & Leasing in Louisville, KY?
40207 has the Highest Percentage of Population Employed in Real Estate, Rental & Leasing in Louisville, KY with 3.4%.
What is the Percentage of Population Employed in Real Estate, Rental & Leasing in Louisville, KY?
Percentage of Population Employed in Real Estate, Rental & Leasing in Louisville is 1.7%.
What is the Percentage of Population Employed in Real Estate, Rental & Leasing in Kentucky?
Percentage of Population Employed in Real Estate, Rental & Leasing in Kentucky is 1.4%.
What is the Percentage of Population Employed in Real Estate, Rental & Leasing in the United States?
Percentage of Population Employed in Real Estate, Rental & Leasing in the United States is 1.9%.