Druid Hills, KY Map & Demographics
Druid Hills Map
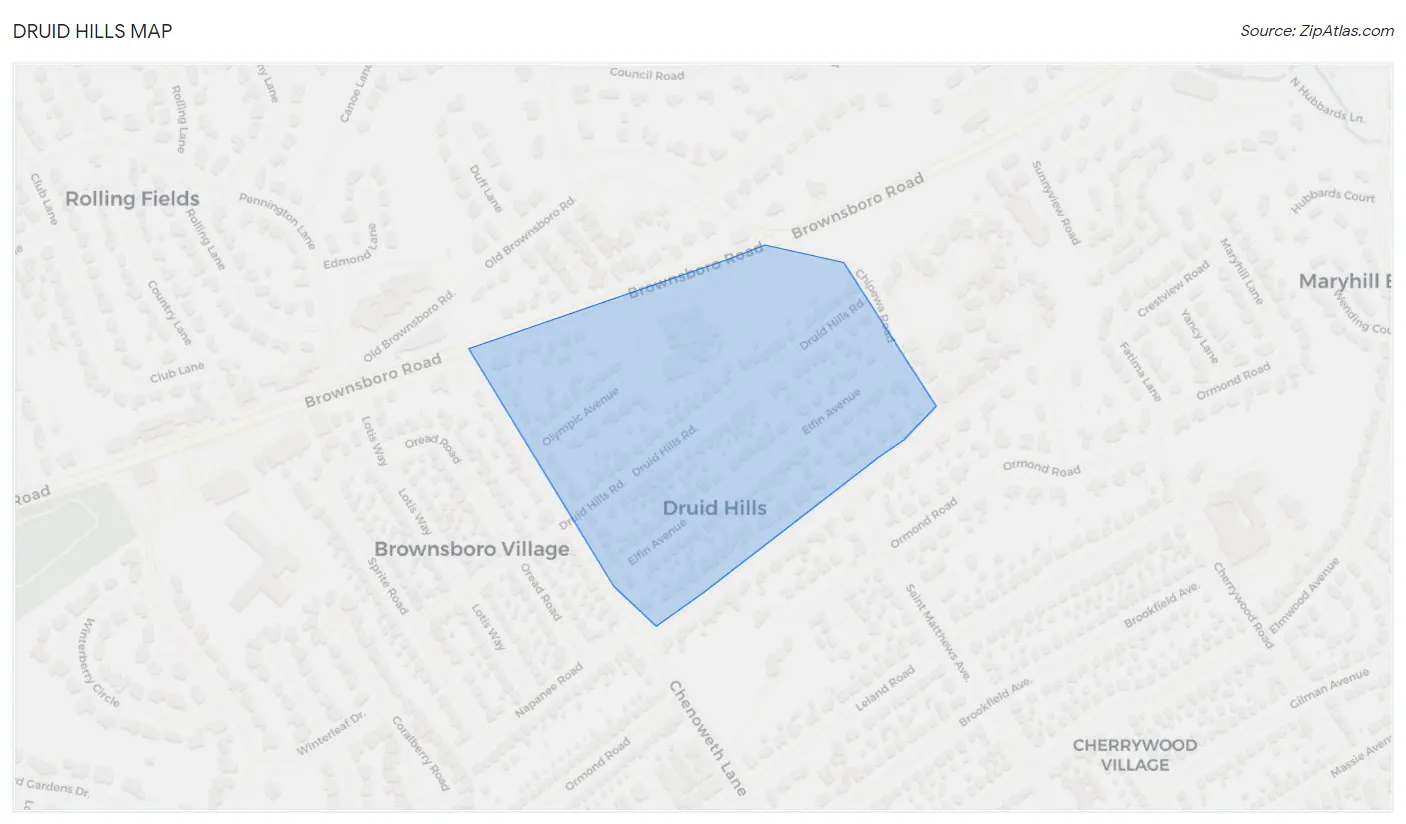
Druid Hills Overview
$75,340
PER CAPITA INCOME
$163,036
AVG FAMILY INCOME
$141,250
AVG HOUSEHOLD INCOME
39.7%
WAGE / INCOME GAP [ % ]
60.3¢/ $1
WAGE / INCOME GAP [ $ ]
0.40
INEQUALITY / GINI INDEX
317
TOTAL POPULATION
162
MALE POPULATION
155
FEMALE POPULATION
104.52
MALES / 100 FEMALES
95.68
FEMALES / 100 MALES
49.5
MEDIAN AGE
2.5
AVG FAMILY SIZE
2.1
AVG HOUSEHOLD SIZE
179
LABOR FORCE [ PEOPLE ]
67.5%
PERCENT IN LABOR FORCE
3.4%
UNEMPLOYMENT RATE
Druid Hills Area Codes
Income in Druid Hills
Income Overview in Druid Hills
Per Capita Income in Druid Hills is $75,340, while median incomes of families and households are $163,036 and $141,250 respectively.
| Characteristic | Number | Measure |
| Per Capita Income | 317 | $75,340 |
| Median Family Income | 105 | $163,036 |
| Mean Family Income | 105 | $172,050 |
| Median Household Income | 150 | $141,250 |
| Mean Household Income | 150 | $153,865 |
| Income Deficit | 105 | $0 |
| Wage / Income Gap (%) | 317 | 39.73% |
| Wage / Income Gap ($) | 317 | 60.27¢ per $1 |
| Gini / Inequality Index | 317 | 0.40 |
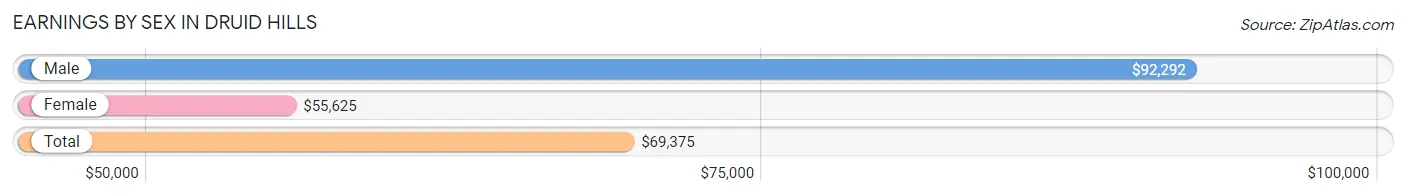
Earnings by Sex in Druid Hills
Average Earnings in Druid Hills are $69,375, $92,292 for men and $55,625 for women, a difference of 39.7%.
| Sex | Number | Average Earnings |
| Male | 99 (51.0%) | $92,292 |
| Female | 95 (49.0%) | $55,625 |
| Total | 194 (100.0%) | $69,375 |
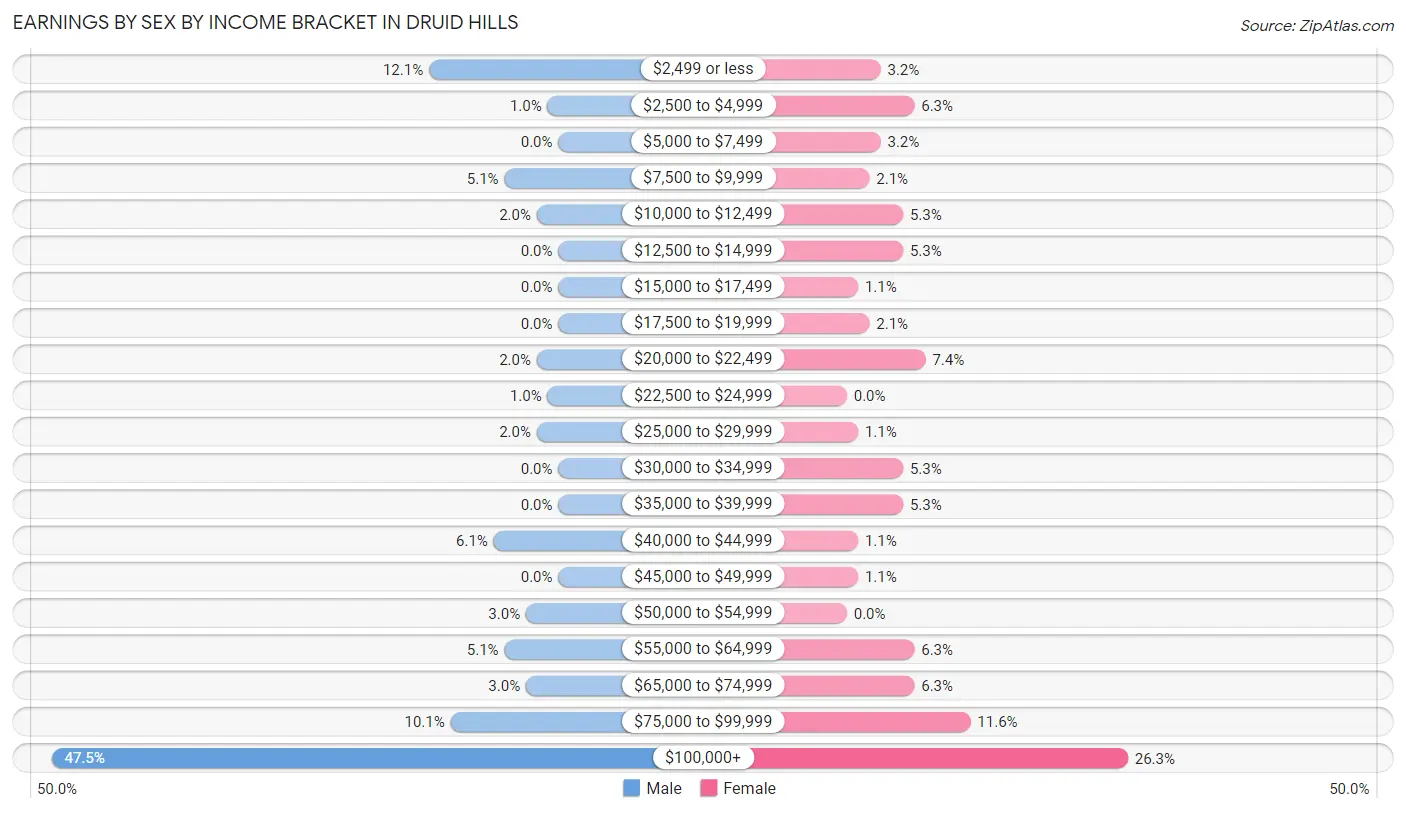
Earnings by Sex by Income Bracket in Druid Hills
The most common earnings brackets in Druid Hills are $100,000+ for men (47 | 47.5%) and $100,000+ for women (25 | 26.3%).
| Income | Male | Female |
| $2,499 or less | 12 (12.1%) | 3 (3.2%) |
| $2,500 to $4,999 | 1 (1.0%) | 6 (6.3%) |
| $5,000 to $7,499 | 0 (0.0%) | 3 (3.2%) |
| $7,500 to $9,999 | 5 (5.1%) | 2 (2.1%) |
| $10,000 to $12,499 | 2 (2.0%) | 5 (5.3%) |
| $12,500 to $14,999 | 0 (0.0%) | 5 (5.3%) |
| $15,000 to $17,499 | 0 (0.0%) | 1 (1.1%) |
| $17,500 to $19,999 | 0 (0.0%) | 2 (2.1%) |
| $20,000 to $22,499 | 2 (2.0%) | 7 (7.4%) |
| $22,500 to $24,999 | 1 (1.0%) | 0 (0.0%) |
| $25,000 to $29,999 | 2 (2.0%) | 1 (1.1%) |
| $30,000 to $34,999 | 0 (0.0%) | 5 (5.3%) |
| $35,000 to $39,999 | 0 (0.0%) | 5 (5.3%) |
| $40,000 to $44,999 | 6 (6.1%) | 1 (1.1%) |
| $45,000 to $49,999 | 0 (0.0%) | 1 (1.1%) |
| $50,000 to $54,999 | 3 (3.0%) | 0 (0.0%) |
| $55,000 to $64,999 | 5 (5.1%) | 6 (6.3%) |
| $65,000 to $74,999 | 3 (3.0%) | 6 (6.3%) |
| $75,000 to $99,999 | 10 (10.1%) | 11 (11.6%) |
| $100,000+ | 47 (47.5%) | 25 (26.3%) |
| Total | 99 (100.0%) | 95 (100.0%) |
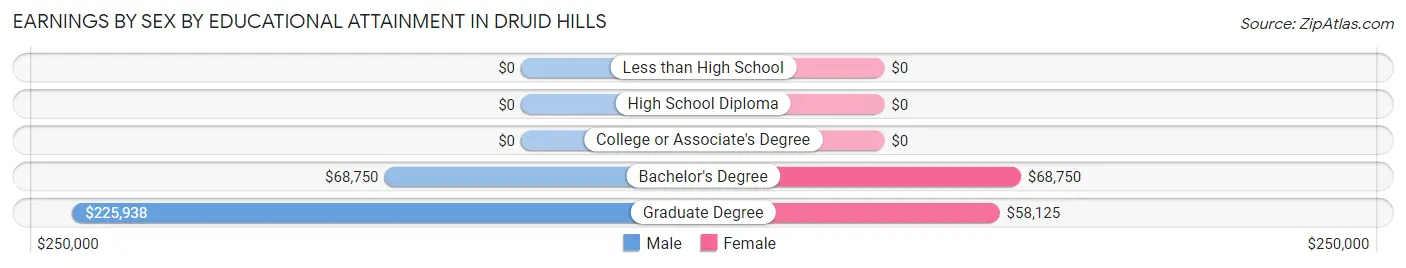
Earnings by Sex by Educational Attainment in Druid Hills
Average earnings in Druid Hills are $111,250 for men and $55,625 for women, a difference of 50.0%. Men with an educational attainment of graduate degree enjoy the highest average annual earnings of $225,938, while those with bachelor's degree education earn the least with $68,750. Women with an educational attainment of bachelor's degree earn the most with the average annual earnings of $68,750, while those with graduate degree education have the smallest earnings of $58,125.
| Educational Attainment | Male Income | Female Income |
| Less than High School | - | - |
| High School Diploma | - | - |
| College or Associate's Degree | - | - |
| Bachelor's Degree | $68,750 | $68,750 |
| Graduate Degree | $225,938 | $58,125 |
| Total | $111,250 | $55,625 |
Family Income in Druid Hills
Family Income Brackets in Druid Hills
According to the Druid Hills family income data, there are 35 families falling into the $200,000+ income range, which is the most common income bracket and makes up 33.3% of all families.
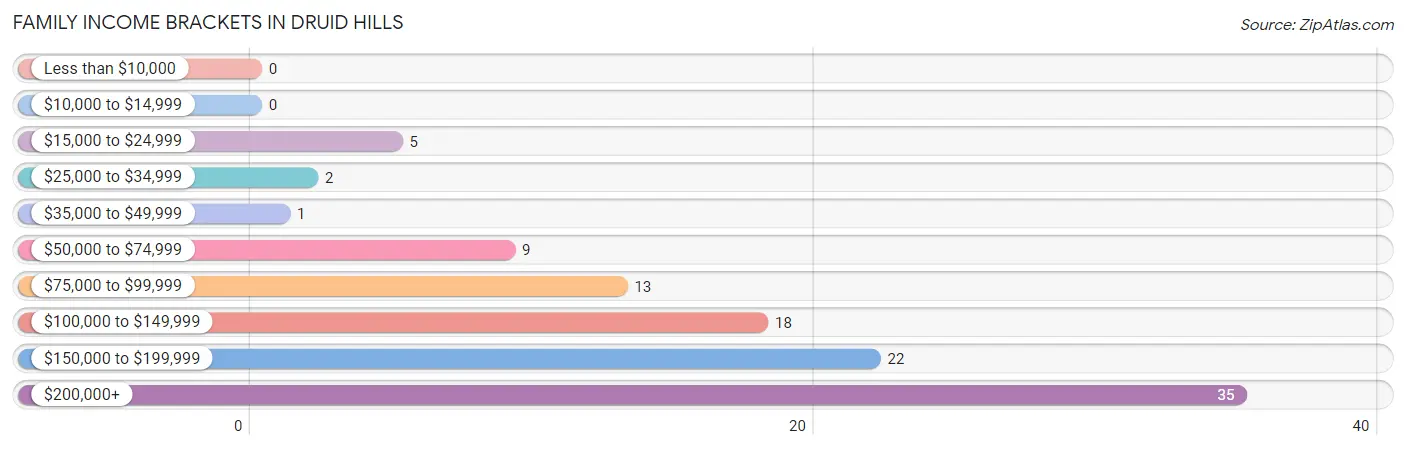
| Income Bracket | # Families | % Families |
| Less than $10,000 | 0 | 0.0% |
| $10,000 to $14,999 | 0 | 0.0% |
| $15,000 to $24,999 | 5 | 4.8% |
| $25,000 to $34,999 | 2 | 1.9% |
| $35,000 to $49,999 | 1 | 1.0% |
| $50,000 to $74,999 | 9 | 8.6% |
| $75,000 to $99,999 | 13 | 12.4% |
| $100,000 to $149,999 | 18 | 17.1% |
| $150,000 to $199,999 | 22 | 21.0% |
| $200,000+ | 35 | 33.3% |
Family Income by Famaliy Size in Druid Hills
3-person families (22 | 20.9%) account for the highest median family income in Druid Hills with $166,250 per family, while 2-person families (70 | 66.7%) have the highest median income of $81,607 per family member.
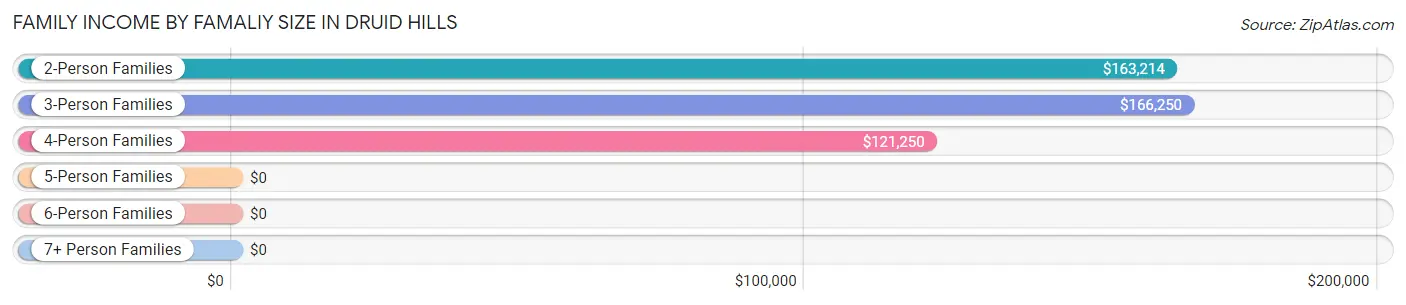
| Income Bracket | # Families | Median Income |
| 2-Person Families | 70 (66.7%) | $163,214 |
| 3-Person Families | 22 (20.9%) | $166,250 |
| 4-Person Families | 11 (10.5%) | $121,250 |
| 5-Person Families | 2 (1.9%) | $0 |
| 6-Person Families | 0 (0.0%) | $0 |
| 7+ Person Families | 0 (0.0%) | $0 |
| Total | 105 (100.0%) | $163,036 |
Family Income by Number of Earners in Druid Hills
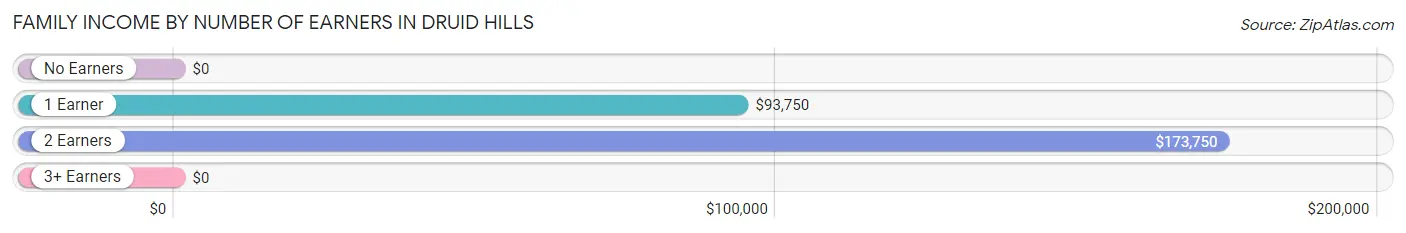
| Number of Earners | # Families | Median Income |
| No Earners | 19 (18.1%) | $0 |
| 1 Earner | 22 (20.9%) | $93,750 |
| 2 Earners | 63 (60.0%) | $173,750 |
| 3+ Earners | 1 (0.9%) | $0 |
| Total | 105 (100.0%) | $163,036 |
Household Income in Druid Hills
Household Income Brackets in Druid Hills
With 43 households falling in the category, the $200,000+ income range is the most frequent in Druid Hills, accounting for 28.7% of all households. In contrast, only 3 households (2.0%) fall into the less than $10,000 income bracket, making it the least populous group.
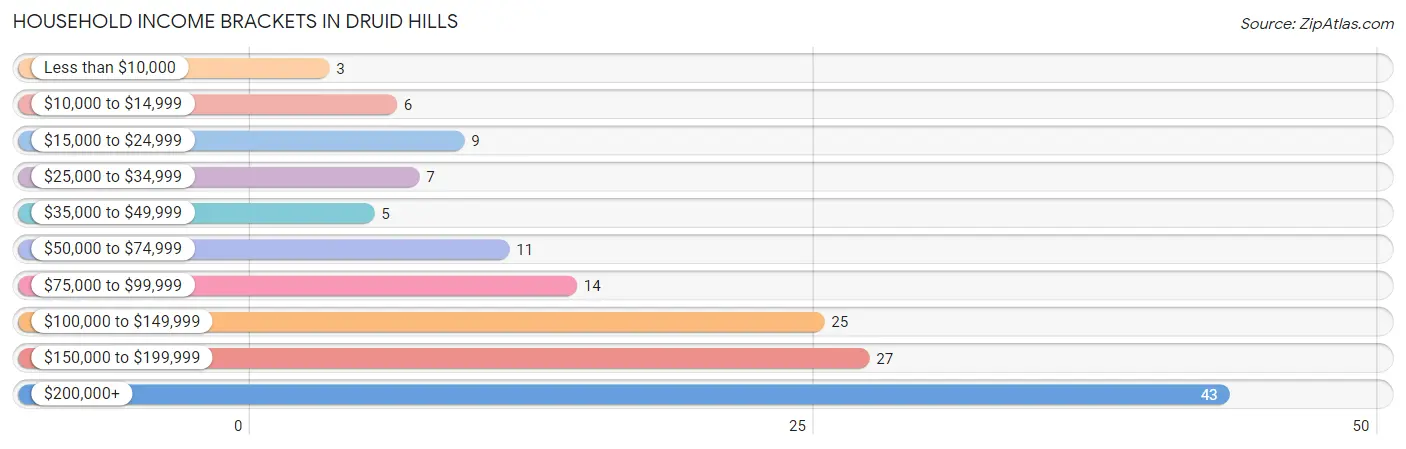
| Income Bracket | # Households | % Households |
| Less than $10,000 | 3 | 2.0% |
| $10,000 to $14,999 | 6 | 4.0% |
| $15,000 to $24,999 | 9 | 6.0% |
| $25,000 to $34,999 | 7 | 4.7% |
| $35,000 to $49,999 | 5 | 3.3% |
| $50,000 to $74,999 | 11 | 7.3% |
| $75,000 to $99,999 | 14 | 9.3% |
| $100,000 to $149,999 | 25 | 16.7% |
| $150,000 to $199,999 | 27 | 18.0% |
| $200,000+ | 43 | 28.7% |
Household Income by Householder Age in Druid Hills
The median household income in Druid Hills is $141,250, with the highest median household income of $163,214 found in the 25 to 44 years age bracket for the primary householder. A total of 42 households (28.0%) fall into this category.
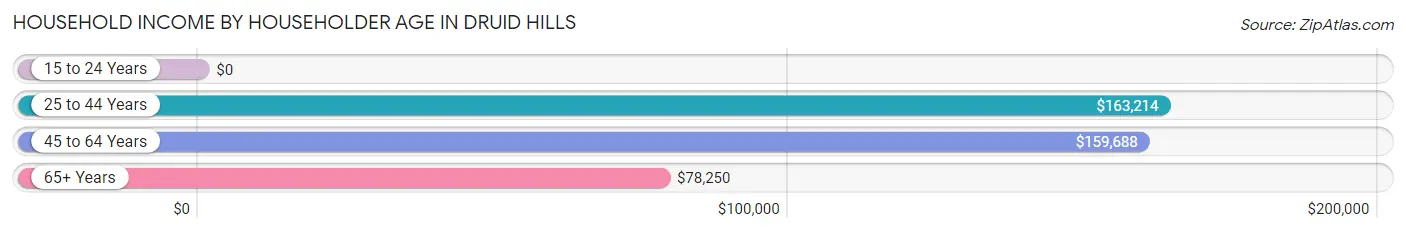
| Income Bracket | # Households | Median Income |
| 15 to 24 Years | 0 (0.0%) | $0 |
| 25 to 44 Years | 42 (28.0%) | $163,214 |
| 45 to 64 Years | 59 (39.3%) | $159,688 |
| 65+ Years | 49 (32.7%) | $78,250 |
| Total | 150 (100.0%) | $141,250 |
Poverty in Druid Hills
Income Below Poverty by Sex and Age in Druid Hills
With 5.6% poverty level for males and 5.2% for females among the residents of Druid Hills, 55 to 64 year old males and 55 to 64 year old females are the most vulnerable to poverty, with 8 males (34.8%) and 6 females (18.2%) in their respective age groups living below the poverty level.
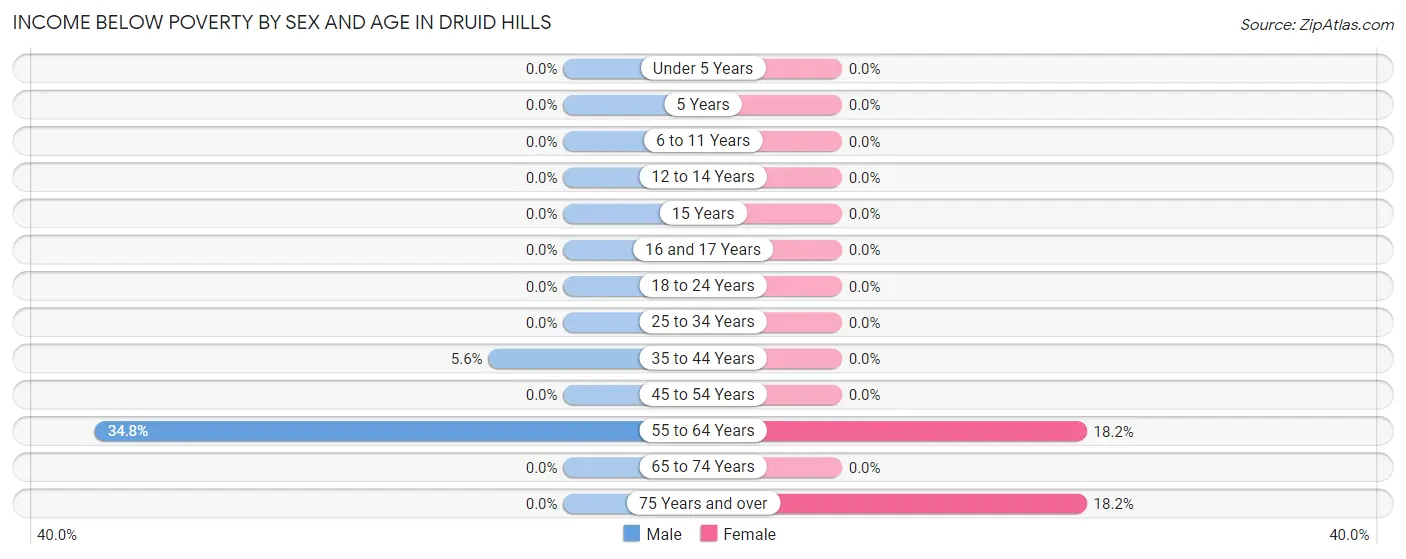
| Age Bracket | Male | Female |
| Under 5 Years | 0 (0.0%) | 0 (0.0%) |
| 5 Years | 0 (0.0%) | 0 (0.0%) |
| 6 to 11 Years | 0 (0.0%) | 0 (0.0%) |
| 12 to 14 Years | 0 (0.0%) | 0 (0.0%) |
| 15 Years | 0 (0.0%) | 0 (0.0%) |
| 16 and 17 Years | 0 (0.0%) | 0 (0.0%) |
| 18 to 24 Years | 0 (0.0%) | 0 (0.0%) |
| 25 to 34 Years | 0 (0.0%) | 0 (0.0%) |
| 35 to 44 Years | 1 (5.6%) | 0 (0.0%) |
| 45 to 54 Years | 0 (0.0%) | 0 (0.0%) |
| 55 to 64 Years | 8 (34.8%) | 6 (18.2%) |
| 65 to 74 Years | 0 (0.0%) | 0 (0.0%) |
| 75 Years and over | 0 (0.0%) | 2 (18.2%) |
| Total | 9 (5.6%) | 8 (5.2%) |
Income Above Poverty by Sex and Age in Druid Hills
According to the poverty statistics in Druid Hills, males aged under 5 years and females aged under 5 years are the age groups that are most secure financially, with 100.0% of males and 100.0% of females in these age groups living above the poverty line.
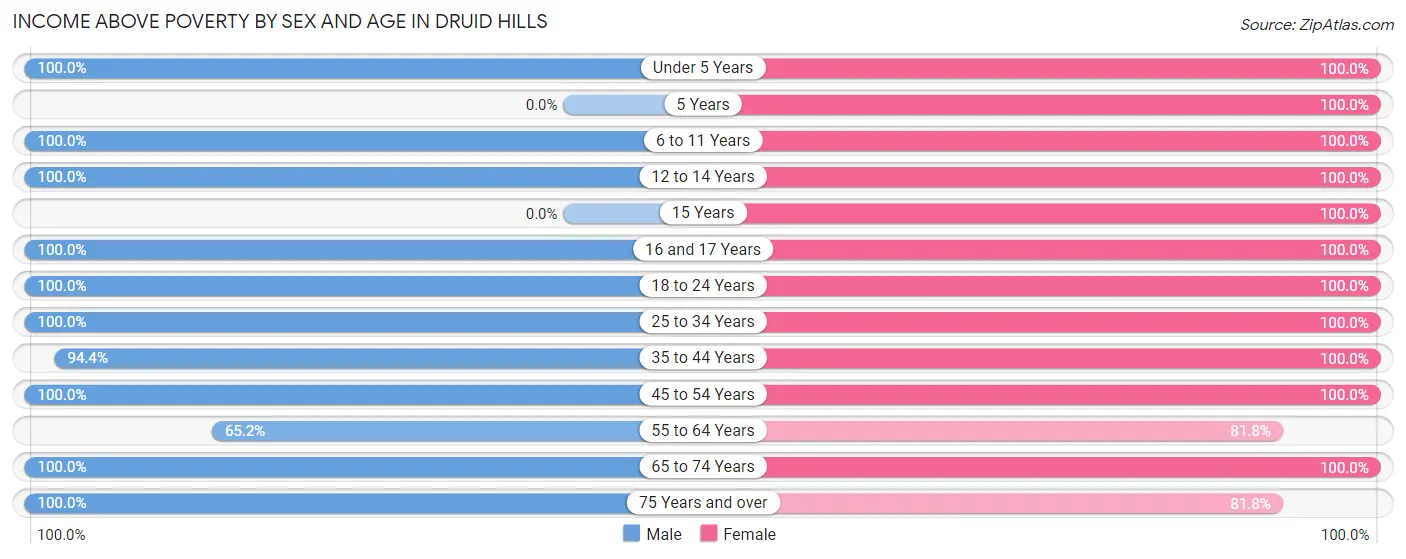
| Age Bracket | Male | Female |
| Under 5 Years | 9 (100.0%) | 6 (100.0%) |
| 5 Years | 0 (0.0%) | 2 (100.0%) |
| 6 to 11 Years | 9 (100.0%) | 4 (100.0%) |
| 12 to 14 Years | 14 (100.0%) | 4 (100.0%) |
| 15 Years | 0 (0.0%) | 4 (100.0%) |
| 16 and 17 Years | 7 (100.0%) | 3 (100.0%) |
| 18 to 24 Years | 1 (100.0%) | 2 (100.0%) |
| 25 to 34 Years | 16 (100.0%) | 18 (100.0%) |
| 35 to 44 Years | 17 (94.4%) | 20 (100.0%) |
| 45 to 54 Years | 26 (100.0%) | 18 (100.0%) |
| 55 to 64 Years | 15 (65.2%) | 27 (81.8%) |
| 65 to 74 Years | 35 (100.0%) | 30 (100.0%) |
| 75 Years and over | 4 (100.0%) | 9 (81.8%) |
| Total | 153 (94.4%) | 147 (94.8%) |
Income Below Poverty Among Married-Couple Families in Druid Hills
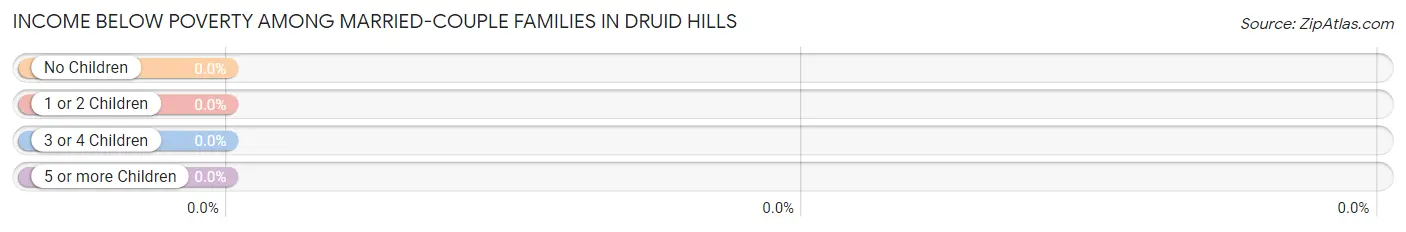
| Children | Above Poverty | Below Poverty |
| No Children | 59 (100.0%) | 0 (0.0%) |
| 1 or 2 Children | 26 (100.0%) | 0 (0.0%) |
| 3 or 4 Children | 2 (100.0%) | 0 (0.0%) |
| 5 or more Children | 0 (0.0%) | 0 (0.0%) |
| Total | 87 (100.0%) | 0 (0.0%) |
Income Below Poverty Among Single-Parent Households in Druid Hills
| Children | Single Father | Single Mother |
| No Children | 0 (0.0%) | 0 (0.0%) |
| 1 or 2 Children | 0 (0.0%) | 0 (0.0%) |
| 3 or 4 Children | 0 (0.0%) | 0 (0.0%) |
| 5 or more Children | 0 (0.0%) | 0 (0.0%) |
| Total | 0 (0.0%) | 0 (0.0%) |
Income Below Poverty Among Married-Couple vs Single-Parent Households in Druid Hills
| Children | Married-Couple Families | Single-Parent Households |
| No Children | 0 (0.0%) | 0 (0.0%) |
| 1 or 2 Children | 0 (0.0%) | 0 (0.0%) |
| 3 or 4 Children | 0 (0.0%) | 0 (0.0%) |
| 5 or more Children | 0 (0.0%) | 0 (0.0%) |
| Total | 0 (0.0%) | 0 (0.0%) |
Race in Druid Hills
The most populous races in Druid Hills are White / Caucasian (307 | 96.9%), Two or more Races (8 | 2.5%), and Asian (1 | 0.3%).
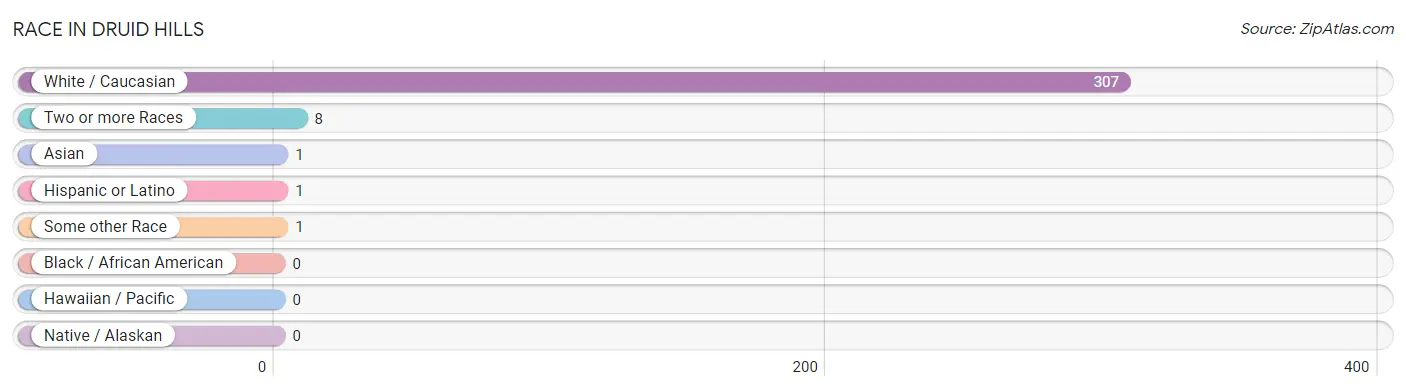
| Race | # Population | % Population |
| Asian | 1 | 0.3% |
| Black / African American | 0 | 0.0% |
| Hawaiian / Pacific | 0 | 0.0% |
| Hispanic or Latino | 1 | 0.3% |
| Native / Alaskan | 0 | 0.0% |
| White / Caucasian | 307 | 96.9% |
| Two or more Races | 8 | 2.5% |
| Some other Race | 1 | 0.3% |
| Total | 317 | 100.0% |
Ancestry in Druid Hills
The most populous ancestries reported in Druid Hills are English (94 | 29.6%), German (80 | 25.2%), Irish (66 | 20.8%), American (26 | 8.2%), and Scottish (20 | 6.3%), together accounting for 90.2% of all Druid Hills residents.
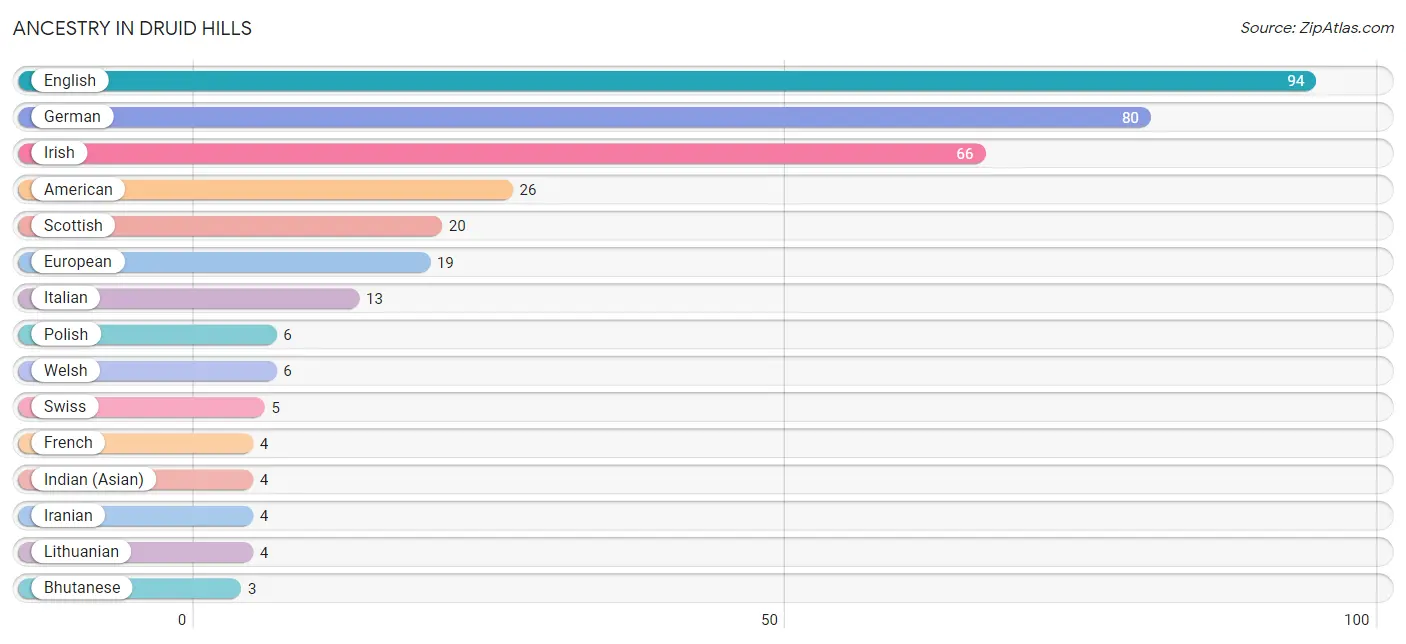
| Ancestry | # Population | % Population |
| American | 26 | 8.2% |
| Austrian | 1 | 0.3% |
| Bhutanese | 3 | 0.9% |
| British | 2 | 0.6% |
| Canadian | 2 | 0.6% |
| Croatian | 1 | 0.3% |
| Dutch | 3 | 0.9% |
| Eastern European | 1 | 0.3% |
| English | 94 | 29.6% |
| European | 19 | 6.0% |
| French | 4 | 1.3% |
| German | 80 | 25.2% |
| Indian (Asian) | 4 | 1.3% |
| Iranian | 4 | 1.3% |
| Irish | 66 | 20.8% |
| Italian | 13 | 4.1% |
| Lithuanian | 4 | 1.3% |
| Norwegian | 2 | 0.6% |
| Polish | 6 | 1.9% |
| Puerto Rican | 1 | 0.3% |
| Scotch-Irish | 2 | 0.6% |
| Scottish | 20 | 6.3% |
| Sri Lankan | 1 | 0.3% |
| Swedish | 2 | 0.6% |
| Swiss | 5 | 1.6% |
| Welsh | 6 | 1.9% | View All 26 Rows |
Immigrants in Druid Hills
The most numerous immigrant groups reported in Druid Hills came from Europe (2 | 0.6%), Northern Europe (2 | 0.6%), Sweden (2 | 0.6%), Asia (1 | 0.3%), and South Eastern Asia (1 | 0.3%), together accounting for 2.5% of all Druid Hills residents.
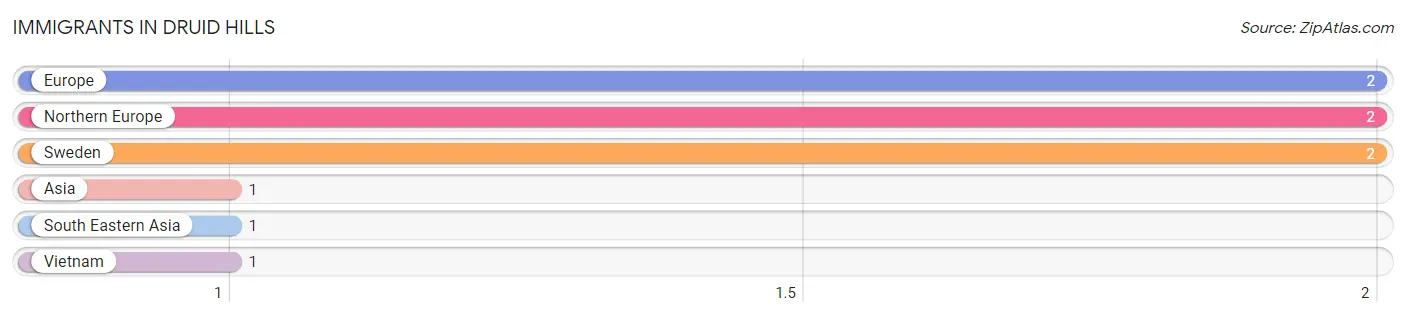
| Immigration Origin | # Population | % Population |
| Asia | 1 | 0.3% |
| Europe | 2 | 0.6% |
| Northern Europe | 2 | 0.6% |
| South Eastern Asia | 1 | 0.3% |
| Sweden | 2 | 0.6% |
| Vietnam | 1 | 0.3% | View All 6 Rows |
Sex and Age in Druid Hills
Sex and Age in Druid Hills
The most populous age groups in Druid Hills are 60 to 64 Years (20 | 12.3%) for men and 60 to 64 Years (19 | 12.3%) for women.
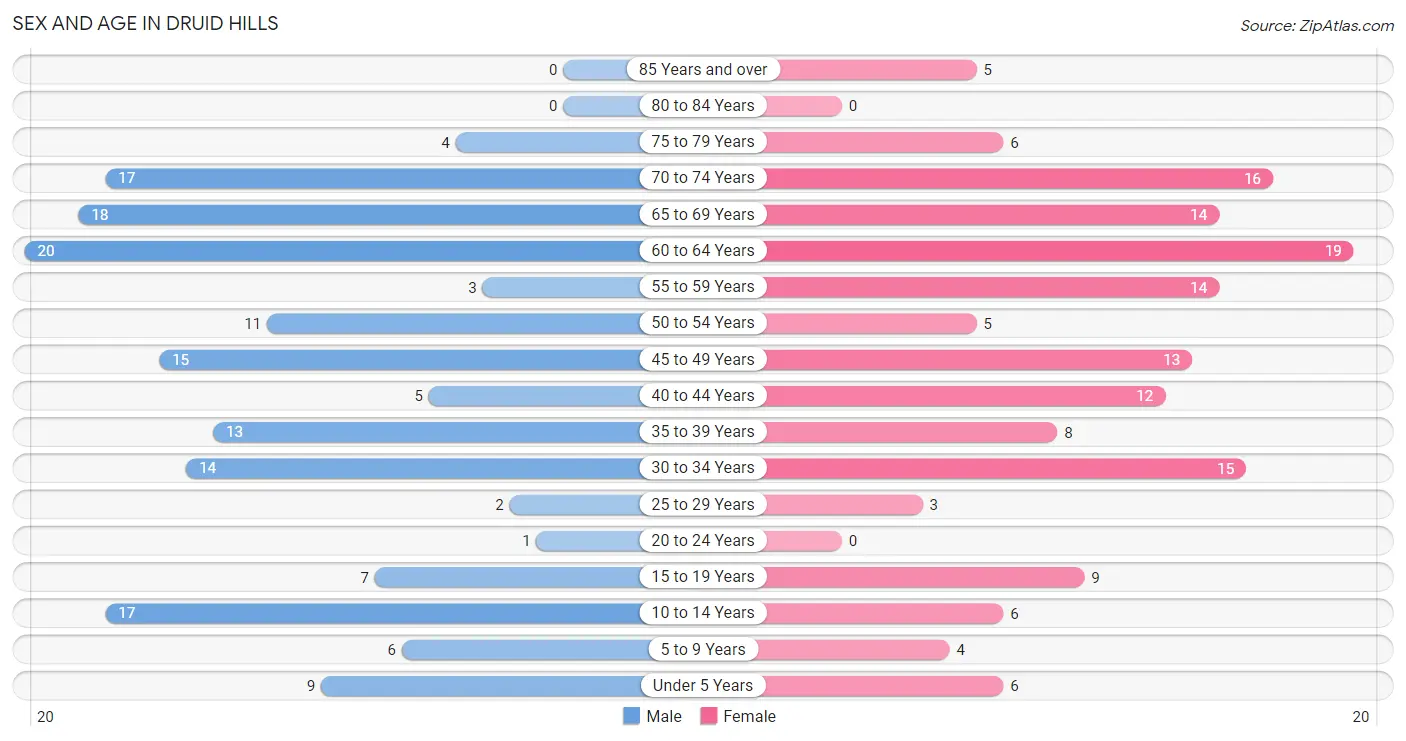
| Age Bracket | Male | Female |
| Under 5 Years | 9 (5.6%) | 6 (3.9%) |
| 5 to 9 Years | 6 (3.7%) | 4 (2.6%) |
| 10 to 14 Years | 17 (10.5%) | 6 (3.9%) |
| 15 to 19 Years | 7 (4.3%) | 9 (5.8%) |
| 20 to 24 Years | 1 (0.6%) | 0 (0.0%) |
| 25 to 29 Years | 2 (1.2%) | 3 (1.9%) |
| 30 to 34 Years | 14 (8.6%) | 15 (9.7%) |
| 35 to 39 Years | 13 (8.0%) | 8 (5.2%) |
| 40 to 44 Years | 5 (3.1%) | 12 (7.7%) |
| 45 to 49 Years | 15 (9.3%) | 13 (8.4%) |
| 50 to 54 Years | 11 (6.8%) | 5 (3.2%) |
| 55 to 59 Years | 3 (1.8%) | 14 (9.0%) |
| 60 to 64 Years | 20 (12.3%) | 19 (12.3%) |
| 65 to 69 Years | 18 (11.1%) | 14 (9.0%) |
| 70 to 74 Years | 17 (10.5%) | 16 (10.3%) |
| 75 to 79 Years | 4 (2.5%) | 6 (3.9%) |
| 80 to 84 Years | 0 (0.0%) | 0 (0.0%) |
| 85 Years and over | 0 (0.0%) | 5 (3.2%) |
| Total | 162 (100.0%) | 155 (100.0%) |
Families and Households in Druid Hills
Median Family Size in Druid Hills
The median family size in Druid Hills is 2.49 persons per family, with single female/mother families (12 | 11.4%) accounting for the largest median family size of 2.92 persons per family. On the other hand, single male/father families (6 | 5.7%) represent the smallest median family size with 1.83 persons per family.
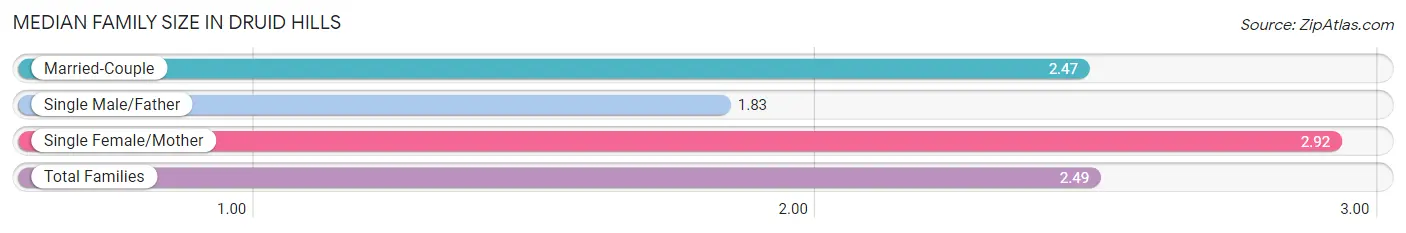
| Family Type | # Families | Family Size |
| Married-Couple | 87 (82.9%) | 2.47 |
| Single Male/Father | 6 (5.7%) | 1.83 |
| Single Female/Mother | 12 (11.4%) | 2.92 |
| Total Families | 105 (100.0%) | 2.49 |
Median Household Size in Druid Hills
The median household size in Druid Hills is 2.11 persons per household, with single female/mother households (12 | 8.0%) accounting for the largest median household size of 2.92 persons per household. non-family households (45 | 30.0%) represent the smallest median household size with 1.24 persons per household.
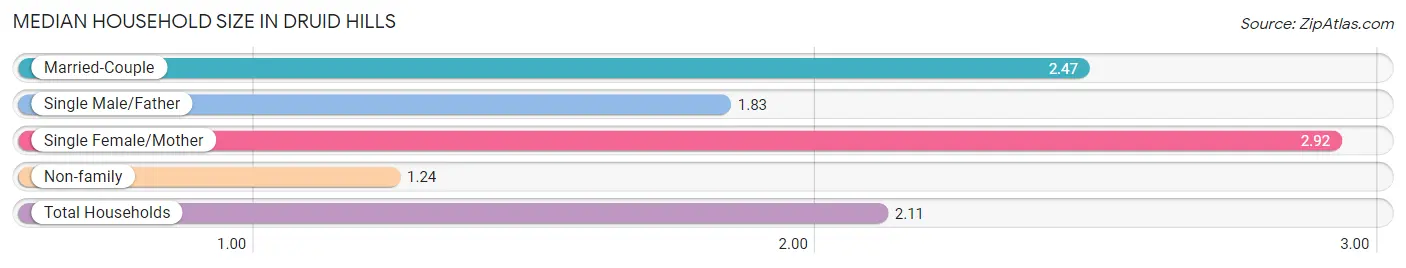
| Household Type | # Households | Household Size |
| Married-Couple | 87 (58.0%) | 2.47 |
| Single Male/Father | 6 (4.0%) | 1.83 |
| Single Female/Mother | 12 (8.0%) | 2.92 |
| Non-family | 45 (30.0%) | 1.24 |
| Total Households | 150 (100.0%) | 2.11 |
Household Size by Marriage Status in Druid Hills
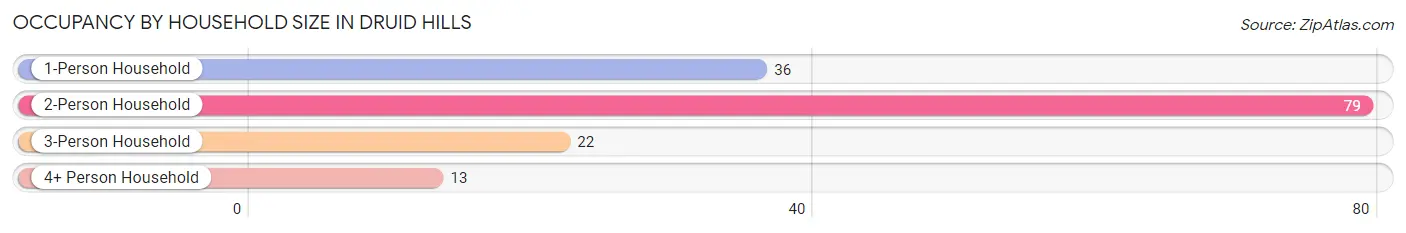
Out of a total of 150 households in Druid Hills, 105 (70.0%) are family households, while 45 (30.0%) are nonfamily households. The most numerous type of family households are 2-person households, comprising 70, and the most common type of nonfamily households are 1-person households, comprising 36.
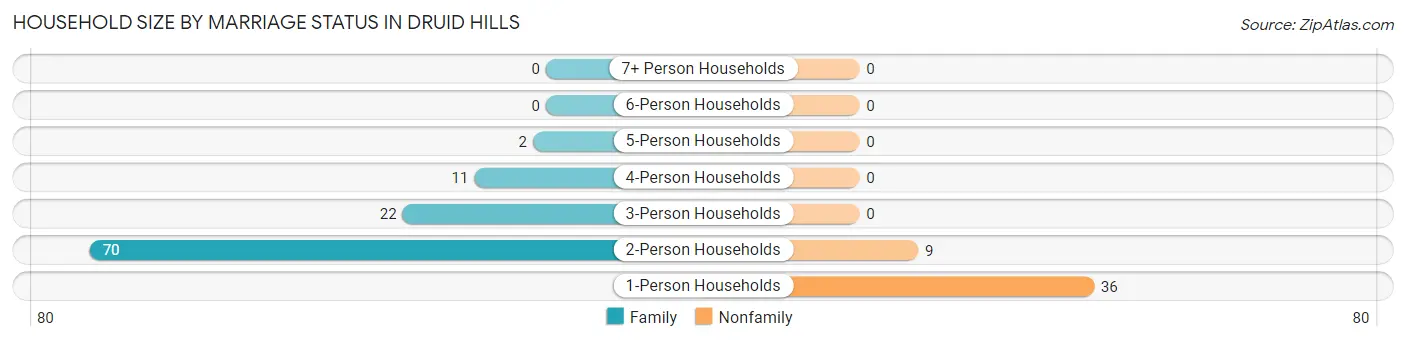
| Household Size | Family Households | Nonfamily Households |
| 1-Person Households | - | 36 (24.0%) |
| 2-Person Households | 70 (46.7%) | 9 (6.0%) |
| 3-Person Households | 22 (14.7%) | 0 (0.0%) |
| 4-Person Households | 11 (7.3%) | 0 (0.0%) |
| 5-Person Households | 2 (1.3%) | 0 (0.0%) |
| 6-Person Households | 0 (0.0%) | 0 (0.0%) |
| 7+ Person Households | 0 (0.0%) | 0 (0.0%) |
| Total | 105 (70.0%) | 45 (30.0%) |
Female Fertility in Druid Hills
Fertility by Age in Druid Hills
Average fertility rate in Druid Hills is 67.0 births per 1,000 women. Women in the age bracket of 35 to 50 years have the highest fertility rate with 91.0 births per 1,000 women. Women in the age bracket of 35 to 50 years acount for 75.0% of all women with births.
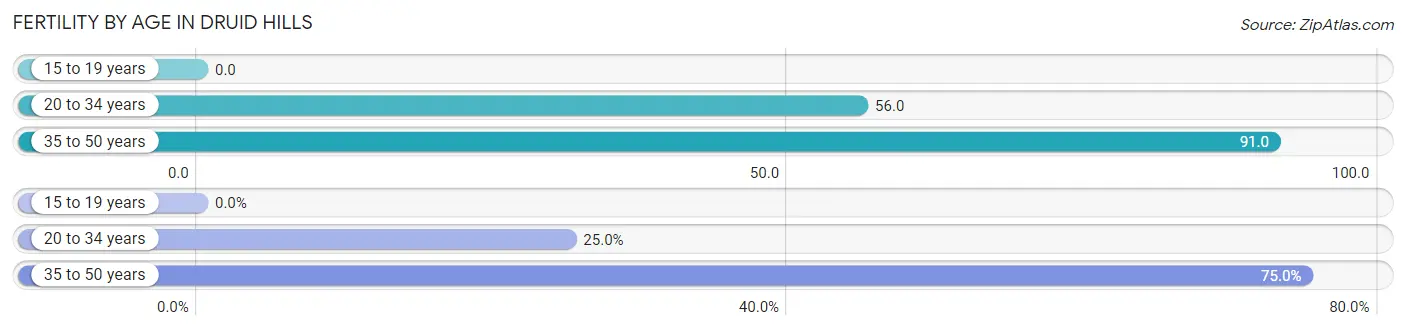
| Age Bracket | Women with Births | Births / 1,000 Women |
| 15 to 19 years | 0 (0.0%) | 0.0 |
| 20 to 34 years | 1 (25.0%) | 56.0 |
| 35 to 50 years | 3 (75.0%) | 91.0 |
| Total | 4 (100.0%) | 67.0 |
Fertility by Age by Marriage Status in Druid Hills
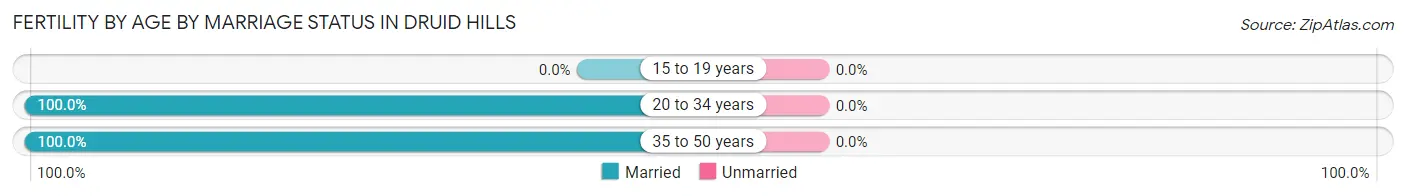
| Age Bracket | Married | Unmarried |
| 15 to 19 years | 0 (0.0%) | 0 (0.0%) |
| 20 to 34 years | 1 (100.0%) | 0 (0.0%) |
| 35 to 50 years | 3 (100.0%) | 0 (0.0%) |
| Total | 4 (100.0%) | 0 (0.0%) |
Fertility by Education in Druid Hills
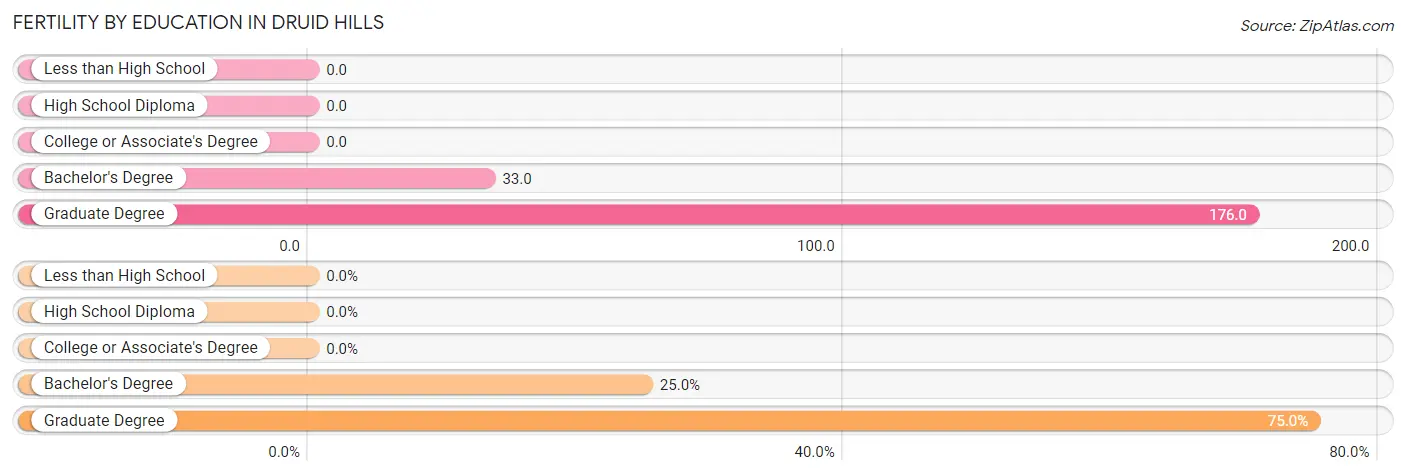
| Educational Attainment | Women with Births | Births / 1,000 Women |
| Less than High School | 0 (0.0%) | 0.0 |
| High School Diploma | 0 (0.0%) | 0.0 |
| College or Associate's Degree | 0 (0.0%) | 0.0 |
| Bachelor's Degree | 1 (25.0%) | 33.0 |
| Graduate Degree | 3 (75.0%) | 176.0 |
| Total | 4 (100.0%) | 67.0 |
Fertility by Education by Marriage Status in Druid Hills
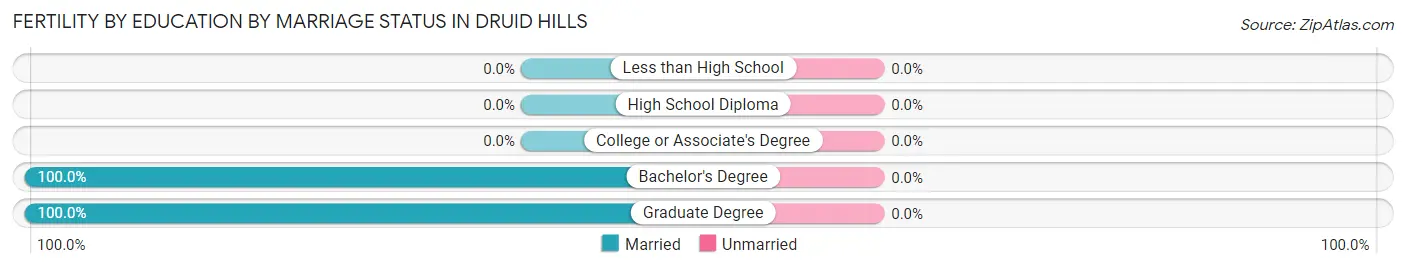
| Educational Attainment | Married | Unmarried |
| Less than High School | 0 (0.0%) | 0 (0.0%) |
| High School Diploma | 0 (0.0%) | 0 (0.0%) |
| College or Associate's Degree | 0 (0.0%) | 0 (0.0%) |
| Bachelor's Degree | 1 (100.0%) | 0 (0.0%) |
| Graduate Degree | 3 (100.0%) | 0 (0.0%) |
| Total | 4 (100.0%) | 0 (0.0%) |
Employment Characteristics in Druid Hills
Employment by Class of Employer in Druid Hills
Among the 165 employed individuals in Druid Hills, private company employees (100 | 60.6%), self-employed (incorporated) (26 | 15.8%), and self-employed (not incorporated) (16 | 9.7%) make up the most common classes of employment.
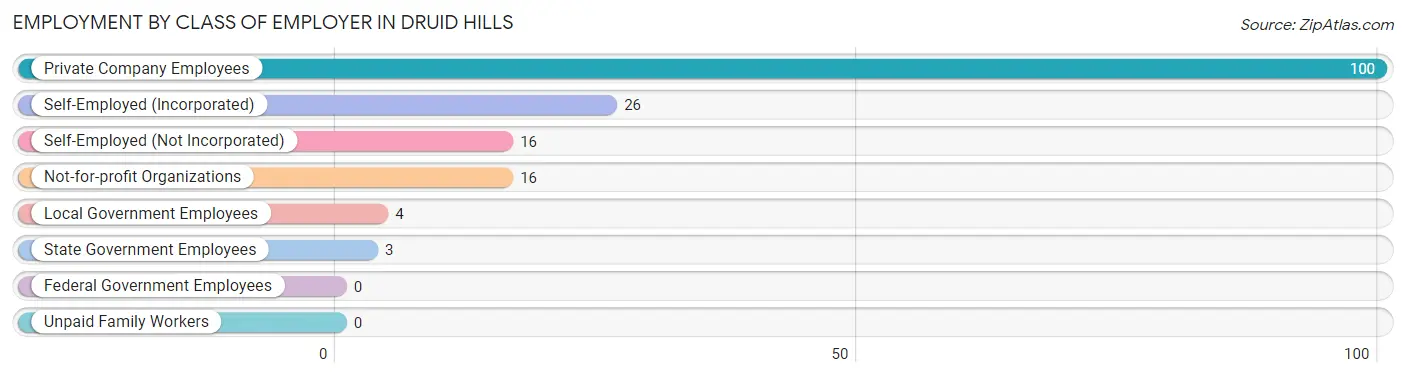
| Employer Class | # Employees | % Employees |
| Private Company Employees | 100 | 60.6% |
| Self-Employed (Incorporated) | 26 | 15.8% |
| Self-Employed (Not Incorporated) | 16 | 9.7% |
| Not-for-profit Organizations | 16 | 9.7% |
| Local Government Employees | 4 | 2.4% |
| State Government Employees | 3 | 1.8% |
| Federal Government Employees | 0 | 0.0% |
| Unpaid Family Workers | 0 | 0.0% |
| Total | 165 | 100.0% |
Employment Status by Age in Druid Hills
According to the labor force statistics for Druid Hills, out of the total population over 16 years of age (265), 67.5% or 179 individuals are in the labor force, with 3.4% or 6 of them unemployed. The age group with the highest labor force participation rate is 20 to 24 years, with 100.0% or 1 individuals in the labor force. Within the labor force, the 20 to 24 years age range has the highest percentage of unemployed individuals, with 100.0% or 1 of them being unemployed.
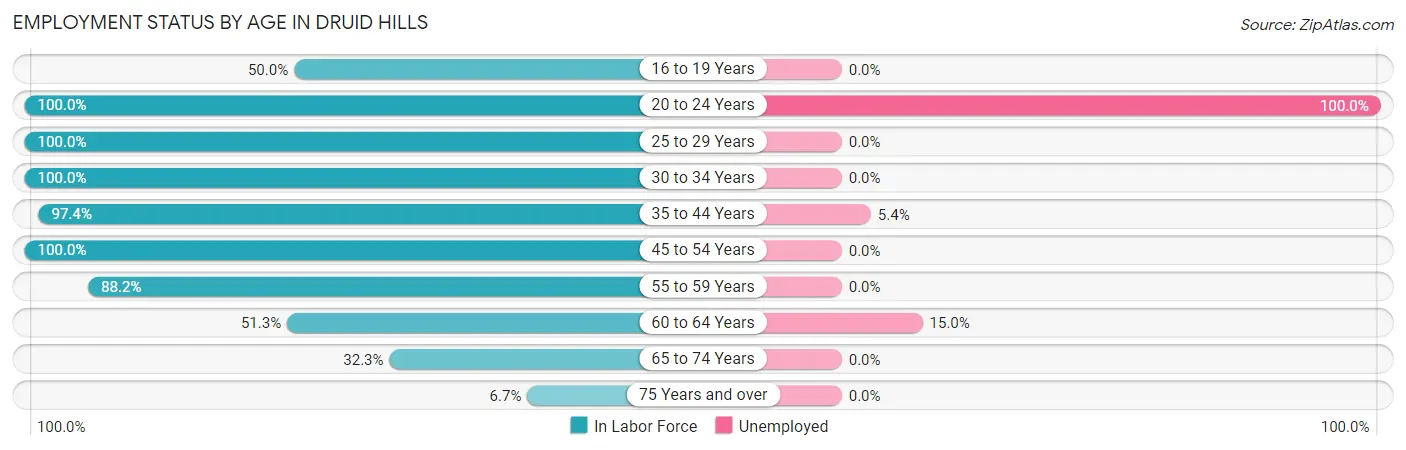
| Age Bracket | In Labor Force | Unemployed |
| 16 to 19 Years | 6 (50.0%) | 0 (0.0%) |
| 20 to 24 Years | 1 (100.0%) | 1 (100.0%) |
| 25 to 29 Years | 5 (100.0%) | 0 (0.0%) |
| 30 to 34 Years | 29 (100.0%) | 0 (0.0%) |
| 35 to 44 Years | 37 (97.4%) | 2 (5.4%) |
| 45 to 54 Years | 44 (100.0%) | 0 (0.0%) |
| 55 to 59 Years | 15 (88.2%) | 0 (0.0%) |
| 60 to 64 Years | 20 (51.3%) | 3 (15.0%) |
| 65 to 74 Years | 21 (32.3%) | 0 (0.0%) |
| 75 Years and over | 1 (6.7%) | 0 (0.0%) |
| Total | 179 (67.5%) | 6 (3.4%) |
Employment Status by Educational Attainment in Druid Hills
According to labor force statistics for Druid Hills, 87.2% of individuals (150) out of the total population between 25 and 64 years of age (172) are in the labor force, with 3.3% or 5 of them being unemployed. The group with the highest labor force participation rate are those with the educational attainment of college / associate degree, with 100.0% or 7 individuals in the labor force. Within the labor force, individuals with bachelor's degree or higher education have the highest percentage of unemployment, with 3.6% or 5 of them being unemployed.
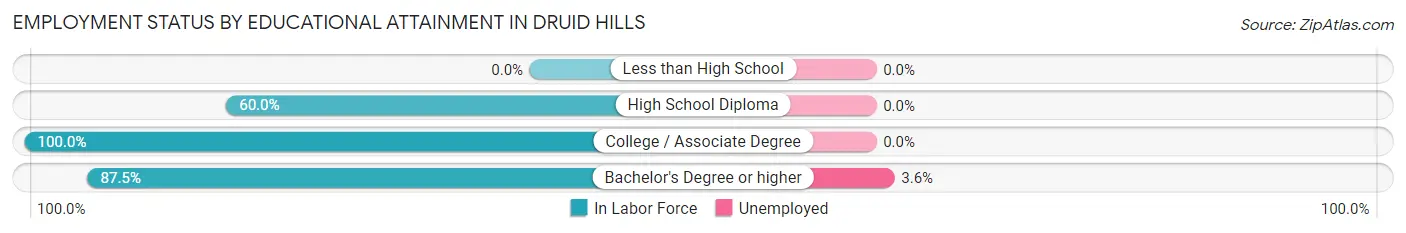
| Educational Attainment | In Labor Force | Unemployed |
| Less than High School | 0 (0.0%) | 0 (0.0%) |
| High School Diploma | 3 (60.0%) | 0 (0.0%) |
| College / Associate Degree | 7 (100.0%) | 0 (0.0%) |
| Bachelor's Degree or higher | 140 (87.5%) | 6 (3.6%) |
| Total | 150 (87.2%) | 6 (3.3%) |
Employment Occupations by Sex in Druid Hills
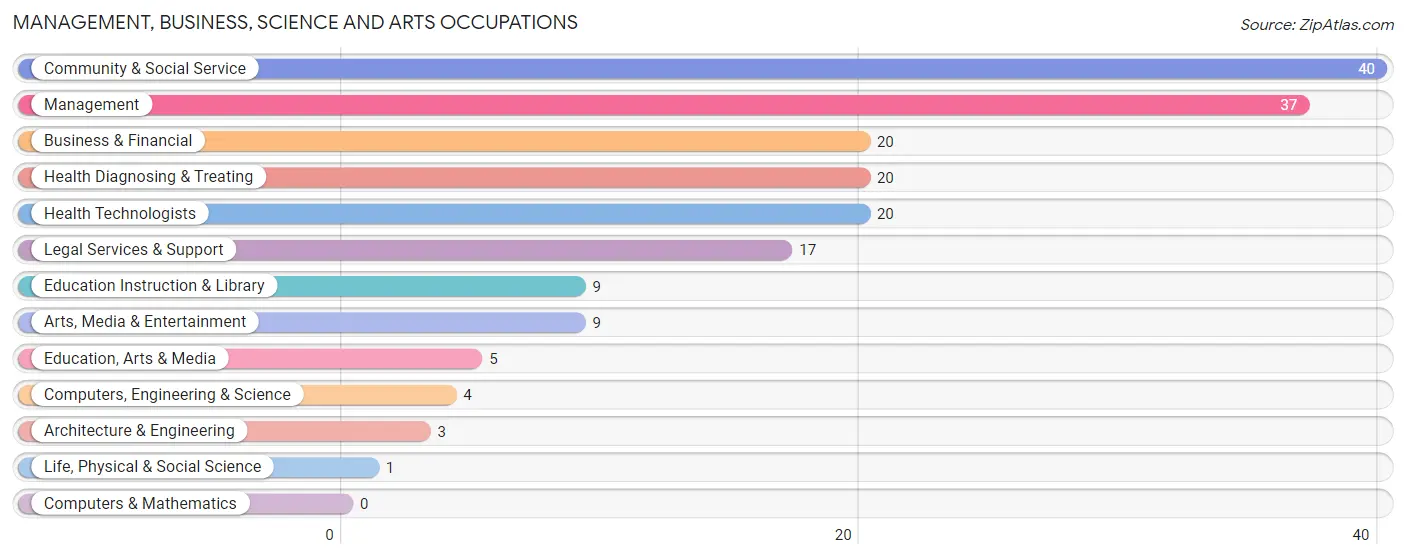
Management, Business, Science and Arts Occupations
The most common Management, Business, Science and Arts occupations in Druid Hills are Community & Social Service (40 | 23.1%), Management (37 | 21.4%), Business & Financial (20 | 11.6%), Health Diagnosing & Treating (20 | 11.6%), and Health Technologists (20 | 11.6%).
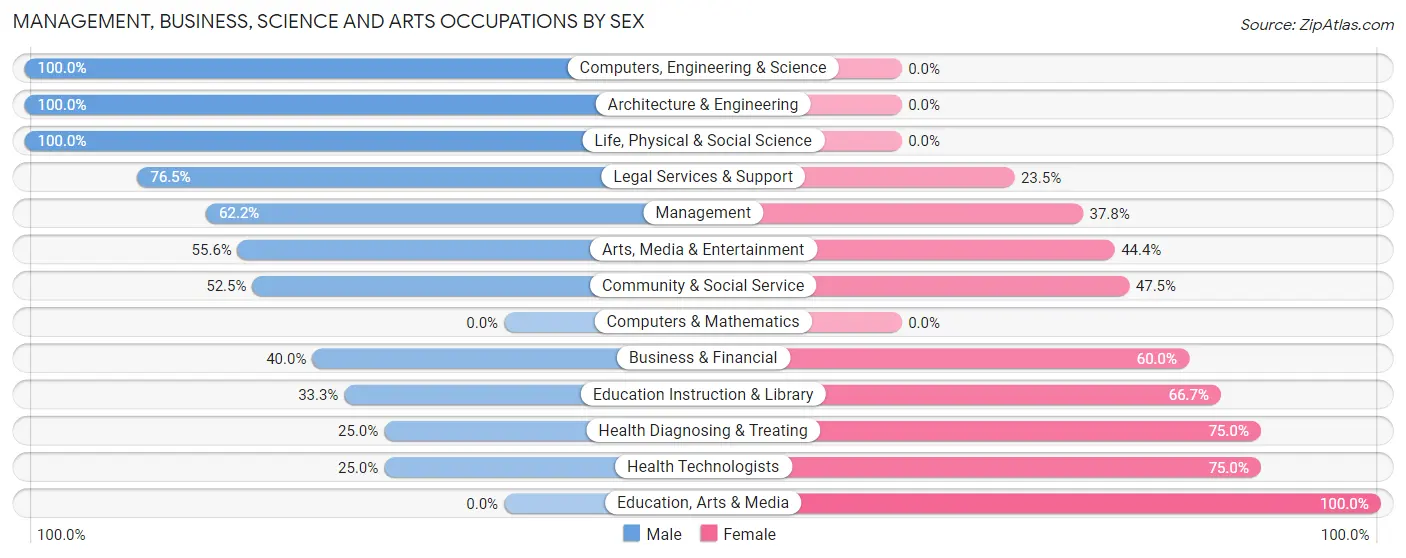
Management, Business, Science and Arts Occupations by Sex
Within the Management, Business, Science and Arts occupations in Druid Hills, the most male-oriented occupations are Computers, Engineering & Science (100.0%), Architecture & Engineering (100.0%), and Life, Physical & Social Science (100.0%), while the most female-oriented occupations are Education, Arts & Media (100.0%), Health Diagnosing & Treating (75.0%), and Health Technologists (75.0%).
| Occupation | Male | Female |
| Management | 23 (62.2%) | 14 (37.8%) |
| Business & Financial | 8 (40.0%) | 12 (60.0%) |
| Computers, Engineering & Science | 4 (100.0%) | 0 (0.0%) |
| Computers & Mathematics | 0 (0.0%) | 0 (0.0%) |
| Architecture & Engineering | 3 (100.0%) | 0 (0.0%) |
| Life, Physical & Social Science | 1 (100.0%) | 0 (0.0%) |
| Community & Social Service | 21 (52.5%) | 19 (47.5%) |
| Education, Arts & Media | 0 (0.0%) | 5 (100.0%) |
| Legal Services & Support | 13 (76.5%) | 4 (23.5%) |
| Education Instruction & Library | 3 (33.3%) | 6 (66.7%) |
| Arts, Media & Entertainment | 5 (55.6%) | 4 (44.4%) |
| Health Diagnosing & Treating | 5 (25.0%) | 15 (75.0%) |
| Health Technologists | 5 (25.0%) | 15 (75.0%) |
| Total (Category) | 61 (50.4%) | 60 (49.6%) |
| Total (Overall) | 88 (50.9%) | 85 (49.1%) |
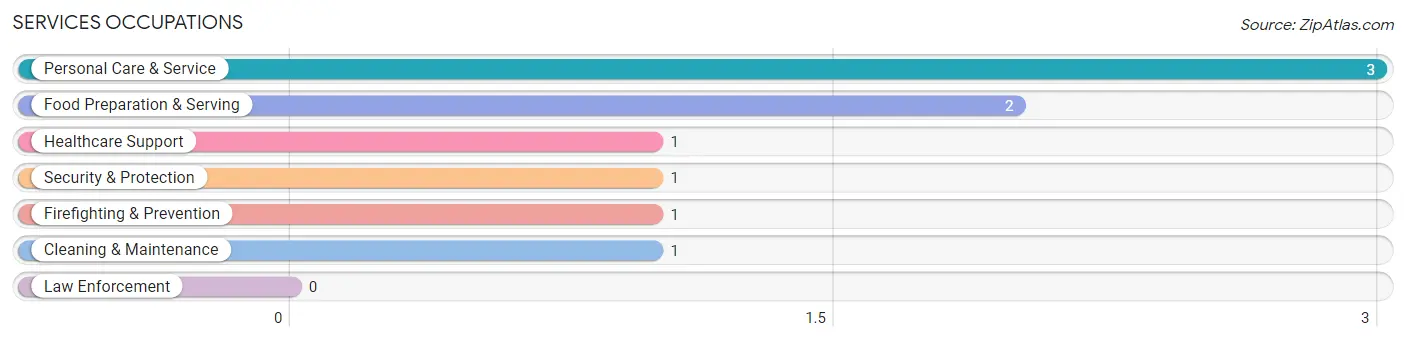
Services Occupations
The most common Services occupations in Druid Hills are Personal Care & Service (3 | 1.7%), Food Preparation & Serving (2 | 1.2%), Healthcare Support (1 | 0.6%), Security & Protection (1 | 0.6%), and Firefighting & Prevention (1 | 0.6%).
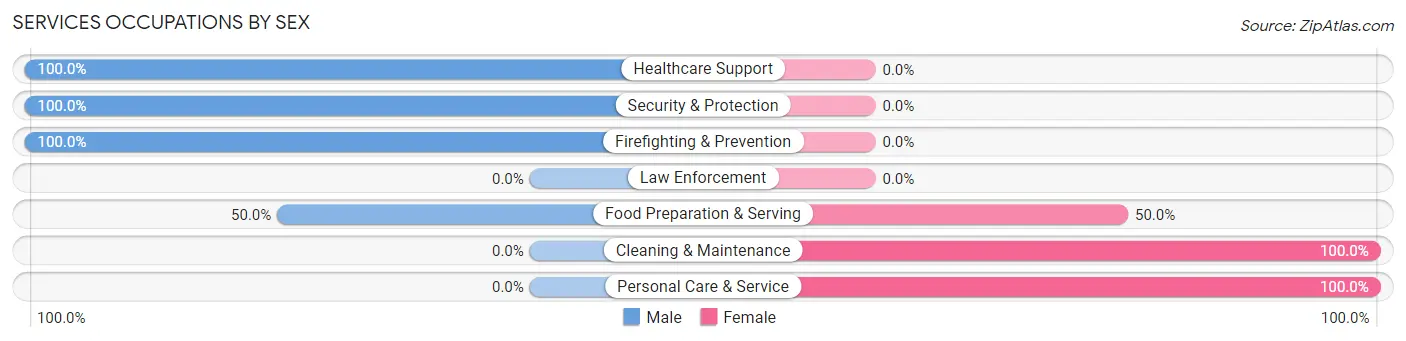
Services Occupations by Sex
Within the Services occupations in Druid Hills, the most male-oriented occupations are Healthcare Support (100.0%), Security & Protection (100.0%), and Firefighting & Prevention (100.0%), while the most female-oriented occupations are Cleaning & Maintenance (100.0%), Personal Care & Service (100.0%), and Food Preparation & Serving (50.0%).
| Occupation | Male | Female |
| Healthcare Support | 1 (100.0%) | 0 (0.0%) |
| Security & Protection | 1 (100.0%) | 0 (0.0%) |
| Firefighting & Prevention | 1 (100.0%) | 0 (0.0%) |
| Law Enforcement | 0 (0.0%) | 0 (0.0%) |
| Food Preparation & Serving | 1 (50.0%) | 1 (50.0%) |
| Cleaning & Maintenance | 0 (0.0%) | 1 (100.0%) |
| Personal Care & Service | 0 (0.0%) | 3 (100.0%) |
| Total (Category) | 3 (37.5%) | 5 (62.5%) |
| Total (Overall) | 88 (50.9%) | 85 (49.1%) |
Sales and Office Occupations
The most common Sales and Office occupations in Druid Hills are Sales & Related (29 | 16.8%), and Office & Administration (9 | 5.2%).
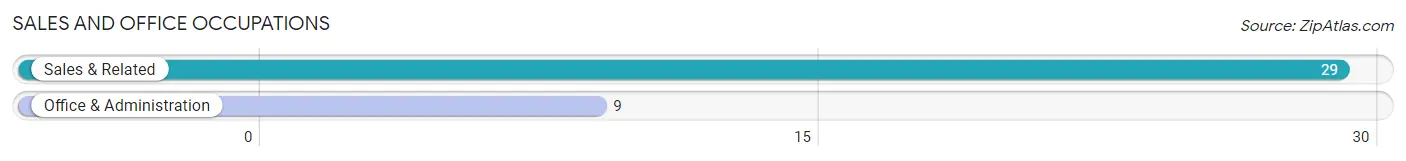
Sales and Office Occupations by Sex
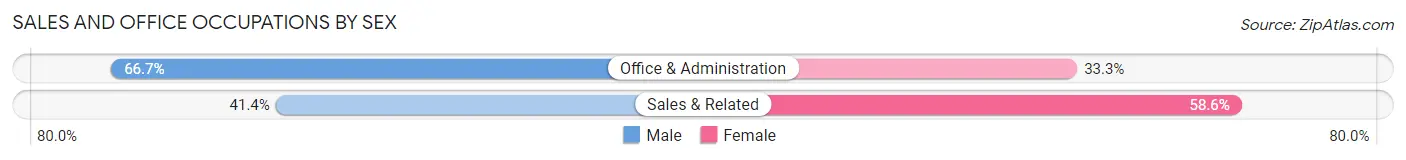
| Occupation | Male | Female |
| Sales & Related | 12 (41.4%) | 17 (58.6%) |
| Office & Administration | 6 (66.7%) | 3 (33.3%) |
| Total (Category) | 18 (47.4%) | 20 (52.6%) |
| Total (Overall) | 88 (50.9%) | 85 (49.1%) |
Natural Resources, Construction and Maintenance Occupations
The most common Natural Resources, Construction and Maintenance occupations in Druid Hills are , and Construction & Extraction (1 | 0.6%).
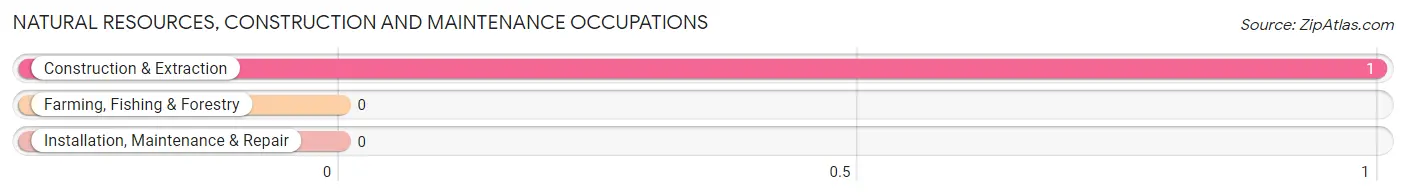
Natural Resources, Construction and Maintenance Occupations by Sex
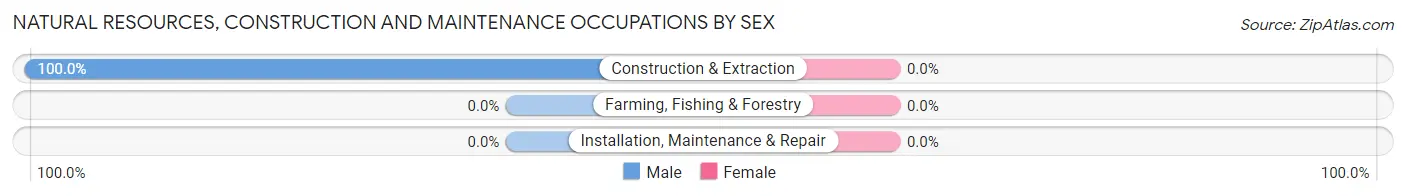
| Occupation | Male | Female |
| Farming, Fishing & Forestry | 0 (0.0%) | 0 (0.0%) |
| Construction & Extraction | 1 (100.0%) | 0 (0.0%) |
| Installation, Maintenance & Repair | 0 (0.0%) | 0 (0.0%) |
| Total (Category) | 1 (100.0%) | 0 (0.0%) |
| Total (Overall) | 88 (50.9%) | 85 (49.1%) |
Production, Transportation and Moving Occupations
The most common Production, Transportation and Moving occupations in Druid Hills are , and Material Moving (5 | 2.9%).
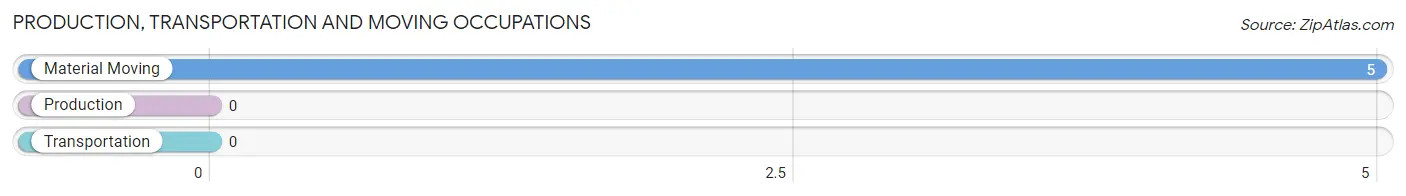
Production, Transportation and Moving Occupations by Sex
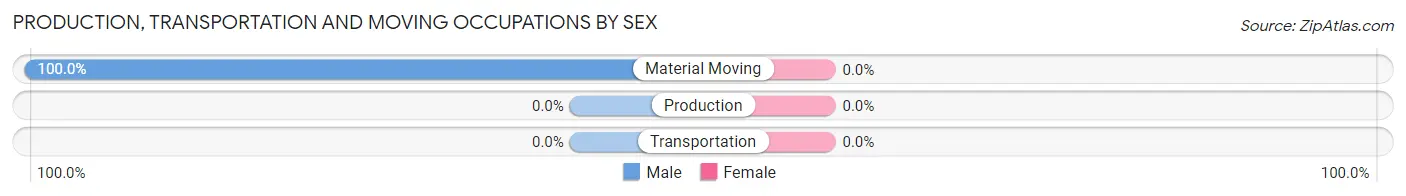
| Occupation | Male | Female |
| Production | 0 (0.0%) | 0 (0.0%) |
| Transportation | 0 (0.0%) | 0 (0.0%) |
| Material Moving | 5 (100.0%) | 0 (0.0%) |
| Total (Category) | 5 (100.0%) | 0 (0.0%) |
| Total (Overall) | 88 (50.9%) | 85 (49.1%) |
Employment Industries by Sex in Druid Hills
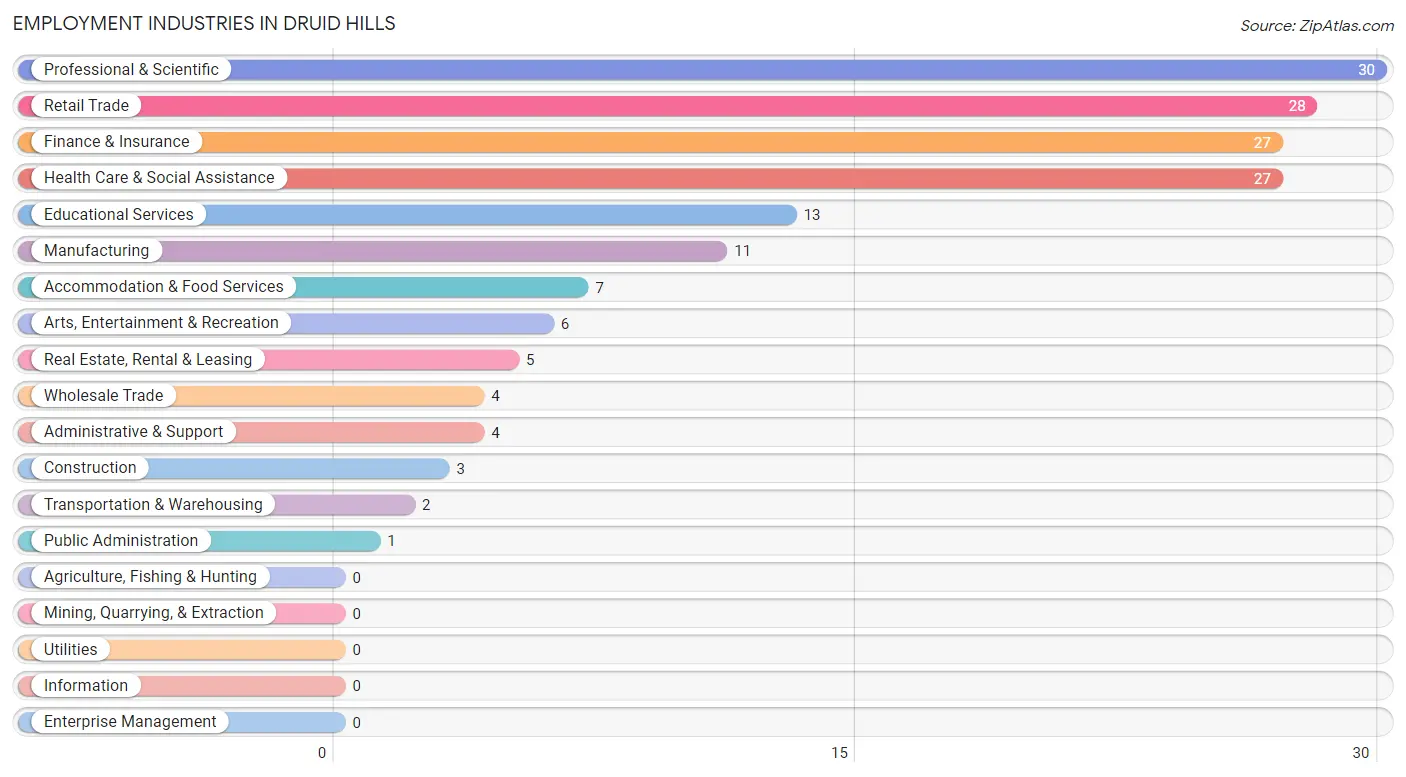
Employment Industries in Druid Hills
The major employment industries in Druid Hills include Professional & Scientific (30 | 17.3%), Retail Trade (28 | 16.2%), Finance & Insurance (27 | 15.6%), Health Care & Social Assistance (27 | 15.6%), and Educational Services (13 | 7.5%).
Employment Industries by Sex in Druid Hills
The Druid Hills industries that see more men than women are Construction (100.0%), Transportation & Warehousing (100.0%), and Arts, Entertainment & Recreation (83.3%), whereas the industries that tend to have a higher number of women are Accommodation & Food Services (100.0%), Public Administration (100.0%), and Educational Services (76.9%).
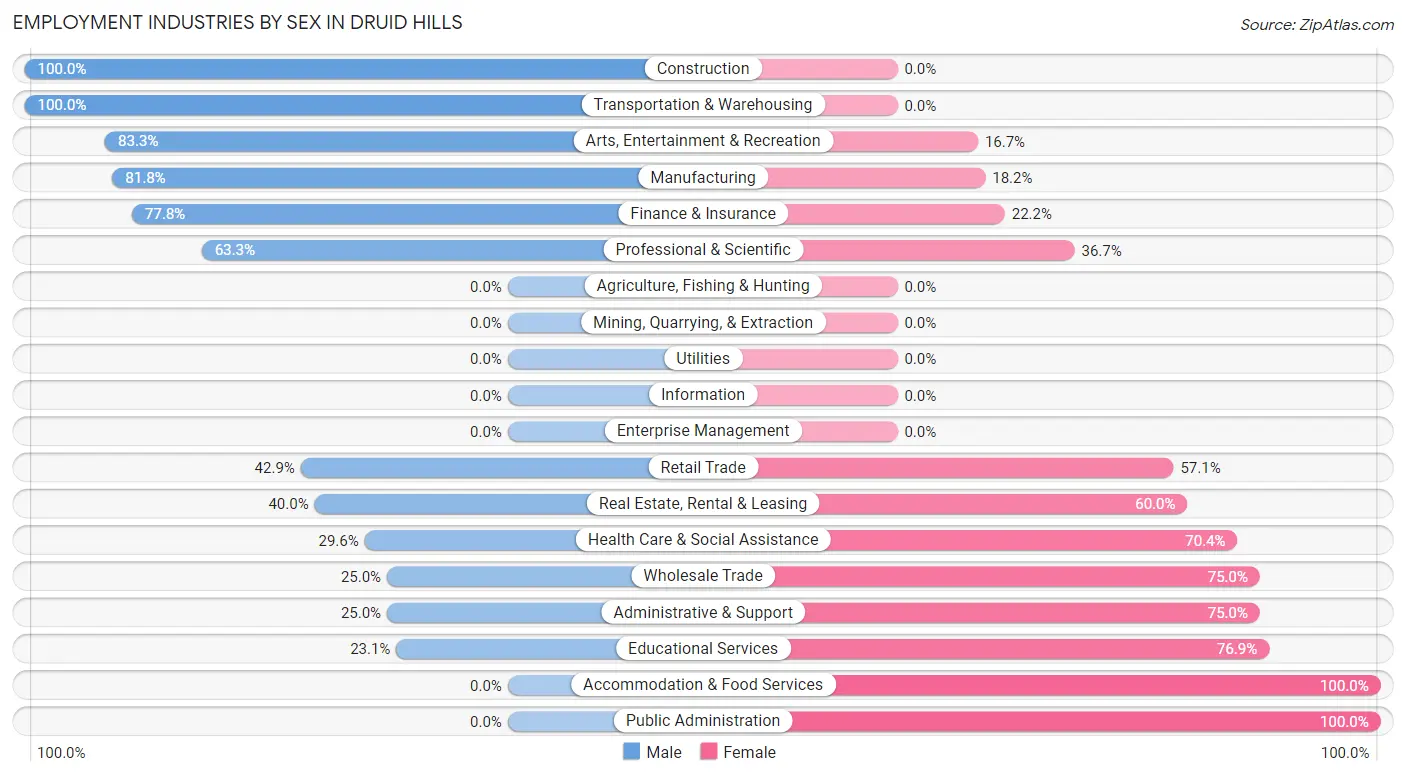
| Industry | Male | Female |
| Agriculture, Fishing & Hunting | 0 (0.0%) | 0 (0.0%) |
| Mining, Quarrying, & Extraction | 0 (0.0%) | 0 (0.0%) |
| Construction | 3 (100.0%) | 0 (0.0%) |
| Manufacturing | 9 (81.8%) | 2 (18.2%) |
| Wholesale Trade | 1 (25.0%) | 3 (75.0%) |
| Retail Trade | 12 (42.9%) | 16 (57.1%) |
| Transportation & Warehousing | 2 (100.0%) | 0 (0.0%) |
| Utilities | 0 (0.0%) | 0 (0.0%) |
| Information | 0 (0.0%) | 0 (0.0%) |
| Finance & Insurance | 21 (77.8%) | 6 (22.2%) |
| Real Estate, Rental & Leasing | 2 (40.0%) | 3 (60.0%) |
| Professional & Scientific | 19 (63.3%) | 11 (36.7%) |
| Enterprise Management | 0 (0.0%) | 0 (0.0%) |
| Administrative & Support | 1 (25.0%) | 3 (75.0%) |
| Educational Services | 3 (23.1%) | 10 (76.9%) |
| Health Care & Social Assistance | 8 (29.6%) | 19 (70.4%) |
| Arts, Entertainment & Recreation | 5 (83.3%) | 1 (16.7%) |
| Accommodation & Food Services | 0 (0.0%) | 7 (100.0%) |
| Public Administration | 0 (0.0%) | 1 (100.0%) |
| Total | 88 (50.9%) | 85 (49.1%) |
Education in Druid Hills
School Enrollment in Druid Hills
The most common levels of schooling among the 57 students in Druid Hills are middle school (17 | 29.8%), high school (17 | 29.8%), and elementary school (11 | 19.3%).
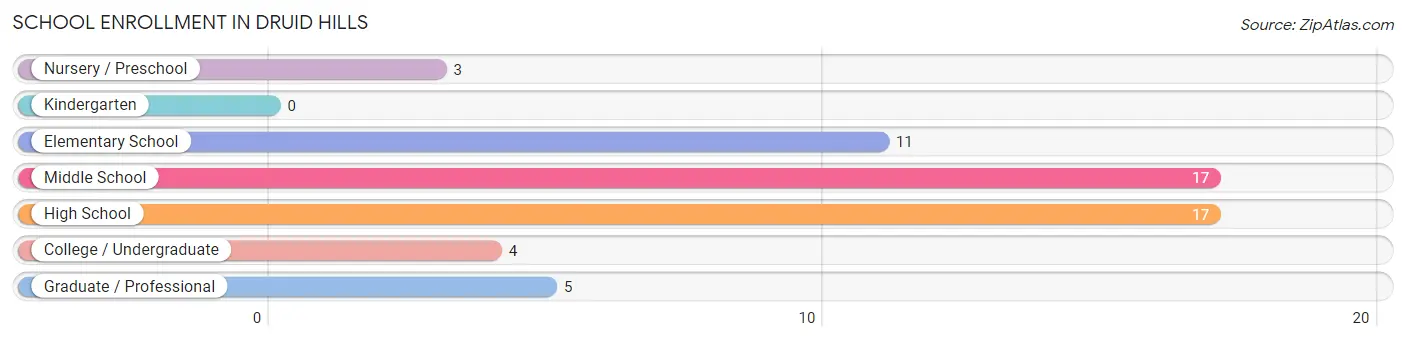
| School Level | # Students | % Students |
| Nursery / Preschool | 3 | 5.3% |
| Kindergarten | 0 | 0.0% |
| Elementary School | 11 | 19.3% |
| Middle School | 17 | 29.8% |
| High School | 17 | 29.8% |
| College / Undergraduate | 4 | 7.0% |
| Graduate / Professional | 5 | 8.8% |
| Total | 57 | 100.0% |
School Enrollment by Age by Funding Source in Druid Hills
Out of a total of 57 students who are enrolled in schools in Druid Hills, 25 (43.9%) attend a private institution, while the remaining 32 (56.1%) are enrolled in public schools. The age group of 3 to 4 year olds has the highest likelihood of being enrolled in private schools, with 1 (100.0% in the age bracket) enrolled. Conversely, the age group of 18 to 19 year olds has the lowest likelihood of being enrolled in a private school, with 2 (100.0% in the age bracket) attending a public institution.
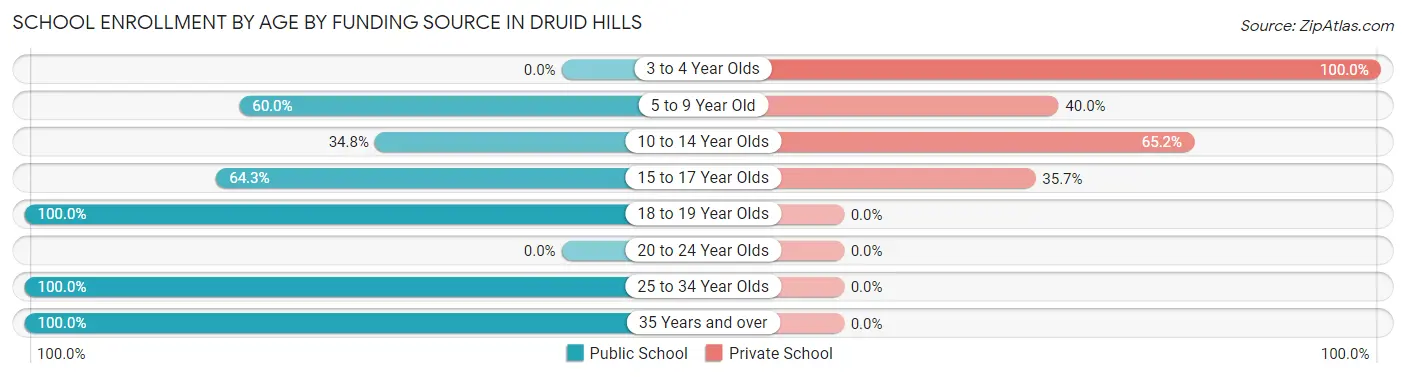
| Age Bracket | Public School | Private School |
| 3 to 4 Year Olds | 0 (0.0%) | 1 (100.0%) |
| 5 to 9 Year Old | 6 (60.0%) | 4 (40.0%) |
| 10 to 14 Year Olds | 8 (34.8%) | 15 (65.2%) |
| 15 to 17 Year Olds | 9 (64.3%) | 5 (35.7%) |
| 18 to 19 Year Olds | 2 (100.0%) | 0 (0.0%) |
| 20 to 24 Year Olds | 0 (0.0%) | 0 (0.0%) |
| 25 to 34 Year Olds | 2 (100.0%) | 0 (0.0%) |
| 35 Years and over | 5 (100.0%) | 0 (0.0%) |
| Total | 32 (56.1%) | 25 (43.9%) |
Educational Attainment by Field of Study in Druid Hills
Business (70 | 30.6%), social sciences (21 | 9.2%), science & technology (16 | 7.0%), communications (16 | 7.0%), and literature & languages (15 | 6.6%) are the most common fields of study among 229 individuals in Druid Hills who have obtained a bachelor's degree or higher.
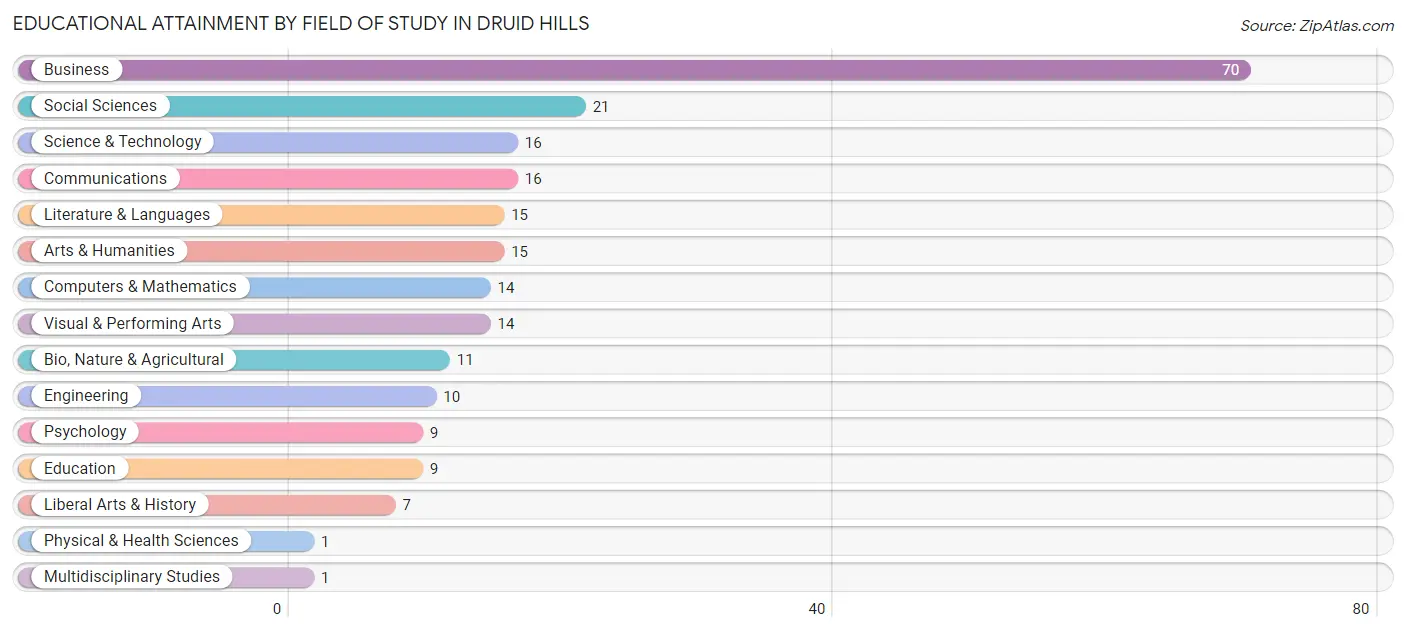
| Field of Study | # Graduates | % Graduates |
| Computers & Mathematics | 14 | 6.1% |
| Bio, Nature & Agricultural | 11 | 4.8% |
| Physical & Health Sciences | 1 | 0.4% |
| Psychology | 9 | 3.9% |
| Social Sciences | 21 | 9.2% |
| Engineering | 10 | 4.4% |
| Multidisciplinary Studies | 1 | 0.4% |
| Science & Technology | 16 | 7.0% |
| Business | 70 | 30.6% |
| Education | 9 | 3.9% |
| Literature & Languages | 15 | 6.6% |
| Liberal Arts & History | 7 | 3.1% |
| Visual & Performing Arts | 14 | 6.1% |
| Communications | 16 | 7.0% |
| Arts & Humanities | 15 | 6.6% |
| Total | 229 | 100.0% |
Transportation & Commute in Druid Hills
Vehicle Availability by Sex in Druid Hills
The most prevalent vehicle ownership categories in Druid Hills are males with 2 vehicles (64, accounting for 72.7%) and females with 2 vehicles (45, making up 83.1%).
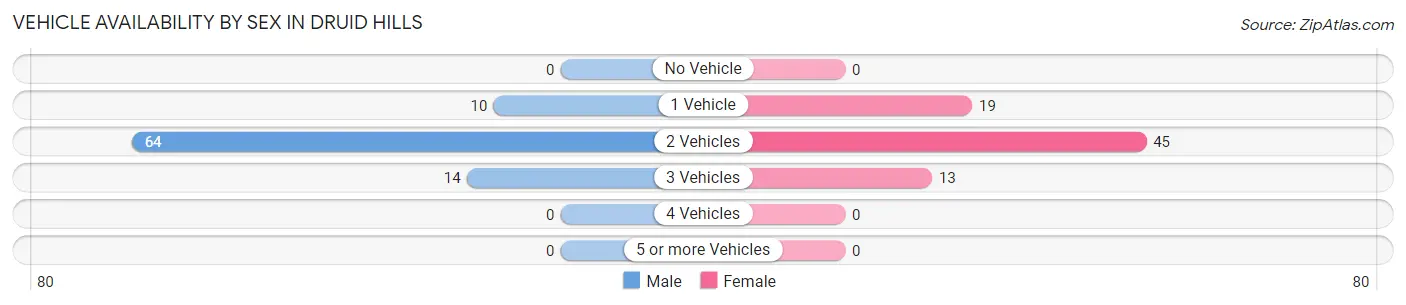
| Vehicles Available | Male | Female |
| No Vehicle | 0 (0.0%) | 0 (0.0%) |
| 1 Vehicle | 10 (11.4%) | 19 (24.7%) |
| 2 Vehicles | 64 (72.7%) | 45 (58.4%) |
| 3 Vehicles | 14 (15.9%) | 13 (16.9%) |
| 4 Vehicles | 0 (0.0%) | 0 (0.0%) |
| 5 or more Vehicles | 0 (0.0%) | 0 (0.0%) |
| Total | 88 (100.0%) | 77 (100.0%) |
Commute Time in Druid Hills
The most frequently occuring commute durations in Druid Hills are 15 to 19 minutes (50 commuters, 36.2%), 20 to 24 minutes (23 commuters, 16.7%), and 10 to 14 minutes (20 commuters, 14.5%).
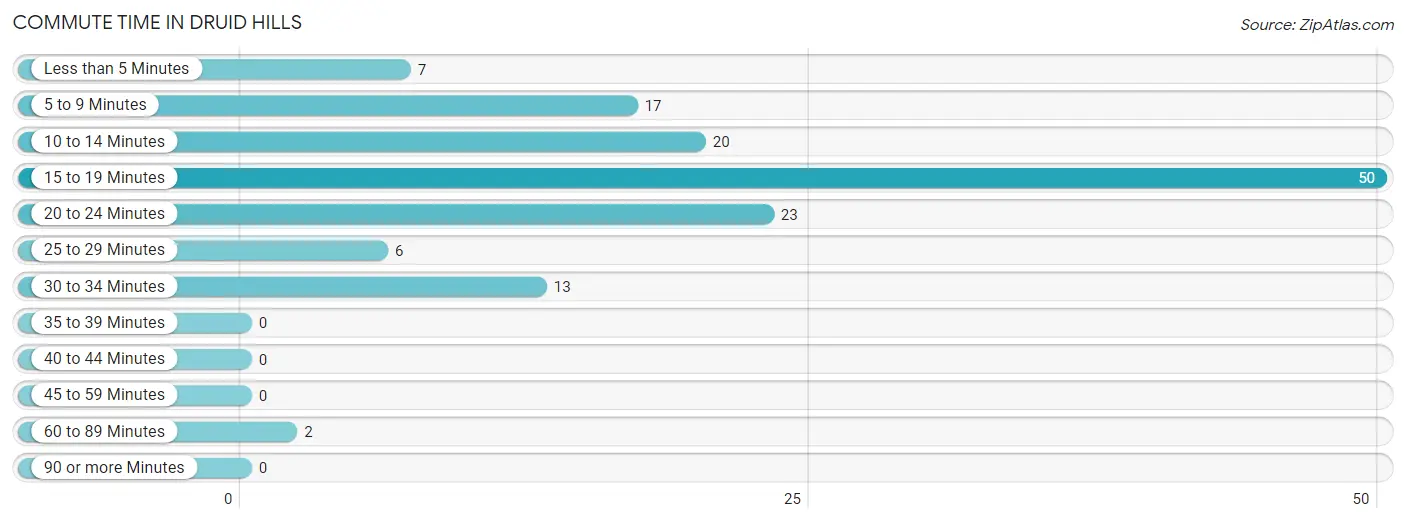
| Commute Time | # Commuters | % Commuters |
| Less than 5 Minutes | 7 | 5.1% |
| 5 to 9 Minutes | 17 | 12.3% |
| 10 to 14 Minutes | 20 | 14.5% |
| 15 to 19 Minutes | 50 | 36.2% |
| 20 to 24 Minutes | 23 | 16.7% |
| 25 to 29 Minutes | 6 | 4.3% |
| 30 to 34 Minutes | 13 | 9.4% |
| 35 to 39 Minutes | 0 | 0.0% |
| 40 to 44 Minutes | 0 | 0.0% |
| 45 to 59 Minutes | 0 | 0.0% |
| 60 to 89 Minutes | 2 | 1.5% |
| 90 or more Minutes | 0 | 0.0% |
Commute Time by Sex in Druid Hills
The most common commute times in Druid Hills are 15 to 19 minutes (39 commuters, 51.3%) for males and 10 to 14 minutes (15 commuters, 24.2%) for females.
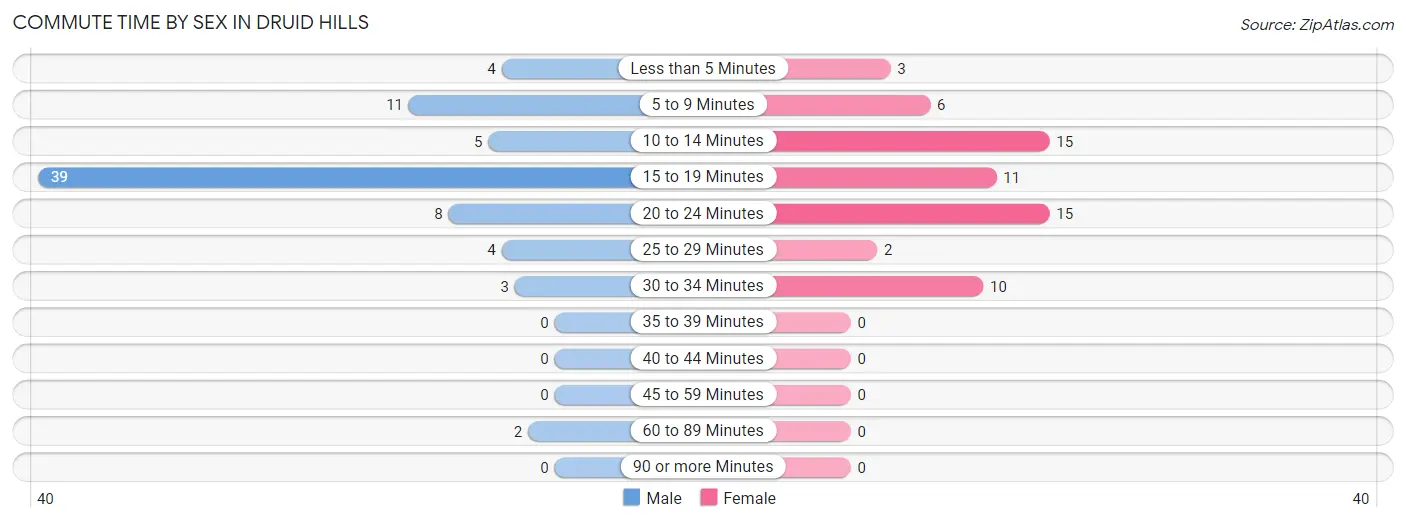
| Commute Time | Male | Female |
| Less than 5 Minutes | 4 (5.3%) | 3 (4.8%) |
| 5 to 9 Minutes | 11 (14.5%) | 6 (9.7%) |
| 10 to 14 Minutes | 5 (6.6%) | 15 (24.2%) |
| 15 to 19 Minutes | 39 (51.3%) | 11 (17.7%) |
| 20 to 24 Minutes | 8 (10.5%) | 15 (24.2%) |
| 25 to 29 Minutes | 4 (5.3%) | 2 (3.2%) |
| 30 to 34 Minutes | 3 (4.0%) | 10 (16.1%) |
| 35 to 39 Minutes | 0 (0.0%) | 0 (0.0%) |
| 40 to 44 Minutes | 0 (0.0%) | 0 (0.0%) |
| 45 to 59 Minutes | 0 (0.0%) | 0 (0.0%) |
| 60 to 89 Minutes | 2 (2.6%) | 0 (0.0%) |
| 90 or more Minutes | 0 (0.0%) | 0 (0.0%) |
Time of Departure to Work by Sex in Druid Hills
The most frequent times of departure to work in Druid Hills are 7:30 AM to 7:59 AM (18, 23.7%) for males and 7:30 AM to 7:59 AM (20, 32.3%) for females.
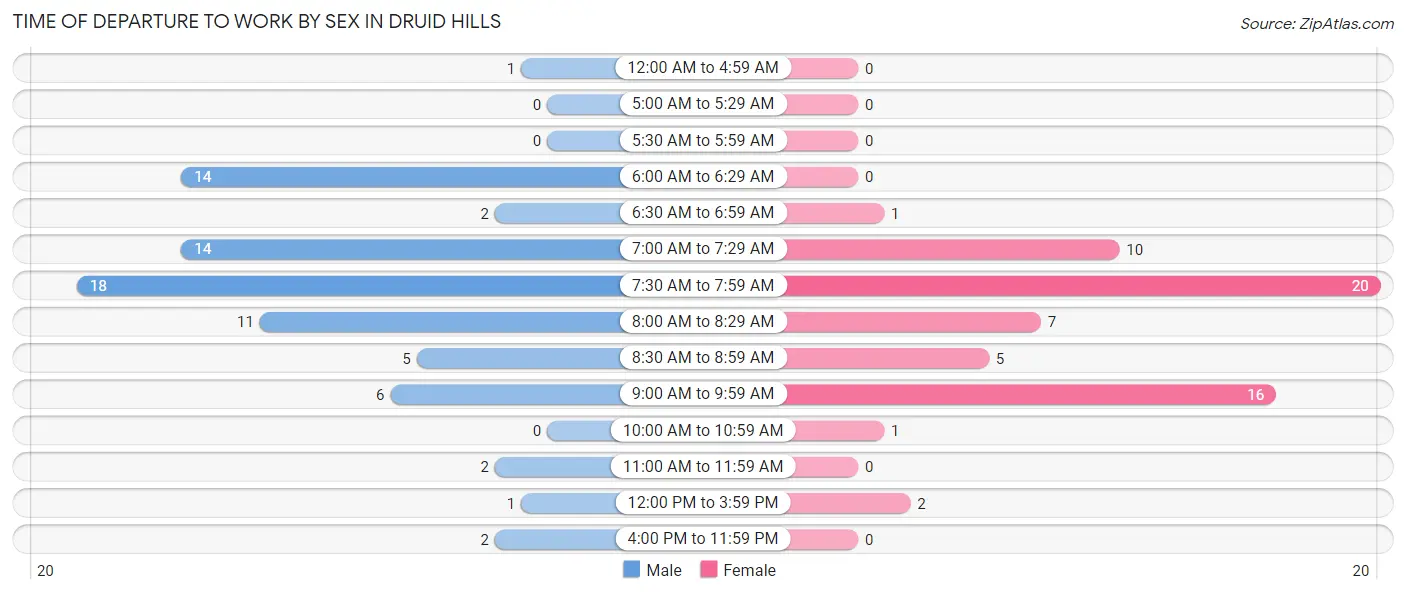
| Time of Departure | Male | Female |
| 12:00 AM to 4:59 AM | 1 (1.3%) | 0 (0.0%) |
| 5:00 AM to 5:29 AM | 0 (0.0%) | 0 (0.0%) |
| 5:30 AM to 5:59 AM | 0 (0.0%) | 0 (0.0%) |
| 6:00 AM to 6:29 AM | 14 (18.4%) | 0 (0.0%) |
| 6:30 AM to 6:59 AM | 2 (2.6%) | 1 (1.6%) |
| 7:00 AM to 7:29 AM | 14 (18.4%) | 10 (16.1%) |
| 7:30 AM to 7:59 AM | 18 (23.7%) | 20 (32.3%) |
| 8:00 AM to 8:29 AM | 11 (14.5%) | 7 (11.3%) |
| 8:30 AM to 8:59 AM | 5 (6.6%) | 5 (8.1%) |
| 9:00 AM to 9:59 AM | 6 (7.9%) | 16 (25.8%) |
| 10:00 AM to 10:59 AM | 0 (0.0%) | 1 (1.6%) |
| 11:00 AM to 11:59 AM | 2 (2.6%) | 0 (0.0%) |
| 12:00 PM to 3:59 PM | 1 (1.3%) | 2 (3.2%) |
| 4:00 PM to 11:59 PM | 2 (2.6%) | 0 (0.0%) |
| Total | 76 (100.0%) | 62 (100.0%) |
Housing Occupancy in Druid Hills
Occupancy by Ownership in Druid Hills
Of the total 150 dwellings in Druid Hills, owner-occupied units account for 134 (89.3%), while renter-occupied units make up 16 (10.7%).
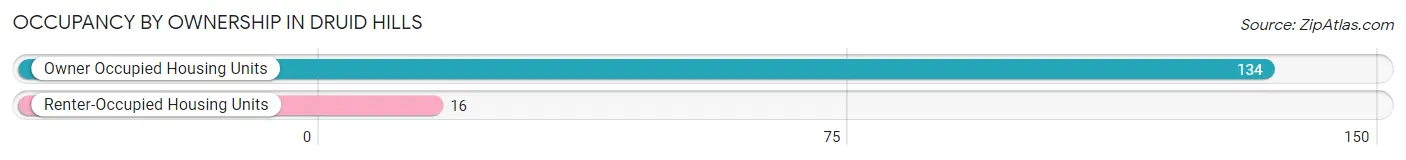
| Occupancy | # Housing Units | % Housing Units |
| Owner Occupied Housing Units | 134 | 89.3% |
| Renter-Occupied Housing Units | 16 | 10.7% |
| Total Occupied Housing Units | 150 | 100.0% |
Occupancy by Household Size in Druid Hills
| Household Size | # Housing Units | % Housing Units |
| 1-Person Household | 36 | 24.0% |
| 2-Person Household | 79 | 52.7% |
| 3-Person Household | 22 | 14.7% |
| 4+ Person Household | 13 | 8.7% |
| Total Housing Units | 150 | 100.0% |
Occupancy by Ownership by Household Size in Druid Hills
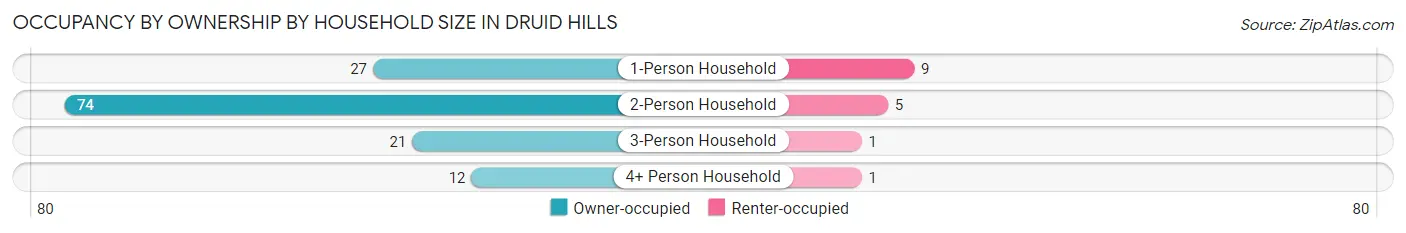
| Household Size | Owner-occupied | Renter-occupied |
| 1-Person Household | 27 (75.0%) | 9 (25.0%) |
| 2-Person Household | 74 (93.7%) | 5 (6.3%) |
| 3-Person Household | 21 (95.5%) | 1 (4.5%) |
| 4+ Person Household | 12 (92.3%) | 1 (7.7%) |
| Total Housing Units | 134 (89.3%) | 16 (10.7%) |
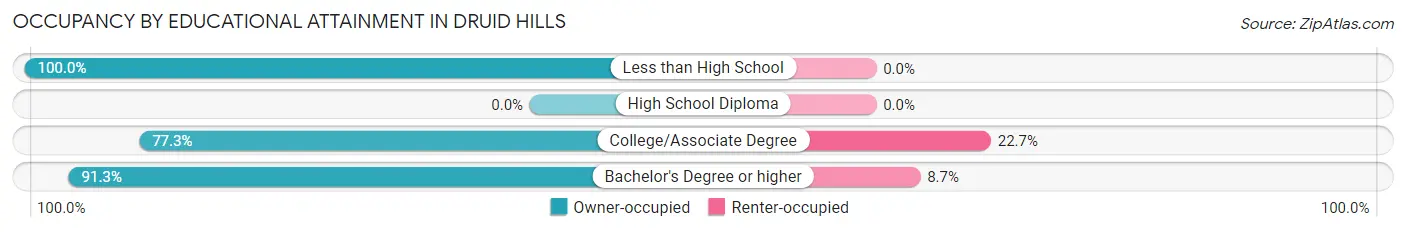
Occupancy by Educational Attainment in Druid Hills
| Household Size | Owner-occupied | Renter-occupied |
| Less than High School | 2 (100.0%) | 0 (0.0%) |
| High School Diploma | 0 (0.0%) | 0 (0.0%) |
| College/Associate Degree | 17 (77.3%) | 5 (22.7%) |
| Bachelor's Degree or higher | 115 (91.3%) | 11 (8.7%) |
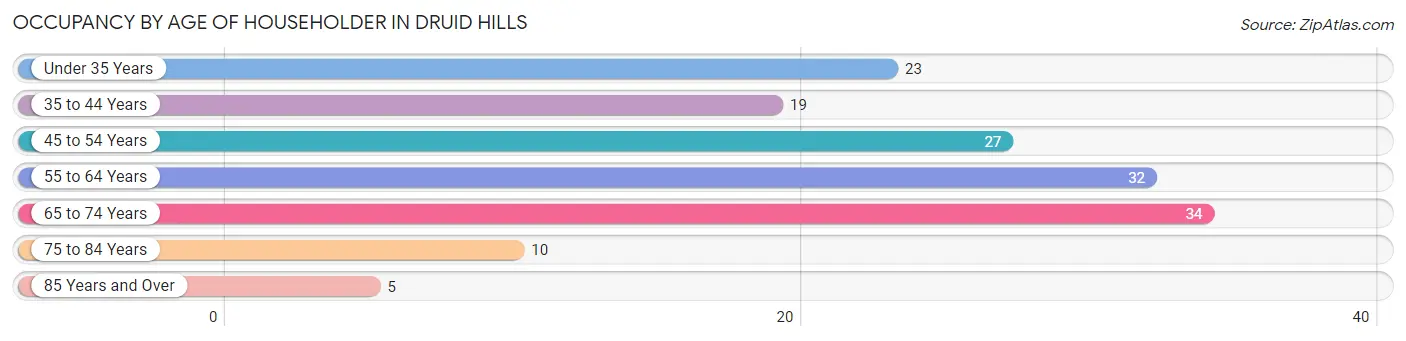
Occupancy by Age of Householder in Druid Hills
| Age Bracket | # Households | % Households |
| Under 35 Years | 23 | 15.3% |
| 35 to 44 Years | 19 | 12.7% |
| 45 to 54 Years | 27 | 18.0% |
| 55 to 64 Years | 32 | 21.3% |
| 65 to 74 Years | 34 | 22.7% |
| 75 to 84 Years | 10 | 6.7% |
| 85 Years and Over | 5 | 3.3% |
| Total | 150 | 100.0% |
Housing Finances in Druid Hills
Median Income by Occupancy in Druid Hills
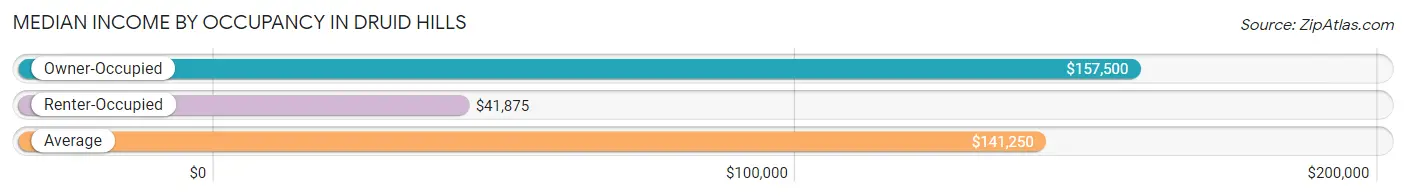
| Occupancy Type | # Households | Median Income |
| Owner-Occupied | 134 (89.3%) | $157,500 |
| Renter-Occupied | 16 (10.7%) | $41,875 |
| Average | 150 (100.0%) | $141,250 |
Occupancy by Householder Income Bracket in Druid Hills
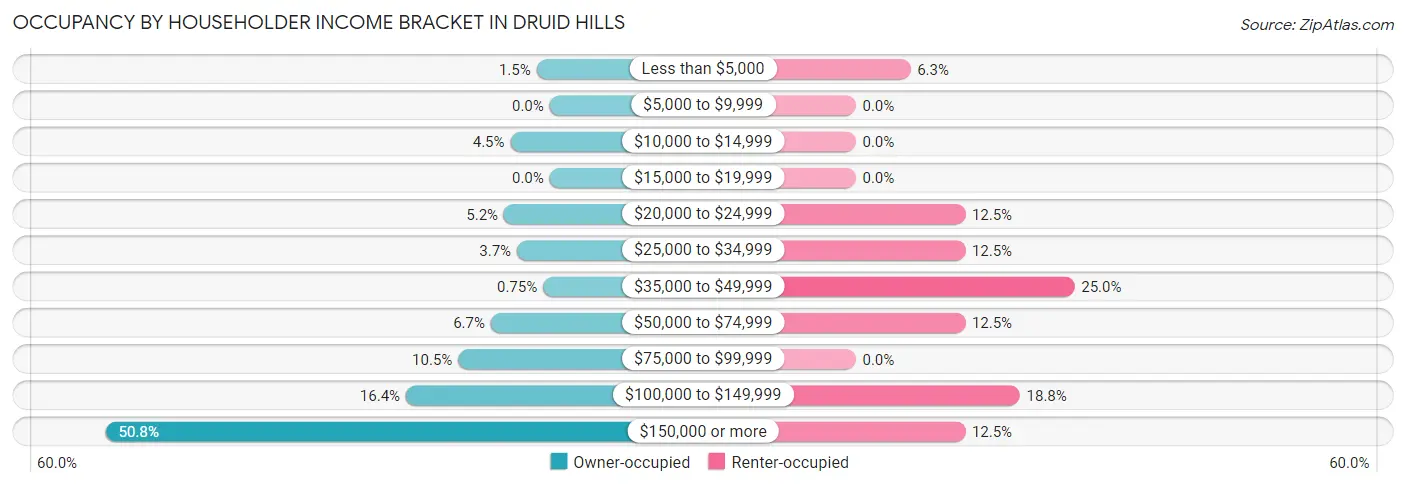
| Income Bracket | Owner-occupied | Renter-occupied |
| Less than $5,000 | 2 (1.5%) | 1 (6.2%) |
| $5,000 to $9,999 | 0 (0.0%) | 0 (0.0%) |
| $10,000 to $14,999 | 6 (4.5%) | 0 (0.0%) |
| $15,000 to $19,999 | 0 (0.0%) | 0 (0.0%) |
| $20,000 to $24,999 | 7 (5.2%) | 2 (12.5%) |
| $25,000 to $34,999 | 5 (3.7%) | 2 (12.5%) |
| $35,000 to $49,999 | 1 (0.7%) | 4 (25.0%) |
| $50,000 to $74,999 | 9 (6.7%) | 2 (12.5%) |
| $75,000 to $99,999 | 14 (10.4%) | 0 (0.0%) |
| $100,000 to $149,999 | 22 (16.4%) | 3 (18.8%) |
| $150,000 or more | 68 (50.7%) | 2 (12.5%) |
| Total | 134 (100.0%) | 16 (100.0%) |
Monthly Housing Cost Tiers in Druid Hills
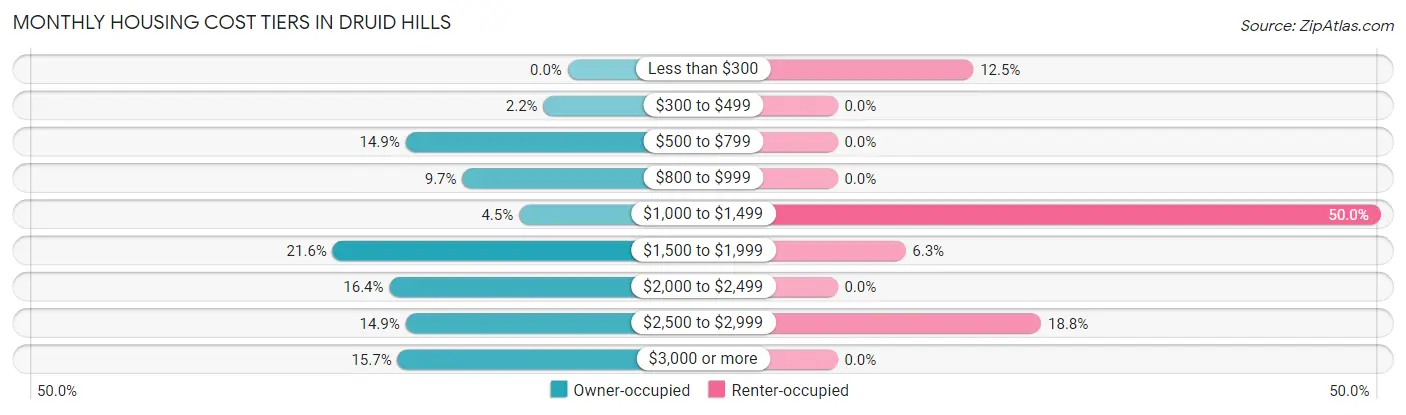
| Monthly Cost | Owner-occupied | Renter-occupied |
| Less than $300 | 0 (0.0%) | 2 (12.5%) |
| $300 to $499 | 3 (2.2%) | 0 (0.0%) |
| $500 to $799 | 20 (14.9%) | 0 (0.0%) |
| $800 to $999 | 13 (9.7%) | 0 (0.0%) |
| $1,000 to $1,499 | 6 (4.5%) | 8 (50.0%) |
| $1,500 to $1,999 | 29 (21.6%) | 1 (6.2%) |
| $2,000 to $2,499 | 22 (16.4%) | 0 (0.0%) |
| $2,500 to $2,999 | 20 (14.9%) | 3 (18.8%) |
| $3,000 or more | 21 (15.7%) | 0 (0.0%) |
| Total | 134 (100.0%) | 16 (100.0%) |
Physical Housing Characteristics in Druid Hills
Housing Structures in Druid Hills
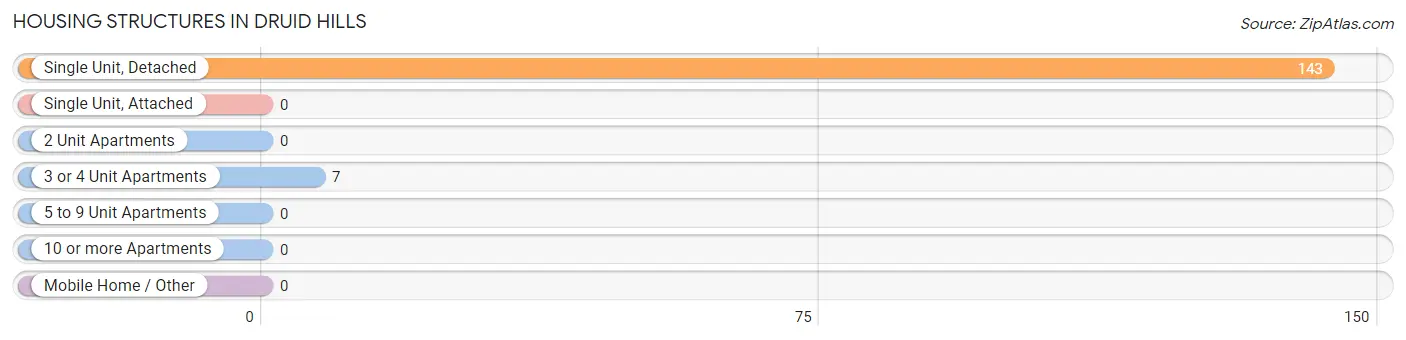
| Structure Type | # Housing Units | % Housing Units |
| Single Unit, Detached | 143 | 95.3% |
| Single Unit, Attached | 0 | 0.0% |
| 2 Unit Apartments | 0 | 0.0% |
| 3 or 4 Unit Apartments | 7 | 4.7% |
| 5 to 9 Unit Apartments | 0 | 0.0% |
| 10 or more Apartments | 0 | 0.0% |
| Mobile Home / Other | 0 | 0.0% |
| Total | 150 | 100.0% |
Housing Structures by Occupancy in Druid Hills
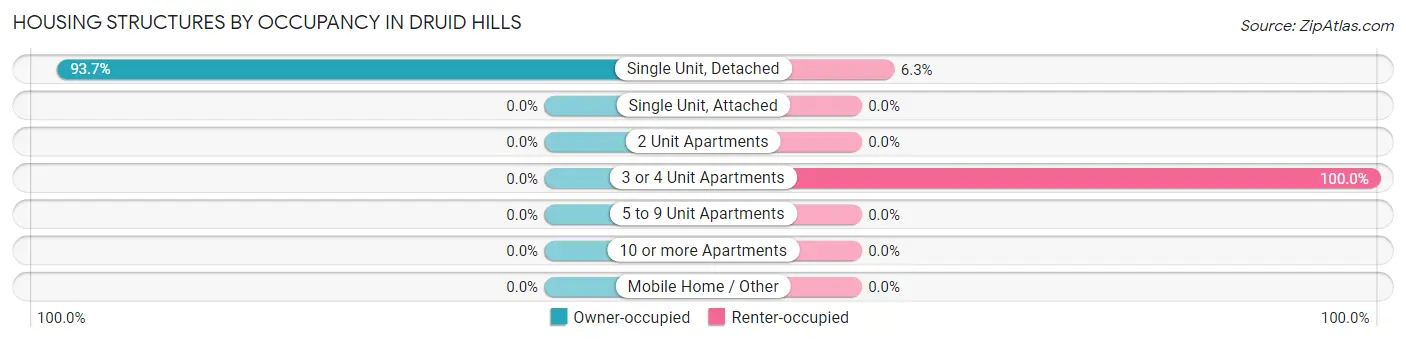
| Structure Type | Owner-occupied | Renter-occupied |
| Single Unit, Detached | 134 (93.7%) | 9 (6.3%) |
| Single Unit, Attached | 0 (0.0%) | 0 (0.0%) |
| 2 Unit Apartments | 0 (0.0%) | 0 (0.0%) |
| 3 or 4 Unit Apartments | 0 (0.0%) | 7 (100.0%) |
| 5 to 9 Unit Apartments | 0 (0.0%) | 0 (0.0%) |
| 10 or more Apartments | 0 (0.0%) | 0 (0.0%) |
| Mobile Home / Other | 0 (0.0%) | 0 (0.0%) |
| Total | 134 (89.3%) | 16 (10.7%) |
Housing Structures by Number of Rooms in Druid Hills
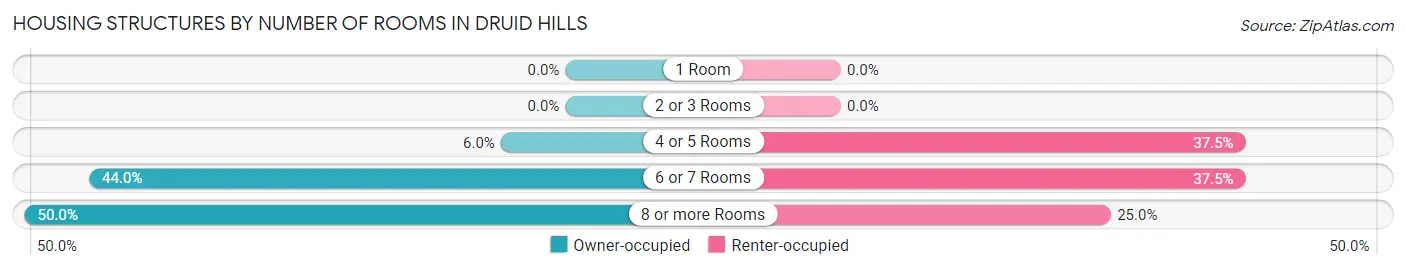
| Number of Rooms | Owner-occupied | Renter-occupied |
| 1 Room | 0 (0.0%) | 0 (0.0%) |
| 2 or 3 Rooms | 0 (0.0%) | 0 (0.0%) |
| 4 or 5 Rooms | 8 (6.0%) | 6 (37.5%) |
| 6 or 7 Rooms | 59 (44.0%) | 6 (37.5%) |
| 8 or more Rooms | 67 (50.0%) | 4 (25.0%) |
| Total | 134 (100.0%) | 16 (100.0%) |
Housing Structure by Heating Type in Druid Hills
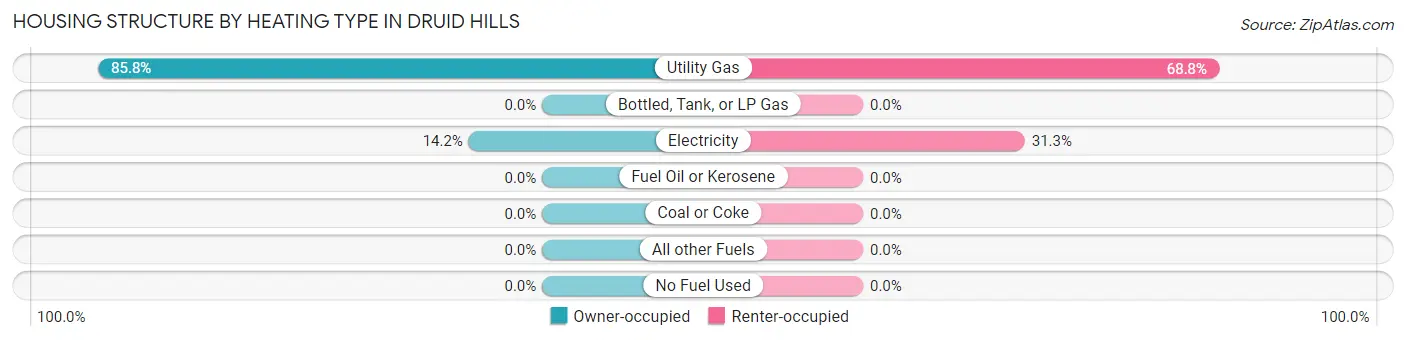
| Heating Type | Owner-occupied | Renter-occupied |
| Utility Gas | 115 (85.8%) | 11 (68.8%) |
| Bottled, Tank, or LP Gas | 0 (0.0%) | 0 (0.0%) |
| Electricity | 19 (14.2%) | 5 (31.2%) |
| Fuel Oil or Kerosene | 0 (0.0%) | 0 (0.0%) |
| Coal or Coke | 0 (0.0%) | 0 (0.0%) |
| All other Fuels | 0 (0.0%) | 0 (0.0%) |
| No Fuel Used | 0 (0.0%) | 0 (0.0%) |
| Total | 134 (100.0%) | 16 (100.0%) |
Household Vehicle Usage in Druid Hills
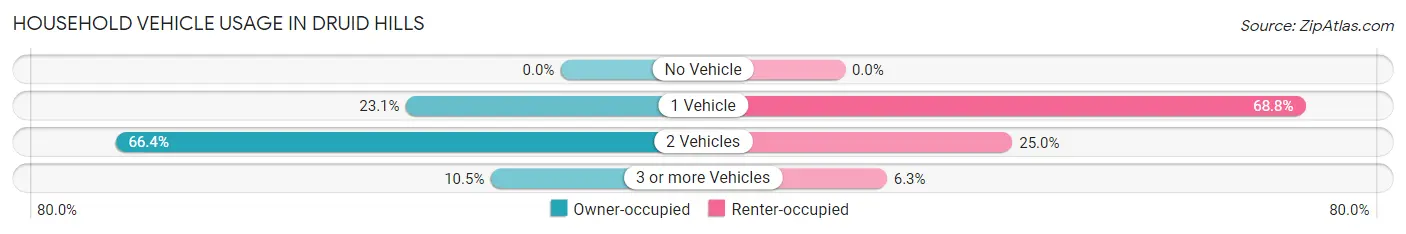
| Vehicles per Household | Owner-occupied | Renter-occupied |
| No Vehicle | 0 (0.0%) | 0 (0.0%) |
| 1 Vehicle | 31 (23.1%) | 11 (68.8%) |
| 2 Vehicles | 89 (66.4%) | 4 (25.0%) |
| 3 or more Vehicles | 14 (10.4%) | 1 (6.2%) |
| Total | 134 (100.0%) | 16 (100.0%) |
Real Estate & Mortgages in Druid Hills
Real Estate and Mortgage Overview in Druid Hills
| Characteristic | Without Mortgage | With Mortgage |
| Housing Units | 40 | 94 |
| Median Property Value | $539,500 | $451,700 |
| Median Household Income | $98,750 | $55 |
| Monthly Housing Costs | $750 | $21 |
| Real Estate Taxes | $3,167 | $0 |
Property Value by Mortgage Status in Druid Hills
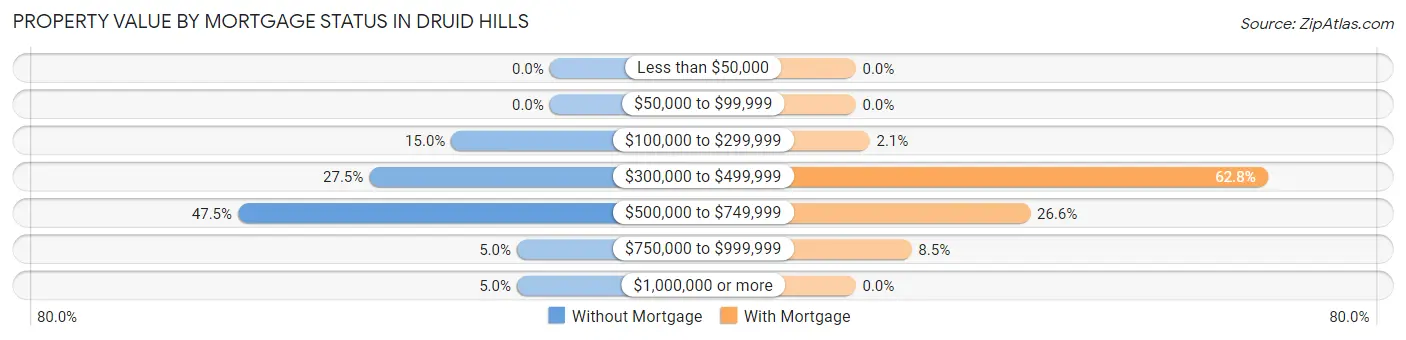
| Property Value | Without Mortgage | With Mortgage |
| Less than $50,000 | 0 (0.0%) | 0 (0.0%) |
| $50,000 to $99,999 | 0 (0.0%) | 0 (0.0%) |
| $100,000 to $299,999 | 6 (15.0%) | 2 (2.1%) |
| $300,000 to $499,999 | 11 (27.5%) | 59 (62.8%) |
| $500,000 to $749,999 | 19 (47.5%) | 25 (26.6%) |
| $750,000 to $999,999 | 2 (5.0%) | 8 (8.5%) |
| $1,000,000 or more | 2 (5.0%) | 0 (0.0%) |
| Total | 40 (100.0%) | 94 (100.0%) |
Household Income by Mortgage Status in Druid Hills
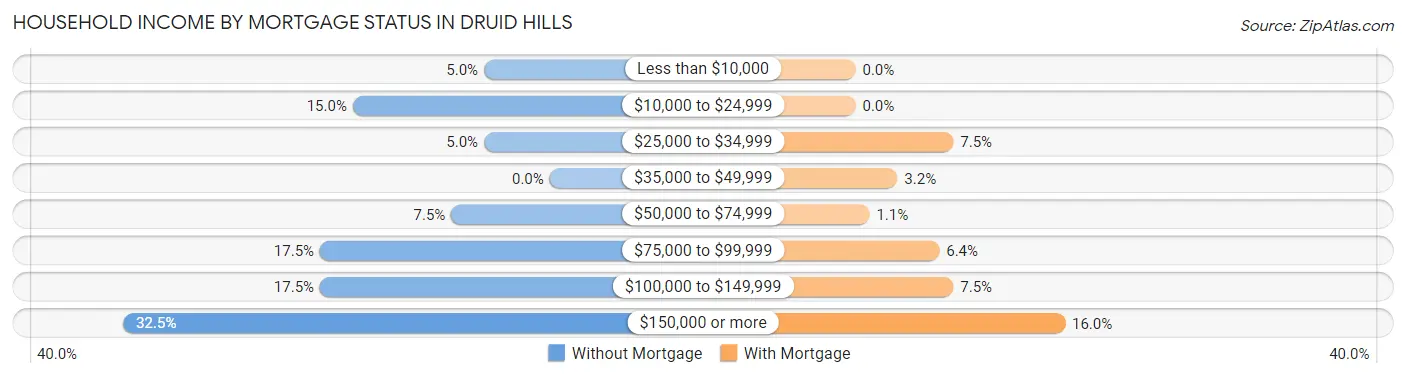
| Household Income | Without Mortgage | With Mortgage |
| Less than $10,000 | 2 (5.0%) | 0 (0.0%) |
| $10,000 to $24,999 | 6 (15.0%) | 0 (0.0%) |
| $25,000 to $34,999 | 2 (5.0%) | 7 (7.4%) |
| $35,000 to $49,999 | 0 (0.0%) | 3 (3.2%) |
| $50,000 to $74,999 | 3 (7.5%) | 1 (1.1%) |
| $75,000 to $99,999 | 7 (17.5%) | 6 (6.4%) |
| $100,000 to $149,999 | 7 (17.5%) | 7 (7.4%) |
| $150,000 or more | 13 (32.5%) | 15 (16.0%) |
| Total | 40 (100.0%) | 94 (100.0%) |
Property Value to Household Income Ratio in Druid Hills
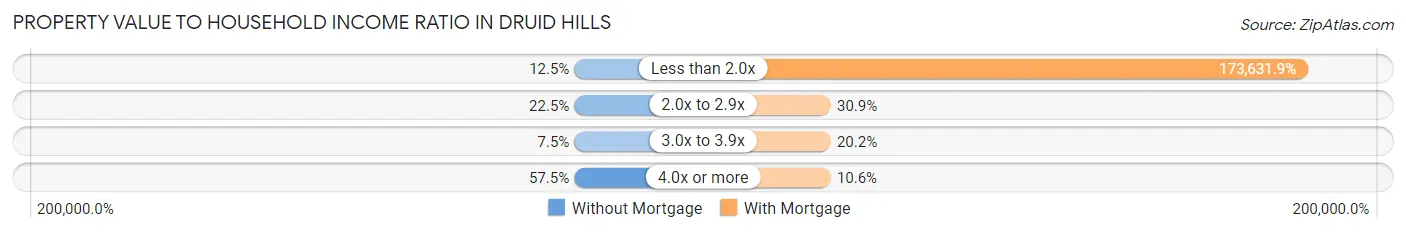
| Value-to-Income Ratio | Without Mortgage | With Mortgage |
| Less than 2.0x | 5 (12.5%) | 163,214 (173,631.9%) |
| 2.0x to 2.9x | 9 (22.5%) | 29 (30.8%) |
| 3.0x to 3.9x | 3 (7.5%) | 19 (20.2%) |
| 4.0x or more | 23 (57.5%) | 10 (10.6%) |
| Total | 40 (100.0%) | 94 (100.0%) |
Real Estate Taxes by Mortgage Status in Druid Hills
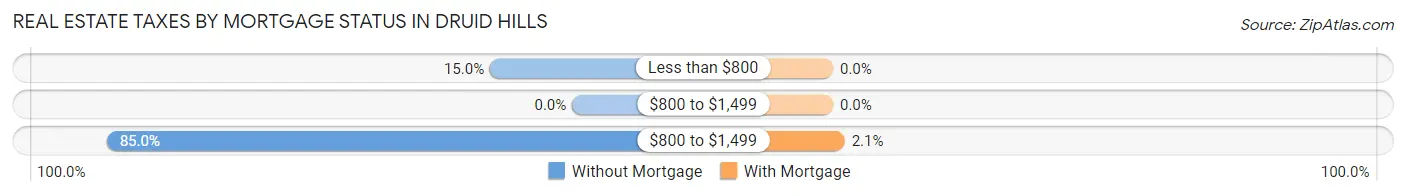
| Property Taxes | Without Mortgage | With Mortgage |
| Less than $800 | 6 (15.0%) | 0 (0.0%) |
| $800 to $1,499 | 0 (0.0%) | 0 (0.0%) |
| $800 to $1,499 | 34 (85.0%) | 2 (2.1%) |
| Total | 40 (100.0%) | 94 (100.0%) |
Health & Disability in Druid Hills
Health Insurance Coverage by Age in Druid Hills
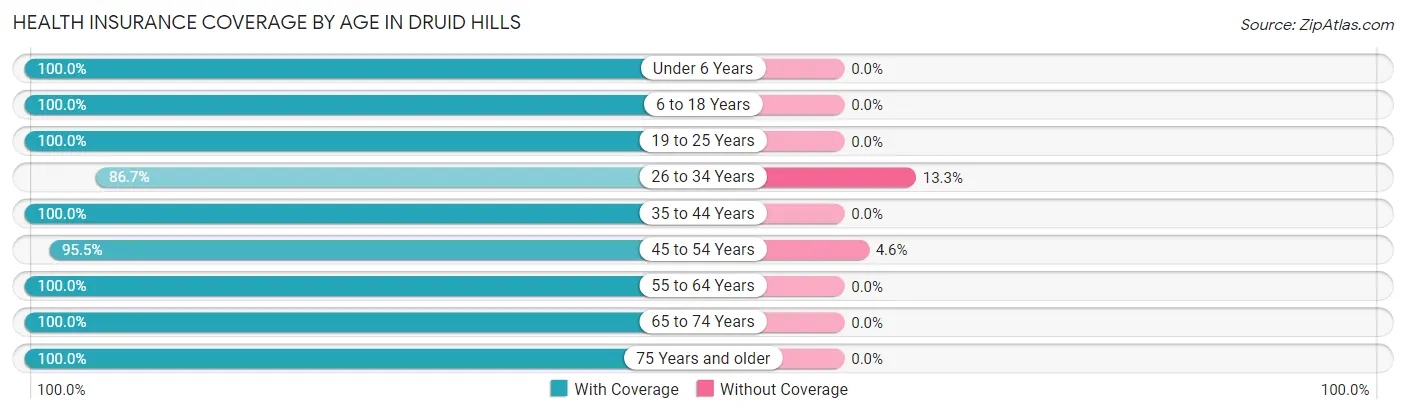
| Age Bracket | With Coverage | Without Coverage |
| Under 6 Years | 17 (100.0%) | 0 (0.0%) |
| 6 to 18 Years | 45 (100.0%) | 0 (0.0%) |
| 19 to 25 Years | 7 (100.0%) | 0 (0.0%) |
| 26 to 34 Years | 26 (86.7%) | 4 (13.3%) |
| 35 to 44 Years | 38 (100.0%) | 0 (0.0%) |
| 45 to 54 Years | 42 (95.5%) | 2 (4.5%) |
| 55 to 64 Years | 56 (100.0%) | 0 (0.0%) |
| 65 to 74 Years | 65 (100.0%) | 0 (0.0%) |
| 75 Years and older | 15 (100.0%) | 0 (0.0%) |
| Total | 311 (98.1%) | 6 (1.9%) |
Health Insurance Coverage by Citizenship Status in Druid Hills
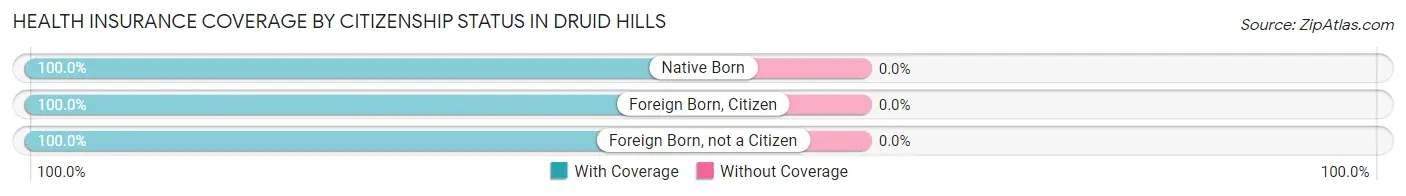
| Citizenship Status | With Coverage | Without Coverage |
| Native Born | 17 (100.0%) | 0 (0.0%) |
| Foreign Born, Citizen | 45 (100.0%) | 0 (0.0%) |
| Foreign Born, not a Citizen | 7 (100.0%) | 0 (0.0%) |
Health Insurance Coverage by Household Income in Druid Hills
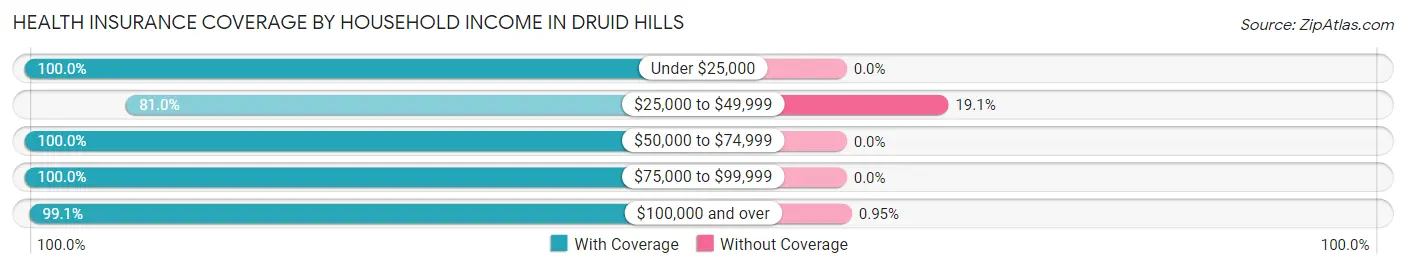
| Household Income | With Coverage | Without Coverage |
| Under $25,000 | 29 (100.0%) | 0 (0.0%) |
| $25,000 to $49,999 | 17 (80.9%) | 4 (19.1%) |
| $50,000 to $74,999 | 20 (100.0%) | 0 (0.0%) |
| $75,000 to $99,999 | 37 (100.0%) | 0 (0.0%) |
| $100,000 and over | 208 (99.1%) | 2 (0.9%) |
Public vs Private Health Insurance Coverage by Age in Druid Hills
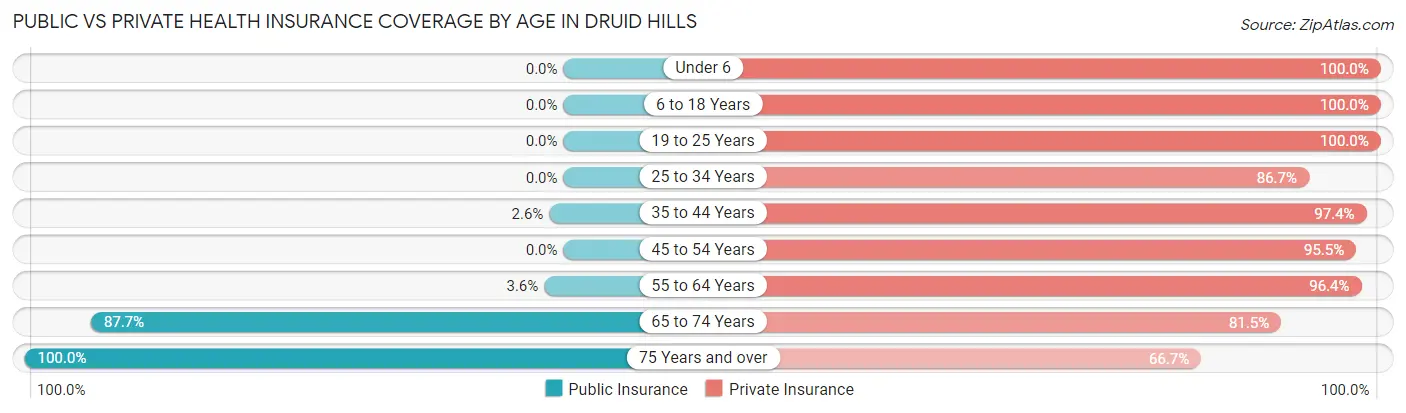
| Age Bracket | Public Insurance | Private Insurance |
| Under 6 | 0 (0.0%) | 17 (100.0%) |
| 6 to 18 Years | 0 (0.0%) | 45 (100.0%) |
| 19 to 25 Years | 0 (0.0%) | 7 (100.0%) |
| 25 to 34 Years | 0 (0.0%) | 26 (86.7%) |
| 35 to 44 Years | 1 (2.6%) | 37 (97.4%) |
| 45 to 54 Years | 0 (0.0%) | 42 (95.5%) |
| 55 to 64 Years | 2 (3.6%) | 54 (96.4%) |
| 65 to 74 Years | 57 (87.7%) | 53 (81.5%) |
| 75 Years and over | 15 (100.0%) | 10 (66.7%) |
| Total | 75 (23.7%) | 291 (91.8%) |
Disability Status by Sex by Age in Druid Hills
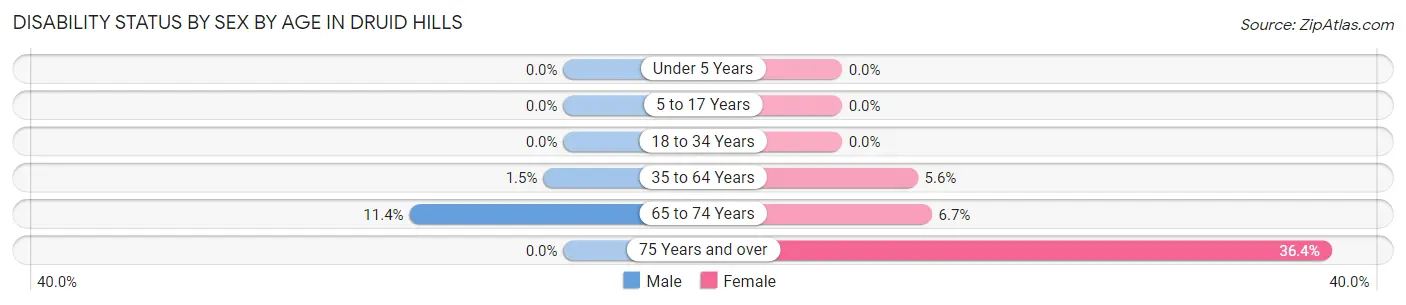
| Age Bracket | Male | Female |
| Under 5 Years | 0 (0.0%) | 0 (0.0%) |
| 5 to 17 Years | 0 (0.0%) | 0 (0.0%) |
| 18 to 34 Years | 0 (0.0%) | 0 (0.0%) |
| 35 to 64 Years | 1 (1.5%) | 4 (5.6%) |
| 65 to 74 Years | 4 (11.4%) | 2 (6.7%) |
| 75 Years and over | 0 (0.0%) | 4 (36.4%) |
Disability Class by Sex by Age in Druid Hills
Disability Class: Hearing Difficulty
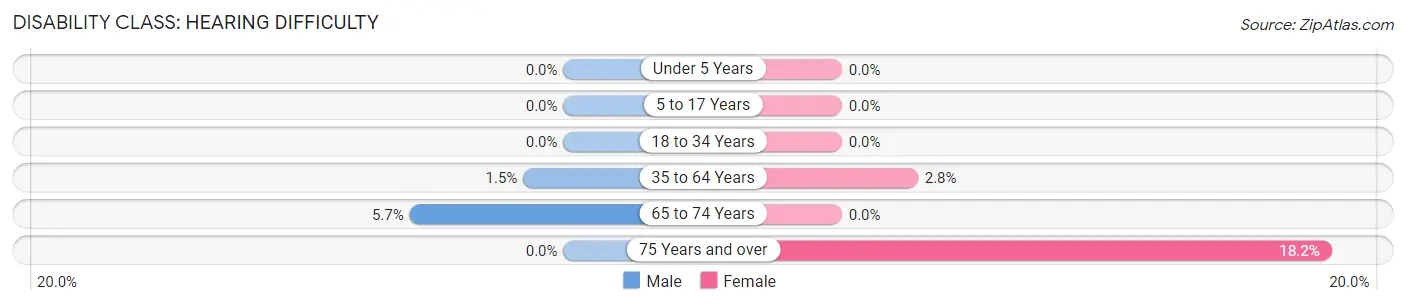
| Age Bracket | Male | Female |
| Under 5 Years | 0 (0.0%) | 0 (0.0%) |
| 5 to 17 Years | 0 (0.0%) | 0 (0.0%) |
| 18 to 34 Years | 0 (0.0%) | 0 (0.0%) |
| 35 to 64 Years | 1 (1.5%) | 2 (2.8%) |
| 65 to 74 Years | 2 (5.7%) | 0 (0.0%) |
| 75 Years and over | 0 (0.0%) | 2 (18.2%) |
Disability Class: Vision Difficulty
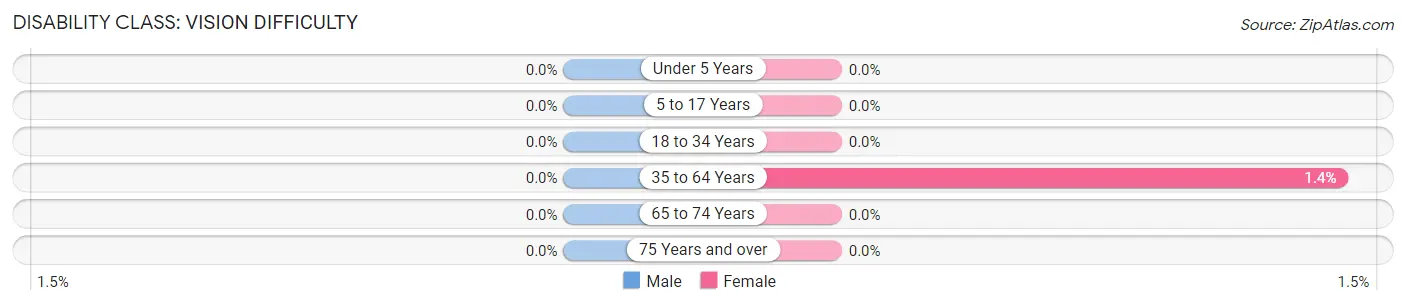
| Age Bracket | Male | Female |
| Under 5 Years | 0 (0.0%) | 0 (0.0%) |
| 5 to 17 Years | 0 (0.0%) | 0 (0.0%) |
| 18 to 34 Years | 0 (0.0%) | 0 (0.0%) |
| 35 to 64 Years | 0 (0.0%) | 1 (1.4%) |
| 65 to 74 Years | 0 (0.0%) | 0 (0.0%) |
| 75 Years and over | 0 (0.0%) | 0 (0.0%) |
Disability Class: Cognitive Difficulty
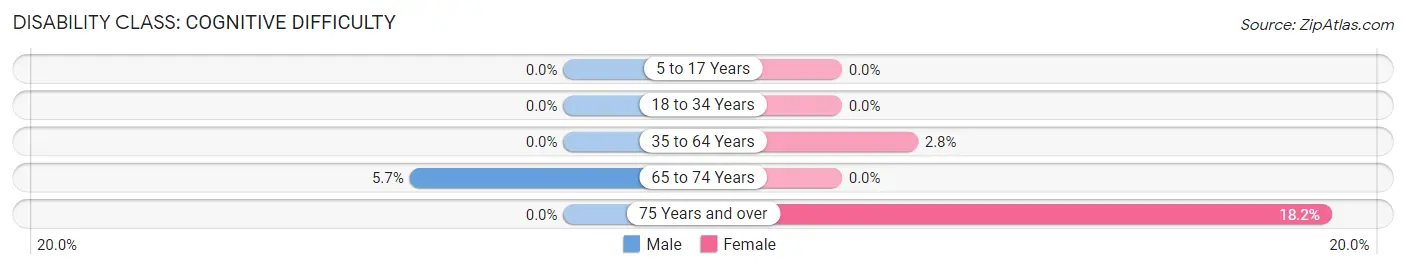
| Age Bracket | Male | Female |
| 5 to 17 Years | 0 (0.0%) | 0 (0.0%) |
| 18 to 34 Years | 0 (0.0%) | 0 (0.0%) |
| 35 to 64 Years | 0 (0.0%) | 2 (2.8%) |
| 65 to 74 Years | 2 (5.7%) | 0 (0.0%) |
| 75 Years and over | 0 (0.0%) | 2 (18.2%) |
Disability Class: Ambulatory Difficulty
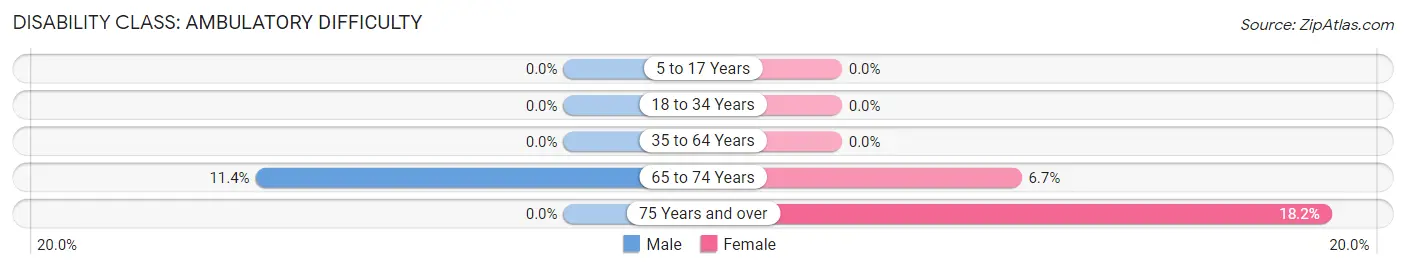
| Age Bracket | Male | Female |
| 5 to 17 Years | 0 (0.0%) | 0 (0.0%) |
| 18 to 34 Years | 0 (0.0%) | 0 (0.0%) |
| 35 to 64 Years | 0 (0.0%) | 0 (0.0%) |
| 65 to 74 Years | 4 (11.4%) | 2 (6.7%) |
| 75 Years and over | 0 (0.0%) | 2 (18.2%) |
Disability Class: Self-Care Difficulty
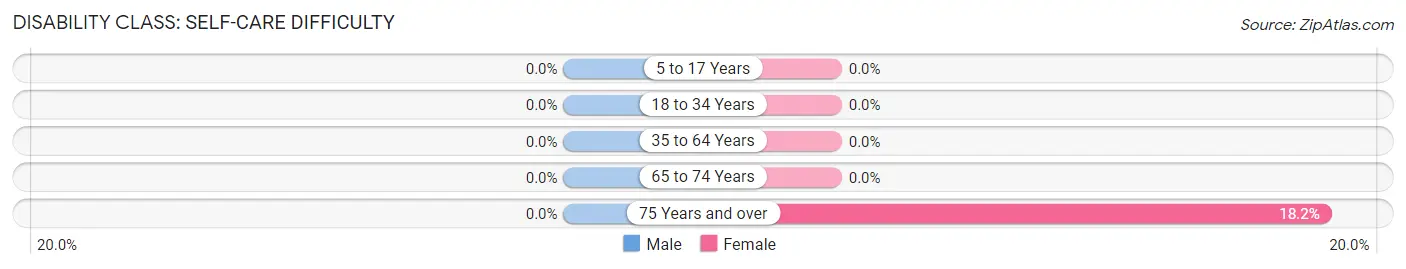
| Age Bracket | Male | Female |
| 5 to 17 Years | 0 (0.0%) | 0 (0.0%) |
| 18 to 34 Years | 0 (0.0%) | 0 (0.0%) |
| 35 to 64 Years | 0 (0.0%) | 0 (0.0%) |
| 65 to 74 Years | 0 (0.0%) | 0 (0.0%) |
| 75 Years and over | 0 (0.0%) | 2 (18.2%) |
Technology Access in Druid Hills
Computing Device Access in Druid Hills
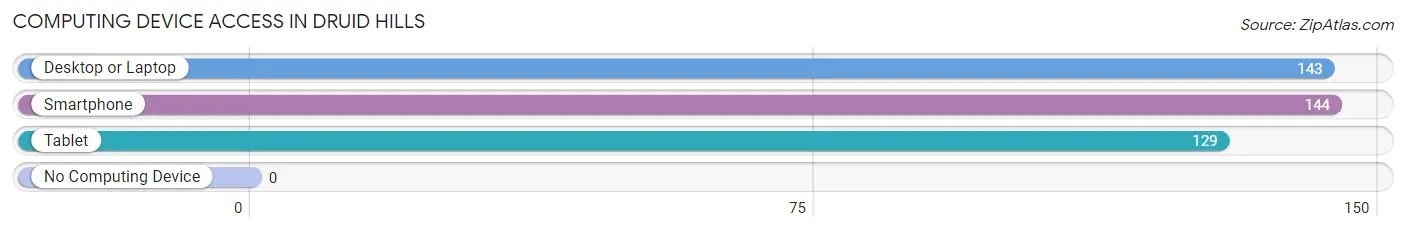
| Device Type | # Households | % Households |
| Desktop or Laptop | 143 | 95.3% |
| Smartphone | 144 | 96.0% |
| Tablet | 129 | 86.0% |
| No Computing Device | 0 | 0.0% |
| Total | 150 | 100.0% |
Internet Access in Druid Hills
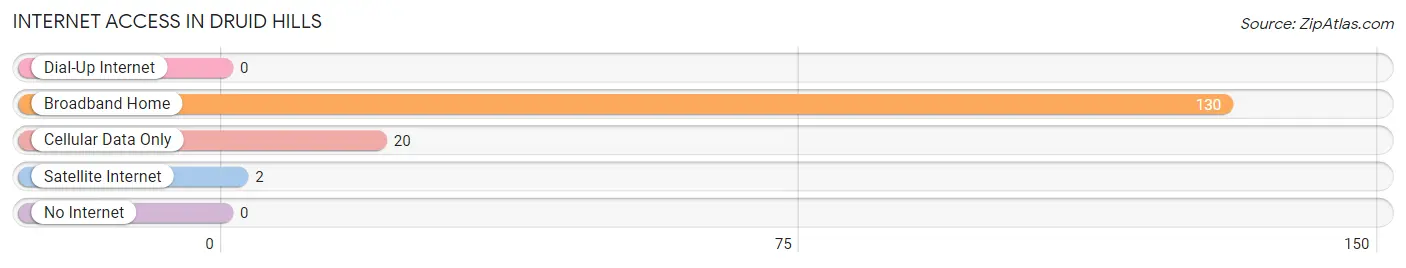
| Internet Type | # Households | % Households |
| Dial-Up Internet | 0 | 0.0% |
| Broadband Home | 130 | 86.7% |
| Cellular Data Only | 20 | 13.3% |
| Satellite Internet | 2 | 1.3% |
| No Internet | 0 | 0.0% |
| Total | 150 | 100.0% |
Druid Hills Summary
Druid Hills is a small unincorporated community located in the state of Kentucky, in the United States. It is situated in the southeastern part of the state, in the foothills of the Appalachian Mountains. The community is located in the county of Harlan, and is part of the Harlan Micropolitan Statistical Area.
History
The area that is now known as Druid Hills was first settled in the early 1800s by a group of settlers from Scotland. The settlers named the area after the druids, an ancient Celtic religious order. The area was originally used for farming and logging, and the settlers built a small church and school.
In the late 1800s, the area began to develop into a small community. A post office was established in 1891, and the community was officially incorporated in 1895. The town was named after the druids, and the name was changed to Druid Hills in 1901.
The town grew slowly over the next few decades, and by the mid-1900s it had become a small rural community. The town was home to a few small businesses, including a general store, a blacksmith shop, and a sawmill.
Geography
Druid Hills is located in the southeastern part of the state of Kentucky, in the foothills of the Appalachian Mountains. The community is situated in the county of Harlan, and is part of the Harlan Micropolitan Statistical Area.
The town is located at an elevation of 1,000 feet above sea level, and is surrounded by rolling hills and forests. The area is known for its scenic beauty, and is home to a variety of wildlife, including deer, wild turkeys, and black bears.
The climate in Druid Hills is humid subtropical, with hot summers and mild winters. The average annual temperature is around 60 degrees Fahrenheit, and the average annual precipitation is around 45 inches.
Economy
The economy of Druid Hills is largely based on agriculture and forestry. The area is home to several small farms, and the town is also home to a sawmill and a lumber company.
The town is also home to a few small businesses, including a general store, a blacksmith shop, and a few restaurants. The town is also home to a few small manufacturing companies, including a furniture factory and a metal fabrication shop.
Demographics
As of the 2010 census, the population of Druid Hills was 1,093. The racial makeup of the town was 97.3% White, 0.9% African American, 0.2% Native American, 0.2% Asian, 0.1% Pacific Islander, and 0.3% from other races.
The median household income in Druid Hills was $30,938, and the median family income was $37,813. The per capita income was $15,945. About 17.2% of the population was below the poverty line.
Common Questions
What is Per Capita Income in Druid Hills?
Per Capita income in Druid Hills is $75,340.
What is the Median Family Income in Druid Hills?
Median Family Income in Druid Hills is $163,036.
What is the Median Household income in Druid Hills?
Median Household Income in Druid Hills is $141,250.
What is Income or Wage Gap in Druid Hills?
Income or Wage Gap in Druid Hills is 39.7%.
Women in Druid Hills earn 60.3 cents for every dollar earned by a man.
What is Inequality or Gini Index in Druid Hills?
Inequality or Gini Index in Druid Hills is 0.40.
What is the Total Population of Druid Hills?
Total Population of Druid Hills is 317.
What is the Total Male Population of Druid Hills?
Total Male Population of Druid Hills is 162.
What is the Total Female Population of Druid Hills?
Total Female Population of Druid Hills is 155.
What is the Ratio of Males per 100 Females in Druid Hills?
There are 104.52 Males per 100 Females in Druid Hills.
What is the Ratio of Females per 100 Males in Druid Hills?
There are 95.68 Females per 100 Males in Druid Hills.
What is the Median Population Age in Druid Hills?
Median Population Age in Druid Hills is 49.5 Years.
What is the Average Family Size in Druid Hills
Average Family Size in Druid Hills is 2.5 People.
What is the Average Household Size in Druid Hills
Average Household Size in Druid Hills is 2.1 People.
How Large is the Labor Force in Druid Hills?
There are 179 People in the Labor Forcein in Druid Hills.
What is the Percentage of People in the Labor Force in Druid Hills?
67.5% of People are in the Labor Force in Druid Hills.
What is the Unemployment Rate in Druid Hills?
Unemployment Rate in Druid Hills is 3.4%.