Scottsville, KY Map & Demographics
Scottsville Map
Scottsville Overview
$24,319
PER CAPITA INCOME
$42,094
AVG FAMILY INCOME
$34,835
AVG HOUSEHOLD INCOME
37.7%
WAGE / INCOME GAP [ % ]
62.3¢/ $1
WAGE / INCOME GAP [ $ ]
0.50
INEQUALITY / GINI INDEX
4,332
TOTAL POPULATION
1,988
MALE POPULATION
2,344
FEMALE POPULATION
84.81
MALES / 100 FEMALES
117.91
FEMALES / 100 MALES
36.1
MEDIAN AGE
2.9
AVG FAMILY SIZE
2.5
AVG HOUSEHOLD SIZE
1,965
LABOR FORCE [ PEOPLE ]
60.0%
PERCENT IN LABOR FORCE
16.2%
UNEMPLOYMENT RATE
Scottsville Zip Codes
Scottsville Area Codes
Income in Scottsville
Income Overview in Scottsville
Per Capita Income in Scottsville is $24,319, while median incomes of families and households are $42,094 and $34,835 respectively.
| Characteristic | Number | Measure |
| Per Capita Income | 4,332 | $24,319 |
| Median Family Income | 1,201 | $42,094 |
| Mean Family Income | 1,201 | $66,645 |
| Median Household Income | 1,738 | $34,835 |
| Mean Household Income | 1,738 | $55,749 |
| Income Deficit | 1,201 | $0 |
| Wage / Income Gap (%) | 4,332 | 37.71% |
| Wage / Income Gap ($) | 4,332 | 62.29¢ per $1 |
| Gini / Inequality Index | 4,332 | 0.50 |
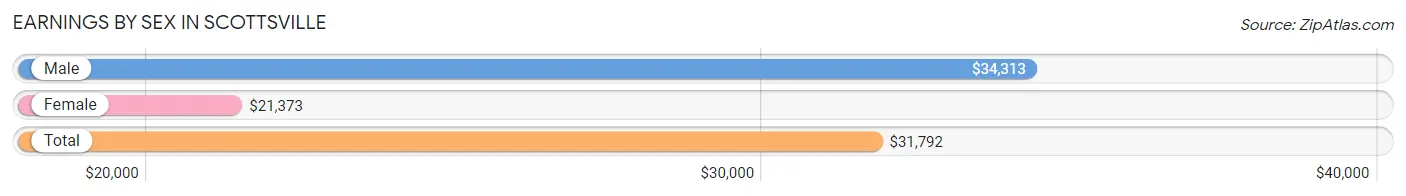
Earnings by Sex in Scottsville
Average Earnings in Scottsville are $31,792, $34,313 for men and $21,373 for women, a difference of 37.7%.
| Sex | Number | Average Earnings |
| Male | 1,004 (52.8%) | $34,313 |
| Female | 898 (47.2%) | $21,373 |
| Total | 1,902 (100.0%) | $31,792 |
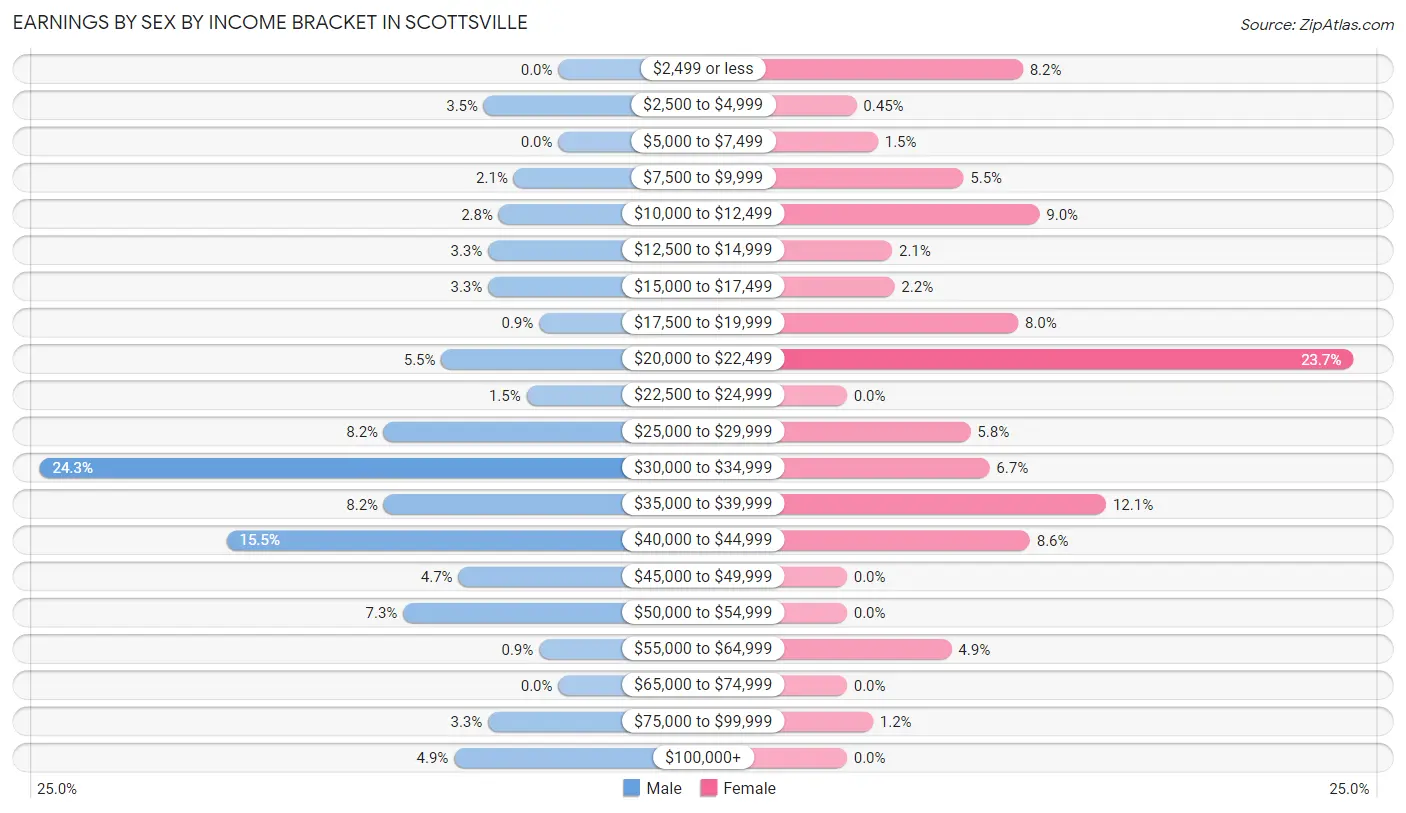
Earnings by Sex by Income Bracket in Scottsville
The most common earnings brackets in Scottsville are $30,000 to $34,999 for men (244 | 24.3%) and $20,000 to $22,499 for women (213 | 23.7%).
| Income | Male | Female |
| $2,499 or less | 0 (0.0%) | 74 (8.2%) |
| $2,500 to $4,999 | 35 (3.5%) | 4 (0.4%) |
| $5,000 to $7,499 | 0 (0.0%) | 13 (1.5%) |
| $7,500 to $9,999 | 21 (2.1%) | 49 (5.5%) |
| $10,000 to $12,499 | 28 (2.8%) | 81 (9.0%) |
| $12,500 to $14,999 | 33 (3.3%) | 19 (2.1%) |
| $15,000 to $17,499 | 33 (3.3%) | 20 (2.2%) |
| $17,500 to $19,999 | 9 (0.9%) | 72 (8.0%) |
| $20,000 to $22,499 | 55 (5.5%) | 213 (23.7%) |
| $22,500 to $24,999 | 15 (1.5%) | 0 (0.0%) |
| $25,000 to $29,999 | 82 (8.2%) | 52 (5.8%) |
| $30,000 to $34,999 | 244 (24.3%) | 60 (6.7%) |
| $35,000 to $39,999 | 82 (8.2%) | 109 (12.1%) |
| $40,000 to $44,999 | 156 (15.5%) | 77 (8.6%) |
| $45,000 to $49,999 | 47 (4.7%) | 0 (0.0%) |
| $50,000 to $54,999 | 73 (7.3%) | 0 (0.0%) |
| $55,000 to $64,999 | 9 (0.9%) | 44 (4.9%) |
| $65,000 to $74,999 | 0 (0.0%) | 0 (0.0%) |
| $75,000 to $99,999 | 33 (3.3%) | 11 (1.2%) |
| $100,000+ | 49 (4.9%) | 0 (0.0%) |
| Total | 1,004 (100.0%) | 898 (100.0%) |
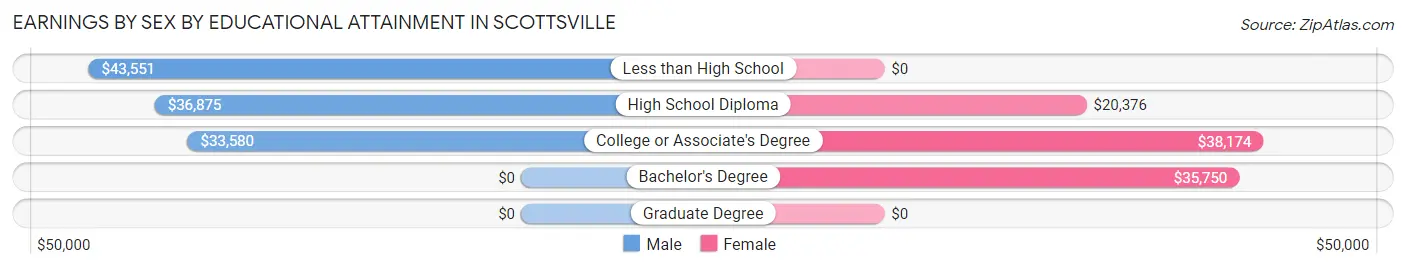
Earnings by Sex by Educational Attainment in Scottsville
Average earnings in Scottsville are $34,751 for men and $21,626 for women, a difference of 37.8%. Men with an educational attainment of less than high school enjoy the highest average annual earnings of $43,551, while those with college or associate's degree education earn the least with $33,580. Women with an educational attainment of college or associate's degree earn the most with the average annual earnings of $38,174, while those with high school diploma education have the smallest earnings of $20,376.
| Educational Attainment | Male Income | Female Income |
| Less than High School | $43,551 | $0 |
| High School Diploma | $36,875 | $20,376 |
| College or Associate's Degree | $33,580 | $38,174 |
| Bachelor's Degree | - | - |
| Graduate Degree | - | - |
| Total | $34,751 | $21,626 |
Family Income in Scottsville
Family Income Brackets in Scottsville
According to the Scottsville family income data, there are 213 families falling into the $25,000 to $34,999 income range, which is the most common income bracket and makes up 17.7% of all families. Conversely, the $10,000 to $14,999 income bracket is the least frequent group with only 6 families (0.5%) belonging to this category.
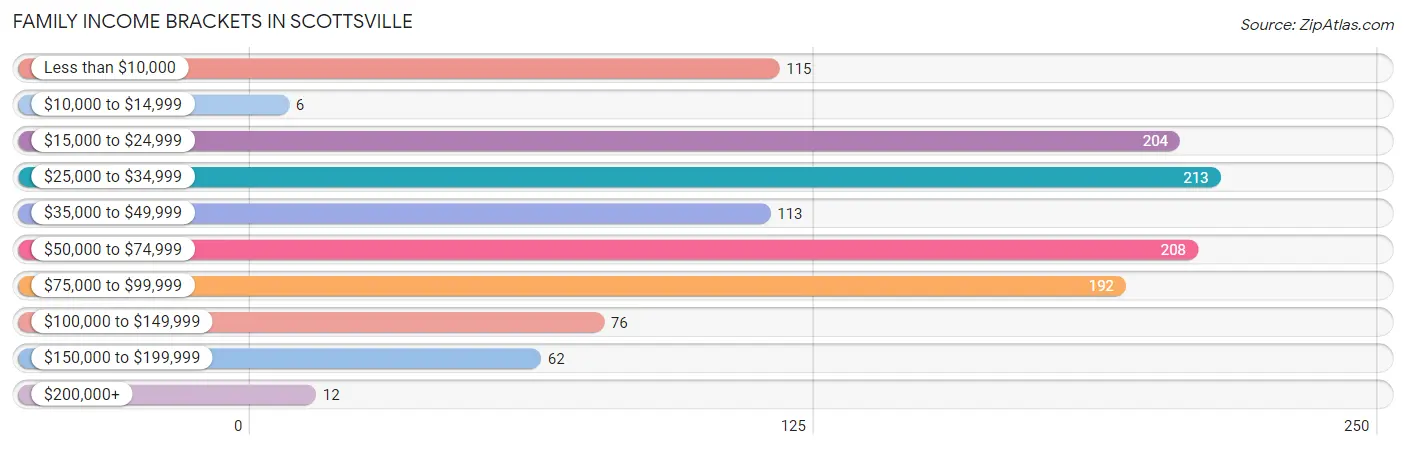
| Income Bracket | # Families | % Families |
| Less than $10,000 | 115 | 9.6% |
| $10,000 to $14,999 | 6 | 0.5% |
| $15,000 to $24,999 | 204 | 17.0% |
| $25,000 to $34,999 | 213 | 17.7% |
| $35,000 to $49,999 | 113 | 9.4% |
| $50,000 to $74,999 | 208 | 17.3% |
| $75,000 to $99,999 | 192 | 16.0% |
| $100,000 to $149,999 | 76 | 6.3% |
| $150,000 to $199,999 | 62 | 5.2% |
| $200,000+ | 12 | 1.0% |
Family Income by Famaliy Size in Scottsville
5-person families (100 | 8.3%) account for the highest median family income in Scottsville with $87,045 per family, while 2-person families (545 | 45.4%) have the highest median income of $35,247 per family member.
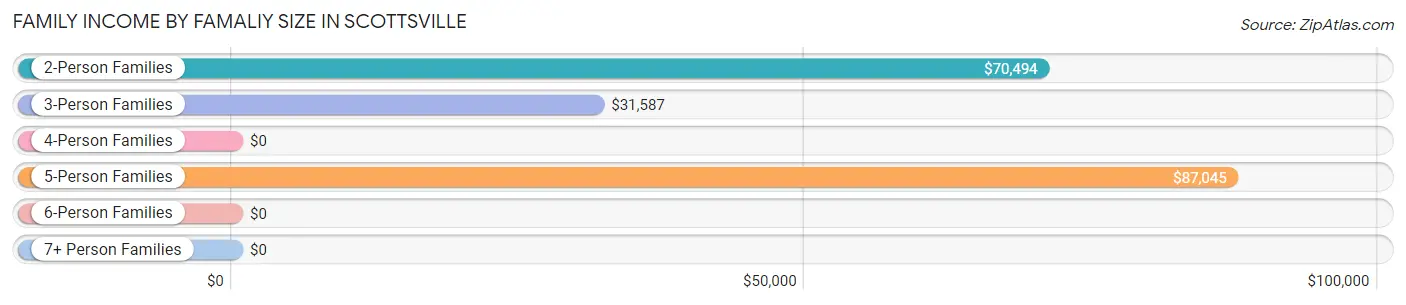
| Income Bracket | # Families | Median Income |
| 2-Person Families | 545 (45.4%) | $70,494 |
| 3-Person Families | 348 (29.0%) | $31,587 |
| 4-Person Families | 208 (17.3%) | $0 |
| 5-Person Families | 100 (8.3%) | $87,045 |
| 6-Person Families | 0 (0.0%) | $0 |
| 7+ Person Families | 0 (0.0%) | $0 |
| Total | 1,201 (100.0%) | $42,094 |
Family Income by Number of Earners in Scottsville
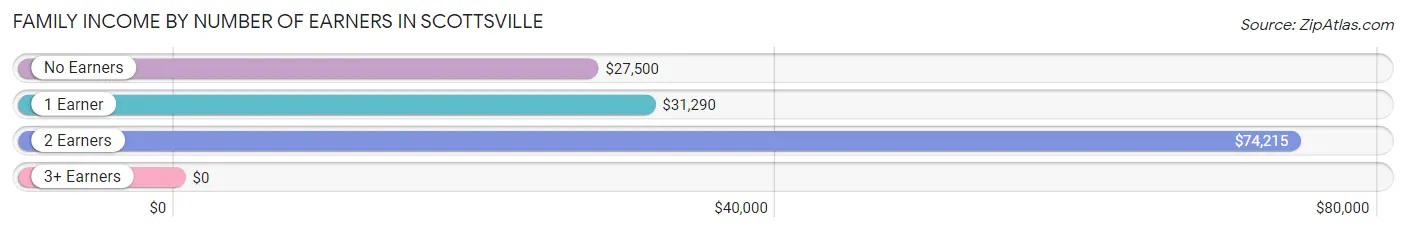
| Number of Earners | # Families | Median Income |
| No Earners | 188 (15.7%) | $27,500 |
| 1 Earner | 621 (51.7%) | $31,290 |
| 2 Earners | 381 (31.7%) | $74,215 |
| 3+ Earners | 11 (0.9%) | $0 |
| Total | 1,201 (100.0%) | $42,094 |
Household Income in Scottsville
Household Income Brackets in Scottsville
With 315 households falling in the category, the $25,000 to $34,999 income range is the most frequent in Scottsville, accounting for 18.1% of all households. In contrast, only 12 households (0.7%) fall into the $200,000+ income bracket, making it the least populous group.
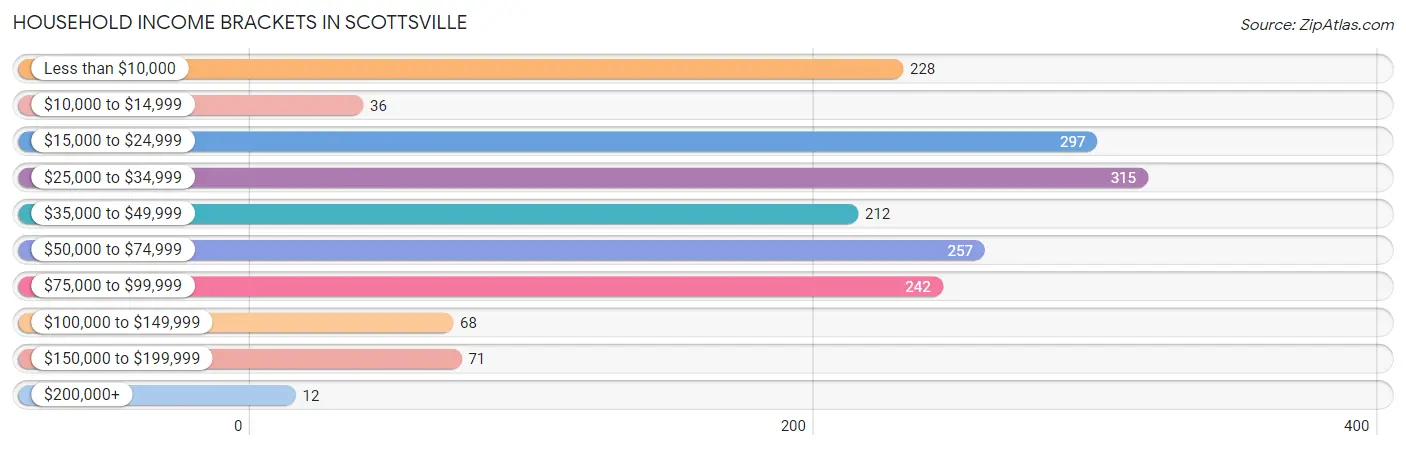
| Income Bracket | # Households | % Households |
| Less than $10,000 | 228 | 13.1% |
| $10,000 to $14,999 | 36 | 2.1% |
| $15,000 to $24,999 | 297 | 17.1% |
| $25,000 to $34,999 | 315 | 18.1% |
| $35,000 to $49,999 | 212 | 12.2% |
| $50,000 to $74,999 | 257 | 14.8% |
| $75,000 to $99,999 | 242 | 13.9% |
| $100,000 to $149,999 | 68 | 3.9% |
| $150,000 to $199,999 | 71 | 4.1% |
| $200,000+ | 12 | 0.7% |
Household Income by Householder Age in Scottsville
The median household income in Scottsville is $34,835, with the highest median household income of $35,938 found in the 45 to 64 years age bracket for the primary householder. A total of 505 households (29.1%) fall into this category. Meanwhile, the 15 to 24 years age bracket for the primary householder has the lowest median household income of $0, with 139 households (8.0%) in this group.
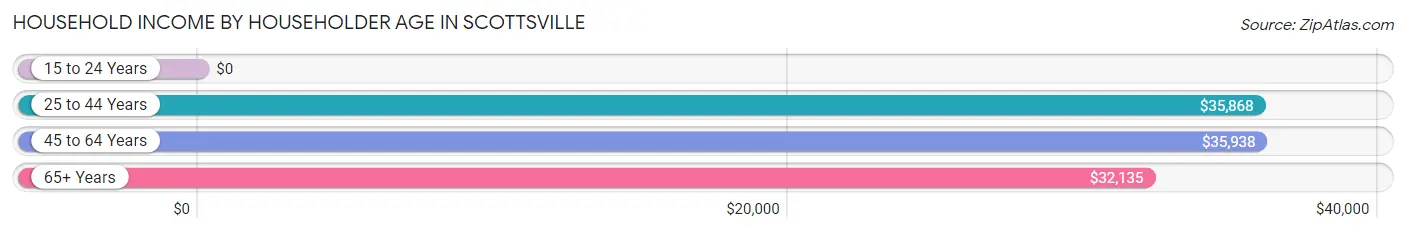
| Income Bracket | # Households | Median Income |
| 15 to 24 Years | 139 (8.0%) | $0 |
| 25 to 44 Years | 675 (38.8%) | $35,868 |
| 45 to 64 Years | 505 (29.1%) | $35,938 |
| 65+ Years | 419 (24.1%) | $32,135 |
| Total | 1,738 (100.0%) | $34,835 |
Poverty in Scottsville
Income Below Poverty by Sex and Age in Scottsville
With 23.5% poverty level for males and 37.3% for females among the residents of Scottsville, 16 and 17 year old males and 15 year old females are the most vulnerable to poverty, with 79 males (100.0%) and 11 females (100.0%) in their respective age groups living below the poverty level.
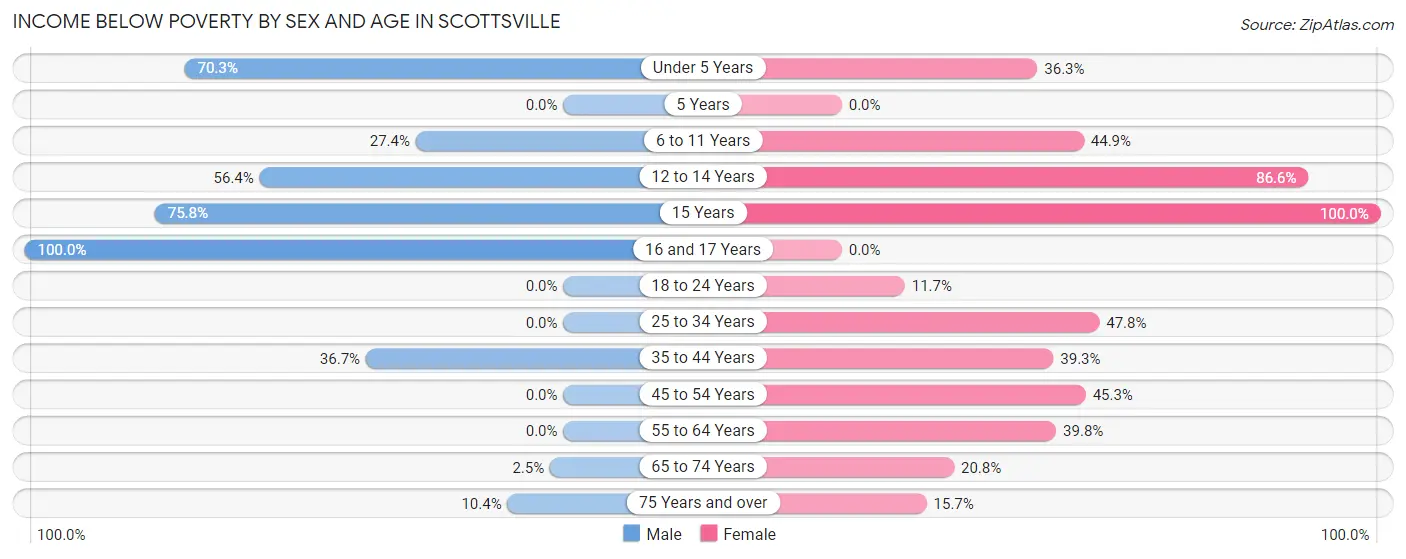
| Age Bracket | Male | Female |
| Under 5 Years | 45 (70.3%) | 53 (36.3%) |
| 5 Years | 0 (0.0%) | 0 (0.0%) |
| 6 to 11 Years | 43 (27.4%) | 93 (44.9%) |
| 12 to 14 Years | 53 (56.4%) | 129 (86.6%) |
| 15 Years | 91 (75.8%) | 11 (100.0%) |
| 16 and 17 Years | 79 (100.0%) | 0 (0.0%) |
| 18 to 24 Years | 0 (0.0%) | 27 (11.7%) |
| 25 to 34 Years | 0 (0.0%) | 141 (47.8%) |
| 35 to 44 Years | 118 (36.6%) | 139 (39.3%) |
| 45 to 54 Years | 0 (0.0%) | 67 (45.3%) |
| 55 to 64 Years | 0 (0.0%) | 115 (39.8%) |
| 65 to 74 Years | 6 (2.5%) | 45 (20.8%) |
| 75 Years and over | 14 (10.4%) | 34 (15.7%) |
| Total | 449 (23.5%) | 854 (37.3%) |
Income Above Poverty by Sex and Age in Scottsville
According to the poverty statistics in Scottsville, males aged 5 years and females aged 5 years are the age groups that are most secure financially, with 100.0% of males and 100.0% of females in these age groups living above the poverty line.
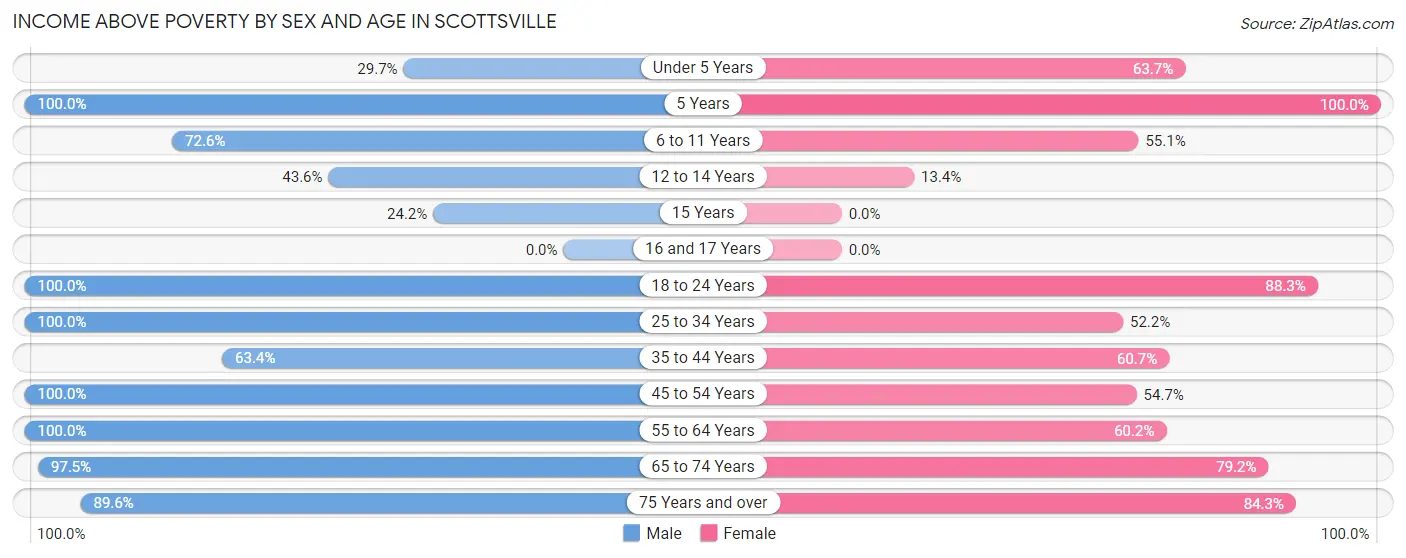
| Age Bracket | Male | Female |
| Under 5 Years | 19 (29.7%) | 93 (63.7%) |
| 5 Years | 11 (100.0%) | 29 (100.0%) |
| 6 to 11 Years | 114 (72.6%) | 114 (55.1%) |
| 12 to 14 Years | 41 (43.6%) | 20 (13.4%) |
| 15 Years | 29 (24.2%) | 0 (0.0%) |
| 16 and 17 Years | 0 (0.0%) | 0 (0.0%) |
| 18 to 24 Years | 192 (100.0%) | 204 (88.3%) |
| 25 to 34 Years | 176 (100.0%) | 154 (52.2%) |
| 35 to 44 Years | 204 (63.3%) | 215 (60.7%) |
| 45 to 54 Years | 130 (100.0%) | 81 (54.7%) |
| 55 to 64 Years | 191 (100.0%) | 174 (60.2%) |
| 65 to 74 Years | 237 (97.5%) | 171 (79.2%) |
| 75 Years and over | 121 (89.6%) | 182 (84.3%) |
| Total | 1,465 (76.5%) | 1,437 (62.7%) |
Income Below Poverty Among Married-Couple Families in Scottsville
The poverty statistics for married-couple families in Scottsville show that 15.6% or 101 of the total 646 families live below the poverty line. Families with 1 or 2 children have the highest poverty rate of 50.0%, comprising of 101 families. On the other hand, families with no children have the lowest poverty rate of 0.0%, which includes 0 families.
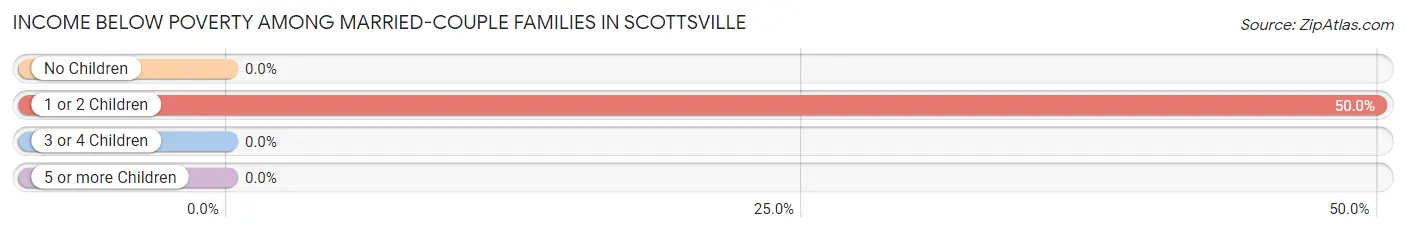
| Children | Above Poverty | Below Poverty |
| No Children | 358 (100.0%) | 0 (0.0%) |
| 1 or 2 Children | 101 (50.0%) | 101 (50.0%) |
| 3 or 4 Children | 86 (100.0%) | 0 (0.0%) |
| 5 or more Children | 0 (0.0%) | 0 (0.0%) |
| Total | 545 (84.4%) | 101 (15.6%) |
Income Below Poverty Among Single-Parent Households in Scottsville
According to the poverty data in Scottsville, 7.8% or 20 single-father households and 52.3% or 157 single-mother households are living below the poverty line. Among single-father households, those with 3 or 4 children have the highest poverty rate, with 14 households (100.0%) experiencing poverty. Likewise, among single-mother households, those with 1 or 2 children have the highest poverty rate, with 157 households (54.9%) falling below the poverty line.
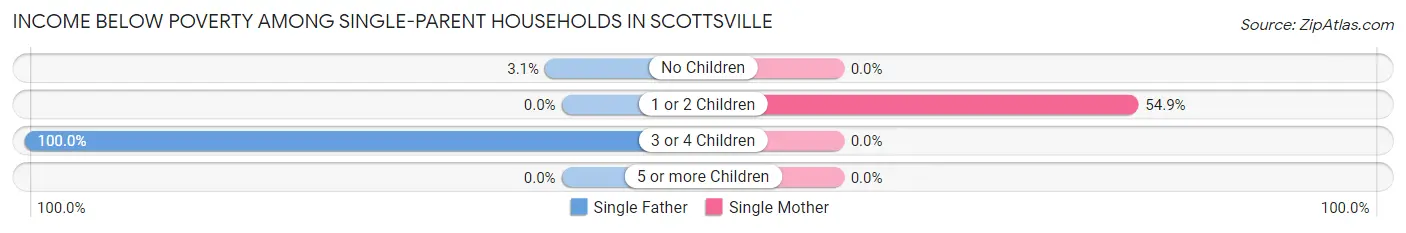
| Children | Single Father | Single Mother |
| No Children | 6 (3.1%) | 0 (0.0%) |
| 1 or 2 Children | 0 (0.0%) | 157 (54.9%) |
| 3 or 4 Children | 14 (100.0%) | 0 (0.0%) |
| 5 or more Children | 0 (0.0%) | 0 (0.0%) |
| Total | 20 (7.8%) | 157 (52.3%) |
Income Below Poverty Among Married-Couple vs Single-Parent Households in Scottsville
The poverty data for Scottsville shows that 101 of the married-couple family households (15.6%) and 177 of the single-parent households (31.9%) are living below the poverty level. Within the married-couple family households, those with 1 or 2 children have the highest poverty rate, with 101 households (50.0%) falling below the poverty line. Among the single-parent households, those with 3 or 4 children have the highest poverty rate, with 14 household (100.0%) living below poverty.
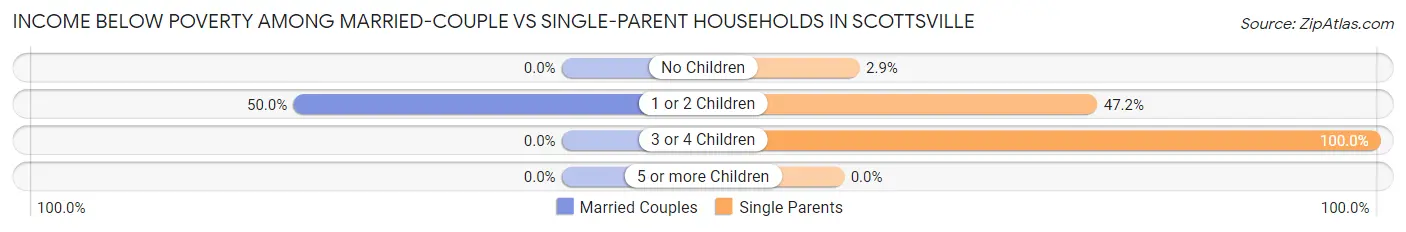
| Children | Married-Couple Families | Single-Parent Households |
| No Children | 0 (0.0%) | 6 (2.9%) |
| 1 or 2 Children | 101 (50.0%) | 157 (47.1%) |
| 3 or 4 Children | 0 (0.0%) | 14 (100.0%) |
| 5 or more Children | 0 (0.0%) | 0 (0.0%) |
| Total | 101 (15.6%) | 177 (31.9%) |
Race in Scottsville
The most populous races in Scottsville are White / Caucasian (4,019 | 92.8%), Two or more Races (172 | 4.0%), and Black / African American (139 | 3.2%).
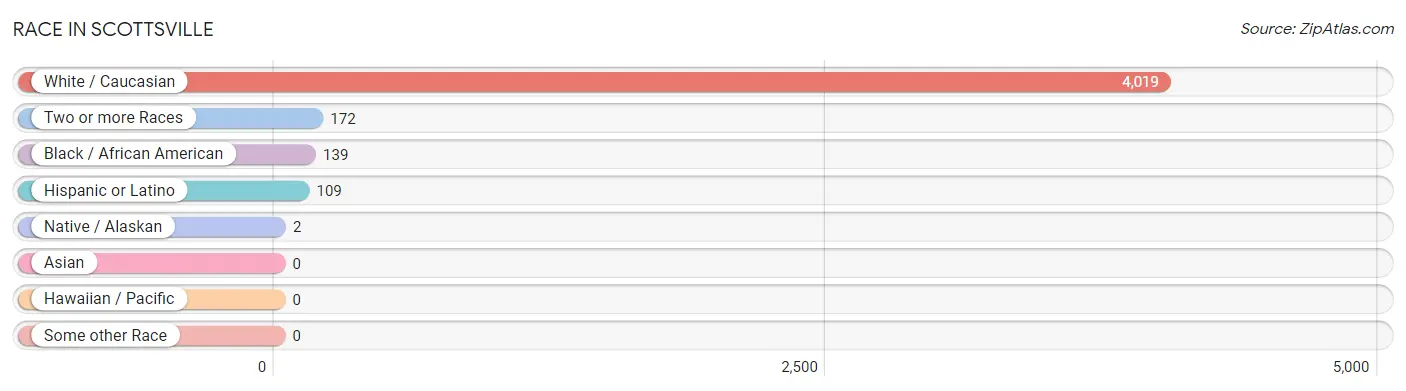
| Race | # Population | % Population |
| Asian | 0 | 0.0% |
| Black / African American | 139 | 3.2% |
| Hawaiian / Pacific | 0 | 0.0% |
| Hispanic or Latino | 109 | 2.5% |
| Native / Alaskan | 2 | 0.1% |
| White / Caucasian | 4,019 | 92.8% |
| Two or more Races | 172 | 4.0% |
| Some other Race | 0 | 0.0% |
| Total | 4,332 | 100.0% |
Ancestry in Scottsville
The most populous ancestries reported in Scottsville are American (654 | 15.1%), Irish (378 | 8.7%), English (259 | 6.0%), Russian (215 | 5.0%), and German (207 | 4.8%), together accounting for 39.6% of all Scottsville residents.
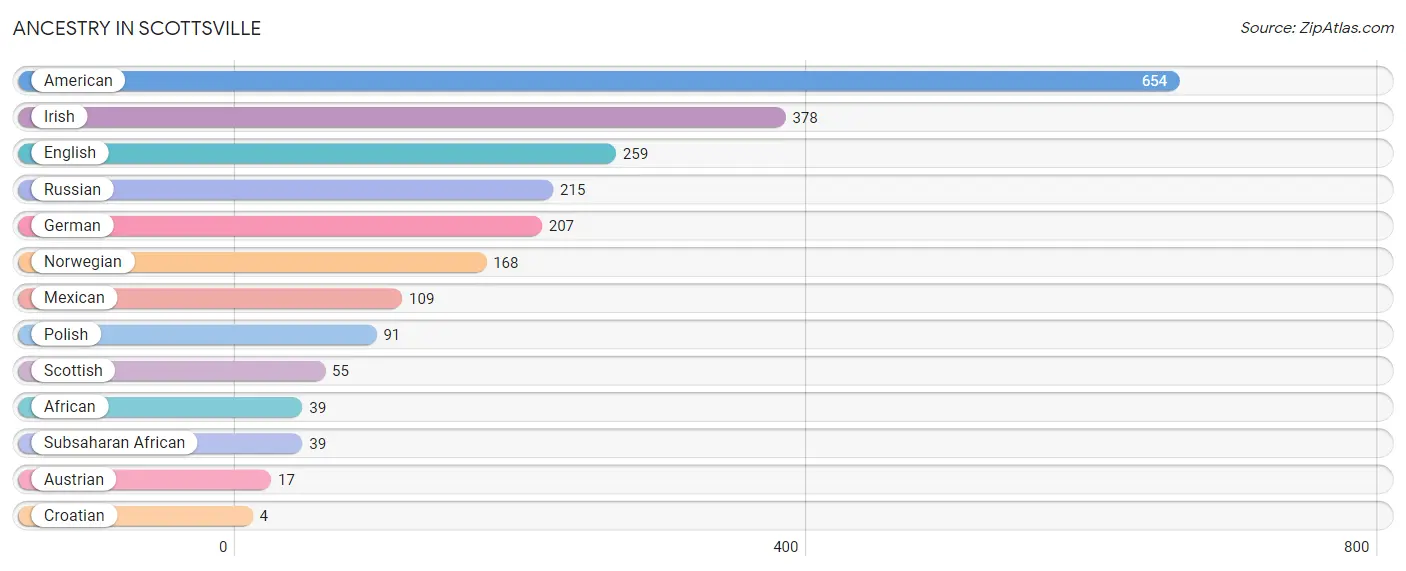
| Ancestry | # Population | % Population |
| African | 39 | 0.9% |
| American | 654 | 15.1% |
| Austrian | 17 | 0.4% |
| Croatian | 4 | 0.1% |
| English | 259 | 6.0% |
| German | 207 | 4.8% |
| Irish | 378 | 8.7% |
| Mexican | 109 | 2.5% |
| Norwegian | 168 | 3.9% |
| Polish | 91 | 2.1% |
| Russian | 215 | 5.0% |
| Scottish | 55 | 1.3% |
| Subsaharan African | 39 | 0.9% | View All 13 Rows |
Immigrants in Scottsville
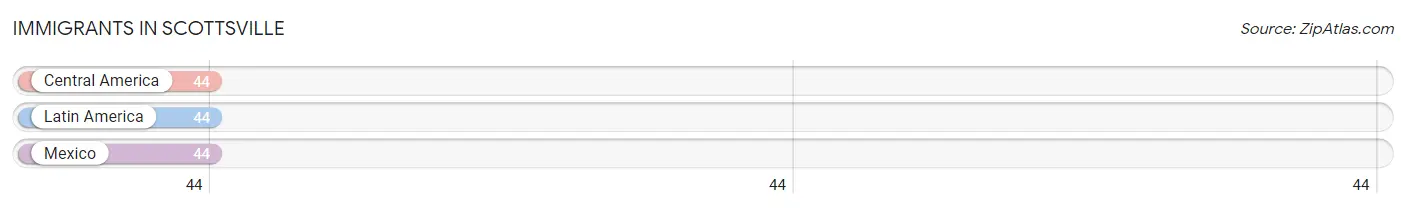
The most numerous immigrant groups reported in Scottsville came from Central America (44 | 1.0%), Latin America (44 | 1.0%), and Mexico (44 | 1.0%), together accounting for 3.1% of all Scottsville residents.
| Immigration Origin | # Population | % Population |
| Central America | 44 | 1.0% |
| Latin America | 44 | 1.0% |
| Mexico | 44 | 1.0% | View All 3 Rows |
Sex and Age in Scottsville
Sex and Age in Scottsville
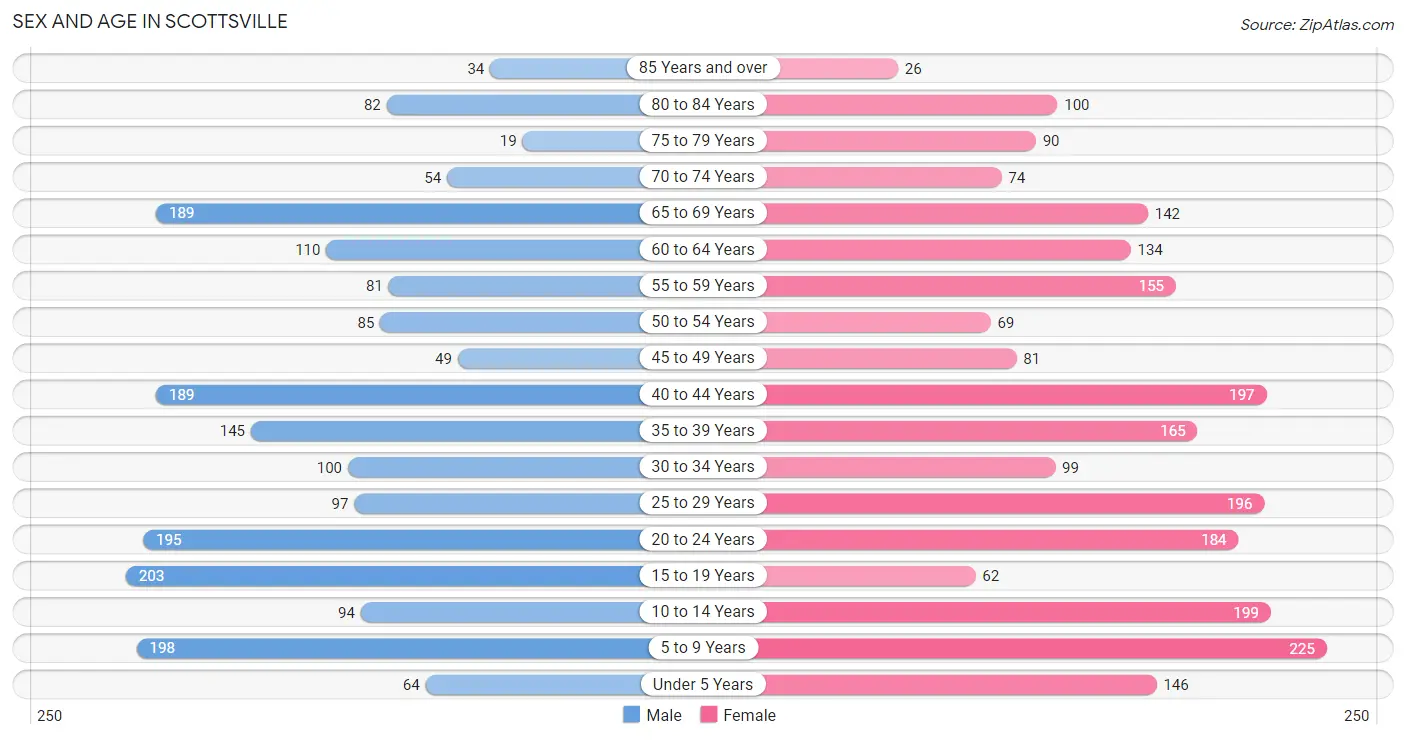
The most populous age groups in Scottsville are 15 to 19 Years (203 | 10.2%) for men and 5 to 9 Years (225 | 9.6%) for women.
| Age Bracket | Male | Female |
| Under 5 Years | 64 (3.2%) | 146 (6.2%) |
| 5 to 9 Years | 198 (10.0%) | 225 (9.6%) |
| 10 to 14 Years | 94 (4.7%) | 199 (8.5%) |
| 15 to 19 Years | 203 (10.2%) | 62 (2.6%) |
| 20 to 24 Years | 195 (9.8%) | 184 (7.9%) |
| 25 to 29 Years | 97 (4.9%) | 196 (8.4%) |
| 30 to 34 Years | 100 (5.0%) | 99 (4.2%) |
| 35 to 39 Years | 145 (7.3%) | 165 (7.0%) |
| 40 to 44 Years | 189 (9.5%) | 197 (8.4%) |
| 45 to 49 Years | 49 (2.5%) | 81 (3.5%) |
| 50 to 54 Years | 85 (4.3%) | 69 (2.9%) |
| 55 to 59 Years | 81 (4.1%) | 155 (6.6%) |
| 60 to 64 Years | 110 (5.5%) | 134 (5.7%) |
| 65 to 69 Years | 189 (9.5%) | 142 (6.1%) |
| 70 to 74 Years | 54 (2.7%) | 74 (3.2%) |
| 75 to 79 Years | 19 (1.0%) | 90 (3.8%) |
| 80 to 84 Years | 82 (4.1%) | 100 (4.3%) |
| 85 Years and over | 34 (1.7%) | 26 (1.1%) |
| Total | 1,988 (100.0%) | 2,344 (100.0%) |
Families and Households in Scottsville
Median Family Size in Scottsville
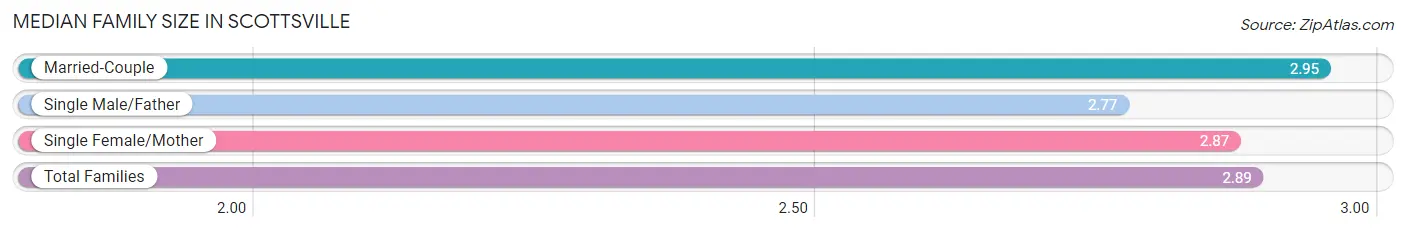
The median family size in Scottsville is 2.89 persons per family, with married-couple families (646 | 53.8%) accounting for the largest median family size of 2.95 persons per family. On the other hand, single male/father families (255 | 21.2%) represent the smallest median family size with 2.77 persons per family.
| Family Type | # Families | Family Size |
| Married-Couple | 646 (53.8%) | 2.95 |
| Single Male/Father | 255 (21.2%) | 2.77 |
| Single Female/Mother | 300 (25.0%) | 2.87 |
| Total Families | 1,201 (100.0%) | 2.89 |
Median Household Size in Scottsville
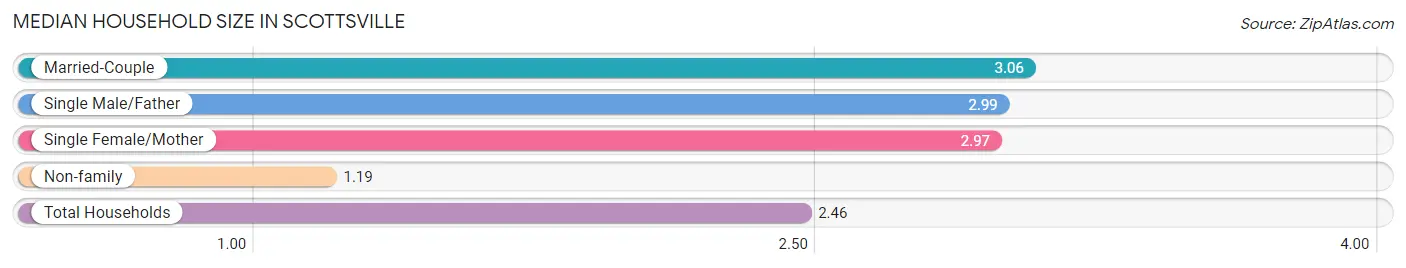
The median household size in Scottsville is 2.46 persons per household, with married-couple households (646 | 37.2%) accounting for the largest median household size of 3.06 persons per household. non-family households (537 | 30.9%) represent the smallest median household size with 1.19 persons per household.
| Household Type | # Households | Household Size |
| Married-Couple | 646 (37.2%) | 3.06 |
| Single Male/Father | 255 (14.7%) | 2.99 |
| Single Female/Mother | 300 (17.3%) | 2.97 |
| Non-family | 537 (30.9%) | 1.19 |
| Total Households | 1,738 (100.0%) | 2.46 |
Household Size by Marriage Status in Scottsville
Out of a total of 1,738 households in Scottsville, 1,201 (69.1%) are family households, while 537 (30.9%) are nonfamily households. The most numerous type of family households are 2-person households, comprising 482, and the most common type of nonfamily households are 1-person households, comprising 459.
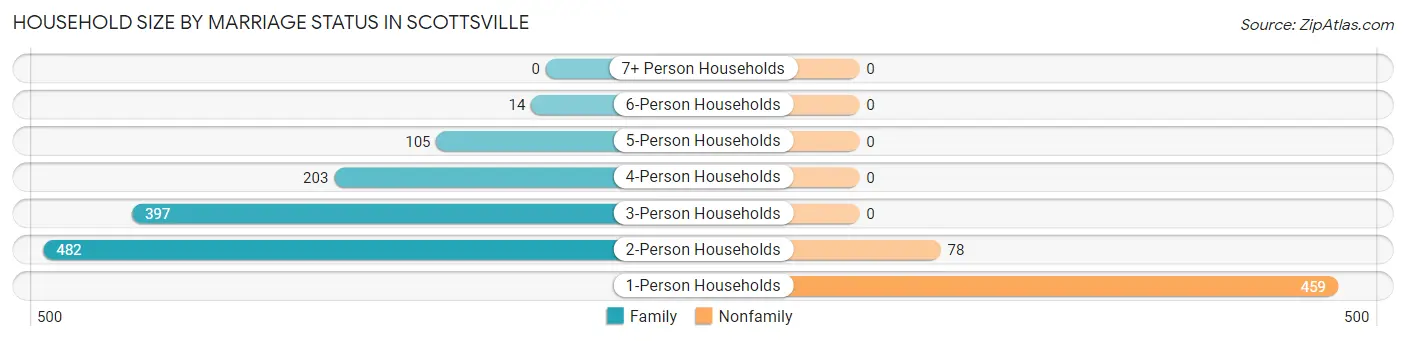
| Household Size | Family Households | Nonfamily Households |
| 1-Person Households | - | 459 (26.4%) |
| 2-Person Households | 482 (27.7%) | 78 (4.5%) |
| 3-Person Households | 397 (22.8%) | 0 (0.0%) |
| 4-Person Households | 203 (11.7%) | 0 (0.0%) |
| 5-Person Households | 105 (6.0%) | 0 (0.0%) |
| 6-Person Households | 14 (0.8%) | 0 (0.0%) |
| 7+ Person Households | 0 (0.0%) | 0 (0.0%) |
| Total | 1,201 (69.1%) | 537 (30.9%) |
Female Fertility in Scottsville
Fertility by Age in Scottsville
Average fertility rate in Scottsville is 26.0 births per 1,000 women. Women in the age bracket of 20 to 34 years have the highest fertility rate with 56.0 births per 1,000 women. Women in the age bracket of 20 to 34 years acount for 100.0% of all women with births.
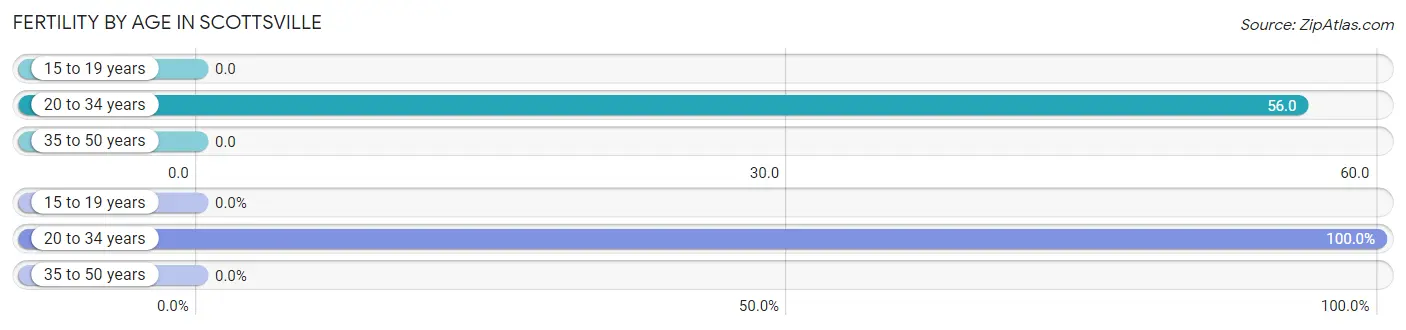
| Age Bracket | Women with Births | Births / 1,000 Women |
| 15 to 19 years | 0 (0.0%) | 0.0 |
| 20 to 34 years | 27 (100.0%) | 56.0 |
| 35 to 50 years | 0 (0.0%) | 0.0 |
| Total | 27 (100.0%) | 26.0 |
Fertility by Age by Marriage Status in Scottsville
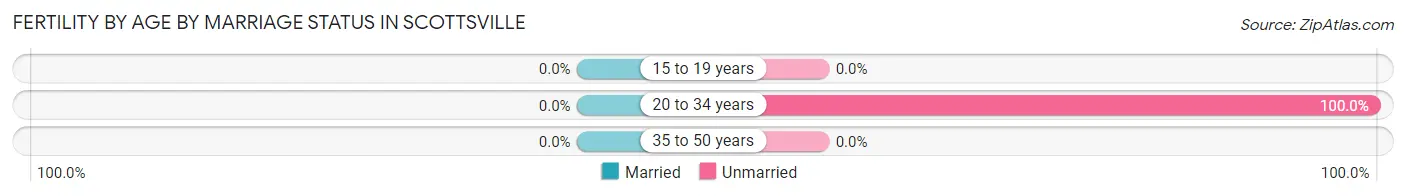
| Age Bracket | Married | Unmarried |
| 15 to 19 years | 0 (0.0%) | 0 (0.0%) |
| 20 to 34 years | 0 (0.0%) | 27 (100.0%) |
| 35 to 50 years | 0 (0.0%) | 0 (0.0%) |
| Total | 0 (0.0%) | 27 (100.0%) |
Fertility by Education in Scottsville
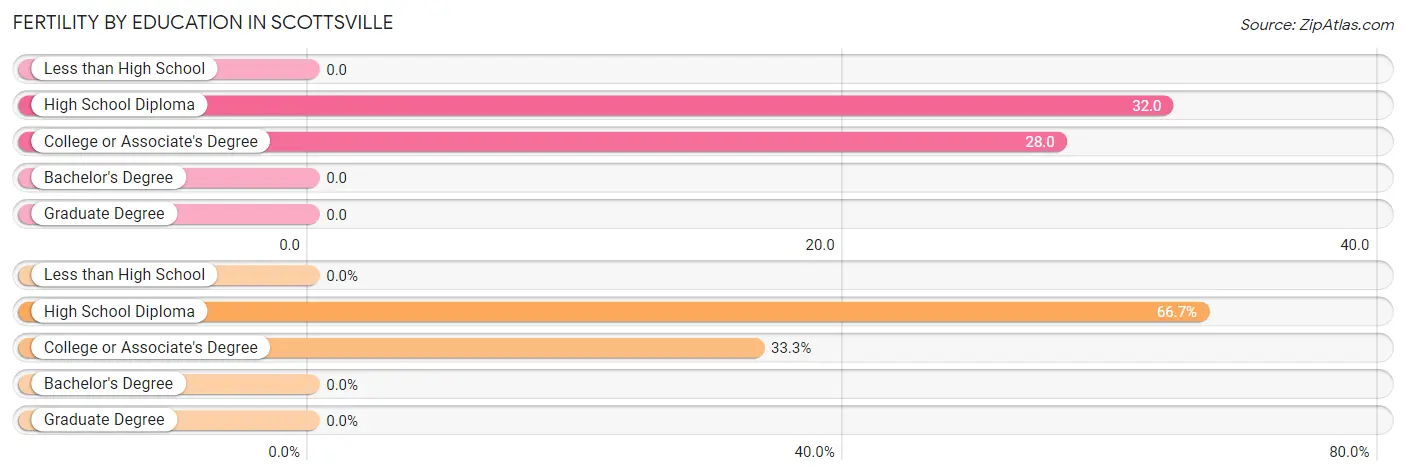
| Educational Attainment | Women with Births | Births / 1,000 Women |
| Less than High School | 0 (0.0%) | 0.0 |
| High School Diploma | 18 (66.7%) | 32.0 |
| College or Associate's Degree | 9 (33.3%) | 28.0 |
| Bachelor's Degree | 0 (0.0%) | 0.0 |
| Graduate Degree | 0 (0.0%) | 0.0 |
| Total | 27 (100.0%) | 26.0 |
Fertility by Education by Marriage Status in Scottsville
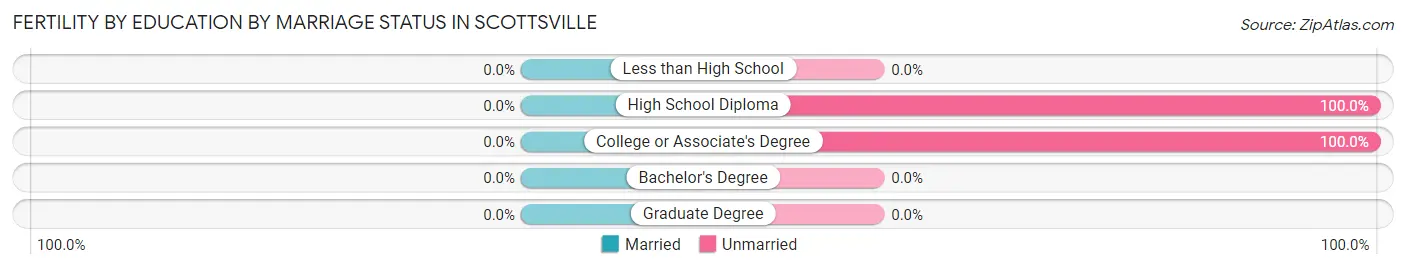
| Educational Attainment | Married | Unmarried |
| Less than High School | 0 (0.0%) | 0 (0.0%) |
| High School Diploma | 0 (0.0%) | 18 (100.0%) |
| College or Associate's Degree | 0 (0.0%) | 9 (100.0%) |
| Bachelor's Degree | 0 (0.0%) | 0 (0.0%) |
| Graduate Degree | 0 (0.0%) | 0 (0.0%) |
| Total | 0 (0.0%) | 27 (100.0%) |
Employment Characteristics in Scottsville
Employment by Class of Employer in Scottsville
Among the 1,648 employed individuals in Scottsville, private company employees (1,254 | 76.1%), local government employees (124 | 7.5%), and not-for-profit organizations (103 | 6.2%) make up the most common classes of employment.
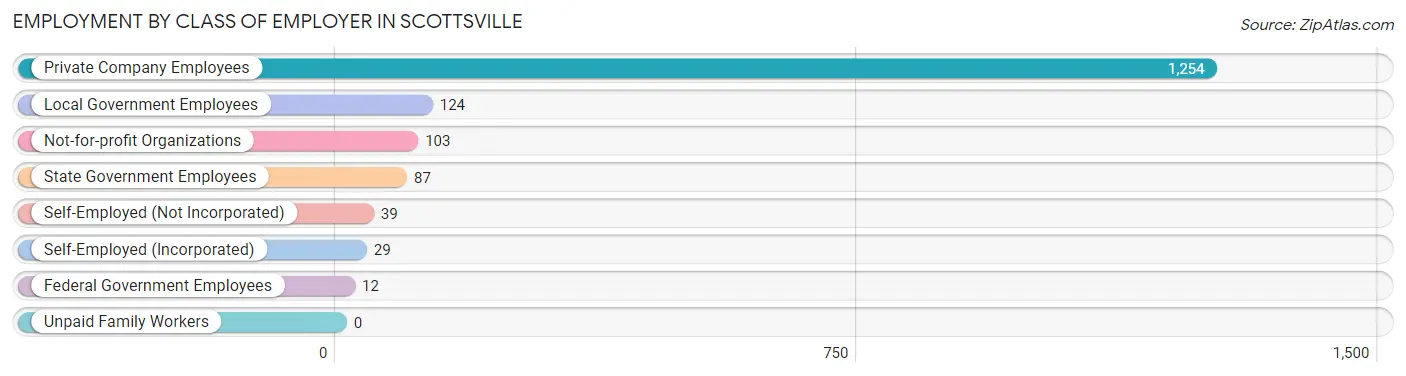
| Employer Class | # Employees | % Employees |
| Private Company Employees | 1,254 | 76.1% |
| Self-Employed (Incorporated) | 29 | 1.8% |
| Self-Employed (Not Incorporated) | 39 | 2.4% |
| Not-for-profit Organizations | 103 | 6.2% |
| Local Government Employees | 124 | 7.5% |
| State Government Employees | 87 | 5.3% |
| Federal Government Employees | 12 | 0.7% |
| Unpaid Family Workers | 0 | 0.0% |
| Total | 1,648 | 100.0% |
Employment Status by Age in Scottsville
According to the labor force statistics for Scottsville, out of the total population over 16 years of age (3,275), 60.0% or 1,965 individuals are in the labor force, with 16.2% or 318 of them unemployed. The age group with the highest labor force participation rate is 30 to 34 years, with 93.5% or 186 individuals in the labor force. Within the labor force, the 45 to 54 years age range has the highest percentage of unemployed individuals, with 39.7% or 58 of them being unemployed.
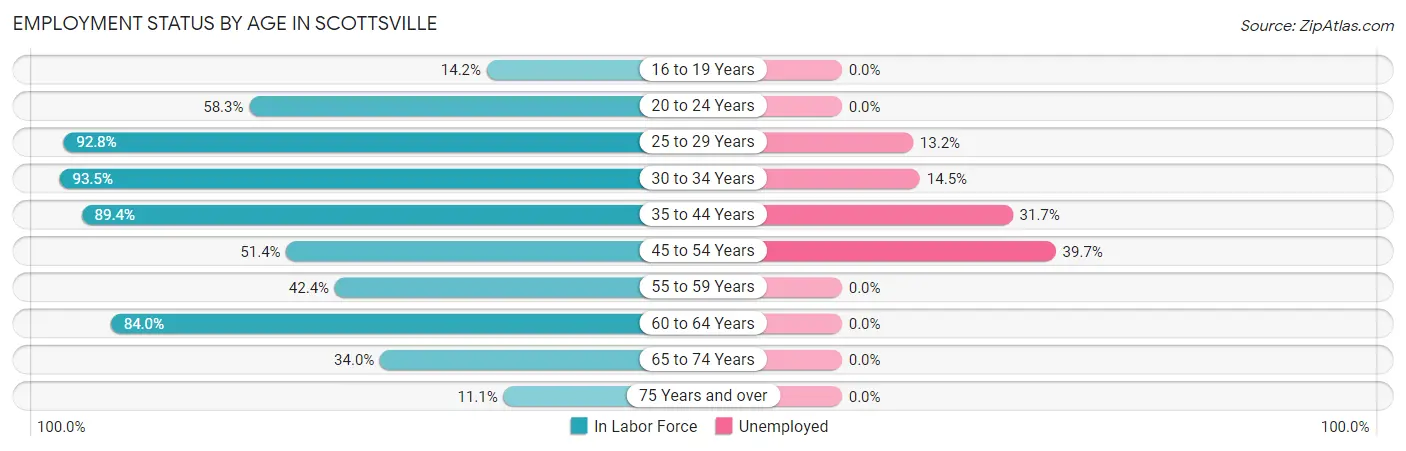
| Age Bracket | In Labor Force | Unemployed |
| 16 to 19 Years | 19 (14.2%) | 0 (0.0%) |
| 20 to 24 Years | 221 (58.3%) | 0 (0.0%) |
| 25 to 29 Years | 272 (92.8%) | 36 (13.2%) |
| 30 to 34 Years | 186 (93.5%) | 27 (14.5%) |
| 35 to 44 Years | 622 (89.4%) | 197 (31.7%) |
| 45 to 54 Years | 146 (51.4%) | 58 (39.7%) |
| 55 to 59 Years | 100 (42.4%) | 0 (0.0%) |
| 60 to 64 Years | 205 (84.0%) | 0 (0.0%) |
| 65 to 74 Years | 156 (34.0%) | 0 (0.0%) |
| 75 Years and over | 39 (11.1%) | 0 (0.0%) |
| Total | 1,965 (60.0%) | 318 (16.2%) |
Employment Status by Educational Attainment in Scottsville
According to labor force statistics for Scottsville, 78.4% of individuals (1,530) out of the total population between 25 and 64 years of age (1,952) are in the labor force, with 20.8% or 318 of them being unemployed. The group with the highest labor force participation rate are those with the educational attainment of bachelor's degree or higher, with 96.7% or 117 individuals in the labor force. Within the labor force, individuals with college / associate degree education have the highest percentage of unemployment, with 41.3% or 282 of them being unemployed.
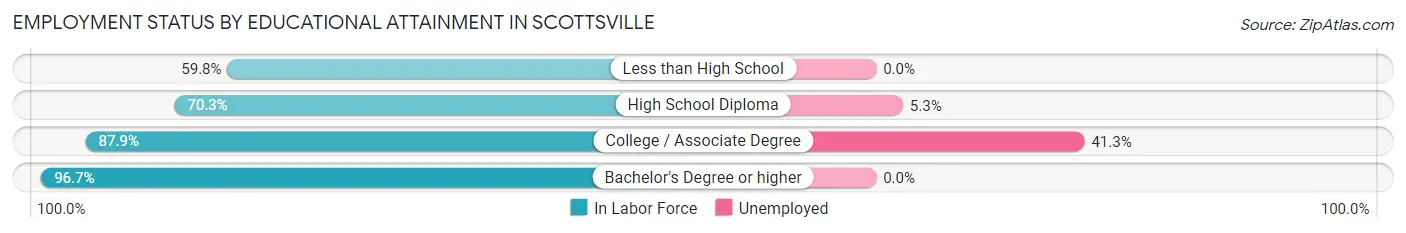
| Educational Attainment | In Labor Force | Unemployed |
| Less than High School | 55 (59.8%) | 0 (0.0%) |
| High School Diploma | 676 (70.3%) | 51 (5.3%) |
| College / Associate Degree | 683 (87.9%) | 321 (41.3%) |
| Bachelor's Degree or higher | 117 (96.7%) | 0 (0.0%) |
| Total | 1,530 (78.4%) | 406 (20.8%) |
Employment Occupations by Sex in Scottsville
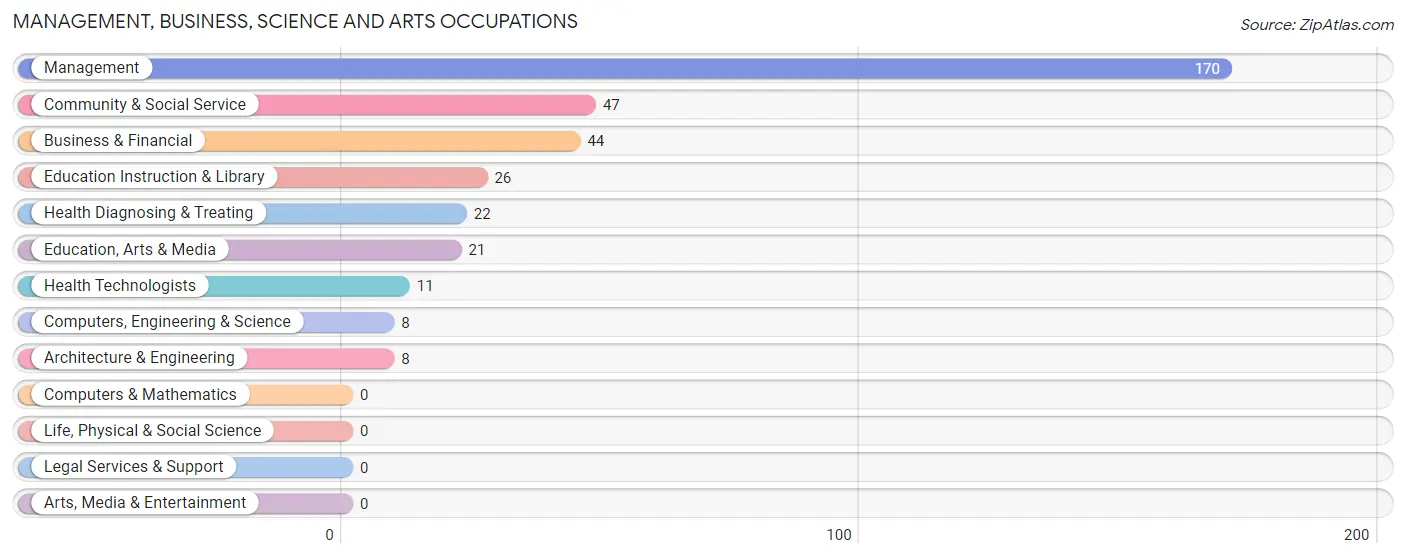
Management, Business, Science and Arts Occupations
The most common Management, Business, Science and Arts occupations in Scottsville are Management (170 | 10.3%), Community & Social Service (47 | 2.9%), Business & Financial (44 | 2.7%), Education Instruction & Library (26 | 1.6%), and Health Diagnosing & Treating (22 | 1.3%).
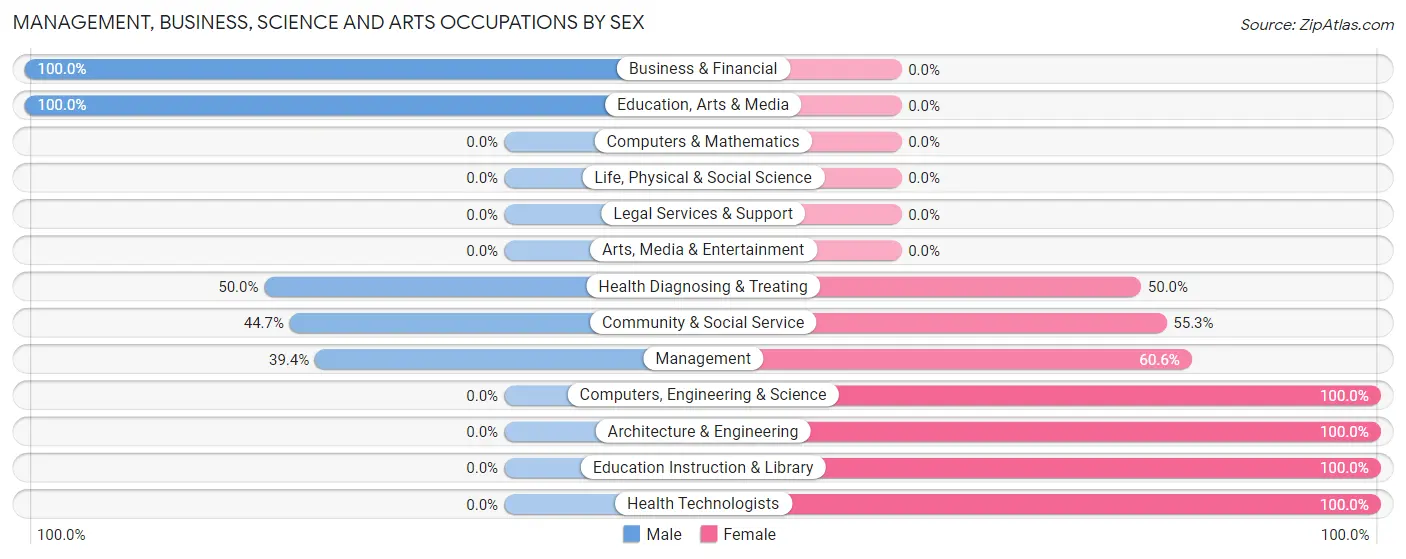
Management, Business, Science and Arts Occupations by Sex
Within the Management, Business, Science and Arts occupations in Scottsville, the most male-oriented occupations are Business & Financial (100.0%), Education, Arts & Media (100.0%), and Health Diagnosing & Treating (50.0%), while the most female-oriented occupations are Computers, Engineering & Science (100.0%), Architecture & Engineering (100.0%), and Education Instruction & Library (100.0%).
| Occupation | Male | Female |
| Management | 67 (39.4%) | 103 (60.6%) |
| Business & Financial | 44 (100.0%) | 0 (0.0%) |
| Computers, Engineering & Science | 0 (0.0%) | 8 (100.0%) |
| Computers & Mathematics | 0 (0.0%) | 0 (0.0%) |
| Architecture & Engineering | 0 (0.0%) | 8 (100.0%) |
| Life, Physical & Social Science | 0 (0.0%) | 0 (0.0%) |
| Community & Social Service | 21 (44.7%) | 26 (55.3%) |
| Education, Arts & Media | 21 (100.0%) | 0 (0.0%) |
| Legal Services & Support | 0 (0.0%) | 0 (0.0%) |
| Education Instruction & Library | 0 (0.0%) | 26 (100.0%) |
| Arts, Media & Entertainment | 0 (0.0%) | 0 (0.0%) |
| Health Diagnosing & Treating | 11 (50.0%) | 11 (50.0%) |
| Health Technologists | 0 (0.0%) | 11 (100.0%) |
| Total (Category) | 143 (49.1%) | 148 (50.9%) |
| Total (Overall) | 754 (45.8%) | 894 (54.2%) |
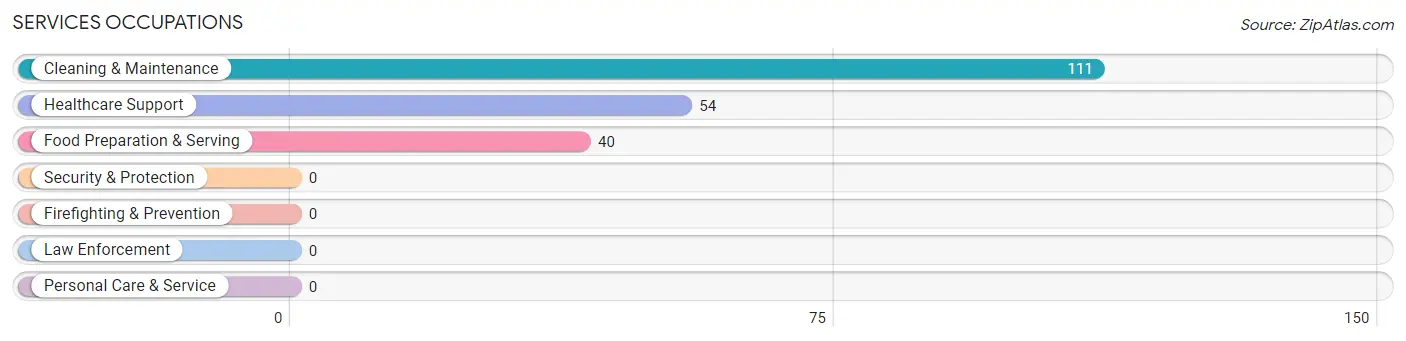
Services Occupations
The most common Services occupations in Scottsville are Cleaning & Maintenance (111 | 6.7%), Healthcare Support (54 | 3.3%), and Food Preparation & Serving (40 | 2.4%).
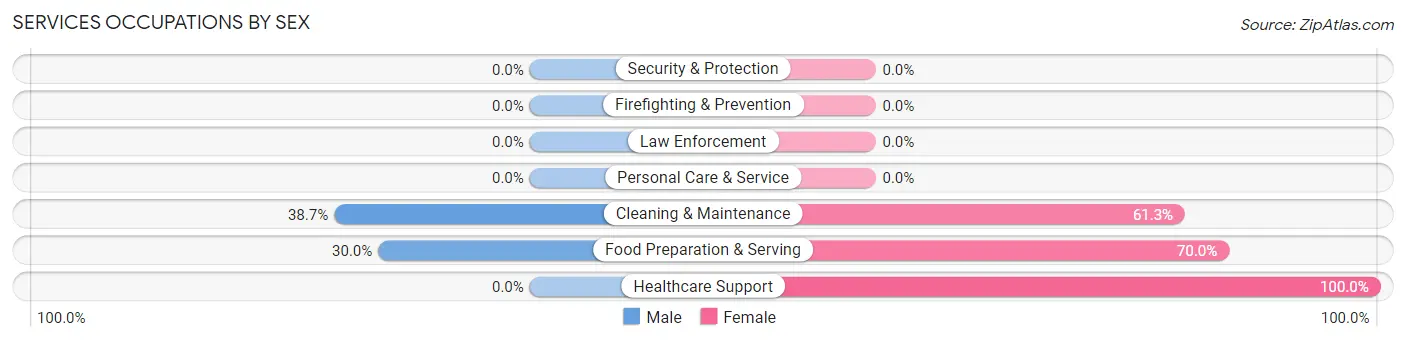
Services Occupations by Sex
Within the Services occupations in Scottsville, the most male-oriented occupations are Cleaning & Maintenance (38.7%), and Food Preparation & Serving (30.0%), while the most female-oriented occupations are Healthcare Support (100.0%), Food Preparation & Serving (70.0%), and Cleaning & Maintenance (61.3%).
| Occupation | Male | Female |
| Healthcare Support | 0 (0.0%) | 54 (100.0%) |
| Security & Protection | 0 (0.0%) | 0 (0.0%) |
| Firefighting & Prevention | 0 (0.0%) | 0 (0.0%) |
| Law Enforcement | 0 (0.0%) | 0 (0.0%) |
| Food Preparation & Serving | 12 (30.0%) | 28 (70.0%) |
| Cleaning & Maintenance | 43 (38.7%) | 68 (61.3%) |
| Personal Care & Service | 0 (0.0%) | 0 (0.0%) |
| Total (Category) | 55 (26.8%) | 150 (73.2%) |
| Total (Overall) | 754 (45.8%) | 894 (54.2%) |
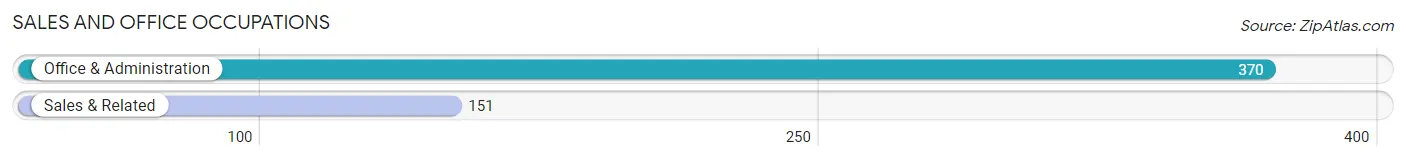
Sales and Office Occupations
The most common Sales and Office occupations in Scottsville are Office & Administration (370 | 22.5%), and Sales & Related (151 | 9.2%).
Sales and Office Occupations by Sex
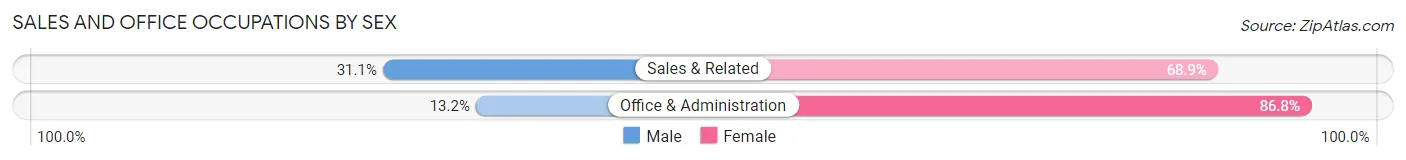
| Occupation | Male | Female |
| Sales & Related | 47 (31.1%) | 104 (68.9%) |
| Office & Administration | 49 (13.2%) | 321 (86.8%) |
| Total (Category) | 96 (18.4%) | 425 (81.6%) |
| Total (Overall) | 754 (45.8%) | 894 (54.2%) |
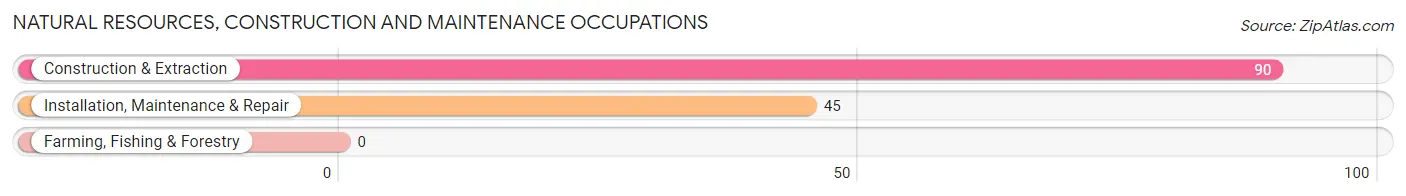
Natural Resources, Construction and Maintenance Occupations
The most common Natural Resources, Construction and Maintenance occupations in Scottsville are Construction & Extraction (90 | 5.5%), and Installation, Maintenance & Repair (45 | 2.7%).
Natural Resources, Construction and Maintenance Occupations by Sex
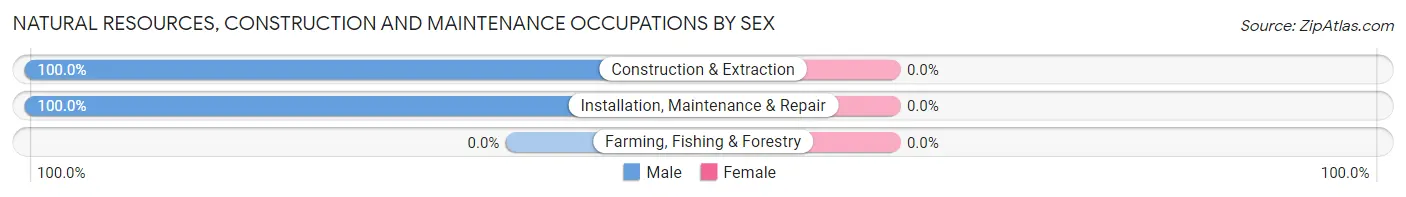
| Occupation | Male | Female |
| Farming, Fishing & Forestry | 0 (0.0%) | 0 (0.0%) |
| Construction & Extraction | 90 (100.0%) | 0 (0.0%) |
| Installation, Maintenance & Repair | 45 (100.0%) | 0 (0.0%) |
| Total (Category) | 135 (100.0%) | 0 (0.0%) |
| Total (Overall) | 754 (45.8%) | 894 (54.2%) |
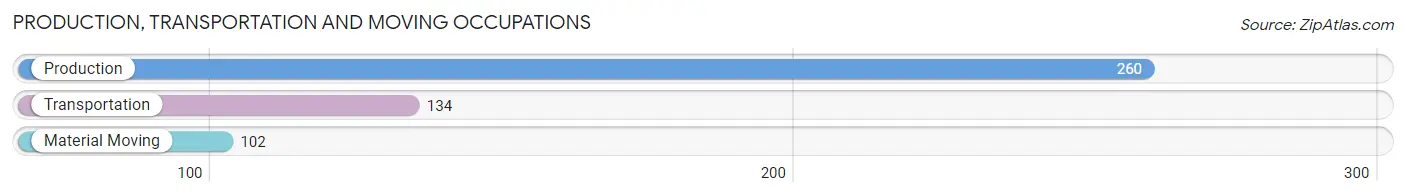
Production, Transportation and Moving Occupations
The most common Production, Transportation and Moving occupations in Scottsville are Production (260 | 15.8%), Transportation (134 | 8.1%), and Material Moving (102 | 6.2%).
Production, Transportation and Moving Occupations by Sex
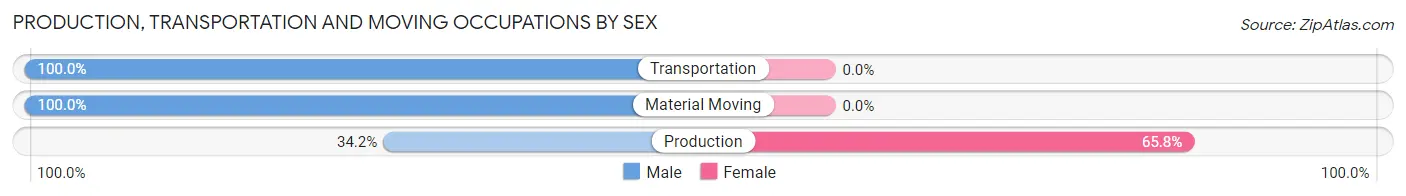
| Occupation | Male | Female |
| Production | 89 (34.2%) | 171 (65.8%) |
| Transportation | 134 (100.0%) | 0 (0.0%) |
| Material Moving | 102 (100.0%) | 0 (0.0%) |
| Total (Category) | 325 (65.5%) | 171 (34.5%) |
| Total (Overall) | 754 (45.8%) | 894 (54.2%) |
Employment Industries by Sex in Scottsville
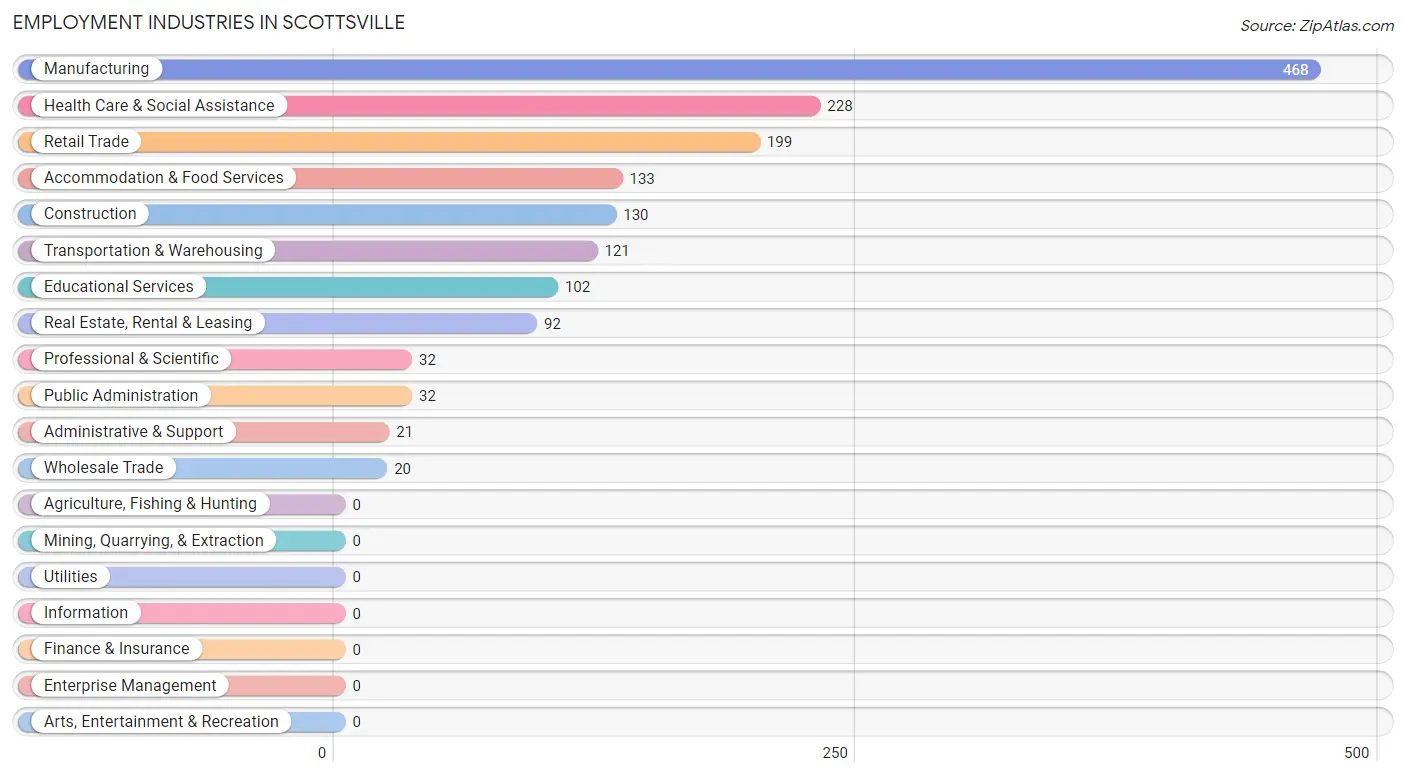
Employment Industries in Scottsville
The major employment industries in Scottsville include Manufacturing (468 | 28.4%), Health Care & Social Assistance (228 | 13.8%), Retail Trade (199 | 12.1%), Accommodation & Food Services (133 | 8.1%), and Construction (130 | 7.9%).
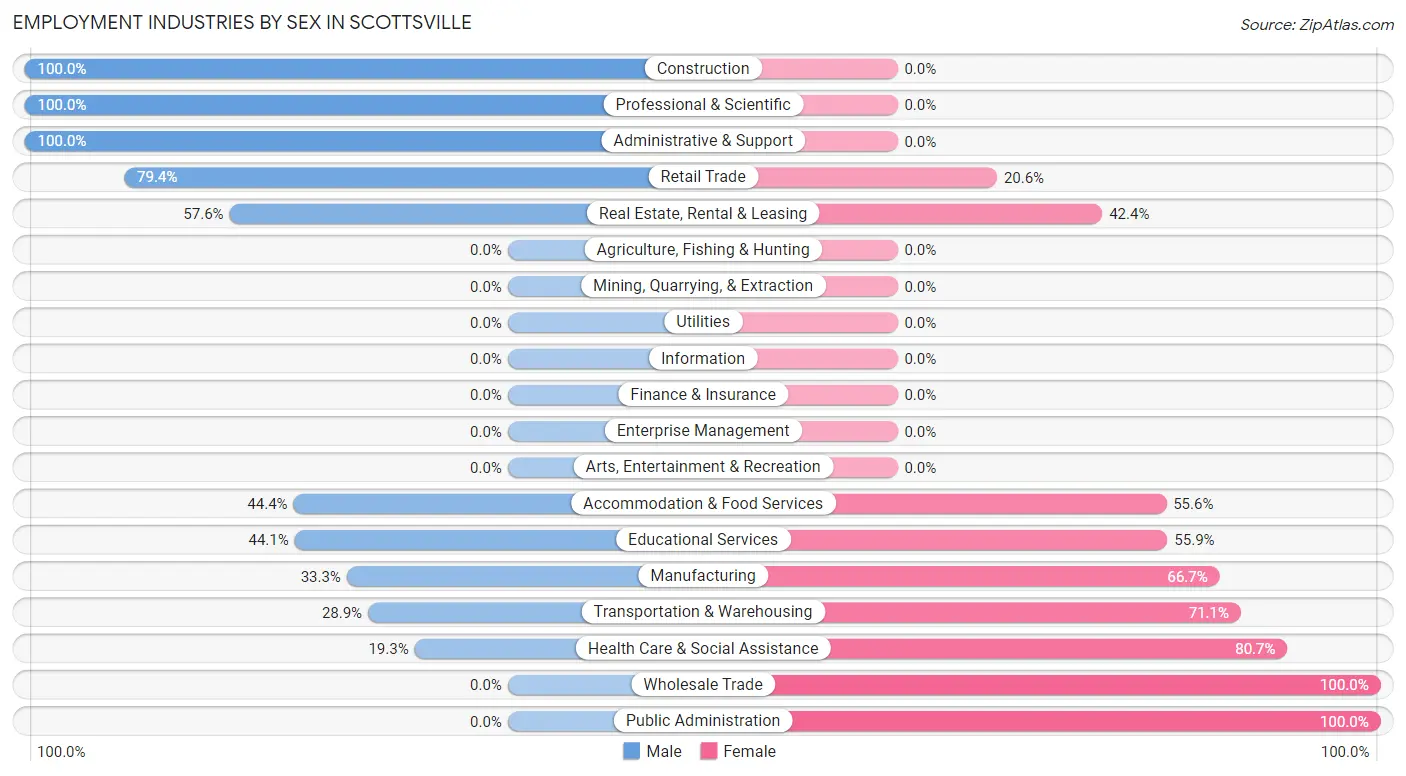
Employment Industries by Sex in Scottsville
The Scottsville industries that see more men than women are Construction (100.0%), Professional & Scientific (100.0%), and Administrative & Support (100.0%), whereas the industries that tend to have a higher number of women are Wholesale Trade (100.0%), Public Administration (100.0%), and Health Care & Social Assistance (80.7%).
| Industry | Male | Female |
| Agriculture, Fishing & Hunting | 0 (0.0%) | 0 (0.0%) |
| Mining, Quarrying, & Extraction | 0 (0.0%) | 0 (0.0%) |
| Construction | 130 (100.0%) | 0 (0.0%) |
| Manufacturing | 156 (33.3%) | 312 (66.7%) |
| Wholesale Trade | 0 (0.0%) | 20 (100.0%) |
| Retail Trade | 158 (79.4%) | 41 (20.6%) |
| Transportation & Warehousing | 35 (28.9%) | 86 (71.1%) |
| Utilities | 0 (0.0%) | 0 (0.0%) |
| Information | 0 (0.0%) | 0 (0.0%) |
| Finance & Insurance | 0 (0.0%) | 0 (0.0%) |
| Real Estate, Rental & Leasing | 53 (57.6%) | 39 (42.4%) |
| Professional & Scientific | 32 (100.0%) | 0 (0.0%) |
| Enterprise Management | 0 (0.0%) | 0 (0.0%) |
| Administrative & Support | 21 (100.0%) | 0 (0.0%) |
| Educational Services | 45 (44.1%) | 57 (55.9%) |
| Health Care & Social Assistance | 44 (19.3%) | 184 (80.7%) |
| Arts, Entertainment & Recreation | 0 (0.0%) | 0 (0.0%) |
| Accommodation & Food Services | 59 (44.4%) | 74 (55.6%) |
| Public Administration | 0 (0.0%) | 32 (100.0%) |
| Total | 754 (45.8%) | 894 (54.2%) |
Education in Scottsville
School Enrollment in Scottsville
The most common levels of schooling among the 1,094 students in Scottsville are elementary school (378 | 34.5%), middle school (267 | 24.4%), and high school (221 | 20.2%).
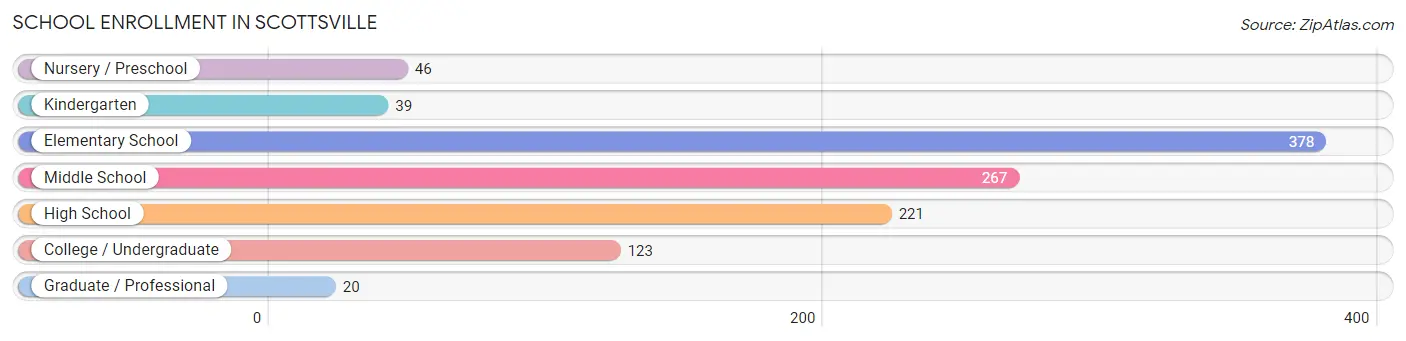
| School Level | # Students | % Students |
| Nursery / Preschool | 46 | 4.2% |
| Kindergarten | 39 | 3.6% |
| Elementary School | 378 | 34.5% |
| Middle School | 267 | 24.4% |
| High School | 221 | 20.2% |
| College / Undergraduate | 123 | 11.2% |
| Graduate / Professional | 20 | 1.8% |
| Total | 1,094 | 100.0% |
School Enrollment by Age by Funding Source in Scottsville
Out of a total of 1,094 students who are enrolled in schools in Scottsville, 171 (15.6%) attend a private institution, while the remaining 923 (84.4%) are enrolled in public schools. The age group of 3 to 4 year olds has the highest likelihood of being enrolled in private schools, with 6 (100.0% in the age bracket) enrolled. Conversely, the age group of 15 to 17 year olds has the lowest likelihood of being enrolled in a private school, with 210 (100.0% in the age bracket) attending a public institution.
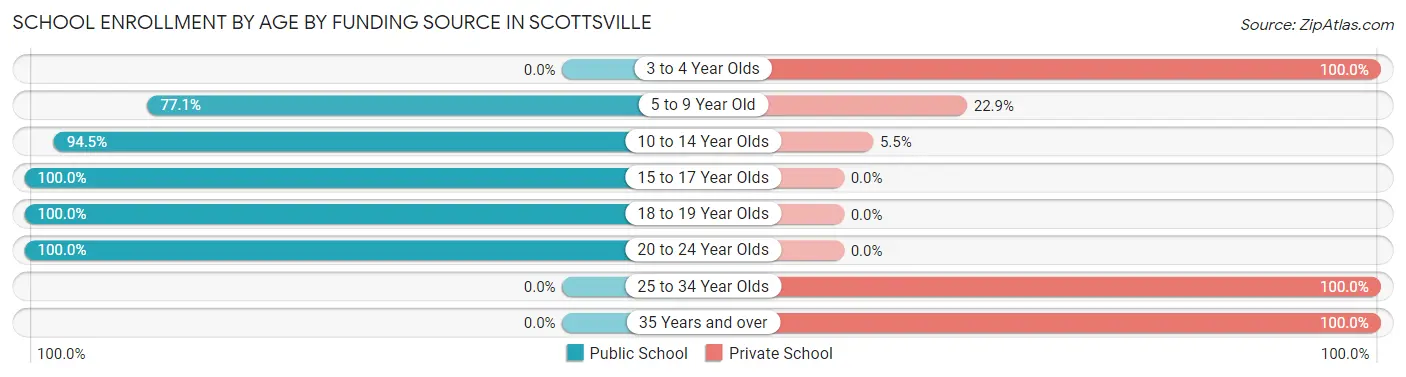
| Age Bracket | Public School | Private School |
| 3 to 4 Year Olds | 0 (0.0%) | 6 (100.0%) |
| 5 to 9 Year Old | 326 (77.1%) | 97 (22.9%) |
| 10 to 14 Year Olds | 277 (94.5%) | 16 (5.5%) |
| 15 to 17 Year Olds | 210 (100.0%) | 0 (0.0%) |
| 18 to 19 Year Olds | 19 (100.0%) | 0 (0.0%) |
| 20 to 24 Year Olds | 91 (100.0%) | 0 (0.0%) |
| 25 to 34 Year Olds | 0 (0.0%) | 20 (100.0%) |
| 35 Years and over | 0 (0.0%) | 32 (100.0%) |
| Total | 923 (84.4%) | 171 (15.6%) |
Educational Attainment by Field of Study in Scottsville
Business (82 | 26.8%), education (70 | 22.9%), multidisciplinary studies (31 | 10.1%), social sciences (29 | 9.5%), and science & technology (25 | 8.2%) are the most common fields of study among 306 individuals in Scottsville who have obtained a bachelor's degree or higher.
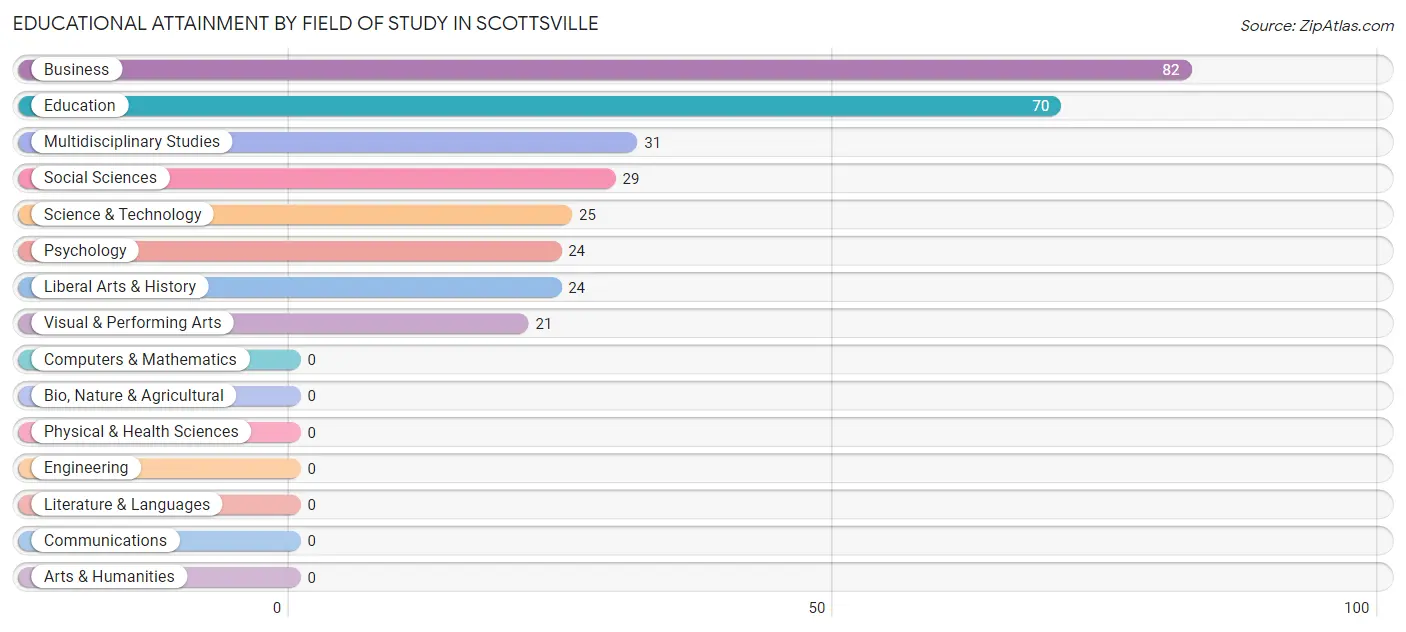
| Field of Study | # Graduates | % Graduates |
| Computers & Mathematics | 0 | 0.0% |
| Bio, Nature & Agricultural | 0 | 0.0% |
| Physical & Health Sciences | 0 | 0.0% |
| Psychology | 24 | 7.8% |
| Social Sciences | 29 | 9.5% |
| Engineering | 0 | 0.0% |
| Multidisciplinary Studies | 31 | 10.1% |
| Science & Technology | 25 | 8.2% |
| Business | 82 | 26.8% |
| Education | 70 | 22.9% |
| Literature & Languages | 0 | 0.0% |
| Liberal Arts & History | 24 | 7.8% |
| Visual & Performing Arts | 21 | 6.9% |
| Communications | 0 | 0.0% |
| Arts & Humanities | 0 | 0.0% |
| Total | 306 | 100.0% |
Transportation & Commute in Scottsville
Vehicle Availability by Sex in Scottsville
The most prevalent vehicle ownership categories in Scottsville are males with 2 vehicles (335, accounting for 44.4%) and females with 2 vehicles (317, making up 37.5%).
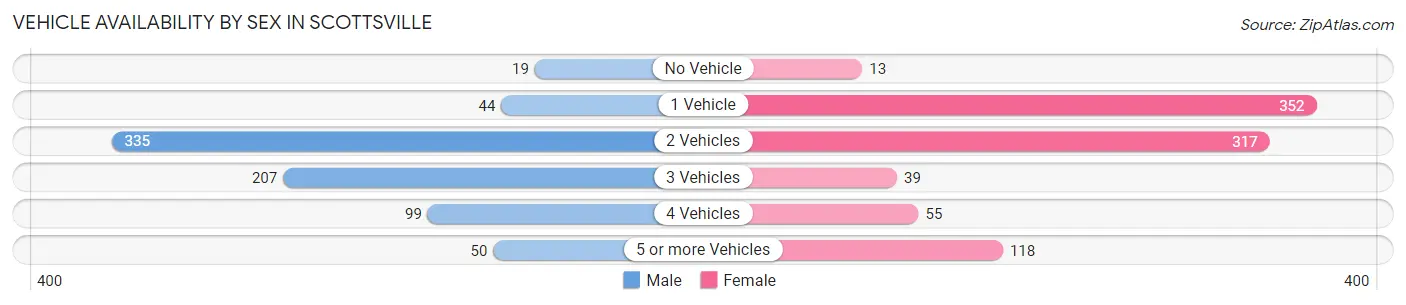
| Vehicles Available | Male | Female |
| No Vehicle | 19 (2.5%) | 13 (1.5%) |
| 1 Vehicle | 44 (5.8%) | 352 (39.4%) |
| 2 Vehicles | 335 (44.4%) | 317 (35.5%) |
| 3 Vehicles | 207 (27.5%) | 39 (4.4%) |
| 4 Vehicles | 99 (13.1%) | 55 (6.1%) |
| 5 or more Vehicles | 50 (6.6%) | 118 (13.2%) |
| Total | 754 (100.0%) | 894 (100.0%) |
Commute Time in Scottsville
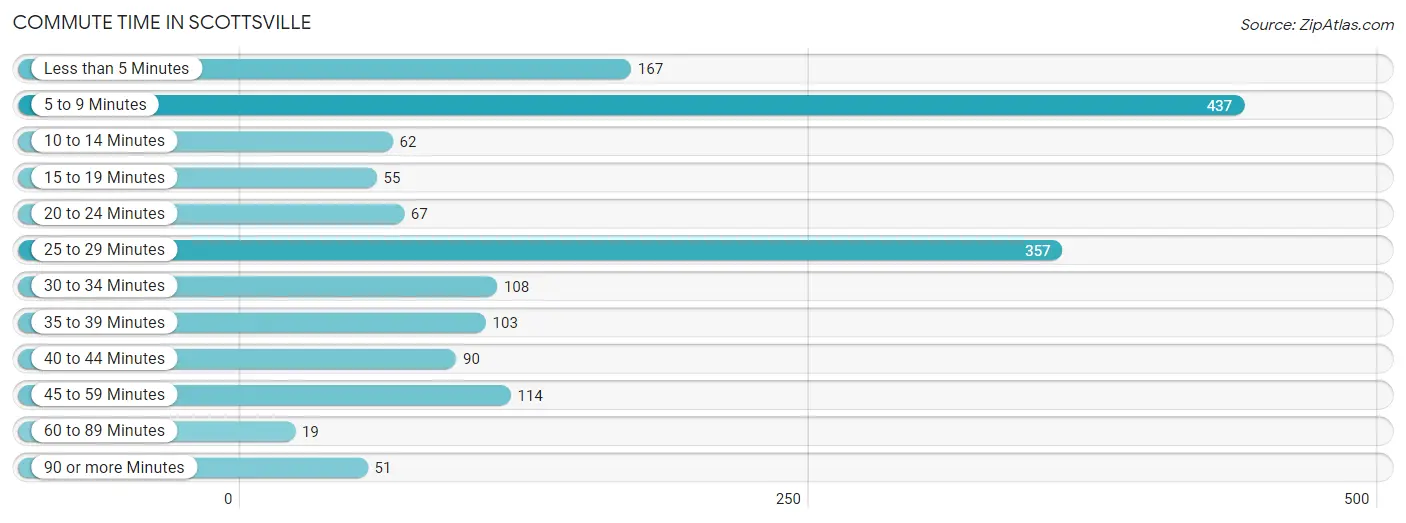
The most frequently occuring commute durations in Scottsville are 5 to 9 minutes (437 commuters, 26.8%), 25 to 29 minutes (357 commuters, 21.9%), and less than 5 minutes (167 commuters, 10.2%).
| Commute Time | # Commuters | % Commuters |
| Less than 5 Minutes | 167 | 10.2% |
| 5 to 9 Minutes | 437 | 26.8% |
| 10 to 14 Minutes | 62 | 3.8% |
| 15 to 19 Minutes | 55 | 3.4% |
| 20 to 24 Minutes | 67 | 4.1% |
| 25 to 29 Minutes | 357 | 21.9% |
| 30 to 34 Minutes | 108 | 6.6% |
| 35 to 39 Minutes | 103 | 6.3% |
| 40 to 44 Minutes | 90 | 5.5% |
| 45 to 59 Minutes | 114 | 7.0% |
| 60 to 89 Minutes | 19 | 1.2% |
| 90 or more Minutes | 51 | 3.1% |
Commute Time by Sex in Scottsville
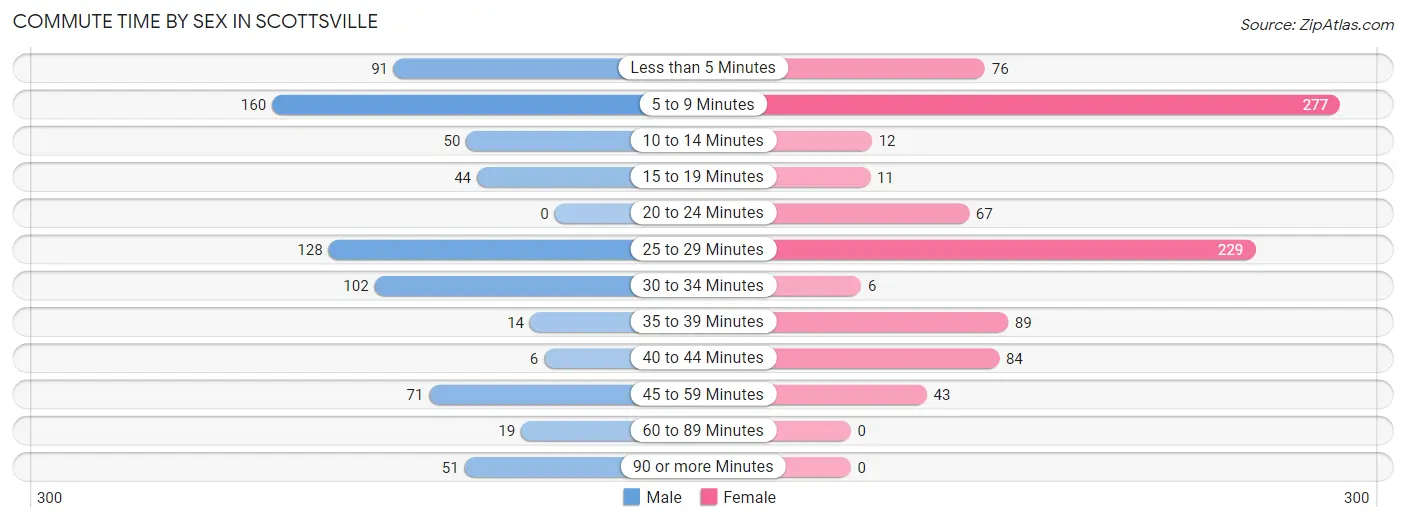
The most common commute times in Scottsville are 5 to 9 minutes (160 commuters, 21.7%) for males and 5 to 9 minutes (277 commuters, 31.0%) for females.
| Commute Time | Male | Female |
| Less than 5 Minutes | 91 (12.4%) | 76 (8.5%) |
| 5 to 9 Minutes | 160 (21.7%) | 277 (31.0%) |
| 10 to 14 Minutes | 50 (6.8%) | 12 (1.3%) |
| 15 to 19 Minutes | 44 (6.0%) | 11 (1.2%) |
| 20 to 24 Minutes | 0 (0.0%) | 67 (7.5%) |
| 25 to 29 Minutes | 128 (17.4%) | 229 (25.6%) |
| 30 to 34 Minutes | 102 (13.9%) | 6 (0.7%) |
| 35 to 39 Minutes | 14 (1.9%) | 89 (10.0%) |
| 40 to 44 Minutes | 6 (0.8%) | 84 (9.4%) |
| 45 to 59 Minutes | 71 (9.7%) | 43 (4.8%) |
| 60 to 89 Minutes | 19 (2.6%) | 0 (0.0%) |
| 90 or more Minutes | 51 (6.9%) | 0 (0.0%) |
Time of Departure to Work by Sex in Scottsville
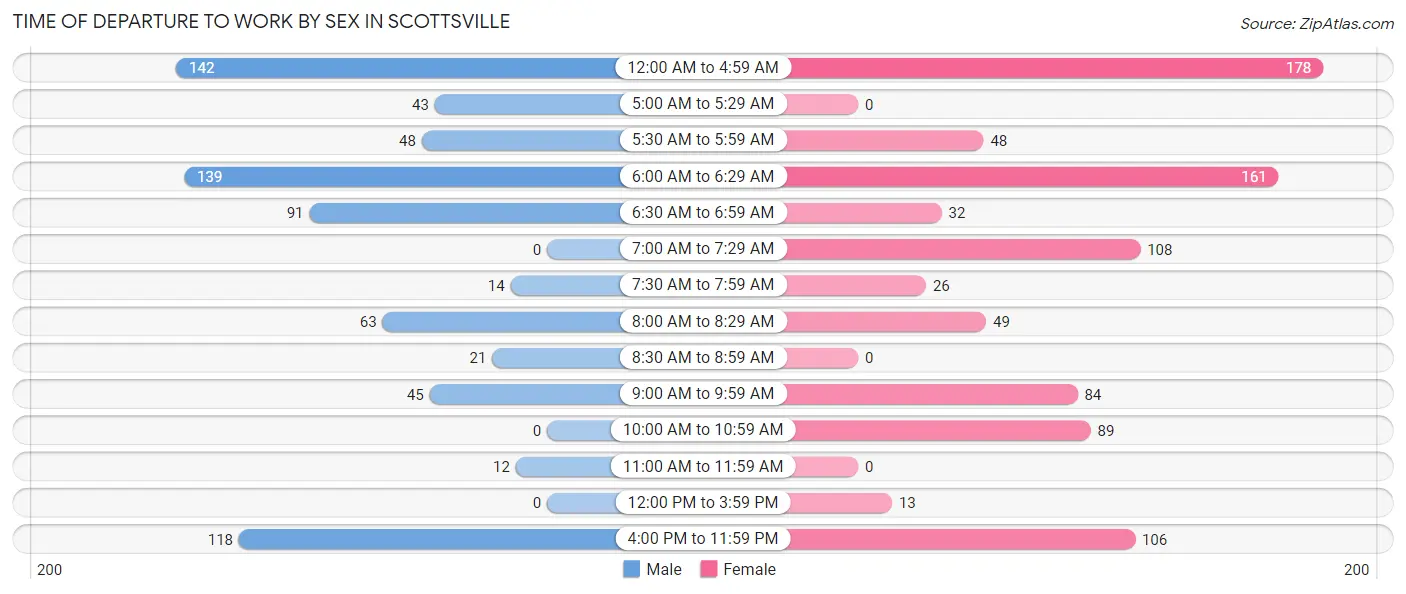
The most frequent times of departure to work in Scottsville are 12:00 AM to 4:59 AM (142, 19.3%) for males and 12:00 AM to 4:59 AM (178, 19.9%) for females.
| Time of Departure | Male | Female |
| 12:00 AM to 4:59 AM | 142 (19.3%) | 178 (19.9%) |
| 5:00 AM to 5:29 AM | 43 (5.8%) | 0 (0.0%) |
| 5:30 AM to 5:59 AM | 48 (6.5%) | 48 (5.4%) |
| 6:00 AM to 6:29 AM | 139 (18.9%) | 161 (18.0%) |
| 6:30 AM to 6:59 AM | 91 (12.4%) | 32 (3.6%) |
| 7:00 AM to 7:29 AM | 0 (0.0%) | 108 (12.1%) |
| 7:30 AM to 7:59 AM | 14 (1.9%) | 26 (2.9%) |
| 8:00 AM to 8:29 AM | 63 (8.6%) | 49 (5.5%) |
| 8:30 AM to 8:59 AM | 21 (2.9%) | 0 (0.0%) |
| 9:00 AM to 9:59 AM | 45 (6.1%) | 84 (9.4%) |
| 10:00 AM to 10:59 AM | 0 (0.0%) | 89 (10.0%) |
| 11:00 AM to 11:59 AM | 12 (1.6%) | 0 (0.0%) |
| 12:00 PM to 3:59 PM | 0 (0.0%) | 13 (1.5%) |
| 4:00 PM to 11:59 PM | 118 (16.0%) | 106 (11.9%) |
| Total | 736 (100.0%) | 894 (100.0%) |
Housing Occupancy in Scottsville
Occupancy by Ownership in Scottsville
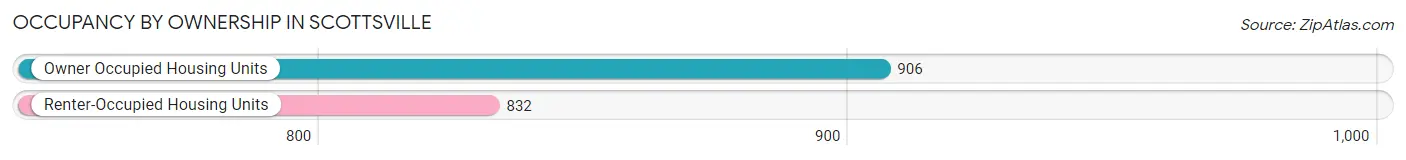
Of the total 1,738 dwellings in Scottsville, owner-occupied units account for 906 (52.1%), while renter-occupied units make up 832 (47.9%).
| Occupancy | # Housing Units | % Housing Units |
| Owner Occupied Housing Units | 906 | 52.1% |
| Renter-Occupied Housing Units | 832 | 47.9% |
| Total Occupied Housing Units | 1,738 | 100.0% |
Occupancy by Household Size in Scottsville
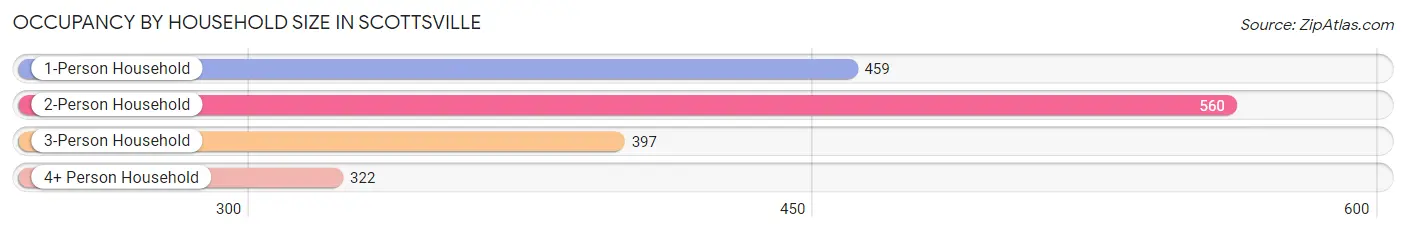
| Household Size | # Housing Units | % Housing Units |
| 1-Person Household | 459 | 26.4% |
| 2-Person Household | 560 | 32.2% |
| 3-Person Household | 397 | 22.8% |
| 4+ Person Household | 322 | 18.5% |
| Total Housing Units | 1,738 | 100.0% |
Occupancy by Ownership by Household Size in Scottsville
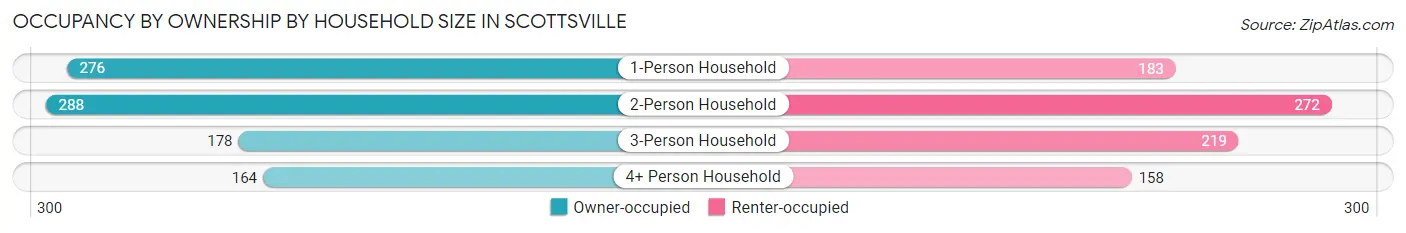
| Household Size | Owner-occupied | Renter-occupied |
| 1-Person Household | 276 (60.1%) | 183 (39.9%) |
| 2-Person Household | 288 (51.4%) | 272 (48.6%) |
| 3-Person Household | 178 (44.8%) | 219 (55.2%) |
| 4+ Person Household | 164 (50.9%) | 158 (49.1%) |
| Total Housing Units | 906 (52.1%) | 832 (47.9%) |
Occupancy by Educational Attainment in Scottsville
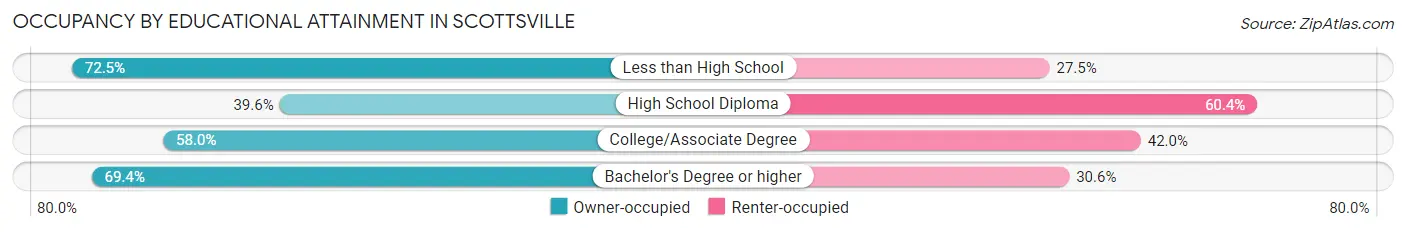
| Household Size | Owner-occupied | Renter-occupied |
| Less than High School | 87 (72.5%) | 33 (27.5%) |
| High School Diploma | 296 (39.6%) | 452 (60.4%) |
| College/Associate Degree | 412 (58.0%) | 298 (42.0%) |
| Bachelor's Degree or higher | 111 (69.4%) | 49 (30.6%) |
Occupancy by Age of Householder in Scottsville
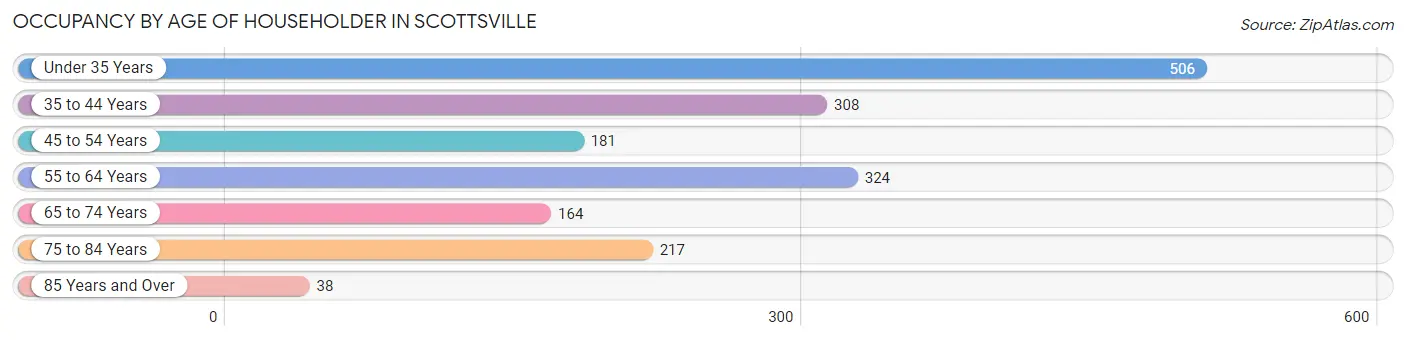
| Age Bracket | # Households | % Households |
| Under 35 Years | 506 | 29.1% |
| 35 to 44 Years | 308 | 17.7% |
| 45 to 54 Years | 181 | 10.4% |
| 55 to 64 Years | 324 | 18.6% |
| 65 to 74 Years | 164 | 9.4% |
| 75 to 84 Years | 217 | 12.5% |
| 85 Years and Over | 38 | 2.2% |
| Total | 1,738 | 100.0% |
Housing Finances in Scottsville
Median Income by Occupancy in Scottsville
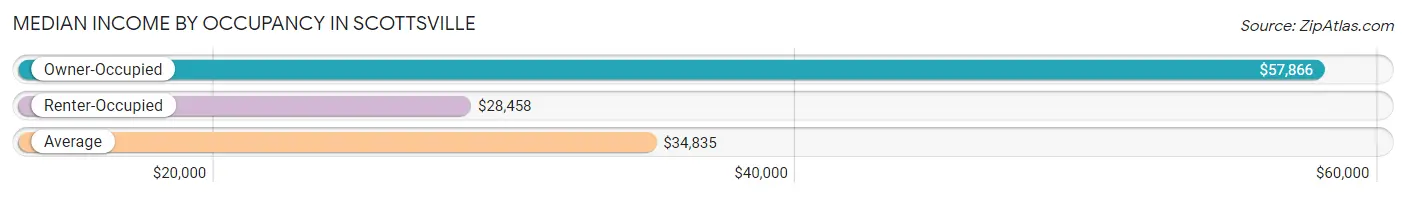
| Occupancy Type | # Households | Median Income |
| Owner-Occupied | 906 (52.1%) | $57,866 |
| Renter-Occupied | 832 (47.9%) | $28,458 |
| Average | 1,738 (100.0%) | $34,835 |
Occupancy by Householder Income Bracket in Scottsville
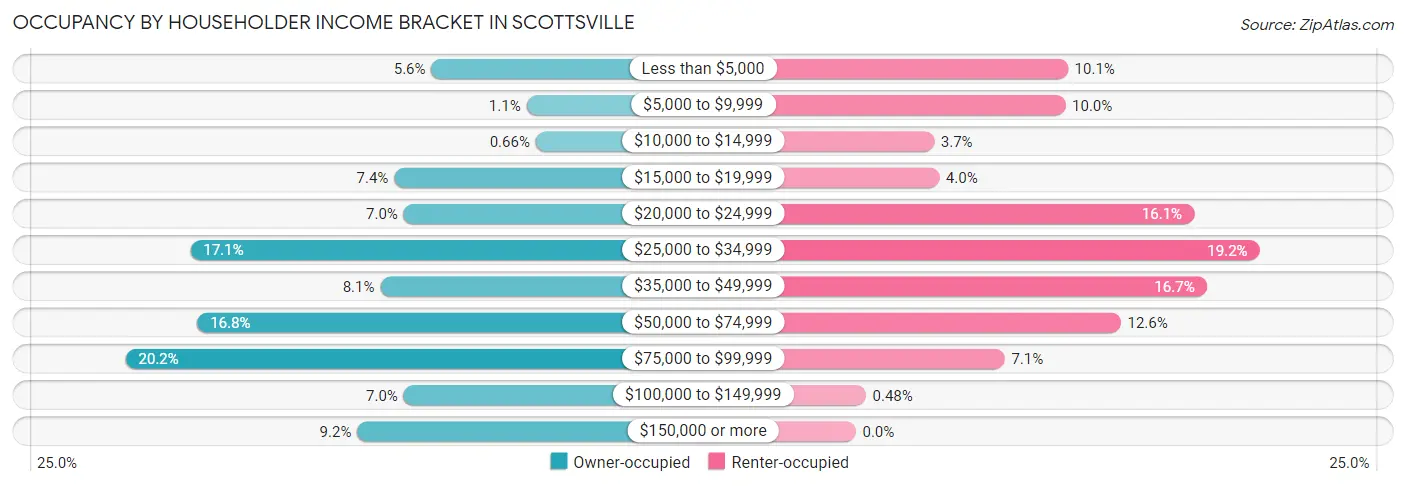
| Income Bracket | Owner-occupied | Renter-occupied |
| Less than $5,000 | 51 (5.6%) | 84 (10.1%) |
| $5,000 to $9,999 | 10 (1.1%) | 83 (10.0%) |
| $10,000 to $14,999 | 6 (0.7%) | 31 (3.7%) |
| $15,000 to $19,999 | 67 (7.4%) | 33 (4.0%) |
| $20,000 to $24,999 | 63 (7.0%) | 134 (16.1%) |
| $25,000 to $34,999 | 155 (17.1%) | 160 (19.2%) |
| $35,000 to $49,999 | 73 (8.1%) | 139 (16.7%) |
| $50,000 to $74,999 | 152 (16.8%) | 105 (12.6%) |
| $75,000 to $99,999 | 183 (20.2%) | 59 (7.1%) |
| $100,000 to $149,999 | 63 (7.0%) | 4 (0.5%) |
| $150,000 or more | 83 (9.2%) | 0 (0.0%) |
| Total | 906 (100.0%) | 832 (100.0%) |
Monthly Housing Cost Tiers in Scottsville
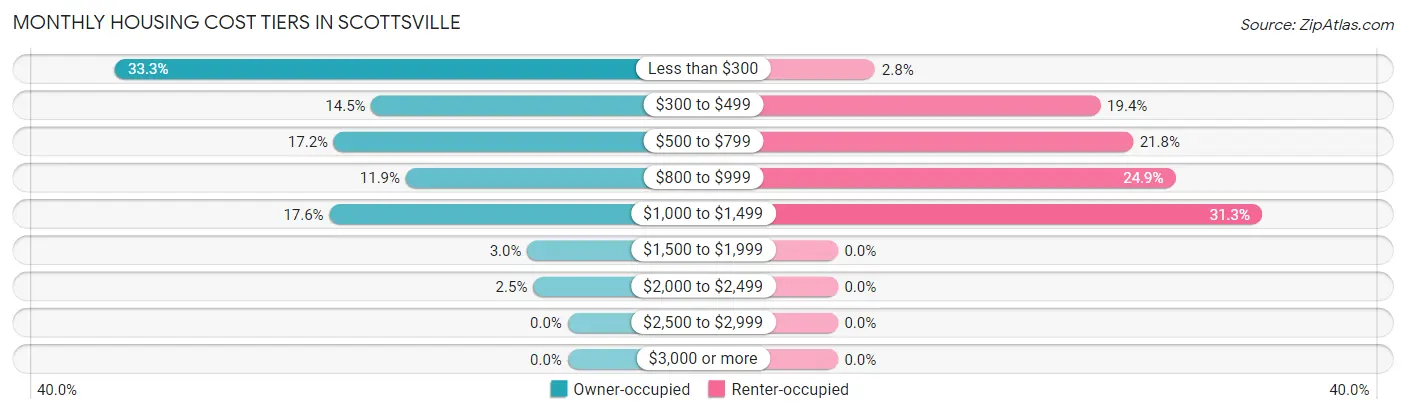
| Monthly Cost | Owner-occupied | Renter-occupied |
| Less than $300 | 302 (33.3%) | 23 (2.8%) |
| $300 to $499 | 131 (14.5%) | 161 (19.4%) |
| $500 to $799 | 156 (17.2%) | 181 (21.7%) |
| $800 to $999 | 108 (11.9%) | 207 (24.9%) |
| $1,000 to $1,499 | 159 (17.5%) | 260 (31.2%) |
| $1,500 to $1,999 | 27 (3.0%) | 0 (0.0%) |
| $2,000 to $2,499 | 23 (2.5%) | 0 (0.0%) |
| $2,500 to $2,999 | 0 (0.0%) | 0 (0.0%) |
| $3,000 or more | 0 (0.0%) | 0 (0.0%) |
| Total | 906 (100.0%) | 832 (100.0%) |
Physical Housing Characteristics in Scottsville
Housing Structures in Scottsville
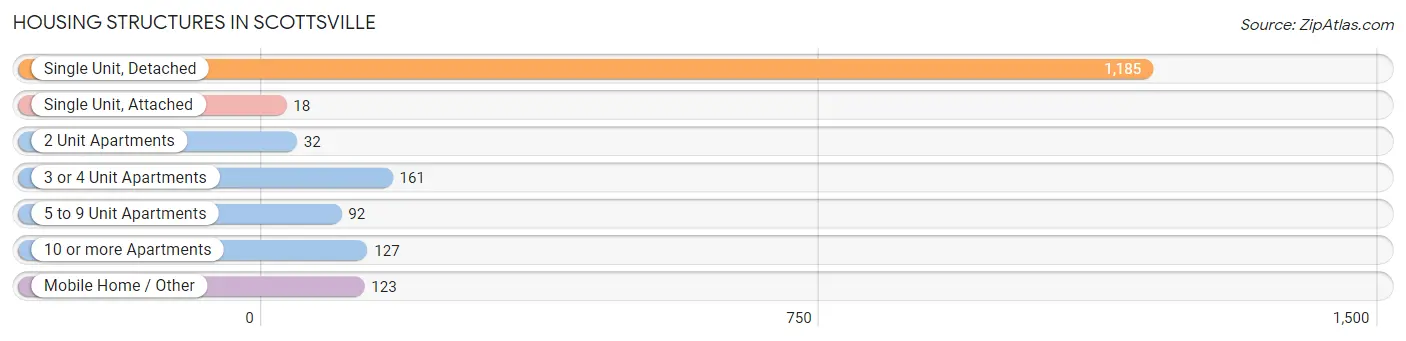
| Structure Type | # Housing Units | % Housing Units |
| Single Unit, Detached | 1,185 | 68.2% |
| Single Unit, Attached | 18 | 1.0% |
| 2 Unit Apartments | 32 | 1.8% |
| 3 or 4 Unit Apartments | 161 | 9.3% |
| 5 to 9 Unit Apartments | 92 | 5.3% |
| 10 or more Apartments | 127 | 7.3% |
| Mobile Home / Other | 123 | 7.1% |
| Total | 1,738 | 100.0% |
Housing Structures by Occupancy in Scottsville
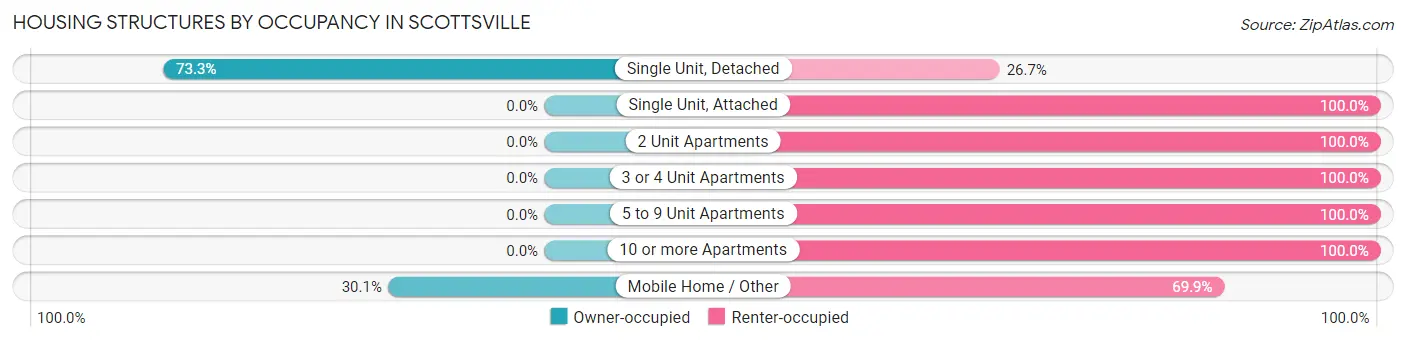
| Structure Type | Owner-occupied | Renter-occupied |
| Single Unit, Detached | 869 (73.3%) | 316 (26.7%) |
| Single Unit, Attached | 0 (0.0%) | 18 (100.0%) |
| 2 Unit Apartments | 0 (0.0%) | 32 (100.0%) |
| 3 or 4 Unit Apartments | 0 (0.0%) | 161 (100.0%) |
| 5 to 9 Unit Apartments | 0 (0.0%) | 92 (100.0%) |
| 10 or more Apartments | 0 (0.0%) | 127 (100.0%) |
| Mobile Home / Other | 37 (30.1%) | 86 (69.9%) |
| Total | 906 (52.1%) | 832 (47.9%) |
Housing Structures by Number of Rooms in Scottsville
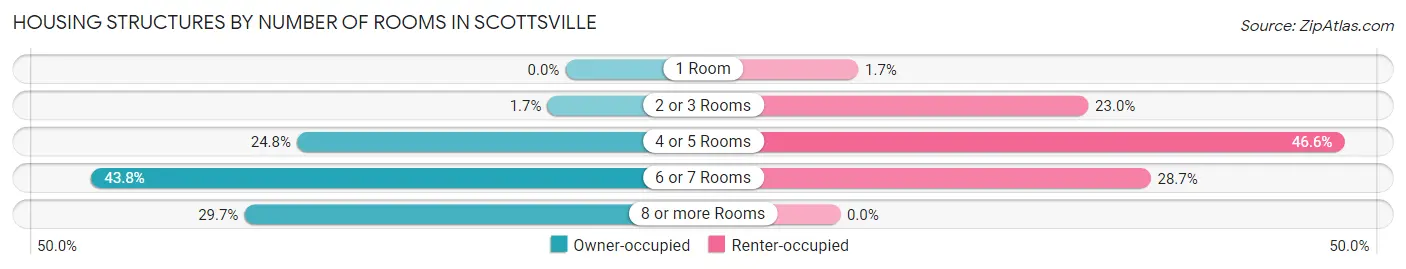
| Number of Rooms | Owner-occupied | Renter-occupied |
| 1 Room | 0 (0.0%) | 14 (1.7%) |
| 2 or 3 Rooms | 15 (1.7%) | 191 (23.0%) |
| 4 or 5 Rooms | 225 (24.8%) | 388 (46.6%) |
| 6 or 7 Rooms | 397 (43.8%) | 239 (28.7%) |
| 8 or more Rooms | 269 (29.7%) | 0 (0.0%) |
| Total | 906 (100.0%) | 832 (100.0%) |
Housing Structure by Heating Type in Scottsville
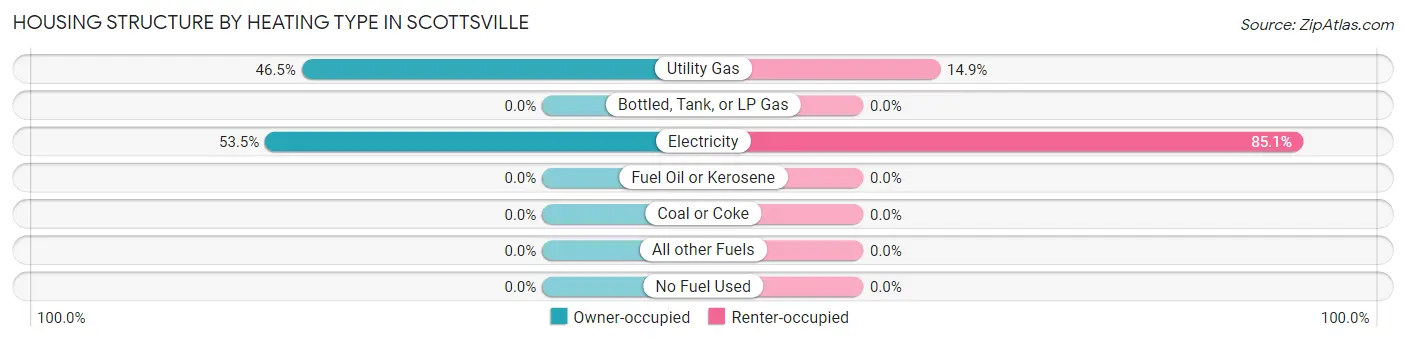
| Heating Type | Owner-occupied | Renter-occupied |
| Utility Gas | 421 (46.5%) | 124 (14.9%) |
| Bottled, Tank, or LP Gas | 0 (0.0%) | 0 (0.0%) |
| Electricity | 485 (53.5%) | 708 (85.1%) |
| Fuel Oil or Kerosene | 0 (0.0%) | 0 (0.0%) |
| Coal or Coke | 0 (0.0%) | 0 (0.0%) |
| All other Fuels | 0 (0.0%) | 0 (0.0%) |
| No Fuel Used | 0 (0.0%) | 0 (0.0%) |
| Total | 906 (100.0%) | 832 (100.0%) |
Household Vehicle Usage in Scottsville
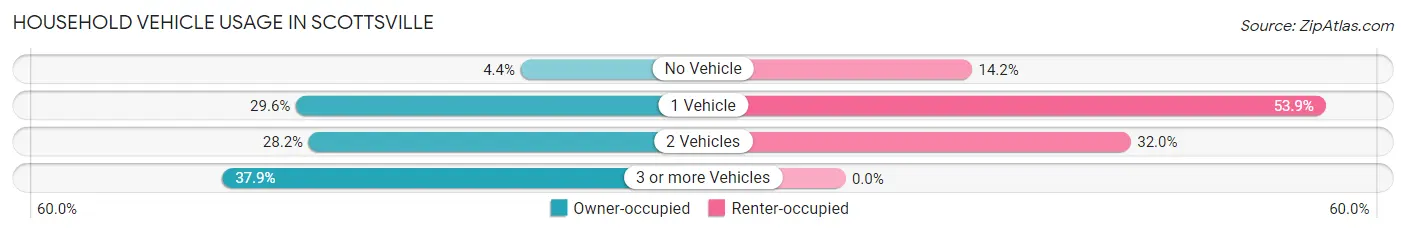
| Vehicles per Household | Owner-occupied | Renter-occupied |
| No Vehicle | 40 (4.4%) | 118 (14.2%) |
| 1 Vehicle | 268 (29.6%) | 448 (53.8%) |
| 2 Vehicles | 255 (28.1%) | 266 (32.0%) |
| 3 or more Vehicles | 343 (37.9%) | 0 (0.0%) |
| Total | 906 (100.0%) | 832 (100.0%) |
Real Estate & Mortgages in Scottsville
Real Estate and Mortgage Overview in Scottsville
| Characteristic | Without Mortgage | With Mortgage |
| Housing Units | 604 | 302 |
| Median Property Value | $109,500 | $128,000 |
| Median Household Income | $34,263 | $31 |
| Monthly Housing Costs | $300 | $0 |
| Real Estate Taxes | $818 | $32 |
Property Value by Mortgage Status in Scottsville
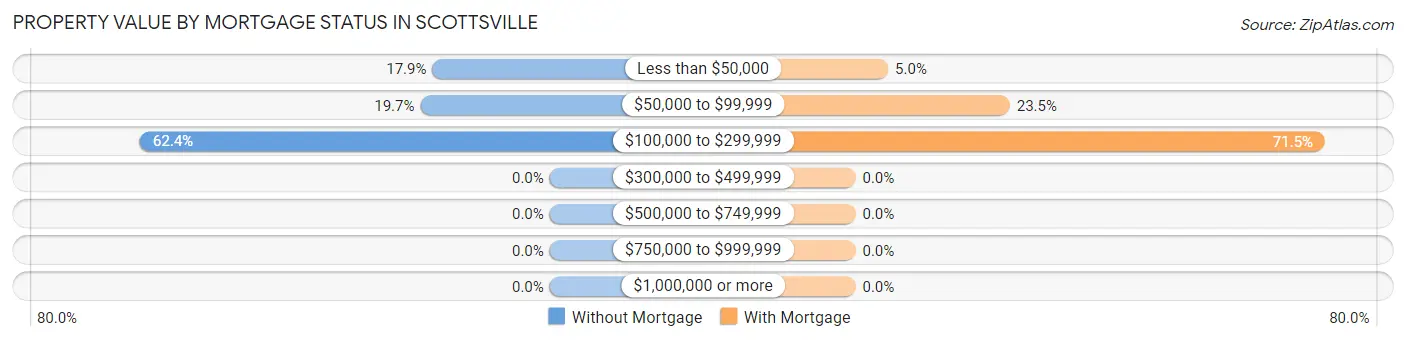
| Property Value | Without Mortgage | With Mortgage |
| Less than $50,000 | 108 (17.9%) | 15 (5.0%) |
| $50,000 to $99,999 | 119 (19.7%) | 71 (23.5%) |
| $100,000 to $299,999 | 377 (62.4%) | 216 (71.5%) |
| $300,000 to $499,999 | 0 (0.0%) | 0 (0.0%) |
| $500,000 to $749,999 | 0 (0.0%) | 0 (0.0%) |
| $750,000 to $999,999 | 0 (0.0%) | 0 (0.0%) |
| $1,000,000 or more | 0 (0.0%) | 0 (0.0%) |
| Total | 604 (100.0%) | 302 (100.0%) |
Household Income by Mortgage Status in Scottsville
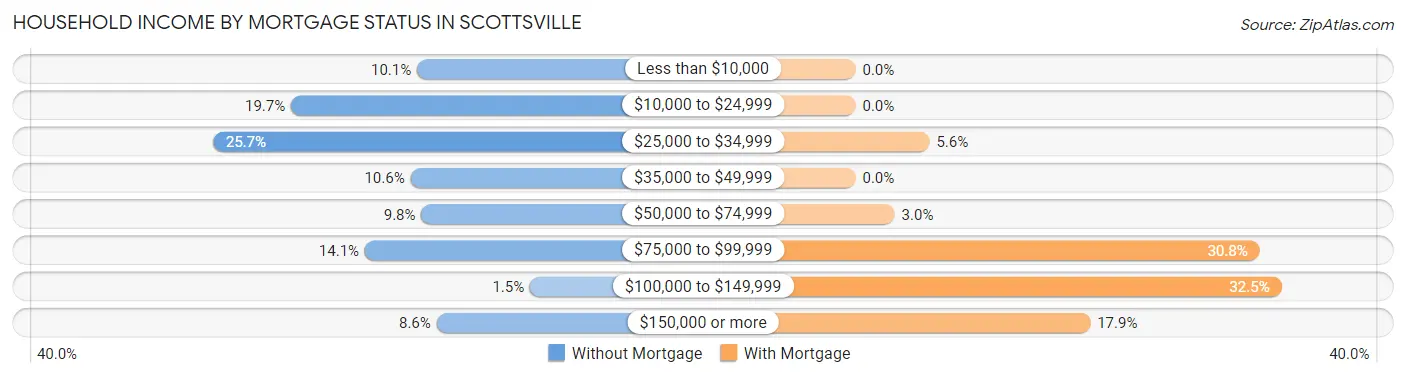
| Household Income | Without Mortgage | With Mortgage |
| Less than $10,000 | 61 (10.1%) | 0 (0.0%) |
| $10,000 to $24,999 | 119 (19.7%) | 0 (0.0%) |
| $25,000 to $34,999 | 155 (25.7%) | 17 (5.6%) |
| $35,000 to $49,999 | 64 (10.6%) | 0 (0.0%) |
| $50,000 to $74,999 | 59 (9.8%) | 9 (3.0%) |
| $75,000 to $99,999 | 85 (14.1%) | 93 (30.8%) |
| $100,000 to $149,999 | 9 (1.5%) | 98 (32.5%) |
| $150,000 or more | 52 (8.6%) | 54 (17.9%) |
| Total | 604 (100.0%) | 302 (100.0%) |
Property Value to Household Income Ratio in Scottsville
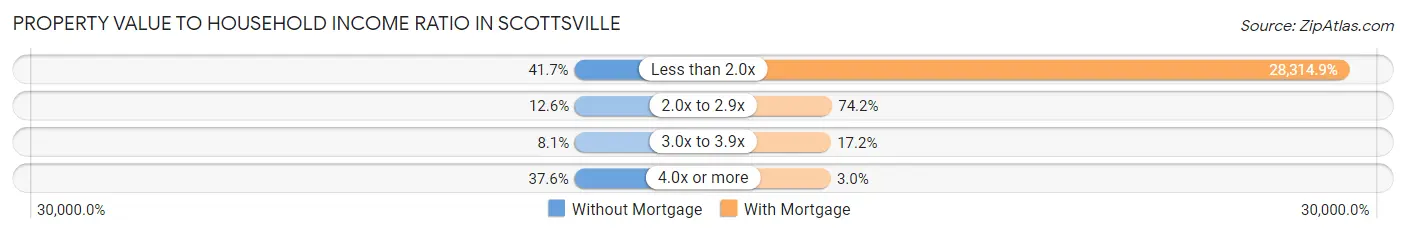
| Value-to-Income Ratio | Without Mortgage | With Mortgage |
| Less than 2.0x | 252 (41.7%) | 85,511 (28,314.9%) |
| 2.0x to 2.9x | 76 (12.6%) | 224 (74.2%) |
| 3.0x to 3.9x | 49 (8.1%) | 52 (17.2%) |
| 4.0x or more | 227 (37.6%) | 9 (3.0%) |
| Total | 604 (100.0%) | 302 (100.0%) |
Real Estate Taxes by Mortgage Status in Scottsville
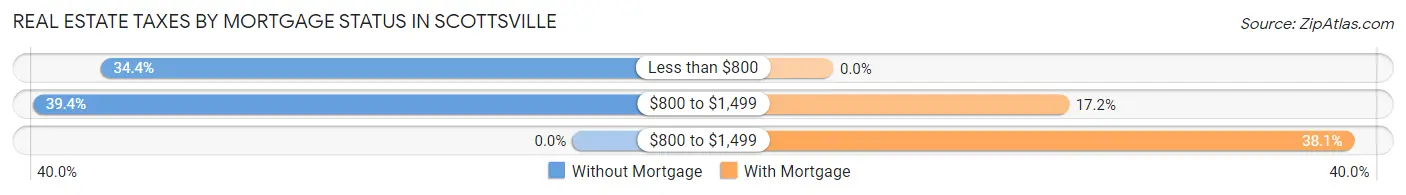
| Property Taxes | Without Mortgage | With Mortgage |
| Less than $800 | 208 (34.4%) | 0 (0.0%) |
| $800 to $1,499 | 238 (39.4%) | 52 (17.2%) |
| $800 to $1,499 | 0 (0.0%) | 115 (38.1%) |
| Total | 604 (100.0%) | 302 (100.0%) |
Health & Disability in Scottsville
Health Insurance Coverage by Age in Scottsville
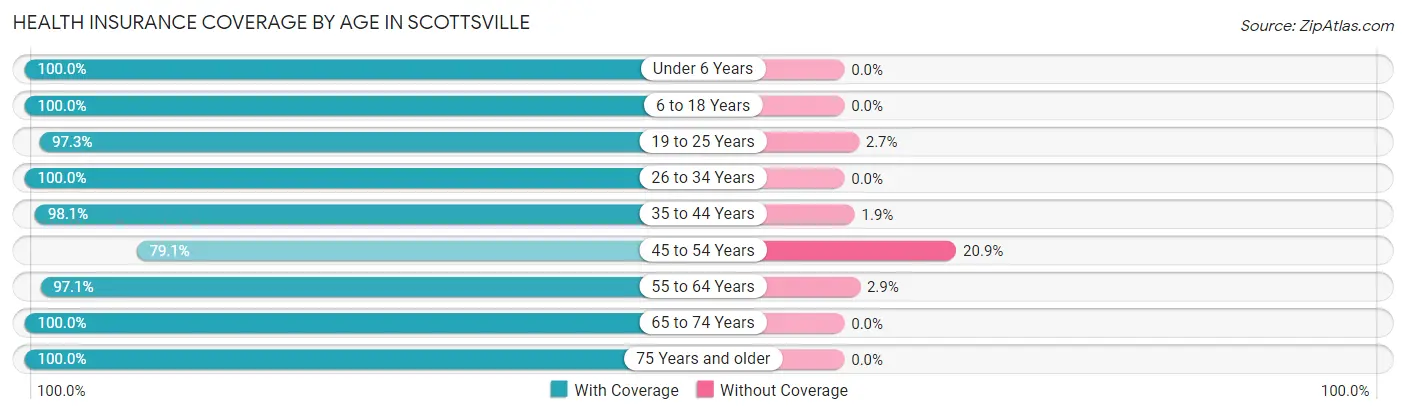
| Age Bracket | With Coverage | Without Coverage |
| Under 6 Years | 250 (100.0%) | 0 (0.0%) |
| 6 to 18 Years | 905 (100.0%) | 0 (0.0%) |
| 19 to 25 Years | 433 (97.3%) | 12 (2.7%) |
| 26 to 34 Years | 430 (100.0%) | 0 (0.0%) |
| 35 to 44 Years | 663 (98.1%) | 13 (1.9%) |
| 45 to 54 Years | 220 (79.1%) | 58 (20.9%) |
| 55 to 64 Years | 466 (97.1%) | 14 (2.9%) |
| 65 to 74 Years | 459 (100.0%) | 0 (0.0%) |
| 75 Years and older | 351 (100.0%) | 0 (0.0%) |
| Total | 4,177 (97.7%) | 97 (2.3%) |
Health Insurance Coverage by Citizenship Status in Scottsville
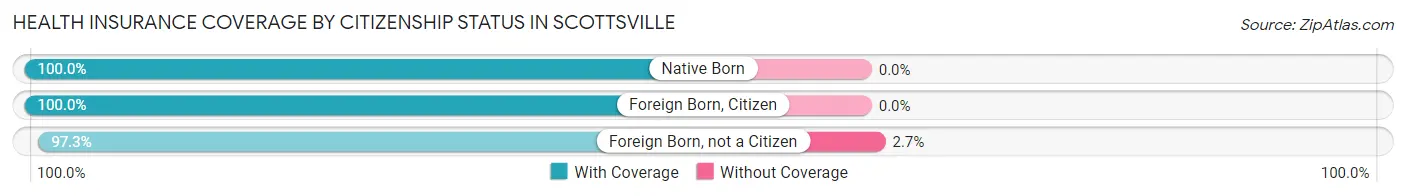
| Citizenship Status | With Coverage | Without Coverage |
| Native Born | 250 (100.0%) | 0 (0.0%) |
| Foreign Born, Citizen | 905 (100.0%) | 0 (0.0%) |
| Foreign Born, not a Citizen | 433 (97.3%) | 12 (2.7%) |
Health Insurance Coverage by Household Income in Scottsville
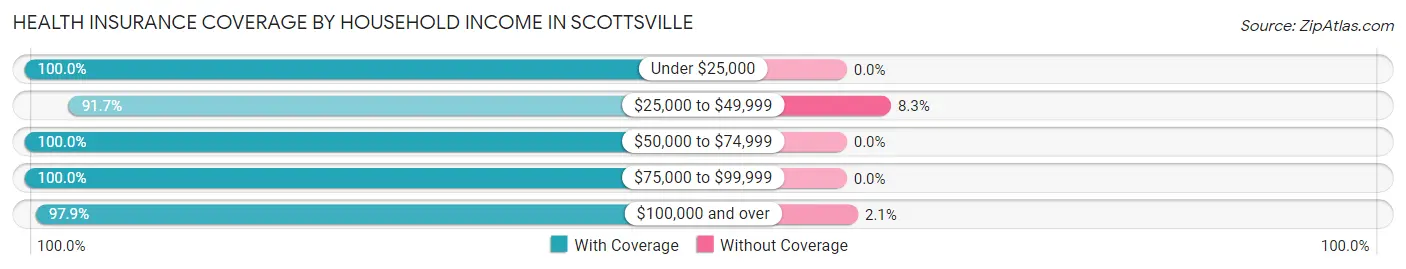
| Household Income | With Coverage | Without Coverage |
| Under $25,000 | 1,338 (100.0%) | 0 (0.0%) |
| $25,000 to $49,999 | 931 (91.7%) | 84 (8.3%) |
| $50,000 to $74,999 | 630 (100.0%) | 0 (0.0%) |
| $75,000 to $99,999 | 671 (100.0%) | 0 (0.0%) |
| $100,000 and over | 602 (97.9%) | 13 (2.1%) |
Public vs Private Health Insurance Coverage by Age in Scottsville
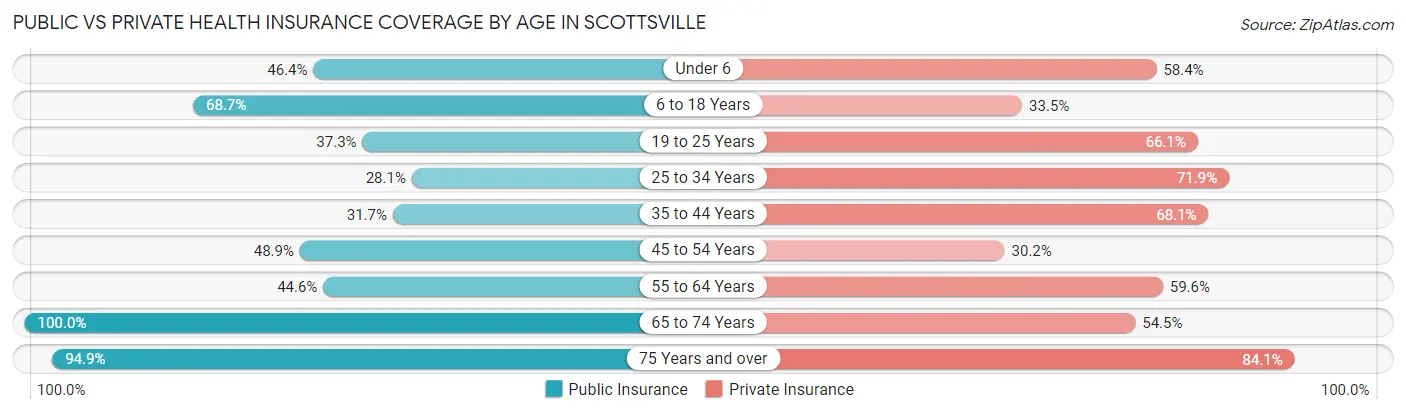
| Age Bracket | Public Insurance | Private Insurance |
| Under 6 | 116 (46.4%) | 146 (58.4%) |
| 6 to 18 Years | 622 (68.7%) | 303 (33.5%) |
| 19 to 25 Years | 166 (37.3%) | 294 (66.1%) |
| 25 to 34 Years | 121 (28.1%) | 309 (71.9%) |
| 35 to 44 Years | 214 (31.7%) | 460 (68.0%) |
| 45 to 54 Years | 136 (48.9%) | 84 (30.2%) |
| 55 to 64 Years | 214 (44.6%) | 286 (59.6%) |
| 65 to 74 Years | 459 (100.0%) | 250 (54.5%) |
| 75 Years and over | 333 (94.9%) | 295 (84.1%) |
| Total | 2,381 (55.7%) | 2,427 (56.8%) |
Disability Status by Sex by Age in Scottsville
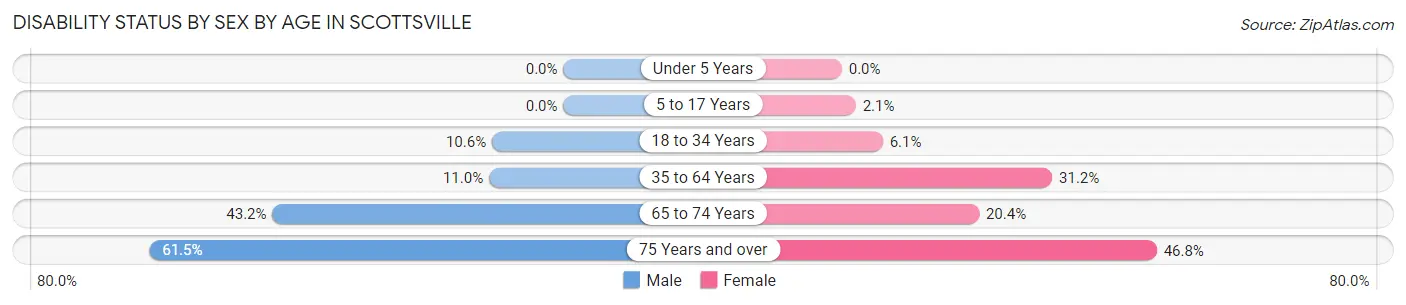
| Age Bracket | Male | Female |
| Under 5 Years | 0 (0.0%) | 0 (0.0%) |
| 5 to 17 Years | 0 (0.0%) | 9 (2.1%) |
| 18 to 34 Years | 39 (10.6%) | 32 (6.1%) |
| 35 to 64 Years | 71 (11.0%) | 247 (31.2%) |
| 65 to 74 Years | 105 (43.2%) | 44 (20.4%) |
| 75 Years and over | 83 (61.5%) | 101 (46.8%) |
Disability Class by Sex by Age in Scottsville
Disability Class: Hearing Difficulty
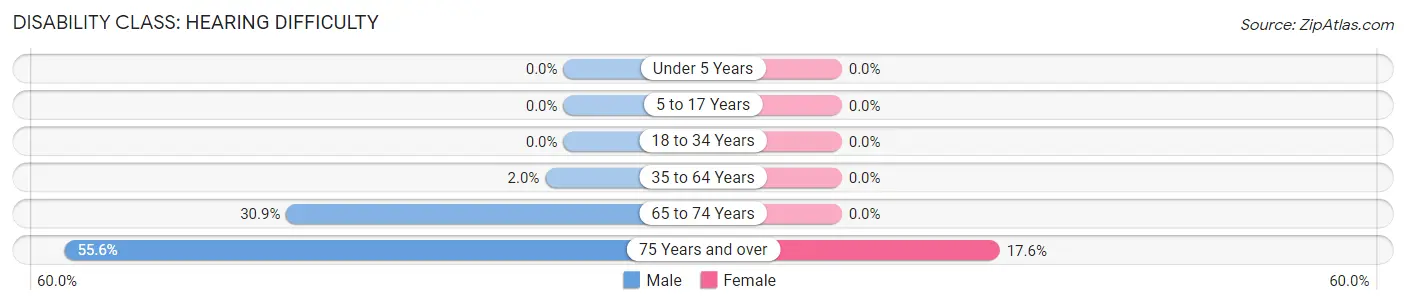
| Age Bracket | Male | Female |
| Under 5 Years | 0 (0.0%) | 0 (0.0%) |
| 5 to 17 Years | 0 (0.0%) | 0 (0.0%) |
| 18 to 34 Years | 0 (0.0%) | 0 (0.0%) |
| 35 to 64 Years | 13 (2.0%) | 0 (0.0%) |
| 65 to 74 Years | 75 (30.9%) | 0 (0.0%) |
| 75 Years and over | 75 (55.6%) | 38 (17.6%) |
Disability Class: Vision Difficulty
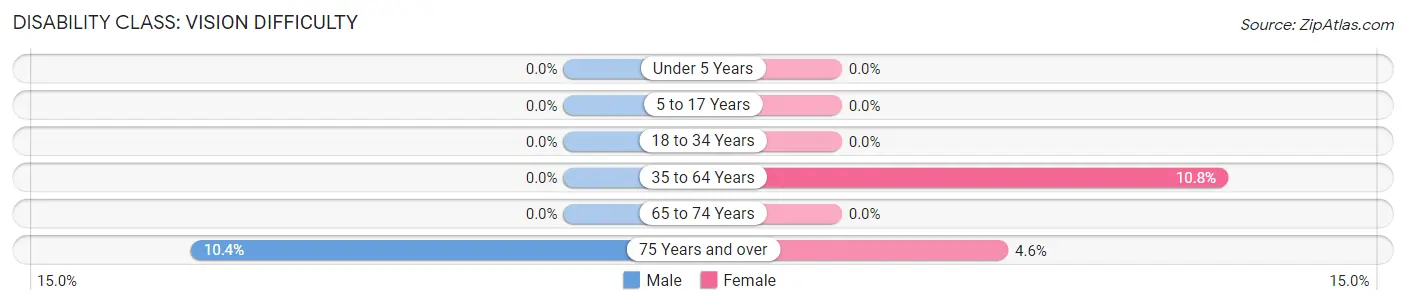
| Age Bracket | Male | Female |
| Under 5 Years | 0 (0.0%) | 0 (0.0%) |
| 5 to 17 Years | 0 (0.0%) | 0 (0.0%) |
| 18 to 34 Years | 0 (0.0%) | 0 (0.0%) |
| 35 to 64 Years | 0 (0.0%) | 85 (10.7%) |
| 65 to 74 Years | 0 (0.0%) | 0 (0.0%) |
| 75 Years and over | 14 (10.4%) | 10 (4.6%) |
Disability Class: Cognitive Difficulty
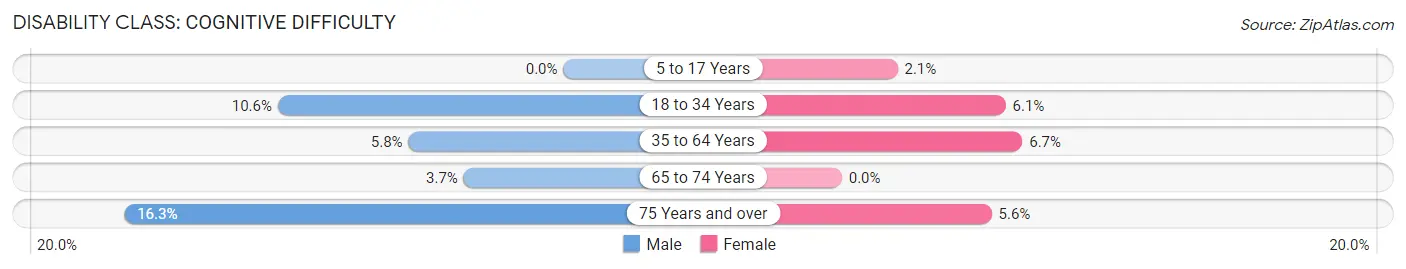
| Age Bracket | Male | Female |
| 5 to 17 Years | 0 (0.0%) | 9 (2.1%) |
| 18 to 34 Years | 39 (10.6%) | 32 (6.1%) |
| 35 to 64 Years | 37 (5.8%) | 53 (6.7%) |
| 65 to 74 Years | 9 (3.7%) | 0 (0.0%) |
| 75 Years and over | 22 (16.3%) | 12 (5.6%) |
Disability Class: Ambulatory Difficulty
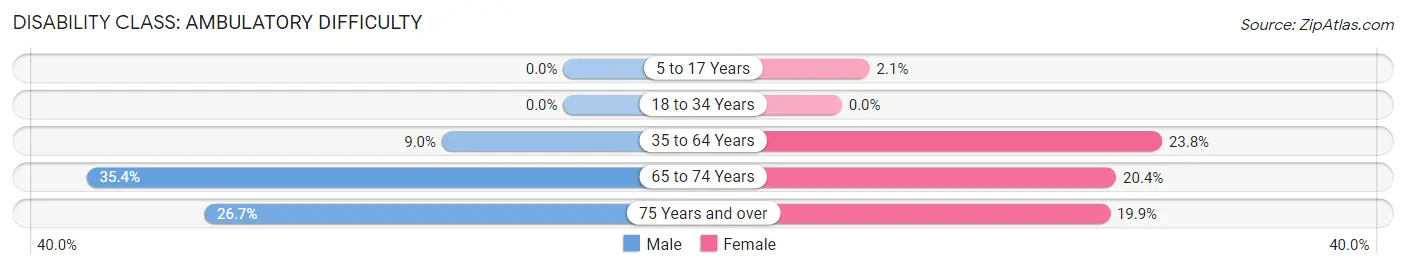
| Age Bracket | Male | Female |
| 5 to 17 Years | 0 (0.0%) | 9 (2.1%) |
| 18 to 34 Years | 0 (0.0%) | 0 (0.0%) |
| 35 to 64 Years | 58 (9.0%) | 188 (23.8%) |
| 65 to 74 Years | 86 (35.4%) | 44 (20.4%) |
| 75 Years and over | 36 (26.7%) | 43 (19.9%) |
Disability Class: Self-Care Difficulty
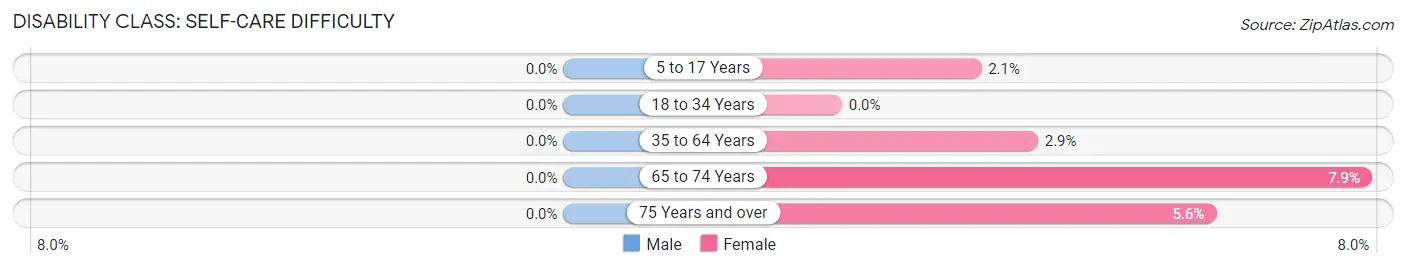
| Age Bracket | Male | Female |
| 5 to 17 Years | 0 (0.0%) | 9 (2.1%) |
| 18 to 34 Years | 0 (0.0%) | 0 (0.0%) |
| 35 to 64 Years | 0 (0.0%) | 23 (2.9%) |
| 65 to 74 Years | 0 (0.0%) | 17 (7.9%) |
| 75 Years and over | 0 (0.0%) | 12 (5.6%) |
Technology Access in Scottsville
Computing Device Access in Scottsville
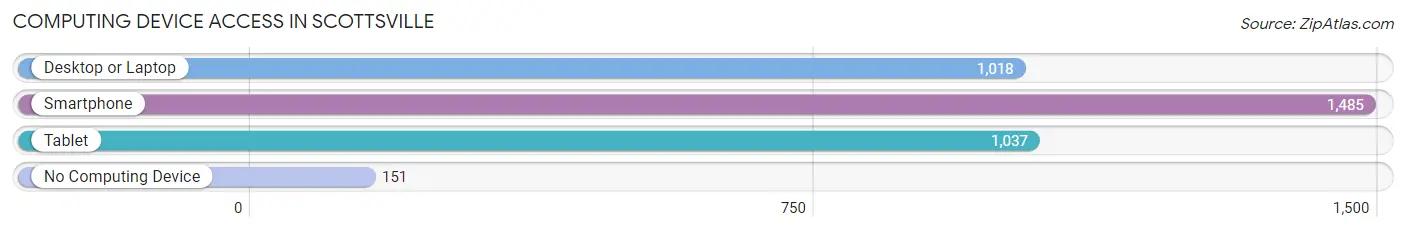
| Device Type | # Households | % Households |
| Desktop or Laptop | 1,018 | 58.6% |
| Smartphone | 1,485 | 85.4% |
| Tablet | 1,037 | 59.7% |
| No Computing Device | 151 | 8.7% |
| Total | 1,738 | 100.0% |
Internet Access in Scottsville
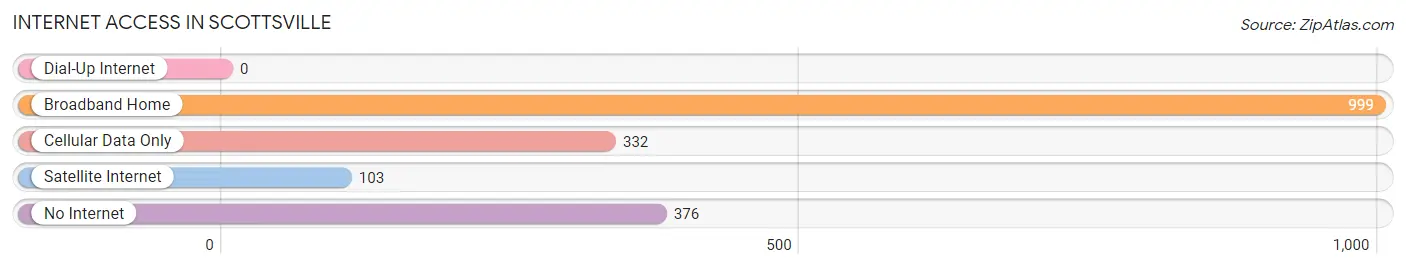
| Internet Type | # Households | % Households |
| Dial-Up Internet | 0 | 0.0% |
| Broadband Home | 999 | 57.5% |
| Cellular Data Only | 332 | 19.1% |
| Satellite Internet | 103 | 5.9% |
| No Internet | 376 | 21.6% |
| Total | 1,738 | 100.0% |
Scottsville Summary
Scottsville, Kentucky is a small town located in Allen County, Kentucky. It is the county seat of Allen County and is located in the south-central part of the state. The population of Scottsville was 2,077 at the 2010 census.
History
Scottsville was founded in 1817 by William Scott, a Revolutionary War veteran. The town was named after him and was incorporated in 1820. The town was originally located on the banks of the Barren River, but was moved to its current location in 1836 due to flooding.
Scottsville was an important stop on the Louisville and Nashville Railroad, which was completed in 1859. The railroad brought economic growth to the town and allowed for the development of a variety of industries, including a flour mill, a sawmill, and a cotton gin.
The town was also an important stop on the Underground Railroad, which was used by slaves escaping to freedom in the North. The town was home to several prominent abolitionists, including the Reverend John G. Fee, who founded Berea College in 1855.
Geography
Scottsville is located in south-central Kentucky, approximately 40 miles north of Nashville, Tennessee. The town is situated on the banks of the Barren River, which flows through the town and is a tributary of the Green River.
The town is located in a hilly region of the state, with elevations ranging from 600 to 900 feet above sea level. The climate is humid subtropical, with hot summers and mild winters.
Economy
The economy of Scottsville is largely based on agriculture and manufacturing. The town is home to several large farms, which produce corn, soybeans, wheat, and hay. The town is also home to several manufacturing companies, including a furniture factory, a plastics factory, and a paper mill.
The town is also home to several small businesses, including restaurants, retail stores, and service providers. The town is also home to a branch of the Allen County Public Library.
Demographics
As of the 2010 census, the population of Scottsville was 2,077. The racial makeup of the town was 95.3% White, 2.2% African American, 0.3% Native American, 0.2% Asian, 0.1% Pacific Islander, 0.7% from other races, and 1.4% from two or more races. Hispanic or Latino of any race were 1.7% of the population.
The median household income in Scottsville was $31,250, and the median family income was $37,500. The per capita income for the town was $17,845. About 17.2% of families and 20.2% of the population were below the poverty line, including 28.3% of those under age 18 and 11.2% of those age 65 or over.
Conclusion
Scottsville, Kentucky is a small town located in Allen County, Kentucky. It is the county seat of Allen County and is located in the south-central part of the state. The town was founded in 1817 by William Scott and was an important stop on the Louisville and Nashville Railroad and the Underground Railroad. The economy of Scottsville is largely based on agriculture and manufacturing, and the town is home to several small businesses. As of the 2010 census, the population of Scottsville was 2,077. The median household income in Scottsville was $31,250, and the median family income was $37,500.
Common Questions
What is Per Capita Income in Scottsville?
Per Capita income in Scottsville is $24,319.
What is the Median Family Income in Scottsville?
Median Family Income in Scottsville is $42,094.
What is the Median Household income in Scottsville?
Median Household Income in Scottsville is $34,835.
What is Income or Wage Gap in Scottsville?
Income or Wage Gap in Scottsville is 37.7%.
Women in Scottsville earn 62.3 cents for every dollar earned by a man.
What is Inequality or Gini Index in Scottsville?
Inequality or Gini Index in Scottsville is 0.50.
What is the Total Population of Scottsville?
Total Population of Scottsville is 4,332.
What is the Total Male Population of Scottsville?
Total Male Population of Scottsville is 1,988.
What is the Total Female Population of Scottsville?
Total Female Population of Scottsville is 2,344.
What is the Ratio of Males per 100 Females in Scottsville?
There are 84.81 Males per 100 Females in Scottsville.
What is the Ratio of Females per 100 Males in Scottsville?
There are 117.91 Females per 100 Males in Scottsville.
What is the Median Population Age in Scottsville?
Median Population Age in Scottsville is 36.1 Years.
What is the Average Family Size in Scottsville
Average Family Size in Scottsville is 2.9 People.
What is the Average Household Size in Scottsville
Average Household Size in Scottsville is 2.5 People.
How Large is the Labor Force in Scottsville?
There are 1,965 People in the Labor Forcein in Scottsville.
What is the Percentage of People in the Labor Force in Scottsville?
60.0% of People are in the Labor Force in Scottsville.
What is the Unemployment Rate in Scottsville?
Unemployment Rate in Scottsville is 16.2%.