Zip Codes with the Highest Percentage of Population Employed in Real Estate, Rental & Leasing in Kentucky
RELATED REPORTS & OPTIONS
Real Estate, Rental & Leasing
Kentucky
Compare Zip Codes
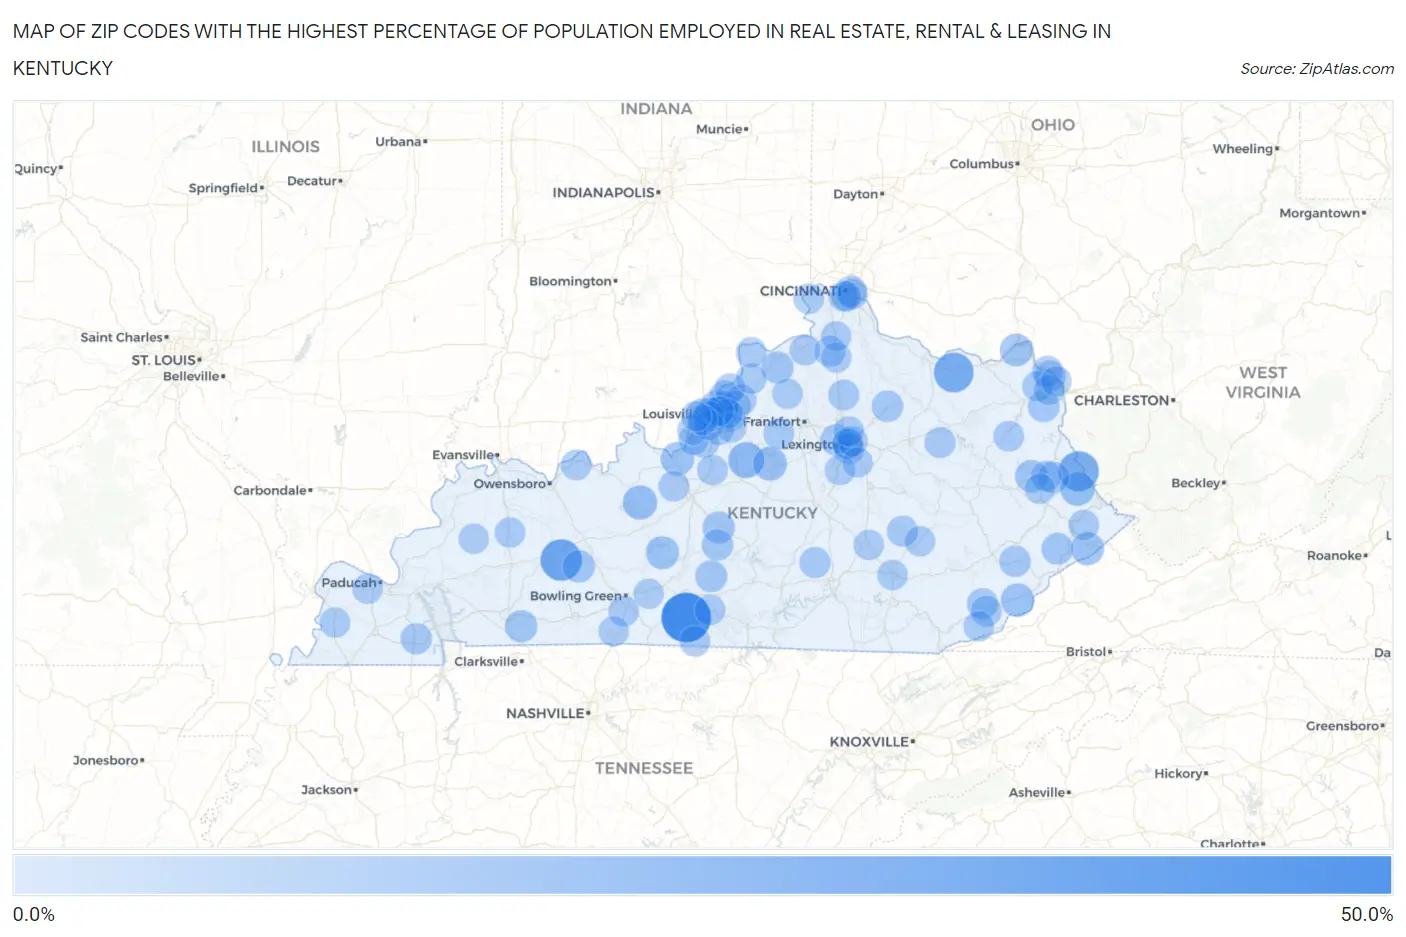
Map of Zip Codes with the Highest Percentage of Population Employed in Real Estate, Rental & Leasing in Kentucky
0.0%
50.0%
Zip Codes with the Highest Percentage of Population Employed in Real Estate, Rental & Leasing in Kentucky
| Zip Code | % Employed | vs State | vs National | |
| 1. | 42131 | 43.3% | 1.4%(+42.0)#1 | 1.9%(+41.4)#23 |
| 2. | 42326 | 25.7% | 1.4%(+24.3)#2 | 1.9%(+23.8)#68 |
| 3. | 41203 | 22.9% | 1.4%(+21.5)#3 | 1.9%(+21.0)#87 |
| 4. | 41189 | 22.0% | 1.4%(+20.6)#4 | 1.9%(+20.1)#91 |
| 5. | 40020 | 13.6% | 1.4%(+12.3)#5 | 1.9%(+11.7)#213 |
| 6. | 40145 | 10.1% | 1.4%(+8.79)#6 | 1.9%(+8.25)#370 |
| 7. | 41250 | 10.1% | 1.4%(+8.75)#7 | 1.9%(+8.22)#373 |
| 8. | 40012 | 9.4% | 1.4%(+8.01)#8 | 1.9%(+7.47)#436 |
| 9. | 40155 | 8.2% | 1.4%(+6.81)#9 | 1.9%(+6.28)#532 |
| 10. | 40823 | 8.1% | 1.4%(+6.69)#10 | 1.9%(+6.16)#547 |
| 11. | 42729 | 7.9% | 1.4%(+6.58)#11 | 1.9%(+6.05)#563 |
| 12. | 41522 | 7.6% | 1.4%(+6.29)#12 | 1.9%(+5.76)#612 |
| 13. | 41174 | 6.8% | 1.4%(+5.47)#13 | 1.9%(+4.94)#762 |
| 14. | 41256 | 6.5% | 1.4%(+5.17)#14 | 1.9%(+4.64)#814 |
| 15. | 42273 | 6.4% | 1.4%(+5.06)#15 | 1.9%(+4.53)#845 |
| 16. | 42716 | 5.9% | 1.4%(+4.51)#16 | 1.9%(+3.98)#1,021 |
| 17. | 40075 | 5.8% | 1.4%(+4.46)#17 | 1.9%(+3.93)#1,037 |
| 18. | 42266 | 5.7% | 1.4%(+4.39)#18 | 1.9%(+3.85)#1,057 |
| 19. | 42214 | 5.6% | 1.4%(+4.20)#19 | 1.9%(+3.66)#1,130 |
| 20. | 41572 | 5.3% | 1.4%(+3.95)#20 | 1.9%(+3.42)#1,239 |
| 21. | 40510 | 4.9% | 1.4%(+3.51)#21 | 1.9%(+2.98)#1,463 |
| 22. | 41168 | 4.8% | 1.4%(+3.45)#22 | 1.9%(+2.92)#1,498 |
| 23. | 40348 | 4.5% | 1.4%(+3.17)#23 | 1.9%(+2.64)#1,698 |
| 24. | 40025 | 4.5% | 1.4%(+3.13)#24 | 1.9%(+2.60)#1,724 |
| 25. | 40059 | 4.5% | 1.4%(+3.11)#25 | 1.9%(+2.57)#1,746 |
| 26. | 42782 | 4.4% | 1.4%(+3.01)#26 | 1.9%(+2.48)#1,814 |
| 27. | 41204 | 4.4% | 1.4%(+3.01)#27 | 1.9%(+2.48)#1,819 |
| 28. | 41759 | 4.2% | 1.4%(+2.89)#28 | 1.9%(+2.36)#1,921 |
| 29. | 42020 | 4.2% | 1.4%(+2.83)#29 | 1.9%(+2.30)#1,962 |
| 30. | 41074 | 3.8% | 1.4%(+2.42)#30 | 1.9%(+1.88)#2,412 |
| 31. | 41035 | 3.7% | 1.4%(+2.30)#31 | 1.9%(+1.76)#2,581 |
| 32. | 42516 | 3.6% | 1.4%(+2.28)#32 | 1.9%(+1.74)#2,605 |
| 33. | 40447 | 3.6% | 1.4%(+2.24)#33 | 1.9%(+1.71)#2,673 |
| 34. | 40056 | 3.5% | 1.4%(+2.17)#34 | 1.9%(+1.64)#2,787 |
| 35. | 40810 | 3.5% | 1.4%(+2.12)#35 | 1.9%(+1.59)#2,885 |
| 36. | 41169 | 3.4% | 1.4%(+2.08)#36 | 1.9%(+1.54)#2,956 |
| 37. | 40370 | 3.4% | 1.4%(+2.07)#37 | 1.9%(+1.54)#2,961 |
| 38. | 40358 | 3.4% | 1.4%(+2.05)#38 | 1.9%(+1.52)#3,005 |
| 39. | 40207 | 3.4% | 1.4%(+1.99)#39 | 1.9%(+1.46)#3,127 |
| 40. | 40109 | 3.3% | 1.4%(+1.93)#40 | 1.9%(+1.40)#3,222 |
| 41. | 40806 | 3.3% | 1.4%(+1.92)#41 | 1.9%(+1.39)#3,257 |
| 42. | 40203 | 3.3% | 1.4%(+1.91)#42 | 1.9%(+1.38)#3,277 |
| 43. | 41183 | 3.1% | 1.4%(+1.78)#43 | 1.9%(+1.25)#3,544 |
| 44. | 41086 | 3.1% | 1.4%(+1.74)#44 | 1.9%(+1.21)#3,617 |
| 45. | 41260 | 3.1% | 1.4%(+1.71)#45 | 1.9%(+1.18)#3,699 |
| 46. | 40076 | 3.0% | 1.4%(+1.68)#46 | 1.9%(+1.15)#3,788 |
| 47. | 40242 | 3.0% | 1.4%(+1.67)#47 | 1.9%(+1.14)#3,798 |
| 48. | 40243 | 2.9% | 1.4%(+1.57)#48 | 1.9%(+1.04)#4,088 |
| 49. | 40502 | 2.8% | 1.4%(+1.48)#49 | 1.9%(+0.951)#4,317 |
| 50. | 40508 | 2.8% | 1.4%(+1.47)#50 | 1.9%(+0.938)#4,356 |
| 51. | 41171 | 2.8% | 1.4%(+1.45)#51 | 1.9%(+0.913)#4,427 |
| 52. | 40014 | 2.8% | 1.4%(+1.39)#52 | 1.9%(+0.861)#4,571 |
| 53. | 40150 | 2.7% | 1.4%(+1.34)#53 | 1.9%(+0.812)#4,732 |
| 54. | 40241 | 2.7% | 1.4%(+1.31)#54 | 1.9%(+0.779)#4,850 |
| 55. | 42166 | 2.7% | 1.4%(+1.31)#55 | 1.9%(+0.778)#4,857 |
| 56. | 42104 | 2.6% | 1.4%(+1.28)#56 | 1.9%(+0.751)#4,956 |
| 57. | 40162 | 2.6% | 1.4%(+1.27)#57 | 1.9%(+0.735)#5,013 |
| 58. | 40228 | 2.6% | 1.4%(+1.27)#58 | 1.9%(+0.734)#5,018 |
| 59. | 42140 | 2.6% | 1.4%(+1.26)#59 | 1.9%(+0.726)#5,043 |
| 60. | 42351 | 2.6% | 1.4%(+1.25)#60 | 1.9%(+0.717)#5,070 |
| 61. | 41011 | 2.6% | 1.4%(+1.22)#61 | 1.9%(+0.691)#5,152 |
| 62. | 41557 | 2.6% | 1.4%(+1.21)#62 | 1.9%(+0.676)#5,215 |
| 63. | 40026 | 2.5% | 1.4%(+1.15)#63 | 1.9%(+0.622)#5,435 |
| 64. | 40055 | 2.5% | 1.4%(+1.14)#64 | 1.9%(+0.606)#5,500 |
| 65. | 40057 | 2.4% | 1.4%(+1.09)#65 | 1.9%(+0.557)#5,684 |
| 66. | 42413 | 2.4% | 1.4%(+1.08)#66 | 1.9%(+0.552)#5,701 |
| 67. | 41121 | 2.4% | 1.4%(+1.06)#67 | 1.9%(+0.525)#5,826 |
| 68. | 41080 | 2.4% | 1.4%(+1.04)#68 | 1.9%(+0.508)#5,899 |
| 69. | 42021 | 2.4% | 1.4%(+1.03)#69 | 1.9%(+0.499)#5,935 |
| 70. | 40456 | 2.4% | 1.4%(+0.996)#70 | 1.9%(+0.463)#6,084 |
| 71. | 41102 | 2.3% | 1.4%(+0.962)#71 | 1.9%(+0.430)#6,214 |
| 72. | 40741 | 2.3% | 1.4%(+0.953)#72 | 1.9%(+0.420)#6,258 |
| 73. | 41075 | 2.3% | 1.4%(+0.935)#73 | 1.9%(+0.403)#6,330 |
| 74. | 40045 | 2.3% | 1.4%(+0.923)#74 | 1.9%(+0.391)#6,386 |
| 75. | 41097 | 2.3% | 1.4%(+0.916)#75 | 1.9%(+0.384)#6,421 |
| 76. | 42001 | 2.3% | 1.4%(+0.902)#76 | 1.9%(+0.370)#6,505 |
| 77. | 41101 | 2.3% | 1.4%(+0.893)#77 | 1.9%(+0.361)#6,556 |
| 78. | 41216 | 2.2% | 1.4%(+0.891)#78 | 1.9%(+0.358)#6,571 |
| 79. | 40486 | 2.2% | 1.4%(+0.875)#79 | 1.9%(+0.343)#6,633 |
| 80. | 40206 | 2.2% | 1.4%(+0.861)#80 | 1.9%(+0.328)#6,718 |
| 81. | 40831 | 2.2% | 1.4%(+0.850)#81 | 1.9%(+0.317)#6,764 |
| 82. | 41014 | 2.2% | 1.4%(+0.838)#82 | 1.9%(+0.306)#6,824 |
| 83. | 40299 | 2.2% | 1.4%(+0.834)#83 | 1.9%(+0.302)#6,839 |
| 84. | 40507 | 2.2% | 1.4%(+0.825)#84 | 1.9%(+0.293)#6,880 |
| 85. | 40356 | 2.1% | 1.4%(+0.760)#85 | 1.9%(+0.228)#7,219 |
| 86. | 40223 | 2.1% | 1.4%(+0.746)#86 | 1.9%(+0.213)#7,299 |
| 87. | 40204 | 2.1% | 1.4%(+0.741)#87 | 1.9%(+0.209)#7,315 |
| 88. | 40272 | 2.1% | 1.4%(+0.732)#88 | 1.9%(+0.200)#7,362 |
| 89. | 40213 | 2.1% | 1.4%(+0.730)#89 | 1.9%(+0.198)#7,373 |
| 90. | 40505 | 2.1% | 1.4%(+0.725)#90 | 1.9%(+0.192)#7,399 |
| 91. | 40222 | 2.1% | 1.4%(+0.715)#91 | 1.9%(+0.183)#7,447 |
| 92. | 40258 | 2.1% | 1.4%(+0.704)#92 | 1.9%(+0.172)#7,516 |
| 93. | 42159 | 2.1% | 1.4%(+0.704)#93 | 1.9%(+0.171)#7,519 |
| 94. | 40208 | 2.1% | 1.4%(+0.703)#94 | 1.9%(+0.170)#7,524 |
| 95. | 42134 | 2.1% | 1.4%(+0.702)#95 | 1.9%(+0.170)#7,528 |
| 96. | 41030 | 2.0% | 1.4%(+0.673)#96 | 1.9%(+0.140)#7,679 |
| 97. | 42450 | 2.0% | 1.4%(+0.671)#97 | 1.9%(+0.139)#7,686 |
| 98. | 40511 | 2.0% | 1.4%(+0.656)#98 | 1.9%(+0.123)#7,761 |
| 99. | 40211 | 2.0% | 1.4%(+0.635)#99 | 1.9%(+0.102)#7,875 |
| 100. | 40515 | 2.0% | 1.4%(+0.634)#100 | 1.9%(+0.102)#7,878 |
Common Questions
What are the Top 10 Zip Codes with the Highest Percentage of Population Employed in Real Estate, Rental & Leasing in Kentucky?
Top 10 Zip Codes with the Highest Percentage of Population Employed in Real Estate, Rental & Leasing in Kentucky are:
What zip code has the Highest Percentage of Population Employed in Real Estate, Rental & Leasing in Kentucky?
42131 has the Highest Percentage of Population Employed in Real Estate, Rental & Leasing in Kentucky with 43.3%.
What is the Percentage of Population Employed in Real Estate, Rental & Leasing in the State of Kentucky?
Percentage of Population Employed in Real Estate, Rental & Leasing in Kentucky is 1.4%.
What is the Percentage of Population Employed in Real Estate, Rental & Leasing in the United States?
Percentage of Population Employed in Real Estate, Rental & Leasing in the United States is 1.9%.