Hunters Hollow, KY Map & Demographics
Hunters Hollow Map
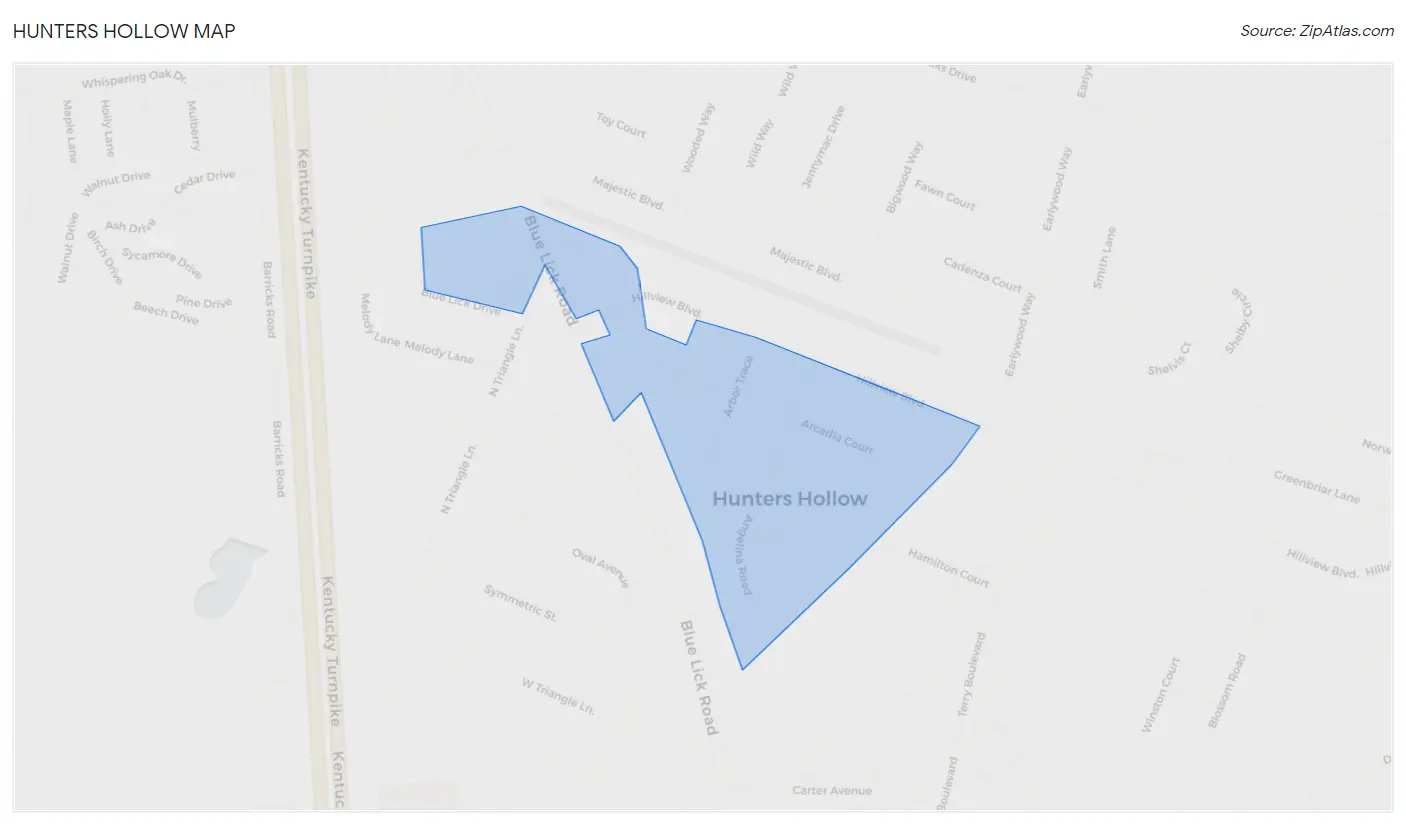
Hunters Hollow Overview
$30,752
PER CAPITA INCOME
$90,000
AVG FAMILY INCOME
$66,607
AVG HOUSEHOLD INCOME
18.5%
WAGE / INCOME GAP [ % ]
81.5¢/ $1
WAGE / INCOME GAP [ $ ]
0.36
INEQUALITY / GINI INDEX
327
TOTAL POPULATION
163
MALE POPULATION
164
FEMALE POPULATION
99.39
MALES / 100 FEMALES
100.61
FEMALES / 100 MALES
34.3
MEDIAN AGE
3.2
AVG FAMILY SIZE
2.5
AVG HOUSEHOLD SIZE
177
LABOR FORCE [ PEOPLE ]
66.8%
PERCENT IN LABOR FORCE
4.0%
UNEMPLOYMENT RATE
Hunters Hollow Area Codes
Income in Hunters Hollow
Income Overview in Hunters Hollow
Per Capita Income in Hunters Hollow is $30,752, while median incomes of families and households are $90,000 and $66,607 respectively.
| Characteristic | Number | Measure |
| Per Capita Income | 327 | $30,752 |
| Median Family Income | 80 | $90,000 |
| Mean Family Income | 80 | $94,165 |
| Median Household Income | 129 | $66,607 |
| Mean Household Income | 129 | $75,444 |
| Income Deficit | 80 | $0 |
| Wage / Income Gap (%) | 327 | 18.52% |
| Wage / Income Gap ($) | 327 | 81.48¢ per $1 |
| Gini / Inequality Index | 327 | 0.36 |
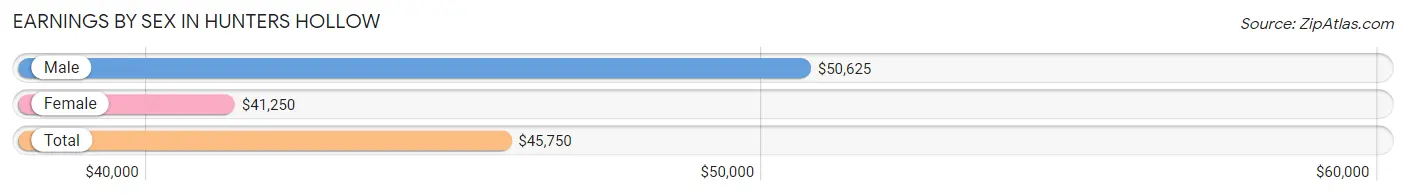
Earnings by Sex in Hunters Hollow
Average Earnings in Hunters Hollow are $45,750, $50,625 for men and $41,250 for women, a difference of 18.5%.
| Sex | Number | Average Earnings |
| Male | 89 (47.8%) | $50,625 |
| Female | 97 (52.1%) | $41,250 |
| Total | 186 (100.0%) | $45,750 |
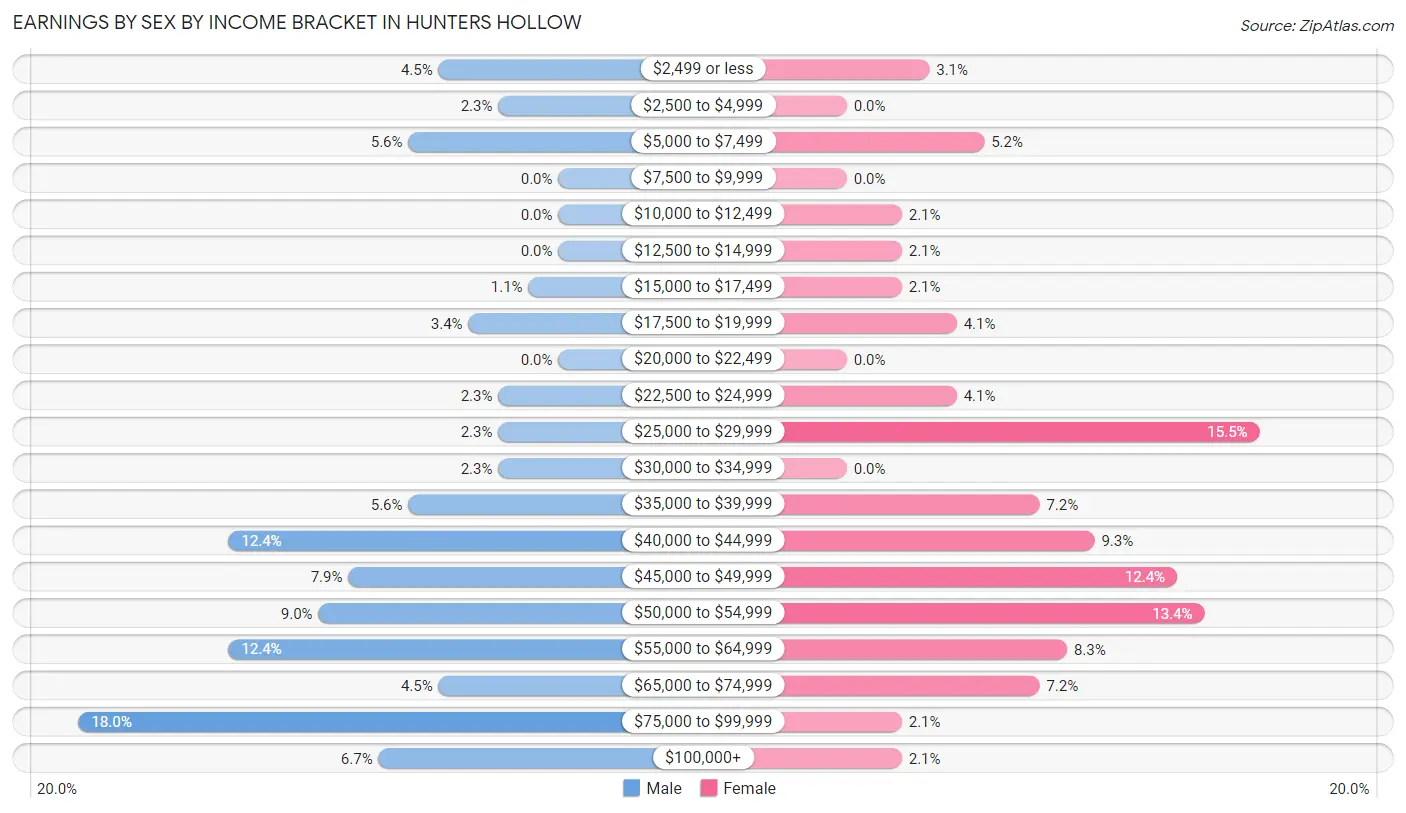
Earnings by Sex by Income Bracket in Hunters Hollow
The most common earnings brackets in Hunters Hollow are $75,000 to $99,999 for men (16 | 18.0%) and $25,000 to $29,999 for women (15 | 15.5%).
| Income | Male | Female |
| $2,499 or less | 4 (4.5%) | 3 (3.1%) |
| $2,500 to $4,999 | 2 (2.2%) | 0 (0.0%) |
| $5,000 to $7,499 | 5 (5.6%) | 5 (5.1%) |
| $7,500 to $9,999 | 0 (0.0%) | 0 (0.0%) |
| $10,000 to $12,499 | 0 (0.0%) | 2 (2.1%) |
| $12,500 to $14,999 | 0 (0.0%) | 2 (2.1%) |
| $15,000 to $17,499 | 1 (1.1%) | 2 (2.1%) |
| $17,500 to $19,999 | 3 (3.4%) | 4 (4.1%) |
| $20,000 to $22,499 | 0 (0.0%) | 0 (0.0%) |
| $22,500 to $24,999 | 2 (2.2%) | 4 (4.1%) |
| $25,000 to $29,999 | 2 (2.2%) | 15 (15.5%) |
| $30,000 to $34,999 | 2 (2.2%) | 0 (0.0%) |
| $35,000 to $39,999 | 5 (5.6%) | 7 (7.2%) |
| $40,000 to $44,999 | 11 (12.4%) | 9 (9.3%) |
| $45,000 to $49,999 | 7 (7.9%) | 12 (12.4%) |
| $50,000 to $54,999 | 8 (9.0%) | 13 (13.4%) |
| $55,000 to $64,999 | 11 (12.4%) | 8 (8.3%) |
| $65,000 to $74,999 | 4 (4.5%) | 7 (7.2%) |
| $75,000 to $99,999 | 16 (18.0%) | 2 (2.1%) |
| $100,000+ | 6 (6.7%) | 2 (2.1%) |
| Total | 89 (100.0%) | 97 (100.0%) |
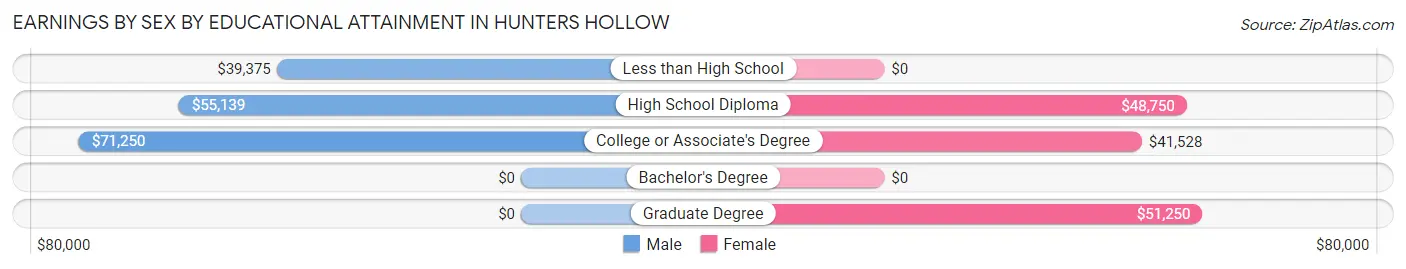
Earnings by Sex by Educational Attainment in Hunters Hollow
Average earnings in Hunters Hollow are $55,139 for men and $46,458 for women, a difference of 15.7%. Men with an educational attainment of college or associate's degree enjoy the highest average annual earnings of $71,250, while those with less than high school education earn the least with $39,375. Women with an educational attainment of graduate degree earn the most with the average annual earnings of $51,250, while those with college or associate's degree education have the smallest earnings of $41,528.
| Educational Attainment | Male Income | Female Income |
| Less than High School | $39,375 | $0 |
| High School Diploma | $55,139 | $48,750 |
| College or Associate's Degree | $71,250 | $41,528 |
| Bachelor's Degree | - | - |
| Graduate Degree | - | - |
| Total | $55,139 | $46,458 |
Family Income in Hunters Hollow
Family Income Brackets in Hunters Hollow
According to the Hunters Hollow family income data, there are 29 families falling into the $100,000 to $149,999 income range, which is the most common income bracket and makes up 36.2% of all families.
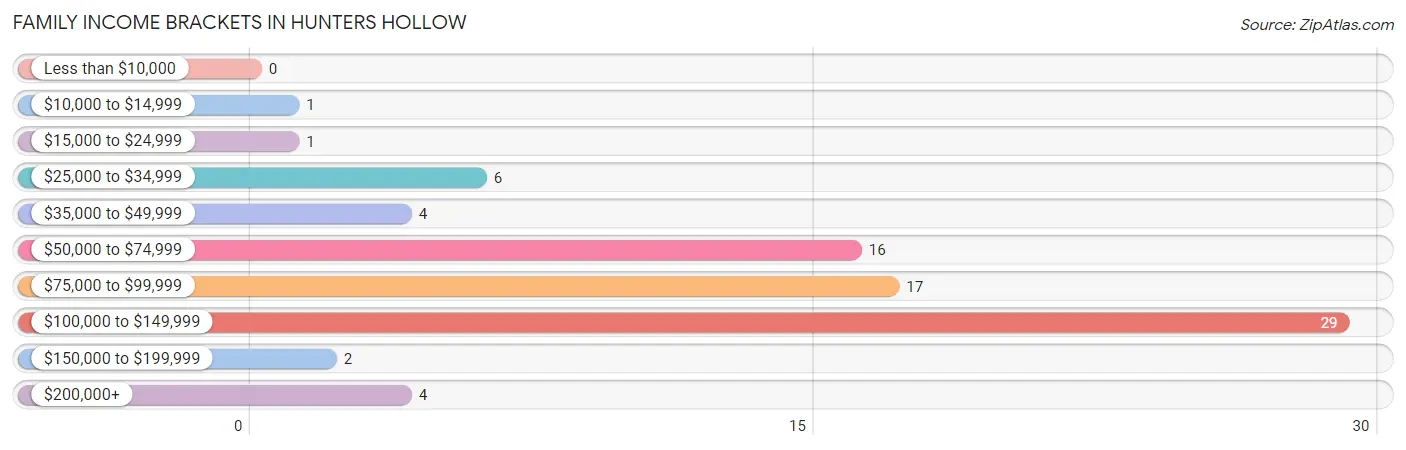
| Income Bracket | # Families | % Families |
| Less than $10,000 | 0 | 0.0% |
| $10,000 to $14,999 | 1 | 1.3% |
| $15,000 to $24,999 | 1 | 1.3% |
| $25,000 to $34,999 | 6 | 7.5% |
| $35,000 to $49,999 | 4 | 5.0% |
| $50,000 to $74,999 | 16 | 20.0% |
| $75,000 to $99,999 | 17 | 21.3% |
| $100,000 to $149,999 | 29 | 36.3% |
| $150,000 to $199,999 | 2 | 2.5% |
| $200,000+ | 4 | 5.0% |
Family Income by Famaliy Size in Hunters Hollow
3-person families (31 | 38.8%) account for the highest median family income in Hunters Hollow with $121,250 per family, while 3-person families (31 | 38.8%) have the highest median income of $40,417 per family member.
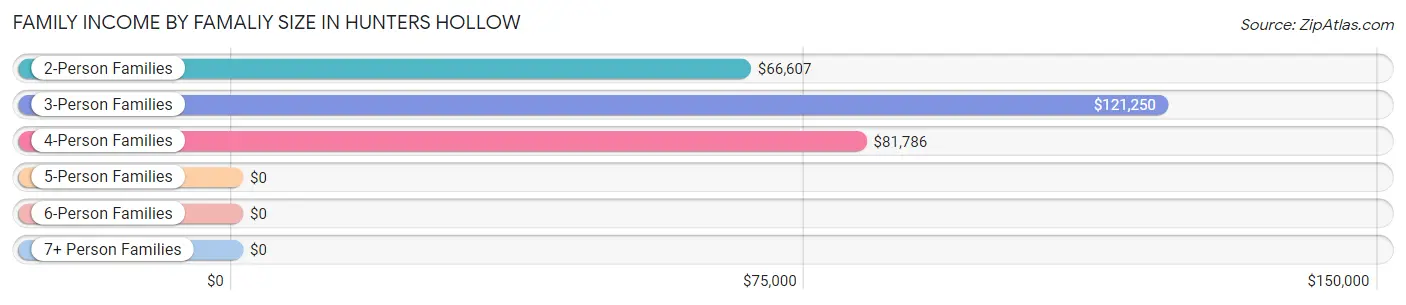
| Income Bracket | # Families | Median Income |
| 2-Person Families | 23 (28.7%) | $66,607 |
| 3-Person Families | 31 (38.8%) | $121,250 |
| 4-Person Families | 22 (27.5%) | $81,786 |
| 5-Person Families | 4 (5.0%) | $0 |
| 6-Person Families | 0 (0.0%) | $0 |
| 7+ Person Families | 0 (0.0%) | $0 |
| Total | 80 (100.0%) | $90,000 |
Family Income by Number of Earners in Hunters Hollow
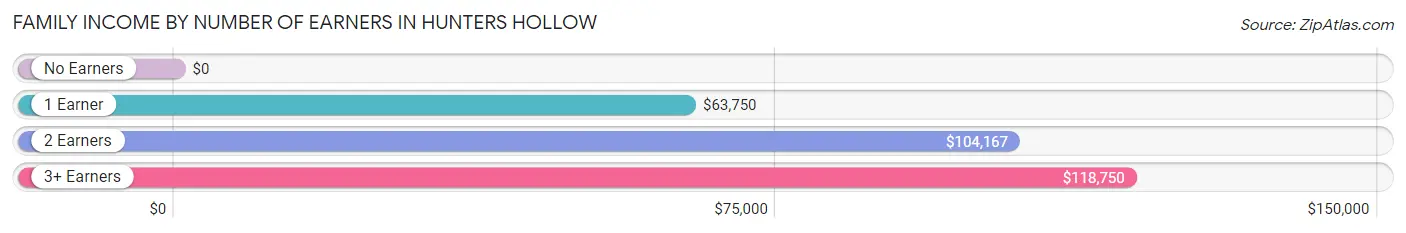
| Number of Earners | # Families | Median Income |
| No Earners | 6 (7.5%) | $0 |
| 1 Earner | 22 (27.5%) | $63,750 |
| 2 Earners | 36 (45.0%) | $104,167 |
| 3+ Earners | 16 (20.0%) | $118,750 |
| Total | 80 (100.0%) | $90,000 |
Household Income in Hunters Hollow
Household Income Brackets in Hunters Hollow
With 36 households falling in the category, the $100,000 to $149,999 income range is the most frequent in Hunters Hollow, accounting for 27.9% of all households. In contrast, only 2 households (1.5%) fall into the $150,000 to $199,999 income bracket, making it the least populous group.
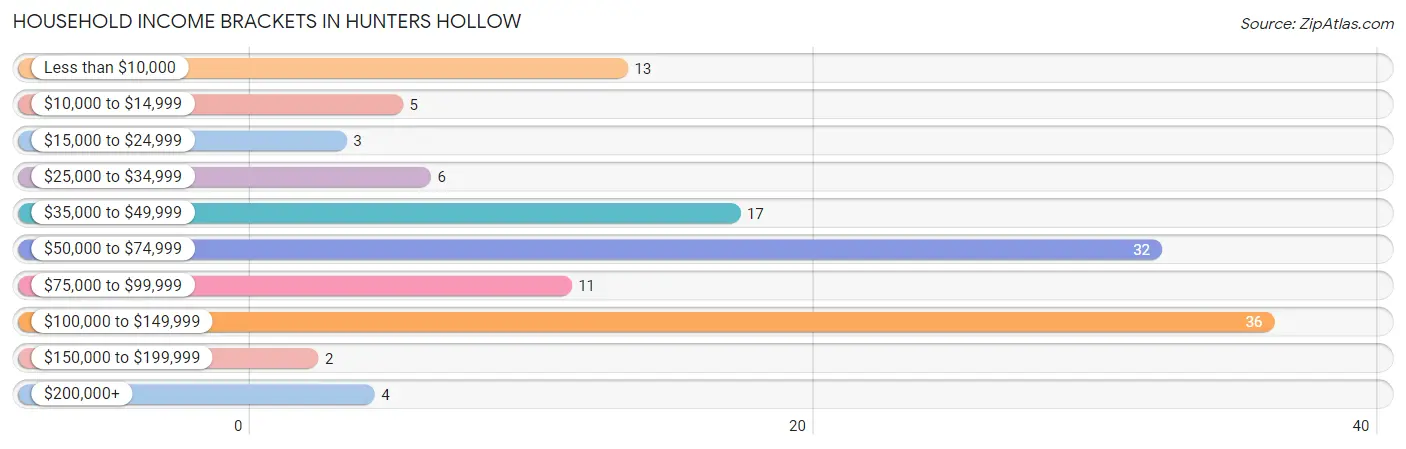
| Income Bracket | # Households | % Households |
| Less than $10,000 | 13 | 10.1% |
| $10,000 to $14,999 | 5 | 3.9% |
| $15,000 to $24,999 | 3 | 2.3% |
| $25,000 to $34,999 | 6 | 4.7% |
| $35,000 to $49,999 | 17 | 13.2% |
| $50,000 to $74,999 | 32 | 24.8% |
| $75,000 to $99,999 | 11 | 8.5% |
| $100,000 to $149,999 | 36 | 27.9% |
| $150,000 to $199,999 | 2 | 1.6% |
| $200,000+ | 4 | 3.1% |
Household Income by Householder Age in Hunters Hollow
The median household income in Hunters Hollow is $66,607, with the highest median household income of $73,750 found in the 25 to 44 years age bracket for the primary householder. A total of 61 households (47.3%) fall into this category. Meanwhile, the 15 to 24 years age bracket for the primary householder has the lowest median household income of $0, with 4 households (3.1%) in this group.
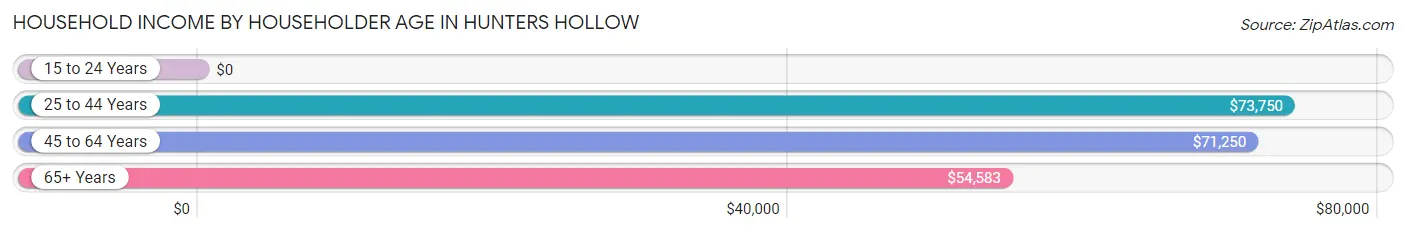
| Income Bracket | # Households | Median Income |
| 15 to 24 Years | 4 (3.1%) | $0 |
| 25 to 44 Years | 61 (47.3%) | $73,750 |
| 45 to 64 Years | 43 (33.3%) | $71,250 |
| 65+ Years | 21 (16.3%) | $54,583 |
| Total | 129 (100.0%) | $66,607 |
Poverty in Hunters Hollow
Income Below Poverty by Sex and Age in Hunters Hollow
With 12.9% poverty level for males and 8.6% for females among the residents of Hunters Hollow, under 5 year old males and 35 to 44 year old females are the most vulnerable to poverty, with 5 males (50.0%) and 10 females (37.0%) in their respective age groups living below the poverty level.
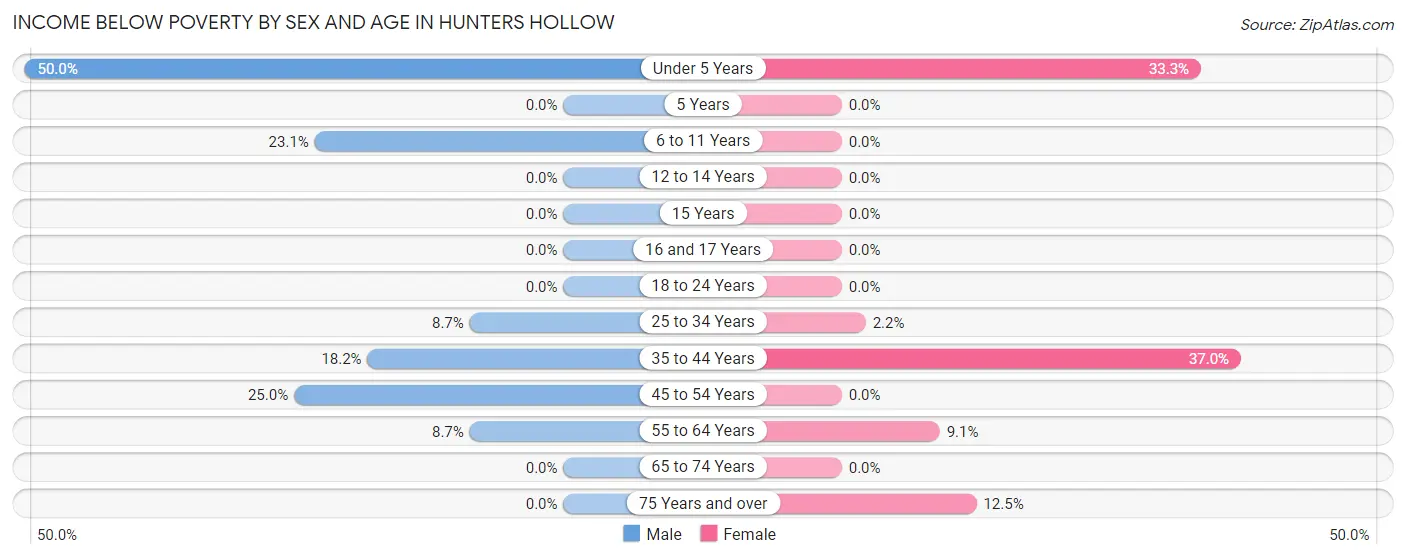
| Age Bracket | Male | Female |
| Under 5 Years | 5 (50.0%) | 1 (33.3%) |
| 5 Years | 0 (0.0%) | 0 (0.0%) |
| 6 to 11 Years | 3 (23.1%) | 0 (0.0%) |
| 12 to 14 Years | 0 (0.0%) | 0 (0.0%) |
| 15 Years | 0 (0.0%) | 0 (0.0%) |
| 16 and 17 Years | 0 (0.0%) | 0 (0.0%) |
| 18 to 24 Years | 0 (0.0%) | 0 (0.0%) |
| 25 to 34 Years | 2 (8.7%) | 1 (2.2%) |
| 35 to 44 Years | 4 (18.2%) | 10 (37.0%) |
| 45 to 54 Years | 5 (25.0%) | 0 (0.0%) |
| 55 to 64 Years | 2 (8.7%) | 1 (9.1%) |
| 65 to 74 Years | 0 (0.0%) | 0 (0.0%) |
| 75 Years and over | 0 (0.0%) | 1 (12.5%) |
| Total | 21 (12.9%) | 14 (8.6%) |
Income Above Poverty by Sex and Age in Hunters Hollow
According to the poverty statistics in Hunters Hollow, males aged 5 years and females aged 6 to 11 years are the age groups that are most secure financially, with 100.0% of males and 100.0% of females in these age groups living above the poverty line.
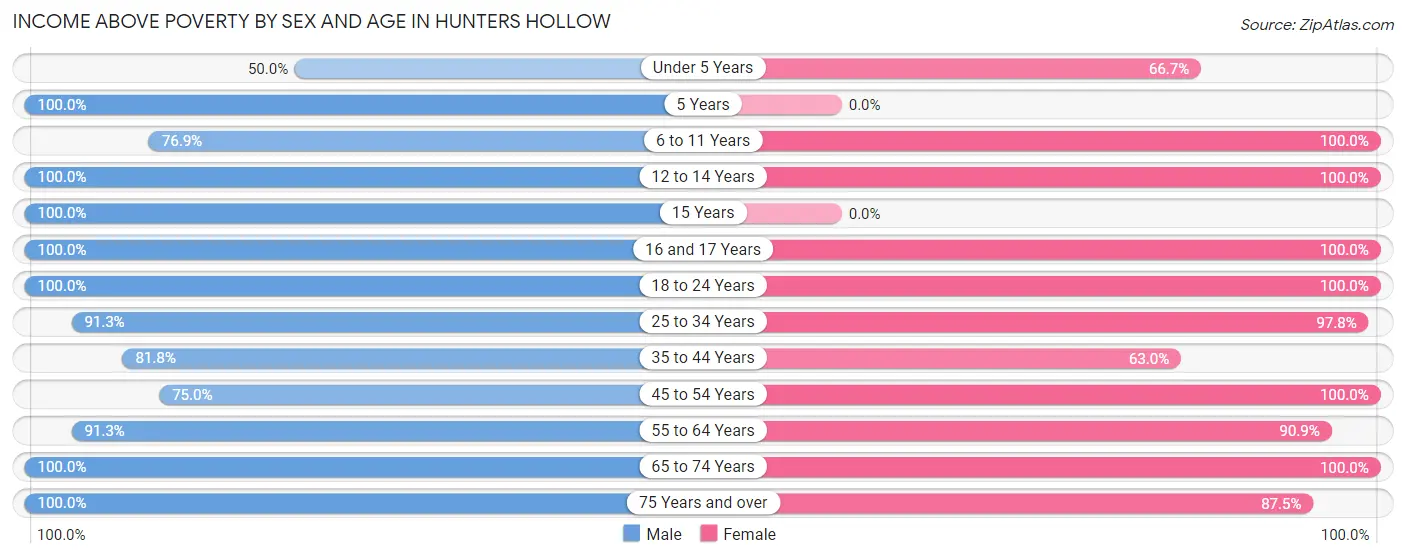
| Age Bracket | Male | Female |
| Under 5 Years | 5 (50.0%) | 2 (66.7%) |
| 5 Years | 1 (100.0%) | 0 (0.0%) |
| 6 to 11 Years | 10 (76.9%) | 14 (100.0%) |
| 12 to 14 Years | 15 (100.0%) | 3 (100.0%) |
| 15 Years | 1 (100.0%) | 0 (0.0%) |
| 16 and 17 Years | 7 (100.0%) | 1 (100.0%) |
| 18 to 24 Years | 16 (100.0%) | 16 (100.0%) |
| 25 to 34 Years | 21 (91.3%) | 44 (97.8%) |
| 35 to 44 Years | 18 (81.8%) | 17 (63.0%) |
| 45 to 54 Years | 15 (75.0%) | 21 (100.0%) |
| 55 to 64 Years | 21 (91.3%) | 10 (90.9%) |
| 65 to 74 Years | 9 (100.0%) | 13 (100.0%) |
| 75 Years and over | 3 (100.0%) | 7 (87.5%) |
| Total | 142 (87.1%) | 148 (91.4%) |
Income Below Poverty Among Married-Couple Families in Hunters Hollow
The poverty statistics for married-couple families in Hunters Hollow show that 3.7% or 2 of the total 54 families live below the poverty line. Families with 1 or 2 children have the highest poverty rate of 7.7%, comprising of 2 families. On the other hand, families with no children have the lowest poverty rate of 0.0%, which includes 0 families.
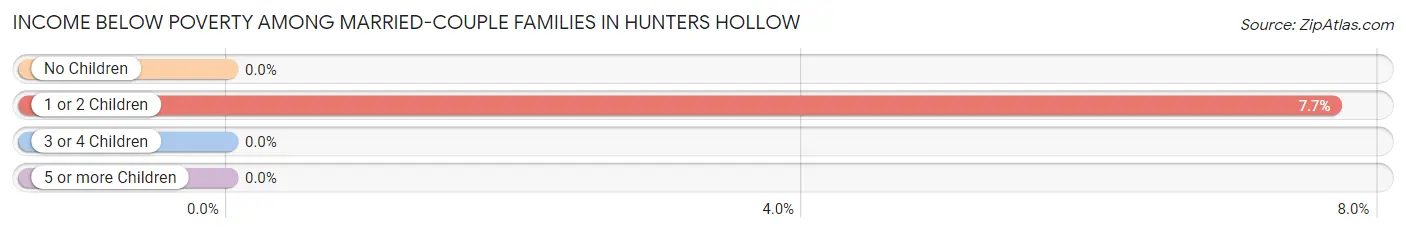
| Children | Above Poverty | Below Poverty |
| No Children | 25 (100.0%) | 0 (0.0%) |
| 1 or 2 Children | 24 (92.3%) | 2 (7.7%) |
| 3 or 4 Children | 3 (100.0%) | 0 (0.0%) |
| 5 or more Children | 0 (0.0%) | 0 (0.0%) |
| Total | 52 (96.3%) | 2 (3.7%) |
Income Below Poverty Among Single-Parent Households in Hunters Hollow
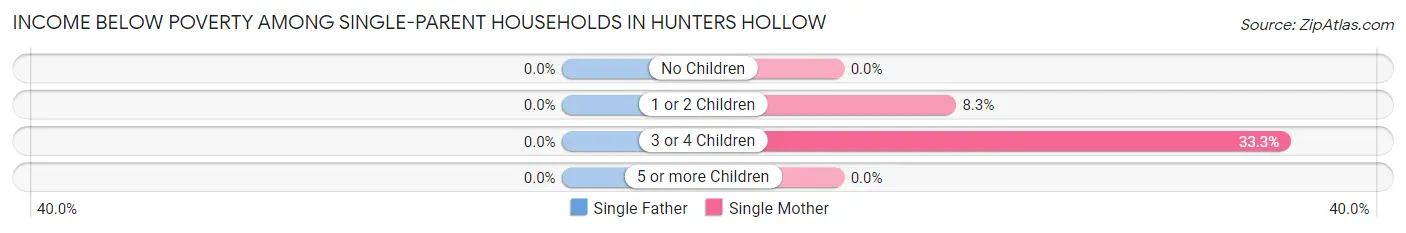
| Children | Single Father | Single Mother |
| No Children | 0 (0.0%) | 0 (0.0%) |
| 1 or 2 Children | 0 (0.0%) | 1 (8.3%) |
| 3 or 4 Children | 0 (0.0%) | 1 (33.3%) |
| 5 or more Children | 0 (0.0%) | 0 (0.0%) |
| Total | 0 (0.0%) | 2 (11.1%) |
Income Below Poverty Among Married-Couple vs Single-Parent Households in Hunters Hollow
The poverty data for Hunters Hollow shows that 2 of the married-couple family households (3.7%) and 2 of the single-parent households (7.7%) are living below the poverty level. Within the married-couple family households, those with 1 or 2 children have the highest poverty rate, with 2 households (7.7%) falling below the poverty line. Among the single-parent households, those with 3 or 4 children have the highest poverty rate, with 1 household (33.3%) living below poverty.
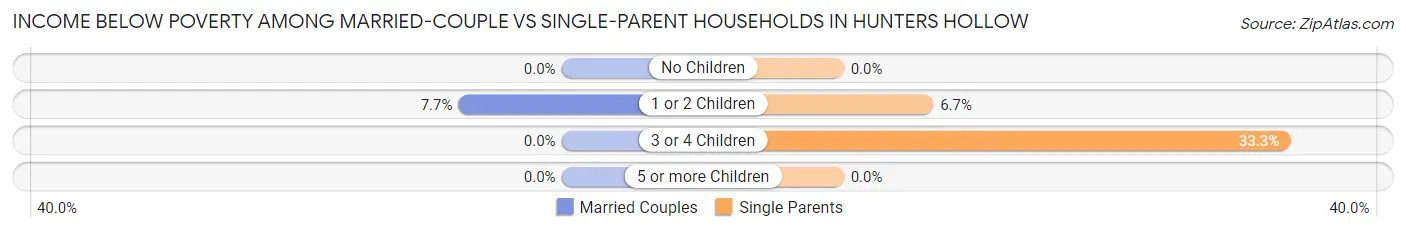
| Children | Married-Couple Families | Single-Parent Households |
| No Children | 0 (0.0%) | 0 (0.0%) |
| 1 or 2 Children | 2 (7.7%) | 1 (6.7%) |
| 3 or 4 Children | 0 (0.0%) | 1 (33.3%) |
| 5 or more Children | 0 (0.0%) | 0 (0.0%) |
| Total | 2 (3.7%) | 2 (7.7%) |
Race in Hunters Hollow
The most populous races in Hunters Hollow are White / Caucasian (291 | 89.0%), Hispanic or Latino (32 | 9.8%), and Two or more Races (29 | 8.9%).
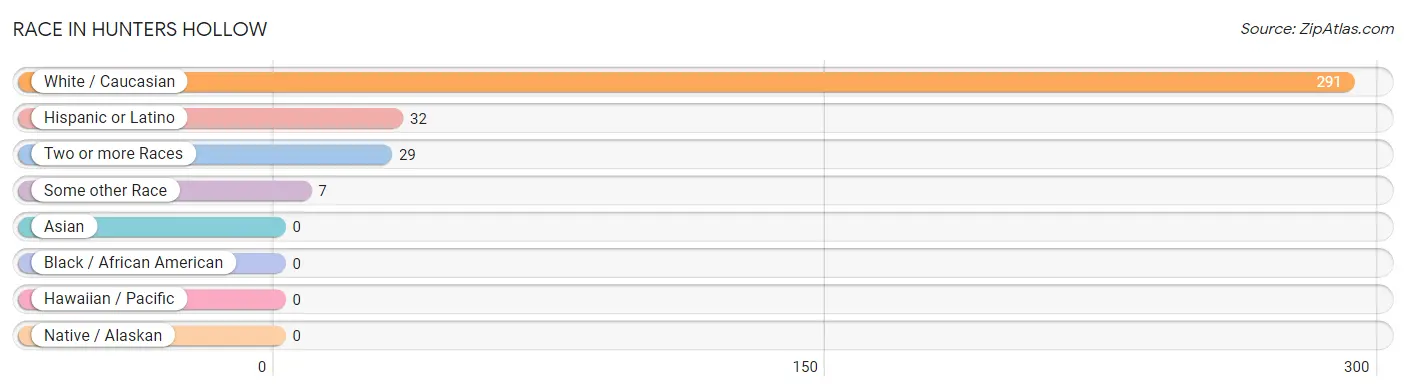
| Race | # Population | % Population |
| Asian | 0 | 0.0% |
| Black / African American | 0 | 0.0% |
| Hawaiian / Pacific | 0 | 0.0% |
| Hispanic or Latino | 32 | 9.8% |
| Native / Alaskan | 0 | 0.0% |
| White / Caucasian | 291 | 89.0% |
| Two or more Races | 29 | 8.9% |
| Some other Race | 7 | 2.1% |
| Total | 327 | 100.0% |
Ancestry in Hunters Hollow
The most populous ancestries reported in Hunters Hollow are German (77 | 23.5%), Irish (48 | 14.7%), American (40 | 12.2%), Italian (27 | 8.3%), and Mexican (15 | 4.6%), together accounting for 63.3% of all Hunters Hollow residents.
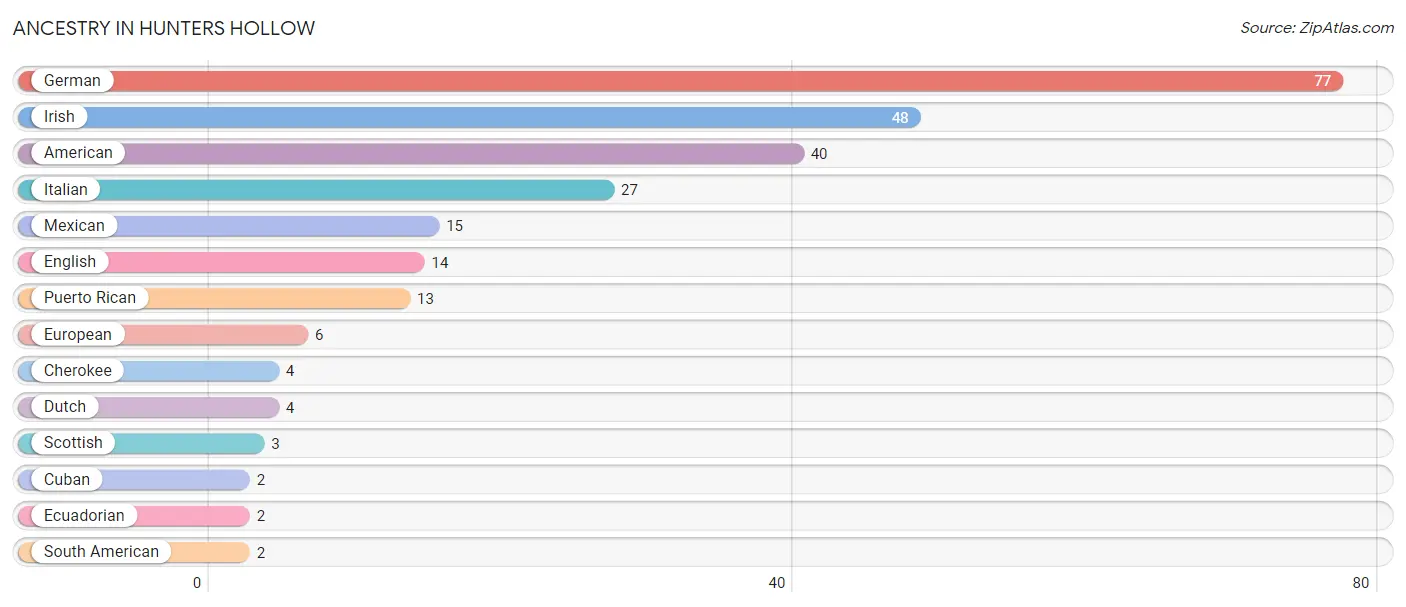
| Ancestry | # Population | % Population |
| American | 40 | 12.2% |
| Cherokee | 4 | 1.2% |
| Cuban | 2 | 0.6% |
| Dutch | 4 | 1.2% |
| Ecuadorian | 2 | 0.6% |
| English | 14 | 4.3% |
| European | 6 | 1.8% |
| German | 77 | 23.5% |
| Irish | 48 | 14.7% |
| Italian | 27 | 8.3% |
| Mexican | 15 | 4.6% |
| Puerto Rican | 13 | 4.0% |
| Scottish | 3 | 0.9% |
| South American | 2 | 0.6% | View All 14 Rows |
Immigrants in Hunters Hollow
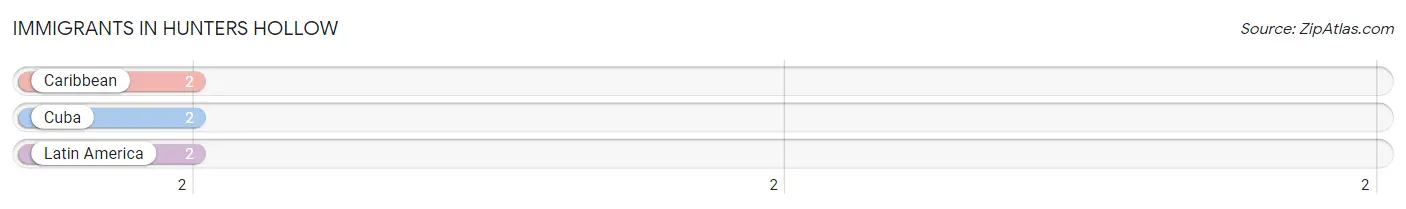
The most numerous immigrant groups reported in Hunters Hollow came from Caribbean (2 | 0.6%), Cuba (2 | 0.6%), and Latin America (2 | 0.6%), together accounting for 1.8% of all Hunters Hollow residents.
| Immigration Origin | # Population | % Population |
| Caribbean | 2 | 0.6% |
| Cuba | 2 | 0.6% |
| Latin America | 2 | 0.6% | View All 3 Rows |
Sex and Age in Hunters Hollow
Sex and Age in Hunters Hollow
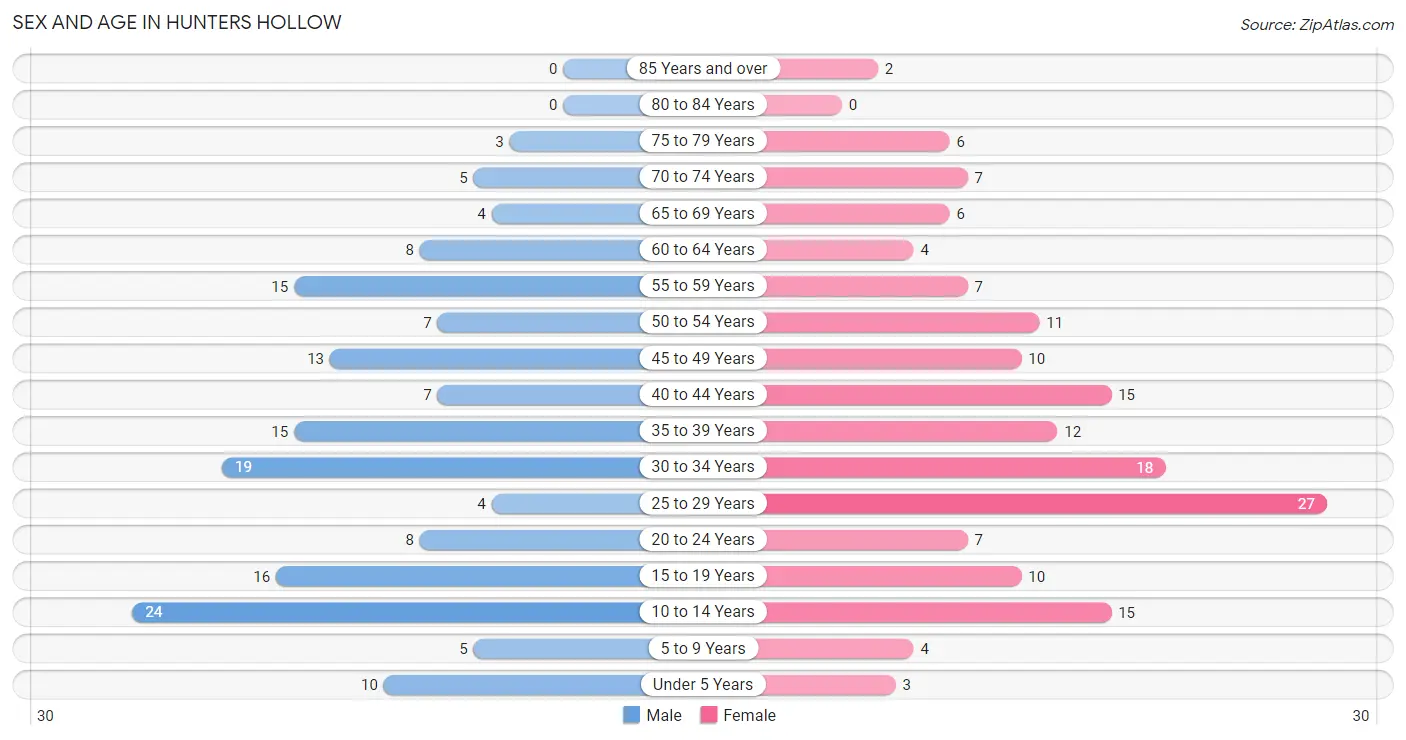
The most populous age groups in Hunters Hollow are 10 to 14 Years (24 | 14.7%) for men and 25 to 29 Years (27 | 16.5%) for women.
| Age Bracket | Male | Female |
| Under 5 Years | 10 (6.1%) | 3 (1.8%) |
| 5 to 9 Years | 5 (3.1%) | 4 (2.4%) |
| 10 to 14 Years | 24 (14.7%) | 15 (9.1%) |
| 15 to 19 Years | 16 (9.8%) | 10 (6.1%) |
| 20 to 24 Years | 8 (4.9%) | 7 (4.3%) |
| 25 to 29 Years | 4 (2.5%) | 27 (16.5%) |
| 30 to 34 Years | 19 (11.7%) | 18 (11.0%) |
| 35 to 39 Years | 15 (9.2%) | 12 (7.3%) |
| 40 to 44 Years | 7 (4.3%) | 15 (9.1%) |
| 45 to 49 Years | 13 (8.0%) | 10 (6.1%) |
| 50 to 54 Years | 7 (4.3%) | 11 (6.7%) |
| 55 to 59 Years | 15 (9.2%) | 7 (4.3%) |
| 60 to 64 Years | 8 (4.9%) | 4 (2.4%) |
| 65 to 69 Years | 4 (2.5%) | 6 (3.7%) |
| 70 to 74 Years | 5 (3.1%) | 7 (4.3%) |
| 75 to 79 Years | 3 (1.8%) | 6 (3.7%) |
| 80 to 84 Years | 0 (0.0%) | 0 (0.0%) |
| 85 Years and over | 0 (0.0%) | 2 (1.2%) |
| Total | 163 (100.0%) | 164 (100.0%) |
Families and Households in Hunters Hollow
Median Family Size in Hunters Hollow
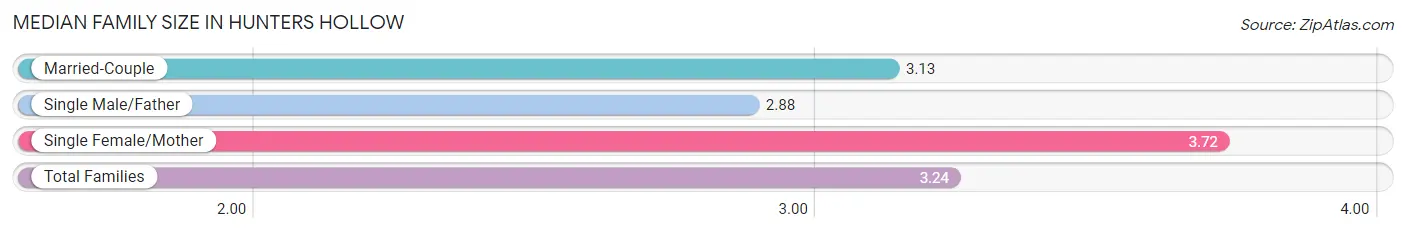
The median family size in Hunters Hollow is 3.24 persons per family, with single female/mother families (18 | 22.5%) accounting for the largest median family size of 3.72 persons per family. On the other hand, single male/father families (8 | 10.0%) represent the smallest median family size with 2.88 persons per family.
| Family Type | # Families | Family Size |
| Married-Couple | 54 (67.5%) | 3.13 |
| Single Male/Father | 8 (10.0%) | 2.88 |
| Single Female/Mother | 18 (22.5%) | 3.72 |
| Total Families | 80 (100.0%) | 3.24 |
Median Household Size in Hunters Hollow
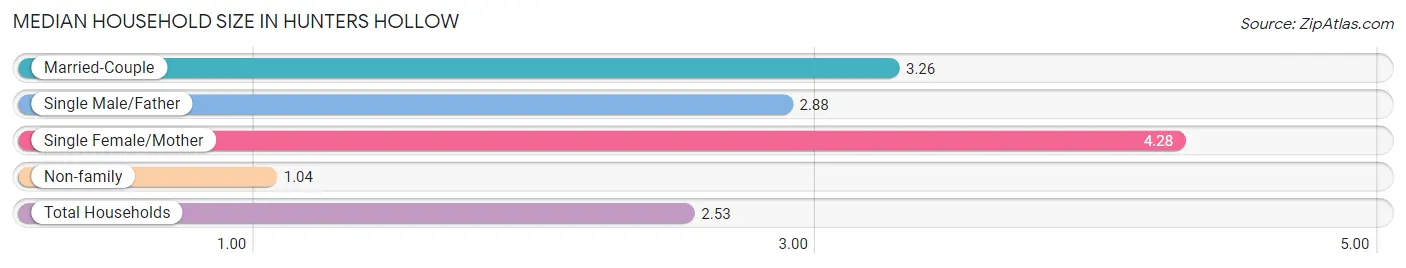
The median household size in Hunters Hollow is 2.53 persons per household, with single female/mother households (18 | 14.0%) accounting for the largest median household size of 4.28 persons per household. non-family households (49 | 38.0%) represent the smallest median household size with 1.04 persons per household.
| Household Type | # Households | Household Size |
| Married-Couple | 54 (41.9%) | 3.26 |
| Single Male/Father | 8 (6.2%) | 2.88 |
| Single Female/Mother | 18 (14.0%) | 4.28 |
| Non-family | 49 (38.0%) | 1.04 |
| Total Households | 129 (100.0%) | 2.53 |
Household Size by Marriage Status in Hunters Hollow
Out of a total of 129 households in Hunters Hollow, 80 (62.0%) are family households, while 49 (38.0%) are nonfamily households. The most numerous type of family households are 3-person households, comprising 31, and the most common type of nonfamily households are 1-person households, comprising 48.
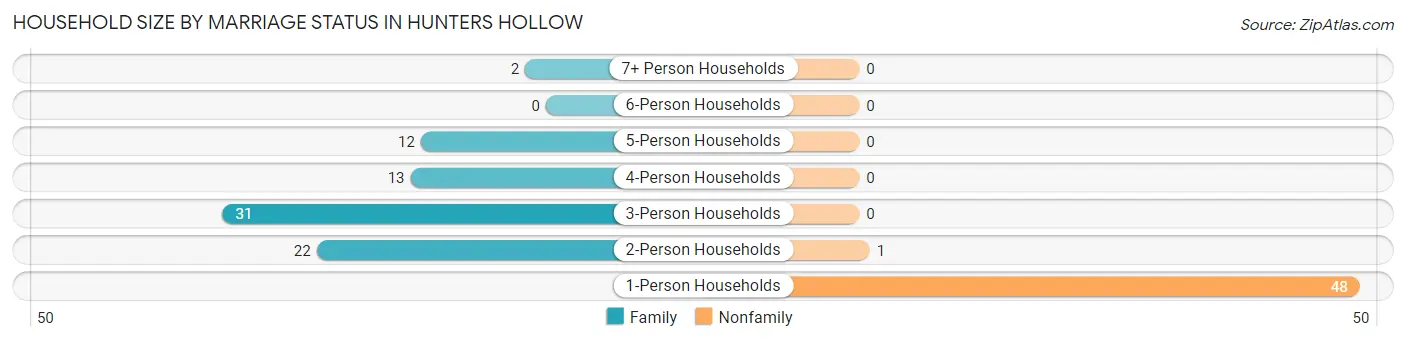
| Household Size | Family Households | Nonfamily Households |
| 1-Person Households | - | 48 (37.2%) |
| 2-Person Households | 22 (17.1%) | 1 (0.8%) |
| 3-Person Households | 31 (24.0%) | 0 (0.0%) |
| 4-Person Households | 13 (10.1%) | 0 (0.0%) |
| 5-Person Households | 12 (9.3%) | 0 (0.0%) |
| 6-Person Households | 0 (0.0%) | 0 (0.0%) |
| 7+ Person Households | 2 (1.5%) | 0 (0.0%) |
| Total | 80 (62.0%) | 49 (38.0%) |
Female Fertility in Hunters Hollow
Fertility by Age in Hunters Hollow
| Age Bracket | Women with Births | Births / 1,000 Women |
| 15 to 19 years | 0 (0.0%) | 0.0 |
| 20 to 34 years | 0 (0.0%) | 0.0 |
| 35 to 50 years | 0 (0.0%) | 0.0 |
| Total | 0 (0.0%) | 0.0 |
Fertility by Age by Marriage Status in Hunters Hollow
| Age Bracket | Married | Unmarried |
| 15 to 19 years | 0 (0.0%) | 0 (0.0%) |
| 20 to 34 years | 0 (0.0%) | 0 (0.0%) |
| 35 to 50 years | 0 (0.0%) | 0 (0.0%) |
| Total | 0 (0.0%) | 0 (0.0%) |
Fertility by Education in Hunters Hollow
| Educational Attainment | Women with Births | Births / 1,000 Women |
| Less than High School | 0 (0.0%) | 0.0 |
| High School Diploma | 0 (0.0%) | 0.0 |
| College or Associate's Degree | 0 (0.0%) | 0.0 |
| Bachelor's Degree | 0 (0.0%) | 0.0 |
| Graduate Degree | 0 (0.0%) | 0.0 |
| Total | 0 (0.0%) | 0.0 |
Fertility by Education by Marriage Status in Hunters Hollow
| Educational Attainment | Married | Unmarried |
| Less than High School | 0 (0.0%) | 0 (0.0%) |
| High School Diploma | 0 (0.0%) | 0 (0.0%) |
| College or Associate's Degree | 0 (0.0%) | 0 (0.0%) |
| Bachelor's Degree | 0 (0.0%) | 0 (0.0%) |
| Graduate Degree | 0 (0.0%) | 0 (0.0%) |
| Total | 0 (0.0%) | 0 (0.0%) |
Employment Characteristics in Hunters Hollow
Employment by Class of Employer in Hunters Hollow
Among the 166 employed individuals in Hunters Hollow, private company employees (154 | 92.8%), self-employed (not incorporated) (6 | 3.6%), and not-for-profit organizations (3 | 1.8%) make up the most common classes of employment.
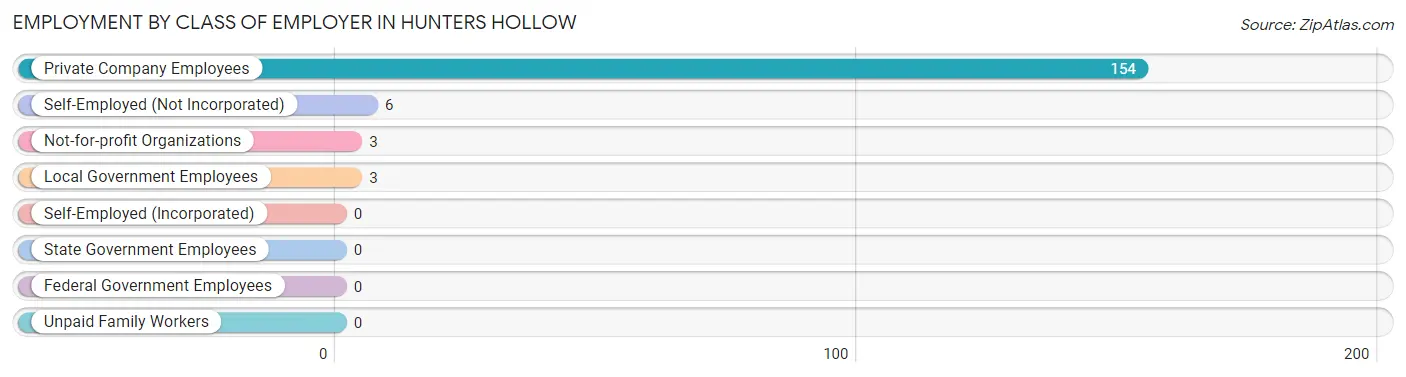
| Employer Class | # Employees | % Employees |
| Private Company Employees | 154 | 92.8% |
| Self-Employed (Incorporated) | 0 | 0.0% |
| Self-Employed (Not Incorporated) | 6 | 3.6% |
| Not-for-profit Organizations | 3 | 1.8% |
| Local Government Employees | 3 | 1.8% |
| State Government Employees | 0 | 0.0% |
| Federal Government Employees | 0 | 0.0% |
| Unpaid Family Workers | 0 | 0.0% |
| Total | 166 | 100.0% |
Employment Status by Age in Hunters Hollow
According to the labor force statistics for Hunters Hollow, out of the total population over 16 years of age (265), 66.8% or 177 individuals are in the labor force, with 4.0% or 7 of them unemployed. The age group with the highest labor force participation rate is 25 to 29 years, with 93.5% or 29 individuals in the labor force. Within the labor force, the 16 to 19 years age range has the highest percentage of unemployed individuals, with 31.3% or 5 of them being unemployed.
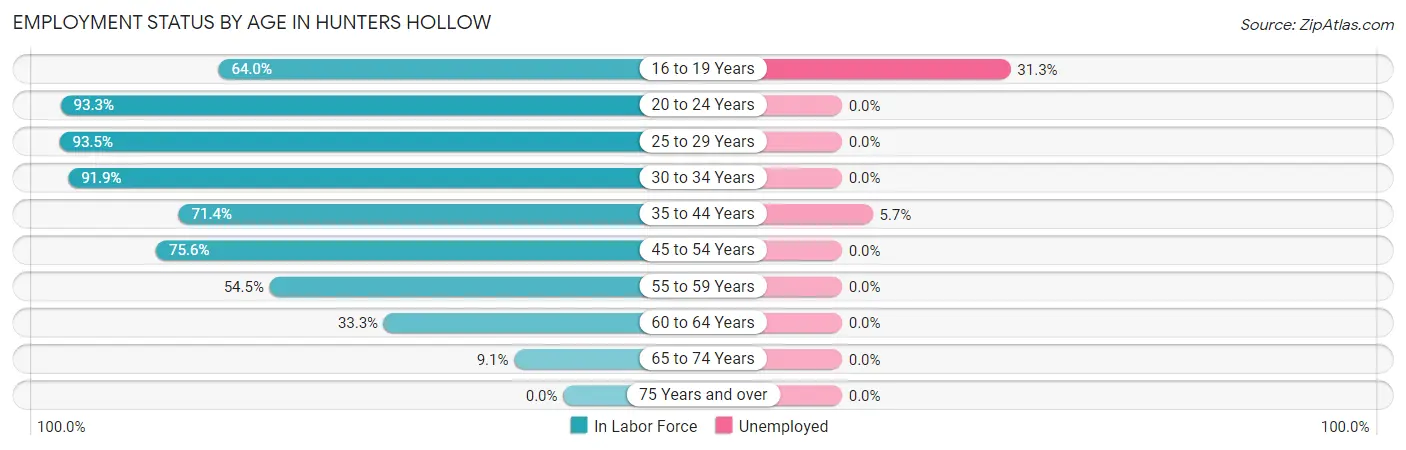
| Age Bracket | In Labor Force | Unemployed |
| 16 to 19 Years | 16 (64.0%) | 5 (31.3%) |
| 20 to 24 Years | 14 (93.3%) | 0 (0.0%) |
| 25 to 29 Years | 29 (93.5%) | 0 (0.0%) |
| 30 to 34 Years | 34 (91.9%) | 0 (0.0%) |
| 35 to 44 Years | 35 (71.4%) | 2 (5.7%) |
| 45 to 54 Years | 31 (75.6%) | 0 (0.0%) |
| 55 to 59 Years | 12 (54.5%) | 0 (0.0%) |
| 60 to 64 Years | 4 (33.3%) | 0 (0.0%) |
| 65 to 74 Years | 2 (9.1%) | 0 (0.0%) |
| 75 Years and over | 0 (0.0%) | 0 (0.0%) |
| Total | 177 (66.8%) | 7 (4.0%) |
Employment Status by Educational Attainment in Hunters Hollow
According to labor force statistics for Hunters Hollow, 75.5% of individuals (145) out of the total population between 25 and 64 years of age (192) are in the labor force, with 1.4% or 2 of them being unemployed. The group with the highest labor force participation rate are those with the educational attainment of college / associate degree, with 83.7% or 82 individuals in the labor force. Within the labor force, individuals with college / associate degree education have the highest percentage of unemployment, with 2.4% or 2 of them being unemployed.
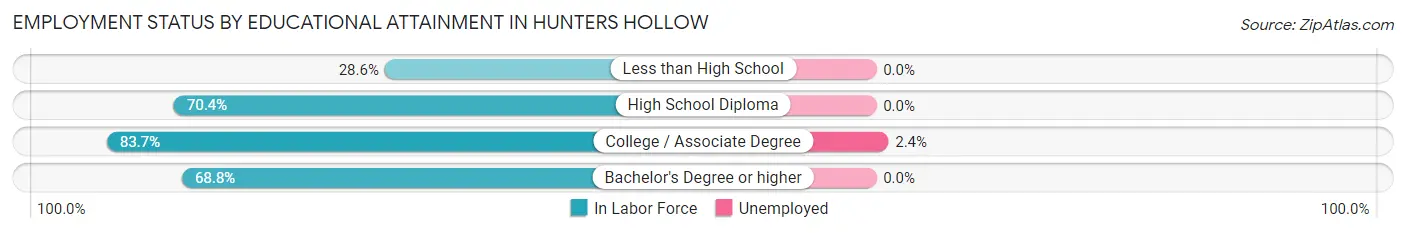
| Educational Attainment | In Labor Force | Unemployed |
| Less than High School | 2 (28.6%) | 0 (0.0%) |
| High School Diploma | 50 (70.4%) | 0 (0.0%) |
| College / Associate Degree | 82 (83.7%) | 2 (2.4%) |
| Bachelor's Degree or higher | 11 (68.8%) | 0 (0.0%) |
| Total | 145 (75.5%) | 3 (1.4%) |
Employment Occupations by Sex in Hunters Hollow
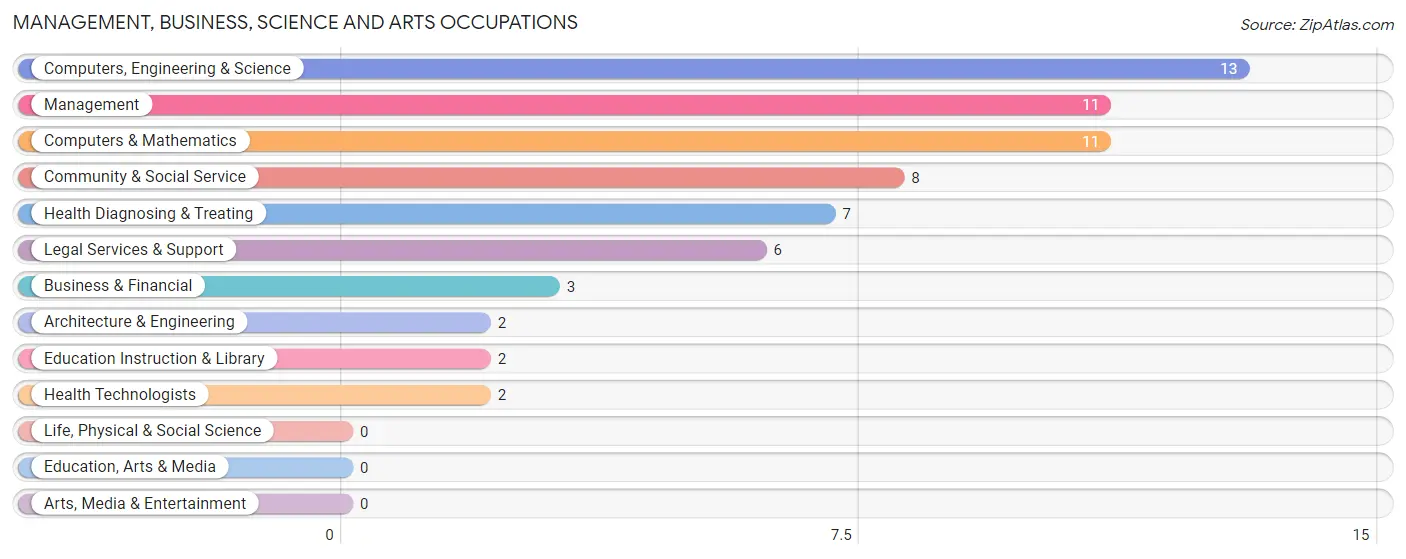
Management, Business, Science and Arts Occupations
The most common Management, Business, Science and Arts occupations in Hunters Hollow are Computers, Engineering & Science (13 | 7.6%), Management (11 | 6.5%), Computers & Mathematics (11 | 6.5%), Community & Social Service (8 | 4.7%), and Health Diagnosing & Treating (7 | 4.1%).
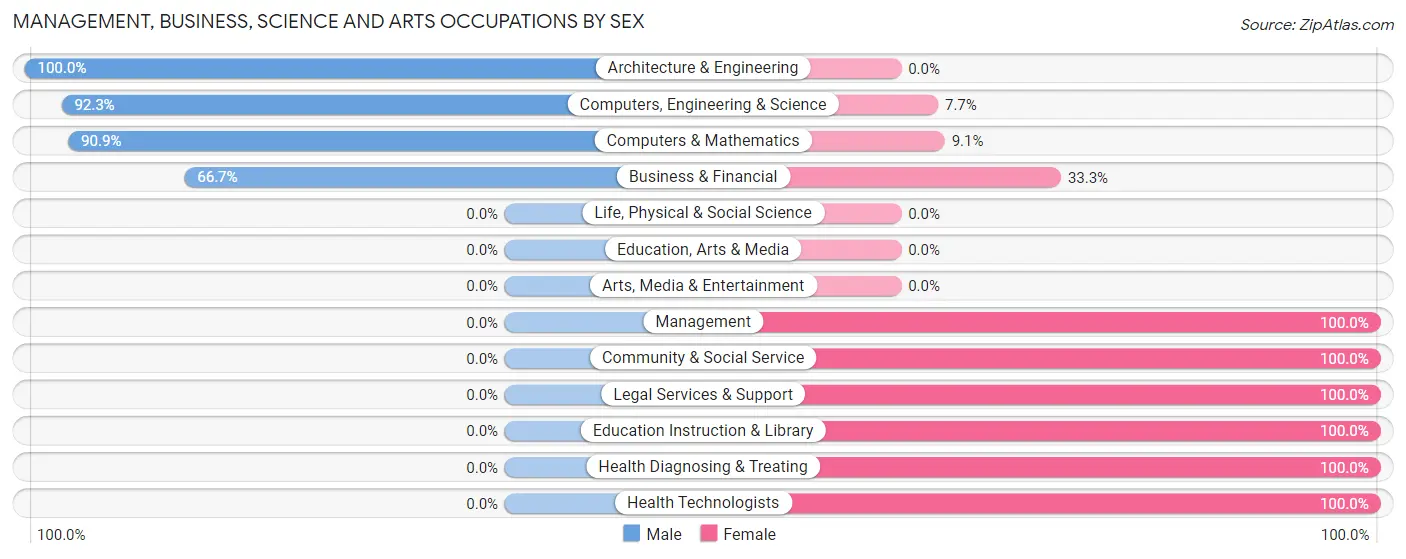
Management, Business, Science and Arts Occupations by Sex
Within the Management, Business, Science and Arts occupations in Hunters Hollow, the most male-oriented occupations are Architecture & Engineering (100.0%), Computers, Engineering & Science (92.3%), and Computers & Mathematics (90.9%), while the most female-oriented occupations are Management (100.0%), Community & Social Service (100.0%), and Legal Services & Support (100.0%).
| Occupation | Male | Female |
| Management | 0 (0.0%) | 11 (100.0%) |
| Business & Financial | 2 (66.7%) | 1 (33.3%) |
| Computers, Engineering & Science | 12 (92.3%) | 1 (7.7%) |
| Computers & Mathematics | 10 (90.9%) | 1 (9.1%) |
| Architecture & Engineering | 2 (100.0%) | 0 (0.0%) |
| Life, Physical & Social Science | 0 (0.0%) | 0 (0.0%) |
| Community & Social Service | 0 (0.0%) | 8 (100.0%) |
| Education, Arts & Media | 0 (0.0%) | 0 (0.0%) |
| Legal Services & Support | 0 (0.0%) | 6 (100.0%) |
| Education Instruction & Library | 0 (0.0%) | 2 (100.0%) |
| Arts, Media & Entertainment | 0 (0.0%) | 0 (0.0%) |
| Health Diagnosing & Treating | 0 (0.0%) | 7 (100.0%) |
| Health Technologists | 0 (0.0%) | 2 (100.0%) |
| Total (Category) | 14 (33.3%) | 28 (66.7%) |
| Total (Overall) | 75 (44.1%) | 95 (55.9%) |
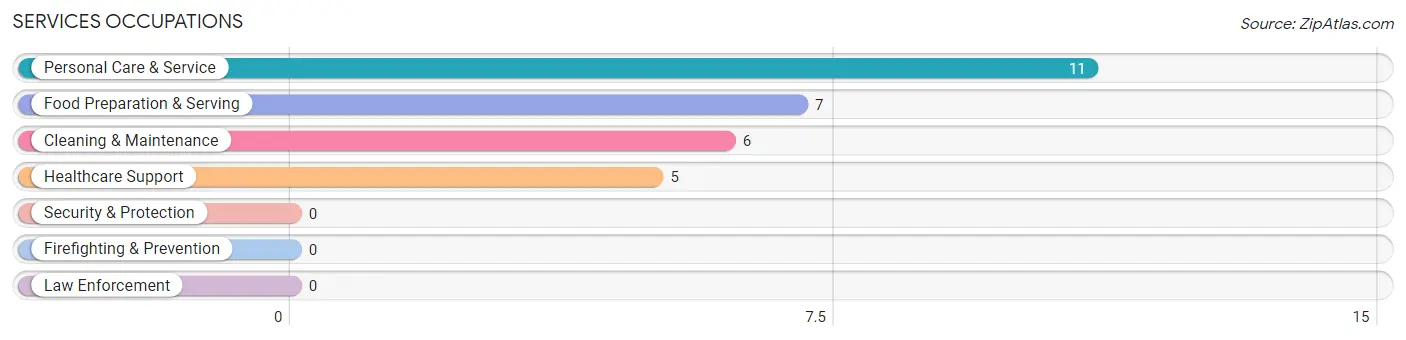
Services Occupations
The most common Services occupations in Hunters Hollow are Personal Care & Service (11 | 6.5%), Food Preparation & Serving (7 | 4.1%), Cleaning & Maintenance (6 | 3.5%), and Healthcare Support (5 | 2.9%).
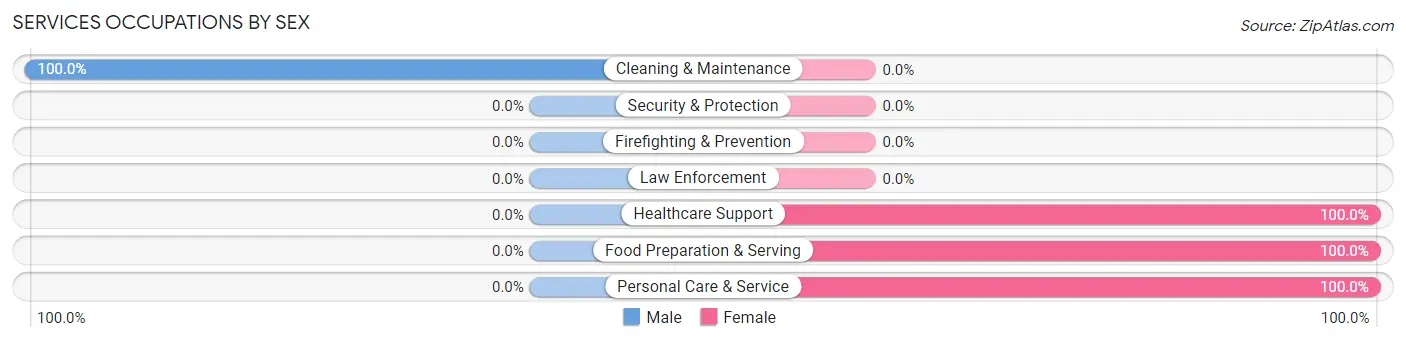
Services Occupations by Sex
| Occupation | Male | Female |
| Healthcare Support | 0 (0.0%) | 5 (100.0%) |
| Security & Protection | 0 (0.0%) | 0 (0.0%) |
| Firefighting & Prevention | 0 (0.0%) | 0 (0.0%) |
| Law Enforcement | 0 (0.0%) | 0 (0.0%) |
| Food Preparation & Serving | 0 (0.0%) | 7 (100.0%) |
| Cleaning & Maintenance | 6 (100.0%) | 0 (0.0%) |
| Personal Care & Service | 0 (0.0%) | 11 (100.0%) |
| Total (Category) | 6 (20.7%) | 23 (79.3%) |
| Total (Overall) | 75 (44.1%) | 95 (55.9%) |
Sales and Office Occupations
The most common Sales and Office occupations in Hunters Hollow are Office & Administration (44 | 25.9%), and Sales & Related (19 | 11.2%).
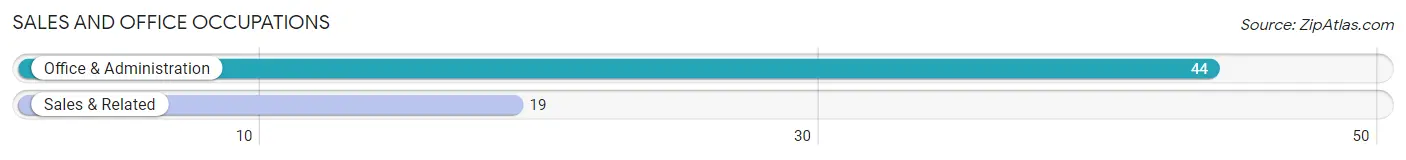
Sales and Office Occupations by Sex
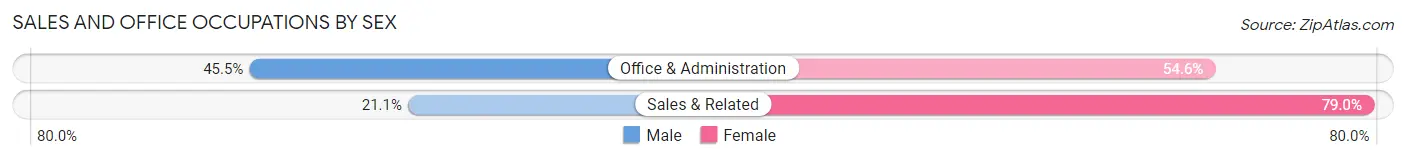
| Occupation | Male | Female |
| Sales & Related | 4 (21.0%) | 15 (78.9%) |
| Office & Administration | 20 (45.5%) | 24 (54.5%) |
| Total (Category) | 24 (38.1%) | 39 (61.9%) |
| Total (Overall) | 75 (44.1%) | 95 (55.9%) |
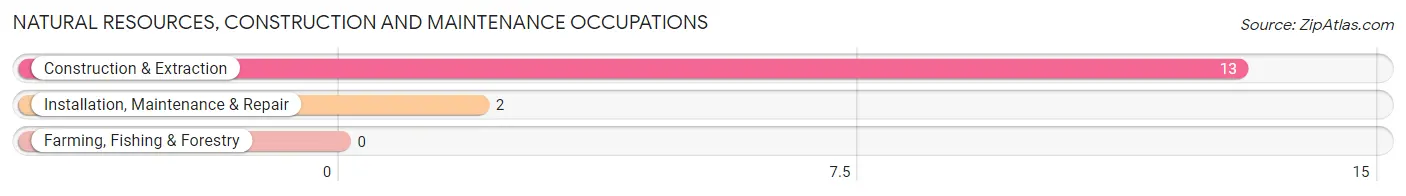
Natural Resources, Construction and Maintenance Occupations
The most common Natural Resources, Construction and Maintenance occupations in Hunters Hollow are Construction & Extraction (13 | 7.6%), and Installation, Maintenance & Repair (2 | 1.2%).
Natural Resources, Construction and Maintenance Occupations by Sex
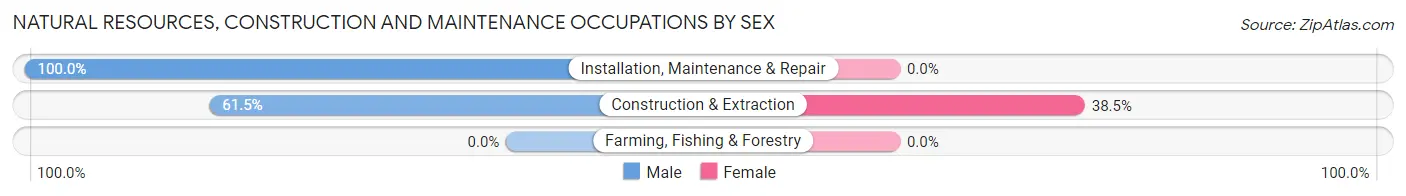
| Occupation | Male | Female |
| Farming, Fishing & Forestry | 0 (0.0%) | 0 (0.0%) |
| Construction & Extraction | 8 (61.5%) | 5 (38.5%) |
| Installation, Maintenance & Repair | 2 (100.0%) | 0 (0.0%) |
| Total (Category) | 10 (66.7%) | 5 (33.3%) |
| Total (Overall) | 75 (44.1%) | 95 (55.9%) |
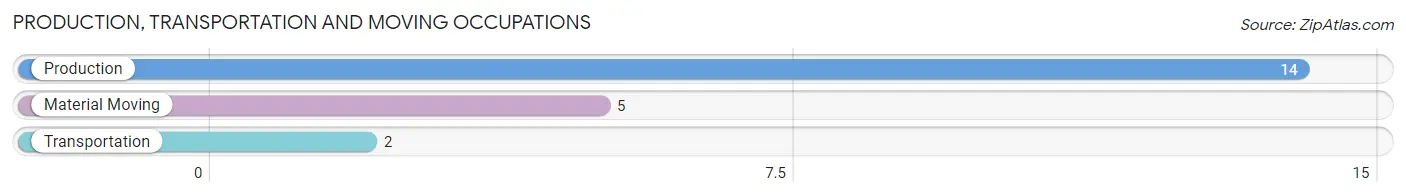
Production, Transportation and Moving Occupations
The most common Production, Transportation and Moving occupations in Hunters Hollow are Production (14 | 8.2%), Material Moving (5 | 2.9%), and Transportation (2 | 1.2%).
Production, Transportation and Moving Occupations by Sex
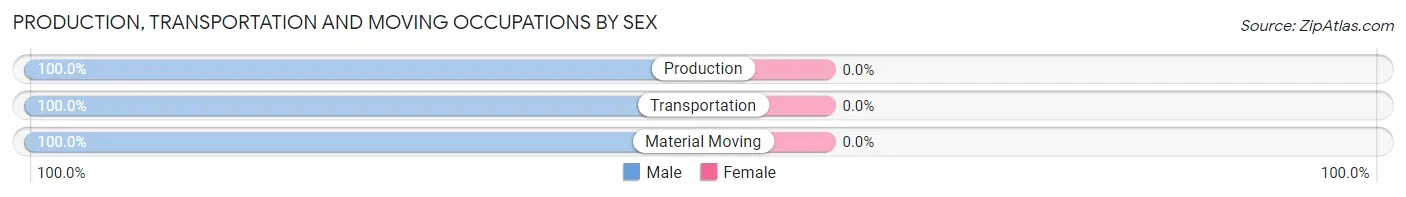
| Occupation | Male | Female |
| Production | 14 (100.0%) | 0 (0.0%) |
| Transportation | 2 (100.0%) | 0 (0.0%) |
| Material Moving | 5 (100.0%) | 0 (0.0%) |
| Total (Category) | 21 (100.0%) | 0 (0.0%) |
| Total (Overall) | 75 (44.1%) | 95 (55.9%) |
Employment Industries by Sex in Hunters Hollow
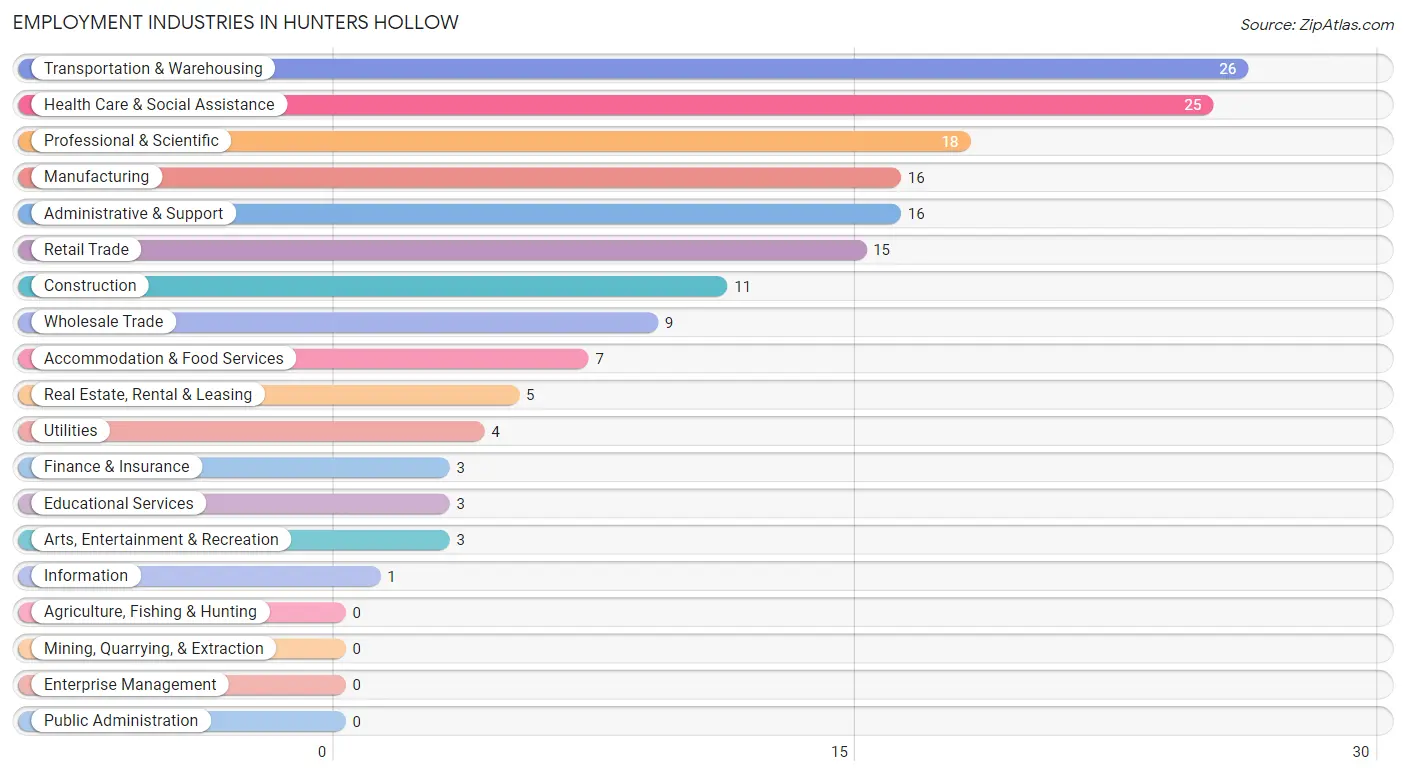
Employment Industries in Hunters Hollow
The major employment industries in Hunters Hollow include Transportation & Warehousing (26 | 15.3%), Health Care & Social Assistance (25 | 14.7%), Professional & Scientific (18 | 10.6%), Manufacturing (16 | 9.4%), and Administrative & Support (16 | 9.4%).
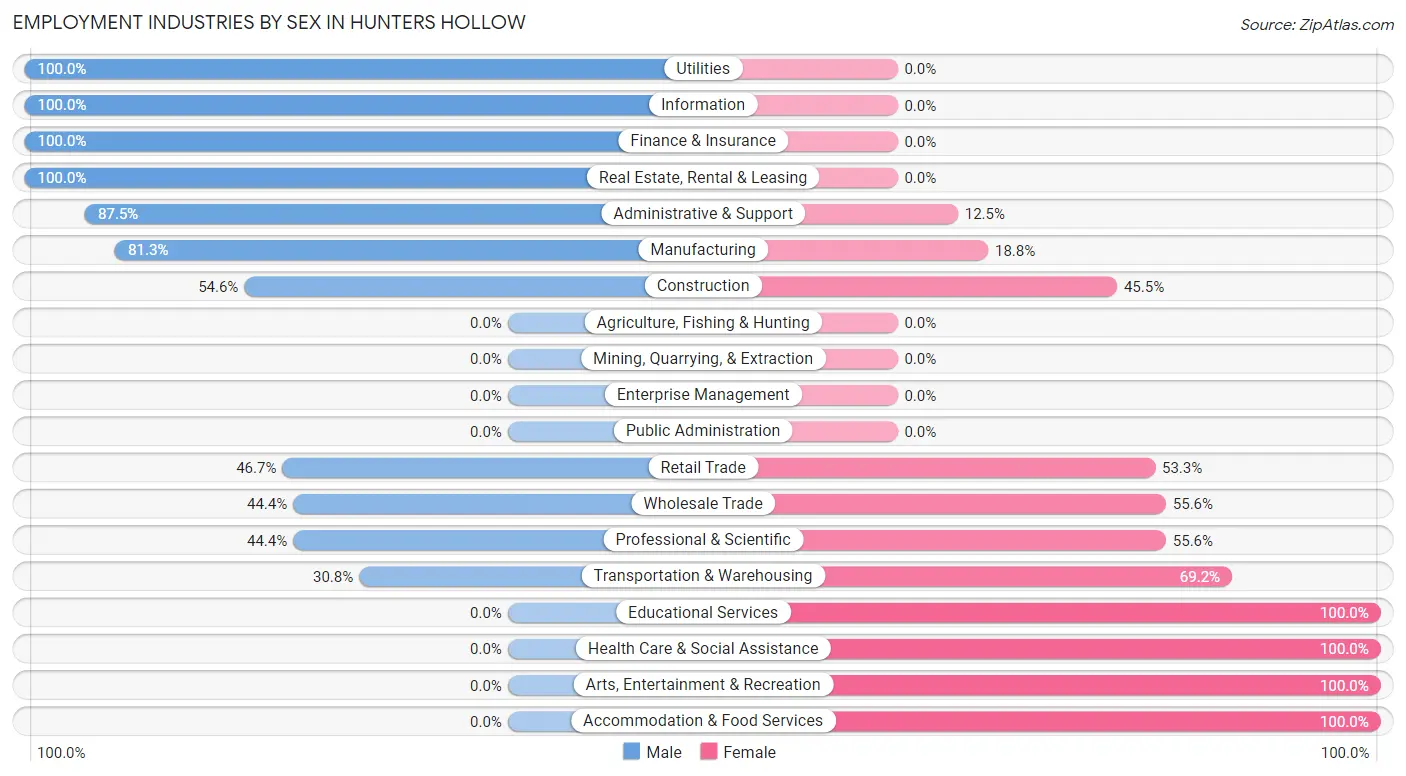
Employment Industries by Sex in Hunters Hollow
The Hunters Hollow industries that see more men than women are Utilities (100.0%), Information (100.0%), and Finance & Insurance (100.0%), whereas the industries that tend to have a higher number of women are Educational Services (100.0%), Health Care & Social Assistance (100.0%), and Arts, Entertainment & Recreation (100.0%).
| Industry | Male | Female |
| Agriculture, Fishing & Hunting | 0 (0.0%) | 0 (0.0%) |
| Mining, Quarrying, & Extraction | 0 (0.0%) | 0 (0.0%) |
| Construction | 6 (54.5%) | 5 (45.5%) |
| Manufacturing | 13 (81.2%) | 3 (18.8%) |
| Wholesale Trade | 4 (44.4%) | 5 (55.6%) |
| Retail Trade | 7 (46.7%) | 8 (53.3%) |
| Transportation & Warehousing | 8 (30.8%) | 18 (69.2%) |
| Utilities | 4 (100.0%) | 0 (0.0%) |
| Information | 1 (100.0%) | 0 (0.0%) |
| Finance & Insurance | 3 (100.0%) | 0 (0.0%) |
| Real Estate, Rental & Leasing | 5 (100.0%) | 0 (0.0%) |
| Professional & Scientific | 8 (44.4%) | 10 (55.6%) |
| Enterprise Management | 0 (0.0%) | 0 (0.0%) |
| Administrative & Support | 14 (87.5%) | 2 (12.5%) |
| Educational Services | 0 (0.0%) | 3 (100.0%) |
| Health Care & Social Assistance | 0 (0.0%) | 25 (100.0%) |
| Arts, Entertainment & Recreation | 0 (0.0%) | 3 (100.0%) |
| Accommodation & Food Services | 0 (0.0%) | 7 (100.0%) |
| Public Administration | 0 (0.0%) | 0 (0.0%) |
| Total | 75 (44.1%) | 95 (55.9%) |
Education in Hunters Hollow
School Enrollment in Hunters Hollow
The most common levels of schooling among the 91 students in Hunters Hollow are middle school (35 | 38.5%), high school (18 | 19.8%), and college / undergraduate (15 | 16.5%).
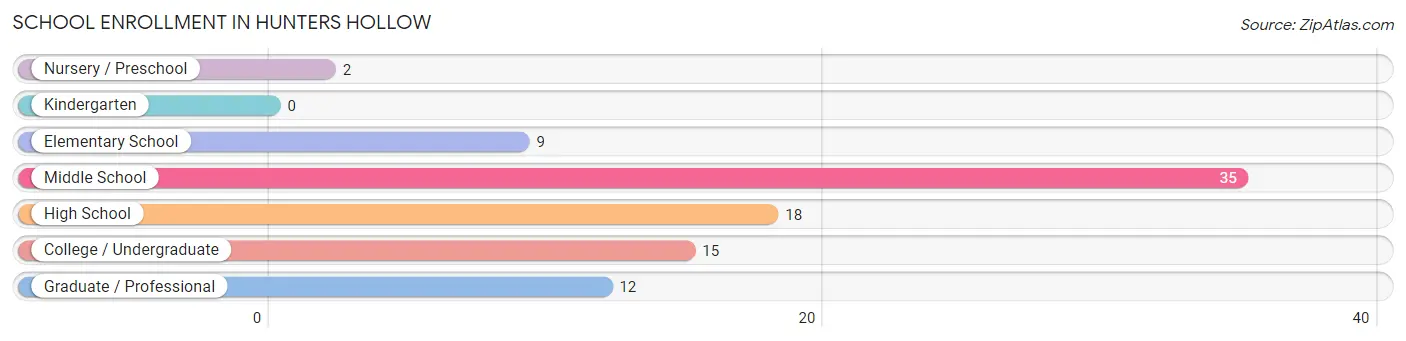
| School Level | # Students | % Students |
| Nursery / Preschool | 2 | 2.2% |
| Kindergarten | 0 | 0.0% |
| Elementary School | 9 | 9.9% |
| Middle School | 35 | 38.5% |
| High School | 18 | 19.8% |
| College / Undergraduate | 15 | 16.5% |
| Graduate / Professional | 12 | 13.2% |
| Total | 91 | 100.0% |
School Enrollment by Age by Funding Source in Hunters Hollow
Out of a total of 91 students who are enrolled in schools in Hunters Hollow, 16 (17.6%) attend a private institution, while the remaining 75 (82.4%) are enrolled in public schools. The age group of 20 to 24 year olds has the highest likelihood of being enrolled in private schools, with 7 (100.0% in the age bracket) enrolled. Conversely, the age group of 10 to 14 year olds has the lowest likelihood of being enrolled in a private school, with 39 (100.0% in the age bracket) attending a public institution.
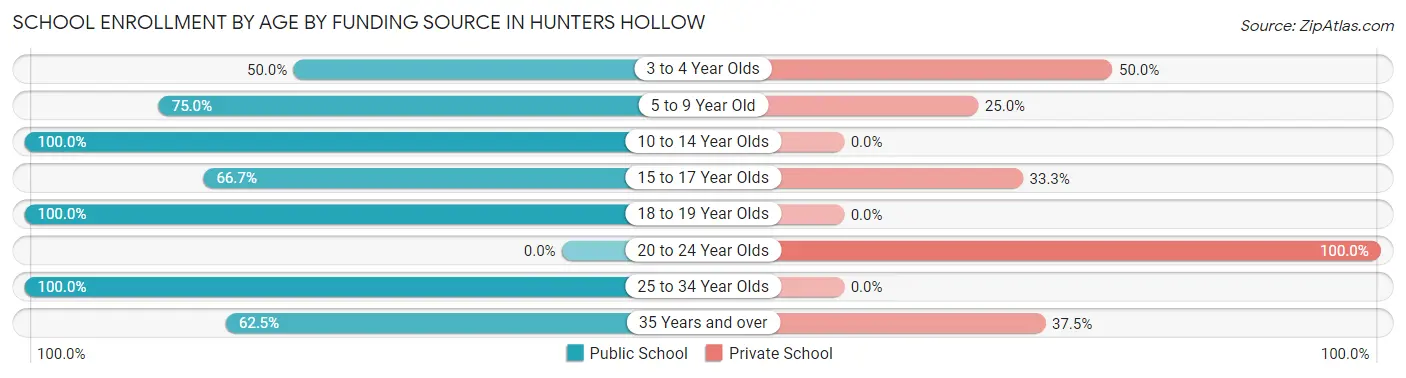
| Age Bracket | Public School | Private School |
| 3 to 4 Year Olds | 1 (50.0%) | 1 (50.0%) |
| 5 to 9 Year Old | 6 (75.0%) | 2 (25.0%) |
| 10 to 14 Year Olds | 39 (100.0%) | 0 (0.0%) |
| 15 to 17 Year Olds | 6 (66.7%) | 3 (33.3%) |
| 18 to 19 Year Olds | 6 (100.0%) | 0 (0.0%) |
| 20 to 24 Year Olds | 0 (0.0%) | 7 (100.0%) |
| 25 to 34 Year Olds | 12 (100.0%) | 0 (0.0%) |
| 35 Years and over | 5 (62.5%) | 3 (37.5%) |
| Total | 75 (82.4%) | 16 (17.6%) |
Educational Attainment by Field of Study in Hunters Hollow
Business (7 | 38.9%), computers & mathematics (5 | 27.8%), education (4 | 22.2%), communications (1 | 5.6%), and arts & humanities (1 | 5.6%) are the most common fields of study among 18 individuals in Hunters Hollow who have obtained a bachelor's degree or higher.
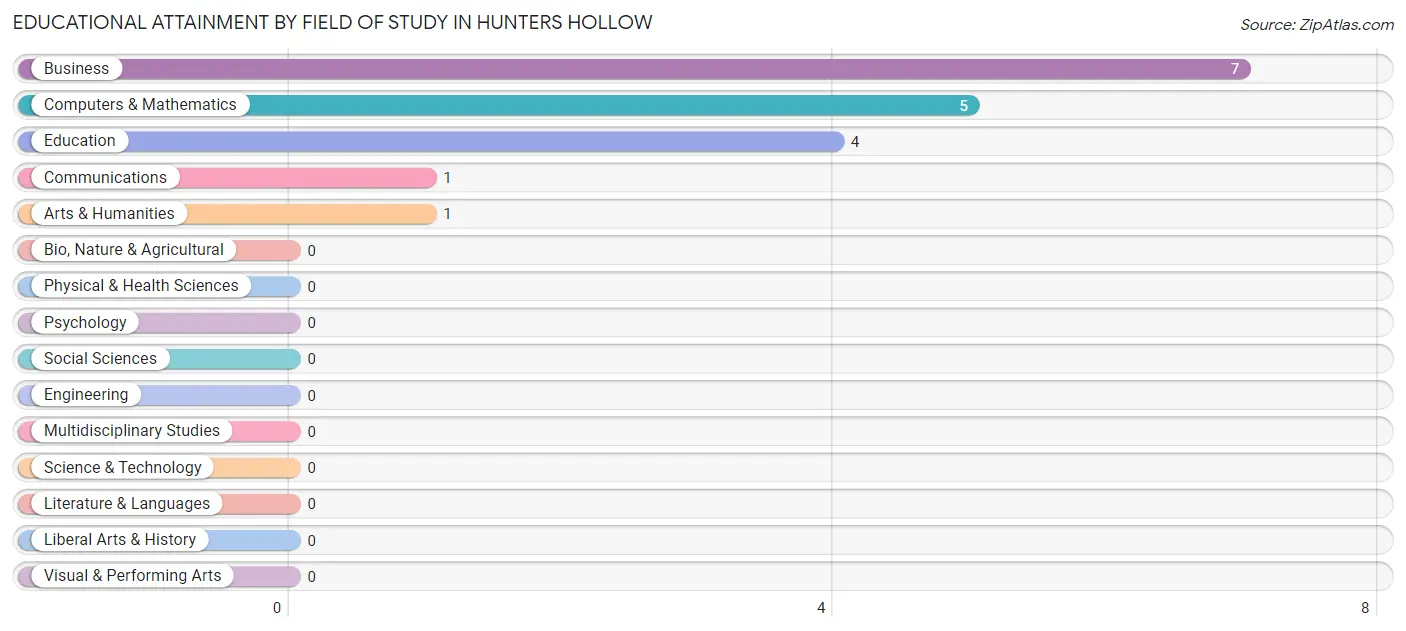
| Field of Study | # Graduates | % Graduates |
| Computers & Mathematics | 5 | 27.8% |
| Bio, Nature & Agricultural | 0 | 0.0% |
| Physical & Health Sciences | 0 | 0.0% |
| Psychology | 0 | 0.0% |
| Social Sciences | 0 | 0.0% |
| Engineering | 0 | 0.0% |
| Multidisciplinary Studies | 0 | 0.0% |
| Science & Technology | 0 | 0.0% |
| Business | 7 | 38.9% |
| Education | 4 | 22.2% |
| Literature & Languages | 0 | 0.0% |
| Liberal Arts & History | 0 | 0.0% |
| Visual & Performing Arts | 0 | 0.0% |
| Communications | 1 | 5.6% |
| Arts & Humanities | 1 | 5.6% |
| Total | 18 | 100.0% |
Transportation & Commute in Hunters Hollow
Vehicle Availability by Sex in Hunters Hollow
The most prevalent vehicle ownership categories in Hunters Hollow are males with 2 vehicles (41, accounting for 56.2%) and females with 2 vehicles (56, making up 44.1%).
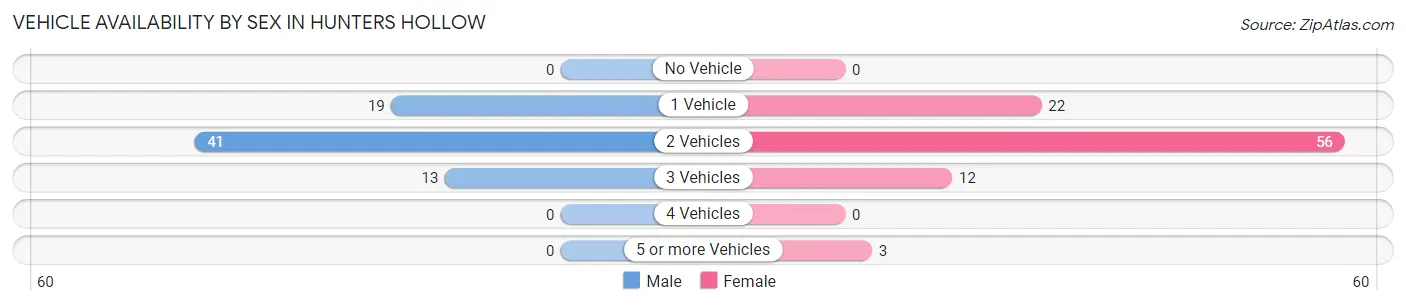
| Vehicles Available | Male | Female |
| No Vehicle | 0 (0.0%) | 0 (0.0%) |
| 1 Vehicle | 19 (26.0%) | 22 (23.7%) |
| 2 Vehicles | 41 (56.2%) | 56 (60.2%) |
| 3 Vehicles | 13 (17.8%) | 12 (12.9%) |
| 4 Vehicles | 0 (0.0%) | 0 (0.0%) |
| 5 or more Vehicles | 0 (0.0%) | 3 (3.2%) |
| Total | 73 (100.0%) | 93 (100.0%) |
Commute Time in Hunters Hollow
The most frequently occuring commute durations in Hunters Hollow are 30 to 34 minutes (39 commuters, 26.4%), 15 to 19 minutes (33 commuters, 22.3%), and 25 to 29 minutes (24 commuters, 16.2%).
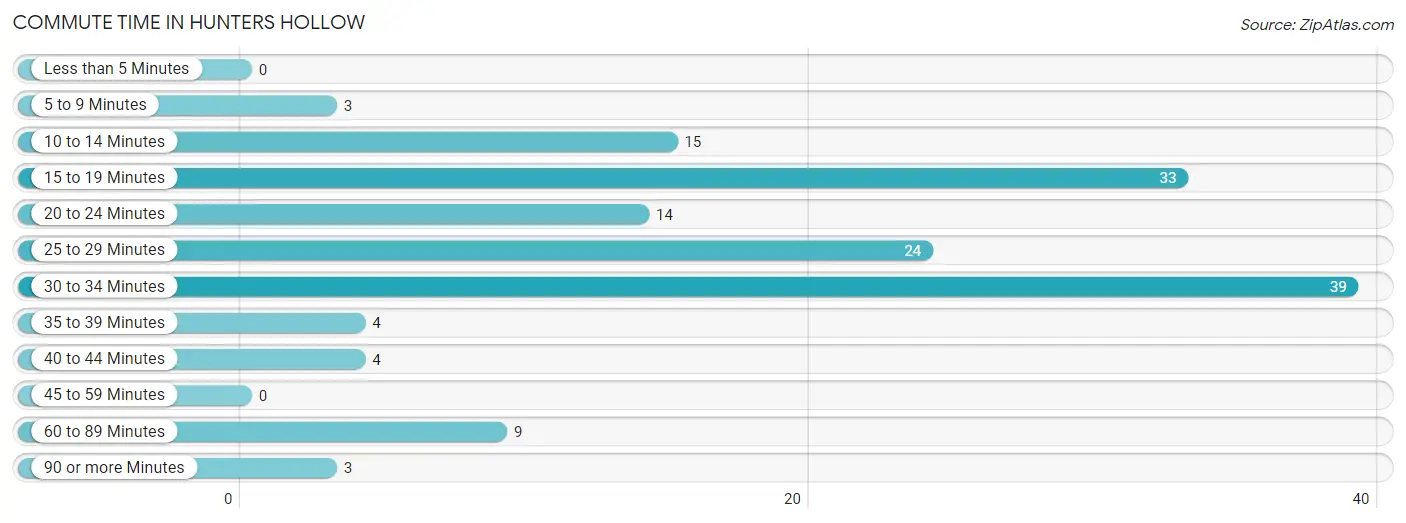
| Commute Time | # Commuters | % Commuters |
| Less than 5 Minutes | 0 | 0.0% |
| 5 to 9 Minutes | 3 | 2.0% |
| 10 to 14 Minutes | 15 | 10.1% |
| 15 to 19 Minutes | 33 | 22.3% |
| 20 to 24 Minutes | 14 | 9.5% |
| 25 to 29 Minutes | 24 | 16.2% |
| 30 to 34 Minutes | 39 | 26.4% |
| 35 to 39 Minutes | 4 | 2.7% |
| 40 to 44 Minutes | 4 | 2.7% |
| 45 to 59 Minutes | 0 | 0.0% |
| 60 to 89 Minutes | 9 | 6.1% |
| 90 or more Minutes | 3 | 2.0% |
Commute Time by Sex in Hunters Hollow
The most common commute times in Hunters Hollow are 25 to 29 minutes (17 commuters, 23.9%) for males and 15 to 19 minutes (25 commuters, 32.5%) for females.
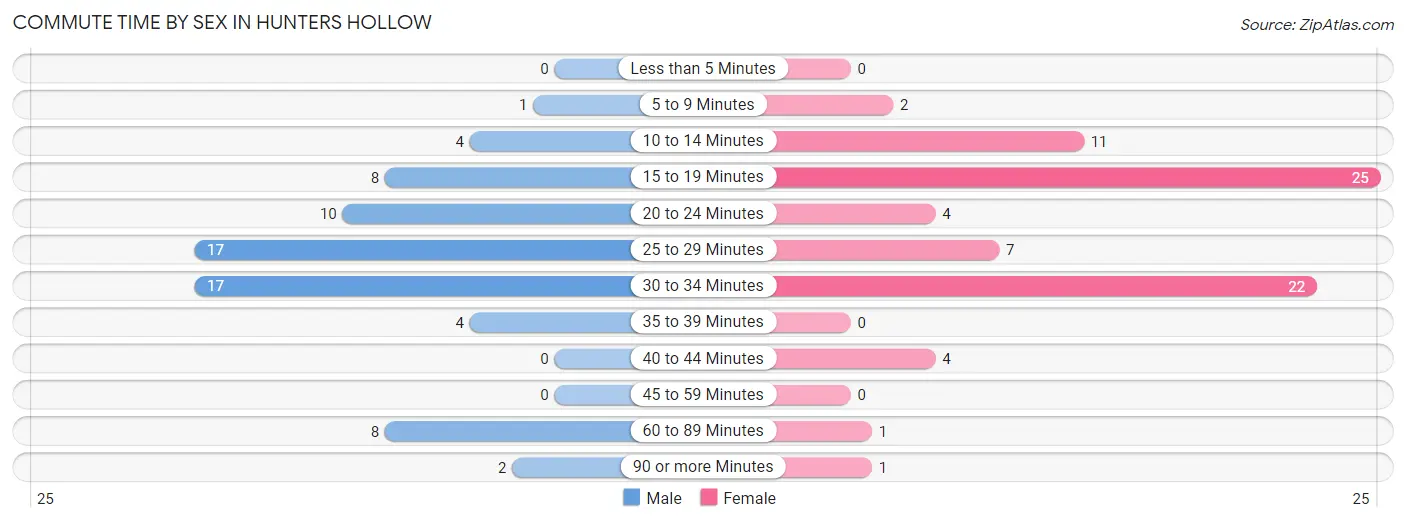
| Commute Time | Male | Female |
| Less than 5 Minutes | 0 (0.0%) | 0 (0.0%) |
| 5 to 9 Minutes | 1 (1.4%) | 2 (2.6%) |
| 10 to 14 Minutes | 4 (5.6%) | 11 (14.3%) |
| 15 to 19 Minutes | 8 (11.3%) | 25 (32.5%) |
| 20 to 24 Minutes | 10 (14.1%) | 4 (5.2%) |
| 25 to 29 Minutes | 17 (23.9%) | 7 (9.1%) |
| 30 to 34 Minutes | 17 (23.9%) | 22 (28.6%) |
| 35 to 39 Minutes | 4 (5.6%) | 0 (0.0%) |
| 40 to 44 Minutes | 0 (0.0%) | 4 (5.2%) |
| 45 to 59 Minutes | 0 (0.0%) | 0 (0.0%) |
| 60 to 89 Minutes | 8 (11.3%) | 1 (1.3%) |
| 90 or more Minutes | 2 (2.8%) | 1 (1.3%) |
Time of Departure to Work by Sex in Hunters Hollow
The most frequent times of departure to work in Hunters Hollow are 6:00 AM to 6:29 AM (25, 35.2%) for males and 8:00 AM to 8:29 AM (24, 31.2%) for females.
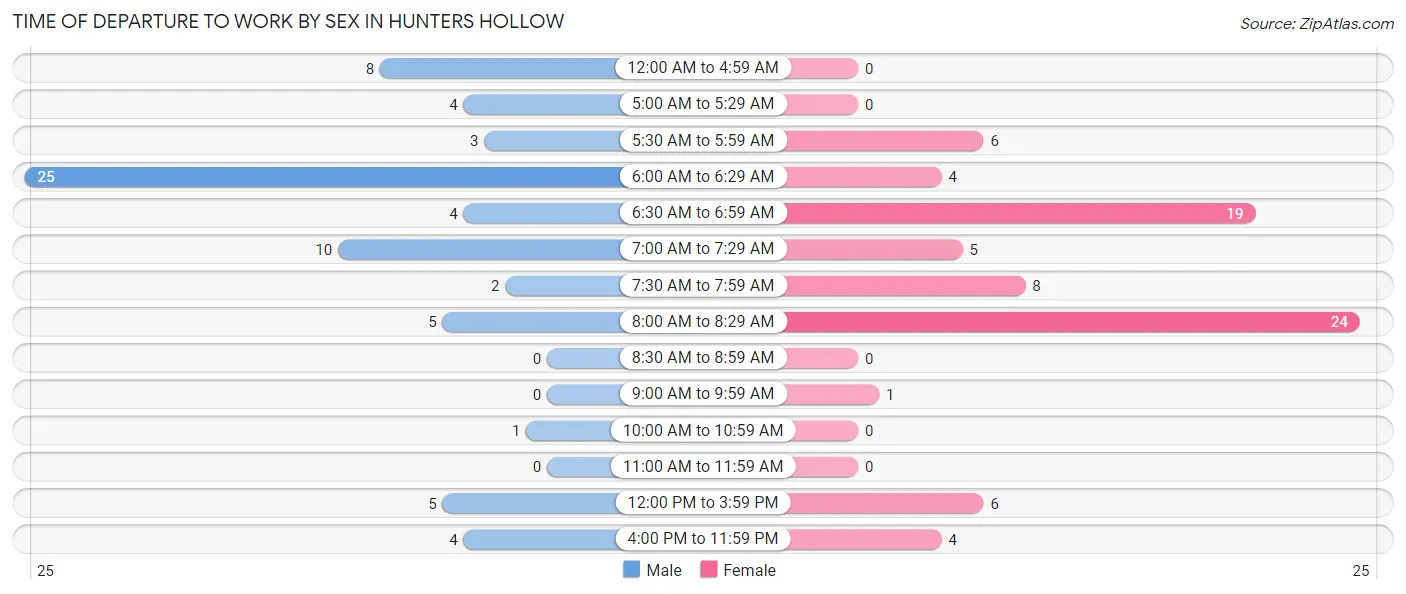
| Time of Departure | Male | Female |
| 12:00 AM to 4:59 AM | 8 (11.3%) | 0 (0.0%) |
| 5:00 AM to 5:29 AM | 4 (5.6%) | 0 (0.0%) |
| 5:30 AM to 5:59 AM | 3 (4.2%) | 6 (7.8%) |
| 6:00 AM to 6:29 AM | 25 (35.2%) | 4 (5.2%) |
| 6:30 AM to 6:59 AM | 4 (5.6%) | 19 (24.7%) |
| 7:00 AM to 7:29 AM | 10 (14.1%) | 5 (6.5%) |
| 7:30 AM to 7:59 AM | 2 (2.8%) | 8 (10.4%) |
| 8:00 AM to 8:29 AM | 5 (7.0%) | 24 (31.2%) |
| 8:30 AM to 8:59 AM | 0 (0.0%) | 0 (0.0%) |
| 9:00 AM to 9:59 AM | 0 (0.0%) | 1 (1.3%) |
| 10:00 AM to 10:59 AM | 1 (1.4%) | 0 (0.0%) |
| 11:00 AM to 11:59 AM | 0 (0.0%) | 0 (0.0%) |
| 12:00 PM to 3:59 PM | 5 (7.0%) | 6 (7.8%) |
| 4:00 PM to 11:59 PM | 4 (5.6%) | 4 (5.2%) |
| Total | 71 (100.0%) | 77 (100.0%) |
Housing Occupancy in Hunters Hollow
Occupancy by Ownership in Hunters Hollow
Of the total 129 dwellings in Hunters Hollow, owner-occupied units account for 110 (85.3%), while renter-occupied units make up 19 (14.7%).
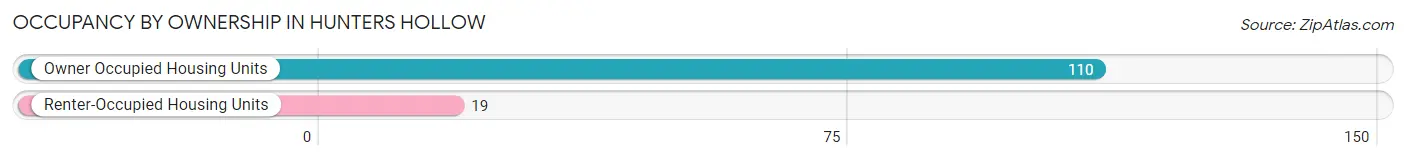
| Occupancy | # Housing Units | % Housing Units |
| Owner Occupied Housing Units | 110 | 85.3% |
| Renter-Occupied Housing Units | 19 | 14.7% |
| Total Occupied Housing Units | 129 | 100.0% |
Occupancy by Household Size in Hunters Hollow
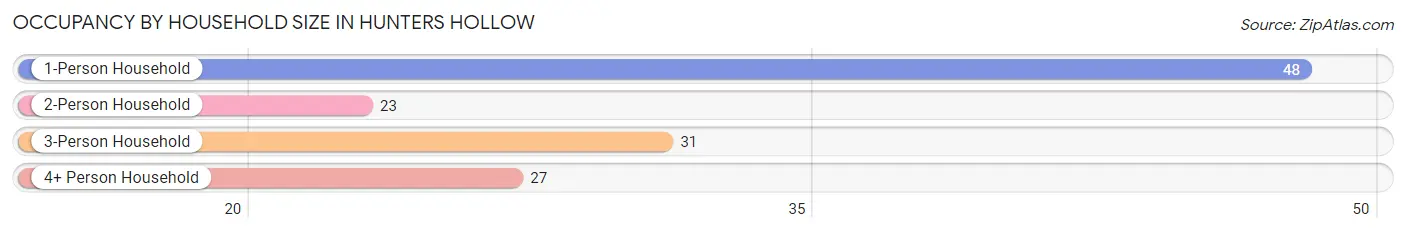
| Household Size | # Housing Units | % Housing Units |
| 1-Person Household | 48 | 37.2% |
| 2-Person Household | 23 | 17.8% |
| 3-Person Household | 31 | 24.0% |
| 4+ Person Household | 27 | 20.9% |
| Total Housing Units | 129 | 100.0% |
Occupancy by Ownership by Household Size in Hunters Hollow
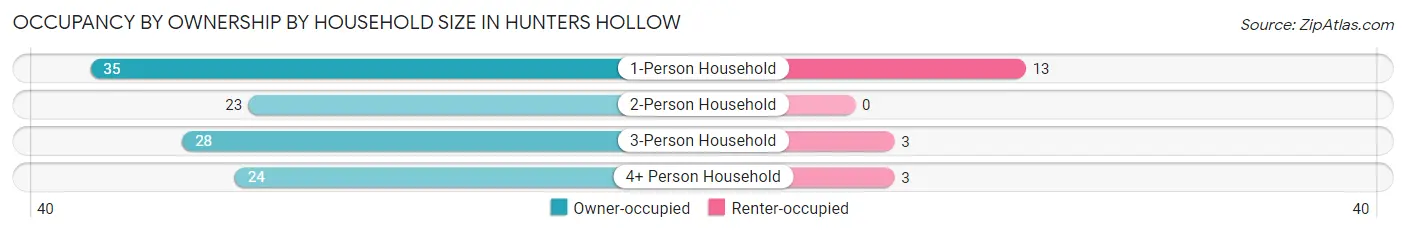
| Household Size | Owner-occupied | Renter-occupied |
| 1-Person Household | 35 (72.9%) | 13 (27.1%) |
| 2-Person Household | 23 (100.0%) | 0 (0.0%) |
| 3-Person Household | 28 (90.3%) | 3 (9.7%) |
| 4+ Person Household | 24 (88.9%) | 3 (11.1%) |
| Total Housing Units | 110 (85.3%) | 19 (14.7%) |
Occupancy by Educational Attainment in Hunters Hollow
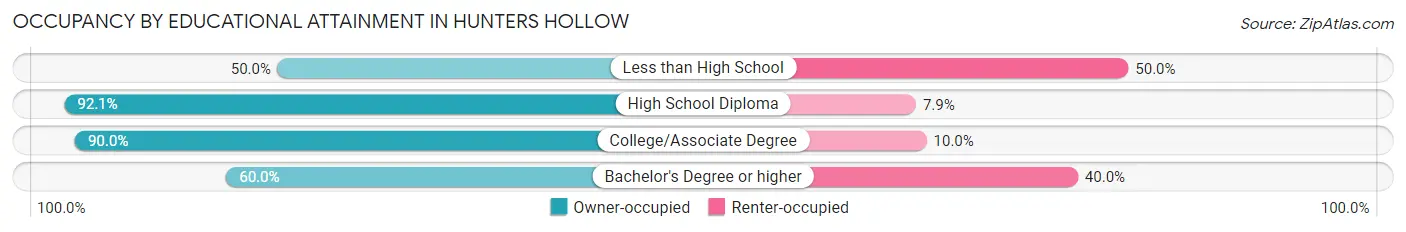
| Household Size | Owner-occupied | Renter-occupied |
| Less than High School | 3 (50.0%) | 3 (50.0%) |
| High School Diploma | 35 (92.1%) | 3 (7.9%) |
| College/Associate Degree | 63 (90.0%) | 7 (10.0%) |
| Bachelor's Degree or higher | 9 (60.0%) | 6 (40.0%) |
Occupancy by Age of Householder in Hunters Hollow
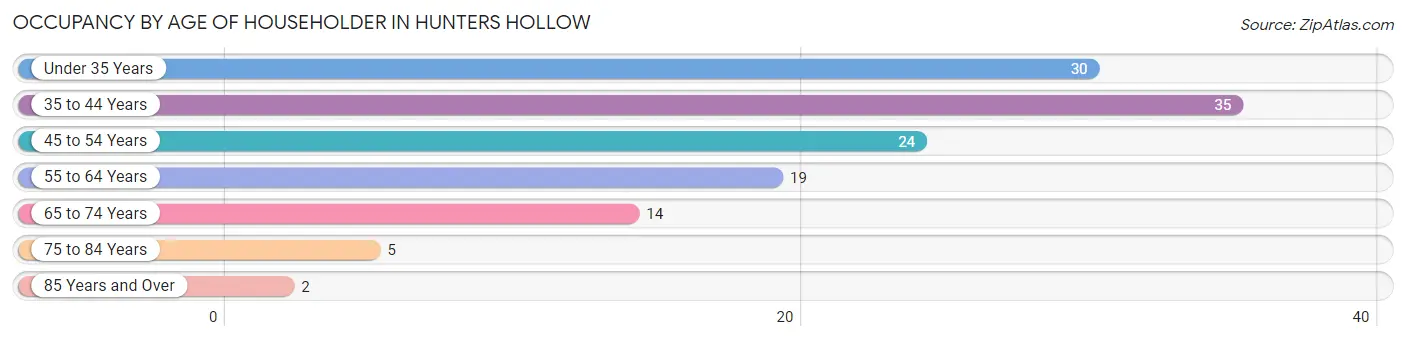
| Age Bracket | # Households | % Households |
| Under 35 Years | 30 | 23.3% |
| 35 to 44 Years | 35 | 27.1% |
| 45 to 54 Years | 24 | 18.6% |
| 55 to 64 Years | 19 | 14.7% |
| 65 to 74 Years | 14 | 10.8% |
| 75 to 84 Years | 5 | 3.9% |
| 85 Years and Over | 2 | 1.5% |
| Total | 129 | 100.0% |
Housing Finances in Hunters Hollow
Median Income by Occupancy in Hunters Hollow
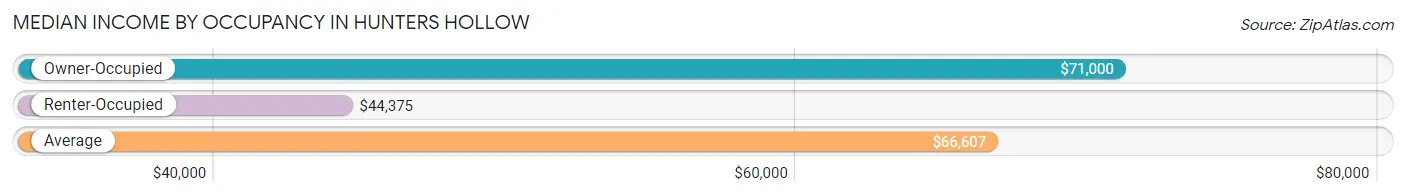
| Occupancy Type | # Households | Median Income |
| Owner-Occupied | 110 (85.3%) | $71,000 |
| Renter-Occupied | 19 (14.7%) | $44,375 |
| Average | 129 (100.0%) | $66,607 |
Occupancy by Householder Income Bracket in Hunters Hollow
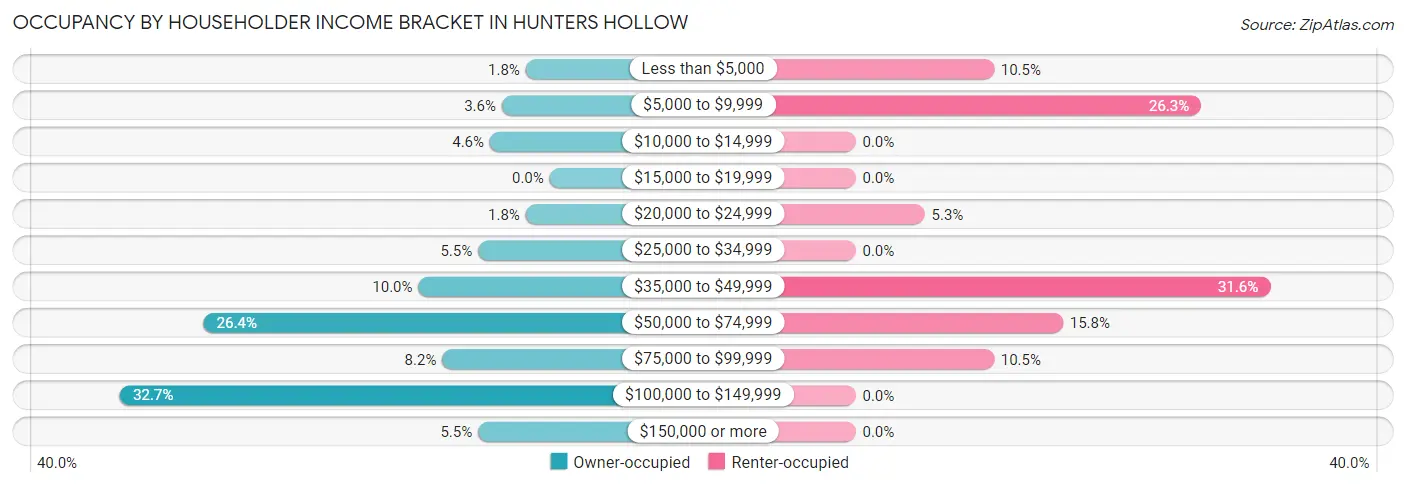
| Income Bracket | Owner-occupied | Renter-occupied |
| Less than $5,000 | 2 (1.8%) | 2 (10.5%) |
| $5,000 to $9,999 | 4 (3.6%) | 5 (26.3%) |
| $10,000 to $14,999 | 5 (4.5%) | 0 (0.0%) |
| $15,000 to $19,999 | 0 (0.0%) | 0 (0.0%) |
| $20,000 to $24,999 | 2 (1.8%) | 1 (5.3%) |
| $25,000 to $34,999 | 6 (5.4%) | 0 (0.0%) |
| $35,000 to $49,999 | 11 (10.0%) | 6 (31.6%) |
| $50,000 to $74,999 | 29 (26.4%) | 3 (15.8%) |
| $75,000 to $99,999 | 9 (8.2%) | 2 (10.5%) |
| $100,000 to $149,999 | 36 (32.7%) | 0 (0.0%) |
| $150,000 or more | 6 (5.4%) | 0 (0.0%) |
| Total | 110 (100.0%) | 19 (100.0%) |
Monthly Housing Cost Tiers in Hunters Hollow
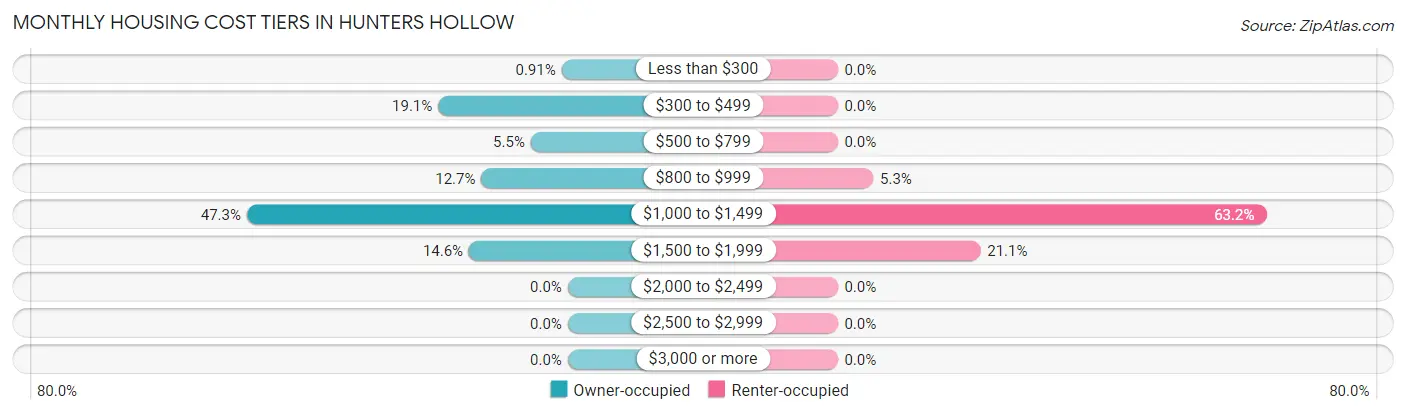
| Monthly Cost | Owner-occupied | Renter-occupied |
| Less than $300 | 1 (0.9%) | 0 (0.0%) |
| $300 to $499 | 21 (19.1%) | 0 (0.0%) |
| $500 to $799 | 6 (5.4%) | 0 (0.0%) |
| $800 to $999 | 14 (12.7%) | 1 (5.3%) |
| $1,000 to $1,499 | 52 (47.3%) | 12 (63.2%) |
| $1,500 to $1,999 | 16 (14.5%) | 4 (21.0%) |
| $2,000 to $2,499 | 0 (0.0%) | 0 (0.0%) |
| $2,500 to $2,999 | 0 (0.0%) | 0 (0.0%) |
| $3,000 or more | 0 (0.0%) | 0 (0.0%) |
| Total | 110 (100.0%) | 19 (100.0%) |
Physical Housing Characteristics in Hunters Hollow
Housing Structures in Hunters Hollow
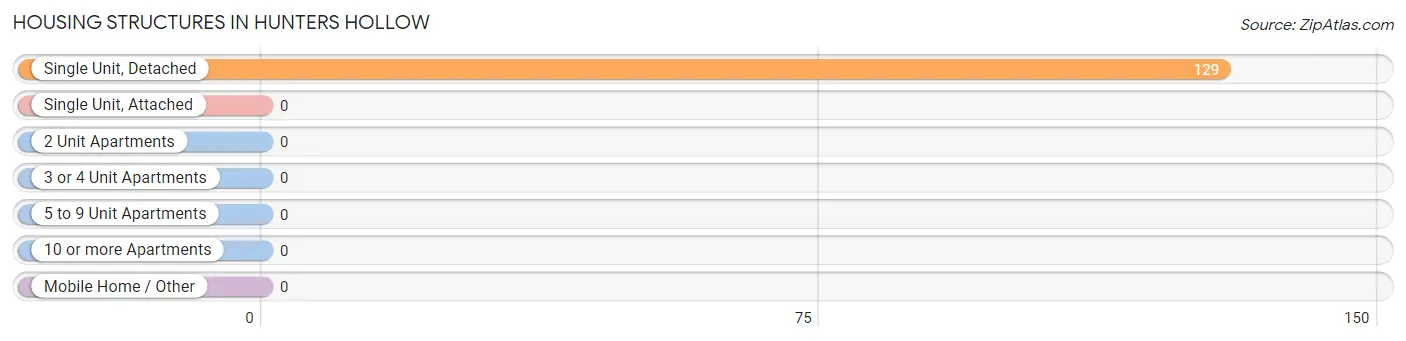
| Structure Type | # Housing Units | % Housing Units |
| Single Unit, Detached | 129 | 100.0% |
| Single Unit, Attached | 0 | 0.0% |
| 2 Unit Apartments | 0 | 0.0% |
| 3 or 4 Unit Apartments | 0 | 0.0% |
| 5 to 9 Unit Apartments | 0 | 0.0% |
| 10 or more Apartments | 0 | 0.0% |
| Mobile Home / Other | 0 | 0.0% |
| Total | 129 | 100.0% |
Housing Structures by Occupancy in Hunters Hollow
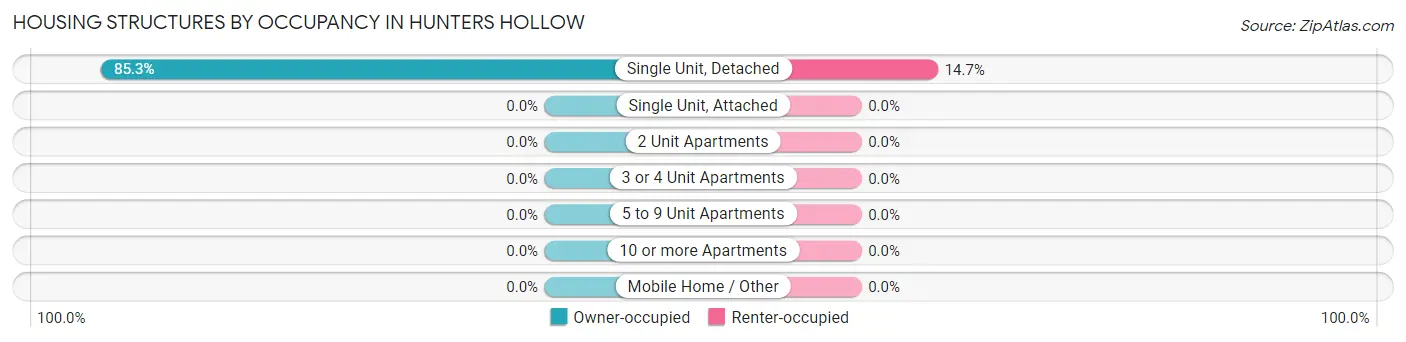
| Structure Type | Owner-occupied | Renter-occupied |
| Single Unit, Detached | 110 (85.3%) | 19 (14.7%) |
| Single Unit, Attached | 0 (0.0%) | 0 (0.0%) |
| 2 Unit Apartments | 0 (0.0%) | 0 (0.0%) |
| 3 or 4 Unit Apartments | 0 (0.0%) | 0 (0.0%) |
| 5 to 9 Unit Apartments | 0 (0.0%) | 0 (0.0%) |
| 10 or more Apartments | 0 (0.0%) | 0 (0.0%) |
| Mobile Home / Other | 0 (0.0%) | 0 (0.0%) |
| Total | 110 (85.3%) | 19 (14.7%) |
Housing Structures by Number of Rooms in Hunters Hollow
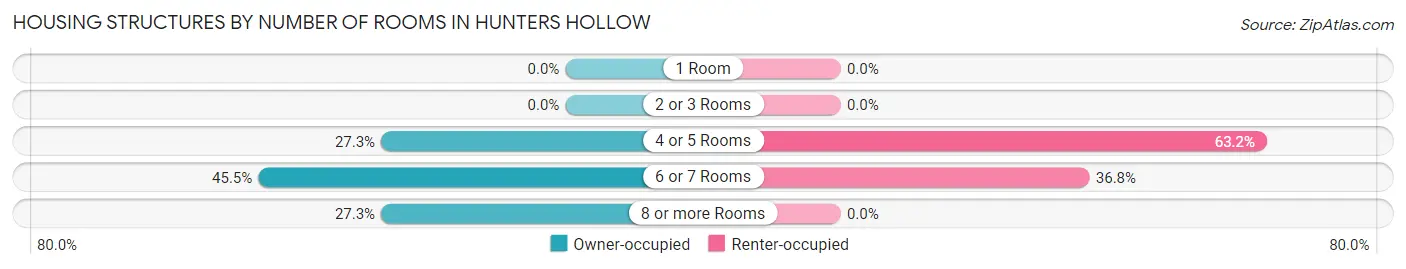
| Number of Rooms | Owner-occupied | Renter-occupied |
| 1 Room | 0 (0.0%) | 0 (0.0%) |
| 2 or 3 Rooms | 0 (0.0%) | 0 (0.0%) |
| 4 or 5 Rooms | 30 (27.3%) | 12 (63.2%) |
| 6 or 7 Rooms | 50 (45.5%) | 7 (36.8%) |
| 8 or more Rooms | 30 (27.3%) | 0 (0.0%) |
| Total | 110 (100.0%) | 19 (100.0%) |
Housing Structure by Heating Type in Hunters Hollow
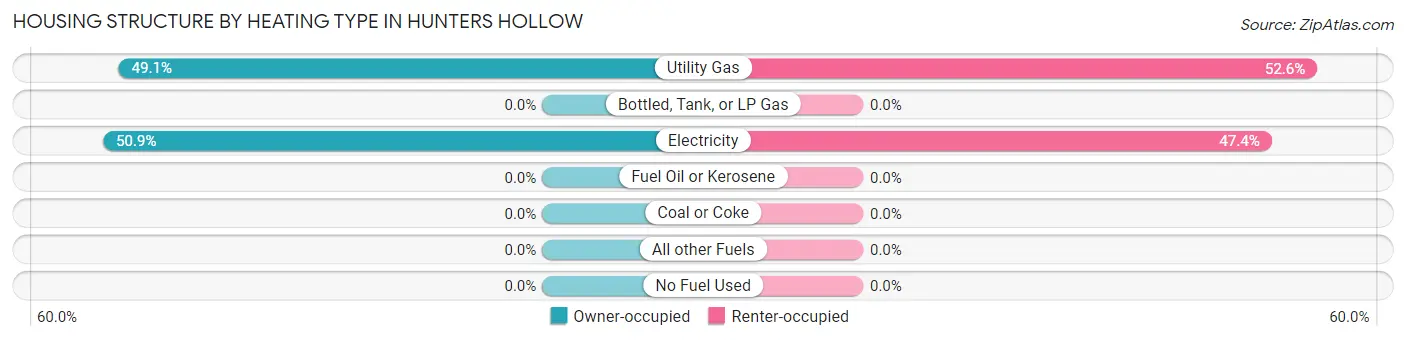
| Heating Type | Owner-occupied | Renter-occupied |
| Utility Gas | 54 (49.1%) | 10 (52.6%) |
| Bottled, Tank, or LP Gas | 0 (0.0%) | 0 (0.0%) |
| Electricity | 56 (50.9%) | 9 (47.4%) |
| Fuel Oil or Kerosene | 0 (0.0%) | 0 (0.0%) |
| Coal or Coke | 0 (0.0%) | 0 (0.0%) |
| All other Fuels | 0 (0.0%) | 0 (0.0%) |
| No Fuel Used | 0 (0.0%) | 0 (0.0%) |
| Total | 110 (100.0%) | 19 (100.0%) |
Household Vehicle Usage in Hunters Hollow
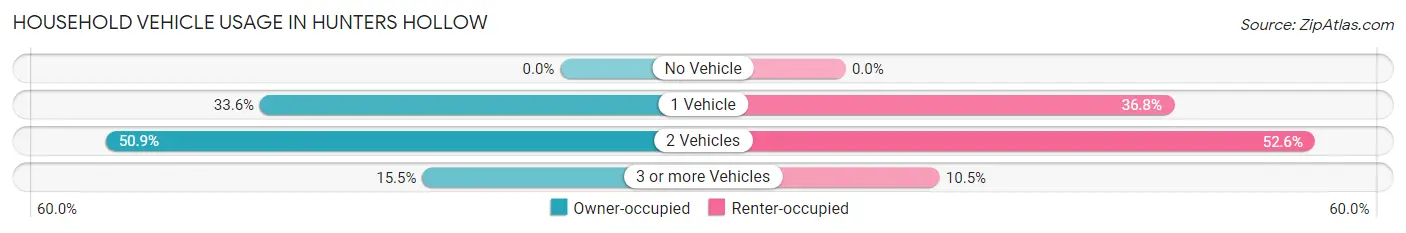
| Vehicles per Household | Owner-occupied | Renter-occupied |
| No Vehicle | 0 (0.0%) | 0 (0.0%) |
| 1 Vehicle | 37 (33.6%) | 7 (36.8%) |
| 2 Vehicles | 56 (50.9%) | 10 (52.6%) |
| 3 or more Vehicles | 17 (15.4%) | 2 (10.5%) |
| Total | 110 (100.0%) | 19 (100.0%) |
Real Estate & Mortgages in Hunters Hollow
Real Estate and Mortgage Overview in Hunters Hollow
| Characteristic | Without Mortgage | With Mortgage |
| Housing Units | 15 | 95 |
| Median Property Value | $129,200 | $170,500 |
| Median Household Income | - | - |
| Monthly Housing Costs | $375 | $0 |
| Real Estate Taxes | $1,275 | $2 |
Property Value by Mortgage Status in Hunters Hollow
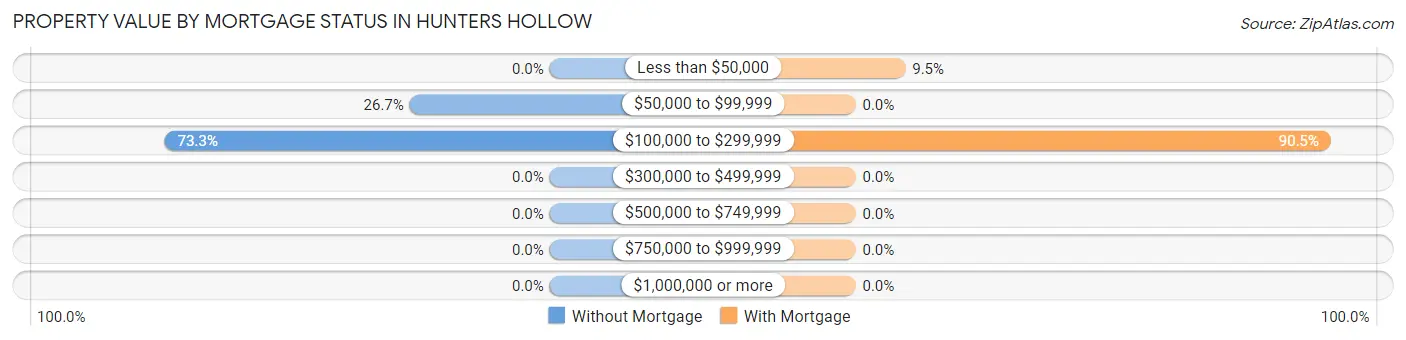
| Property Value | Without Mortgage | With Mortgage |
| Less than $50,000 | 0 (0.0%) | 9 (9.5%) |
| $50,000 to $99,999 | 4 (26.7%) | 0 (0.0%) |
| $100,000 to $299,999 | 11 (73.3%) | 86 (90.5%) |
| $300,000 to $499,999 | 0 (0.0%) | 0 (0.0%) |
| $500,000 to $749,999 | 0 (0.0%) | 0 (0.0%) |
| $750,000 to $999,999 | 0 (0.0%) | 0 (0.0%) |
| $1,000,000 or more | 0 (0.0%) | 0 (0.0%) |
| Total | 15 (100.0%) | 95 (100.0%) |
Household Income by Mortgage Status in Hunters Hollow
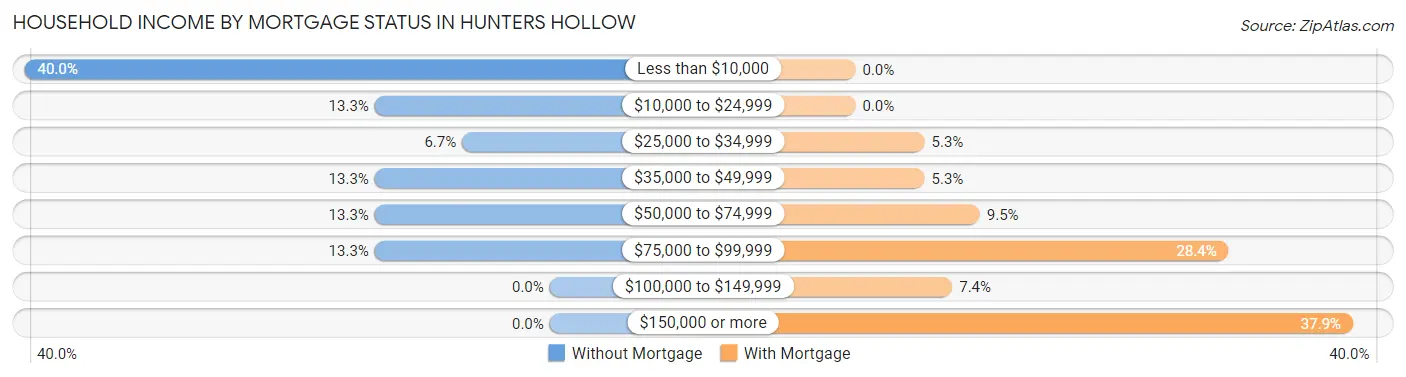
| Household Income | Without Mortgage | With Mortgage |
| Less than $10,000 | 6 (40.0%) | 0 (0.0%) |
| $10,000 to $24,999 | 2 (13.3%) | 0 (0.0%) |
| $25,000 to $34,999 | 1 (6.7%) | 5 (5.3%) |
| $35,000 to $49,999 | 2 (13.3%) | 5 (5.3%) |
| $50,000 to $74,999 | 2 (13.3%) | 9 (9.5%) |
| $75,000 to $99,999 | 2 (13.3%) | 27 (28.4%) |
| $100,000 to $149,999 | 0 (0.0%) | 7 (7.4%) |
| $150,000 or more | 0 (0.0%) | 36 (37.9%) |
| Total | 15 (100.0%) | 95 (100.0%) |
Property Value to Household Income Ratio in Hunters Hollow
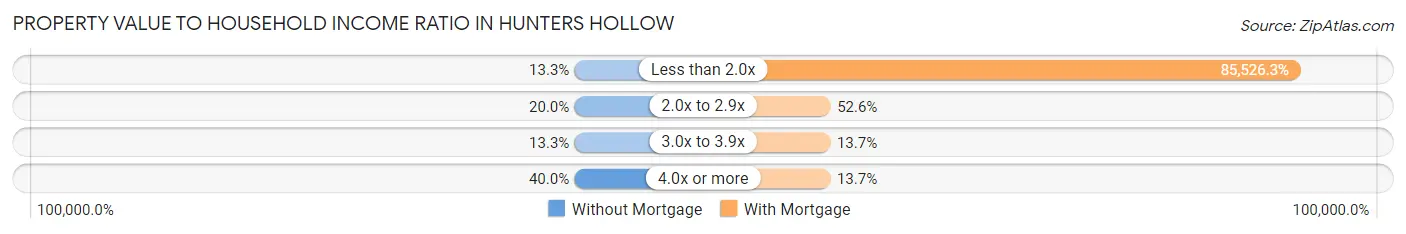
| Value-to-Income Ratio | Without Mortgage | With Mortgage |
| Less than 2.0x | 2 (13.3%) | 81,250 (85,526.3%) |
| 2.0x to 2.9x | 3 (20.0%) | 50 (52.6%) |
| 3.0x to 3.9x | 2 (13.3%) | 13 (13.7%) |
| 4.0x or more | 6 (40.0%) | 13 (13.7%) |
| Total | 15 (100.0%) | 95 (100.0%) |
Real Estate Taxes by Mortgage Status in Hunters Hollow
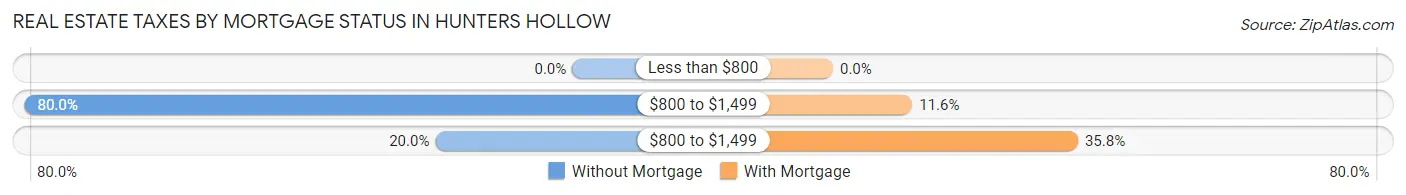
| Property Taxes | Without Mortgage | With Mortgage |
| Less than $800 | 0 (0.0%) | 0 (0.0%) |
| $800 to $1,499 | 12 (80.0%) | 11 (11.6%) |
| $800 to $1,499 | 3 (20.0%) | 34 (35.8%) |
| Total | 15 (100.0%) | 95 (100.0%) |
Health & Disability in Hunters Hollow
Health Insurance Coverage by Age in Hunters Hollow
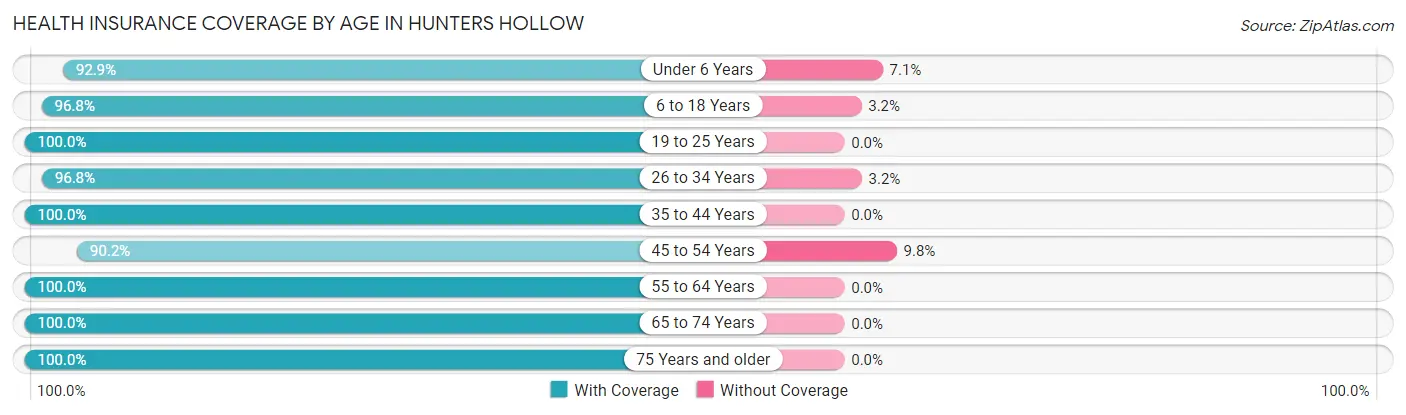
| Age Bracket | With Coverage | Without Coverage |
| Under 6 Years | 13 (92.9%) | 1 (7.1%) |
| 6 to 18 Years | 61 (96.8%) | 2 (3.2%) |
| 19 to 25 Years | 31 (100.0%) | 0 (0.0%) |
| 26 to 34 Years | 60 (96.8%) | 2 (3.2%) |
| 35 to 44 Years | 49 (100.0%) | 0 (0.0%) |
| 45 to 54 Years | 37 (90.2%) | 4 (9.8%) |
| 55 to 64 Years | 34 (100.0%) | 0 (0.0%) |
| 65 to 74 Years | 22 (100.0%) | 0 (0.0%) |
| 75 Years and older | 11 (100.0%) | 0 (0.0%) |
| Total | 318 (97.3%) | 9 (2.8%) |
Health Insurance Coverage by Citizenship Status in Hunters Hollow
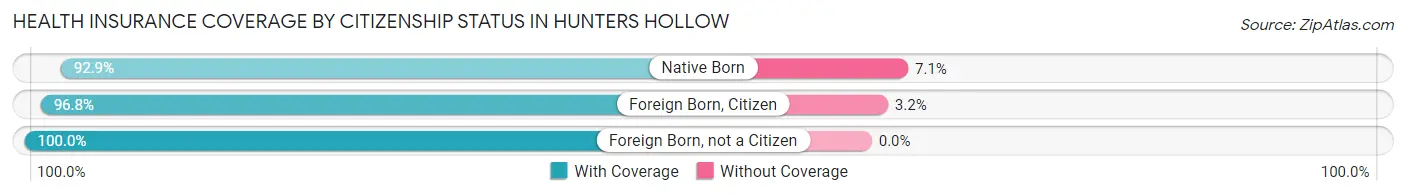
| Citizenship Status | With Coverage | Without Coverage |
| Native Born | 13 (92.9%) | 1 (7.1%) |
| Foreign Born, Citizen | 61 (96.8%) | 2 (3.2%) |
| Foreign Born, not a Citizen | 31 (100.0%) | 0 (0.0%) |
Health Insurance Coverage by Household Income in Hunters Hollow
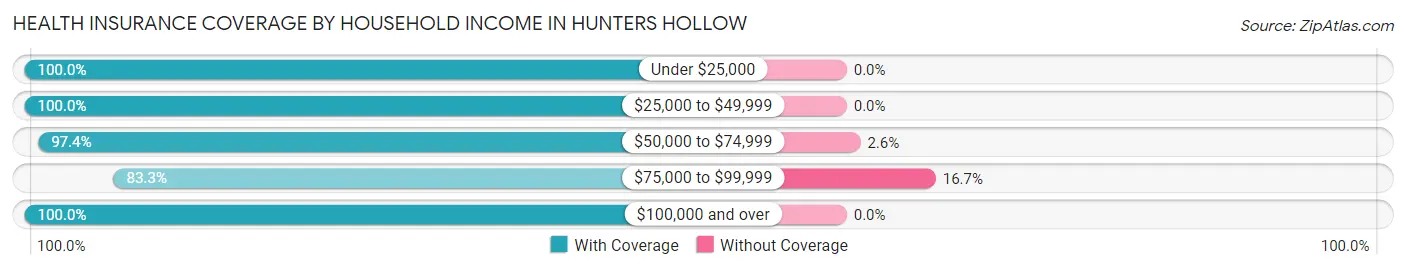
| Household Income | With Coverage | Without Coverage |
| Under $25,000 | 25 (100.0%) | 0 (0.0%) |
| $25,000 to $49,999 | 38 (100.0%) | 0 (0.0%) |
| $50,000 to $74,999 | 76 (97.4%) | 2 (2.6%) |
| $75,000 to $99,999 | 35 (83.3%) | 7 (16.7%) |
| $100,000 and over | 144 (100.0%) | 0 (0.0%) |
Public vs Private Health Insurance Coverage by Age in Hunters Hollow
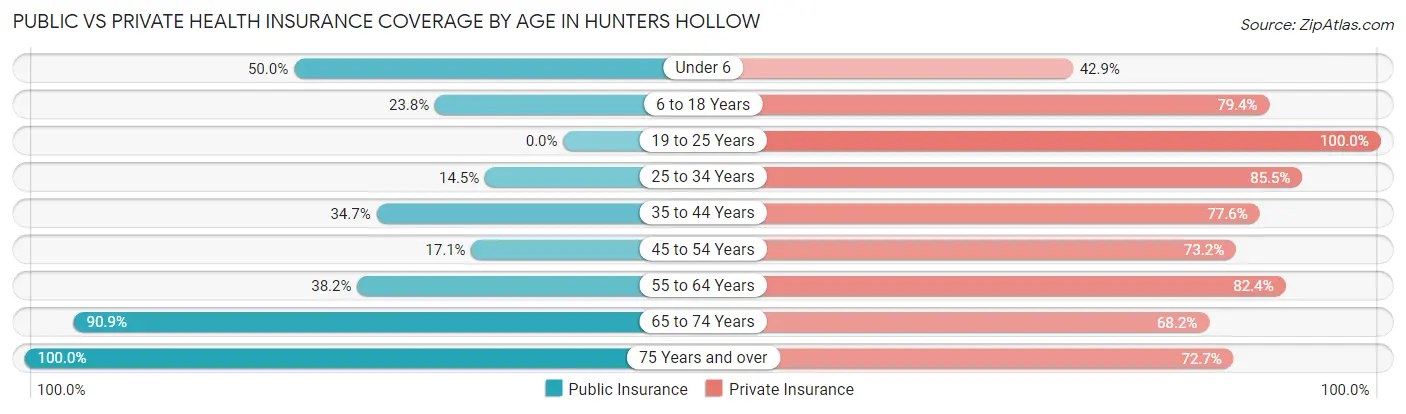
| Age Bracket | Public Insurance | Private Insurance |
| Under 6 | 7 (50.0%) | 6 (42.9%) |
| 6 to 18 Years | 15 (23.8%) | 50 (79.4%) |
| 19 to 25 Years | 0 (0.0%) | 31 (100.0%) |
| 25 to 34 Years | 9 (14.5%) | 53 (85.5%) |
| 35 to 44 Years | 17 (34.7%) | 38 (77.5%) |
| 45 to 54 Years | 7 (17.1%) | 30 (73.2%) |
| 55 to 64 Years | 13 (38.2%) | 28 (82.4%) |
| 65 to 74 Years | 20 (90.9%) | 15 (68.2%) |
| 75 Years and over | 11 (100.0%) | 8 (72.7%) |
| Total | 99 (30.3%) | 259 (79.2%) |
Disability Status by Sex by Age in Hunters Hollow
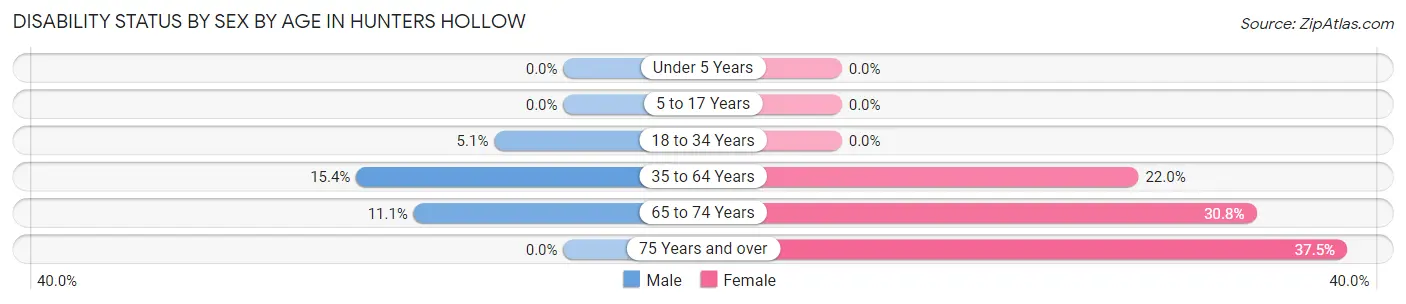
| Age Bracket | Male | Female |
| Under 5 Years | 0 (0.0%) | 0 (0.0%) |
| 5 to 17 Years | 0 (0.0%) | 0 (0.0%) |
| 18 to 34 Years | 2 (5.1%) | 0 (0.0%) |
| 35 to 64 Years | 10 (15.4%) | 13 (22.0%) |
| 65 to 74 Years | 1 (11.1%) | 4 (30.8%) |
| 75 Years and over | 0 (0.0%) | 3 (37.5%) |
Disability Class by Sex by Age in Hunters Hollow
Disability Class: Hearing Difficulty
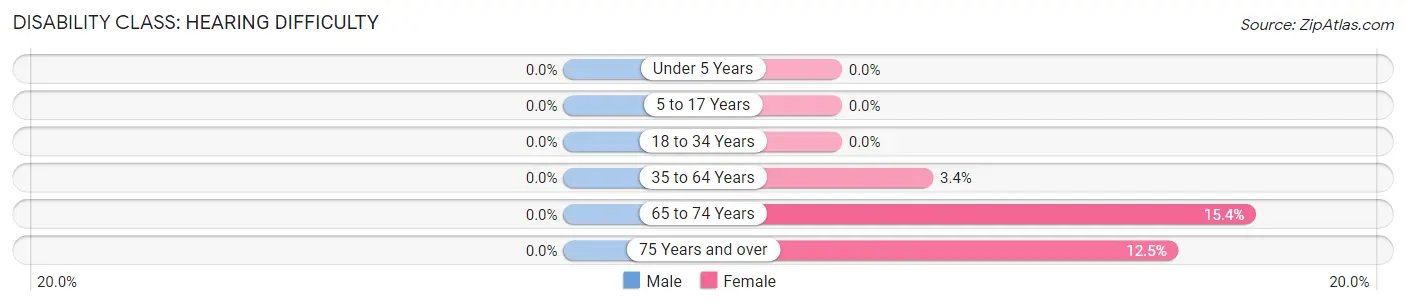
| Age Bracket | Male | Female |
| Under 5 Years | 0 (0.0%) | 0 (0.0%) |
| 5 to 17 Years | 0 (0.0%) | 0 (0.0%) |
| 18 to 34 Years | 0 (0.0%) | 0 (0.0%) |
| 35 to 64 Years | 0 (0.0%) | 2 (3.4%) |
| 65 to 74 Years | 0 (0.0%) | 2 (15.4%) |
| 75 Years and over | 0 (0.0%) | 1 (12.5%) |
Disability Class: Vision Difficulty
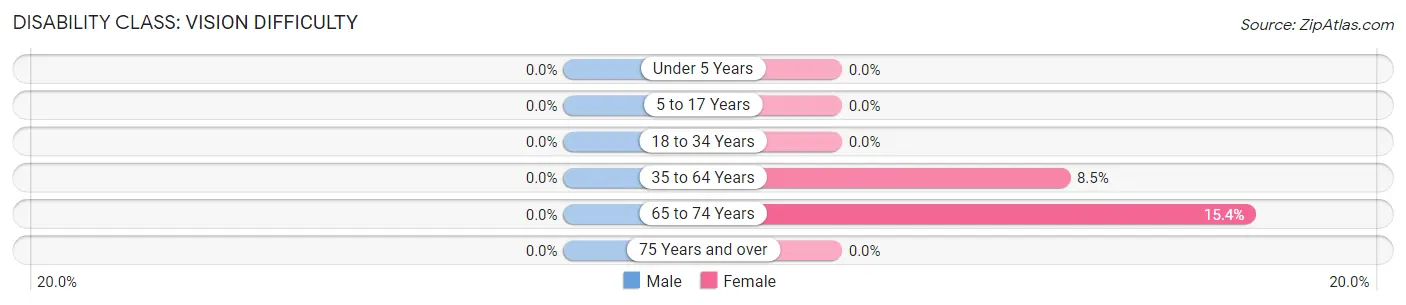
| Age Bracket | Male | Female |
| Under 5 Years | 0 (0.0%) | 0 (0.0%) |
| 5 to 17 Years | 0 (0.0%) | 0 (0.0%) |
| 18 to 34 Years | 0 (0.0%) | 0 (0.0%) |
| 35 to 64 Years | 0 (0.0%) | 5 (8.5%) |
| 65 to 74 Years | 0 (0.0%) | 2 (15.4%) |
| 75 Years and over | 0 (0.0%) | 0 (0.0%) |
Disability Class: Cognitive Difficulty
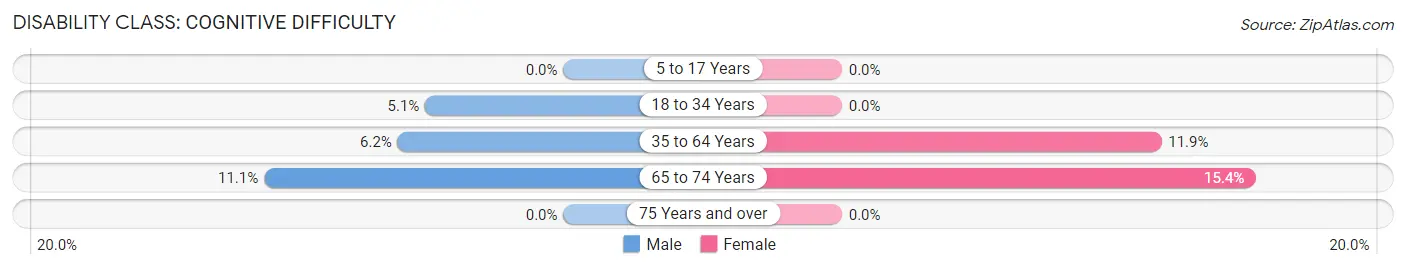
| Age Bracket | Male | Female |
| 5 to 17 Years | 0 (0.0%) | 0 (0.0%) |
| 18 to 34 Years | 2 (5.1%) | 0 (0.0%) |
| 35 to 64 Years | 4 (6.1%) | 7 (11.9%) |
| 65 to 74 Years | 1 (11.1%) | 2 (15.4%) |
| 75 Years and over | 0 (0.0%) | 0 (0.0%) |
Disability Class: Ambulatory Difficulty
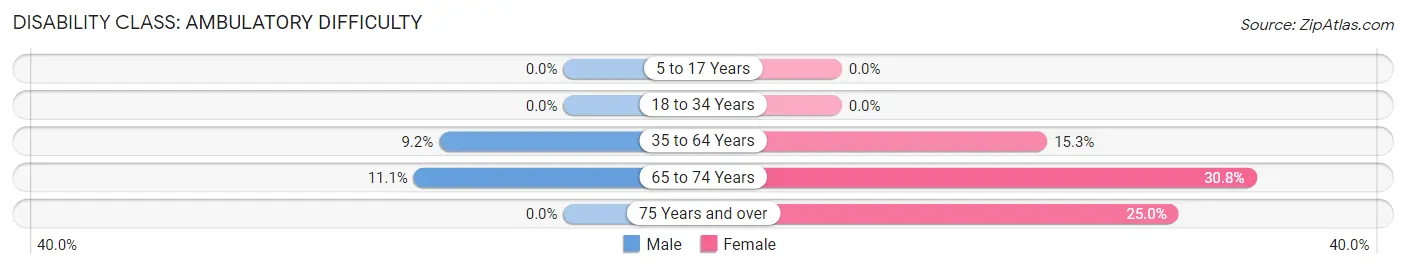
| Age Bracket | Male | Female |
| 5 to 17 Years | 0 (0.0%) | 0 (0.0%) |
| 18 to 34 Years | 0 (0.0%) | 0 (0.0%) |
| 35 to 64 Years | 6 (9.2%) | 9 (15.2%) |
| 65 to 74 Years | 1 (11.1%) | 4 (30.8%) |
| 75 Years and over | 0 (0.0%) | 2 (25.0%) |
Disability Class: Self-Care Difficulty
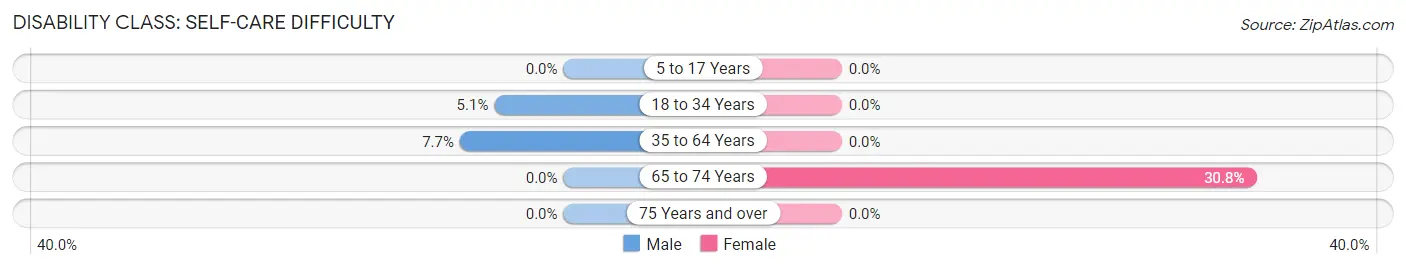
| Age Bracket | Male | Female |
| 5 to 17 Years | 0 (0.0%) | 0 (0.0%) |
| 18 to 34 Years | 2 (5.1%) | 0 (0.0%) |
| 35 to 64 Years | 5 (7.7%) | 0 (0.0%) |
| 65 to 74 Years | 0 (0.0%) | 4 (30.8%) |
| 75 Years and over | 0 (0.0%) | 0 (0.0%) |
Technology Access in Hunters Hollow
Computing Device Access in Hunters Hollow
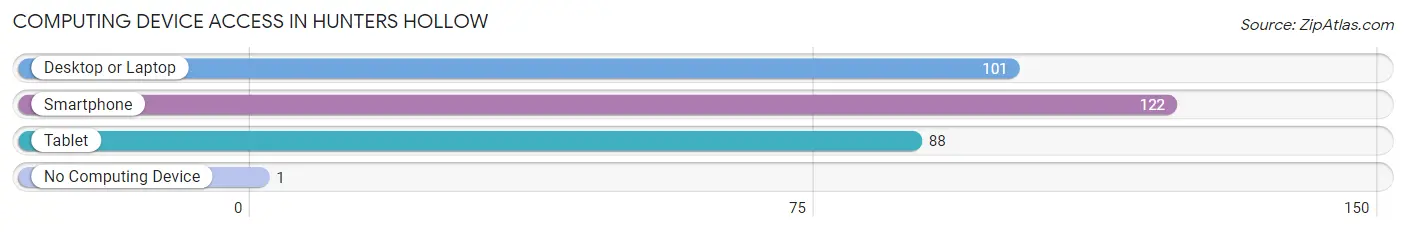
| Device Type | # Households | % Households |
| Desktop or Laptop | 101 | 78.3% |
| Smartphone | 122 | 94.6% |
| Tablet | 88 | 68.2% |
| No Computing Device | 1 | 0.8% |
| Total | 129 | 100.0% |
Internet Access in Hunters Hollow
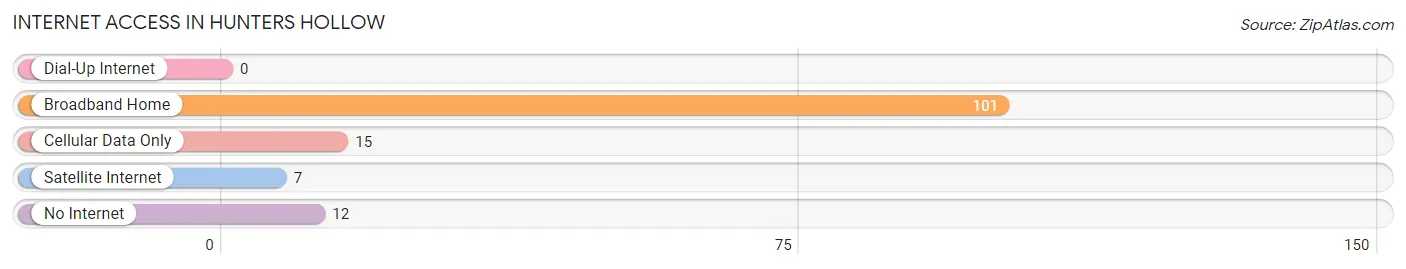
| Internet Type | # Households | % Households |
| Dial-Up Internet | 0 | 0.0% |
| Broadband Home | 101 | 78.3% |
| Cellular Data Only | 15 | 11.6% |
| Satellite Internet | 7 | 5.4% |
| No Internet | 12 | 9.3% |
| Total | 129 | 100.0% |
Hunters Hollow Summary
Hunters Hollow is a small unincorporated community located in the northern part of Kentucky, in the United States. It is situated in the county of Bullitt, and is part of the Louisville/Jefferson County Metropolitan Statistical Area. The population of Hunters Hollow was estimated to be around 1,000 people in the year 2000.
History
The area that is now Hunters Hollow was first settled in the late 1700s by a group of settlers from Virginia. The settlers were attracted to the area due to its abundance of natural resources, such as timber and game. The area was originally known as “Hunter’s Hollow”, named after the first settler, John Hunter. The area was officially incorporated in 1820, and the name was changed to “Hunters Hollow”.
The area was primarily an agricultural community, with the main crops being corn, wheat, and tobacco. The area also had a number of small businesses, such as a general store, a blacksmith, and a sawmill. The area was also home to a number of churches, including the Hunters Hollow Baptist Church, which was founded in 1820.
Geography
Hunters Hollow is located in the northern part of Kentucky, in the county of Bullitt. It is situated in the Louisville/Jefferson County Metropolitan Statistical Area. The area is primarily rural, with rolling hills and forests. The area is also home to a number of creeks and streams, including the Salt River, which runs through the area.
The climate in Hunters Hollow is generally mild, with hot summers and cold winters. The average temperature in the summer is around 75 degrees Fahrenheit, and the average temperature in the winter is around 35 degrees Fahrenheit. The area receives an average of 45 inches of precipitation per year.
Economy
The economy of Hunters Hollow is primarily based on agriculture. The main crops grown in the area are corn, wheat, and tobacco. The area also has a number of small businesses, such as a general store, a blacksmith, and a sawmill. The area is also home to a number of churches, which provide employment opportunities for local residents.
Demographics
The population of Hunters Hollow was estimated to be around 1,000 people in the year 2000. The population is primarily white, with a small percentage of African Americans and Hispanics. The median household income in the area is around $35,000, and the median home value is around $100,000. The area is served by the Bullitt County Public Schools system.
Common Questions
What is Per Capita Income in Hunters Hollow?
Per Capita income in Hunters Hollow is $30,752.
What is the Median Family Income in Hunters Hollow?
Median Family Income in Hunters Hollow is $90,000.
What is the Median Household income in Hunters Hollow?
Median Household Income in Hunters Hollow is $66,607.
What is Income or Wage Gap in Hunters Hollow?
Income or Wage Gap in Hunters Hollow is 18.5%.
Women in Hunters Hollow earn 81.5 cents for every dollar earned by a man.
What is Inequality or Gini Index in Hunters Hollow?
Inequality or Gini Index in Hunters Hollow is 0.36.
What is the Total Population of Hunters Hollow?
Total Population of Hunters Hollow is 327.
What is the Total Male Population of Hunters Hollow?
Total Male Population of Hunters Hollow is 163.
What is the Total Female Population of Hunters Hollow?
Total Female Population of Hunters Hollow is 164.
What is the Ratio of Males per 100 Females in Hunters Hollow?
There are 99.39 Males per 100 Females in Hunters Hollow.
What is the Ratio of Females per 100 Males in Hunters Hollow?
There are 100.61 Females per 100 Males in Hunters Hollow.
What is the Median Population Age in Hunters Hollow?
Median Population Age in Hunters Hollow is 34.3 Years.
What is the Average Family Size in Hunters Hollow
Average Family Size in Hunters Hollow is 3.2 People.
What is the Average Household Size in Hunters Hollow
Average Household Size in Hunters Hollow is 2.5 People.
How Large is the Labor Force in Hunters Hollow?
There are 177 People in the Labor Forcein in Hunters Hollow.
What is the Percentage of People in the Labor Force in Hunters Hollow?
66.8% of People are in the Labor Force in Hunters Hollow.
What is the Unemployment Rate in Hunters Hollow?
Unemployment Rate in Hunters Hollow is 4.0%.