Fancy Farm, KY Map & Demographics
Fancy Farm Map
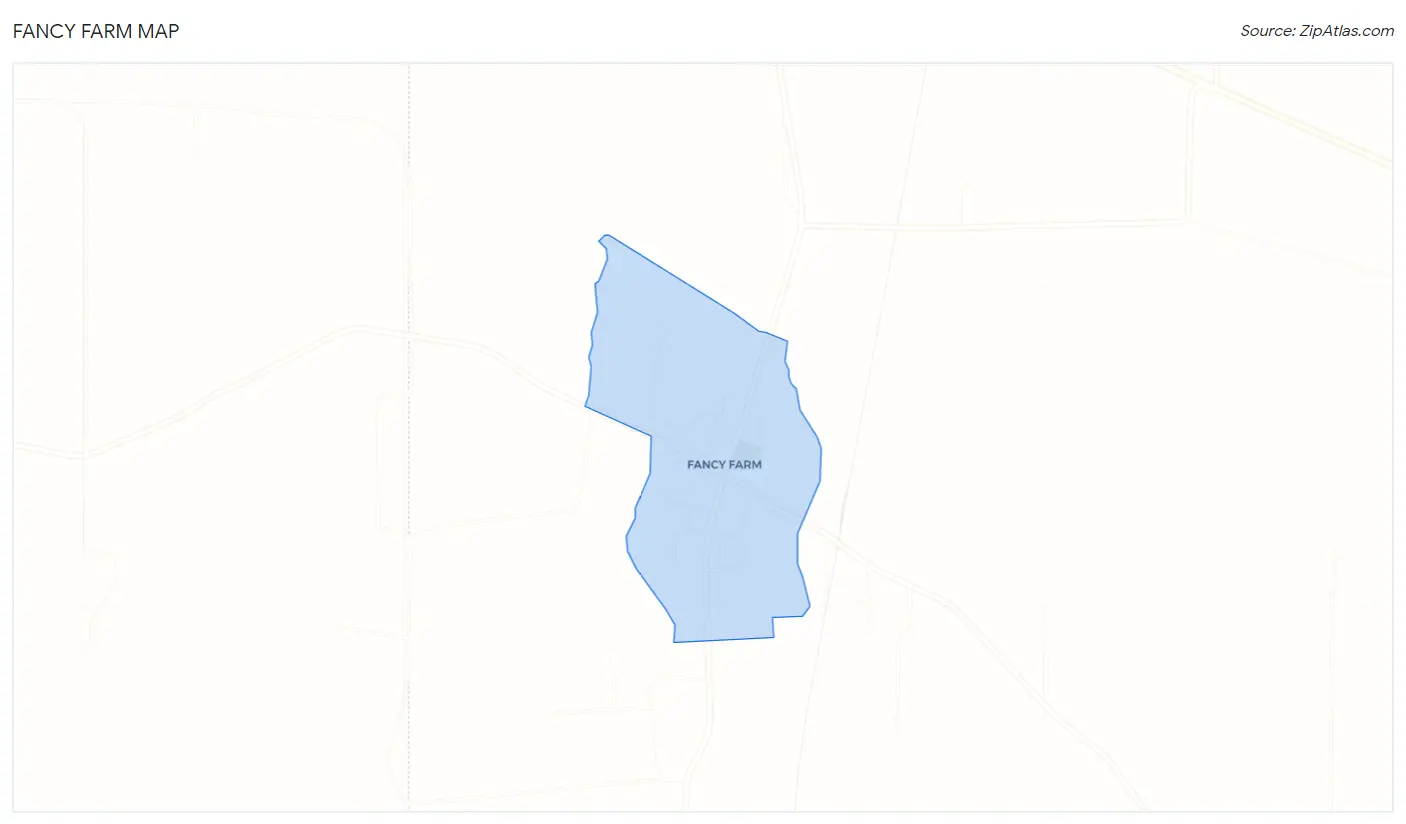
Fancy Farm Overview
$26,605
PER CAPITA INCOME
$54,107
AVG FAMILY INCOME
$55,060
AVG HOUSEHOLD INCOME
37.6%
WAGE / INCOME GAP [ % ]
62.4¢/ $1
WAGE / INCOME GAP [ $ ]
0.46
INEQUALITY / GINI INDEX
300
TOTAL POPULATION
140
MALE POPULATION
160
FEMALE POPULATION
87.50
MALES / 100 FEMALES
114.29
FEMALES / 100 MALES
51.1
MEDIAN AGE
3.9
AVG FAMILY SIZE
2.0
AVG HOUSEHOLD SIZE
117
LABOR FORCE [ PEOPLE ]
43.3%
PERCENT IN LABOR FORCE
Fancy Farm Zip Codes
Income in Fancy Farm
Income Overview in Fancy Farm
Per Capita Income in Fancy Farm is $26,605, while median incomes of families and households are $54,107 and $55,060 respectively.
| Characteristic | Number | Measure |
| Per Capita Income | 300 | $26,605 |
| Median Family Income | 43 | $54,107 |
| Mean Family Income | 43 | $63,188 |
| Median Household Income | 151 | $55,060 |
| Mean Household Income | 151 | $51,802 |
| Income Deficit | 43 | $0 |
| Wage / Income Gap (%) | 300 | 37.60% |
| Wage / Income Gap ($) | 300 | 62.40¢ per $1 |
| Gini / Inequality Index | 300 | 0.46 |
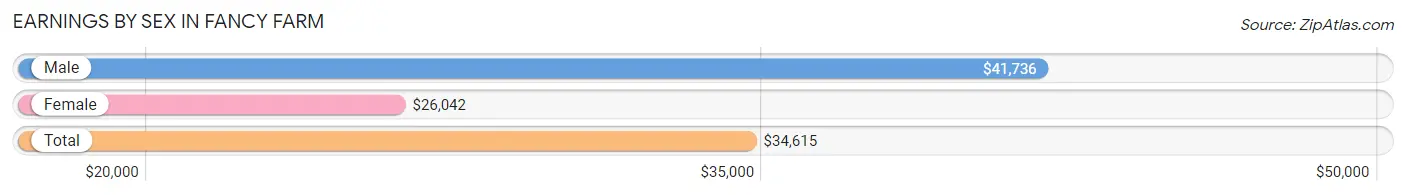
Earnings by Sex in Fancy Farm
Average Earnings in Fancy Farm are $34,615, $41,736 for men and $26,042 for women, a difference of 37.6%.
| Sex | Number | Average Earnings |
| Male | 69 (55.6%) | $41,736 |
| Female | 55 (44.4%) | $26,042 |
| Total | 124 (100.0%) | $34,615 |
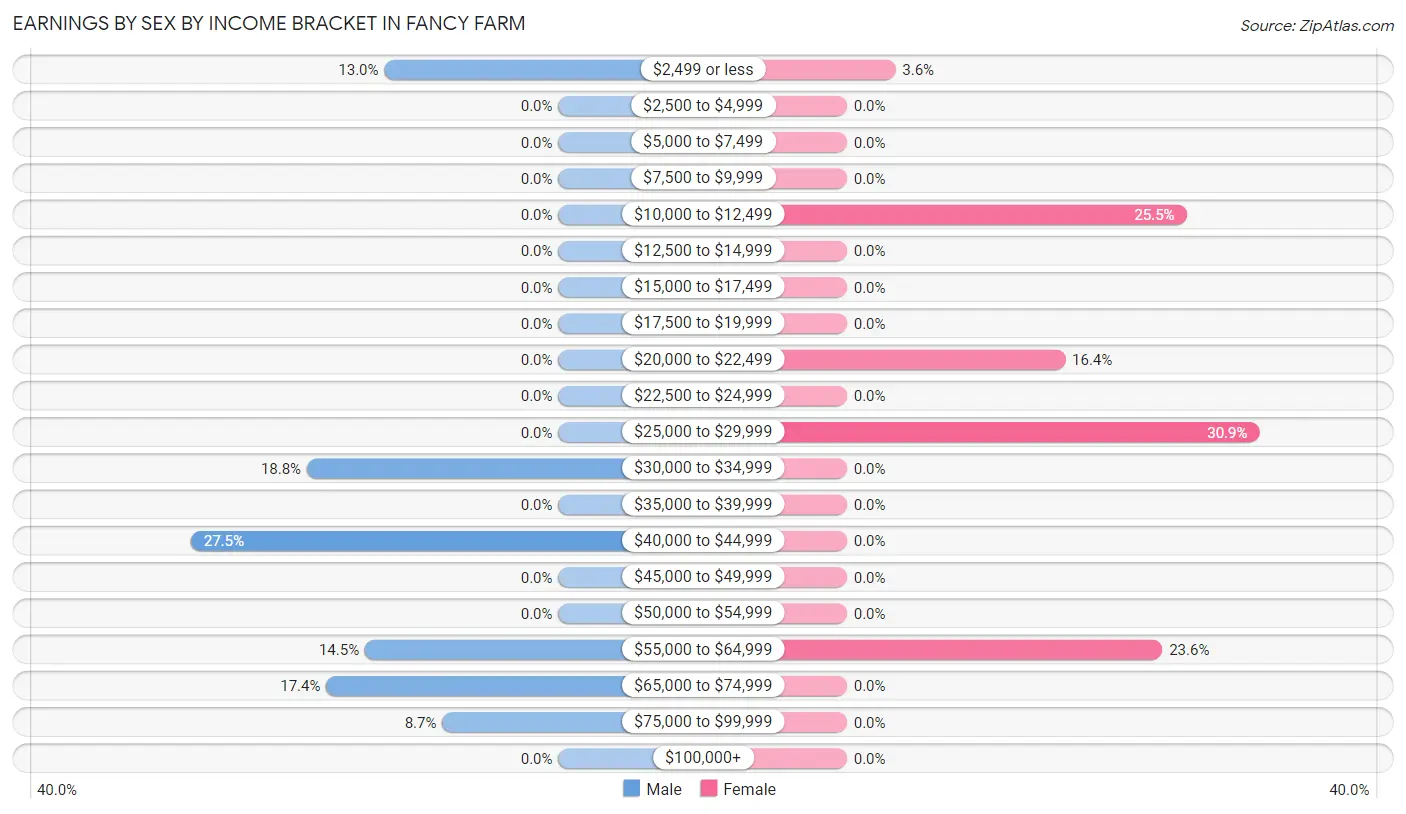
Earnings by Sex by Income Bracket in Fancy Farm
The most common earnings brackets in Fancy Farm are $40,000 to $44,999 for men (19 | 27.5%) and $25,000 to $29,999 for women (17 | 30.9%).
| Income | Male | Female |
| $2,499 or less | 9 (13.0%) | 2 (3.6%) |
| $2,500 to $4,999 | 0 (0.0%) | 0 (0.0%) |
| $5,000 to $7,499 | 0 (0.0%) | 0 (0.0%) |
| $7,500 to $9,999 | 0 (0.0%) | 0 (0.0%) |
| $10,000 to $12,499 | 0 (0.0%) | 14 (25.5%) |
| $12,500 to $14,999 | 0 (0.0%) | 0 (0.0%) |
| $15,000 to $17,499 | 0 (0.0%) | 0 (0.0%) |
| $17,500 to $19,999 | 0 (0.0%) | 0 (0.0%) |
| $20,000 to $22,499 | 0 (0.0%) | 9 (16.4%) |
| $22,500 to $24,999 | 0 (0.0%) | 0 (0.0%) |
| $25,000 to $29,999 | 0 (0.0%) | 17 (30.9%) |
| $30,000 to $34,999 | 13 (18.8%) | 0 (0.0%) |
| $35,000 to $39,999 | 0 (0.0%) | 0 (0.0%) |
| $40,000 to $44,999 | 19 (27.5%) | 0 (0.0%) |
| $45,000 to $49,999 | 0 (0.0%) | 0 (0.0%) |
| $50,000 to $54,999 | 0 (0.0%) | 0 (0.0%) |
| $55,000 to $64,999 | 10 (14.5%) | 13 (23.6%) |
| $65,000 to $74,999 | 12 (17.4%) | 0 (0.0%) |
| $75,000 to $99,999 | 6 (8.7%) | 0 (0.0%) |
| $100,000+ | 0 (0.0%) | 0 (0.0%) |
| Total | 69 (100.0%) | 55 (100.0%) |
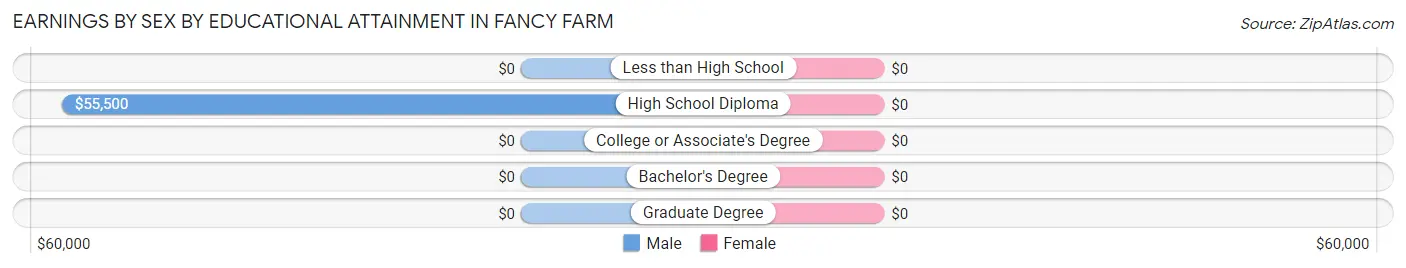
Earnings by Sex by Educational Attainment in Fancy Farm
| Educational Attainment | Male Income | Female Income |
| Less than High School | - | - |
| High School Diploma | $55,500 | $0 |
| College or Associate's Degree | - | - |
| Bachelor's Degree | - | - |
| Graduate Degree | - | - |
| Total | $42,361 | $27,727 |
Family Income in Fancy Farm
Family Income Brackets in Fancy Farm
According to the Fancy Farm family income data, there are 13 families falling into the $50,000 to $74,999 income range, which is the most common income bracket and makes up 30.2% of all families.
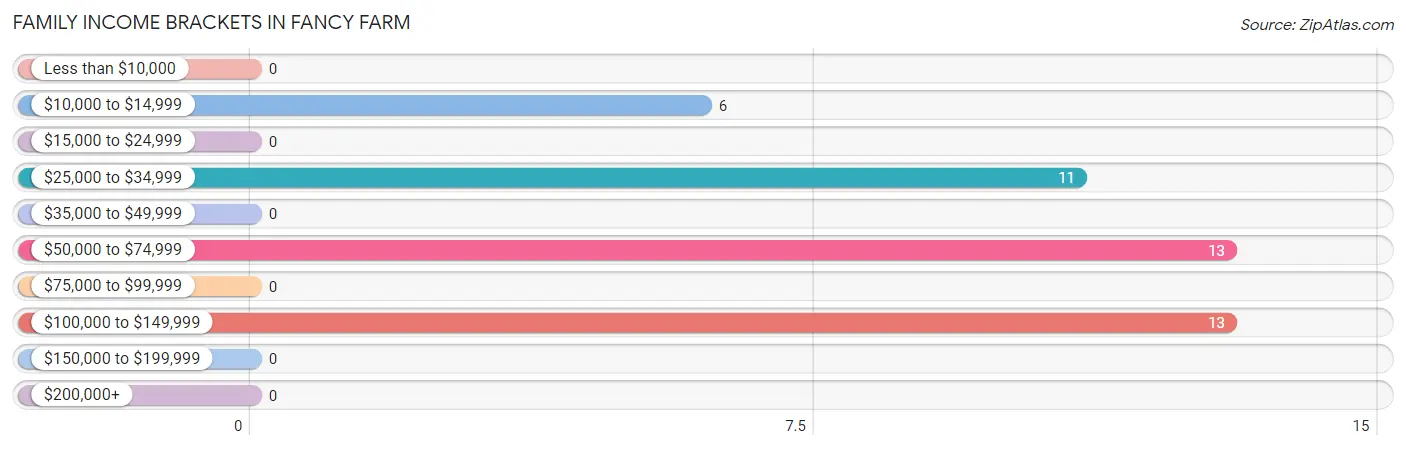
| Income Bracket | # Families | % Families |
| Less than $10,000 | 0 | 0.0% |
| $10,000 to $14,999 | 6 | 14.0% |
| $15,000 to $24,999 | 0 | 0.0% |
| $25,000 to $34,999 | 11 | 25.6% |
| $35,000 to $49,999 | 0 | 0.0% |
| $50,000 to $74,999 | 13 | 30.2% |
| $75,000 to $99,999 | 0 | 0.0% |
| $100,000 to $149,999 | 13 | 30.2% |
| $150,000 to $199,999 | 0 | 0.0% |
| $200,000+ | 0 | 0.0% |
Family Income by Famaliy Size in Fancy Farm
2-person families (17 | 39.5%) account for the highest median family income in Fancy Farm with $54,107 per family, while 2-person families (17 | 39.5%) have the highest median income of $27,054 per family member.
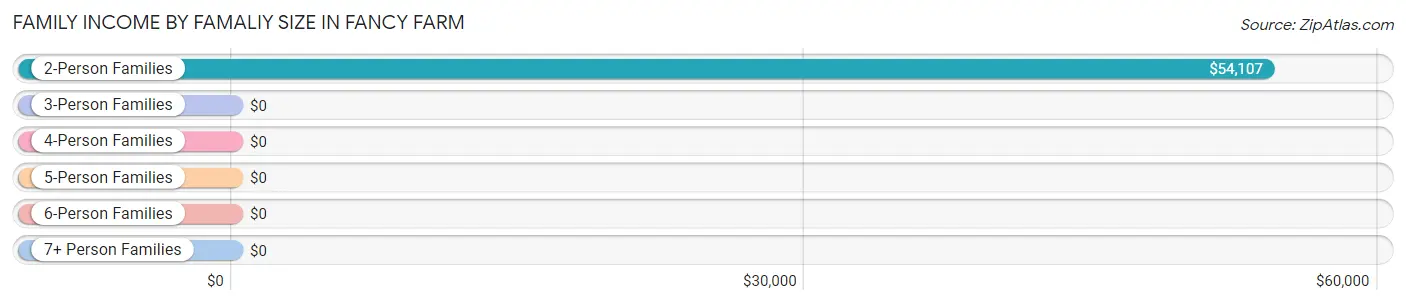
| Income Bracket | # Families | Median Income |
| 2-Person Families | 17 (39.5%) | $54,107 |
| 3-Person Families | 19 (44.2%) | $0 |
| 4-Person Families | 6 (14.0%) | $0 |
| 5-Person Families | 0 (0.0%) | $0 |
| 6-Person Families | 0 (0.0%) | $0 |
| 7+ Person Families | 1 (2.3%) | $0 |
| Total | 43 (100.0%) | $54,107 |
Family Income by Number of Earners in Fancy Farm
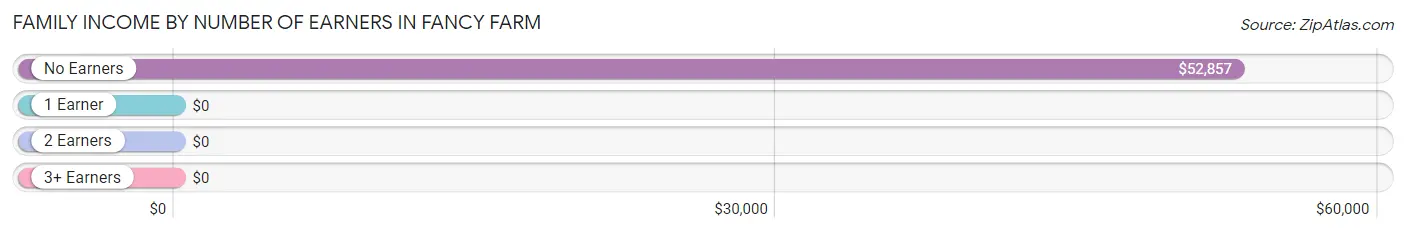
| Number of Earners | # Families | Median Income |
| No Earners | 24 (55.8%) | $52,857 |
| 1 Earner | 6 (14.0%) | $0 |
| 2 Earners | 6 (14.0%) | $0 |
| 3+ Earners | 7 (16.3%) | $0 |
| Total | 43 (100.0%) | $54,107 |
Household Income in Fancy Farm
Household Income Brackets in Fancy Farm
With 42 households falling in the category, the $100,000 to $149,999 income range is the most frequent in Fancy Farm, accounting for 27.8% of all households.
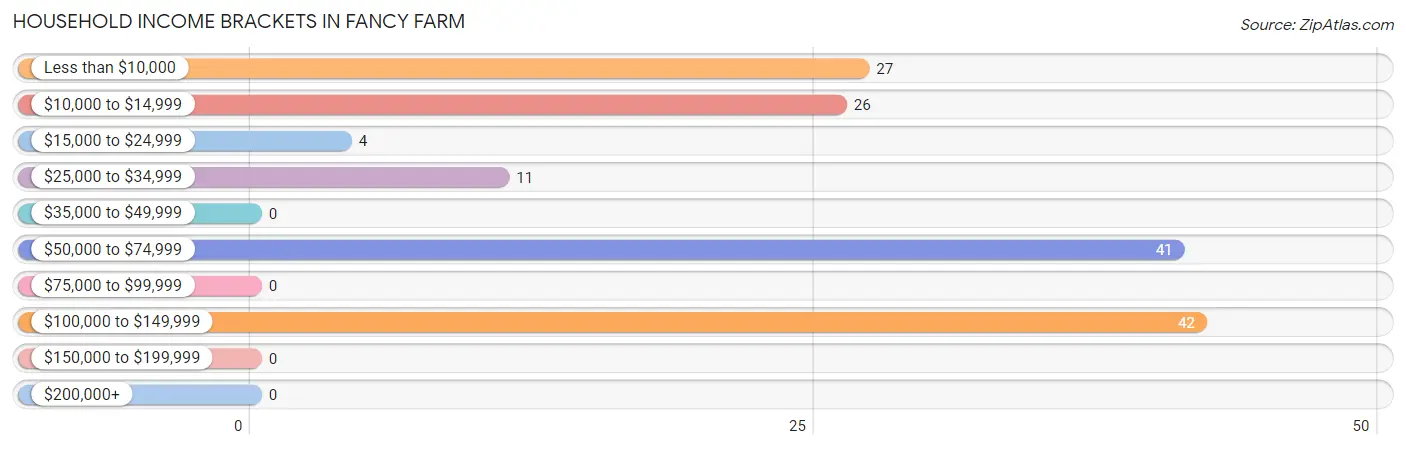
| Income Bracket | # Households | % Households |
| Less than $10,000 | 27 | 17.9% |
| $10,000 to $14,999 | 26 | 17.2% |
| $15,000 to $24,999 | 4 | 2.6% |
| $25,000 to $34,999 | 11 | 7.3% |
| $35,000 to $49,999 | 0 | 0.0% |
| $50,000 to $74,999 | 41 | 27.2% |
| $75,000 to $99,999 | 0 | 0.0% |
| $100,000 to $149,999 | 42 | 27.8% |
| $150,000 to $199,999 | 0 | 0.0% |
| $200,000+ | 0 | 0.0% |
Household Income by Householder Age in Fancy Farm
The median household income in Fancy Farm is $55,060, with the highest median household income of $86,250 found in the 25 to 44 years age bracket for the primary householder. A total of 34 households (22.5%) fall into this category.
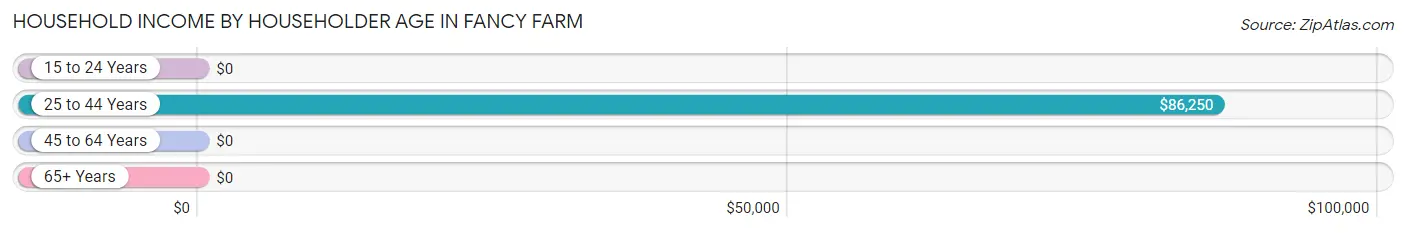
| Income Bracket | # Households | Median Income |
| 15 to 24 Years | 0 (0.0%) | $0 |
| 25 to 44 Years | 34 (22.5%) | $86,250 |
| 45 to 64 Years | 44 (29.1%) | $0 |
| 65+ Years | 73 (48.3%) | $0 |
| Total | 151 (100.0%) | $55,060 |
Poverty in Fancy Farm
Income Below Poverty by Sex and Age in Fancy Farm
With 10.7% poverty level for males and 43.8% for females among the residents of Fancy Farm, 55 to 64 year old males and 15 year old females are the most vulnerable to poverty, with 6 males (33.3%) and 19 females (100.0%) in their respective age groups living below the poverty level.
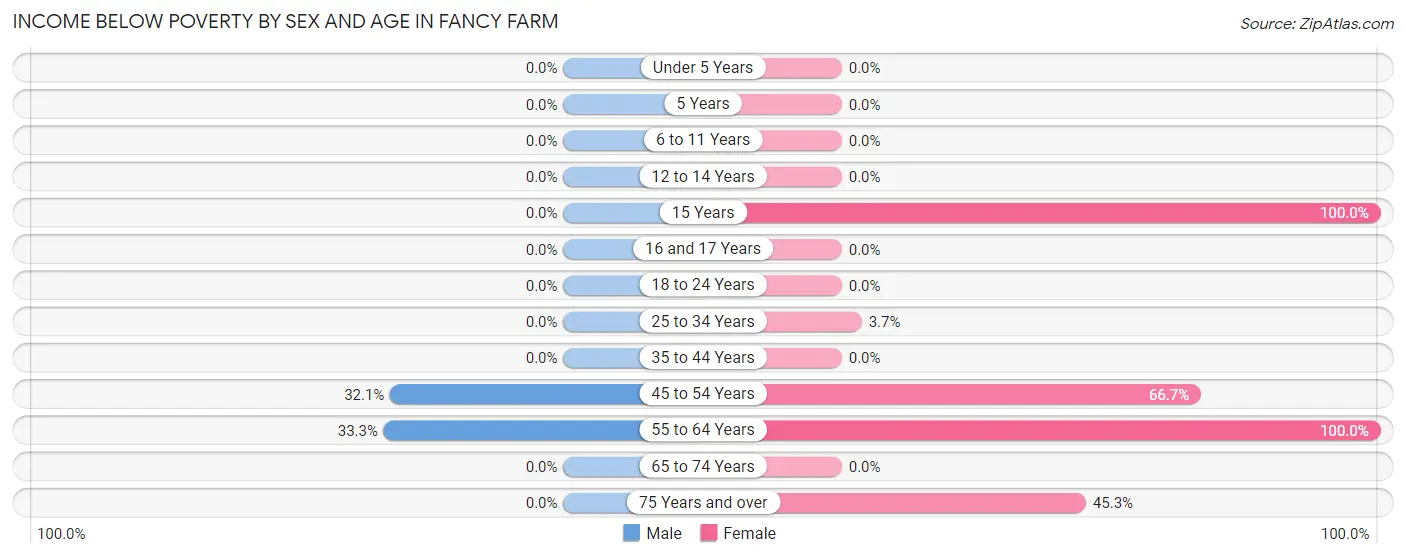
| Age Bracket | Male | Female |
| Under 5 Years | 0 (0.0%) | 0 (0.0%) |
| 5 Years | 0 (0.0%) | 0 (0.0%) |
| 6 to 11 Years | 0 (0.0%) | 0 (0.0%) |
| 12 to 14 Years | 0 (0.0%) | 0 (0.0%) |
| 15 Years | 0 (0.0%) | 19 (100.0%) |
| 16 and 17 Years | 0 (0.0%) | 0 (0.0%) |
| 18 to 24 Years | 0 (0.0%) | 0 (0.0%) |
| 25 to 34 Years | 0 (0.0%) | 1 (3.7%) |
| 35 to 44 Years | 0 (0.0%) | 0 (0.0%) |
| 45 to 54 Years | 9 (32.1%) | 14 (66.7%) |
| 55 to 64 Years | 6 (33.3%) | 7 (100.0%) |
| 65 to 74 Years | 0 (0.0%) | 0 (0.0%) |
| 75 Years and over | 0 (0.0%) | 29 (45.3%) |
| Total | 15 (10.7%) | 70 (43.8%) |
Income Above Poverty by Sex and Age in Fancy Farm
According to the poverty statistics in Fancy Farm, males aged 5 years and females aged 6 to 11 years are the age groups that are most secure financially, with 100.0% of males and 100.0% of females in these age groups living above the poverty line.
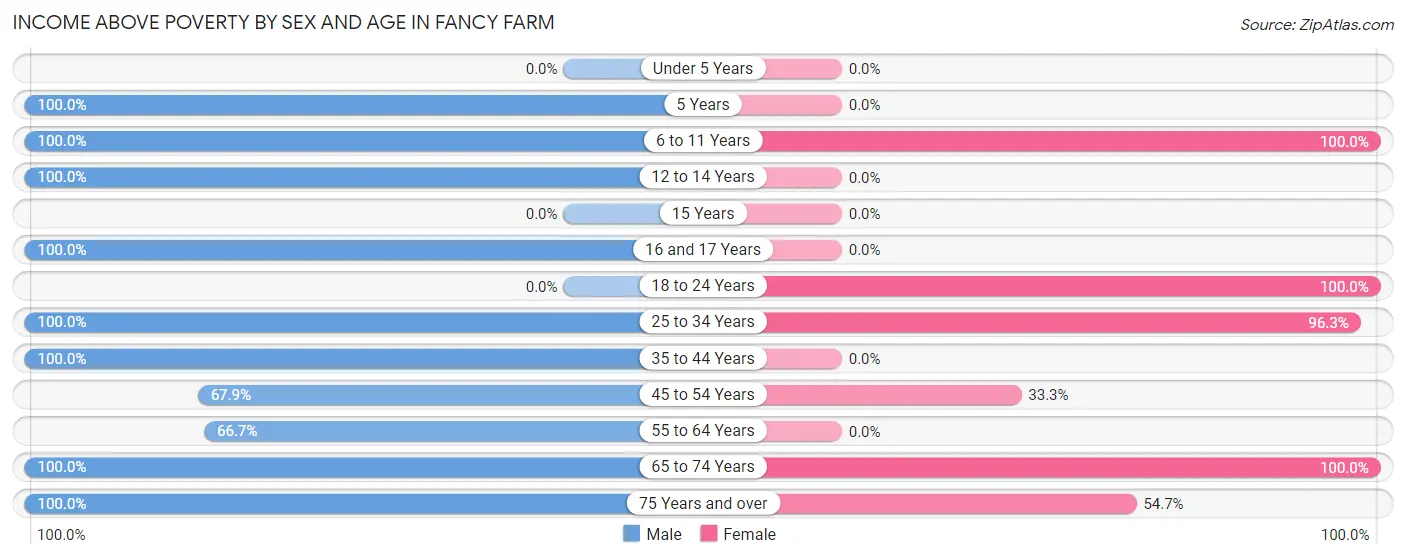
| Age Bracket | Male | Female |
| Under 5 Years | 0 (0.0%) | 0 (0.0%) |
| 5 Years | 1 (100.0%) | 0 (0.0%) |
| 6 to 11 Years | 1 (100.0%) | 1 (100.0%) |
| 12 to 14 Years | 8 (100.0%) | 0 (0.0%) |
| 15 Years | 0 (0.0%) | 0 (0.0%) |
| 16 and 17 Years | 9 (100.0%) | 0 (0.0%) |
| 18 to 24 Years | 0 (0.0%) | 9 (100.0%) |
| 25 to 34 Years | 1 (100.0%) | 26 (96.3%) |
| 35 to 44 Years | 47 (100.0%) | 0 (0.0%) |
| 45 to 54 Years | 19 (67.9%) | 7 (33.3%) |
| 55 to 64 Years | 12 (66.7%) | 0 (0.0%) |
| 65 to 74 Years | 13 (100.0%) | 12 (100.0%) |
| 75 Years and over | 14 (100.0%) | 35 (54.7%) |
| Total | 125 (89.3%) | 90 (56.2%) |
Income Below Poverty Among Married-Couple Families in Fancy Farm
The poverty statistics for married-couple families in Fancy Farm show that 20.0% or 6 of the total 30 families live below the poverty line. Families with 1 or 2 children have the highest poverty rate of 50.0%, comprising of 6 families. On the other hand, families with no children have the lowest poverty rate of 0.0%, which includes 0 families.
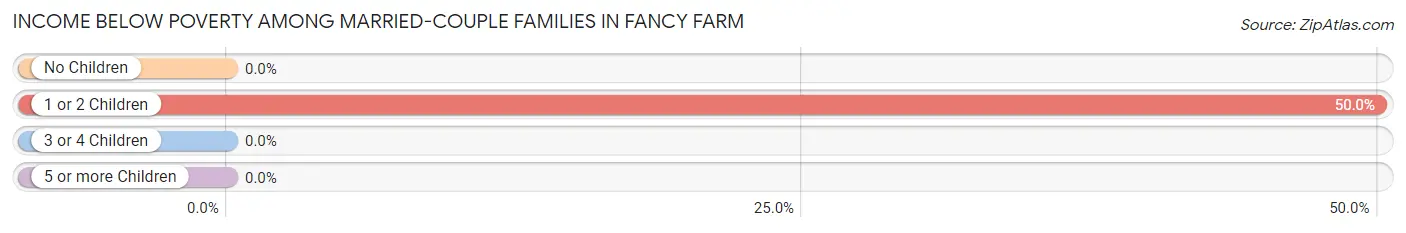
| Children | Above Poverty | Below Poverty |
| No Children | 17 (100.0%) | 0 (0.0%) |
| 1 or 2 Children | 6 (50.0%) | 6 (50.0%) |
| 3 or 4 Children | 1 (100.0%) | 0 (0.0%) |
| 5 or more Children | 0 (0.0%) | 0 (0.0%) |
| Total | 24 (80.0%) | 6 (20.0%) |
Income Below Poverty Among Single-Parent Households in Fancy Farm
| Children | Single Father | Single Mother |
| No Children | 0 (0.0%) | 0 (0.0%) |
| 1 or 2 Children | 0 (0.0%) | 0 (0.0%) |
| 3 or 4 Children | 0 (0.0%) | 0 (0.0%) |
| 5 or more Children | 0 (0.0%) | 0 (0.0%) |
| Total | 0 (0.0%) | 0 (0.0%) |
Income Below Poverty Among Married-Couple vs Single-Parent Households in Fancy Farm
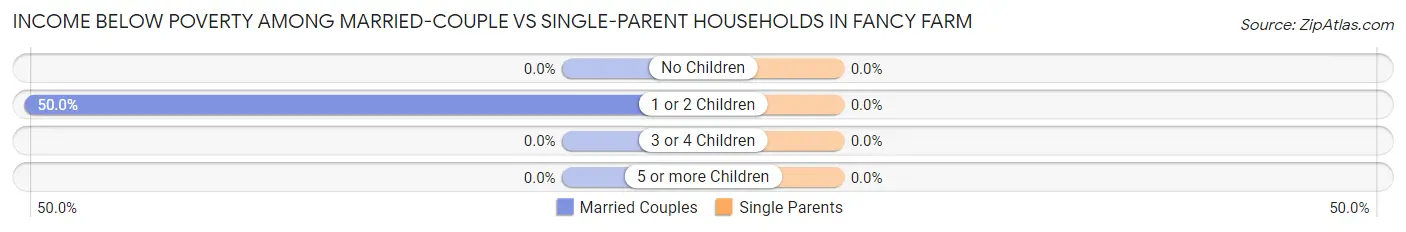
| Children | Married-Couple Families | Single-Parent Households |
| No Children | 0 (0.0%) | 0 (0.0%) |
| 1 or 2 Children | 6 (50.0%) | 0 (0.0%) |
| 3 or 4 Children | 0 (0.0%) | 0 (0.0%) |
| 5 or more Children | 0 (0.0%) | 0 (0.0%) |
| Total | 6 (20.0%) | 0 (0.0%) |
Race in Fancy Farm
The most populous races in Fancy Farm are White / Caucasian (271 | 90.3%), Two or more Races (19 | 6.3%), and Black / African American (10 | 3.3%).
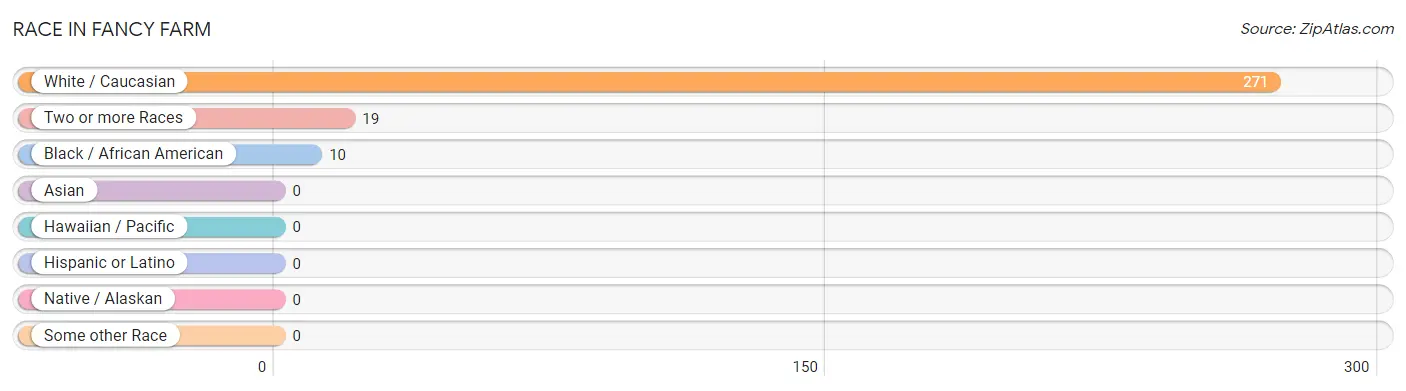
| Race | # Population | % Population |
| Asian | 0 | 0.0% |
| Black / African American | 10 | 3.3% |
| Hawaiian / Pacific | 0 | 0.0% |
| Hispanic or Latino | 0 | 0.0% |
| Native / Alaskan | 0 | 0.0% |
| White / Caucasian | 271 | 90.3% |
| Two or more Races | 19 | 6.3% |
| Some other Race | 0 | 0.0% |
| Total | 300 | 100.0% |
Ancestry in Fancy Farm
The most populous ancestries reported in Fancy Farm are English (84 | 28.0%), American (81 | 27.0%), German (33 | 11.0%), Italian (26 | 8.7%), and Irish (20 | 6.7%), together accounting for 81.3% of all Fancy Farm residents.
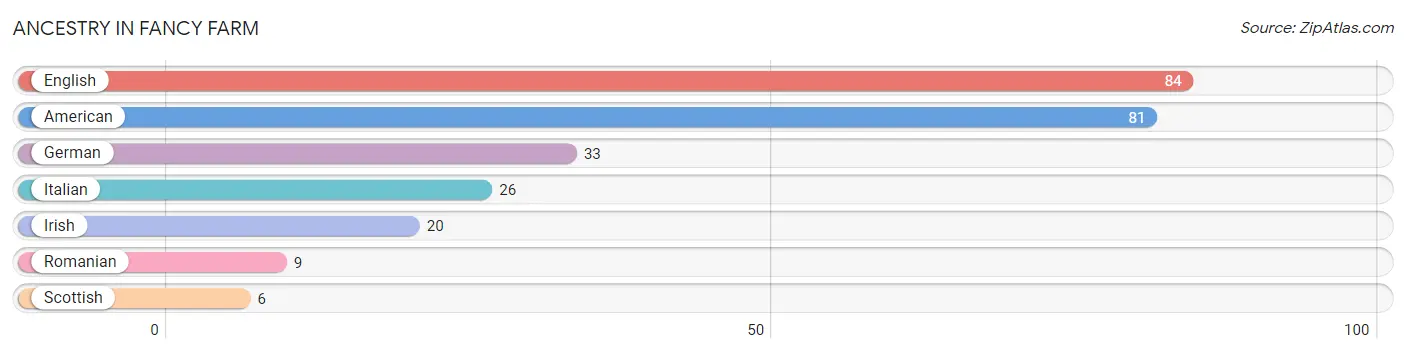
| Ancestry | # Population | % Population |
| American | 81 | 27.0% |
| English | 84 | 28.0% |
| German | 33 | 11.0% |
| Irish | 20 | 6.7% |
| Italian | 26 | 8.7% |
| Romanian | 9 | 3.0% |
| Scottish | 6 | 2.0% | View All 7 Rows |
Immigrants in Fancy Farm
The most numerous immigrant groups reported in Fancy Farm came from Eastern Europe (9 | 3.0%), Europe (9 | 3.0%), and Russia (9 | 3.0%), together accounting for 9.0% of all Fancy Farm residents.
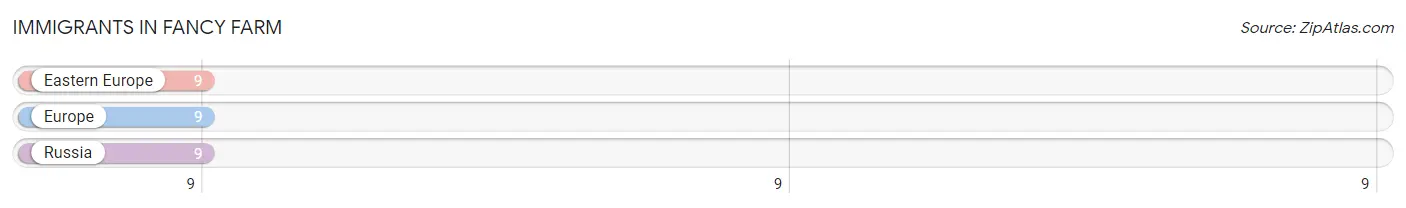
| Immigration Origin | # Population | % Population |
| Eastern Europe | 9 | 3.0% |
| Europe | 9 | 3.0% |
| Russia | 9 | 3.0% | View All 3 Rows |
Sex and Age in Fancy Farm
Sex and Age in Fancy Farm
The most populous age groups in Fancy Farm are 35 to 39 Years (34 | 24.3%) for men and 75 to 79 Years (31 | 19.4%) for women.
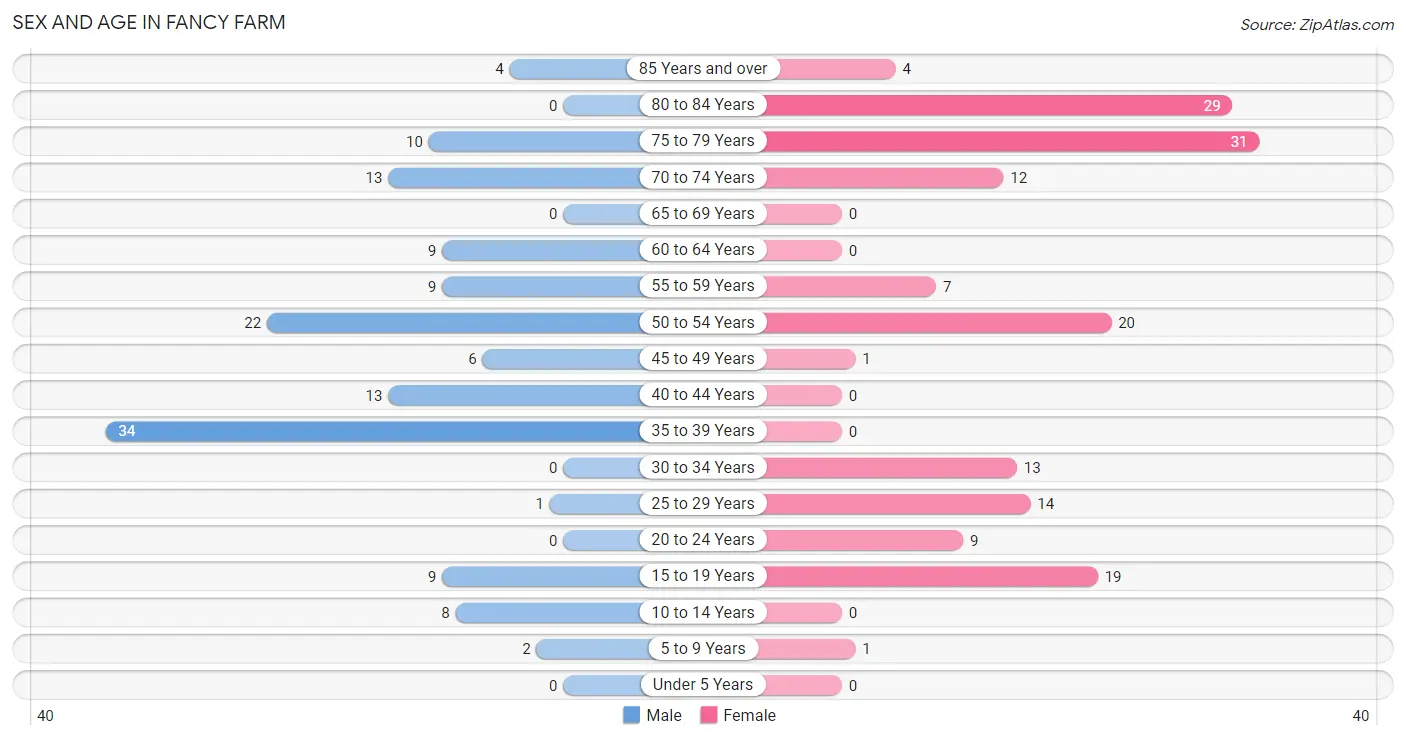
| Age Bracket | Male | Female |
| Under 5 Years | 0 (0.0%) | 0 (0.0%) |
| 5 to 9 Years | 2 (1.4%) | 1 (0.6%) |
| 10 to 14 Years | 8 (5.7%) | 0 (0.0%) |
| 15 to 19 Years | 9 (6.4%) | 19 (11.9%) |
| 20 to 24 Years | 0 (0.0%) | 9 (5.6%) |
| 25 to 29 Years | 1 (0.7%) | 14 (8.7%) |
| 30 to 34 Years | 0 (0.0%) | 13 (8.1%) |
| 35 to 39 Years | 34 (24.3%) | 0 (0.0%) |
| 40 to 44 Years | 13 (9.3%) | 0 (0.0%) |
| 45 to 49 Years | 6 (4.3%) | 1 (0.6%) |
| 50 to 54 Years | 22 (15.7%) | 20 (12.5%) |
| 55 to 59 Years | 9 (6.4%) | 7 (4.4%) |
| 60 to 64 Years | 9 (6.4%) | 0 (0.0%) |
| 65 to 69 Years | 0 (0.0%) | 0 (0.0%) |
| 70 to 74 Years | 13 (9.3%) | 12 (7.5%) |
| 75 to 79 Years | 10 (7.1%) | 31 (19.4%) |
| 80 to 84 Years | 0 (0.0%) | 29 (18.1%) |
| 85 Years and over | 4 (2.9%) | 4 (2.5%) |
| Total | 140 (100.0%) | 160 (100.0%) |
Families and Households in Fancy Farm
Median Family Size in Fancy Farm
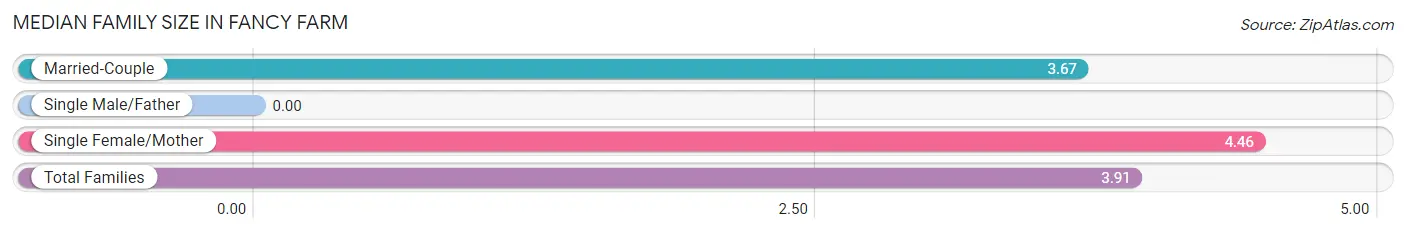
| Family Type | # Families | Family Size |
| Married-Couple | 30 (69.8%) | 3.67 |
| Single Male/Father | 0 (0.0%) | - |
| Single Female/Mother | 13 (30.2%) | 4.46 |
| Total Families | 43 (100.0%) | 3.91 |
Median Household Size in Fancy Farm
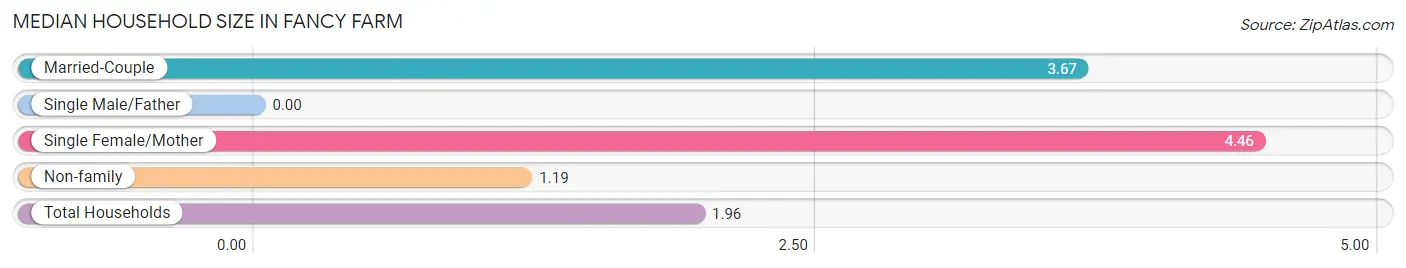
| Household Type | # Households | Household Size |
| Married-Couple | 30 (19.9%) | 3.67 |
| Single Male/Father | 0 (0.0%) | - |
| Single Female/Mother | 13 (8.6%) | 4.46 |
| Non-family | 108 (71.5%) | 1.19 |
| Total Households | 151 (100.0%) | 1.96 |
Household Size by Marriage Status in Fancy Farm
Out of a total of 151 households in Fancy Farm, 43 (28.5%) are family households, while 108 (71.5%) are nonfamily households. The most numerous type of family households are 3-person households, comprising 19, and the most common type of nonfamily households are 1-person households, comprising 80.
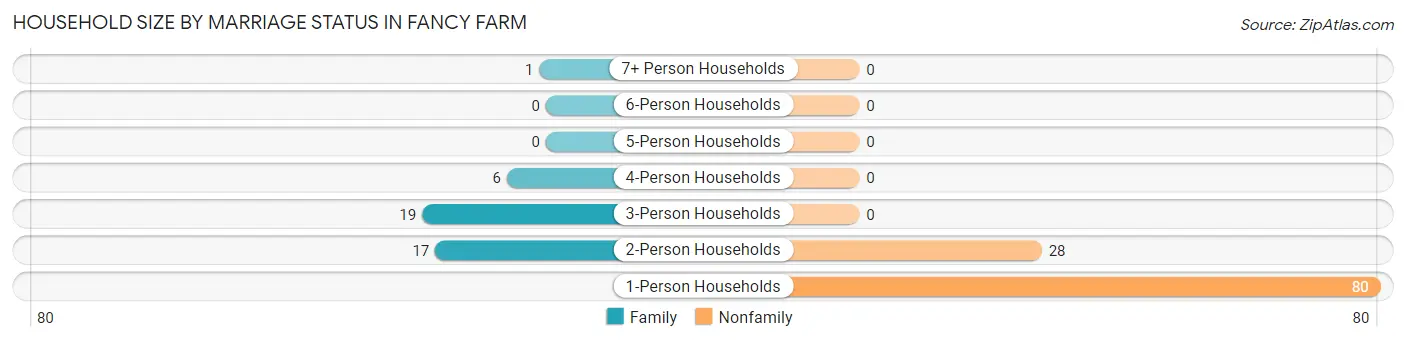
| Household Size | Family Households | Nonfamily Households |
| 1-Person Households | - | 80 (53.0%) |
| 2-Person Households | 17 (11.3%) | 28 (18.5%) |
| 3-Person Households | 19 (12.6%) | 0 (0.0%) |
| 4-Person Households | 6 (4.0%) | 0 (0.0%) |
| 5-Person Households | 0 (0.0%) | 0 (0.0%) |
| 6-Person Households | 0 (0.0%) | 0 (0.0%) |
| 7+ Person Households | 1 (0.7%) | 0 (0.0%) |
| Total | 43 (28.5%) | 108 (71.5%) |
Female Fertility in Fancy Farm
Fertility by Age in Fancy Farm
| Age Bracket | Women with Births | Births / 1,000 Women |
| 15 to 19 years | 0 (0.0%) | 0.0 |
| 20 to 34 years | 0 (0.0%) | 0.0 |
| 35 to 50 years | 0 (0.0%) | 0.0 |
| Total | 0 (0.0%) | 0.0 |
Fertility by Age by Marriage Status in Fancy Farm
| Age Bracket | Married | Unmarried |
| 15 to 19 years | 0 (0.0%) | 0 (0.0%) |
| 20 to 34 years | 0 (0.0%) | 0 (0.0%) |
| 35 to 50 years | 0 (0.0%) | 0 (0.0%) |
| Total | 0 (0.0%) | 0 (0.0%) |
Fertility by Education in Fancy Farm
| Educational Attainment | Women with Births | Births / 1,000 Women |
| Less than High School | 0 (0.0%) | 0.0 |
| High School Diploma | 0 (0.0%) | 0.0 |
| College or Associate's Degree | 0 (0.0%) | 0.0 |
| Bachelor's Degree | 0 (0.0%) | 0.0 |
| Graduate Degree | 0 (0.0%) | 0.0 |
| Total | 0 (0.0%) | 0.0 |
Fertility by Education by Marriage Status in Fancy Farm
| Educational Attainment | Married | Unmarried |
| Less than High School | 0 (0.0%) | 0 (0.0%) |
| High School Diploma | 0 (0.0%) | 0 (0.0%) |
| College or Associate's Degree | 0 (0.0%) | 0 (0.0%) |
| Bachelor's Degree | 0 (0.0%) | 0 (0.0%) |
| Graduate Degree | 0 (0.0%) | 0 (0.0%) |
| Total | 0 (0.0%) | 0 (0.0%) |
Employment Characteristics in Fancy Farm
Employment by Class of Employer in Fancy Farm
Among the 108 employed individuals in Fancy Farm, private company employees (45 | 41.7%), state government employees (30 | 27.8%), and not-for-profit organizations (24 | 22.2%) make up the most common classes of employment.
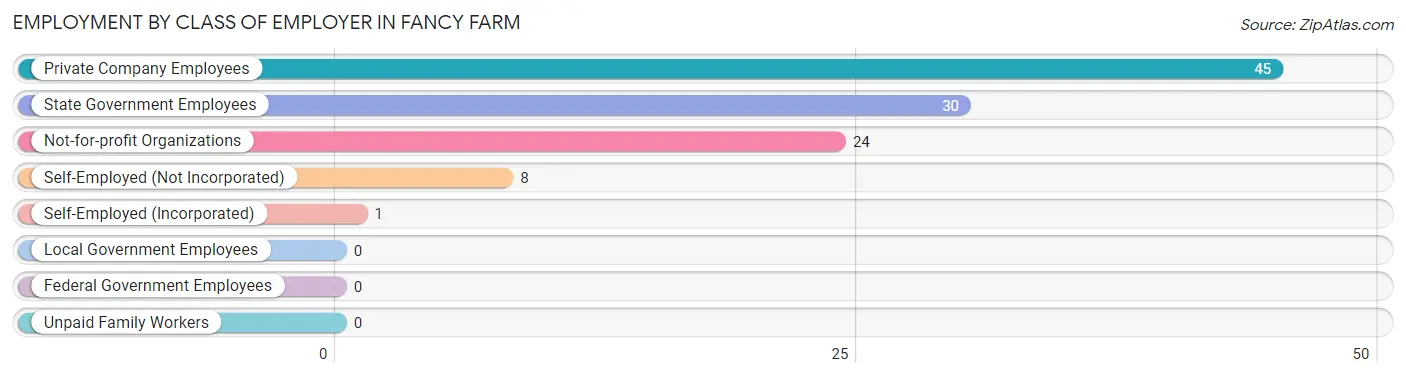
| Employer Class | # Employees | % Employees |
| Private Company Employees | 45 | 41.7% |
| Self-Employed (Incorporated) | 1 | 0.9% |
| Self-Employed (Not Incorporated) | 8 | 7.4% |
| Not-for-profit Organizations | 24 | 22.2% |
| Local Government Employees | 0 | 0.0% |
| State Government Employees | 30 | 27.8% |
| Federal Government Employees | 0 | 0.0% |
| Unpaid Family Workers | 0 | 0.0% |
| Total | 108 | 100.0% |
Employment Status by Age in Fancy Farm
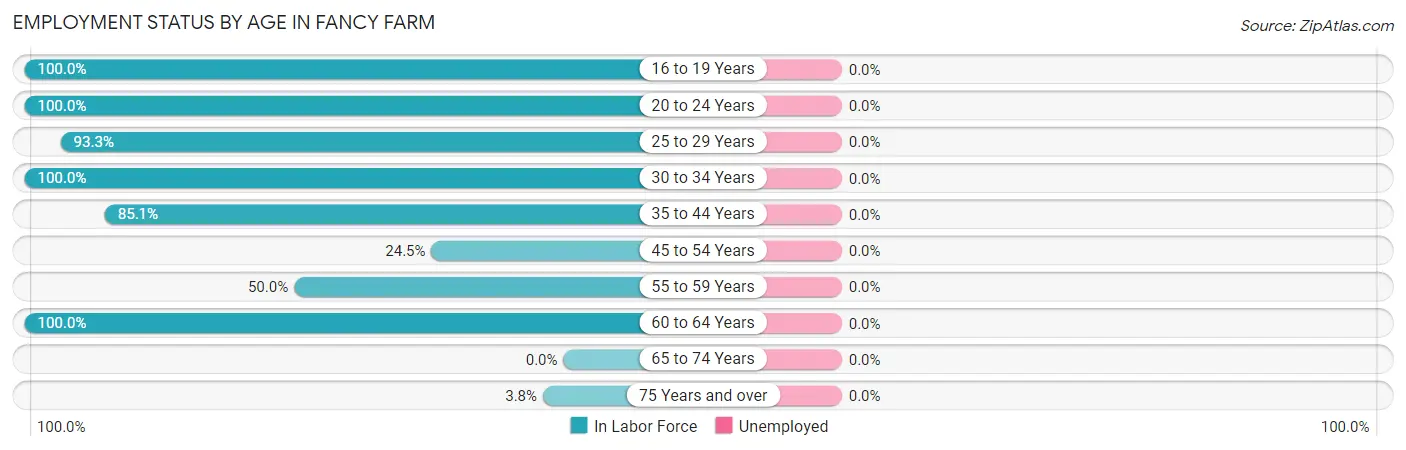
| Age Bracket | In Labor Force | Unemployed |
| 16 to 19 Years | 9 (100.0%) | 0 (0.0%) |
| 20 to 24 Years | 9 (100.0%) | 0 (0.0%) |
| 25 to 29 Years | 14 (93.3%) | 0 (0.0%) |
| 30 to 34 Years | 13 (100.0%) | 0 (0.0%) |
| 35 to 44 Years | 40 (85.1%) | 0 (0.0%) |
| 45 to 54 Years | 12 (24.5%) | 0 (0.0%) |
| 55 to 59 Years | 8 (50.0%) | 0 (0.0%) |
| 60 to 64 Years | 9 (100.0%) | 0 (0.0%) |
| 65 to 74 Years | 0 (0.0%) | 0 (0.0%) |
| 75 Years and over | 3 (3.8%) | 0 (0.0%) |
| Total | 117 (43.3%) | 0 (0.0%) |
Employment Status by Educational Attainment in Fancy Farm
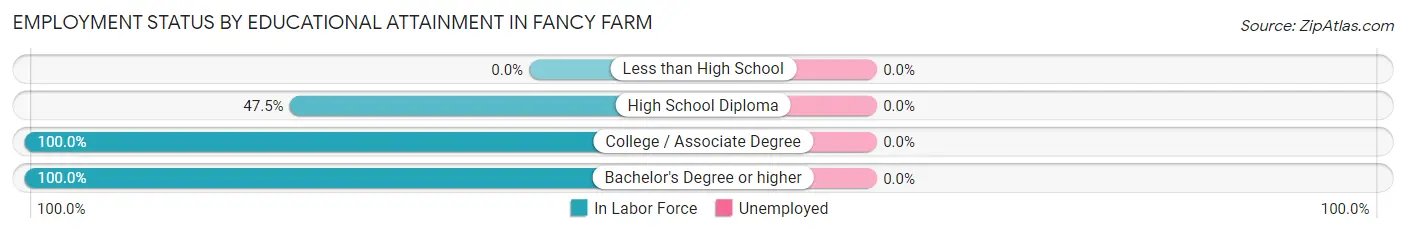
| Educational Attainment | In Labor Force | Unemployed |
| Less than High School | 0 (0.0%) | 0 (0.0%) |
| High School Diploma | 47 (47.5%) | 0 (0.0%) |
| College / Associate Degree | 13 (100.0%) | 0 (0.0%) |
| Bachelor's Degree or higher | 36 (100.0%) | 0 (0.0%) |
| Total | 96 (64.4%) | 0 (0.0%) |
Employment Occupations by Sex in Fancy Farm
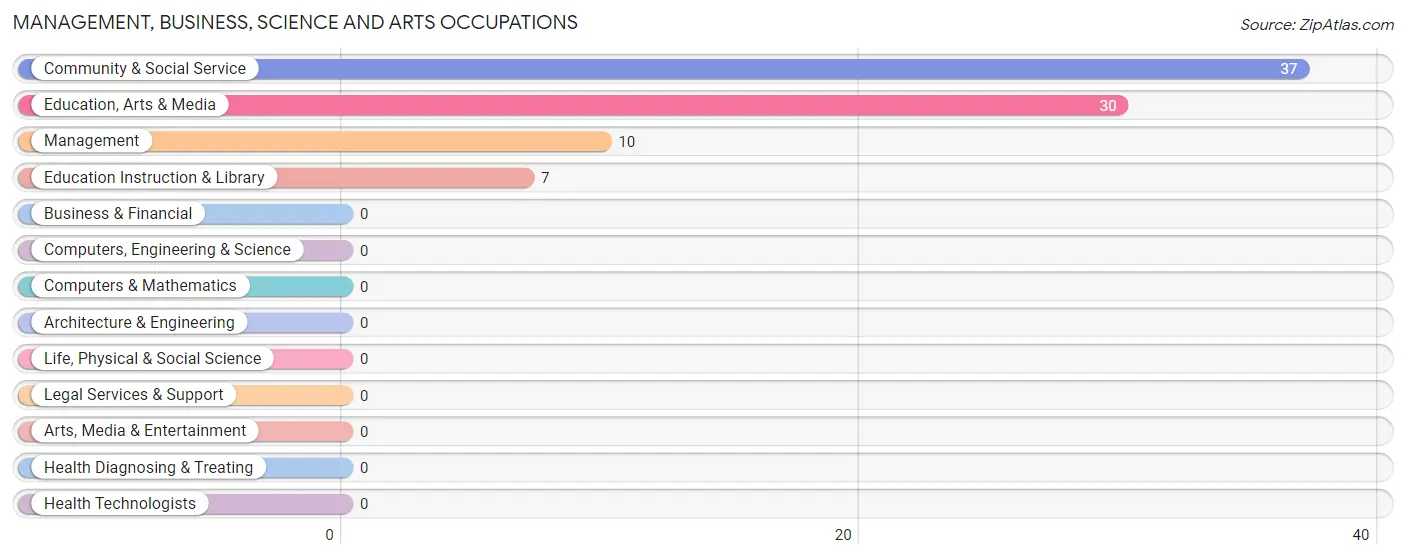
Management, Business, Science and Arts Occupations
The most common Management, Business, Science and Arts occupations in Fancy Farm are Community & Social Service (37 | 31.6%), Education, Arts & Media (30 | 25.6%), Management (10 | 8.6%), and Education Instruction & Library (7 | 6.0%).
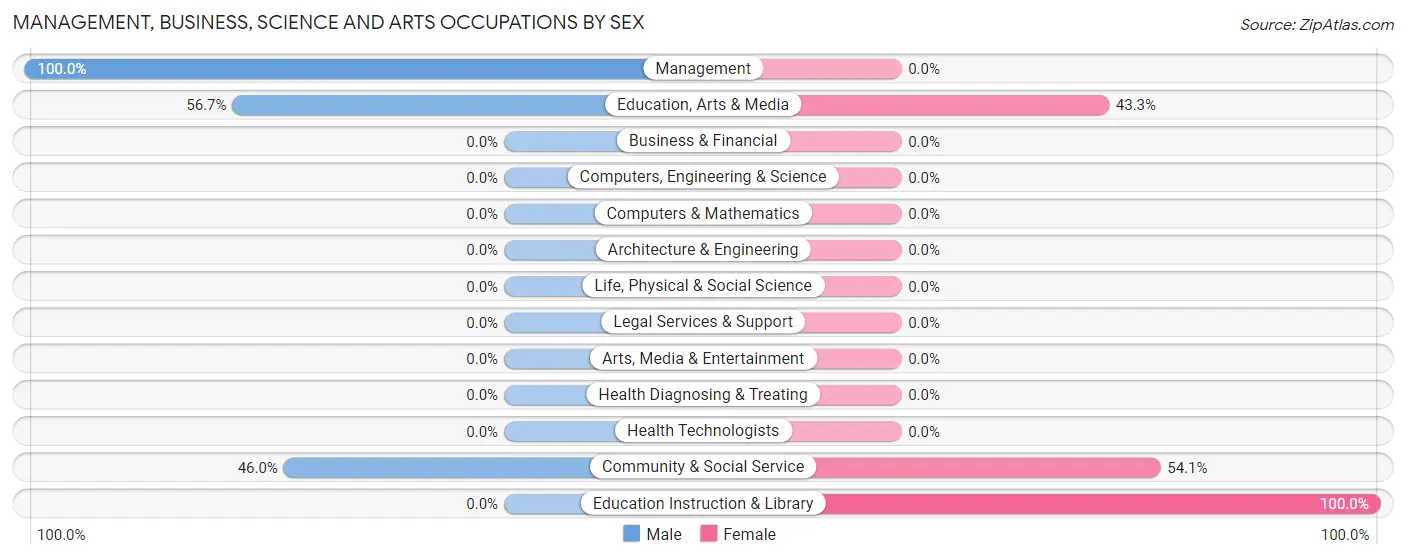
Management, Business, Science and Arts Occupations by Sex
Within the Management, Business, Science and Arts occupations in Fancy Farm, the most male-oriented occupations are Management (100.0%), Education, Arts & Media (56.7%), and Community & Social Service (46.0%), while the most female-oriented occupations are Education Instruction & Library (100.0%), Community & Social Service (54.0%), and Education, Arts & Media (43.3%).
| Occupation | Male | Female |
| Management | 10 (100.0%) | 0 (0.0%) |
| Business & Financial | 0 (0.0%) | 0 (0.0%) |
| Computers, Engineering & Science | 0 (0.0%) | 0 (0.0%) |
| Computers & Mathematics | 0 (0.0%) | 0 (0.0%) |
| Architecture & Engineering | 0 (0.0%) | 0 (0.0%) |
| Life, Physical & Social Science | 0 (0.0%) | 0 (0.0%) |
| Community & Social Service | 17 (46.0%) | 20 (54.0%) |
| Education, Arts & Media | 17 (56.7%) | 13 (43.3%) |
| Legal Services & Support | 0 (0.0%) | 0 (0.0%) |
| Education Instruction & Library | 0 (0.0%) | 7 (100.0%) |
| Arts, Media & Entertainment | 0 (0.0%) | 0 (0.0%) |
| Health Diagnosing & Treating | 0 (0.0%) | 0 (0.0%) |
| Health Technologists | 0 (0.0%) | 0 (0.0%) |
| Total (Category) | 27 (57.5%) | 20 (42.5%) |
| Total (Overall) | 69 (59.0%) | 48 (41.0%) |
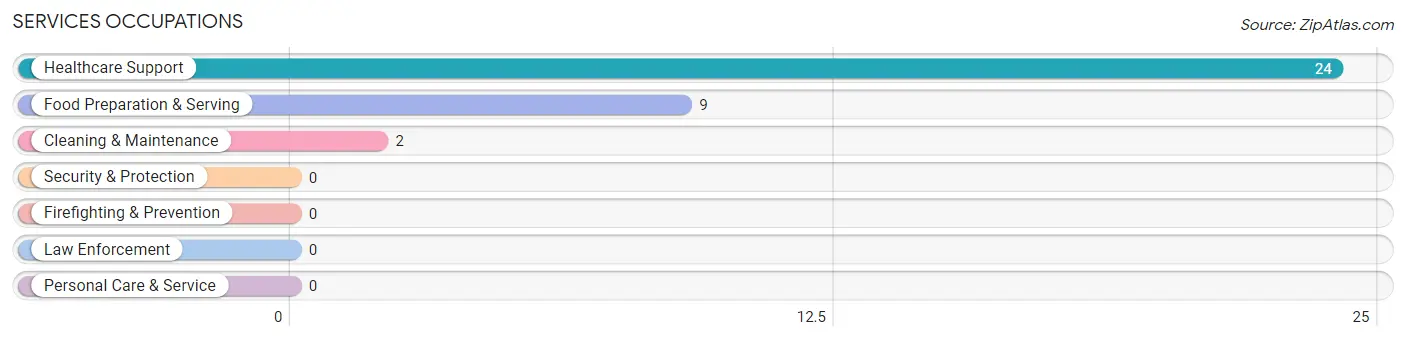
Services Occupations
The most common Services occupations in Fancy Farm are Healthcare Support (24 | 20.5%), Food Preparation & Serving (9 | 7.7%), and Cleaning & Maintenance (2 | 1.7%).
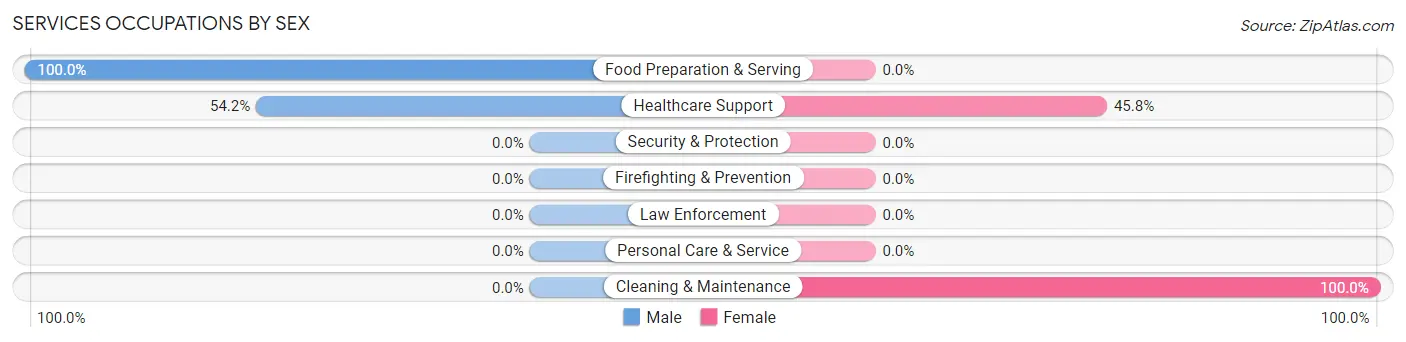
Services Occupations by Sex
Within the Services occupations in Fancy Farm, the most male-oriented occupations are Food Preparation & Serving (100.0%), and Healthcare Support (54.2%), while the most female-oriented occupations are Cleaning & Maintenance (100.0%), and Healthcare Support (45.8%).
| Occupation | Male | Female |
| Healthcare Support | 13 (54.2%) | 11 (45.8%) |
| Security & Protection | 0 (0.0%) | 0 (0.0%) |
| Firefighting & Prevention | 0 (0.0%) | 0 (0.0%) |
| Law Enforcement | 0 (0.0%) | 0 (0.0%) |
| Food Preparation & Serving | 9 (100.0%) | 0 (0.0%) |
| Cleaning & Maintenance | 0 (0.0%) | 2 (100.0%) |
| Personal Care & Service | 0 (0.0%) | 0 (0.0%) |
| Total (Category) | 22 (62.9%) | 13 (37.1%) |
| Total (Overall) | 69 (59.0%) | 48 (41.0%) |
Sales and Office Occupations
The most common Sales and Office occupations in Fancy Farm are , and Sales & Related (6 | 5.1%).
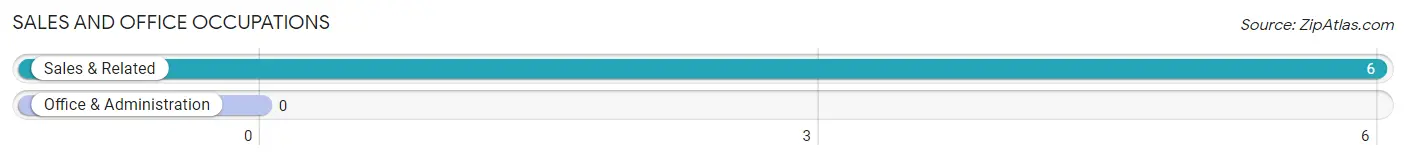
Sales and Office Occupations by Sex
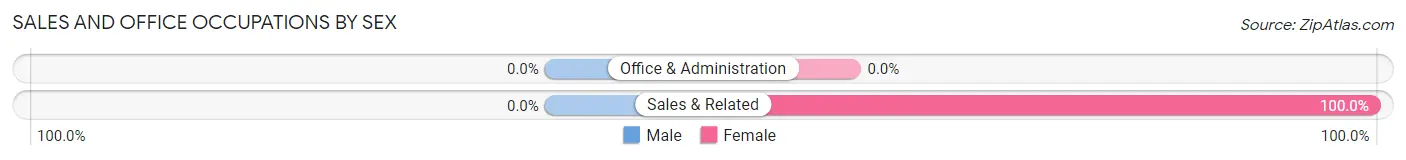
| Occupation | Male | Female |
| Sales & Related | 0 (0.0%) | 6 (100.0%) |
| Office & Administration | 0 (0.0%) | 0 (0.0%) |
| Total (Category) | 0 (0.0%) | 6 (100.0%) |
| Total (Overall) | 69 (59.0%) | 48 (41.0%) |
Natural Resources, Construction and Maintenance Occupations
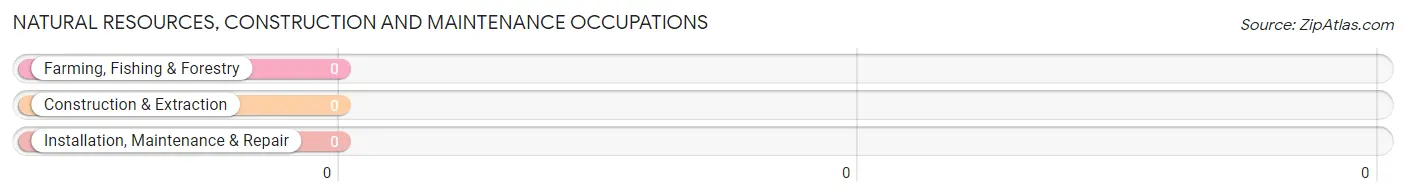
Natural Resources, Construction and Maintenance Occupations by Sex
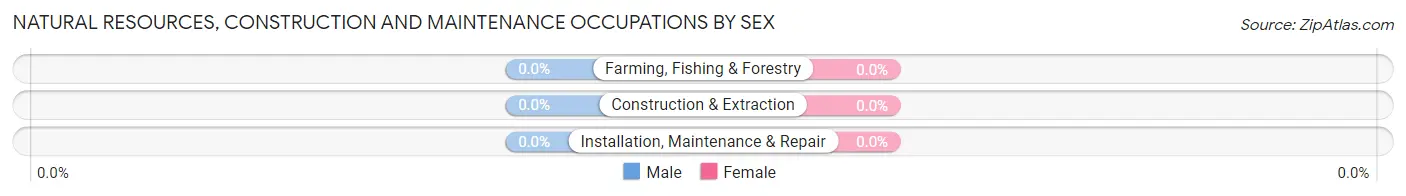
| Occupation | Male | Female |
| Farming, Fishing & Forestry | 0 (0.0%) | 0 (0.0%) |
| Construction & Extraction | 0 (0.0%) | 0 (0.0%) |
| Installation, Maintenance & Repair | 0 (0.0%) | 0 (0.0%) |
| Total (Category) | 0 (0.0%) | 0 (0.0%) |
| Total (Overall) | 69 (59.0%) | 48 (41.0%) |
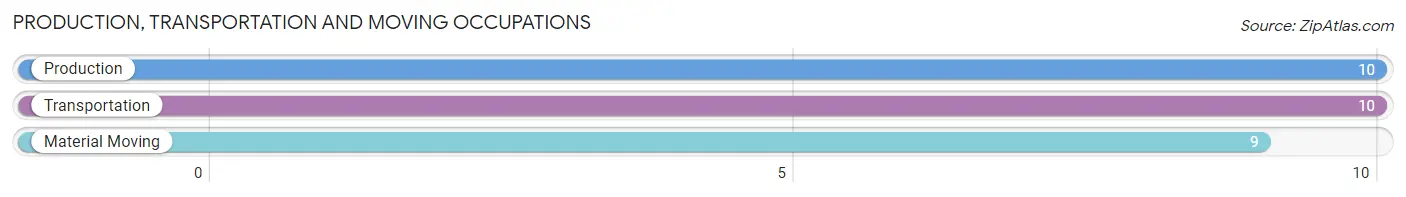
Production, Transportation and Moving Occupations
The most common Production, Transportation and Moving occupations in Fancy Farm are Production (10 | 8.6%), Transportation (10 | 8.6%), and Material Moving (9 | 7.7%).
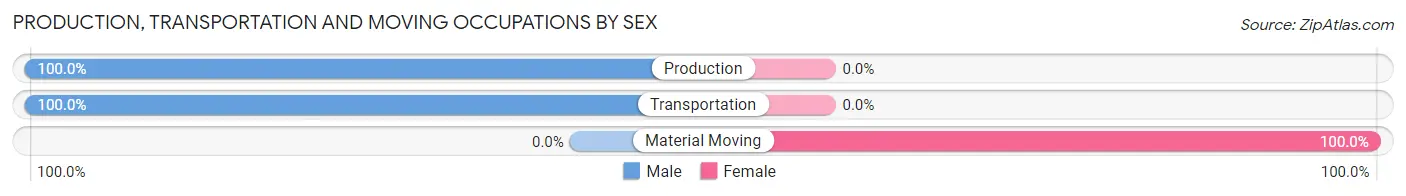
Production, Transportation and Moving Occupations by Sex
| Occupation | Male | Female |
| Production | 10 (100.0%) | 0 (0.0%) |
| Transportation | 10 (100.0%) | 0 (0.0%) |
| Material Moving | 0 (0.0%) | 9 (100.0%) |
| Total (Category) | 20 (69.0%) | 9 (31.0%) |
| Total (Overall) | 69 (59.0%) | 48 (41.0%) |
Employment Industries by Sex in Fancy Farm
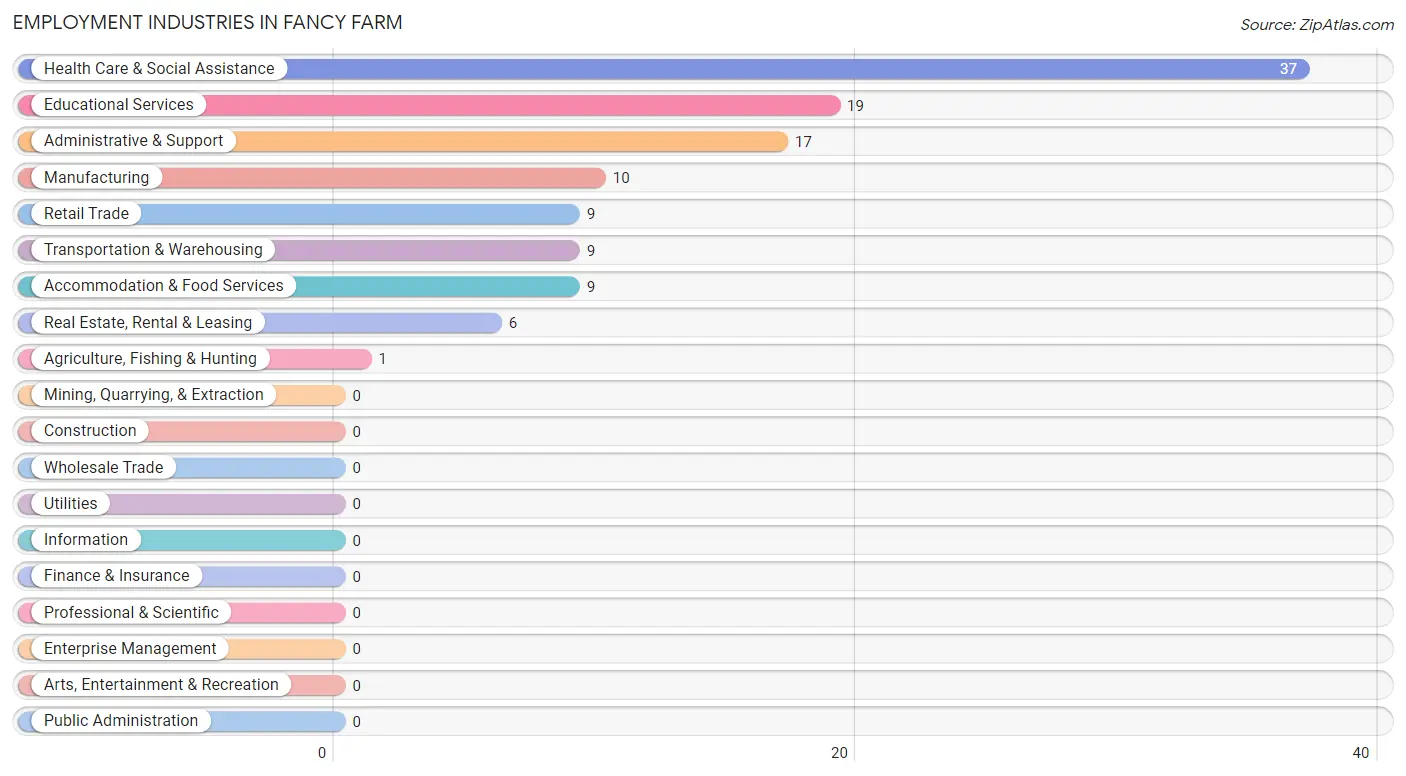
Employment Industries in Fancy Farm
The major employment industries in Fancy Farm include Health Care & Social Assistance (37 | 31.6%), Educational Services (19 | 16.2%), Administrative & Support (17 | 14.5%), Manufacturing (10 | 8.6%), and Retail Trade (9 | 7.7%).
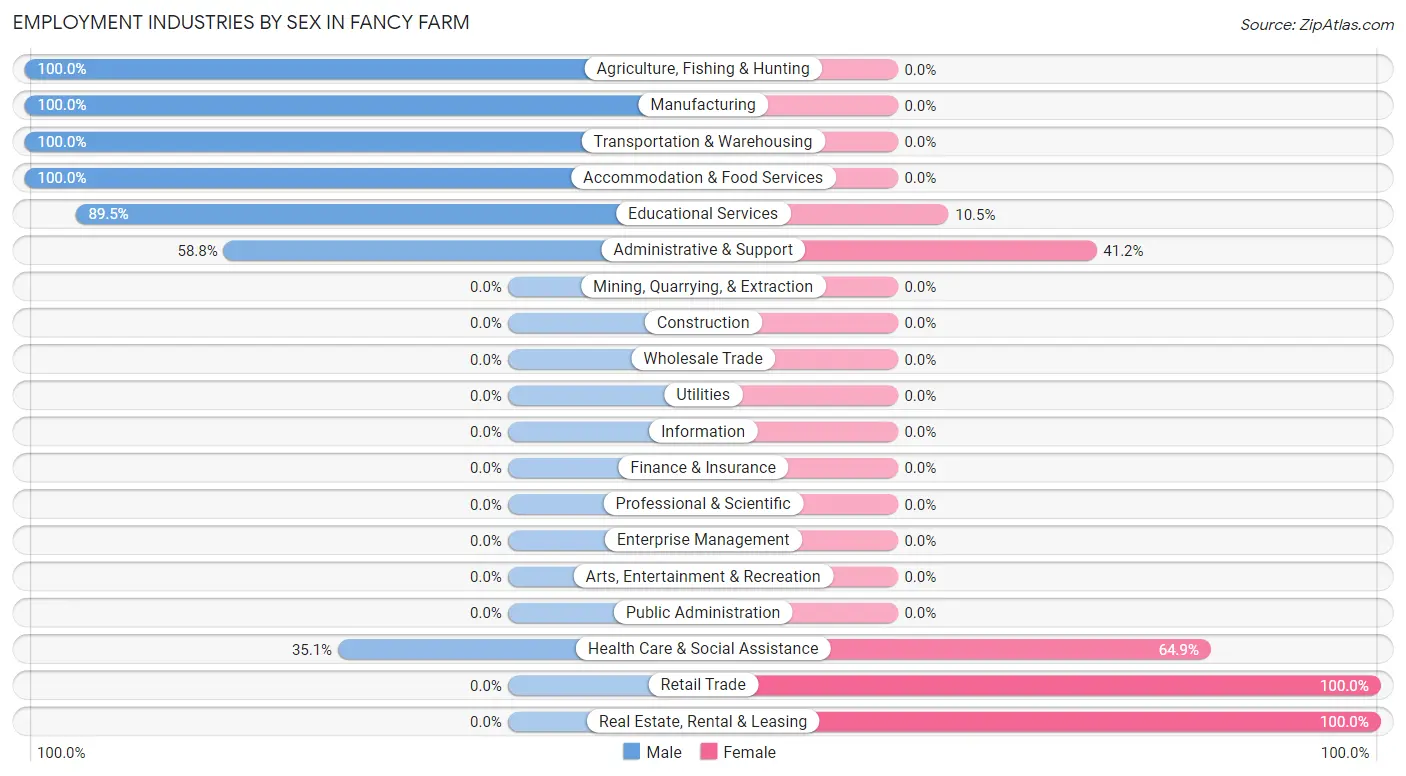
Employment Industries by Sex in Fancy Farm
The Fancy Farm industries that see more men than women are Agriculture, Fishing & Hunting (100.0%), Manufacturing (100.0%), and Transportation & Warehousing (100.0%), whereas the industries that tend to have a higher number of women are Retail Trade (100.0%), Real Estate, Rental & Leasing (100.0%), and Health Care & Social Assistance (64.9%).
| Industry | Male | Female |
| Agriculture, Fishing & Hunting | 1 (100.0%) | 0 (0.0%) |
| Mining, Quarrying, & Extraction | 0 (0.0%) | 0 (0.0%) |
| Construction | 0 (0.0%) | 0 (0.0%) |
| Manufacturing | 10 (100.0%) | 0 (0.0%) |
| Wholesale Trade | 0 (0.0%) | 0 (0.0%) |
| Retail Trade | 0 (0.0%) | 9 (100.0%) |
| Transportation & Warehousing | 9 (100.0%) | 0 (0.0%) |
| Utilities | 0 (0.0%) | 0 (0.0%) |
| Information | 0 (0.0%) | 0 (0.0%) |
| Finance & Insurance | 0 (0.0%) | 0 (0.0%) |
| Real Estate, Rental & Leasing | 0 (0.0%) | 6 (100.0%) |
| Professional & Scientific | 0 (0.0%) | 0 (0.0%) |
| Enterprise Management | 0 (0.0%) | 0 (0.0%) |
| Administrative & Support | 10 (58.8%) | 7 (41.2%) |
| Educational Services | 17 (89.5%) | 2 (10.5%) |
| Health Care & Social Assistance | 13 (35.1%) | 24 (64.9%) |
| Arts, Entertainment & Recreation | 0 (0.0%) | 0 (0.0%) |
| Accommodation & Food Services | 9 (100.0%) | 0 (0.0%) |
| Public Administration | 0 (0.0%) | 0 (0.0%) |
| Total | 69 (59.0%) | 48 (41.0%) |
Education in Fancy Farm
School Enrollment in Fancy Farm
The most common levels of schooling among the 65 students in Fancy Farm are high school (28 | 43.1%), graduate / professional (17 | 26.2%), and college / undergraduate (9 | 13.9%).
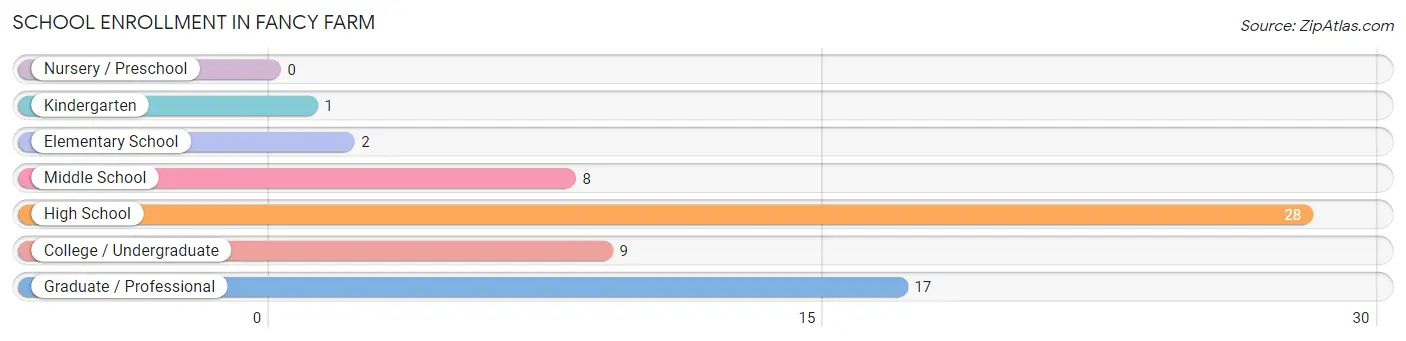
| School Level | # Students | % Students |
| Nursery / Preschool | 0 | 0.0% |
| Kindergarten | 1 | 1.5% |
| Elementary School | 2 | 3.1% |
| Middle School | 8 | 12.3% |
| High School | 28 | 43.1% |
| College / Undergraduate | 9 | 13.9% |
| Graduate / Professional | 17 | 26.2% |
| Total | 65 | 100.0% |
School Enrollment by Age by Funding Source in Fancy Farm
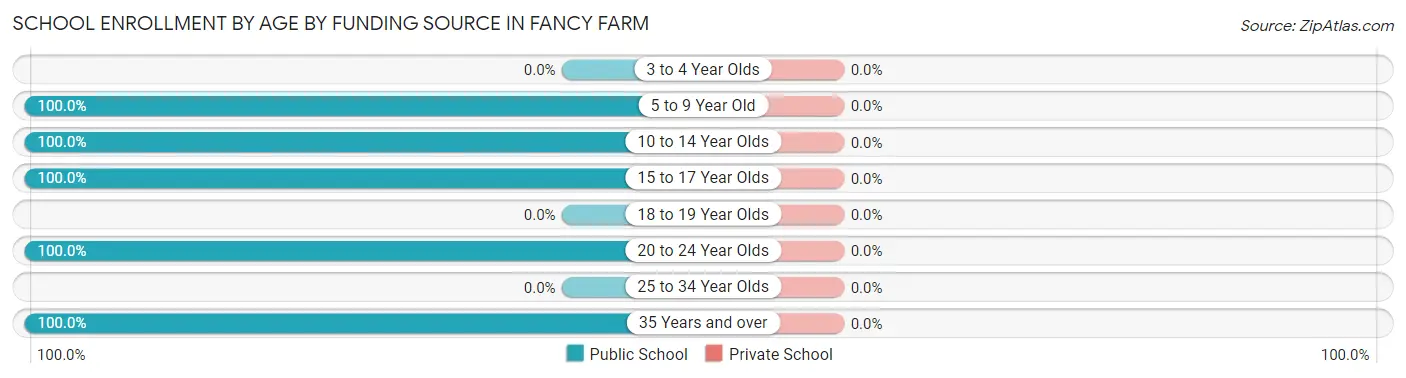
| Age Bracket | Public School | Private School |
| 3 to 4 Year Olds | 0 (0.0%) | 0 (0.0%) |
| 5 to 9 Year Old | 3 (100.0%) | 0 (0.0%) |
| 10 to 14 Year Olds | 8 (100.0%) | 0 (0.0%) |
| 15 to 17 Year Olds | 28 (100.0%) | 0 (0.0%) |
| 18 to 19 Year Olds | 0 (0.0%) | 0 (0.0%) |
| 20 to 24 Year Olds | 9 (100.0%) | 0 (0.0%) |
| 25 to 34 Year Olds | 0 (0.0%) | 0 (0.0%) |
| 35 Years and over | 17 (100.0%) | 0 (0.0%) |
| Total | 65 (100.0%) | 0 (0.0%) |
Educational Attainment by Field of Study in Fancy Farm
Psychology (30 | 44.8%), social sciences (24 | 35.8%), arts & humanities (7 | 10.4%), and visual & performing arts (6 | 9.0%) are the most common fields of study among 67 individuals in Fancy Farm who have obtained a bachelor's degree or higher.
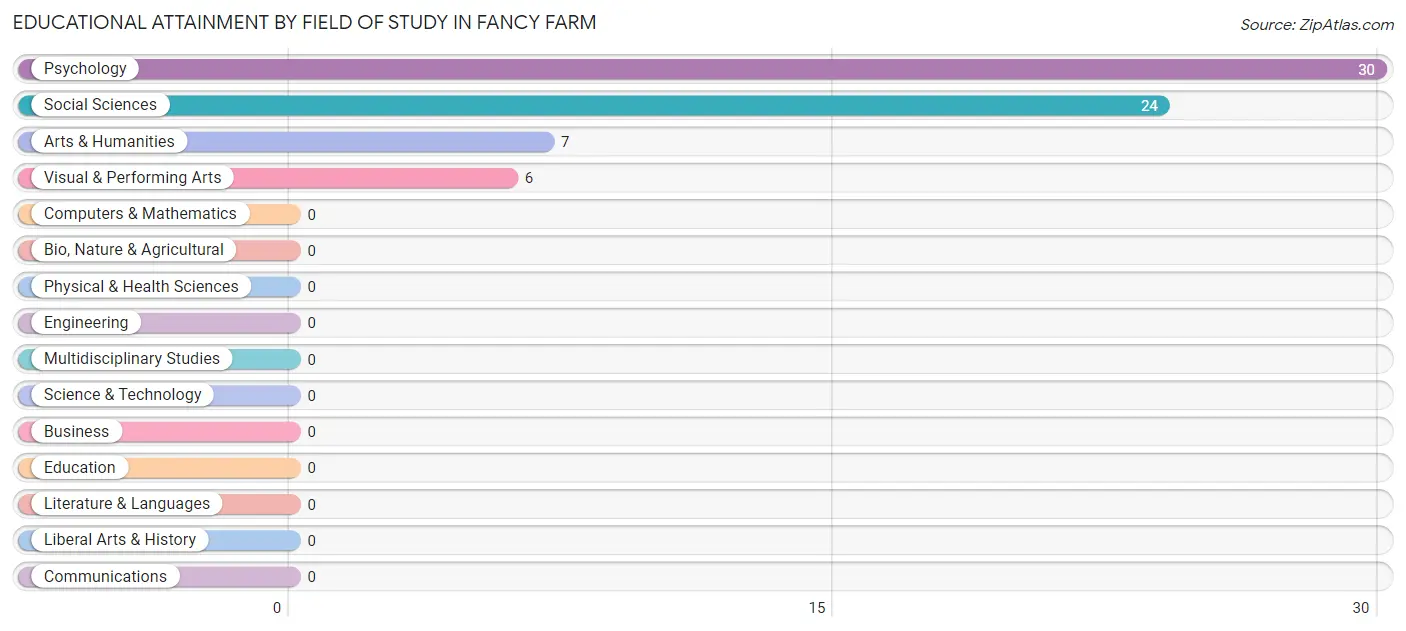
| Field of Study | # Graduates | % Graduates |
| Computers & Mathematics | 0 | 0.0% |
| Bio, Nature & Agricultural | 0 | 0.0% |
| Physical & Health Sciences | 0 | 0.0% |
| Psychology | 30 | 44.8% |
| Social Sciences | 24 | 35.8% |
| Engineering | 0 | 0.0% |
| Multidisciplinary Studies | 0 | 0.0% |
| Science & Technology | 0 | 0.0% |
| Business | 0 | 0.0% |
| Education | 0 | 0.0% |
| Literature & Languages | 0 | 0.0% |
| Liberal Arts & History | 0 | 0.0% |
| Visual & Performing Arts | 6 | 9.0% |
| Communications | 0 | 0.0% |
| Arts & Humanities | 7 | 10.4% |
| Total | 67 | 100.0% |
Transportation & Commute in Fancy Farm
Vehicle Availability by Sex in Fancy Farm
The most prevalent vehicle ownership categories in Fancy Farm are males with 3 vehicles (47, accounting for 78.3%) and females with 3 vehicles (48, making up 97.9%).
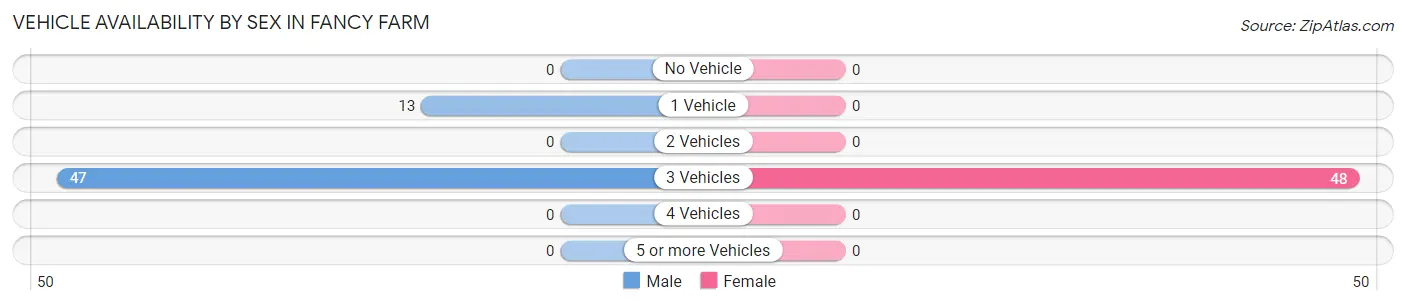
| Vehicles Available | Male | Female |
| No Vehicle | 0 (0.0%) | 0 (0.0%) |
| 1 Vehicle | 13 (21.7%) | 0 (0.0%) |
| 2 Vehicles | 0 (0.0%) | 0 (0.0%) |
| 3 Vehicles | 47 (78.3%) | 48 (100.0%) |
| 4 Vehicles | 0 (0.0%) | 0 (0.0%) |
| 5 or more Vehicles | 0 (0.0%) | 0 (0.0%) |
| Total | 60 (100.0%) | 48 (100.0%) |
Commute Time in Fancy Farm
The most frequently occuring commute durations in Fancy Farm are 40 to 44 minutes (29 commuters, 26.9%), 10 to 14 minutes (18 commuters, 16.7%), and 45 to 59 minutes (17 commuters, 15.7%).
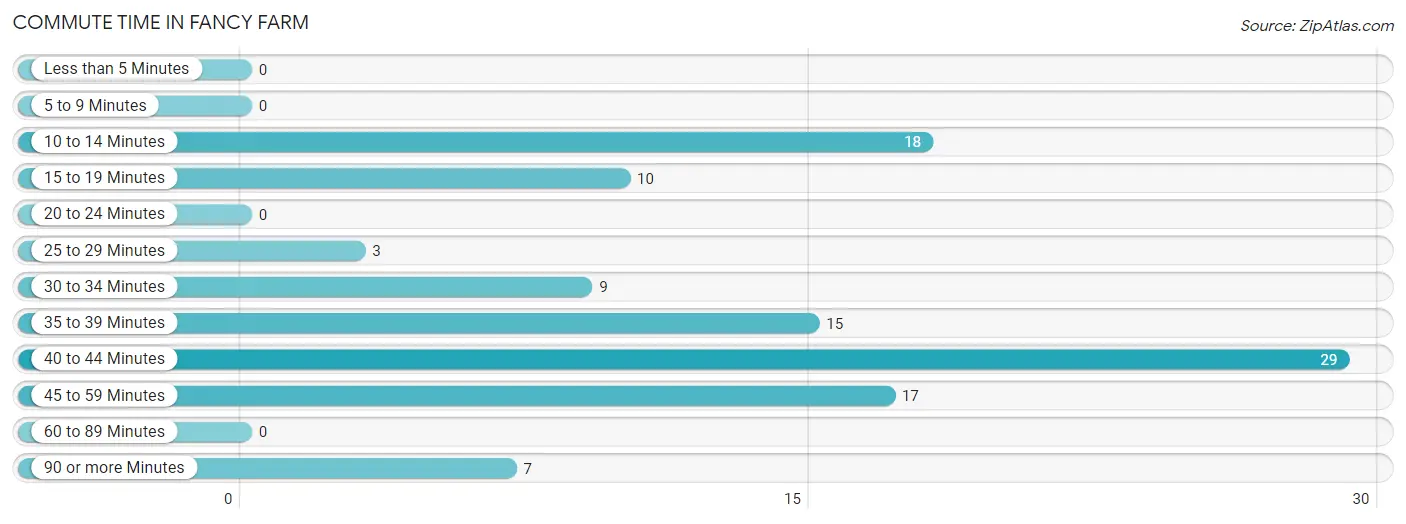
| Commute Time | # Commuters | % Commuters |
| Less than 5 Minutes | 0 | 0.0% |
| 5 to 9 Minutes | 0 | 0.0% |
| 10 to 14 Minutes | 18 | 16.7% |
| 15 to 19 Minutes | 10 | 9.3% |
| 20 to 24 Minutes | 0 | 0.0% |
| 25 to 29 Minutes | 3 | 2.8% |
| 30 to 34 Minutes | 9 | 8.3% |
| 35 to 39 Minutes | 15 | 13.9% |
| 40 to 44 Minutes | 29 | 26.9% |
| 45 to 59 Minutes | 17 | 15.7% |
| 60 to 89 Minutes | 0 | 0.0% |
| 90 or more Minutes | 7 | 6.5% |
Commute Time by Sex in Fancy Farm
The most common commute times in Fancy Farm are 45 to 59 minutes (17 commuters, 28.3%) for males and 35 to 39 minutes (15 commuters, 31.2%) for females.
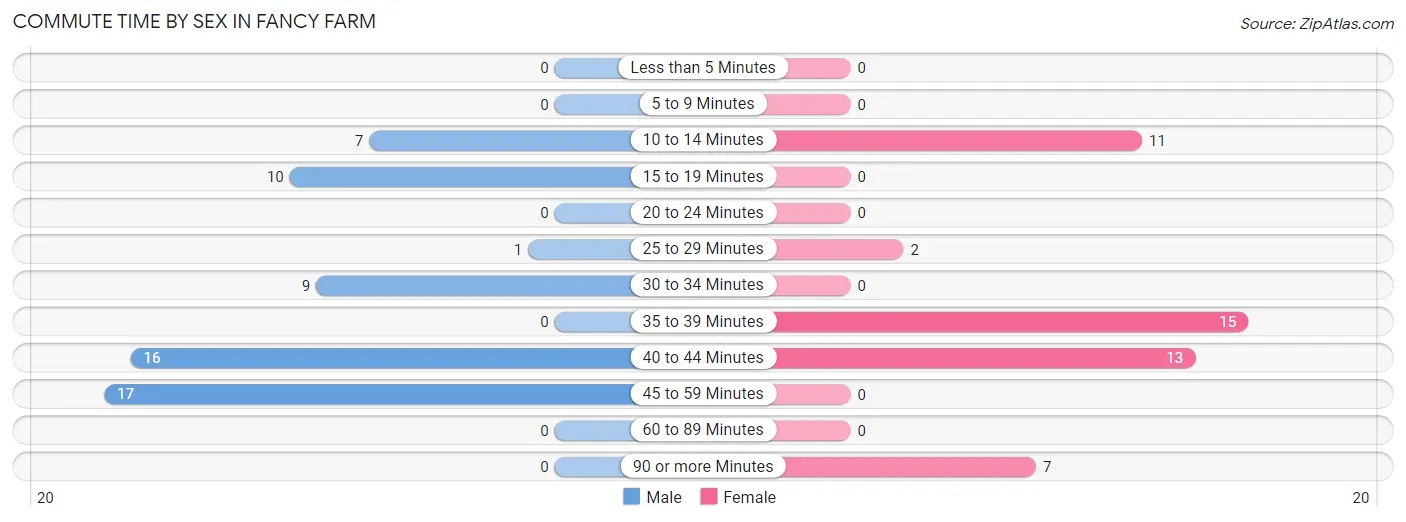
| Commute Time | Male | Female |
| Less than 5 Minutes | 0 (0.0%) | 0 (0.0%) |
| 5 to 9 Minutes | 0 (0.0%) | 0 (0.0%) |
| 10 to 14 Minutes | 7 (11.7%) | 11 (22.9%) |
| 15 to 19 Minutes | 10 (16.7%) | 0 (0.0%) |
| 20 to 24 Minutes | 0 (0.0%) | 0 (0.0%) |
| 25 to 29 Minutes | 1 (1.7%) | 2 (4.2%) |
| 30 to 34 Minutes | 9 (15.0%) | 0 (0.0%) |
| 35 to 39 Minutes | 0 (0.0%) | 15 (31.2%) |
| 40 to 44 Minutes | 16 (26.7%) | 13 (27.1%) |
| 45 to 59 Minutes | 17 (28.3%) | 0 (0.0%) |
| 60 to 89 Minutes | 0 (0.0%) | 0 (0.0%) |
| 90 or more Minutes | 0 (0.0%) | 7 (14.6%) |
Time of Departure to Work by Sex in Fancy Farm
The most frequent times of departure to work in Fancy Farm are 7:00 AM to 7:29 AM (23, 38.3%) for males and 7:30 AM to 7:59 AM (13, 27.1%) for females.
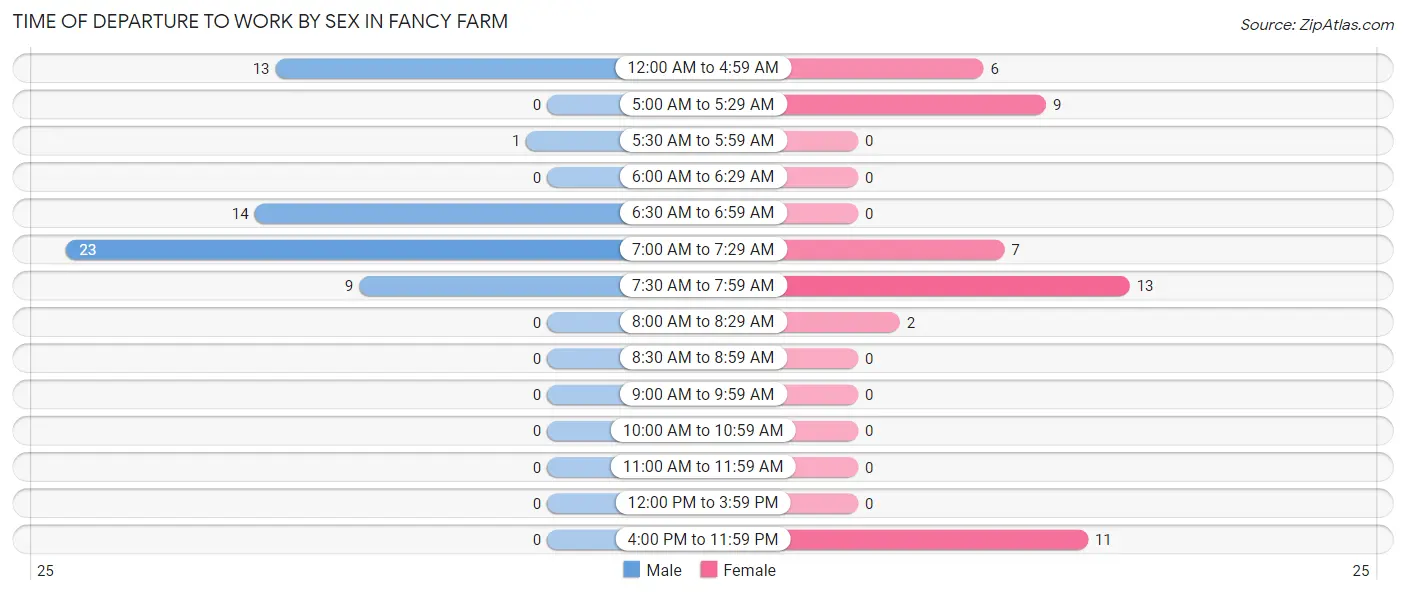
| Time of Departure | Male | Female |
| 12:00 AM to 4:59 AM | 13 (21.7%) | 6 (12.5%) |
| 5:00 AM to 5:29 AM | 0 (0.0%) | 9 (18.8%) |
| 5:30 AM to 5:59 AM | 1 (1.7%) | 0 (0.0%) |
| 6:00 AM to 6:29 AM | 0 (0.0%) | 0 (0.0%) |
| 6:30 AM to 6:59 AM | 14 (23.3%) | 0 (0.0%) |
| 7:00 AM to 7:29 AM | 23 (38.3%) | 7 (14.6%) |
| 7:30 AM to 7:59 AM | 9 (15.0%) | 13 (27.1%) |
| 8:00 AM to 8:29 AM | 0 (0.0%) | 2 (4.2%) |
| 8:30 AM to 8:59 AM | 0 (0.0%) | 0 (0.0%) |
| 9:00 AM to 9:59 AM | 0 (0.0%) | 0 (0.0%) |
| 10:00 AM to 10:59 AM | 0 (0.0%) | 0 (0.0%) |
| 11:00 AM to 11:59 AM | 0 (0.0%) | 0 (0.0%) |
| 12:00 PM to 3:59 PM | 0 (0.0%) | 0 (0.0%) |
| 4:00 PM to 11:59 PM | 0 (0.0%) | 11 (22.9%) |
| Total | 60 (100.0%) | 48 (100.0%) |
Housing Occupancy in Fancy Farm
Occupancy by Ownership in Fancy Farm
Of the total 151 dwellings in Fancy Farm, owner-occupied units account for 74 (49.0%), while renter-occupied units make up 77 (51.0%).
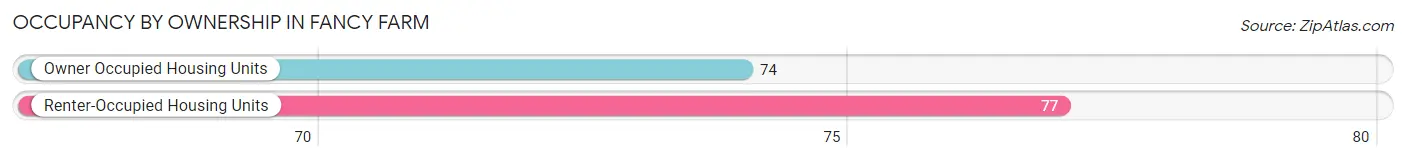
| Occupancy | # Housing Units | % Housing Units |
| Owner Occupied Housing Units | 74 | 49.0% |
| Renter-Occupied Housing Units | 77 | 51.0% |
| Total Occupied Housing Units | 151 | 100.0% |
Occupancy by Household Size in Fancy Farm
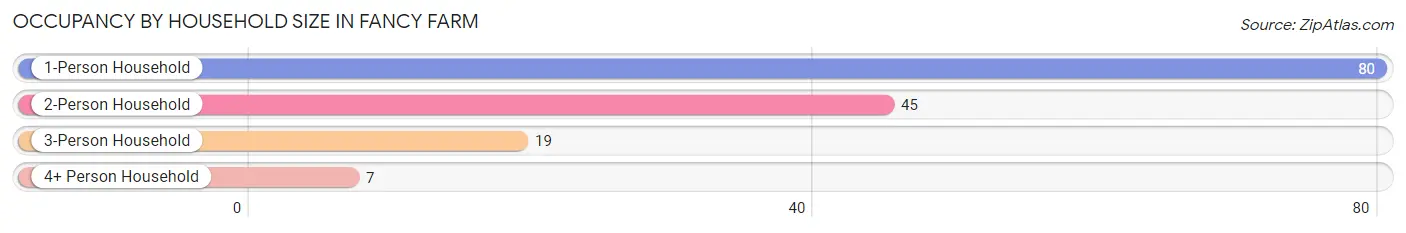
| Household Size | # Housing Units | % Housing Units |
| 1-Person Household | 80 | 53.0% |
| 2-Person Household | 45 | 29.8% |
| 3-Person Household | 19 | 12.6% |
| 4+ Person Household | 7 | 4.6% |
| Total Housing Units | 151 | 100.0% |
Occupancy by Ownership by Household Size in Fancy Farm
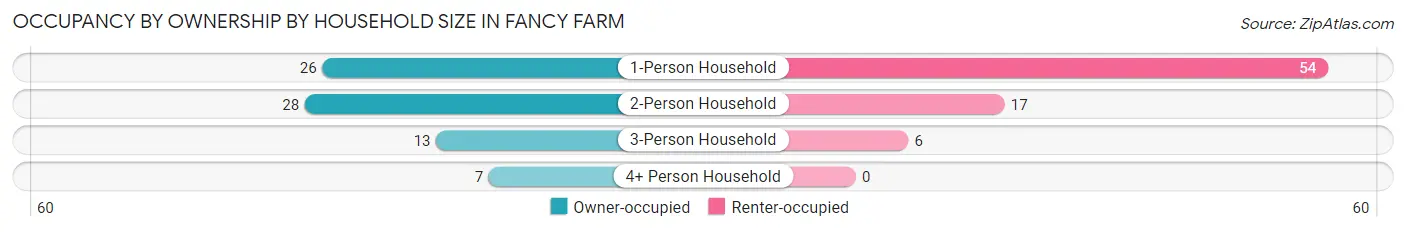
| Household Size | Owner-occupied | Renter-occupied |
| 1-Person Household | 26 (32.5%) | 54 (67.5%) |
| 2-Person Household | 28 (62.2%) | 17 (37.8%) |
| 3-Person Household | 13 (68.4%) | 6 (31.6%) |
| 4+ Person Household | 7 (100.0%) | 0 (0.0%) |
| Total Housing Units | 74 (49.0%) | 77 (51.0%) |
Occupancy by Educational Attainment in Fancy Farm
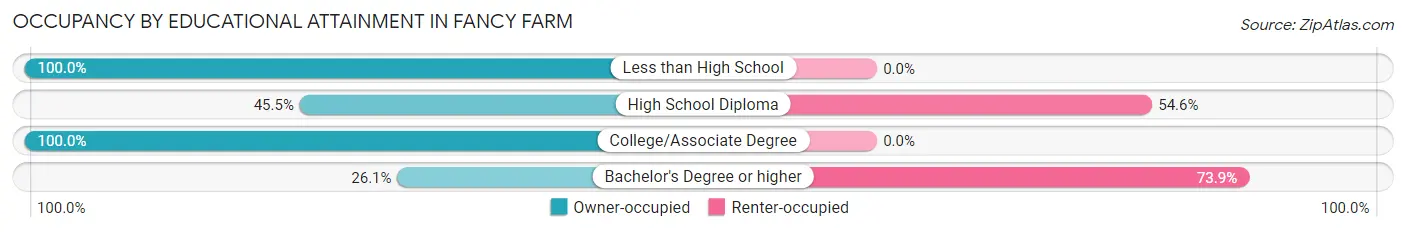
| Household Size | Owner-occupied | Renter-occupied |
| Less than High School | 7 (100.0%) | 0 (0.0%) |
| High School Diploma | 50 (45.5%) | 60 (54.5%) |
| College/Associate Degree | 11 (100.0%) | 0 (0.0%) |
| Bachelor's Degree or higher | 6 (26.1%) | 17 (73.9%) |
Occupancy by Age of Householder in Fancy Farm
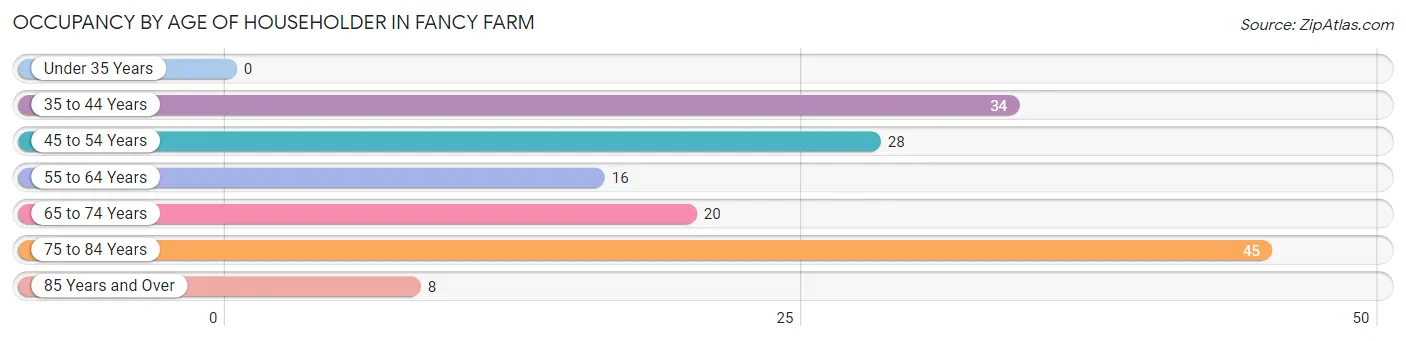
| Age Bracket | # Households | % Households |
| Under 35 Years | 0 | 0.0% |
| 35 to 44 Years | 34 | 22.5% |
| 45 to 54 Years | 28 | 18.5% |
| 55 to 64 Years | 16 | 10.6% |
| 65 to 74 Years | 20 | 13.3% |
| 75 to 84 Years | 45 | 29.8% |
| 85 Years and Over | 8 | 5.3% |
| Total | 151 | 100.0% |
Housing Finances in Fancy Farm
Median Income by Occupancy in Fancy Farm
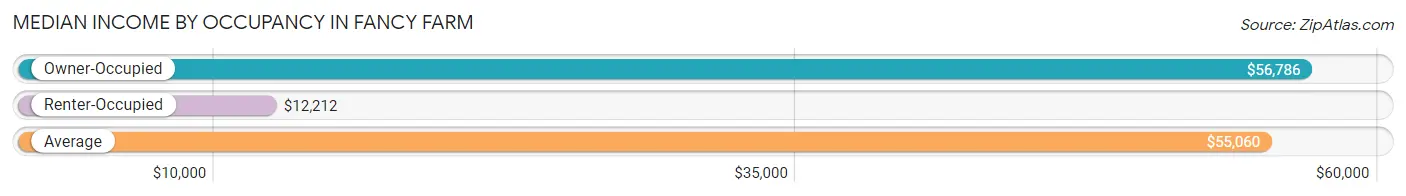
| Occupancy Type | # Households | Median Income |
| Owner-Occupied | 74 (49.0%) | $56,786 |
| Renter-Occupied | 77 (51.0%) | $12,212 |
| Average | 151 (100.0%) | $55,060 |
Occupancy by Householder Income Bracket in Fancy Farm
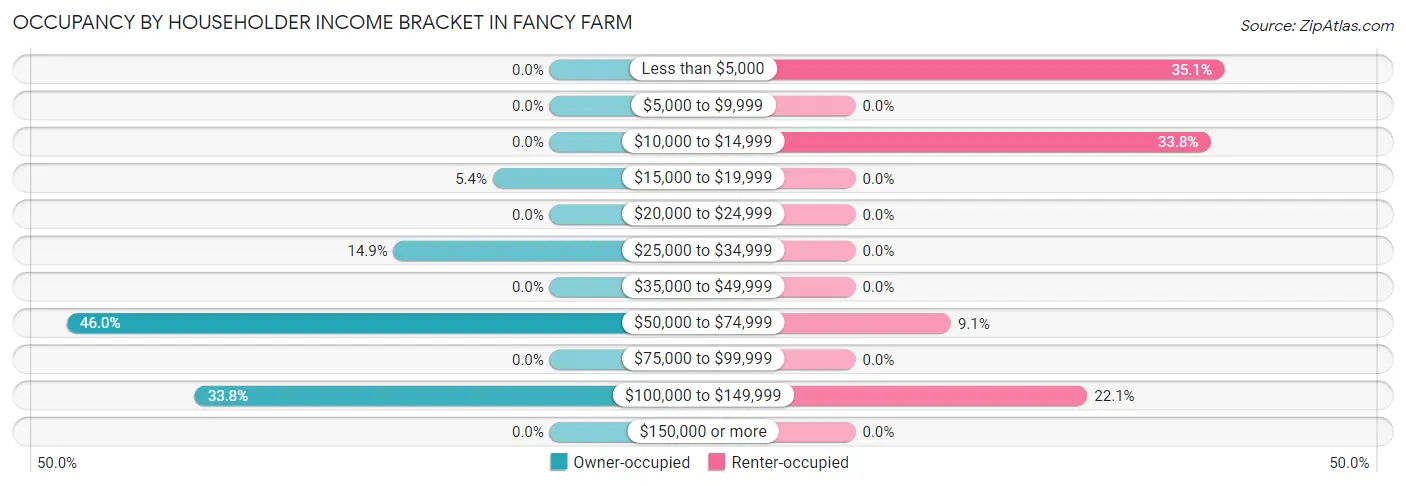
| Income Bracket | Owner-occupied | Renter-occupied |
| Less than $5,000 | 0 (0.0%) | 27 (35.1%) |
| $5,000 to $9,999 | 0 (0.0%) | 0 (0.0%) |
| $10,000 to $14,999 | 0 (0.0%) | 26 (33.8%) |
| $15,000 to $19,999 | 4 (5.4%) | 0 (0.0%) |
| $20,000 to $24,999 | 0 (0.0%) | 0 (0.0%) |
| $25,000 to $34,999 | 11 (14.9%) | 0 (0.0%) |
| $35,000 to $49,999 | 0 (0.0%) | 0 (0.0%) |
| $50,000 to $74,999 | 34 (46.0%) | 7 (9.1%) |
| $75,000 to $99,999 | 0 (0.0%) | 0 (0.0%) |
| $100,000 to $149,999 | 25 (33.8%) | 17 (22.1%) |
| $150,000 or more | 0 (0.0%) | 0 (0.0%) |
| Total | 74 (100.0%) | 77 (100.0%) |
Monthly Housing Cost Tiers in Fancy Farm
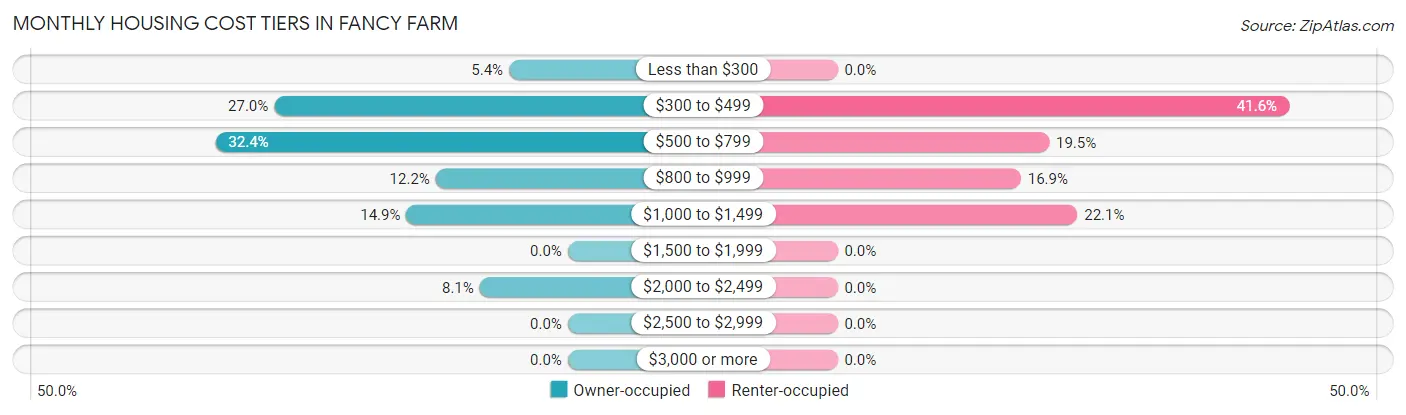
| Monthly Cost | Owner-occupied | Renter-occupied |
| Less than $300 | 4 (5.4%) | 0 (0.0%) |
| $300 to $499 | 20 (27.0%) | 32 (41.6%) |
| $500 to $799 | 24 (32.4%) | 15 (19.5%) |
| $800 to $999 | 9 (12.2%) | 13 (16.9%) |
| $1,000 to $1,499 | 11 (14.9%) | 17 (22.1%) |
| $1,500 to $1,999 | 0 (0.0%) | 0 (0.0%) |
| $2,000 to $2,499 | 6 (8.1%) | 0 (0.0%) |
| $2,500 to $2,999 | 0 (0.0%) | 0 (0.0%) |
| $3,000 or more | 0 (0.0%) | 0 (0.0%) |
| Total | 74 (100.0%) | 77 (100.0%) |
Physical Housing Characteristics in Fancy Farm
Housing Structures in Fancy Farm
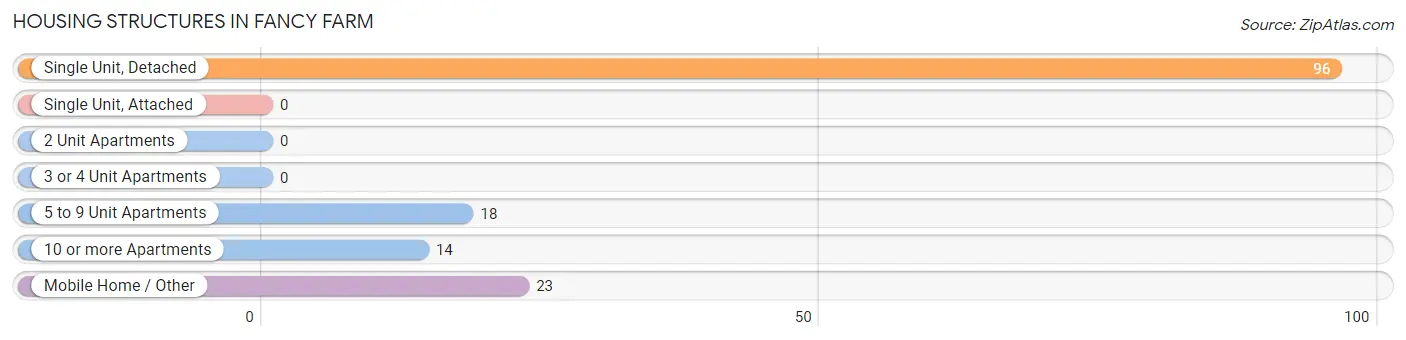
| Structure Type | # Housing Units | % Housing Units |
| Single Unit, Detached | 96 | 63.6% |
| Single Unit, Attached | 0 | 0.0% |
| 2 Unit Apartments | 0 | 0.0% |
| 3 or 4 Unit Apartments | 0 | 0.0% |
| 5 to 9 Unit Apartments | 18 | 11.9% |
| 10 or more Apartments | 14 | 9.3% |
| Mobile Home / Other | 23 | 15.2% |
| Total | 151 | 100.0% |
Housing Structures by Occupancy in Fancy Farm
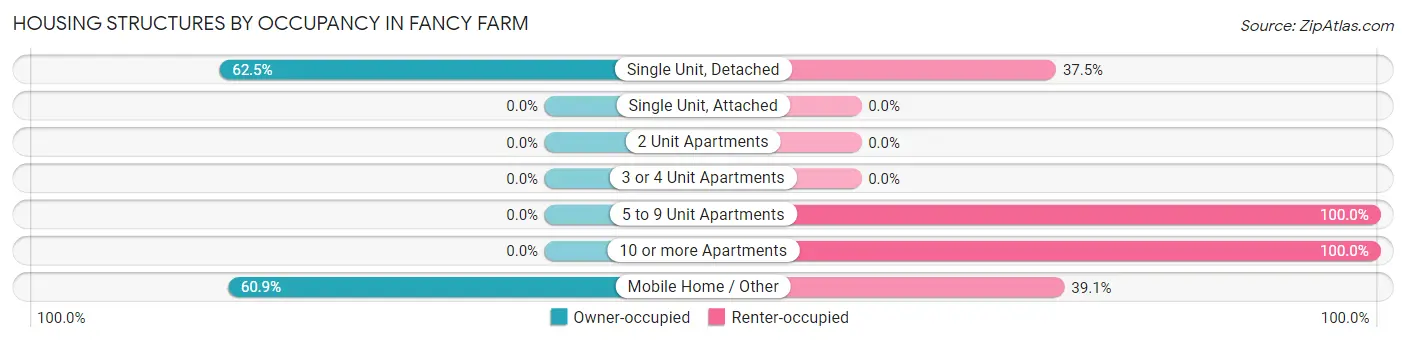
| Structure Type | Owner-occupied | Renter-occupied |
| Single Unit, Detached | 60 (62.5%) | 36 (37.5%) |
| Single Unit, Attached | 0 (0.0%) | 0 (0.0%) |
| 2 Unit Apartments | 0 (0.0%) | 0 (0.0%) |
| 3 or 4 Unit Apartments | 0 (0.0%) | 0 (0.0%) |
| 5 to 9 Unit Apartments | 0 (0.0%) | 18 (100.0%) |
| 10 or more Apartments | 0 (0.0%) | 14 (100.0%) |
| Mobile Home / Other | 14 (60.9%) | 9 (39.1%) |
| Total | 74 (49.0%) | 77 (51.0%) |
Housing Structures by Number of Rooms in Fancy Farm
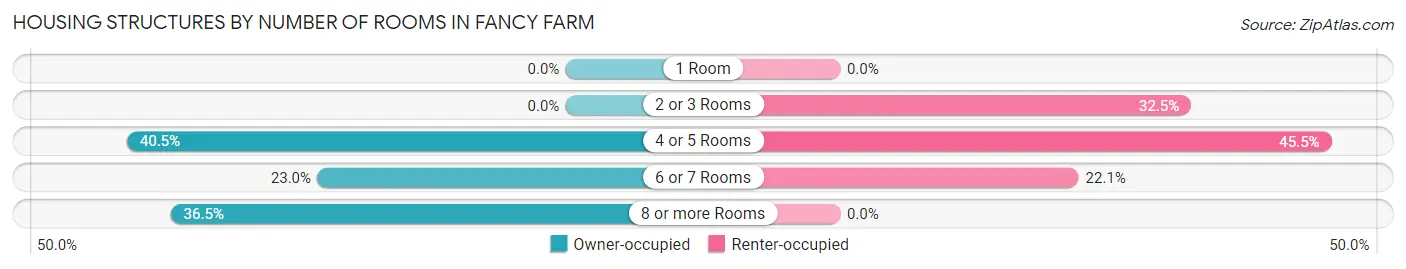
| Number of Rooms | Owner-occupied | Renter-occupied |
| 1 Room | 0 (0.0%) | 0 (0.0%) |
| 2 or 3 Rooms | 0 (0.0%) | 25 (32.5%) |
| 4 or 5 Rooms | 30 (40.5%) | 35 (45.5%) |
| 6 or 7 Rooms | 17 (23.0%) | 17 (22.1%) |
| 8 or more Rooms | 27 (36.5%) | 0 (0.0%) |
| Total | 74 (100.0%) | 77 (100.0%) |
Housing Structure by Heating Type in Fancy Farm
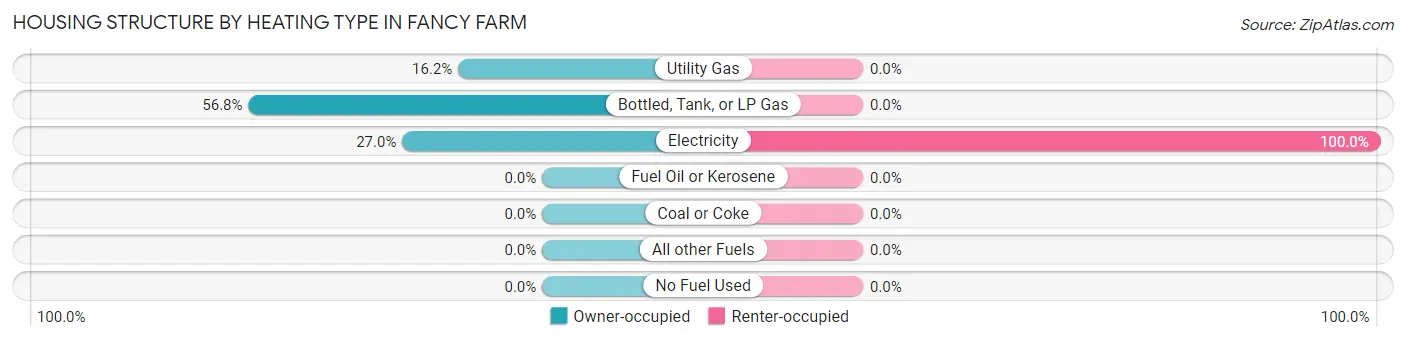
| Heating Type | Owner-occupied | Renter-occupied |
| Utility Gas | 12 (16.2%) | 0 (0.0%) |
| Bottled, Tank, or LP Gas | 42 (56.8%) | 0 (0.0%) |
| Electricity | 20 (27.0%) | 77 (100.0%) |
| Fuel Oil or Kerosene | 0 (0.0%) | 0 (0.0%) |
| Coal or Coke | 0 (0.0%) | 0 (0.0%) |
| All other Fuels | 0 (0.0%) | 0 (0.0%) |
| No Fuel Used | 0 (0.0%) | 0 (0.0%) |
| Total | 74 (100.0%) | 77 (100.0%) |
Household Vehicle Usage in Fancy Farm
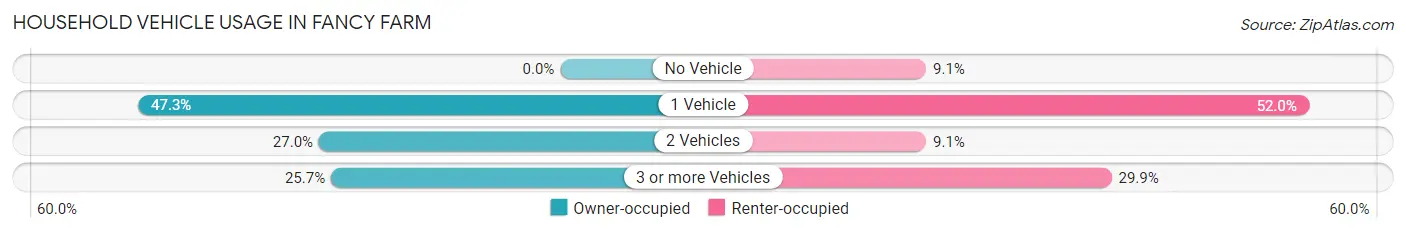
| Vehicles per Household | Owner-occupied | Renter-occupied |
| No Vehicle | 0 (0.0%) | 7 (9.1%) |
| 1 Vehicle | 35 (47.3%) | 40 (51.9%) |
| 2 Vehicles | 20 (27.0%) | 7 (9.1%) |
| 3 or more Vehicles | 19 (25.7%) | 23 (29.9%) |
| Total | 74 (100.0%) | 77 (100.0%) |
Real Estate & Mortgages in Fancy Farm
Real Estate and Mortgage Overview in Fancy Farm
| Characteristic | Without Mortgage | With Mortgage |
| Housing Units | 42 | 32 |
| Median Property Value | $110,400 | $0 |
| Median Household Income | $54,643 | $0 |
| Monthly Housing Costs | $485 | $0 |
| Real Estate Taxes | $715 | $0 |
Property Value by Mortgage Status in Fancy Farm
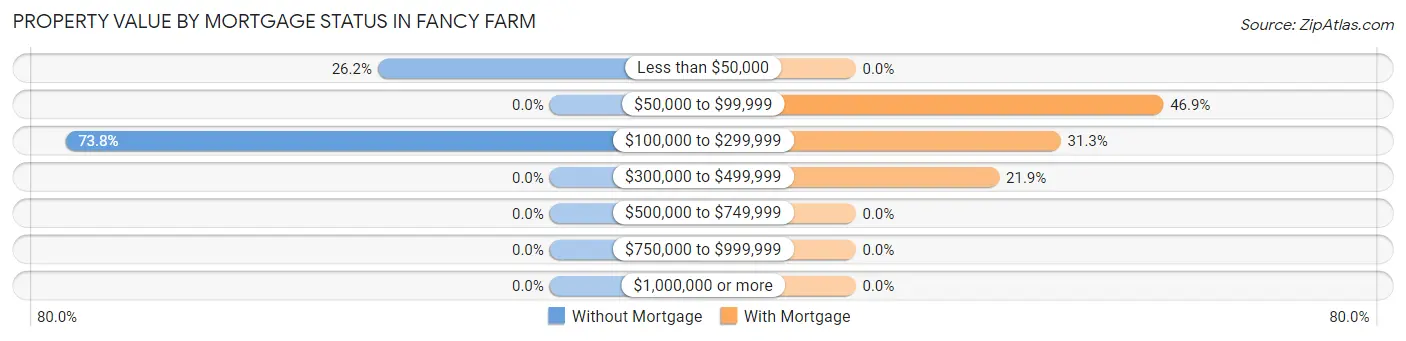
| Property Value | Without Mortgage | With Mortgage |
| Less than $50,000 | 11 (26.2%) | 0 (0.0%) |
| $50,000 to $99,999 | 0 (0.0%) | 15 (46.9%) |
| $100,000 to $299,999 | 31 (73.8%) | 10 (31.2%) |
| $300,000 to $499,999 | 0 (0.0%) | 7 (21.9%) |
| $500,000 to $749,999 | 0 (0.0%) | 0 (0.0%) |
| $750,000 to $999,999 | 0 (0.0%) | 0 (0.0%) |
| $1,000,000 or more | 0 (0.0%) | 0 (0.0%) |
| Total | 42 (100.0%) | 32 (100.0%) |
Household Income by Mortgage Status in Fancy Farm
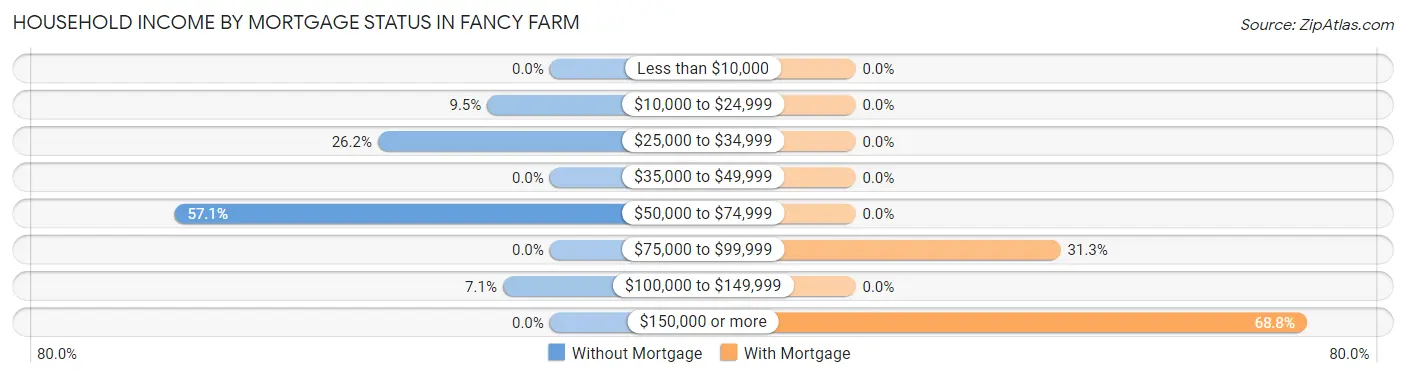
| Household Income | Without Mortgage | With Mortgage |
| Less than $10,000 | 0 (0.0%) | 0 (0.0%) |
| $10,000 to $24,999 | 4 (9.5%) | 0 (0.0%) |
| $25,000 to $34,999 | 11 (26.2%) | 0 (0.0%) |
| $35,000 to $49,999 | 0 (0.0%) | 0 (0.0%) |
| $50,000 to $74,999 | 24 (57.1%) | 0 (0.0%) |
| $75,000 to $99,999 | 0 (0.0%) | 10 (31.2%) |
| $100,000 to $149,999 | 3 (7.1%) | 0 (0.0%) |
| $150,000 or more | 0 (0.0%) | 22 (68.8%) |
| Total | 42 (100.0%) | 32 (100.0%) |
Property Value to Household Income Ratio in Fancy Farm
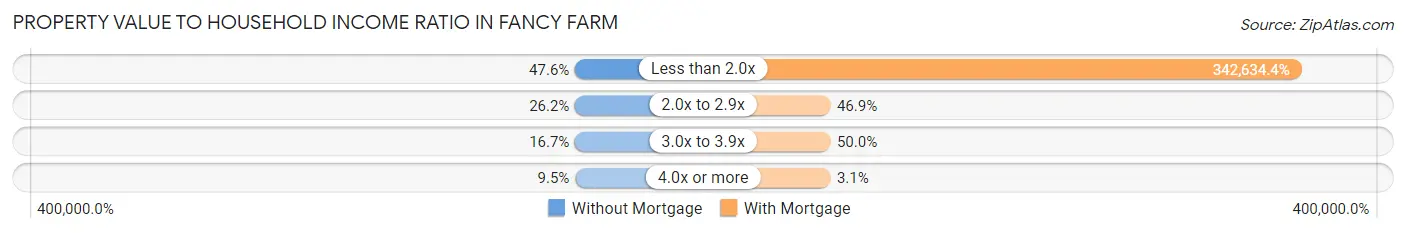
| Value-to-Income Ratio | Without Mortgage | With Mortgage |
| Less than 2.0x | 20 (47.6%) | 109,643 (342,634.4%) |
| 2.0x to 2.9x | 11 (26.2%) | 15 (46.9%) |
| 3.0x to 3.9x | 7 (16.7%) | 16 (50.0%) |
| 4.0x or more | 4 (9.5%) | 1 (3.1%) |
| Total | 42 (100.0%) | 32 (100.0%) |
Real Estate Taxes by Mortgage Status in Fancy Farm
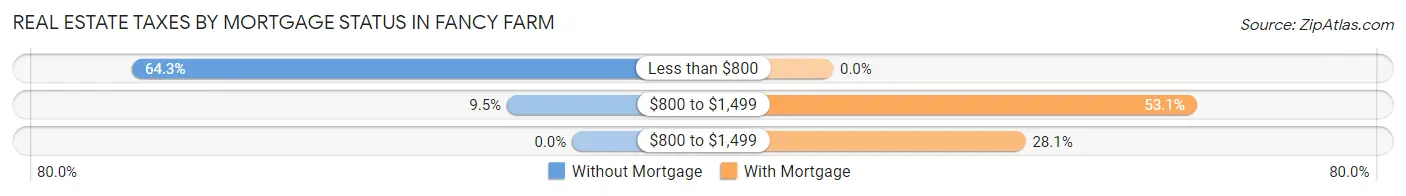
| Property Taxes | Without Mortgage | With Mortgage |
| Less than $800 | 27 (64.3%) | 0 (0.0%) |
| $800 to $1,499 | 4 (9.5%) | 17 (53.1%) |
| $800 to $1,499 | 0 (0.0%) | 9 (28.1%) |
| Total | 42 (100.0%) | 32 (100.0%) |
Health & Disability in Fancy Farm
Health Insurance Coverage by Age in Fancy Farm
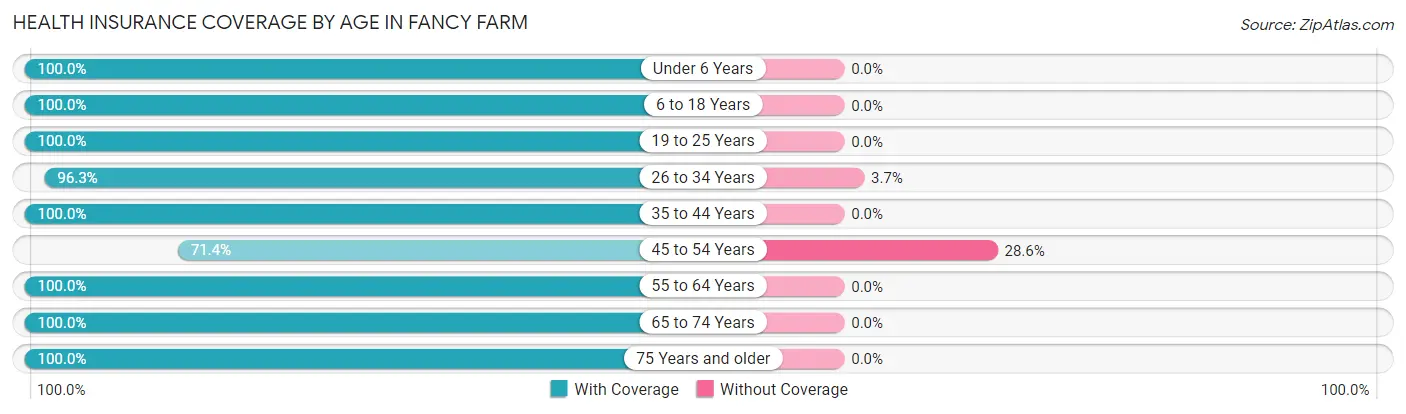
| Age Bracket | With Coverage | Without Coverage |
| Under 6 Years | 1 (100.0%) | 0 (0.0%) |
| 6 to 18 Years | 38 (100.0%) | 0 (0.0%) |
| 19 to 25 Years | 10 (100.0%) | 0 (0.0%) |
| 26 to 34 Years | 26 (96.3%) | 1 (3.7%) |
| 35 to 44 Years | 47 (100.0%) | 0 (0.0%) |
| 45 to 54 Years | 35 (71.4%) | 14 (28.6%) |
| 55 to 64 Years | 25 (100.0%) | 0 (0.0%) |
| 65 to 74 Years | 25 (100.0%) | 0 (0.0%) |
| 75 Years and older | 78 (100.0%) | 0 (0.0%) |
| Total | 285 (95.0%) | 15 (5.0%) |
Health Insurance Coverage by Citizenship Status in Fancy Farm
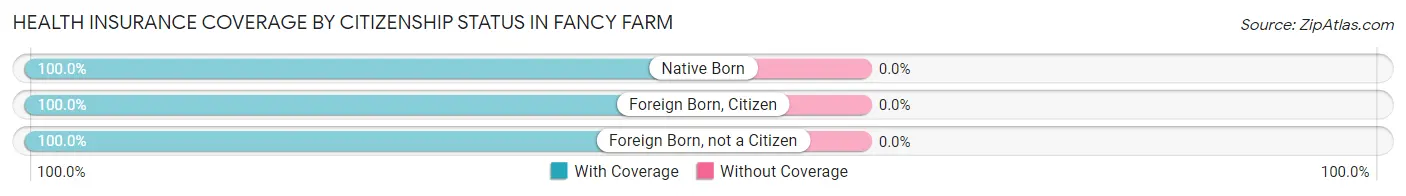
| Citizenship Status | With Coverage | Without Coverage |
| Native Born | 1 (100.0%) | 0 (0.0%) |
| Foreign Born, Citizen | 38 (100.0%) | 0 (0.0%) |
| Foreign Born, not a Citizen | 10 (100.0%) | 0 (0.0%) |
Health Insurance Coverage by Household Income in Fancy Farm
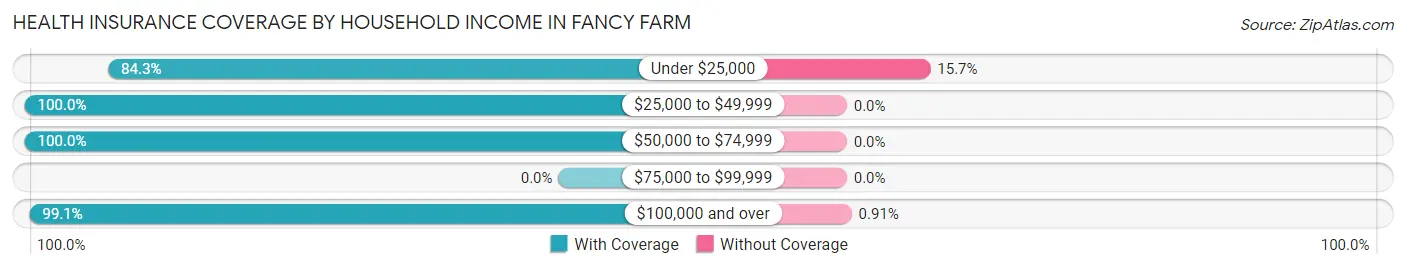
| Household Income | With Coverage | Without Coverage |
| Under $25,000 | 70 (84.3%) | 13 (15.7%) |
| $25,000 to $49,999 | 43 (100.0%) | 0 (0.0%) |
| $50,000 to $74,999 | 60 (100.0%) | 0 (0.0%) |
| $75,000 to $99,999 | 0 (0.0%) | 0 (0.0%) |
| $100,000 and over | 109 (99.1%) | 1 (0.9%) |
Public vs Private Health Insurance Coverage by Age in Fancy Farm
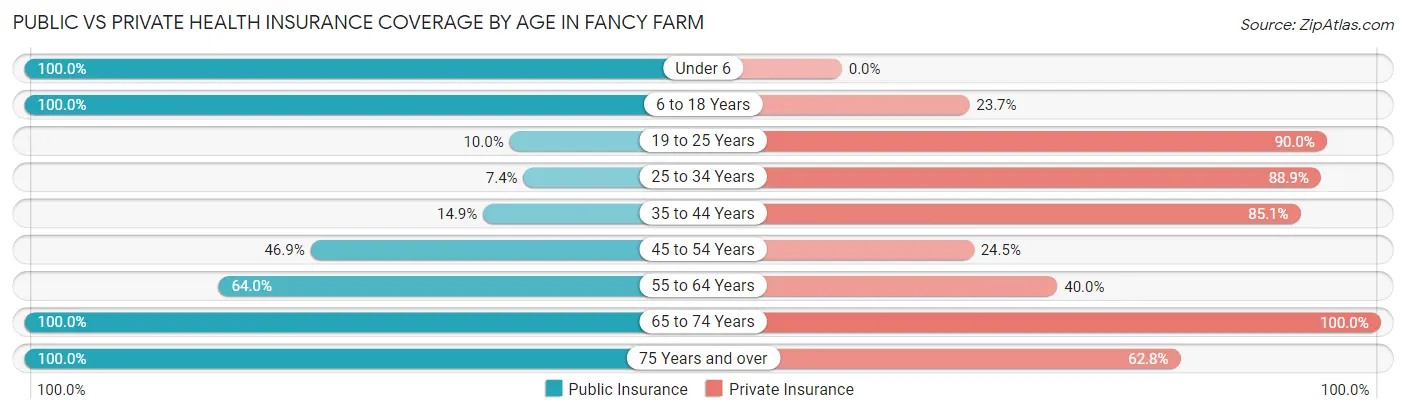
| Age Bracket | Public Insurance | Private Insurance |
| Under 6 | 1 (100.0%) | 0 (0.0%) |
| 6 to 18 Years | 38 (100.0%) | 9 (23.7%) |
| 19 to 25 Years | 1 (10.0%) | 9 (90.0%) |
| 25 to 34 Years | 2 (7.4%) | 24 (88.9%) |
| 35 to 44 Years | 7 (14.9%) | 40 (85.1%) |
| 45 to 54 Years | 23 (46.9%) | 12 (24.5%) |
| 55 to 64 Years | 16 (64.0%) | 10 (40.0%) |
| 65 to 74 Years | 25 (100.0%) | 25 (100.0%) |
| 75 Years and over | 78 (100.0%) | 49 (62.8%) |
| Total | 191 (63.7%) | 178 (59.3%) |
Disability Status by Sex by Age in Fancy Farm
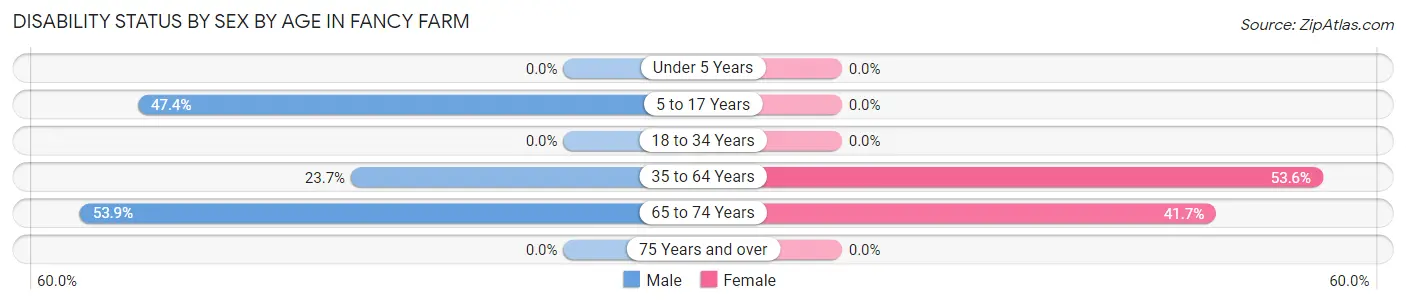
| Age Bracket | Male | Female |
| Under 5 Years | 0 (0.0%) | 0 (0.0%) |
| 5 to 17 Years | 9 (47.4%) | 0 (0.0%) |
| 18 to 34 Years | 0 (0.0%) | 0 (0.0%) |
| 35 to 64 Years | 22 (23.7%) | 15 (53.6%) |
| 65 to 74 Years | 7 (53.8%) | 5 (41.7%) |
| 75 Years and over | 0 (0.0%) | 0 (0.0%) |
Disability Class by Sex by Age in Fancy Farm
Disability Class: Hearing Difficulty
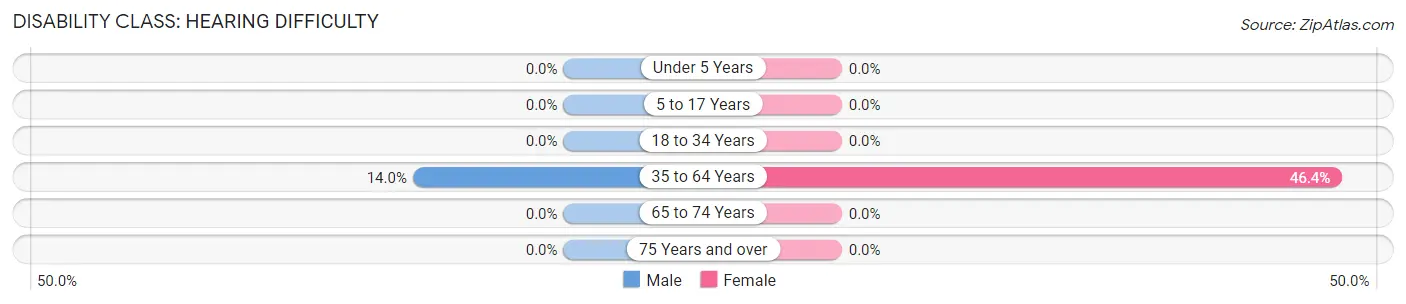
| Age Bracket | Male | Female |
| Under 5 Years | 0 (0.0%) | 0 (0.0%) |
| 5 to 17 Years | 0 (0.0%) | 0 (0.0%) |
| 18 to 34 Years | 0 (0.0%) | 0 (0.0%) |
| 35 to 64 Years | 13 (14.0%) | 13 (46.4%) |
| 65 to 74 Years | 0 (0.0%) | 0 (0.0%) |
| 75 Years and over | 0 (0.0%) | 0 (0.0%) |
Disability Class: Vision Difficulty
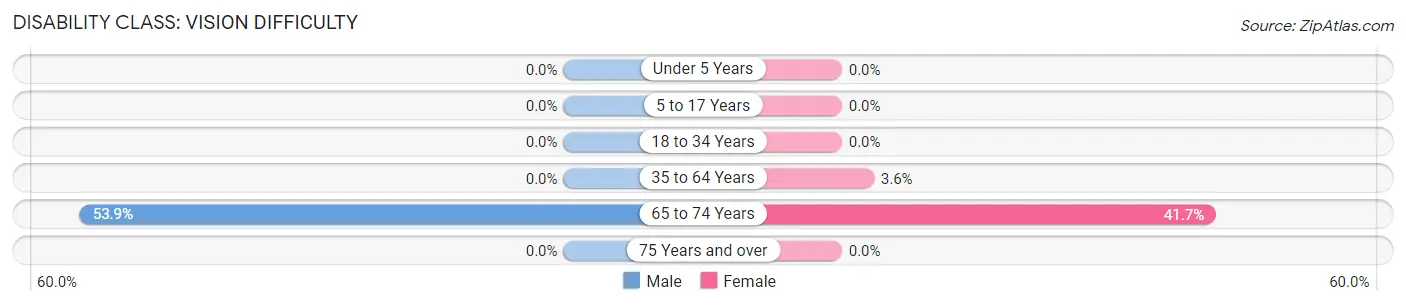
| Age Bracket | Male | Female |
| Under 5 Years | 0 (0.0%) | 0 (0.0%) |
| 5 to 17 Years | 0 (0.0%) | 0 (0.0%) |
| 18 to 34 Years | 0 (0.0%) | 0 (0.0%) |
| 35 to 64 Years | 0 (0.0%) | 1 (3.6%) |
| 65 to 74 Years | 7 (53.8%) | 5 (41.7%) |
| 75 Years and over | 0 (0.0%) | 0 (0.0%) |
Disability Class: Cognitive Difficulty
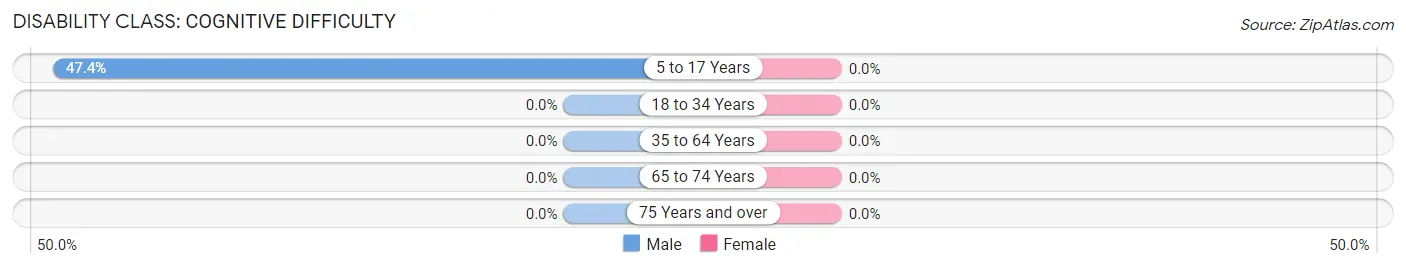
| Age Bracket | Male | Female |
| 5 to 17 Years | 9 (47.4%) | 0 (0.0%) |
| 18 to 34 Years | 0 (0.0%) | 0 (0.0%) |
| 35 to 64 Years | 0 (0.0%) | 0 (0.0%) |
| 65 to 74 Years | 0 (0.0%) | 0 (0.0%) |
| 75 Years and over | 0 (0.0%) | 0 (0.0%) |
Disability Class: Ambulatory Difficulty
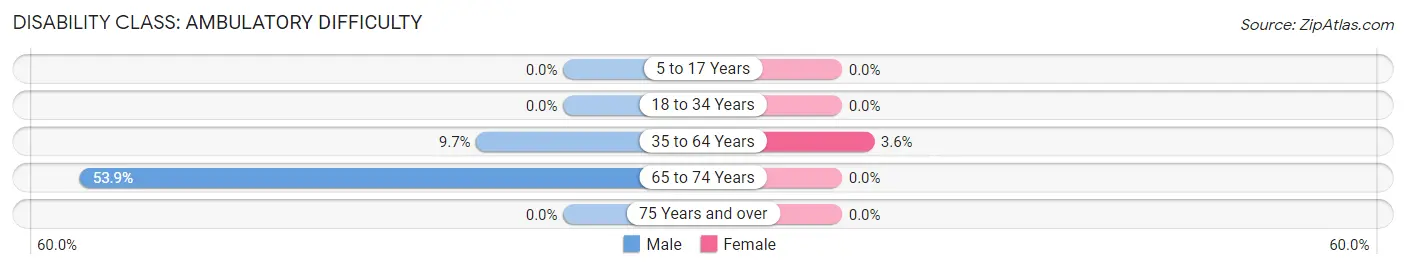
| Age Bracket | Male | Female |
| 5 to 17 Years | 0 (0.0%) | 0 (0.0%) |
| 18 to 34 Years | 0 (0.0%) | 0 (0.0%) |
| 35 to 64 Years | 9 (9.7%) | 1 (3.6%) |
| 65 to 74 Years | 7 (53.8%) | 0 (0.0%) |
| 75 Years and over | 0 (0.0%) | 0 (0.0%) |
Disability Class: Self-Care Difficulty
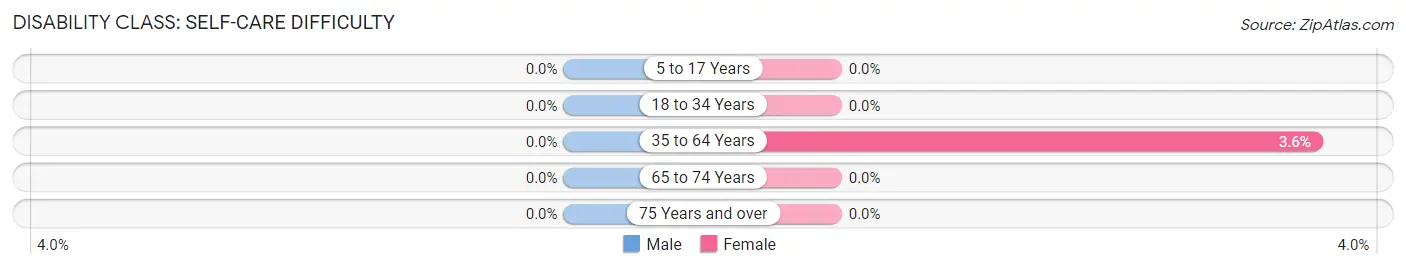
| Age Bracket | Male | Female |
| 5 to 17 Years | 0 (0.0%) | 0 (0.0%) |
| 18 to 34 Years | 0 (0.0%) | 0 (0.0%) |
| 35 to 64 Years | 0 (0.0%) | 1 (3.6%) |
| 65 to 74 Years | 0 (0.0%) | 0 (0.0%) |
| 75 Years and over | 0 (0.0%) | 0 (0.0%) |
Technology Access in Fancy Farm
Computing Device Access in Fancy Farm
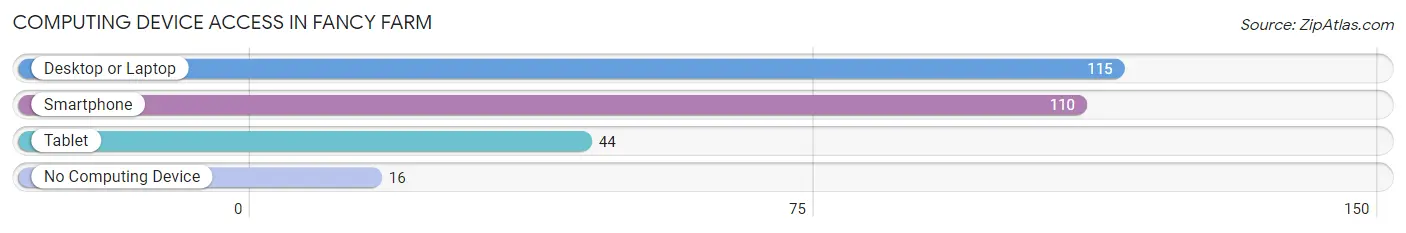
| Device Type | # Households | % Households |
| Desktop or Laptop | 115 | 76.2% |
| Smartphone | 110 | 72.9% |
| Tablet | 44 | 29.1% |
| No Computing Device | 16 | 10.6% |
| Total | 151 | 100.0% |
Internet Access in Fancy Farm
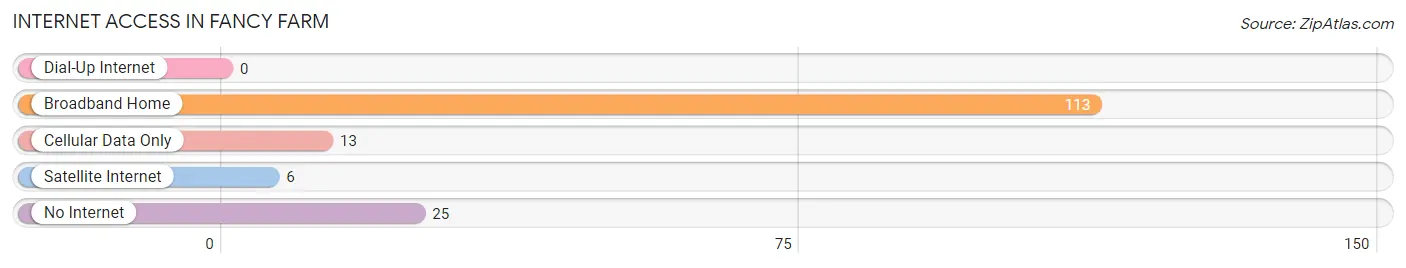
| Internet Type | # Households | % Households |
| Dial-Up Internet | 0 | 0.0% |
| Broadband Home | 113 | 74.8% |
| Cellular Data Only | 13 | 8.6% |
| Satellite Internet | 6 | 4.0% |
| No Internet | 25 | 16.6% |
| Total | 151 | 100.0% |
Fancy Farm Summary
Fancy Farm is a small unincorporated community located in Graves County, Kentucky, United States. It is situated along the western bank of the Tennessee River, approximately 8 miles (13 km) south of Mayfield. The population was estimated to be around 500 in the year 2000.
History
Fancy Farm was first settled in the early 1800s by a group of settlers from Virginia. The town was named after a nearby farm owned by the family of William Fancy, who was one of the original settlers. The town was officially incorporated in 1845.
In the late 1800s, Fancy Farm became a popular destination for steamboat travelers. The town was home to several hotels, restaurants, and stores, as well as a post office. The town also had a school, a church, and a cemetery.
In the early 1900s, Fancy Farm began to decline in population as many of the residents moved away in search of better economic opportunities. The town was eventually abandoned in the 1940s.
Geography
Fancy Farm is located in western Graves County, Kentucky, approximately 8 miles (13 km) south of Mayfield. The town is situated along the western bank of the Tennessee River. The terrain is mostly flat, with some rolling hills in the area. The climate is humid subtropical, with hot summers and mild winters.
Economy
Fancy Farm is a small, rural community with a limited economy. The town is home to a few small businesses, including a convenience store, a gas station, and a few restaurants. The town also has a few churches and a cemetery.
Demographics
As of the 2000 census, the population of Fancy Farm was estimated to be around 500. The racial makeup of the town was 97.2% White, 0.8% African American, 0.4% Native American, and 1.6% from two or more races. The median household income was $25,000, and the median family income was $30,000. The per capita income was $14,000.
Conclusion
Fancy Farm is a small, rural community located in western Graves County, Kentucky. The town was first settled in the early 1800s and was once a popular destination for steamboat travelers. Today, the town is home to a few small businesses and has a population of around 500. The economy of Fancy Farm is limited, and the median household income is lower than the national average.
Common Questions
What is Per Capita Income in Fancy Farm?
Per Capita income in Fancy Farm is $26,605.
What is the Median Family Income in Fancy Farm?
Median Family Income in Fancy Farm is $54,107.
What is the Median Household income in Fancy Farm?
Median Household Income in Fancy Farm is $55,060.
What is Income or Wage Gap in Fancy Farm?
Income or Wage Gap in Fancy Farm is 37.6%.
Women in Fancy Farm earn 62.4 cents for every dollar earned by a man.
What is Inequality or Gini Index in Fancy Farm?
Inequality or Gini Index in Fancy Farm is 0.46.
What is the Total Population of Fancy Farm?
Total Population of Fancy Farm is 300.
What is the Total Male Population of Fancy Farm?
Total Male Population of Fancy Farm is 140.
What is the Total Female Population of Fancy Farm?
Total Female Population of Fancy Farm is 160.
What is the Ratio of Males per 100 Females in Fancy Farm?
There are 87.50 Males per 100 Females in Fancy Farm.
What is the Ratio of Females per 100 Males in Fancy Farm?
There are 114.29 Females per 100 Males in Fancy Farm.
What is the Median Population Age in Fancy Farm?
Median Population Age in Fancy Farm is 51.1 Years.
What is the Average Family Size in Fancy Farm
Average Family Size in Fancy Farm is 3.9 People.
What is the Average Household Size in Fancy Farm
Average Household Size in Fancy Farm is 2.0 People.
How Large is the Labor Force in Fancy Farm?
There are 117 People in the Labor Forcein in Fancy Farm.
What is the Percentage of People in the Labor Force in Fancy Farm?
43.3% of People are in the Labor Force in Fancy Farm.