Lincolnshire, KY Map & Demographics
Lincolnshire Map
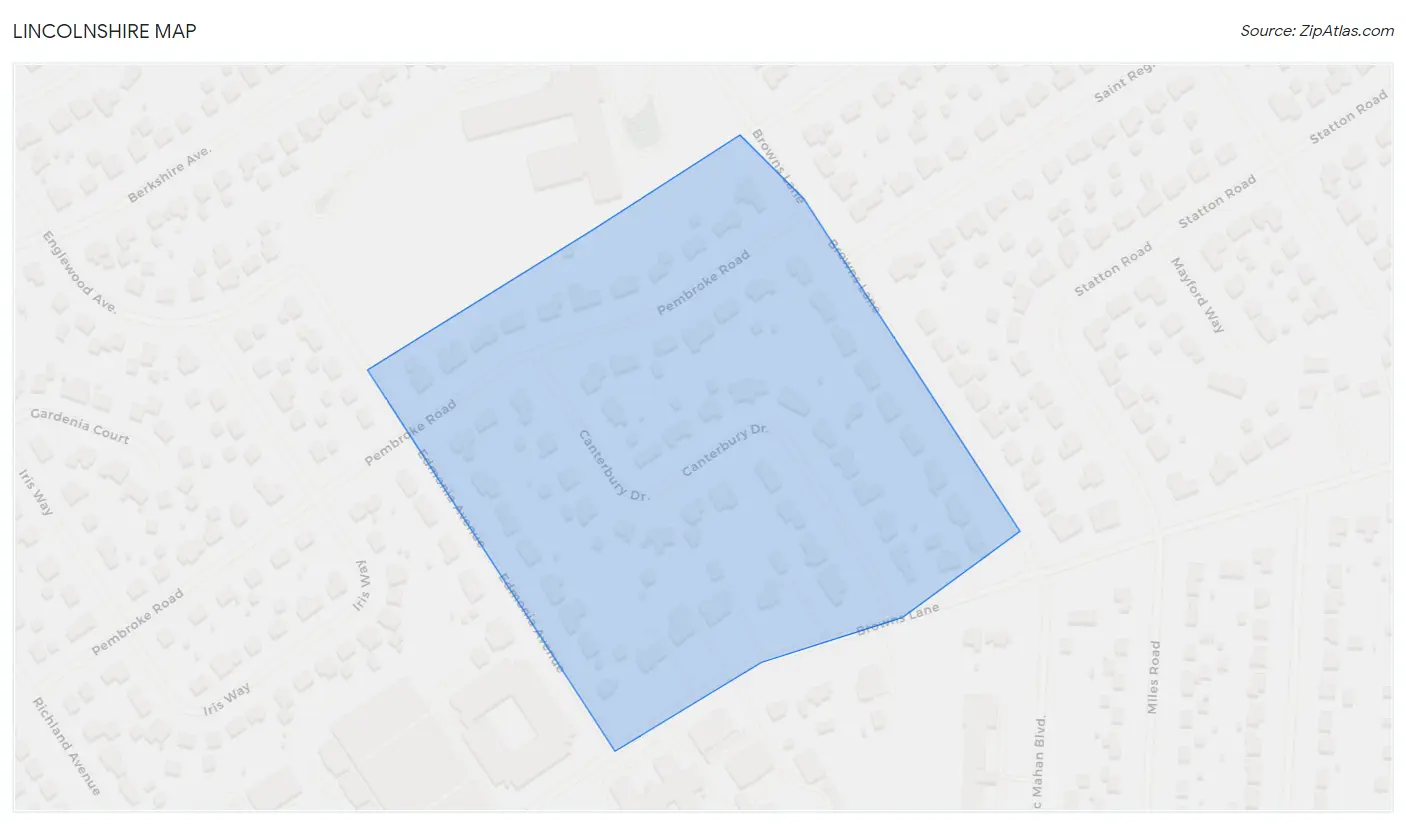
Lincolnshire Overview
$43,984
PER CAPITA INCOME
$115,000
AVG FAMILY INCOME
$93,750
AVG HOUSEHOLD INCOME
0.36
INEQUALITY / GINI INDEX
105
TOTAL POPULATION
58
MALE POPULATION
47
FEMALE POPULATION
123.40
MALES / 100 FEMALES
81.03
FEMALES / 100 MALES
51.4
MEDIAN AGE
2.8
AVG FAMILY SIZE
2.4
AVG HOUSEHOLD SIZE
50
LABOR FORCE [ PEOPLE ]
57.5%
PERCENT IN LABOR FORCE
Lincolnshire Area Codes
Income in Lincolnshire
Income Overview in Lincolnshire
Per Capita Income in Lincolnshire is $43,984, while median incomes of families and households are $115,000 and $93,750 respectively.
| Characteristic | Number | Measure |
| Per Capita Income | 105 | $43,984 |
| Median Family Income | 28 | $115,000 |
| Mean Family Income | 28 | $115,236 |
| Median Household Income | 43 | $93,750 |
| Mean Household Income | 43 | $100,705 |
| Income Deficit | 28 | $0 |
| Wage / Income Gap (%) | 105 | 0.00% |
| Wage / Income Gap ($) | 105 | 100.00¢ per $1 |
| Gini / Inequality Index | 105 | 0.36 |
Earnings by Sex in Lincolnshire
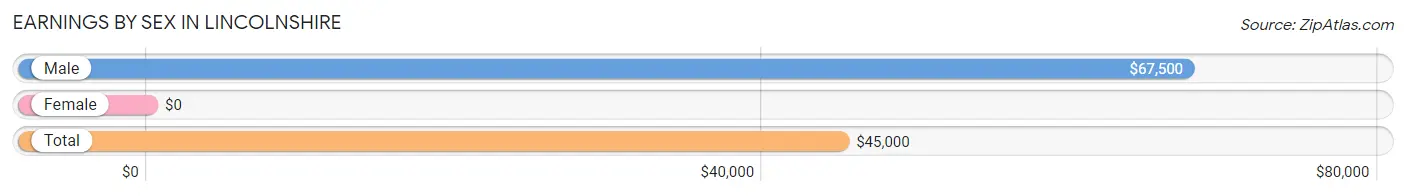
| Sex | Number | Average Earnings |
| Male | 30 (50.0%) | $67,500 |
| Female | 30 (50.0%) | $0 |
| Total | 60 (100.0%) | $45,000 |
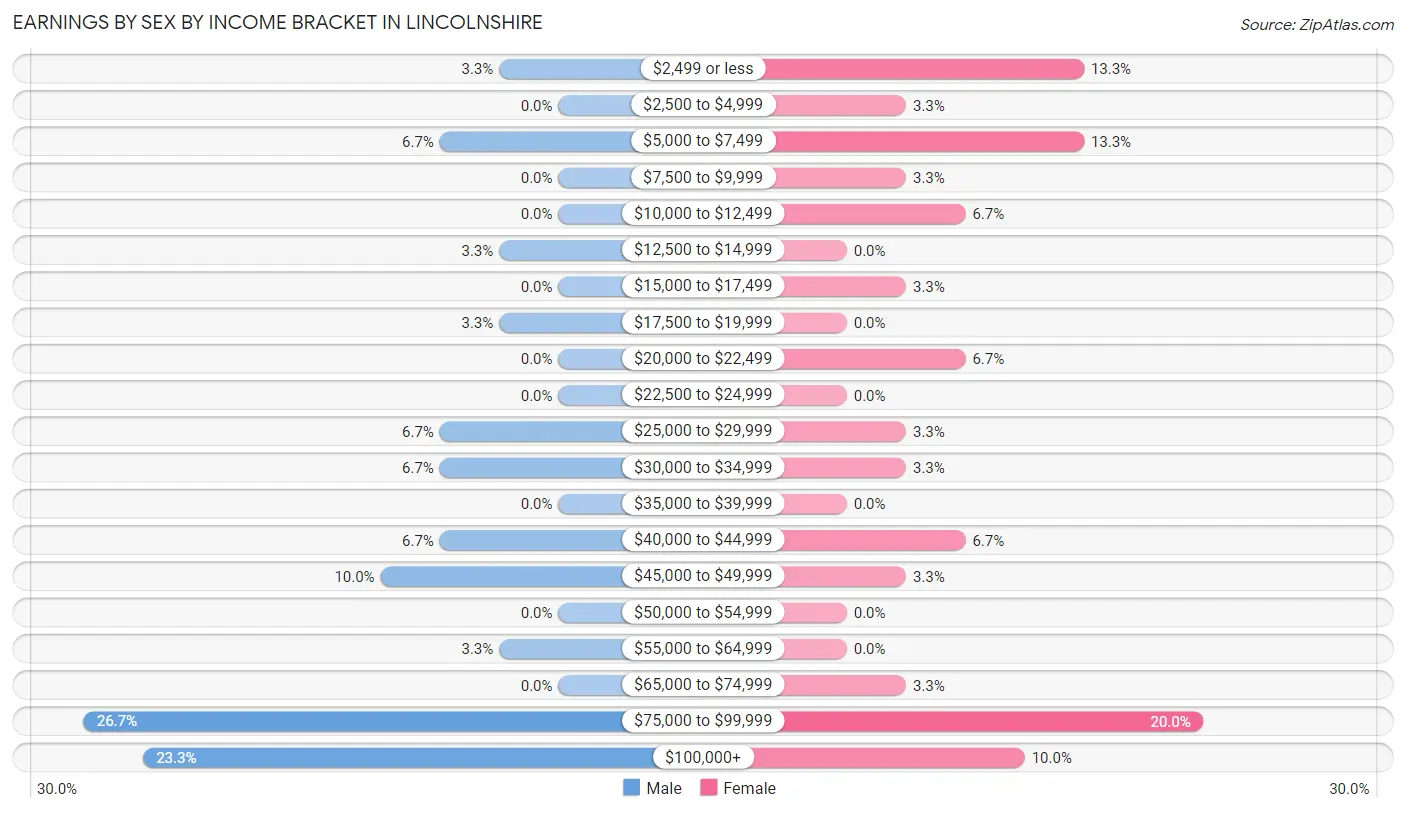
Earnings by Sex by Income Bracket in Lincolnshire
The most common earnings brackets in Lincolnshire are $75,000 to $99,999 for men (8 | 26.7%) and $75,000 to $99,999 for women (6 | 20.0%).
| Income | Male | Female |
| $2,499 or less | 1 (3.3%) | 4 (13.3%) |
| $2,500 to $4,999 | 0 (0.0%) | 1 (3.3%) |
| $5,000 to $7,499 | 2 (6.7%) | 4 (13.3%) |
| $7,500 to $9,999 | 0 (0.0%) | 1 (3.3%) |
| $10,000 to $12,499 | 0 (0.0%) | 2 (6.7%) |
| $12,500 to $14,999 | 1 (3.3%) | 0 (0.0%) |
| $15,000 to $17,499 | 0 (0.0%) | 1 (3.3%) |
| $17,500 to $19,999 | 1 (3.3%) | 0 (0.0%) |
| $20,000 to $22,499 | 0 (0.0%) | 2 (6.7%) |
| $22,500 to $24,999 | 0 (0.0%) | 0 (0.0%) |
| $25,000 to $29,999 | 2 (6.7%) | 1 (3.3%) |
| $30,000 to $34,999 | 2 (6.7%) | 1 (3.3%) |
| $35,000 to $39,999 | 0 (0.0%) | 0 (0.0%) |
| $40,000 to $44,999 | 2 (6.7%) | 2 (6.7%) |
| $45,000 to $49,999 | 3 (10.0%) | 1 (3.3%) |
| $50,000 to $54,999 | 0 (0.0%) | 0 (0.0%) |
| $55,000 to $64,999 | 1 (3.3%) | 0 (0.0%) |
| $65,000 to $74,999 | 0 (0.0%) | 1 (3.3%) |
| $75,000 to $99,999 | 8 (26.7%) | 6 (20.0%) |
| $100,000+ | 7 (23.3%) | 3 (10.0%) |
| Total | 30 (100.0%) | 30 (100.0%) |
Earnings by Sex by Educational Attainment in Lincolnshire
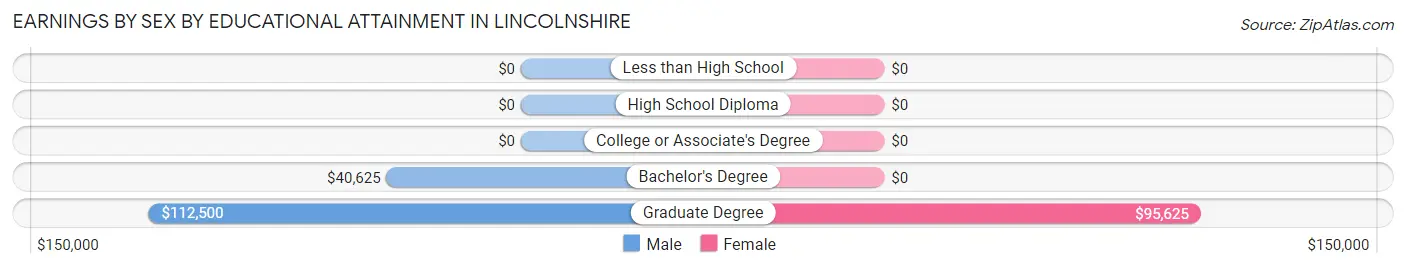
| Educational Attainment | Male Income | Female Income |
| Less than High School | - | - |
| High School Diploma | - | - |
| College or Associate's Degree | - | - |
| Bachelor's Degree | $40,625 | $0 |
| Graduate Degree | $112,500 | $95,625 |
| Total | $67,500 | $0 |
Family Income in Lincolnshire
Family Income Brackets in Lincolnshire
According to the Lincolnshire family income data, there are 7 families falling into the $150,000 to $199,999 income range, which is the most common income bracket and makes up 25.0% of all families.
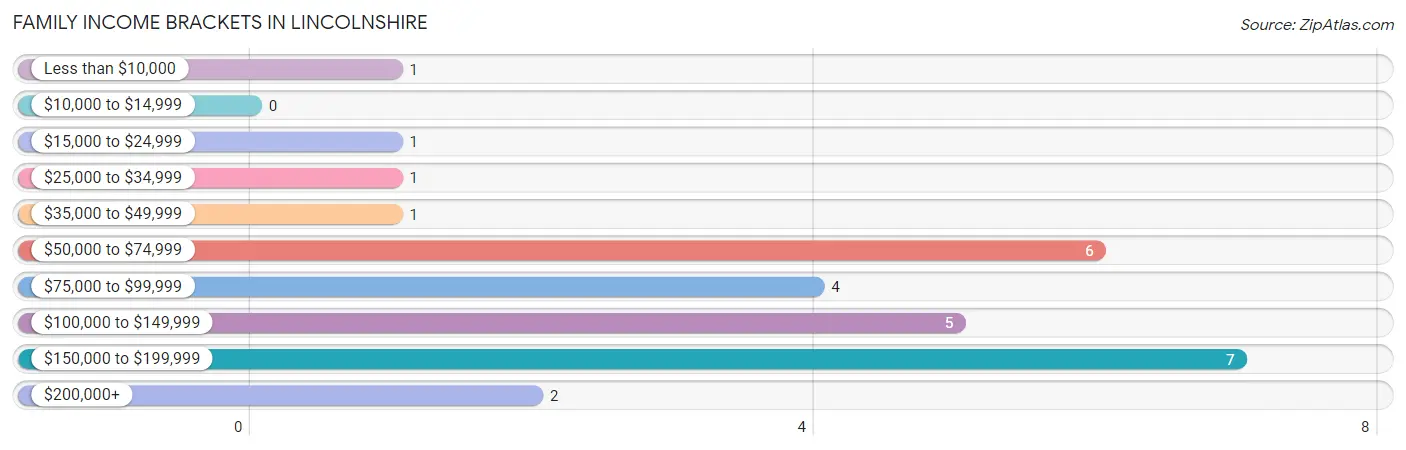
| Income Bracket | # Families | % Families |
| Less than $10,000 | 1 | 3.6% |
| $10,000 to $14,999 | 0 | 0.0% |
| $15,000 to $24,999 | 1 | 3.6% |
| $25,000 to $34,999 | 1 | 3.6% |
| $35,000 to $49,999 | 1 | 3.6% |
| $50,000 to $74,999 | 6 | 21.4% |
| $75,000 to $99,999 | 4 | 14.3% |
| $100,000 to $149,999 | 5 | 17.9% |
| $150,000 to $199,999 | 7 | 25.0% |
| $200,000+ | 2 | 7.1% |
Family Income by Famaliy Size in Lincolnshire
3-person families (4 | 14.3%) account for the highest median family income in Lincolnshire with $203,750 per family, while 3-person families (4 | 14.3%) have the highest median income of $67,917 per family member.
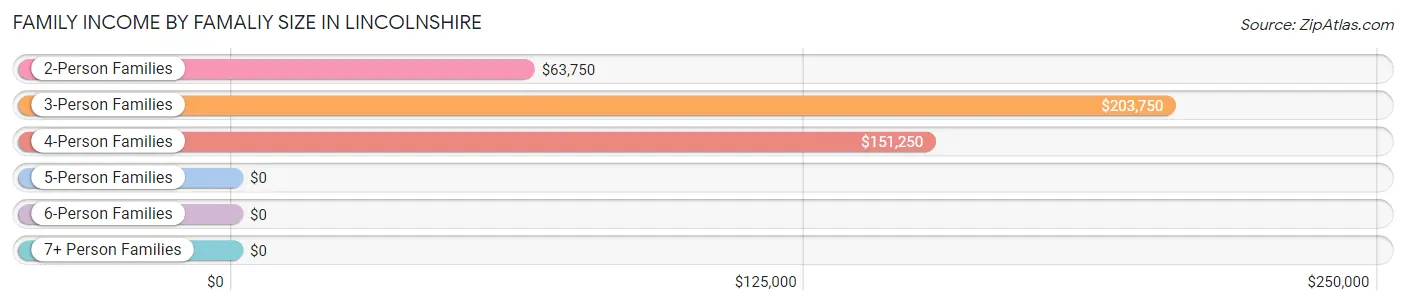
| Income Bracket | # Families | Median Income |
| 2-Person Families | 18 (64.3%) | $63,750 |
| 3-Person Families | 4 (14.3%) | $203,750 |
| 4-Person Families | 6 (21.4%) | $151,250 |
| 5-Person Families | 0 (0.0%) | $0 |
| 6-Person Families | 0 (0.0%) | $0 |
| 7+ Person Families | 0 (0.0%) | $0 |
| Total | 28 (100.0%) | $115,000 |
Family Income by Number of Earners in Lincolnshire
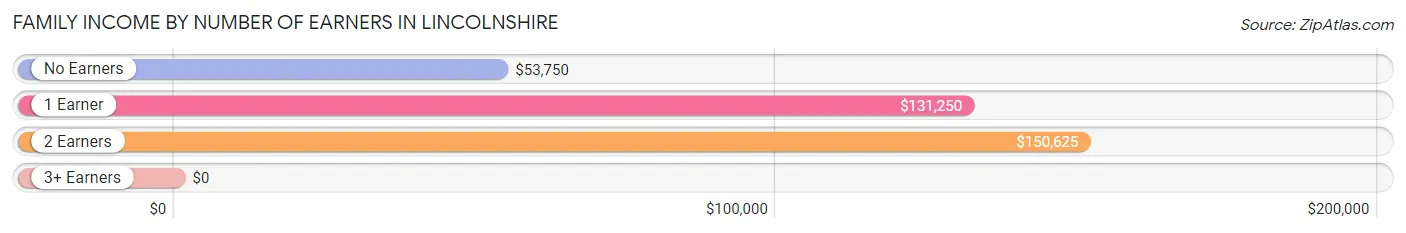
| Number of Earners | # Families | Median Income |
| No Earners | 8 (28.6%) | $53,750 |
| 1 Earner | 5 (17.9%) | $131,250 |
| 2 Earners | 15 (53.6%) | $150,625 |
| 3+ Earners | 0 (0.0%) | $0 |
| Total | 28 (100.0%) | $115,000 |
Household Income in Lincolnshire
Household Income Brackets in Lincolnshire
With 11 households falling in the category, the $100,000 to $149,999 income range is the most frequent in Lincolnshire, accounting for 25.6% of all households. In contrast, only 1 households (2.3%) fall into the $10,000 to $14,999 income bracket, making it the least populous group.
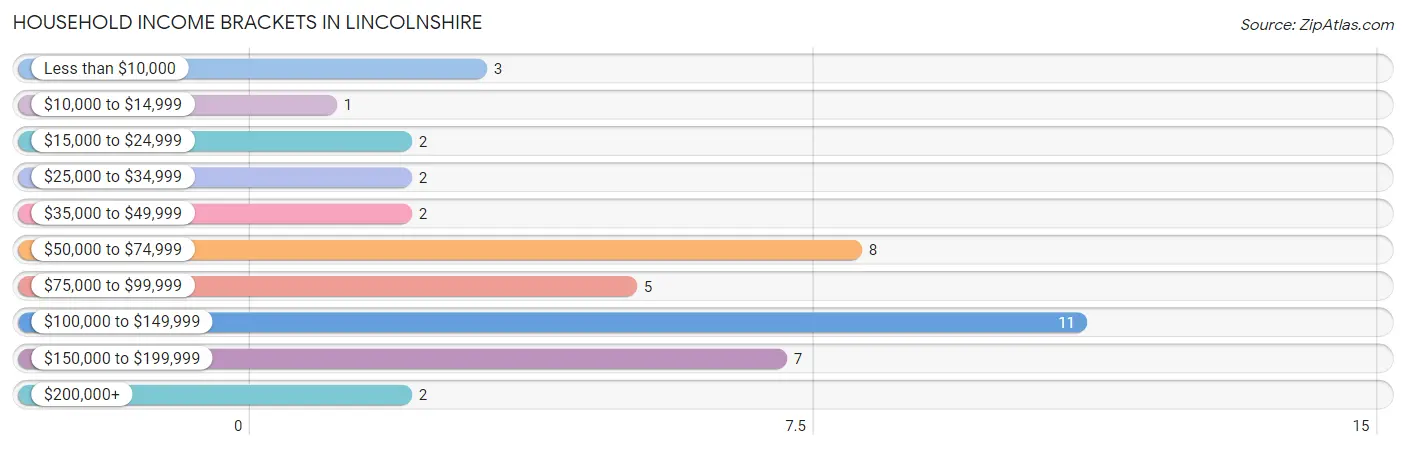
| Income Bracket | # Households | % Households |
| Less than $10,000 | 3 | 7.0% |
| $10,000 to $14,999 | 1 | 2.3% |
| $15,000 to $24,999 | 2 | 4.7% |
| $25,000 to $34,999 | 2 | 4.7% |
| $35,000 to $49,999 | 2 | 4.7% |
| $50,000 to $74,999 | 8 | 18.6% |
| $75,000 to $99,999 | 5 | 11.6% |
| $100,000 to $149,999 | 11 | 25.6% |
| $150,000 to $199,999 | 7 | 16.3% |
| $200,000+ | 2 | 4.7% |
Household Income by Householder Age in Lincolnshire
The median household income in Lincolnshire is $93,750, with the highest median household income of $134,167 found in the 25 to 44 years age bracket for the primary householder. A total of 14 households (32.6%) fall into this category.
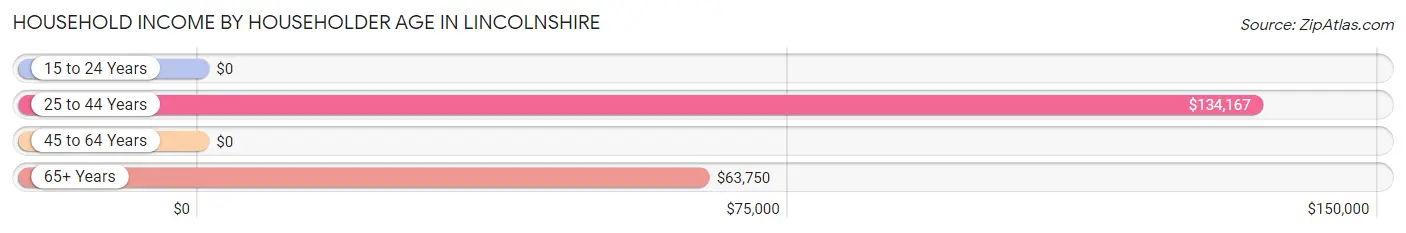
| Income Bracket | # Households | Median Income |
| 15 to 24 Years | 0 (0.0%) | $0 |
| 25 to 44 Years | 14 (32.6%) | $134,167 |
| 45 to 64 Years | 9 (20.9%) | $0 |
| 65+ Years | 20 (46.5%) | $63,750 |
| Total | 43 (100.0%) | $93,750 |
Poverty in Lincolnshire
Income Below Poverty by Sex and Age in Lincolnshire
With 5.2% poverty level for males and 12.8% for females among the residents of Lincolnshire, 45 to 54 year old males and 75 year old and over females are the most vulnerable to poverty, with 2 males (40.0%) and 2 females (25.0%) in their respective age groups living below the poverty level.
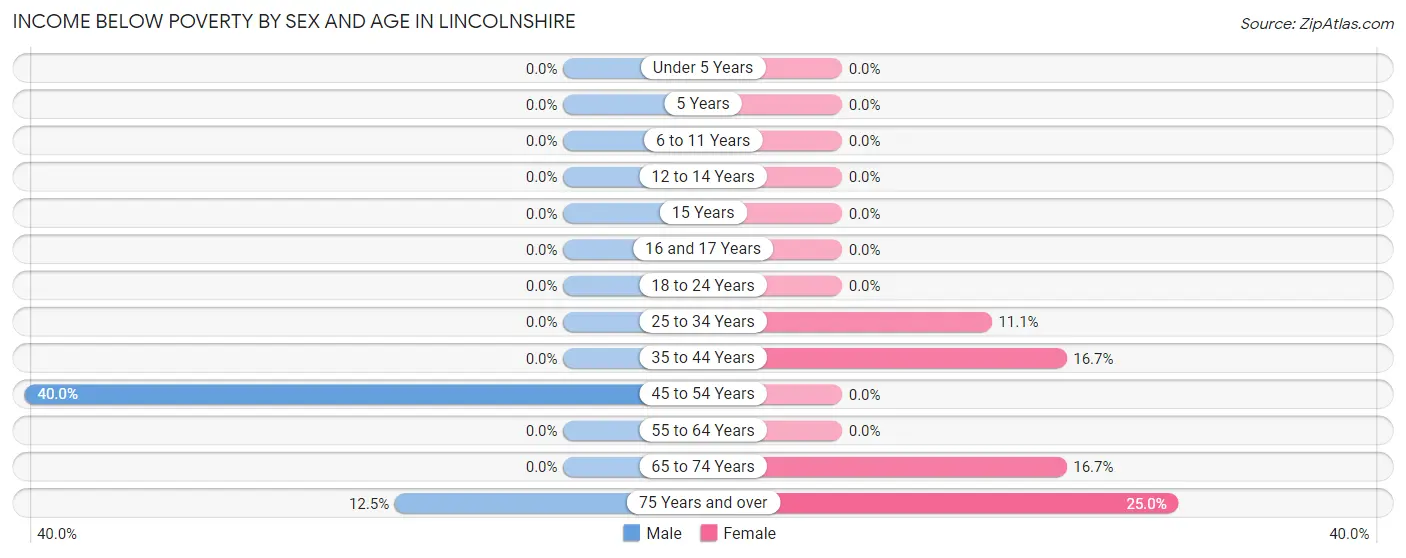
| Age Bracket | Male | Female |
| Under 5 Years | 0 (0.0%) | 0 (0.0%) |
| 5 Years | 0 (0.0%) | 0 (0.0%) |
| 6 to 11 Years | 0 (0.0%) | 0 (0.0%) |
| 12 to 14 Years | 0 (0.0%) | 0 (0.0%) |
| 15 Years | 0 (0.0%) | 0 (0.0%) |
| 16 and 17 Years | 0 (0.0%) | 0 (0.0%) |
| 18 to 24 Years | 0 (0.0%) | 0 (0.0%) |
| 25 to 34 Years | 0 (0.0%) | 1 (11.1%) |
| 35 to 44 Years | 0 (0.0%) | 1 (16.7%) |
| 45 to 54 Years | 2 (40.0%) | 0 (0.0%) |
| 55 to 64 Years | 0 (0.0%) | 0 (0.0%) |
| 65 to 74 Years | 0 (0.0%) | 2 (16.7%) |
| 75 Years and over | 1 (12.5%) | 2 (25.0%) |
| Total | 3 (5.2%) | 6 (12.8%) |
Income Above Poverty by Sex and Age in Lincolnshire
According to the poverty statistics in Lincolnshire, males aged under 5 years and females aged under 5 years are the age groups that are most secure financially, with 100.0% of males and 100.0% of females in these age groups living above the poverty line.
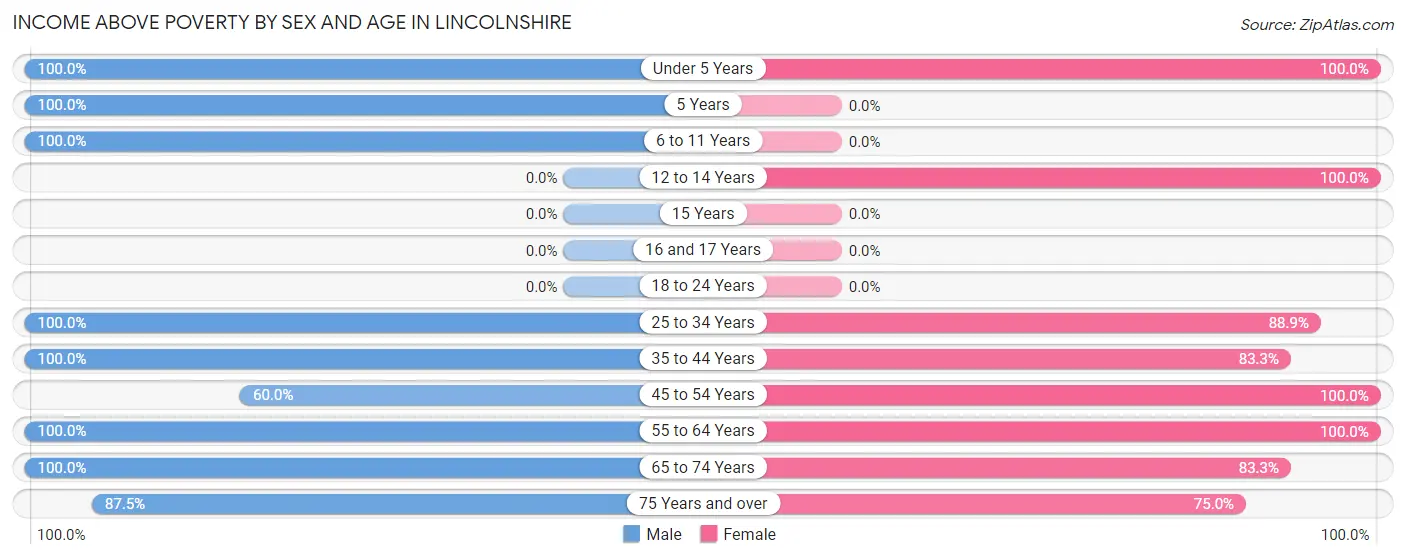
| Age Bracket | Male | Female |
| Under 5 Years | 9 (100.0%) | 1 (100.0%) |
| 5 Years | 2 (100.0%) | 0 (0.0%) |
| 6 to 11 Years | 4 (100.0%) | 0 (0.0%) |
| 12 to 14 Years | 0 (0.0%) | 2 (100.0%) |
| 15 Years | 0 (0.0%) | 0 (0.0%) |
| 16 and 17 Years | 0 (0.0%) | 0 (0.0%) |
| 18 to 24 Years | 0 (0.0%) | 0 (0.0%) |
| 25 to 34 Years | 9 (100.0%) | 8 (88.9%) |
| 35 to 44 Years | 9 (100.0%) | 5 (83.3%) |
| 45 to 54 Years | 3 (60.0%) | 3 (100.0%) |
| 55 to 64 Years | 4 (100.0%) | 6 (100.0%) |
| 65 to 74 Years | 8 (100.0%) | 10 (83.3%) |
| 75 Years and over | 7 (87.5%) | 6 (75.0%) |
| Total | 55 (94.8%) | 41 (87.2%) |
Income Below Poverty Among Married-Couple Families in Lincolnshire
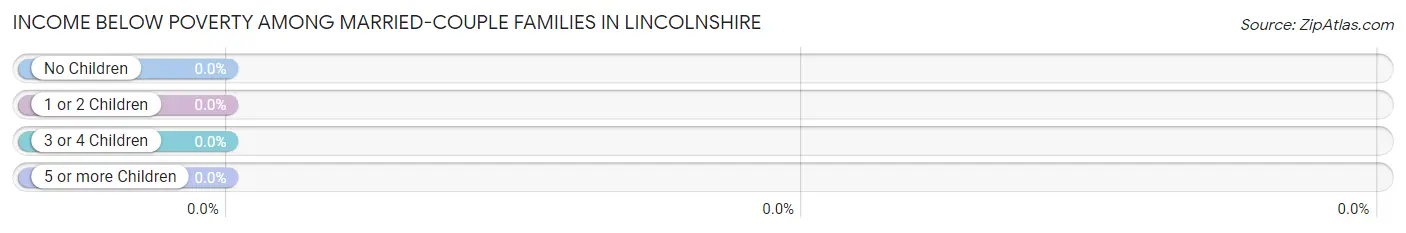
| Children | Above Poverty | Below Poverty |
| No Children | 15 (100.0%) | 0 (0.0%) |
| 1 or 2 Children | 9 (100.0%) | 0 (0.0%) |
| 3 or 4 Children | 0 (0.0%) | 0 (0.0%) |
| 5 or more Children | 0 (0.0%) | 0 (0.0%) |
| Total | 24 (100.0%) | 0 (0.0%) |
Income Below Poverty Among Single-Parent Households in Lincolnshire
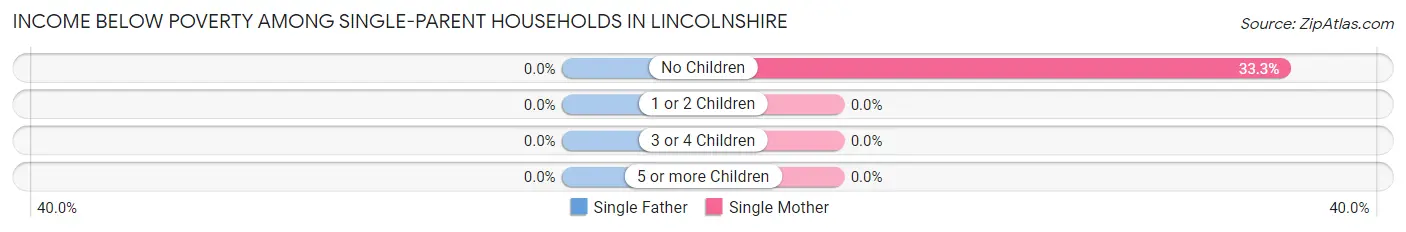
| Children | Single Father | Single Mother |
| No Children | 0 (0.0%) | 1 (33.3%) |
| 1 or 2 Children | 0 (0.0%) | 0 (0.0%) |
| 3 or 4 Children | 0 (0.0%) | 0 (0.0%) |
| 5 or more Children | 0 (0.0%) | 0 (0.0%) |
| Total | 0 (0.0%) | 1 (33.3%) |
Income Below Poverty Among Married-Couple vs Single-Parent Households in Lincolnshire
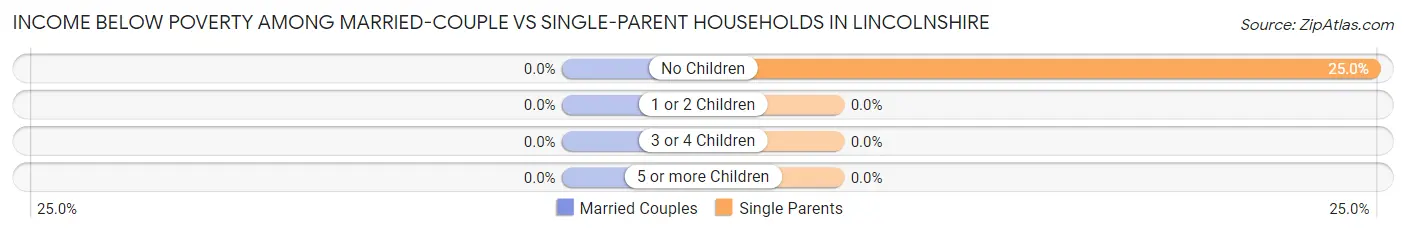
| Children | Married-Couple Families | Single-Parent Households |
| No Children | 0 (0.0%) | 1 (25.0%) |
| 1 or 2 Children | 0 (0.0%) | 0 (0.0%) |
| 3 or 4 Children | 0 (0.0%) | 0 (0.0%) |
| 5 or more Children | 0 (0.0%) | 0 (0.0%) |
| Total | 0 (0.0%) | 1 (25.0%) |
Race in Lincolnshire
The most populous races in Lincolnshire are White / Caucasian (102 | 97.1%), Black / African American (2 | 1.9%), and Two or more Races (1 | 0.9%).
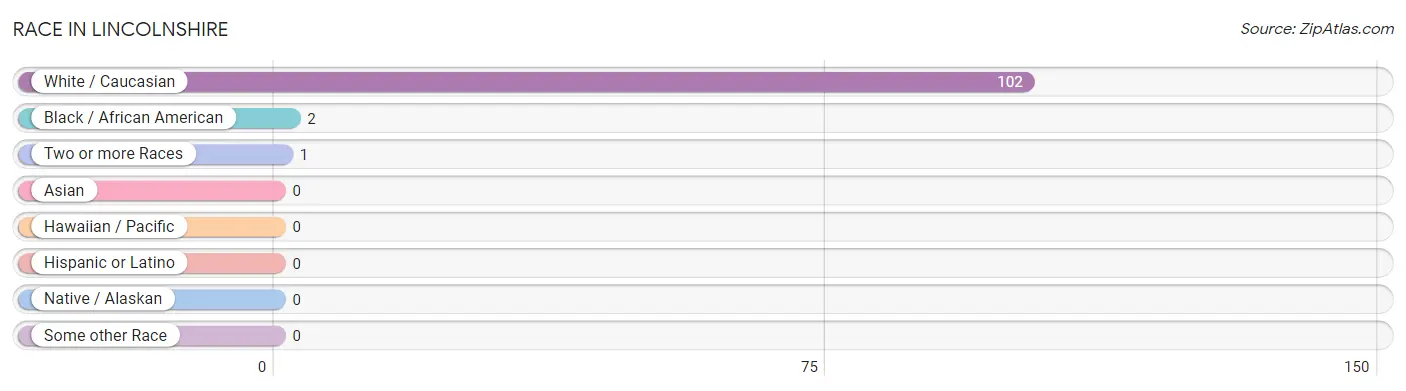
| Race | # Population | % Population |
| Asian | 0 | 0.0% |
| Black / African American | 2 | 1.9% |
| Hawaiian / Pacific | 0 | 0.0% |
| Hispanic or Latino | 0 | 0.0% |
| Native / Alaskan | 0 | 0.0% |
| White / Caucasian | 102 | 97.1% |
| Two or more Races | 1 | 0.9% |
| Some other Race | 0 | 0.0% |
| Total | 105 | 100.0% |
Ancestry in Lincolnshire
The most populous ancestries reported in Lincolnshire are German (35 | 33.3%), Irish (16 | 15.2%), Polish (14 | 13.3%), English (12 | 11.4%), and American (7 | 6.7%), together accounting for 80.0% of all Lincolnshire residents.
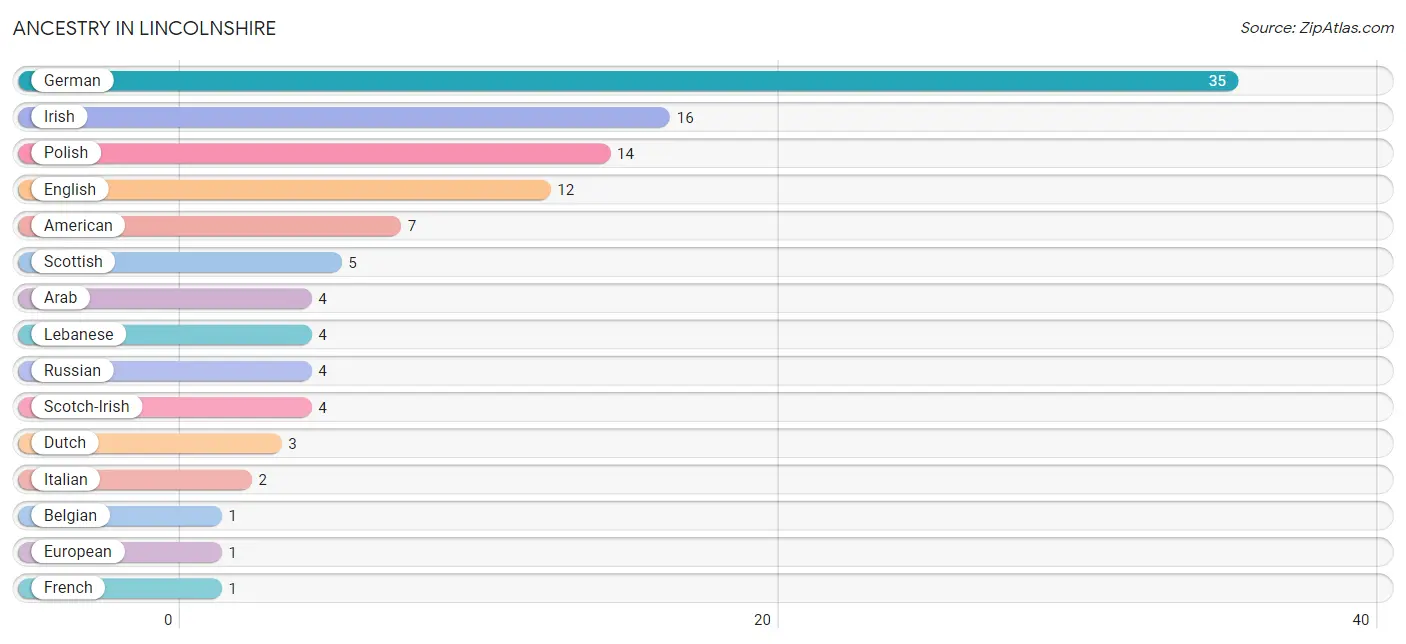
| Ancestry | # Population | % Population |
| American | 7 | 6.7% |
| Arab | 4 | 3.8% |
| Belgian | 1 | 0.9% |
| Dutch | 3 | 2.9% |
| English | 12 | 11.4% |
| European | 1 | 0.9% |
| French | 1 | 0.9% |
| German | 35 | 33.3% |
| Hungarian | 1 | 0.9% |
| Irish | 16 | 15.2% |
| Israeli | 1 | 0.9% |
| Italian | 2 | 1.9% |
| Korean | 1 | 0.9% |
| Lebanese | 4 | 3.8% |
| Norwegian | 1 | 0.9% |
| Polish | 14 | 13.3% |
| Russian | 4 | 3.8% |
| Scotch-Irish | 4 | 3.8% |
| Scottish | 5 | 4.8% |
| Ukrainian | 1 | 0.9% |
| Welsh | 1 | 0.9% | View All 21 Rows |
Immigrants in Lincolnshire
The most numerous immigrant groups reported in Lincolnshire came from Europe (2 | 1.9%), Asia (1 | 0.9%), Belgium (1 | 0.9%), England (1 | 0.9%), and Israel (1 | 0.9%), together accounting for 5.7% of all Lincolnshire residents.
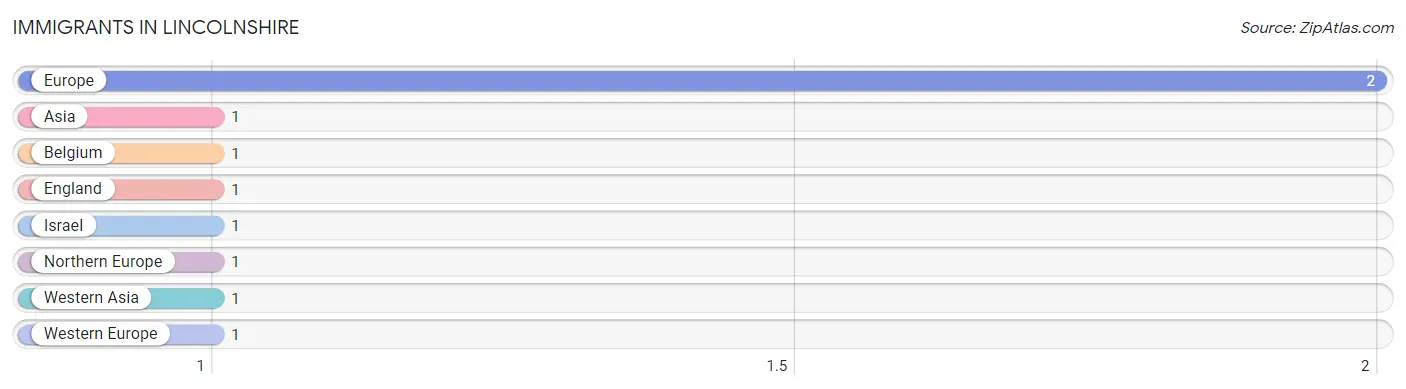
| Immigration Origin | # Population | % Population |
| Asia | 1 | 0.9% |
| Belgium | 1 | 0.9% |
| England | 1 | 0.9% |
| Europe | 2 | 1.9% |
| Israel | 1 | 0.9% |
| Northern Europe | 1 | 0.9% |
| Western Asia | 1 | 0.9% |
| Western Europe | 1 | 0.9% | View All 8 Rows |
Sex and Age in Lincolnshire
Sex and Age in Lincolnshire
The most populous age groups in Lincolnshire are Under 5 Years (9 | 15.5%) for men and 65 to 69 Years (7 | 14.9%) for women.
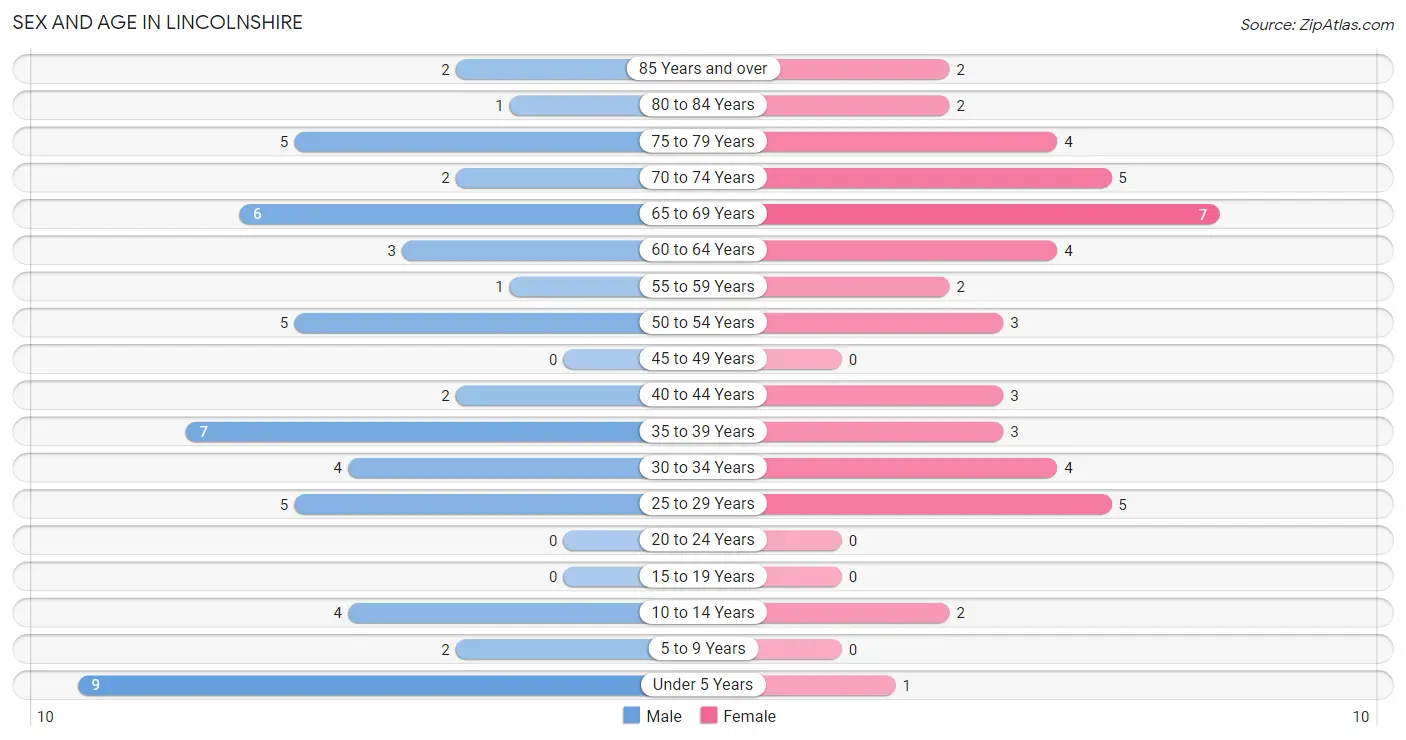
| Age Bracket | Male | Female |
| Under 5 Years | 9 (15.5%) | 1 (2.1%) |
| 5 to 9 Years | 2 (3.5%) | 0 (0.0%) |
| 10 to 14 Years | 4 (6.9%) | 2 (4.3%) |
| 15 to 19 Years | 0 (0.0%) | 0 (0.0%) |
| 20 to 24 Years | 0 (0.0%) | 0 (0.0%) |
| 25 to 29 Years | 5 (8.6%) | 5 (10.6%) |
| 30 to 34 Years | 4 (6.9%) | 4 (8.5%) |
| 35 to 39 Years | 7 (12.1%) | 3 (6.4%) |
| 40 to 44 Years | 2 (3.5%) | 3 (6.4%) |
| 45 to 49 Years | 0 (0.0%) | 0 (0.0%) |
| 50 to 54 Years | 5 (8.6%) | 3 (6.4%) |
| 55 to 59 Years | 1 (1.7%) | 2 (4.3%) |
| 60 to 64 Years | 3 (5.2%) | 4 (8.5%) |
| 65 to 69 Years | 6 (10.3%) | 7 (14.9%) |
| 70 to 74 Years | 2 (3.5%) | 5 (10.6%) |
| 75 to 79 Years | 5 (8.6%) | 4 (8.5%) |
| 80 to 84 Years | 1 (1.7%) | 2 (4.3%) |
| 85 Years and over | 2 (3.5%) | 2 (4.3%) |
| Total | 58 (100.0%) | 47 (100.0%) |
Families and Households in Lincolnshire
Median Family Size in Lincolnshire
The median family size in Lincolnshire is 2.82 persons per family, with married-couple families (24 | 85.7%) accounting for the largest median family size of 2.88 persons per family. On the other hand, single male/father families (1 | 3.6%) represent the smallest median family size with 2.00 persons per family.
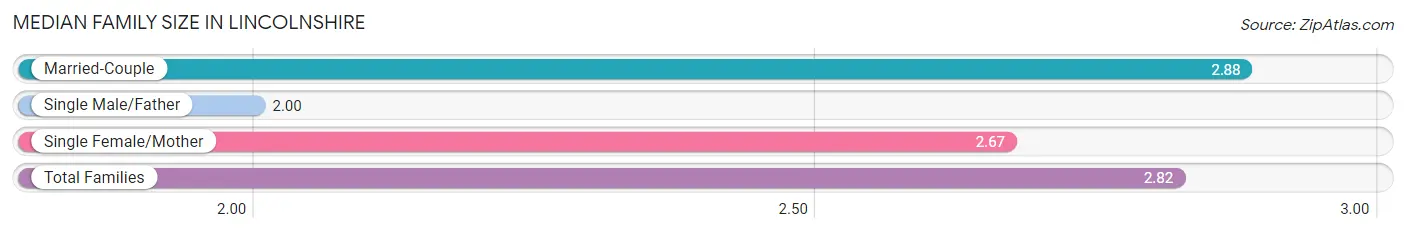
| Family Type | # Families | Family Size |
| Married-Couple | 24 (85.7%) | 2.88 |
| Single Male/Father | 1 (3.6%) | 2.00 |
| Single Female/Mother | 3 (10.7%) | 2.67 |
| Total Families | 28 (100.0%) | 2.82 |
Median Household Size in Lincolnshire
The median household size in Lincolnshire is 2.44 persons per household, with married-couple households (24 | 55.8%) accounting for the largest median household size of 2.92 persons per household. non-family households (15 | 34.9%) represent the smallest median household size with 1.67 persons per household.
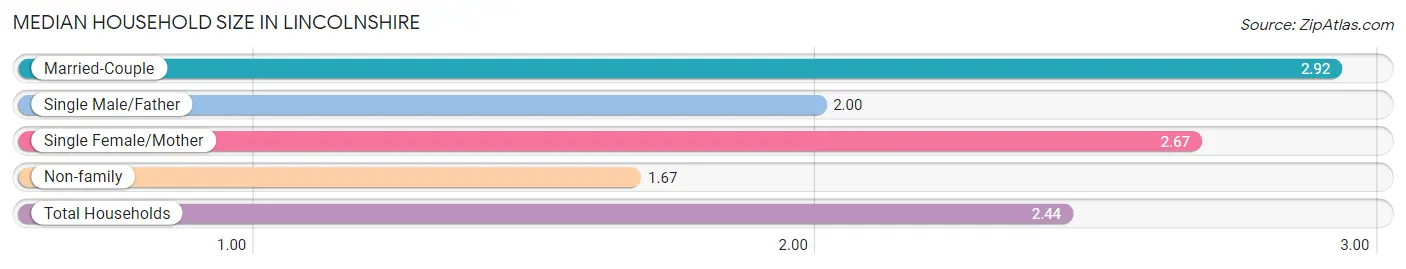
| Household Type | # Households | Household Size |
| Married-Couple | 24 (55.8%) | 2.92 |
| Single Male/Father | 1 (2.3%) | 2.00 |
| Single Female/Mother | 3 (7.0%) | 2.67 |
| Non-family | 15 (34.9%) | 1.67 |
| Total Households | 43 (100.0%) | 2.44 |
Household Size by Marriage Status in Lincolnshire
Out of a total of 43 households in Lincolnshire, 28 (65.1%) are family households, while 15 (34.9%) are nonfamily households. The most numerous type of family households are 2-person households, comprising 17, and the most common type of nonfamily households are 1-person households, comprising 8.
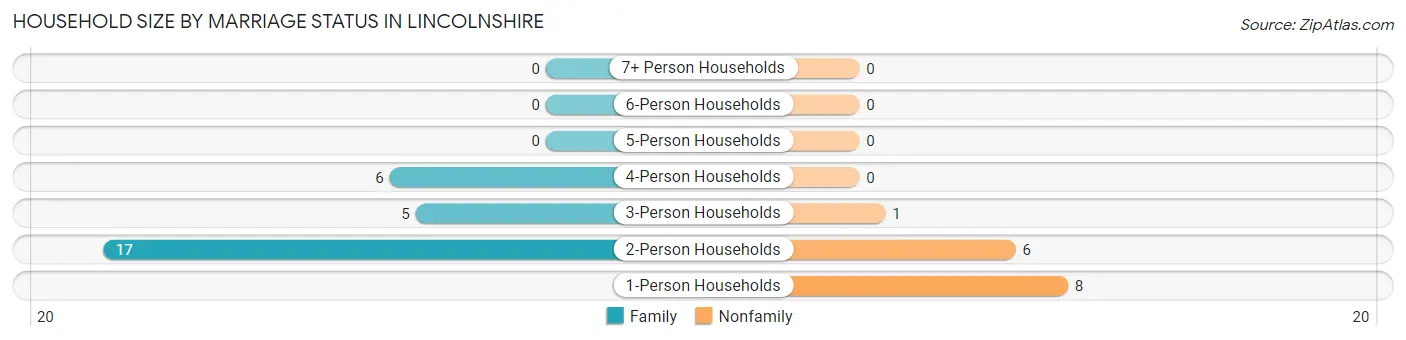
| Household Size | Family Households | Nonfamily Households |
| 1-Person Households | - | 8 (18.6%) |
| 2-Person Households | 17 (39.5%) | 6 (14.0%) |
| 3-Person Households | 5 (11.6%) | 1 (2.3%) |
| 4-Person Households | 6 (14.0%) | 0 (0.0%) |
| 5-Person Households | 0 (0.0%) | 0 (0.0%) |
| 6-Person Households | 0 (0.0%) | 0 (0.0%) |
| 7+ Person Households | 0 (0.0%) | 0 (0.0%) |
| Total | 28 (65.1%) | 15 (34.9%) |
Female Fertility in Lincolnshire
Fertility by Age in Lincolnshire
Average fertility rate in Lincolnshire is 67.0 births per 1,000 women. Women in the age bracket of 20 to 34 years have the highest fertility rate with 111.0 births per 1,000 women. Women in the age bracket of 20 to 34 years acount for 100.0% of all women with births.
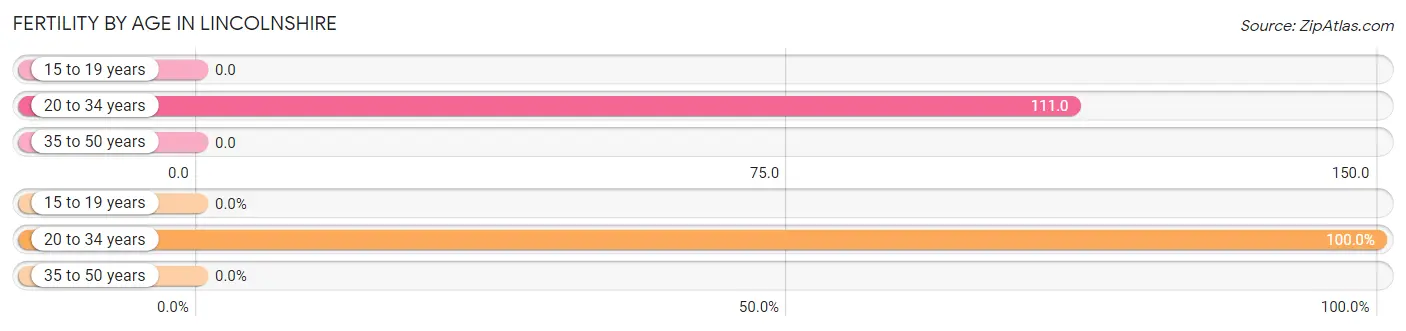
| Age Bracket | Women with Births | Births / 1,000 Women |
| 15 to 19 years | 0 (0.0%) | 0.0 |
| 20 to 34 years | 1 (100.0%) | 111.0 |
| 35 to 50 years | 0 (0.0%) | 0.0 |
| Total | 1 (100.0%) | 67.0 |
Fertility by Age by Marriage Status in Lincolnshire
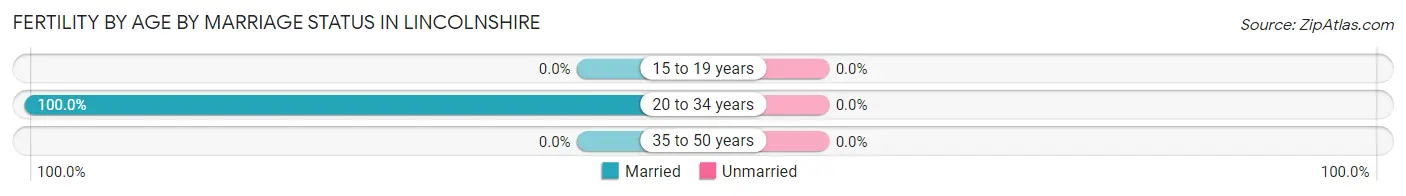
| Age Bracket | Married | Unmarried |
| 15 to 19 years | 0 (0.0%) | 0 (0.0%) |
| 20 to 34 years | 1 (100.0%) | 0 (0.0%) |
| 35 to 50 years | 0 (0.0%) | 0 (0.0%) |
| Total | 1 (100.0%) | 0 (0.0%) |
Fertility by Education in Lincolnshire
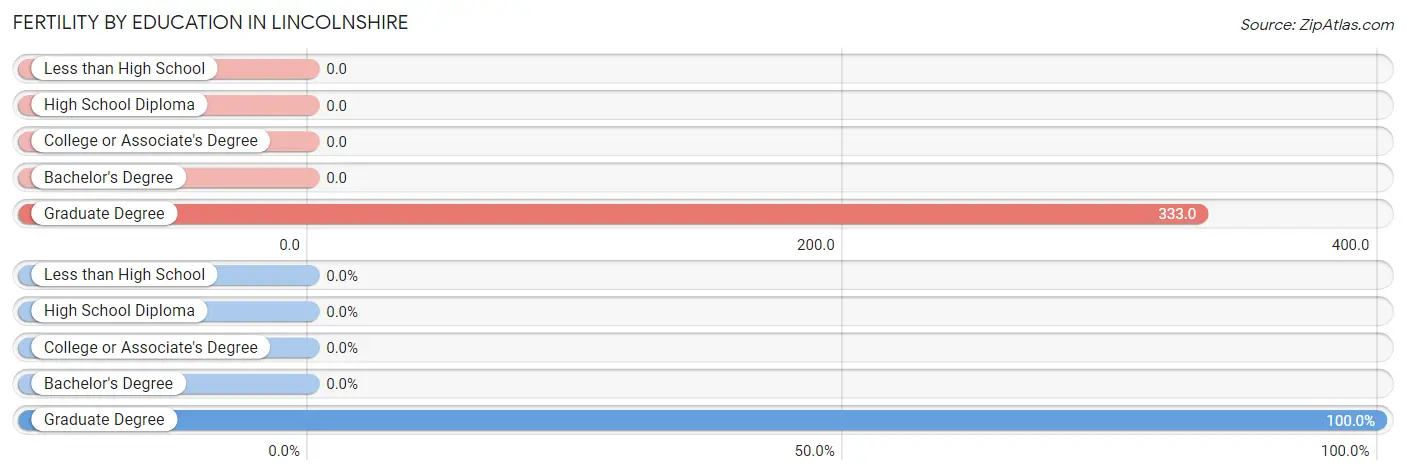
| Educational Attainment | Women with Births | Births / 1,000 Women |
| Less than High School | 0 (0.0%) | 0.0 |
| High School Diploma | 0 (0.0%) | 0.0 |
| College or Associate's Degree | 0 (0.0%) | 0.0 |
| Bachelor's Degree | 0 (0.0%) | 0.0 |
| Graduate Degree | 1 (100.0%) | 333.0 |
| Total | 1 (100.0%) | 67.0 |
Fertility by Education by Marriage Status in Lincolnshire
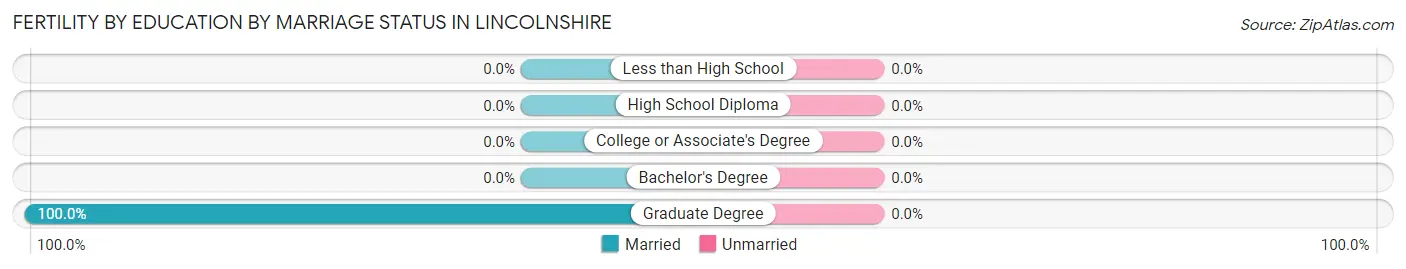
| Educational Attainment | Married | Unmarried |
| Less than High School | 0 (0.0%) | 0 (0.0%) |
| High School Diploma | 0 (0.0%) | 0 (0.0%) |
| College or Associate's Degree | 0 (0.0%) | 0 (0.0%) |
| Bachelor's Degree | 0 (0.0%) | 0 (0.0%) |
| Graduate Degree | 1 (100.0%) | 0 (0.0%) |
| Total | 1 (100.0%) | 0 (0.0%) |
Employment Characteristics in Lincolnshire
Employment by Class of Employer in Lincolnshire
Among the 50 employed individuals in Lincolnshire, private company employees (28 | 56.0%), self-employed (not incorporated) (8 | 16.0%), and local government employees (8 | 16.0%) make up the most common classes of employment.
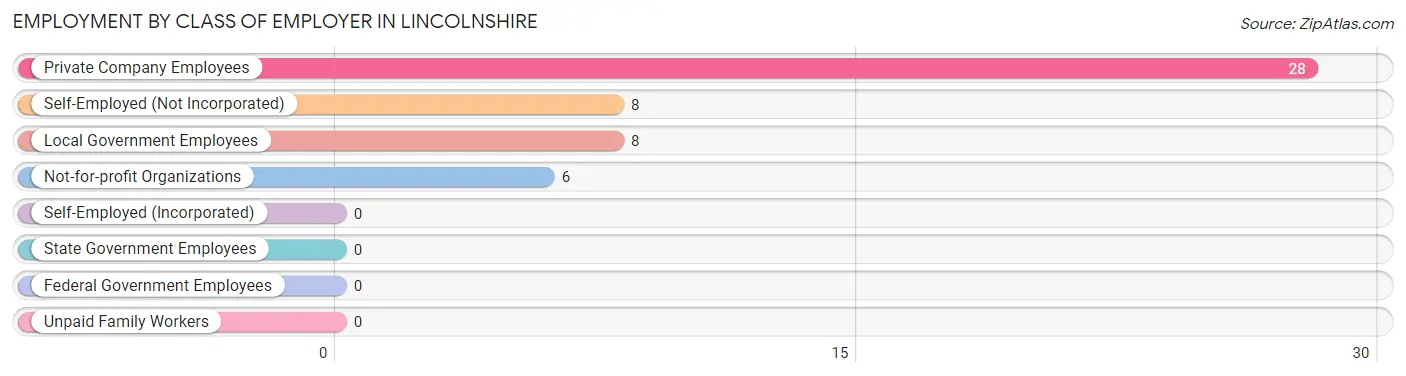
| Employer Class | # Employees | % Employees |
| Private Company Employees | 28 | 56.0% |
| Self-Employed (Incorporated) | 0 | 0.0% |
| Self-Employed (Not Incorporated) | 8 | 16.0% |
| Not-for-profit Organizations | 6 | 12.0% |
| Local Government Employees | 8 | 16.0% |
| State Government Employees | 0 | 0.0% |
| Federal Government Employees | 0 | 0.0% |
| Unpaid Family Workers | 0 | 0.0% |
| Total | 50 | 100.0% |
Employment Status by Age in Lincolnshire
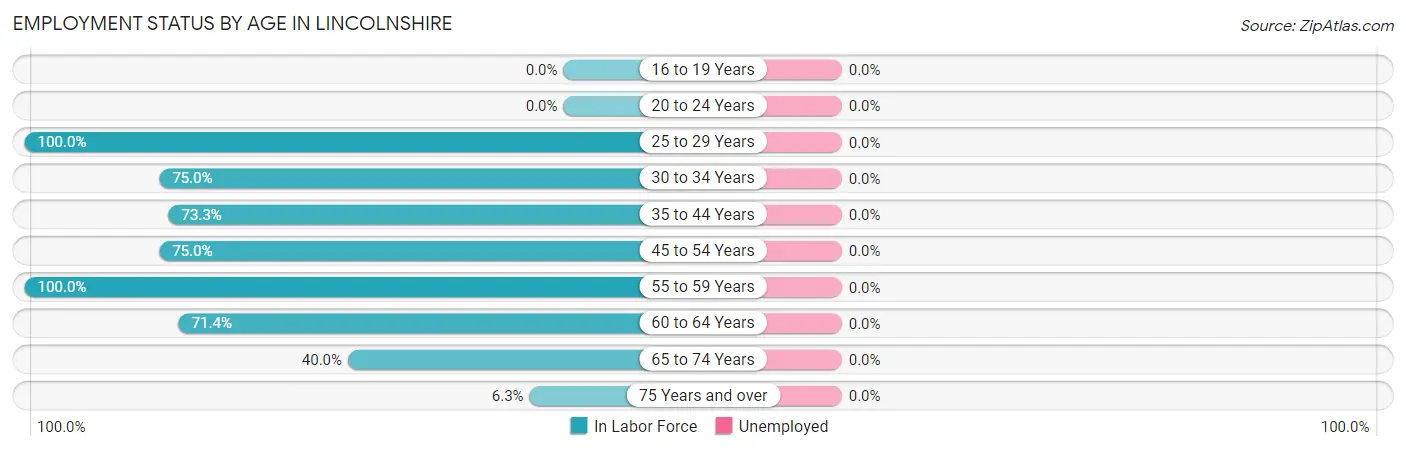
| Age Bracket | In Labor Force | Unemployed |
| 16 to 19 Years | 0 (0.0%) | 0 (0.0%) |
| 20 to 24 Years | 0 (0.0%) | 0 (0.0%) |
| 25 to 29 Years | 10 (100.0%) | 0 (0.0%) |
| 30 to 34 Years | 6 (75.0%) | 0 (0.0%) |
| 35 to 44 Years | 11 (73.3%) | 0 (0.0%) |
| 45 to 54 Years | 6 (75.0%) | 0 (0.0%) |
| 55 to 59 Years | 3 (100.0%) | 0 (0.0%) |
| 60 to 64 Years | 5 (71.4%) | 0 (0.0%) |
| 65 to 74 Years | 8 (40.0%) | 0 (0.0%) |
| 75 Years and over | 1 (6.3%) | 0 (0.0%) |
| Total | 50 (57.5%) | 0 (0.0%) |
Employment Status by Educational Attainment in Lincolnshire
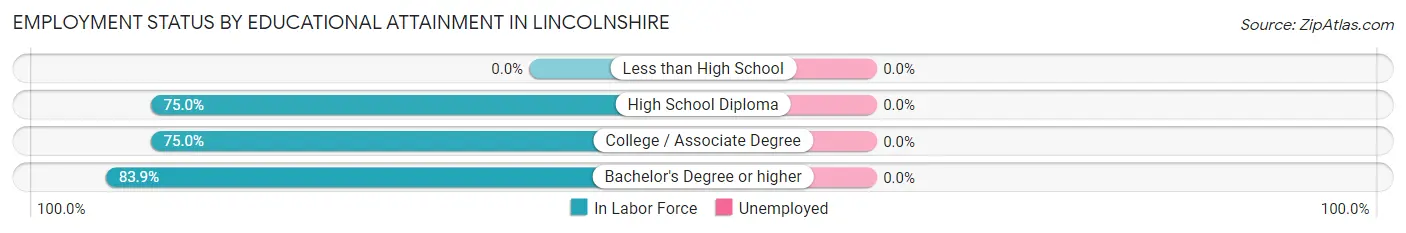
| Educational Attainment | In Labor Force | Unemployed |
| Less than High School | 0 (0.0%) | 0 (0.0%) |
| High School Diploma | 3 (75.0%) | 0 (0.0%) |
| College / Associate Degree | 12 (75.0%) | 0 (0.0%) |
| Bachelor's Degree or higher | 26 (83.9%) | 0 (0.0%) |
| Total | 41 (80.4%) | 0 (0.0%) |
Employment Occupations by Sex in Lincolnshire
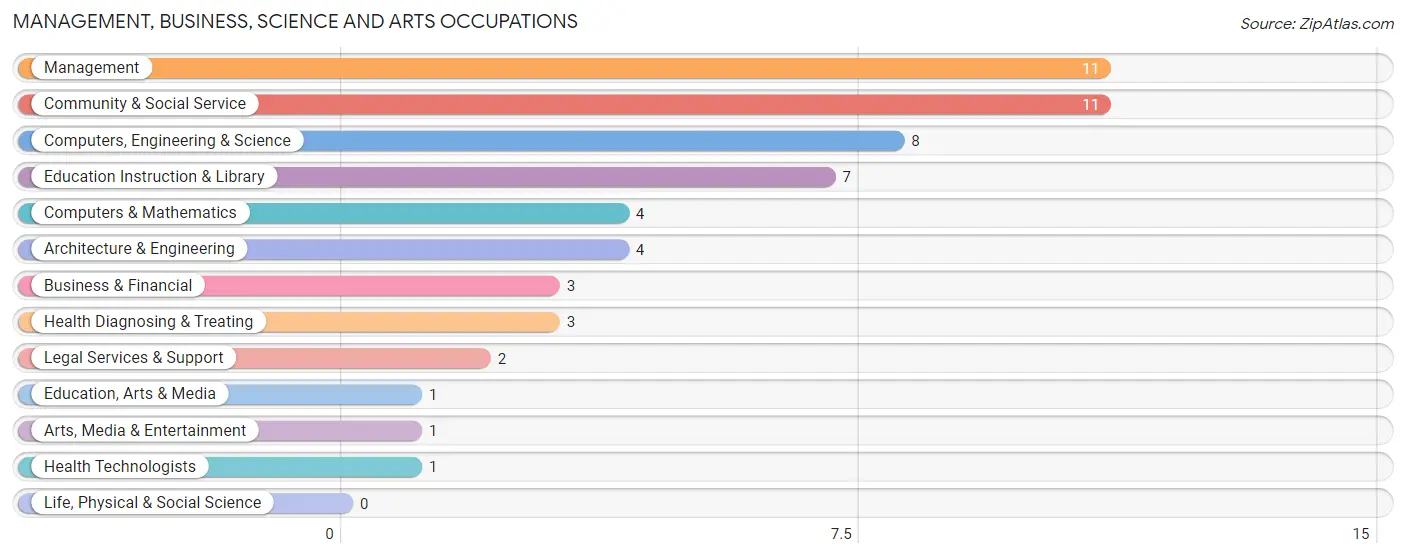
Management, Business, Science and Arts Occupations
The most common Management, Business, Science and Arts occupations in Lincolnshire are Management (11 | 22.0%), Community & Social Service (11 | 22.0%), Computers, Engineering & Science (8 | 16.0%), Education Instruction & Library (7 | 14.0%), and Computers & Mathematics (4 | 8.0%).
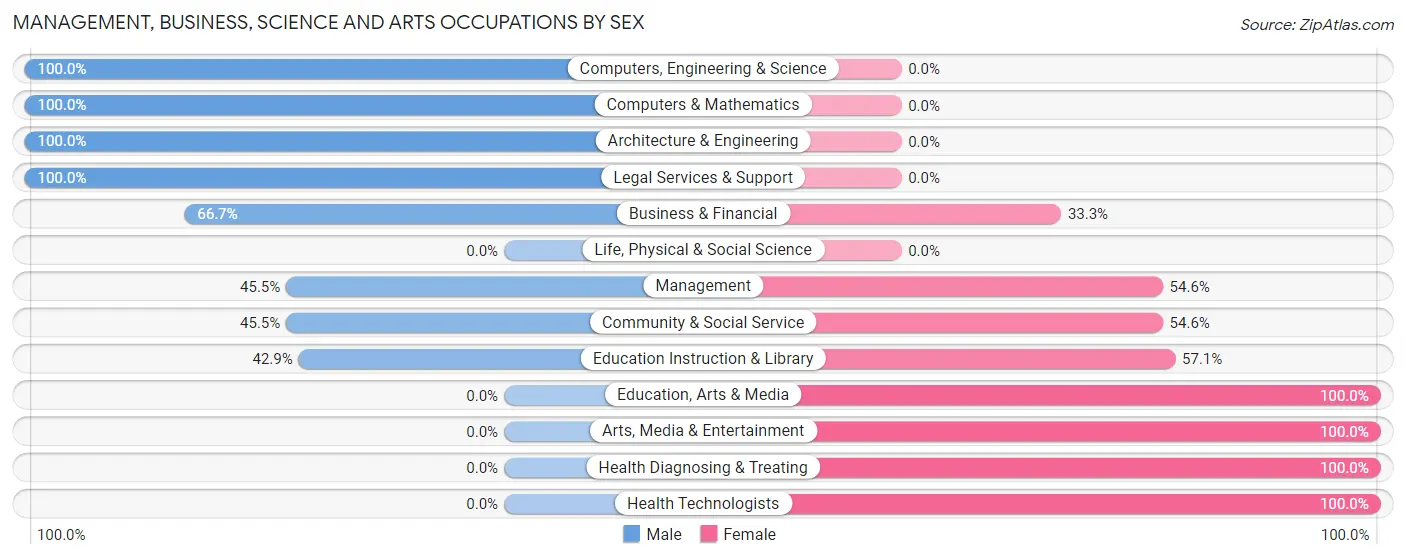
Management, Business, Science and Arts Occupations by Sex
Within the Management, Business, Science and Arts occupations in Lincolnshire, the most male-oriented occupations are Computers, Engineering & Science (100.0%), Computers & Mathematics (100.0%), and Architecture & Engineering (100.0%), while the most female-oriented occupations are Education, Arts & Media (100.0%), Arts, Media & Entertainment (100.0%), and Health Diagnosing & Treating (100.0%).
| Occupation | Male | Female |
| Management | 5 (45.5%) | 6 (54.5%) |
| Business & Financial | 2 (66.7%) | 1 (33.3%) |
| Computers, Engineering & Science | 8 (100.0%) | 0 (0.0%) |
| Computers & Mathematics | 4 (100.0%) | 0 (0.0%) |
| Architecture & Engineering | 4 (100.0%) | 0 (0.0%) |
| Life, Physical & Social Science | 0 (0.0%) | 0 (0.0%) |
| Community & Social Service | 5 (45.5%) | 6 (54.5%) |
| Education, Arts & Media | 0 (0.0%) | 1 (100.0%) |
| Legal Services & Support | 2 (100.0%) | 0 (0.0%) |
| Education Instruction & Library | 3 (42.9%) | 4 (57.1%) |
| Arts, Media & Entertainment | 0 (0.0%) | 1 (100.0%) |
| Health Diagnosing & Treating | 0 (0.0%) | 3 (100.0%) |
| Health Technologists | 0 (0.0%) | 1 (100.0%) |
| Total (Category) | 20 (55.6%) | 16 (44.4%) |
| Total (Overall) | 26 (52.0%) | 24 (48.0%) |
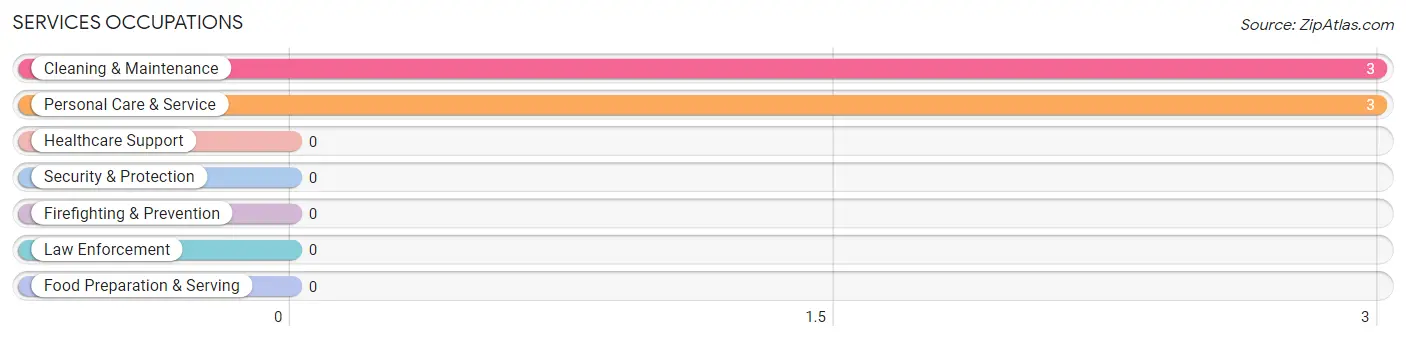
Services Occupations
The most common Services occupations in Lincolnshire are Cleaning & Maintenance (3 | 6.0%), and Personal Care & Service (3 | 6.0%).
Services Occupations by Sex
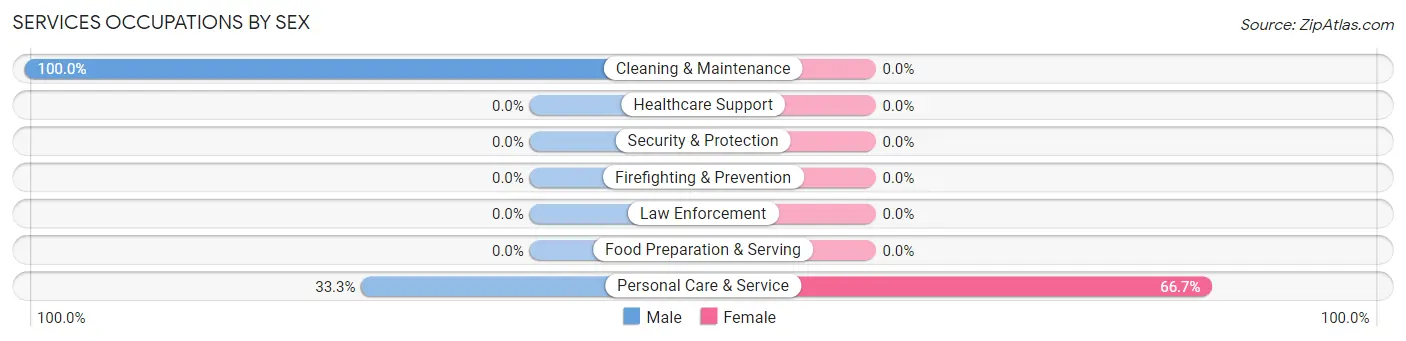
| Occupation | Male | Female |
| Healthcare Support | 0 (0.0%) | 0 (0.0%) |
| Security & Protection | 0 (0.0%) | 0 (0.0%) |
| Firefighting & Prevention | 0 (0.0%) | 0 (0.0%) |
| Law Enforcement | 0 (0.0%) | 0 (0.0%) |
| Food Preparation & Serving | 0 (0.0%) | 0 (0.0%) |
| Cleaning & Maintenance | 3 (100.0%) | 0 (0.0%) |
| Personal Care & Service | 1 (33.3%) | 2 (66.7%) |
| Total (Category) | 4 (66.7%) | 2 (33.3%) |
| Total (Overall) | 26 (52.0%) | 24 (48.0%) |
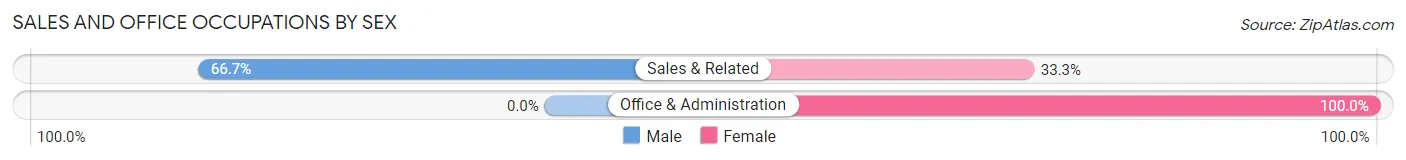
Sales and Office Occupations
The most common Sales and Office occupations in Lincolnshire are Office & Administration (5 | 10.0%), and Sales & Related (3 | 6.0%).
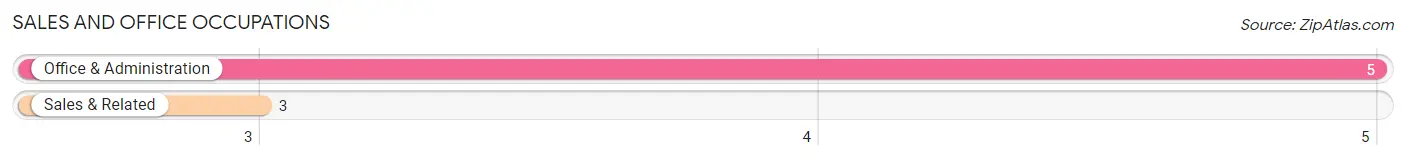
Sales and Office Occupations by Sex
| Occupation | Male | Female |
| Sales & Related | 2 (66.7%) | 1 (33.3%) |
| Office & Administration | 0 (0.0%) | 5 (100.0%) |
| Total (Category) | 2 (25.0%) | 6 (75.0%) |
| Total (Overall) | 26 (52.0%) | 24 (48.0%) |
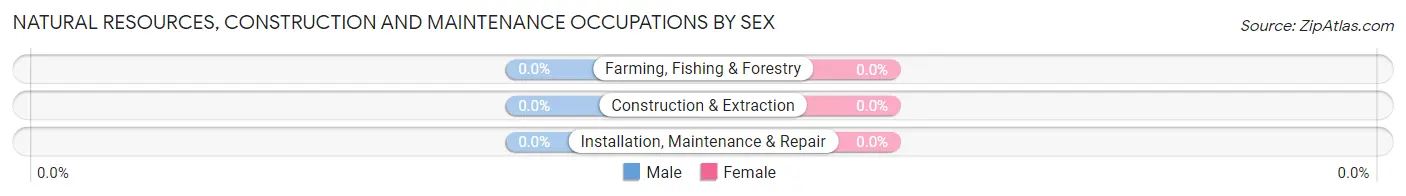
Natural Resources, Construction and Maintenance Occupations
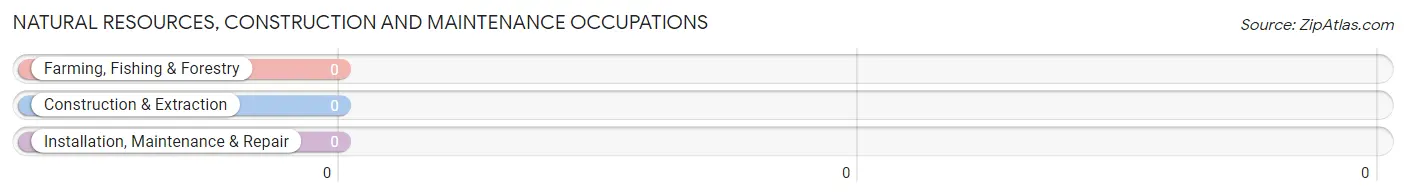
Natural Resources, Construction and Maintenance Occupations by Sex
| Occupation | Male | Female |
| Farming, Fishing & Forestry | 0 (0.0%) | 0 (0.0%) |
| Construction & Extraction | 0 (0.0%) | 0 (0.0%) |
| Installation, Maintenance & Repair | 0 (0.0%) | 0 (0.0%) |
| Total (Category) | 0 (0.0%) | 0 (0.0%) |
| Total (Overall) | 26 (52.0%) | 24 (48.0%) |
Production, Transportation and Moving Occupations
Production, Transportation and Moving Occupations by Sex
| Occupation | Male | Female |
| Production | 0 (0.0%) | 0 (0.0%) |
| Transportation | 0 (0.0%) | 0 (0.0%) |
| Material Moving | 0 (0.0%) | 0 (0.0%) |
| Total (Category) | 0 (0.0%) | 0 (0.0%) |
| Total (Overall) | 26 (52.0%) | 24 (48.0%) |
Employment Industries by Sex in Lincolnshire
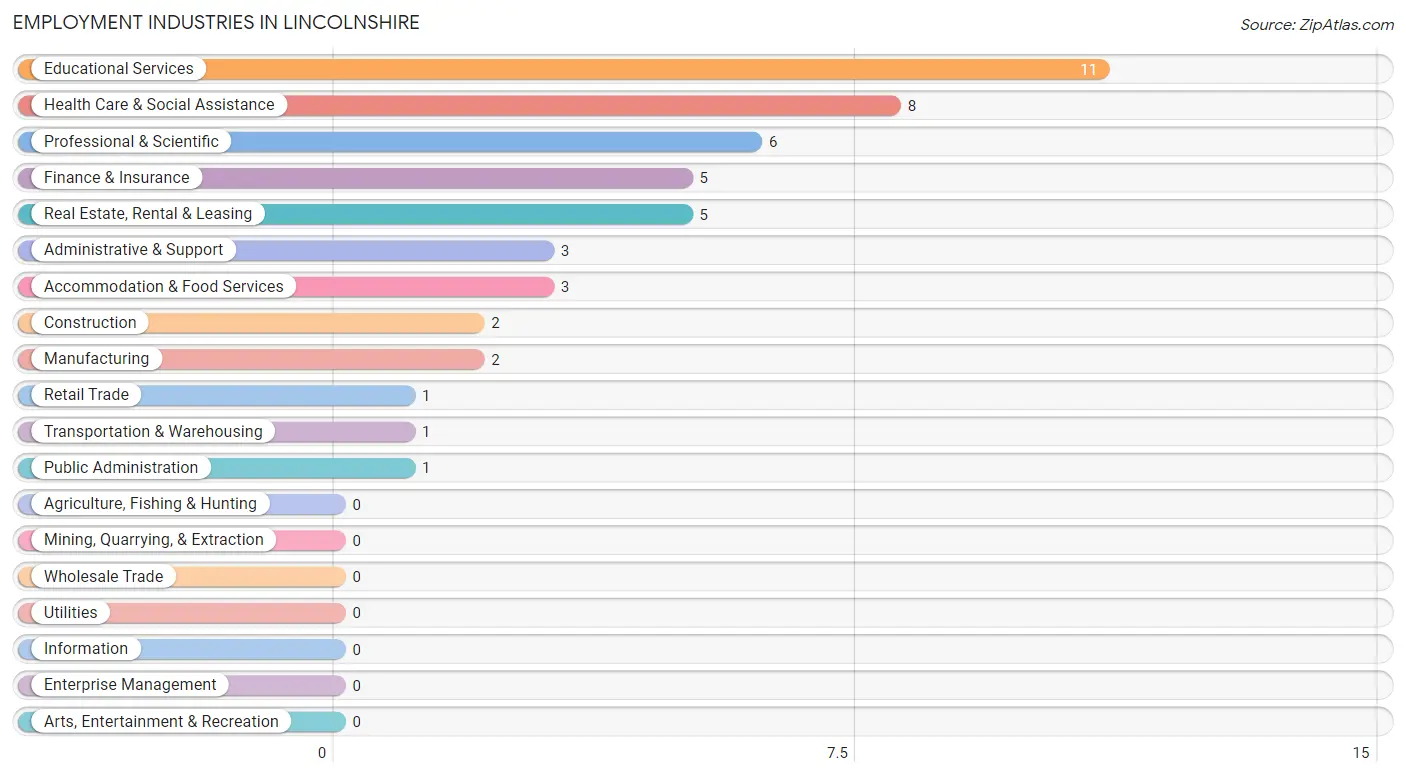
Employment Industries in Lincolnshire
The major employment industries in Lincolnshire include Educational Services (11 | 22.0%), Health Care & Social Assistance (8 | 16.0%), Professional & Scientific (6 | 12.0%), Finance & Insurance (5 | 10.0%), and Real Estate, Rental & Leasing (5 | 10.0%).
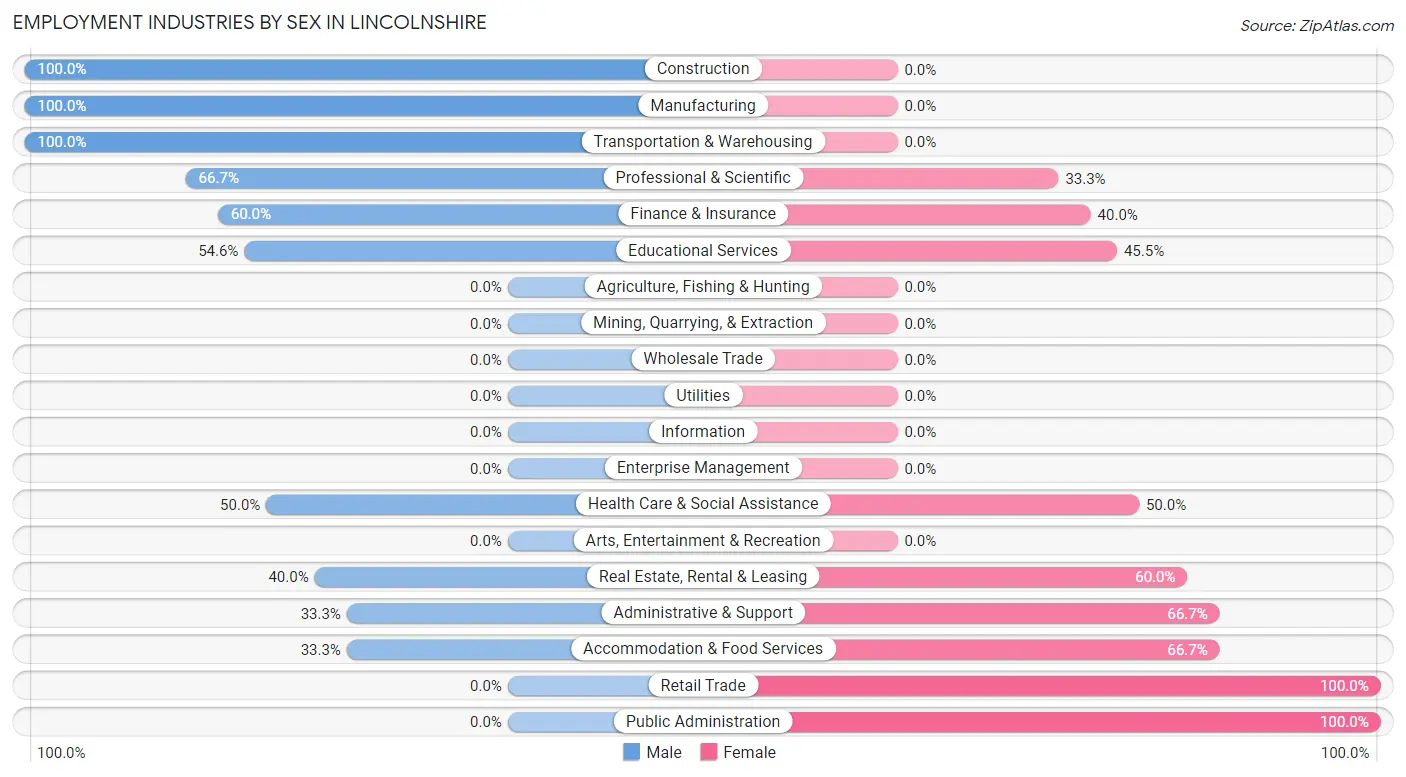
Employment Industries by Sex in Lincolnshire
The Lincolnshire industries that see more men than women are Construction (100.0%), Manufacturing (100.0%), and Transportation & Warehousing (100.0%), whereas the industries that tend to have a higher number of women are Retail Trade (100.0%), Public Administration (100.0%), and Administrative & Support (66.7%).
| Industry | Male | Female |
| Agriculture, Fishing & Hunting | 0 (0.0%) | 0 (0.0%) |
| Mining, Quarrying, & Extraction | 0 (0.0%) | 0 (0.0%) |
| Construction | 2 (100.0%) | 0 (0.0%) |
| Manufacturing | 2 (100.0%) | 0 (0.0%) |
| Wholesale Trade | 0 (0.0%) | 0 (0.0%) |
| Retail Trade | 0 (0.0%) | 1 (100.0%) |
| Transportation & Warehousing | 1 (100.0%) | 0 (0.0%) |
| Utilities | 0 (0.0%) | 0 (0.0%) |
| Information | 0 (0.0%) | 0 (0.0%) |
| Finance & Insurance | 3 (60.0%) | 2 (40.0%) |
| Real Estate, Rental & Leasing | 2 (40.0%) | 3 (60.0%) |
| Professional & Scientific | 4 (66.7%) | 2 (33.3%) |
| Enterprise Management | 0 (0.0%) | 0 (0.0%) |
| Administrative & Support | 1 (33.3%) | 2 (66.7%) |
| Educational Services | 6 (54.5%) | 5 (45.5%) |
| Health Care & Social Assistance | 4 (50.0%) | 4 (50.0%) |
| Arts, Entertainment & Recreation | 0 (0.0%) | 0 (0.0%) |
| Accommodation & Food Services | 1 (33.3%) | 2 (66.7%) |
| Public Administration | 0 (0.0%) | 1 (100.0%) |
| Total | 26 (52.0%) | 24 (48.0%) |
Education in Lincolnshire
School Enrollment in Lincolnshire
The most common levels of schooling among the 11 students in Lincolnshire are middle school (4 | 36.4%), nursery / preschool (2 | 18.2%), and high school (2 | 18.2%).
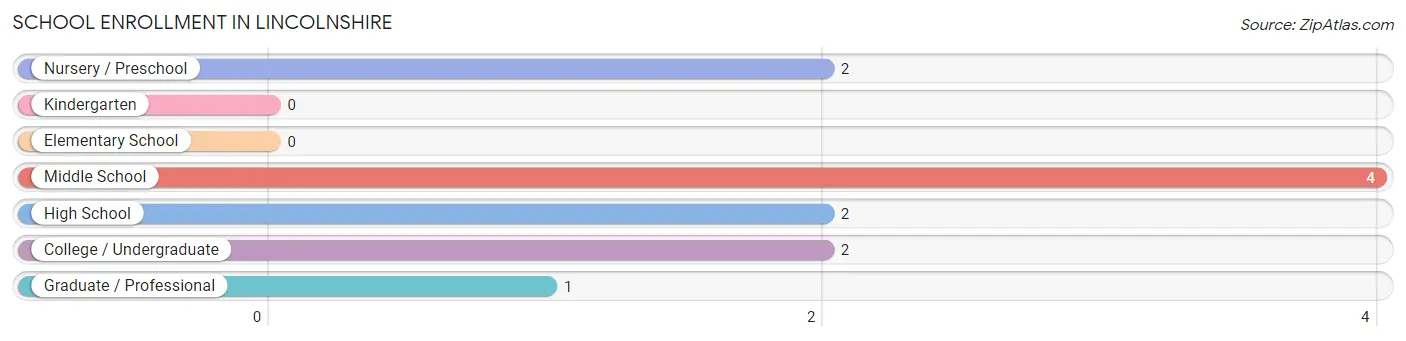
| School Level | # Students | % Students |
| Nursery / Preschool | 2 | 18.2% |
| Kindergarten | 0 | 0.0% |
| Elementary School | 0 | 0.0% |
| Middle School | 4 | 36.4% |
| High School | 2 | 18.2% |
| College / Undergraduate | 2 | 18.2% |
| Graduate / Professional | 1 | 9.1% |
| Total | 11 | 100.0% |
School Enrollment by Age by Funding Source in Lincolnshire
Out of a total of 11 students who are enrolled in schools in Lincolnshire, 6 (54.5%) attend a private institution, while the remaining 5 (45.5%) are enrolled in public schools. The age group of 5 to 9 year old has the highest likelihood of being enrolled in private schools, with 2 (100.0% in the age bracket) enrolled. Conversely, the age group of 10 to 14 year olds has the lowest likelihood of being enrolled in a private school, with 4 (66.7% in the age bracket) attending a public institution.
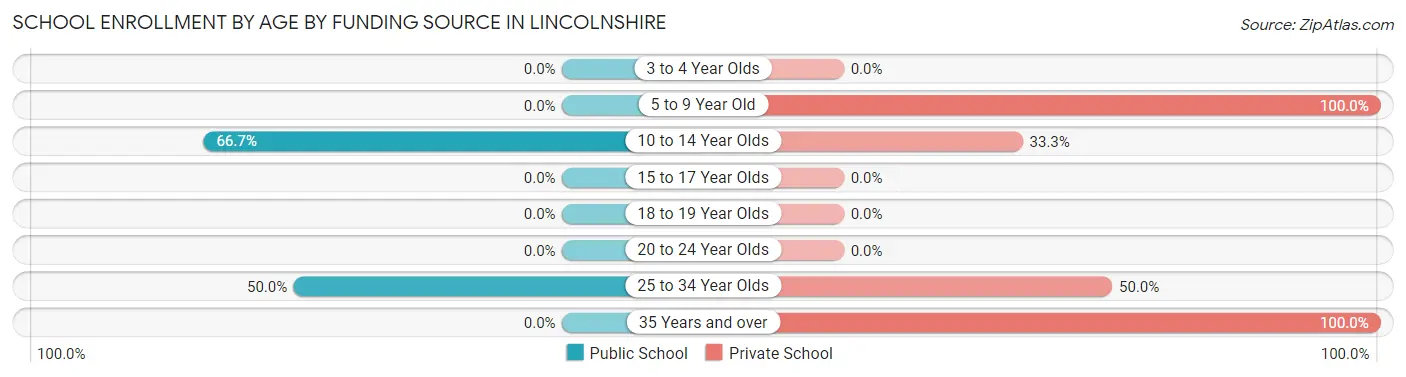
| Age Bracket | Public School | Private School |
| 3 to 4 Year Olds | 0 (0.0%) | 0 (0.0%) |
| 5 to 9 Year Old | 0 (0.0%) | 2 (100.0%) |
| 10 to 14 Year Olds | 4 (66.7%) | 2 (33.3%) |
| 15 to 17 Year Olds | 0 (0.0%) | 0 (0.0%) |
| 18 to 19 Year Olds | 0 (0.0%) | 0 (0.0%) |
| 20 to 24 Year Olds | 0 (0.0%) | 0 (0.0%) |
| 25 to 34 Year Olds | 1 (50.0%) | 1 (50.0%) |
| 35 Years and over | 0 (0.0%) | 1 (100.0%) |
| Total | 5 (45.5%) | 6 (54.5%) |
Educational Attainment by Field of Study in Lincolnshire
Education (12 | 24.0%), business (9 | 18.0%), computers & mathematics (4 | 8.0%), psychology (3 | 6.0%), and social sciences (3 | 6.0%) are the most common fields of study among 50 individuals in Lincolnshire who have obtained a bachelor's degree or higher.
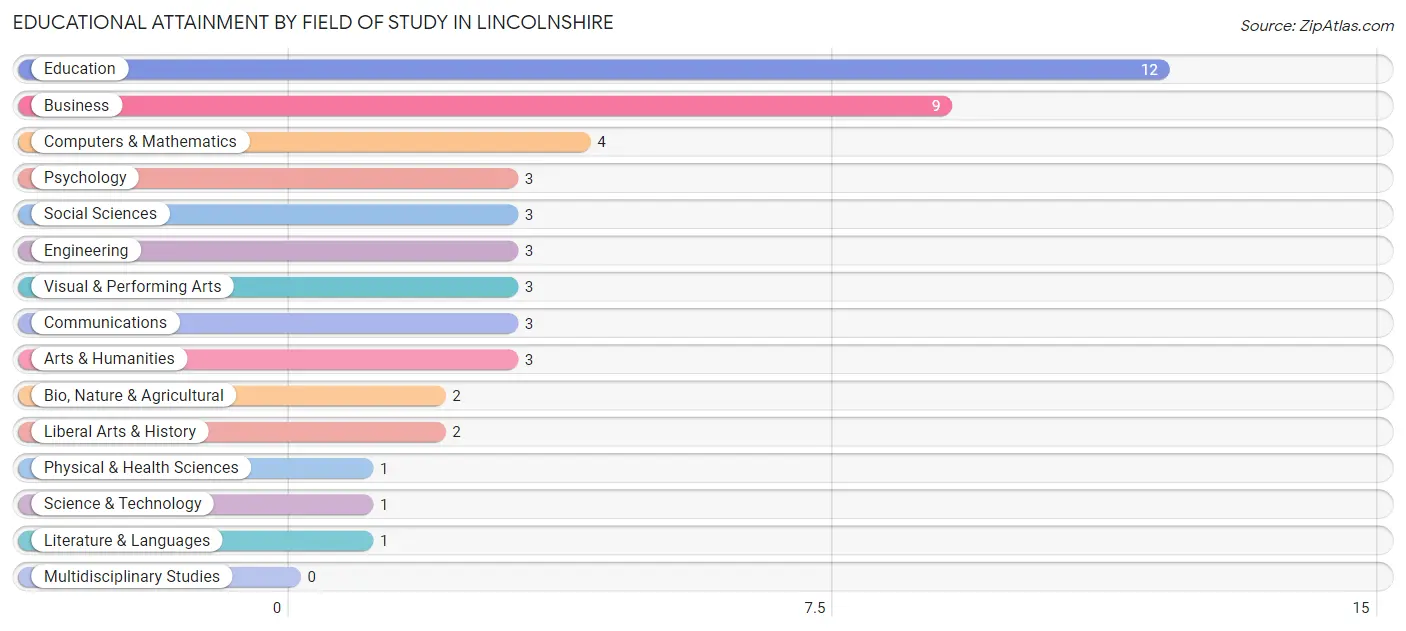
| Field of Study | # Graduates | % Graduates |
| Computers & Mathematics | 4 | 8.0% |
| Bio, Nature & Agricultural | 2 | 4.0% |
| Physical & Health Sciences | 1 | 2.0% |
| Psychology | 3 | 6.0% |
| Social Sciences | 3 | 6.0% |
| Engineering | 3 | 6.0% |
| Multidisciplinary Studies | 0 | 0.0% |
| Science & Technology | 1 | 2.0% |
| Business | 9 | 18.0% |
| Education | 12 | 24.0% |
| Literature & Languages | 1 | 2.0% |
| Liberal Arts & History | 2 | 4.0% |
| Visual & Performing Arts | 3 | 6.0% |
| Communications | 3 | 6.0% |
| Arts & Humanities | 3 | 6.0% |
| Total | 50 | 100.0% |
Transportation & Commute in Lincolnshire
Vehicle Availability by Sex in Lincolnshire
The most prevalent vehicle ownership categories in Lincolnshire are males with 2 vehicles (20, accounting for 76.9%) and females with 2 vehicles (12, making up 83.3%).
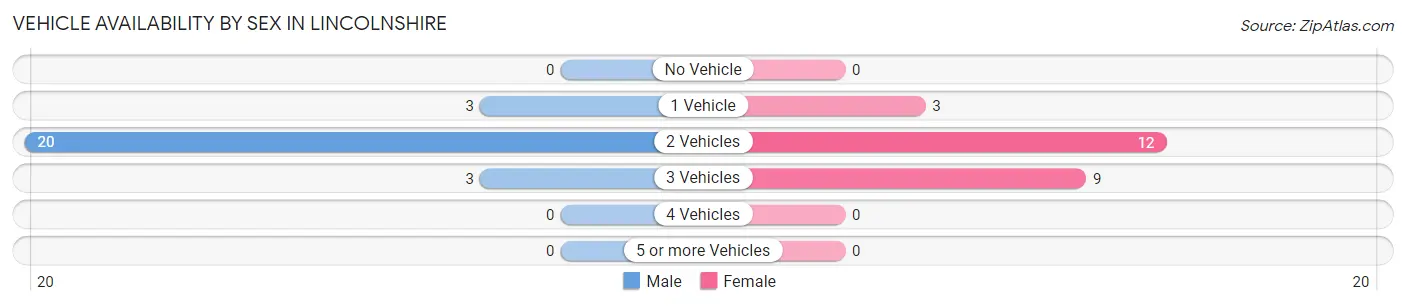
| Vehicles Available | Male | Female |
| No Vehicle | 0 (0.0%) | 0 (0.0%) |
| 1 Vehicle | 3 (11.5%) | 3 (12.5%) |
| 2 Vehicles | 20 (76.9%) | 12 (50.0%) |
| 3 Vehicles | 3 (11.5%) | 9 (37.5%) |
| 4 Vehicles | 0 (0.0%) | 0 (0.0%) |
| 5 or more Vehicles | 0 (0.0%) | 0 (0.0%) |
| Total | 26 (100.0%) | 24 (100.0%) |
Commute Time in Lincolnshire
The most frequently occuring commute durations in Lincolnshire are 15 to 19 minutes (14 commuters, 31.8%), 5 to 9 minutes (8 commuters, 18.2%), and 20 to 24 minutes (8 commuters, 18.2%).
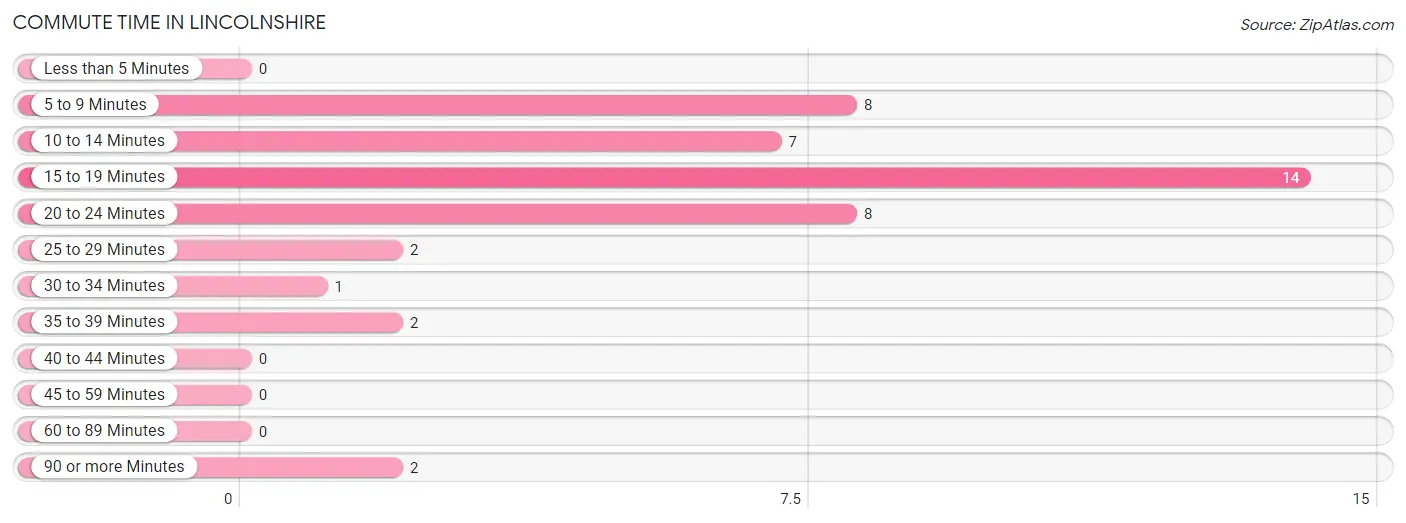
| Commute Time | # Commuters | % Commuters |
| Less than 5 Minutes | 0 | 0.0% |
| 5 to 9 Minutes | 8 | 18.2% |
| 10 to 14 Minutes | 7 | 15.9% |
| 15 to 19 Minutes | 14 | 31.8% |
| 20 to 24 Minutes | 8 | 18.2% |
| 25 to 29 Minutes | 2 | 4.5% |
| 30 to 34 Minutes | 1 | 2.3% |
| 35 to 39 Minutes | 2 | 4.5% |
| 40 to 44 Minutes | 0 | 0.0% |
| 45 to 59 Minutes | 0 | 0.0% |
| 60 to 89 Minutes | 0 | 0.0% |
| 90 or more Minutes | 2 | 4.5% |
Commute Time by Sex in Lincolnshire
The most common commute times in Lincolnshire are 15 to 19 minutes (8 commuters, 33.3%) for males and 5 to 9 minutes (8 commuters, 40.0%) for females.
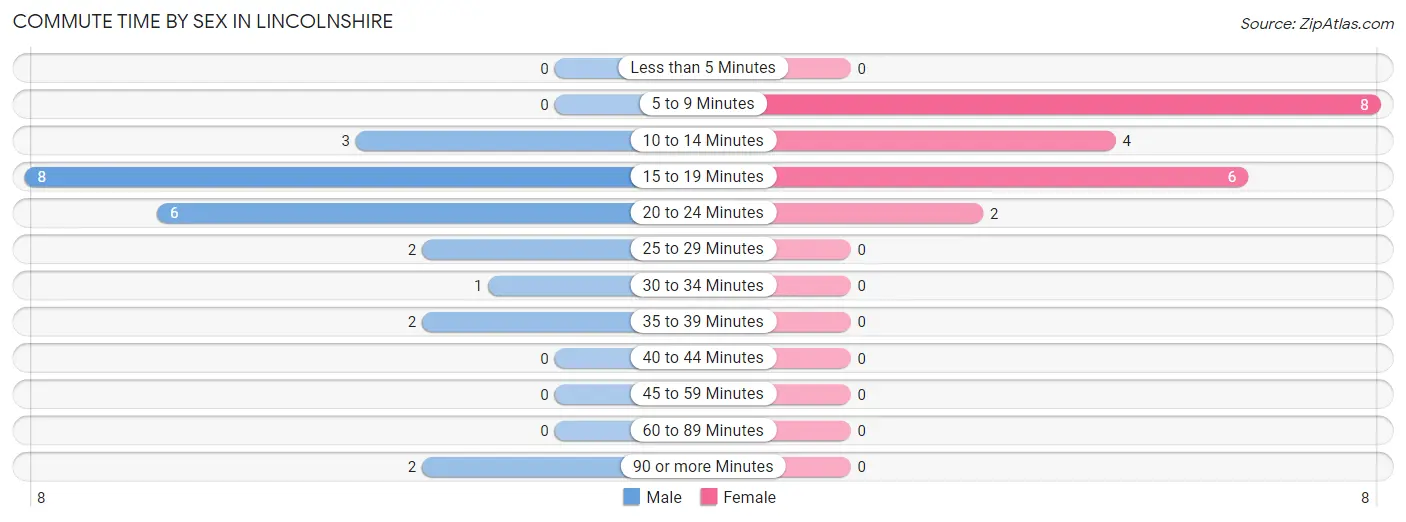
| Commute Time | Male | Female |
| Less than 5 Minutes | 0 (0.0%) | 0 (0.0%) |
| 5 to 9 Minutes | 0 (0.0%) | 8 (40.0%) |
| 10 to 14 Minutes | 3 (12.5%) | 4 (20.0%) |
| 15 to 19 Minutes | 8 (33.3%) | 6 (30.0%) |
| 20 to 24 Minutes | 6 (25.0%) | 2 (10.0%) |
| 25 to 29 Minutes | 2 (8.3%) | 0 (0.0%) |
| 30 to 34 Minutes | 1 (4.2%) | 0 (0.0%) |
| 35 to 39 Minutes | 2 (8.3%) | 0 (0.0%) |
| 40 to 44 Minutes | 0 (0.0%) | 0 (0.0%) |
| 45 to 59 Minutes | 0 (0.0%) | 0 (0.0%) |
| 60 to 89 Minutes | 0 (0.0%) | 0 (0.0%) |
| 90 or more Minutes | 2 (8.3%) | 0 (0.0%) |
Time of Departure to Work by Sex in Lincolnshire
The most frequent times of departure to work in Lincolnshire are 7:30 AM to 7:59 AM (7, 29.2%) for males and 6:30 AM to 6:59 AM (5, 25.0%) for females.
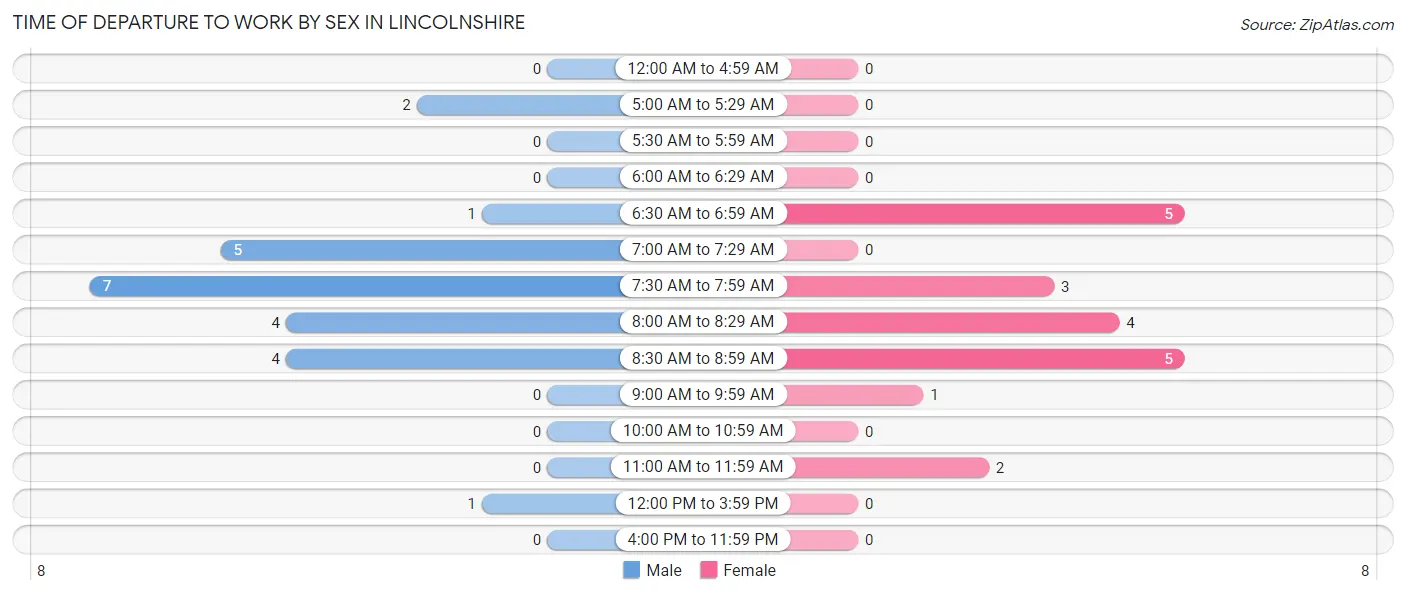
| Time of Departure | Male | Female |
| 12:00 AM to 4:59 AM | 0 (0.0%) | 0 (0.0%) |
| 5:00 AM to 5:29 AM | 2 (8.3%) | 0 (0.0%) |
| 5:30 AM to 5:59 AM | 0 (0.0%) | 0 (0.0%) |
| 6:00 AM to 6:29 AM | 0 (0.0%) | 0 (0.0%) |
| 6:30 AM to 6:59 AM | 1 (4.2%) | 5 (25.0%) |
| 7:00 AM to 7:29 AM | 5 (20.8%) | 0 (0.0%) |
| 7:30 AM to 7:59 AM | 7 (29.2%) | 3 (15.0%) |
| 8:00 AM to 8:29 AM | 4 (16.7%) | 4 (20.0%) |
| 8:30 AM to 8:59 AM | 4 (16.7%) | 5 (25.0%) |
| 9:00 AM to 9:59 AM | 0 (0.0%) | 1 (5.0%) |
| 10:00 AM to 10:59 AM | 0 (0.0%) | 0 (0.0%) |
| 11:00 AM to 11:59 AM | 0 (0.0%) | 2 (10.0%) |
| 12:00 PM to 3:59 PM | 1 (4.2%) | 0 (0.0%) |
| 4:00 PM to 11:59 PM | 0 (0.0%) | 0 (0.0%) |
| Total | 24 (100.0%) | 20 (100.0%) |
Housing Occupancy in Lincolnshire
Occupancy by Ownership in Lincolnshire
Of the total 43 dwellings in Lincolnshire, owner-occupied units account for 41 (95.4%), while renter-occupied units make up 2 (4.6%).
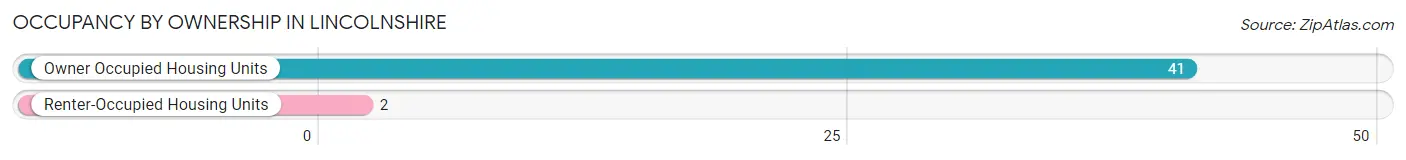
| Occupancy | # Housing Units | % Housing Units |
| Owner Occupied Housing Units | 41 | 95.4% |
| Renter-Occupied Housing Units | 2 | 4.6% |
| Total Occupied Housing Units | 43 | 100.0% |
Occupancy by Household Size in Lincolnshire
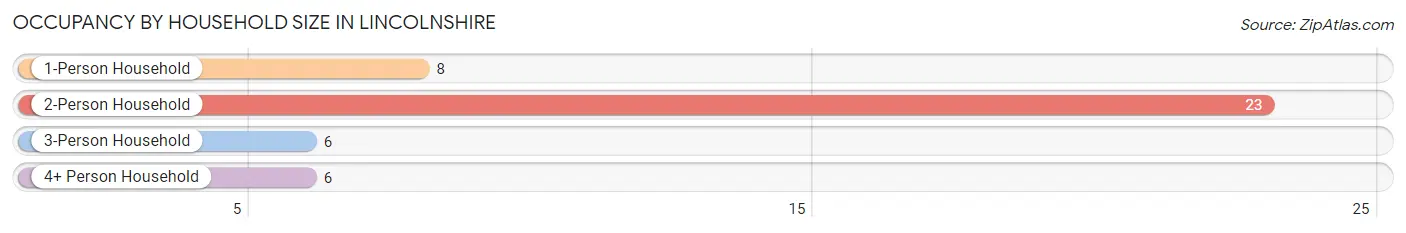
| Household Size | # Housing Units | % Housing Units |
| 1-Person Household | 8 | 18.6% |
| 2-Person Household | 23 | 53.5% |
| 3-Person Household | 6 | 14.0% |
| 4+ Person Household | 6 | 14.0% |
| Total Housing Units | 43 | 100.0% |
Occupancy by Ownership by Household Size in Lincolnshire
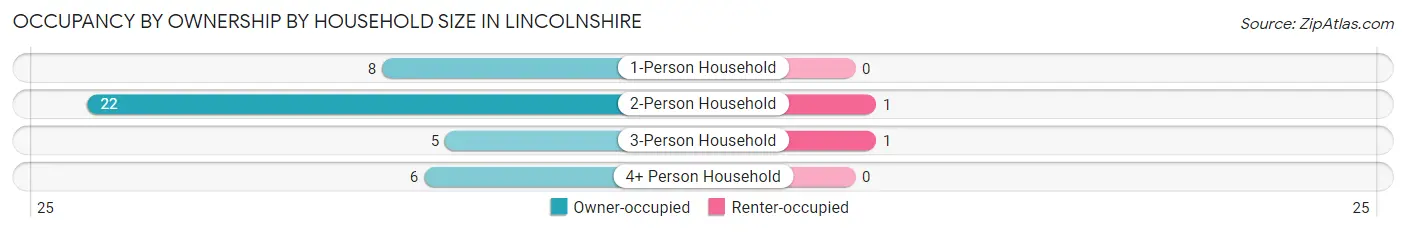
| Household Size | Owner-occupied | Renter-occupied |
| 1-Person Household | 8 (100.0%) | 0 (0.0%) |
| 2-Person Household | 22 (95.7%) | 1 (4.3%) |
| 3-Person Household | 5 (83.3%) | 1 (16.7%) |
| 4+ Person Household | 6 (100.0%) | 0 (0.0%) |
| Total Housing Units | 41 (95.4%) | 2 (4.6%) |
Occupancy by Educational Attainment in Lincolnshire
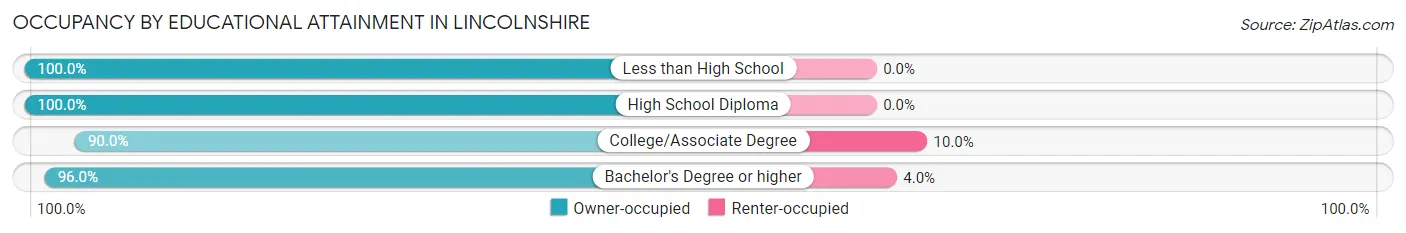
| Household Size | Owner-occupied | Renter-occupied |
| Less than High School | 1 (100.0%) | 0 (0.0%) |
| High School Diploma | 7 (100.0%) | 0 (0.0%) |
| College/Associate Degree | 9 (90.0%) | 1 (10.0%) |
| Bachelor's Degree or higher | 24 (96.0%) | 1 (4.0%) |
Occupancy by Age of Householder in Lincolnshire
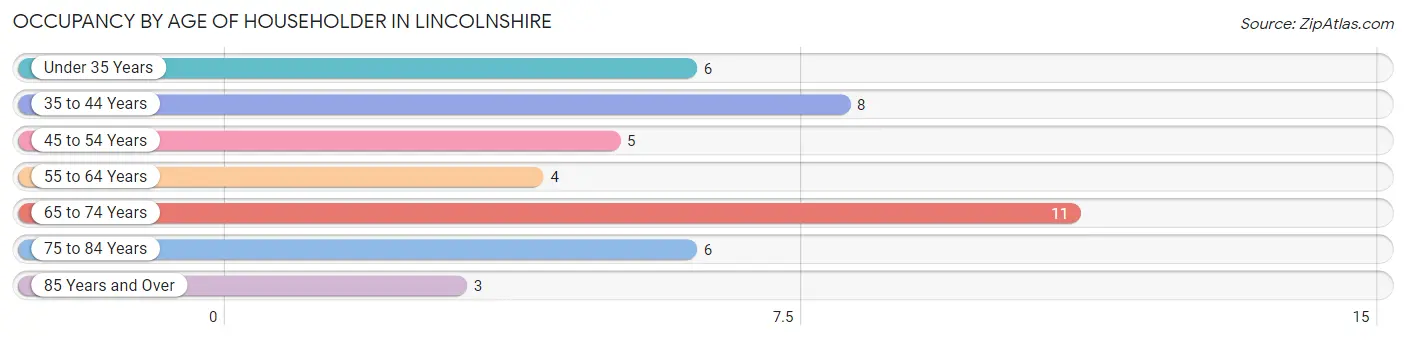
| Age Bracket | # Households | % Households |
| Under 35 Years | 6 | 14.0% |
| 35 to 44 Years | 8 | 18.6% |
| 45 to 54 Years | 5 | 11.6% |
| 55 to 64 Years | 4 | 9.3% |
| 65 to 74 Years | 11 | 25.6% |
| 75 to 84 Years | 6 | 14.0% |
| 85 Years and Over | 3 | 7.0% |
| Total | 43 | 100.0% |
Housing Finances in Lincolnshire
Median Income by Occupancy in Lincolnshire
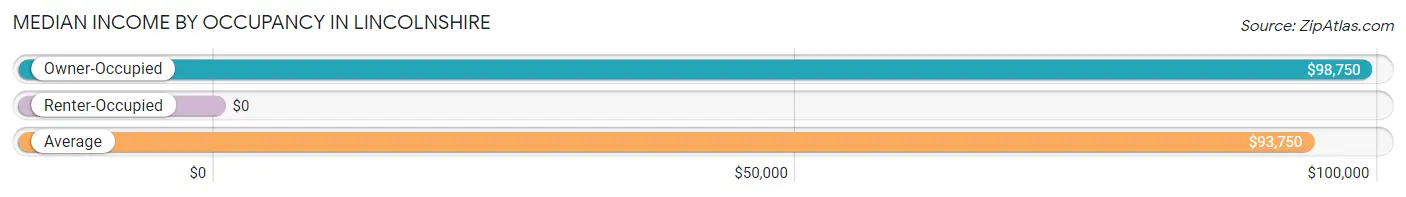
| Occupancy Type | # Households | Median Income |
| Owner-Occupied | 41 (95.4%) | $98,750 |
| Renter-Occupied | 2 (4.6%) | $0 |
| Average | 43 (100.0%) | $93,750 |
Occupancy by Householder Income Bracket in Lincolnshire
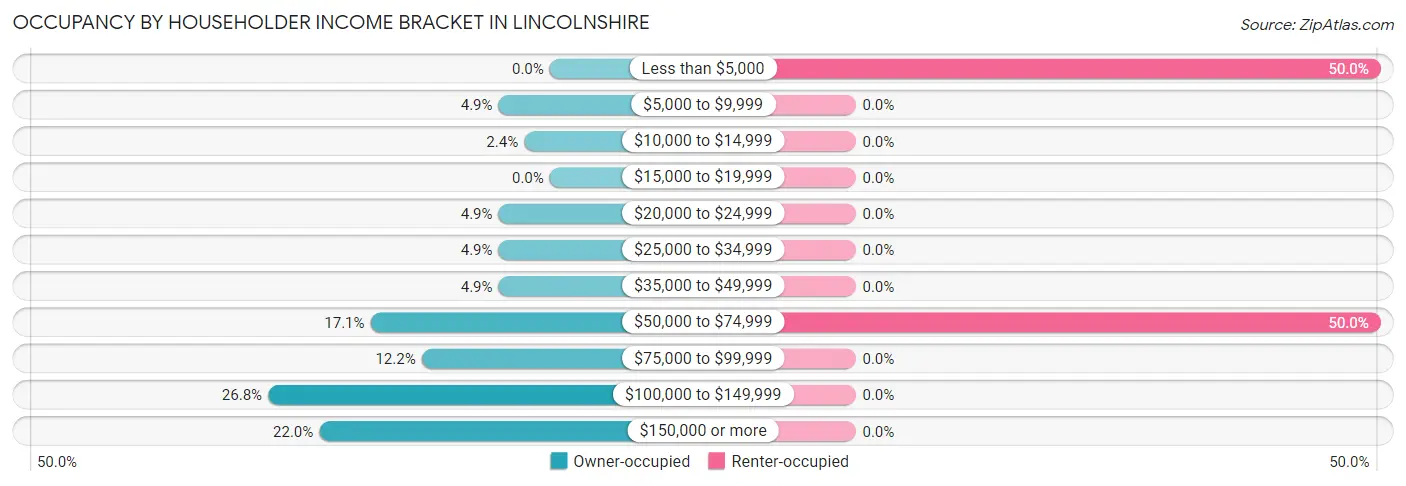
| Income Bracket | Owner-occupied | Renter-occupied |
| Less than $5,000 | 0 (0.0%) | 1 (50.0%) |
| $5,000 to $9,999 | 2 (4.9%) | 0 (0.0%) |
| $10,000 to $14,999 | 1 (2.4%) | 0 (0.0%) |
| $15,000 to $19,999 | 0 (0.0%) | 0 (0.0%) |
| $20,000 to $24,999 | 2 (4.9%) | 0 (0.0%) |
| $25,000 to $34,999 | 2 (4.9%) | 0 (0.0%) |
| $35,000 to $49,999 | 2 (4.9%) | 0 (0.0%) |
| $50,000 to $74,999 | 7 (17.1%) | 1 (50.0%) |
| $75,000 to $99,999 | 5 (12.2%) | 0 (0.0%) |
| $100,000 to $149,999 | 11 (26.8%) | 0 (0.0%) |
| $150,000 or more | 9 (22.0%) | 0 (0.0%) |
| Total | 41 (100.0%) | 2 (100.0%) |
Monthly Housing Cost Tiers in Lincolnshire
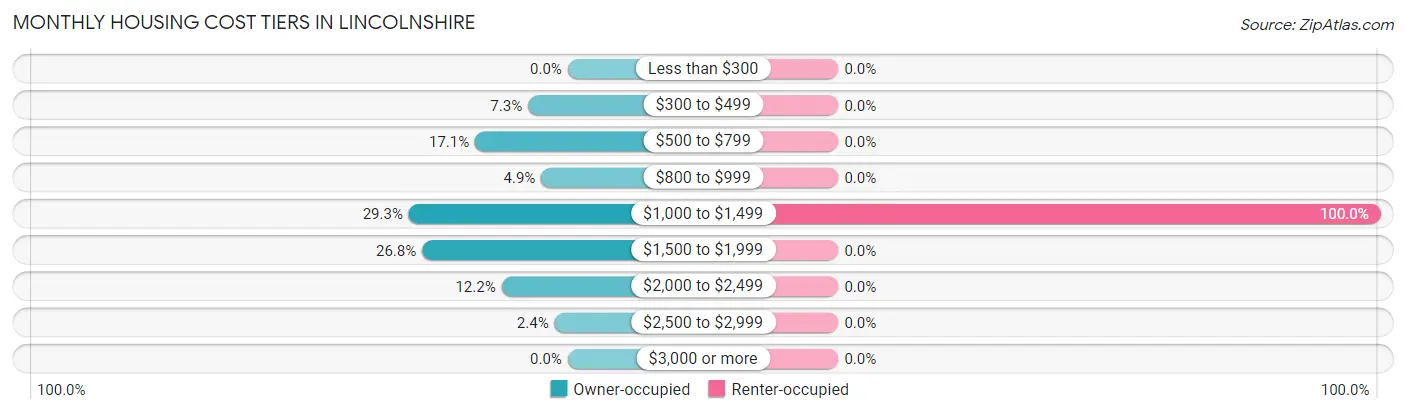
| Monthly Cost | Owner-occupied | Renter-occupied |
| Less than $300 | 0 (0.0%) | 0 (0.0%) |
| $300 to $499 | 3 (7.3%) | 0 (0.0%) |
| $500 to $799 | 7 (17.1%) | 0 (0.0%) |
| $800 to $999 | 2 (4.9%) | 0 (0.0%) |
| $1,000 to $1,499 | 12 (29.3%) | 2 (100.0%) |
| $1,500 to $1,999 | 11 (26.8%) | 0 (0.0%) |
| $2,000 to $2,499 | 5 (12.2%) | 0 (0.0%) |
| $2,500 to $2,999 | 1 (2.4%) | 0 (0.0%) |
| $3,000 or more | 0 (0.0%) | 0 (0.0%) |
| Total | 41 (100.0%) | 2 (100.0%) |
Physical Housing Characteristics in Lincolnshire
Housing Structures in Lincolnshire
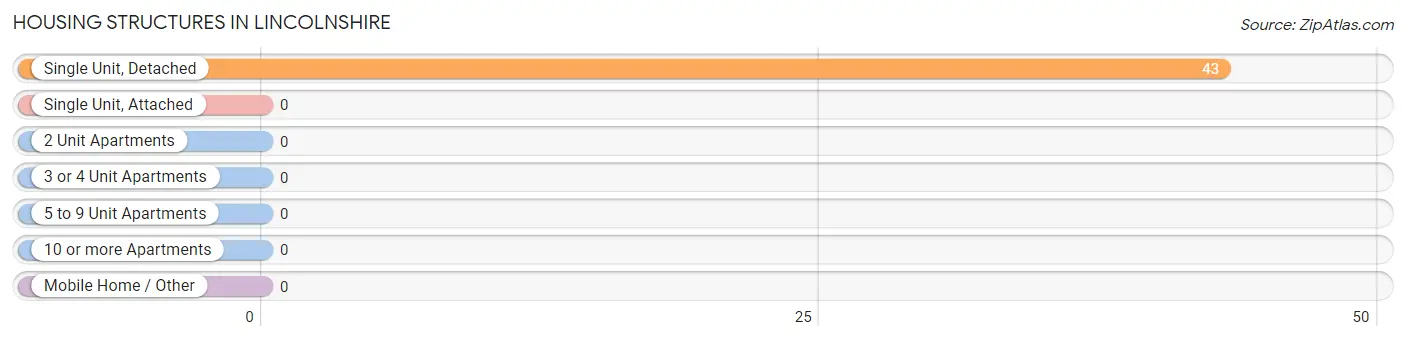
| Structure Type | # Housing Units | % Housing Units |
| Single Unit, Detached | 43 | 100.0% |
| Single Unit, Attached | 0 | 0.0% |
| 2 Unit Apartments | 0 | 0.0% |
| 3 or 4 Unit Apartments | 0 | 0.0% |
| 5 to 9 Unit Apartments | 0 | 0.0% |
| 10 or more Apartments | 0 | 0.0% |
| Mobile Home / Other | 0 | 0.0% |
| Total | 43 | 100.0% |
Housing Structures by Occupancy in Lincolnshire
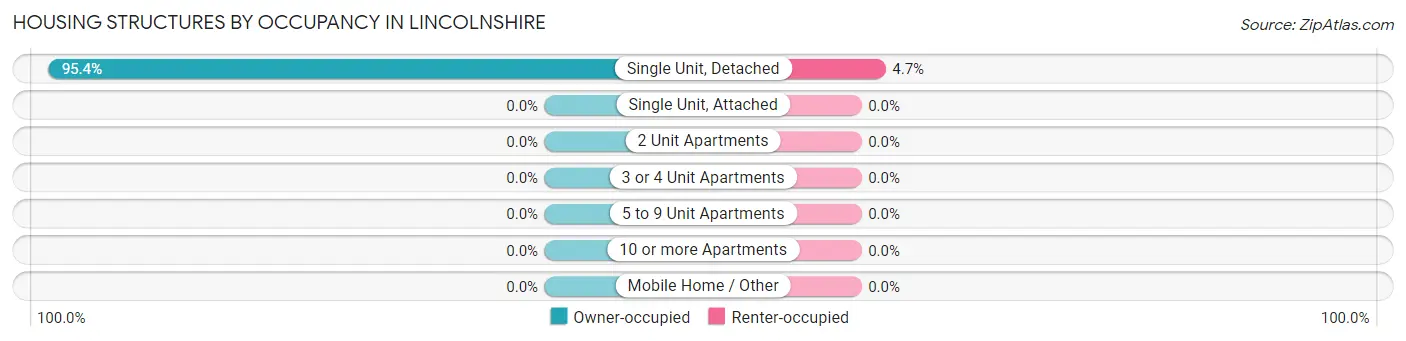
| Structure Type | Owner-occupied | Renter-occupied |
| Single Unit, Detached | 41 (95.4%) | 2 (4.6%) |
| Single Unit, Attached | 0 (0.0%) | 0 (0.0%) |
| 2 Unit Apartments | 0 (0.0%) | 0 (0.0%) |
| 3 or 4 Unit Apartments | 0 (0.0%) | 0 (0.0%) |
| 5 to 9 Unit Apartments | 0 (0.0%) | 0 (0.0%) |
| 10 or more Apartments | 0 (0.0%) | 0 (0.0%) |
| Mobile Home / Other | 0 (0.0%) | 0 (0.0%) |
| Total | 41 (95.4%) | 2 (4.6%) |
Housing Structures by Number of Rooms in Lincolnshire
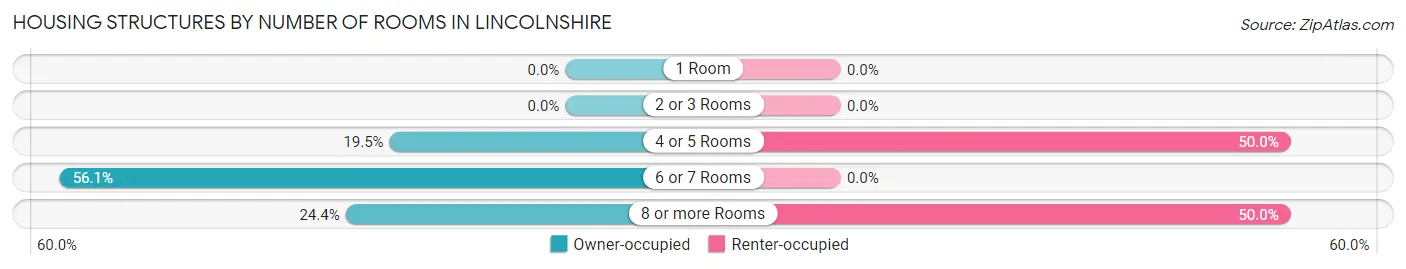
| Number of Rooms | Owner-occupied | Renter-occupied |
| 1 Room | 0 (0.0%) | 0 (0.0%) |
| 2 or 3 Rooms | 0 (0.0%) | 0 (0.0%) |
| 4 or 5 Rooms | 8 (19.5%) | 1 (50.0%) |
| 6 or 7 Rooms | 23 (56.1%) | 0 (0.0%) |
| 8 or more Rooms | 10 (24.4%) | 1 (50.0%) |
| Total | 41 (100.0%) | 2 (100.0%) |
Housing Structure by Heating Type in Lincolnshire
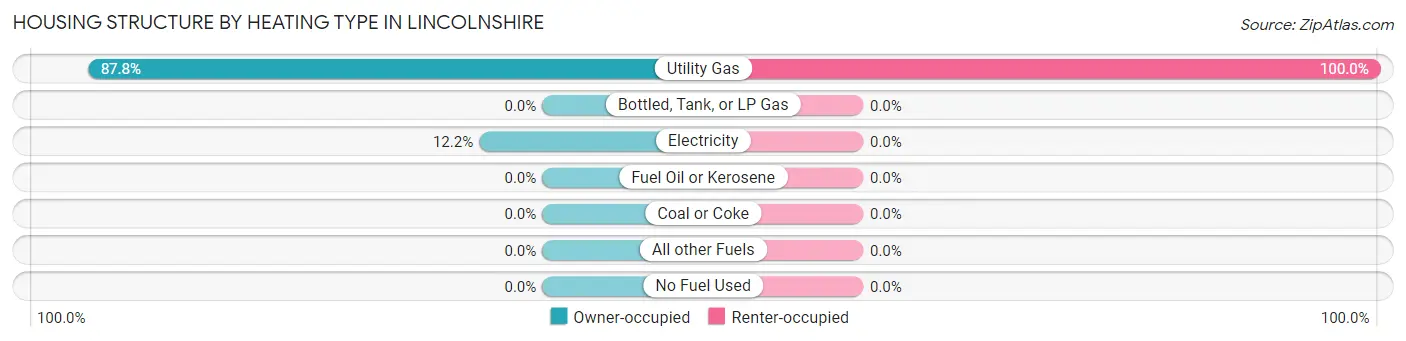
| Heating Type | Owner-occupied | Renter-occupied |
| Utility Gas | 36 (87.8%) | 2 (100.0%) |
| Bottled, Tank, or LP Gas | 0 (0.0%) | 0 (0.0%) |
| Electricity | 5 (12.2%) | 0 (0.0%) |
| Fuel Oil or Kerosene | 0 (0.0%) | 0 (0.0%) |
| Coal or Coke | 0 (0.0%) | 0 (0.0%) |
| All other Fuels | 0 (0.0%) | 0 (0.0%) |
| No Fuel Used | 0 (0.0%) | 0 (0.0%) |
| Total | 41 (100.0%) | 2 (100.0%) |
Household Vehicle Usage in Lincolnshire
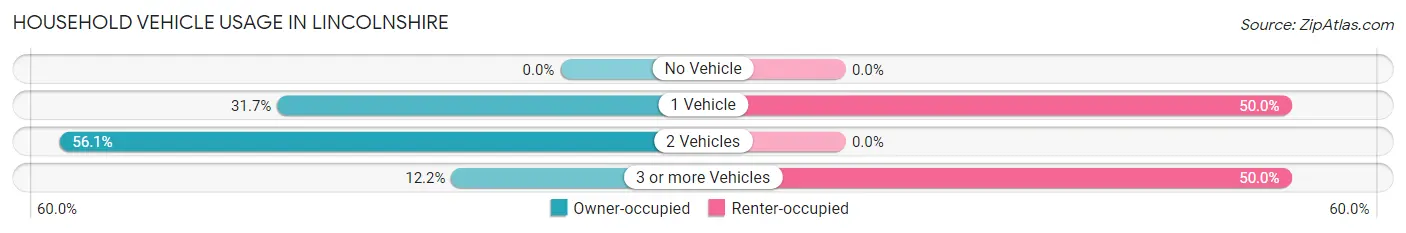
| Vehicles per Household | Owner-occupied | Renter-occupied |
| No Vehicle | 0 (0.0%) | 0 (0.0%) |
| 1 Vehicle | 13 (31.7%) | 1 (50.0%) |
| 2 Vehicles | 23 (56.1%) | 0 (0.0%) |
| 3 or more Vehicles | 5 (12.2%) | 1 (50.0%) |
| Total | 41 (100.0%) | 2 (100.0%) |
Real Estate & Mortgages in Lincolnshire
Real Estate and Mortgage Overview in Lincolnshire
| Characteristic | Without Mortgage | With Mortgage |
| Housing Units | 13 | 28 |
| Median Property Value | $275,000 | $263,600 |
| Median Household Income | $66,250 | $6 |
| Monthly Housing Costs | $650 | $0 |
| Real Estate Taxes | $2,350 | $0 |
Property Value by Mortgage Status in Lincolnshire
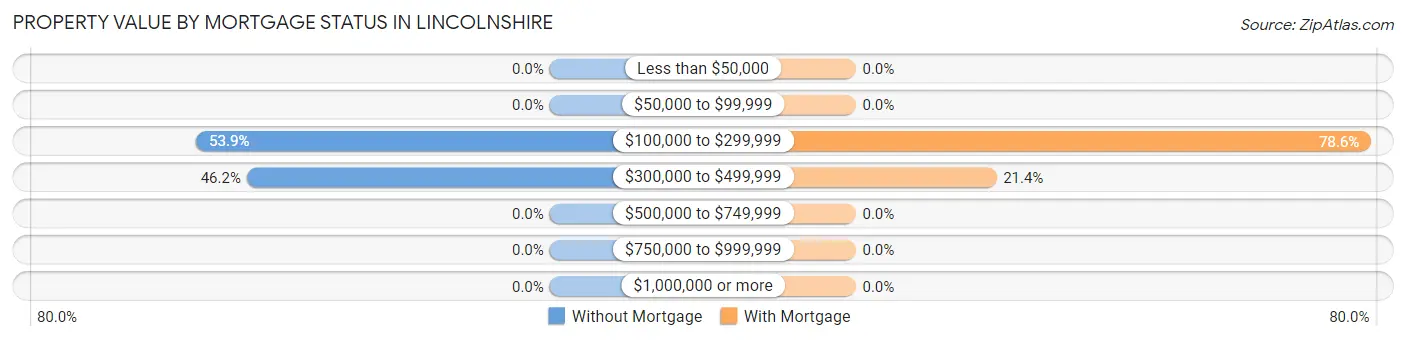
| Property Value | Without Mortgage | With Mortgage |
| Less than $50,000 | 0 (0.0%) | 0 (0.0%) |
| $50,000 to $99,999 | 0 (0.0%) | 0 (0.0%) |
| $100,000 to $299,999 | 7 (53.8%) | 22 (78.6%) |
| $300,000 to $499,999 | 6 (46.2%) | 6 (21.4%) |
| $500,000 to $749,999 | 0 (0.0%) | 0 (0.0%) |
| $750,000 to $999,999 | 0 (0.0%) | 0 (0.0%) |
| $1,000,000 or more | 0 (0.0%) | 0 (0.0%) |
| Total | 13 (100.0%) | 28 (100.0%) |
Household Income by Mortgage Status in Lincolnshire
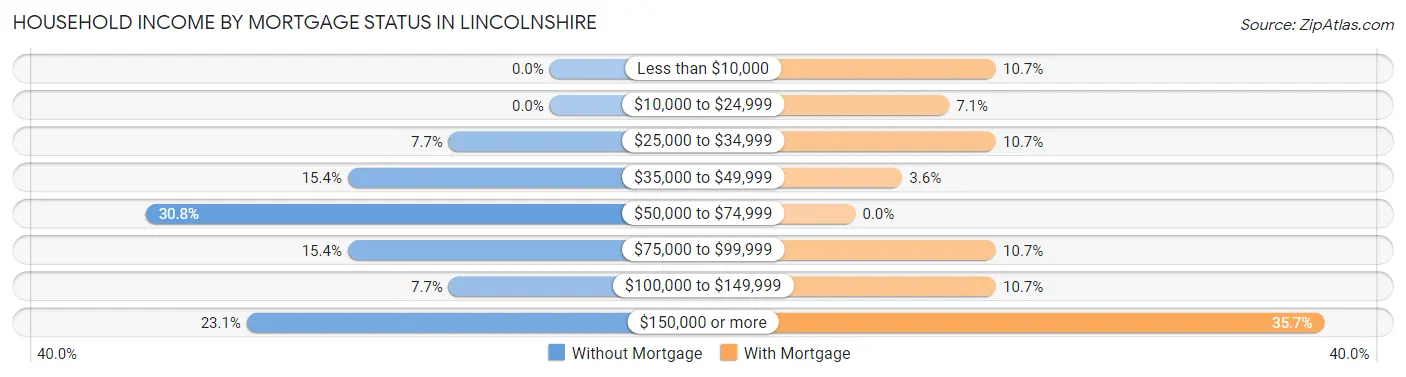
| Household Income | Without Mortgage | With Mortgage |
| Less than $10,000 | 0 (0.0%) | 3 (10.7%) |
| $10,000 to $24,999 | 0 (0.0%) | 2 (7.1%) |
| $25,000 to $34,999 | 1 (7.7%) | 3 (10.7%) |
| $35,000 to $49,999 | 2 (15.4%) | 1 (3.6%) |
| $50,000 to $74,999 | 4 (30.8%) | 0 (0.0%) |
| $75,000 to $99,999 | 2 (15.4%) | 3 (10.7%) |
| $100,000 to $149,999 | 1 (7.7%) | 3 (10.7%) |
| $150,000 or more | 3 (23.1%) | 10 (35.7%) |
| Total | 13 (100.0%) | 28 (100.0%) |
Property Value to Household Income Ratio in Lincolnshire
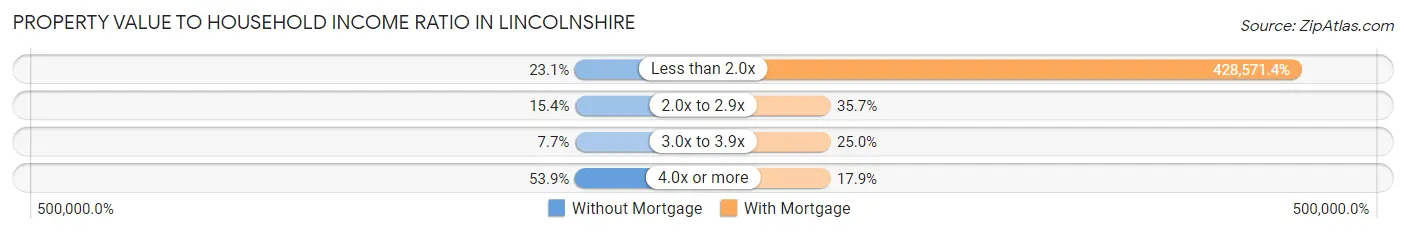
| Value-to-Income Ratio | Without Mortgage | With Mortgage |
| Less than 2.0x | 3 (23.1%) | 120,000 (428,571.4%) |
| 2.0x to 2.9x | 2 (15.4%) | 10 (35.7%) |
| 3.0x to 3.9x | 1 (7.7%) | 7 (25.0%) |
| 4.0x or more | 7 (53.8%) | 5 (17.9%) |
| Total | 13 (100.0%) | 28 (100.0%) |
Real Estate Taxes by Mortgage Status in Lincolnshire
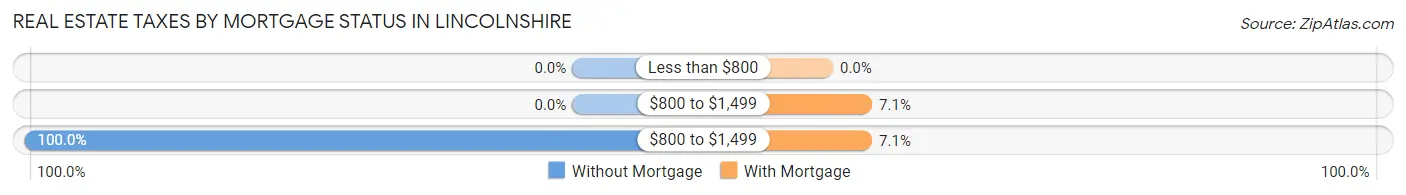
| Property Taxes | Without Mortgage | With Mortgage |
| Less than $800 | 0 (0.0%) | 0 (0.0%) |
| $800 to $1,499 | 0 (0.0%) | 2 (7.1%) |
| $800 to $1,499 | 13 (100.0%) | 2 (7.1%) |
| Total | 13 (100.0%) | 28 (100.0%) |
Health & Disability in Lincolnshire
Health Insurance Coverage by Age in Lincolnshire
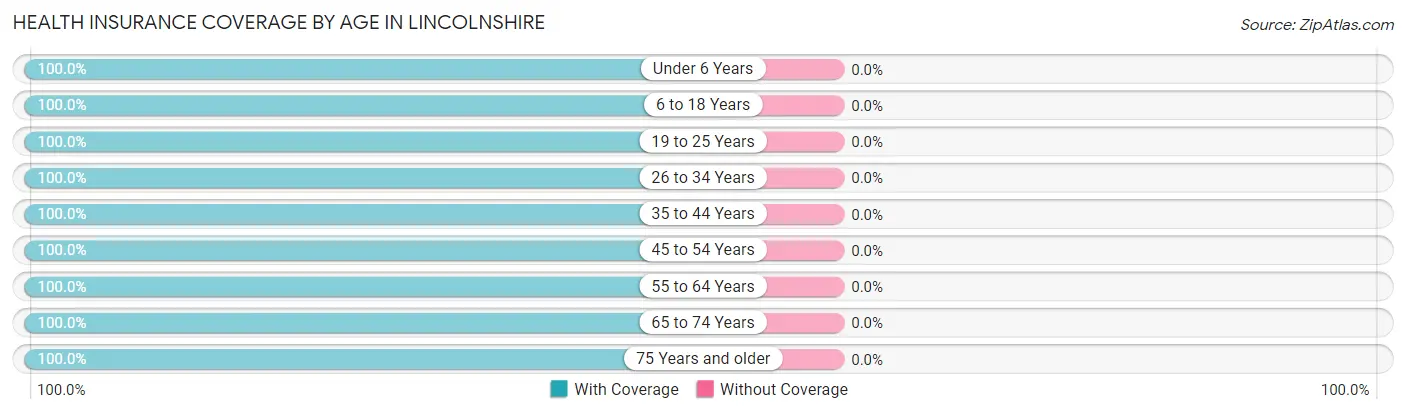
| Age Bracket | With Coverage | Without Coverage |
| Under 6 Years | 12 (100.0%) | 0 (0.0%) |
| 6 to 18 Years | 6 (100.0%) | 0 (0.0%) |
| 19 to 25 Years | 2 (100.0%) | 0 (0.0%) |
| 26 to 34 Years | 16 (100.0%) | 0 (0.0%) |
| 35 to 44 Years | 15 (100.0%) | 0 (0.0%) |
| 45 to 54 Years | 8 (100.0%) | 0 (0.0%) |
| 55 to 64 Years | 10 (100.0%) | 0 (0.0%) |
| 65 to 74 Years | 20 (100.0%) | 0 (0.0%) |
| 75 Years and older | 16 (100.0%) | 0 (0.0%) |
| Total | 105 (100.0%) | 0 (0.0%) |
Health Insurance Coverage by Citizenship Status in Lincolnshire
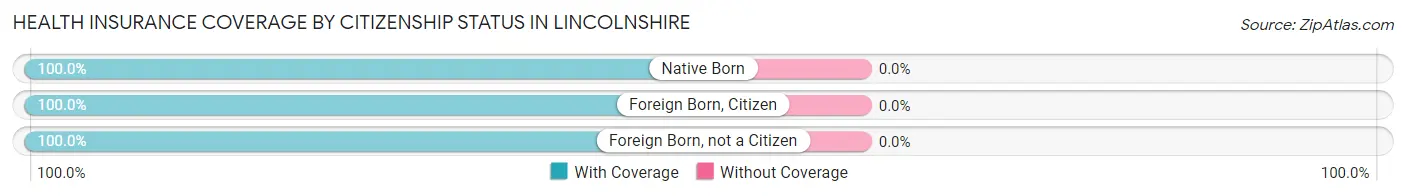
| Citizenship Status | With Coverage | Without Coverage |
| Native Born | 12 (100.0%) | 0 (0.0%) |
| Foreign Born, Citizen | 6 (100.0%) | 0 (0.0%) |
| Foreign Born, not a Citizen | 2 (100.0%) | 0 (0.0%) |
Health Insurance Coverage by Household Income in Lincolnshire
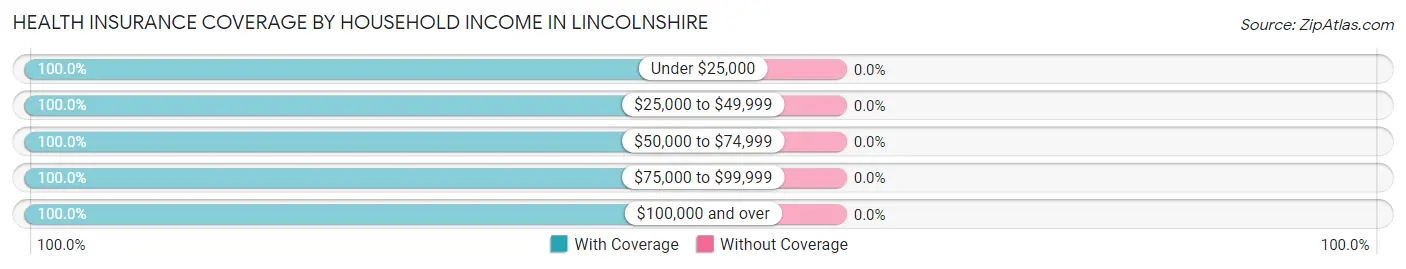
| Household Income | With Coverage | Without Coverage |
| Under $25,000 | 8 (100.0%) | 0 (0.0%) |
| $25,000 to $49,999 | 6 (100.0%) | 0 (0.0%) |
| $50,000 to $74,999 | 16 (100.0%) | 0 (0.0%) |
| $75,000 to $99,999 | 12 (100.0%) | 0 (0.0%) |
| $100,000 and over | 63 (100.0%) | 0 (0.0%) |
Public vs Private Health Insurance Coverage by Age in Lincolnshire
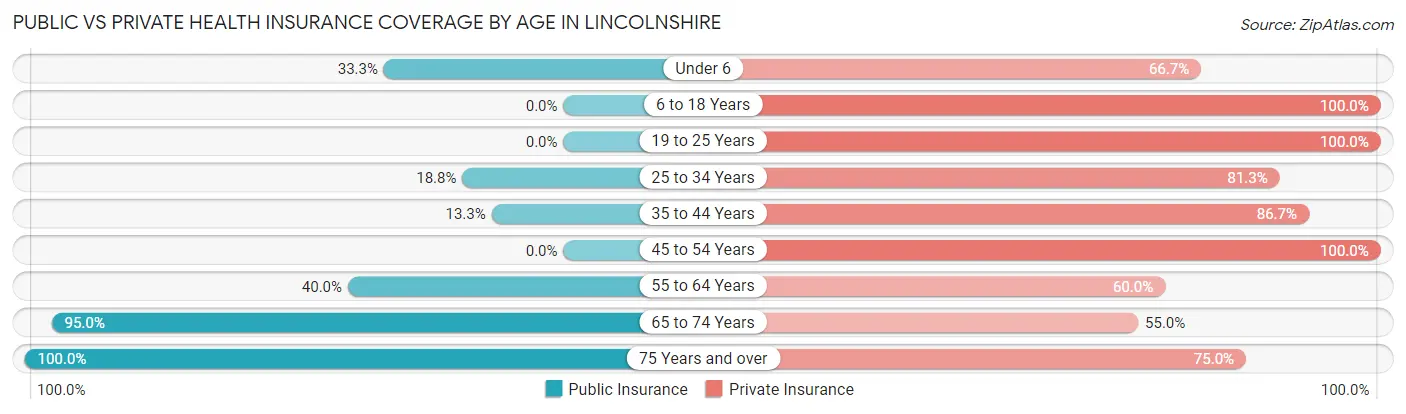
| Age Bracket | Public Insurance | Private Insurance |
| Under 6 | 4 (33.3%) | 8 (66.7%) |
| 6 to 18 Years | 0 (0.0%) | 6 (100.0%) |
| 19 to 25 Years | 0 (0.0%) | 2 (100.0%) |
| 25 to 34 Years | 3 (18.8%) | 13 (81.2%) |
| 35 to 44 Years | 2 (13.3%) | 13 (86.7%) |
| 45 to 54 Years | 0 (0.0%) | 8 (100.0%) |
| 55 to 64 Years | 4 (40.0%) | 6 (60.0%) |
| 65 to 74 Years | 19 (95.0%) | 11 (55.0%) |
| 75 Years and over | 16 (100.0%) | 12 (75.0%) |
| Total | 48 (45.7%) | 79 (75.2%) |
Disability Status by Sex by Age in Lincolnshire
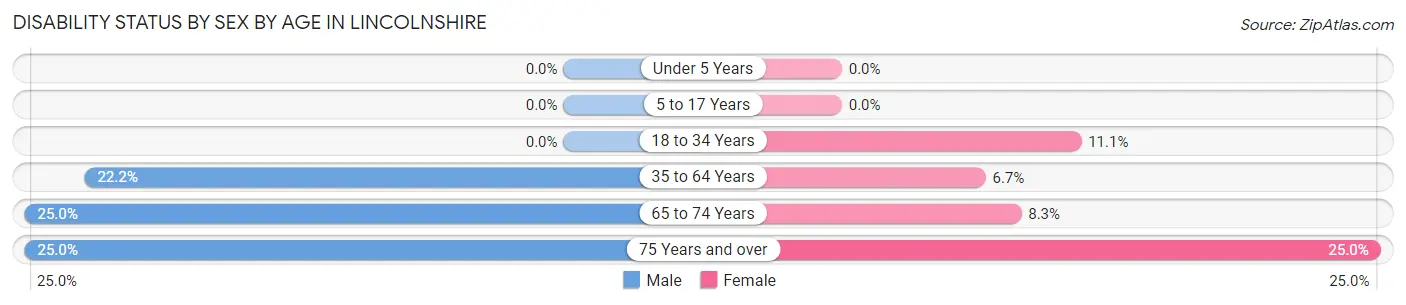
| Age Bracket | Male | Female |
| Under 5 Years | 0 (0.0%) | 0 (0.0%) |
| 5 to 17 Years | 0 (0.0%) | 0 (0.0%) |
| 18 to 34 Years | 0 (0.0%) | 1 (11.1%) |
| 35 to 64 Years | 4 (22.2%) | 1 (6.7%) |
| 65 to 74 Years | 2 (25.0%) | 1 (8.3%) |
| 75 Years and over | 2 (25.0%) | 2 (25.0%) |
Disability Class by Sex by Age in Lincolnshire
Disability Class: Hearing Difficulty
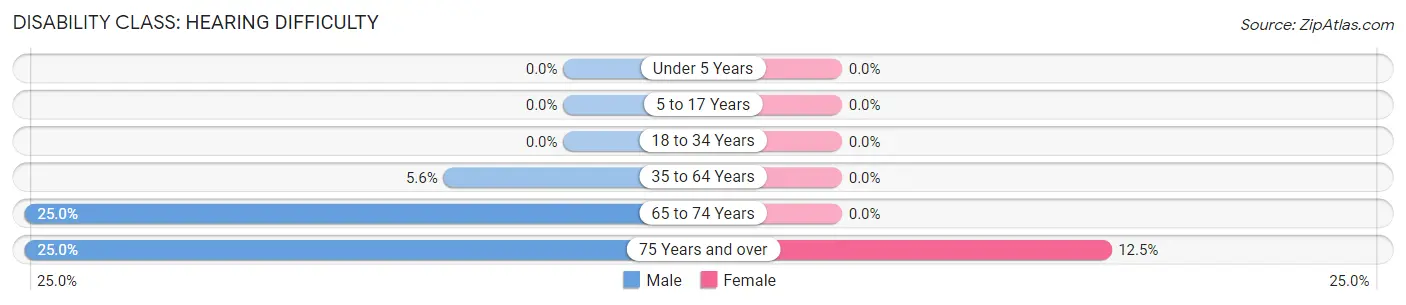
| Age Bracket | Male | Female |
| Under 5 Years | 0 (0.0%) | 0 (0.0%) |
| 5 to 17 Years | 0 (0.0%) | 0 (0.0%) |
| 18 to 34 Years | 0 (0.0%) | 0 (0.0%) |
| 35 to 64 Years | 1 (5.6%) | 0 (0.0%) |
| 65 to 74 Years | 2 (25.0%) | 0 (0.0%) |
| 75 Years and over | 2 (25.0%) | 1 (12.5%) |
Disability Class: Vision Difficulty
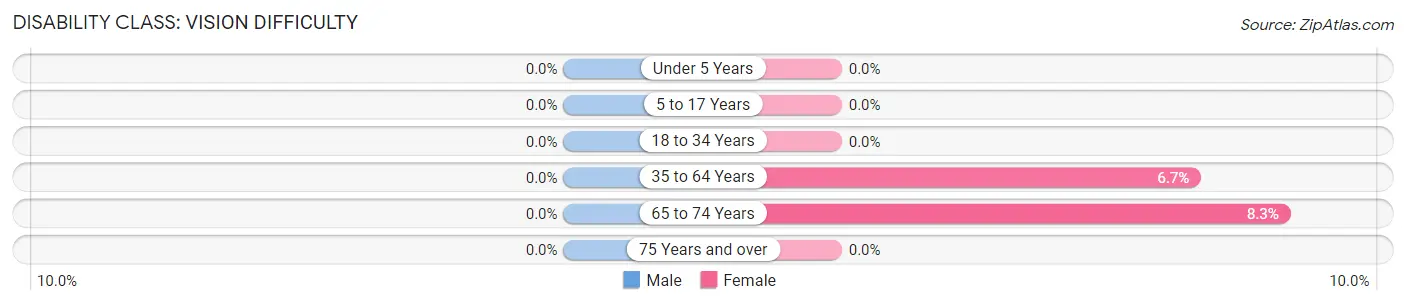
| Age Bracket | Male | Female |
| Under 5 Years | 0 (0.0%) | 0 (0.0%) |
| 5 to 17 Years | 0 (0.0%) | 0 (0.0%) |
| 18 to 34 Years | 0 (0.0%) | 0 (0.0%) |
| 35 to 64 Years | 0 (0.0%) | 1 (6.7%) |
| 65 to 74 Years | 0 (0.0%) | 1 (8.3%) |
| 75 Years and over | 0 (0.0%) | 0 (0.0%) |
Disability Class: Cognitive Difficulty
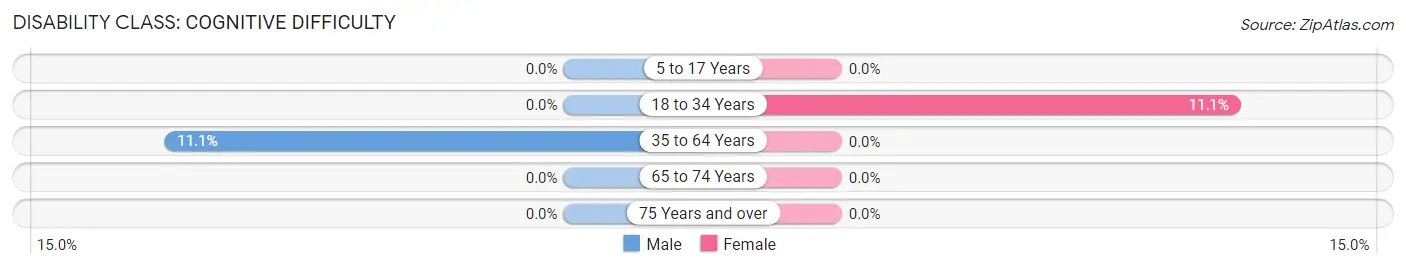
| Age Bracket | Male | Female |
| 5 to 17 Years | 0 (0.0%) | 0 (0.0%) |
| 18 to 34 Years | 0 (0.0%) | 1 (11.1%) |
| 35 to 64 Years | 2 (11.1%) | 0 (0.0%) |
| 65 to 74 Years | 0 (0.0%) | 0 (0.0%) |
| 75 Years and over | 0 (0.0%) | 0 (0.0%) |
Disability Class: Ambulatory Difficulty
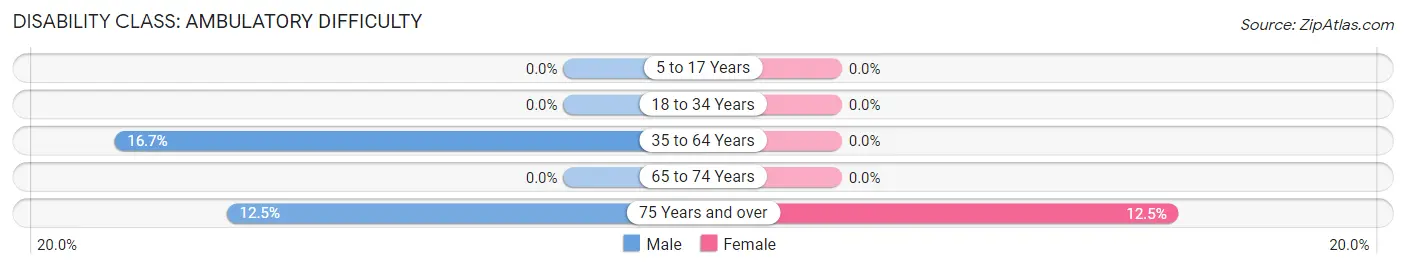
| Age Bracket | Male | Female |
| 5 to 17 Years | 0 (0.0%) | 0 (0.0%) |
| 18 to 34 Years | 0 (0.0%) | 0 (0.0%) |
| 35 to 64 Years | 3 (16.7%) | 0 (0.0%) |
| 65 to 74 Years | 0 (0.0%) | 0 (0.0%) |
| 75 Years and over | 1 (12.5%) | 1 (12.5%) |
Disability Class: Self-Care Difficulty
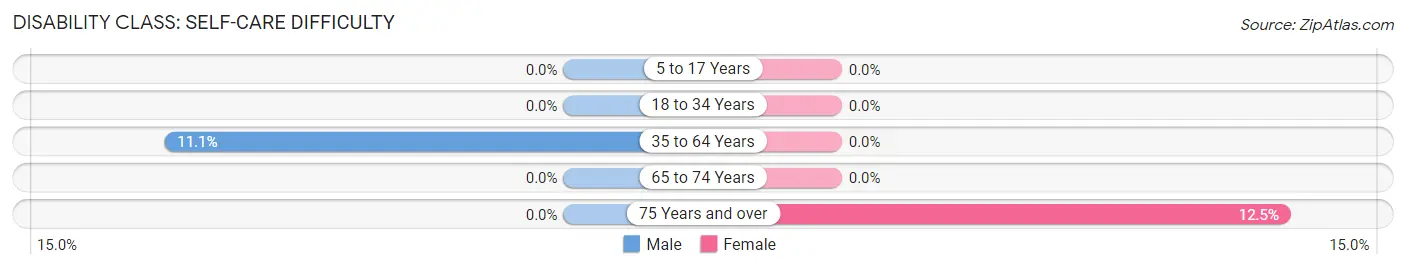
| Age Bracket | Male | Female |
| 5 to 17 Years | 0 (0.0%) | 0 (0.0%) |
| 18 to 34 Years | 0 (0.0%) | 0 (0.0%) |
| 35 to 64 Years | 2 (11.1%) | 0 (0.0%) |
| 65 to 74 Years | 0 (0.0%) | 0 (0.0%) |
| 75 Years and over | 0 (0.0%) | 1 (12.5%) |
Technology Access in Lincolnshire
Computing Device Access in Lincolnshire
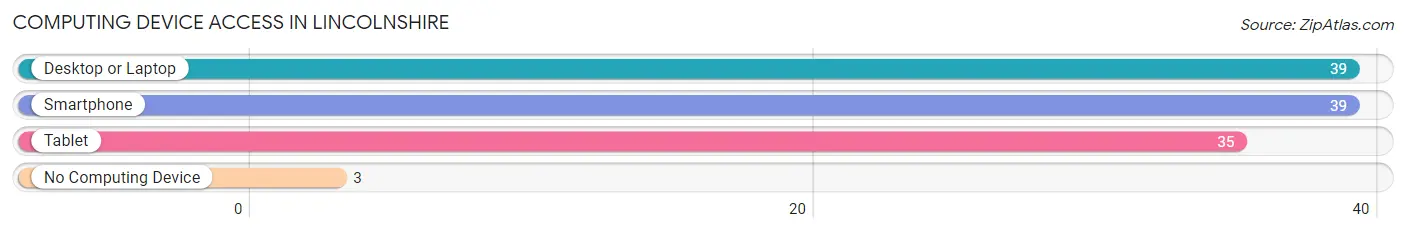
| Device Type | # Households | % Households |
| Desktop or Laptop | 39 | 90.7% |
| Smartphone | 39 | 90.7% |
| Tablet | 35 | 81.4% |
| No Computing Device | 3 | 7.0% |
| Total | 43 | 100.0% |
Internet Access in Lincolnshire
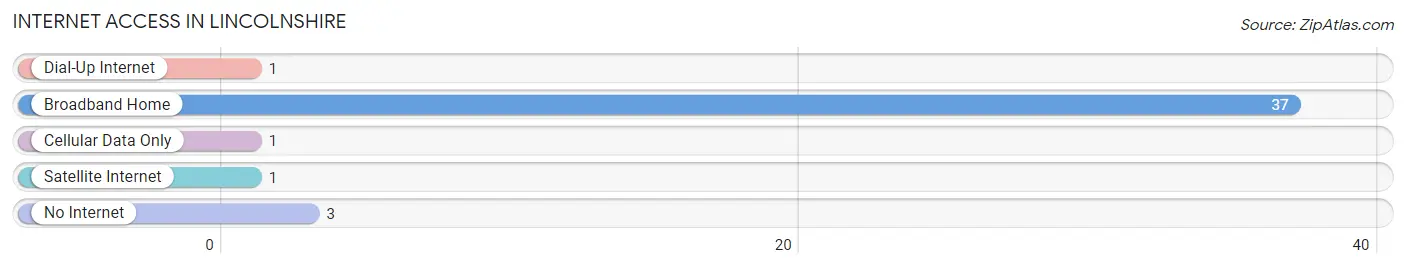
| Internet Type | # Households | % Households |
| Dial-Up Internet | 1 | 2.3% |
| Broadband Home | 37 | 86.1% |
| Cellular Data Only | 1 | 2.3% |
| Satellite Internet | 1 | 2.3% |
| No Internet | 3 | 7.0% |
| Total | 43 | 100.0% |
Lincolnshire Summary
Lincolnshire is a small town located in the state of Kentucky, United States. It is situated in the western part of the state, in the county of Lincoln. The town has a population of around 1,000 people and is known for its rural charm and small-town atmosphere.
Geography
Lincolnshire is located in the western part of Kentucky, in the county of Lincoln. It is situated in the foothills of the Appalachian Mountains, and is surrounded by rolling hills and lush forests. The town is located near the Kentucky River, and is about 30 miles from Lexington, the state capital. The climate in Lincolnshire is humid and subtropical, with hot summers and mild winters.
Economy
The economy of Lincolnshire is largely based on agriculture and tourism. The town is home to several farms, which produce a variety of crops, including corn, soybeans, wheat, and hay. The town also has a few small businesses, including a grocery store, a hardware store, and a few restaurants. Tourism is also an important part of the local economy, as the town is a popular destination for outdoor activities such as fishing, hunting, and camping.
Demographics
As of the 2010 census, the population of Lincolnshire was 1,000 people. The racial makeup of the town was 97.2% White, 0.7% African American, 0.3% Native American, 0.2% Asian, and 1.6% from other races. The median household income was $37,500, and the median family income was $41,250. The per capita income was $17,000.
History
Lincolnshire was founded in 1820 by a group of settlers from Virginia. The town was named after Abraham Lincoln, who was born in the nearby town of Hodgenville. The town grew slowly over the years, and by the late 19th century, it had become a thriving agricultural community. In the early 20th century, the town began to attract tourists, and it became a popular destination for outdoor activities.
Today, Lincolnshire is a small town with a rural charm and a friendly atmosphere. The town is home to several farms, and it is a popular destination for outdoor activities. The town is also home to a few small businesses, and it is a great place to live for those who enjoy the peace and quiet of small-town life.
Common Questions
What is Per Capita Income in Lincolnshire?
Per Capita income in Lincolnshire is $43,984.
What is the Median Family Income in Lincolnshire?
Median Family Income in Lincolnshire is $115,000.
What is the Median Household income in Lincolnshire?
Median Household Income in Lincolnshire is $93,750.
What is Inequality or Gini Index in Lincolnshire?
Inequality or Gini Index in Lincolnshire is 0.36.
What is the Total Population of Lincolnshire?
Total Population of Lincolnshire is 105.
What is the Total Male Population of Lincolnshire?
Total Male Population of Lincolnshire is 58.
What is the Total Female Population of Lincolnshire?
Total Female Population of Lincolnshire is 47.
What is the Ratio of Males per 100 Females in Lincolnshire?
There are 123.40 Males per 100 Females in Lincolnshire.
What is the Ratio of Females per 100 Males in Lincolnshire?
There are 81.03 Females per 100 Males in Lincolnshire.
What is the Median Population Age in Lincolnshire?
Median Population Age in Lincolnshire is 51.4 Years.
What is the Average Family Size in Lincolnshire
Average Family Size in Lincolnshire is 2.8 People.
What is the Average Household Size in Lincolnshire
Average Household Size in Lincolnshire is 2.4 People.
How Large is the Labor Force in Lincolnshire?
There are 50 People in the Labor Forcein in Lincolnshire.
What is the Percentage of People in the Labor Force in Lincolnshire?
57.5% of People are in the Labor Force in Lincolnshire.