Parkway Village, KY Map & Demographics
Parkway Village Map
Parkway Village Overview
$44,891
PER CAPITA INCOME
$109,375
AVG FAMILY INCOME
$88,182
AVG HOUSEHOLD INCOME
10.2%
WAGE / INCOME GAP [ % ]
89.8¢/ $1
WAGE / INCOME GAP [ $ ]
0.29
INEQUALITY / GINI INDEX
622
TOTAL POPULATION
269
MALE POPULATION
353
FEMALE POPULATION
76.20
MALES / 100 FEMALES
131.23
FEMALES / 100 MALES
38.8
MEDIAN AGE
2.9
AVG FAMILY SIZE
2.1
AVG HOUSEHOLD SIZE
393
LABOR FORCE [ PEOPLE ]
77.5%
PERCENT IN LABOR FORCE
1.3%
UNEMPLOYMENT RATE
Parkway Village Area Codes
Income in Parkway Village
Income Overview in Parkway Village
Per Capita Income in Parkway Village is $44,891, while median incomes of families and households are $109,375 and $88,182 respectively.
| Characteristic | Number | Measure |
| Per Capita Income | 622 | $44,891 |
| Median Family Income | 157 | $109,375 |
| Mean Family Income | 157 | $113,731 |
| Median Household Income | 290 | $88,182 |
| Mean Household Income | 290 | $95,000 |
| Income Deficit | 157 | $0 |
| Wage / Income Gap (%) | 622 | 10.22% |
| Wage / Income Gap ($) | 622 | 89.78¢ per $1 |
| Gini / Inequality Index | 622 | 0.29 |
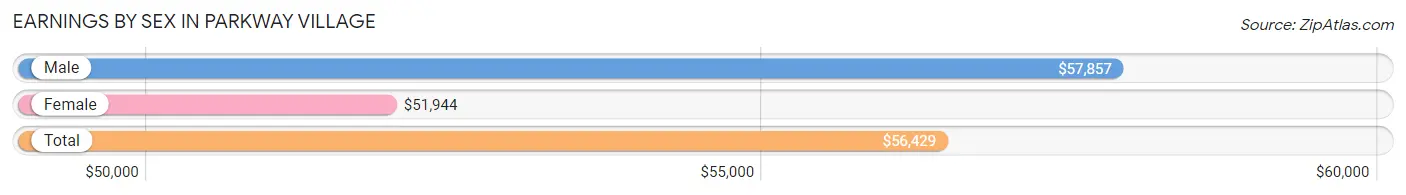
Earnings by Sex in Parkway Village
Average Earnings in Parkway Village are $56,429, $57,857 for men and $51,944 for women, a difference of 10.2%.
| Sex | Number | Average Earnings |
| Male | 192 (47.8%) | $57,857 |
| Female | 210 (52.2%) | $51,944 |
| Total | 402 (100.0%) | $56,429 |
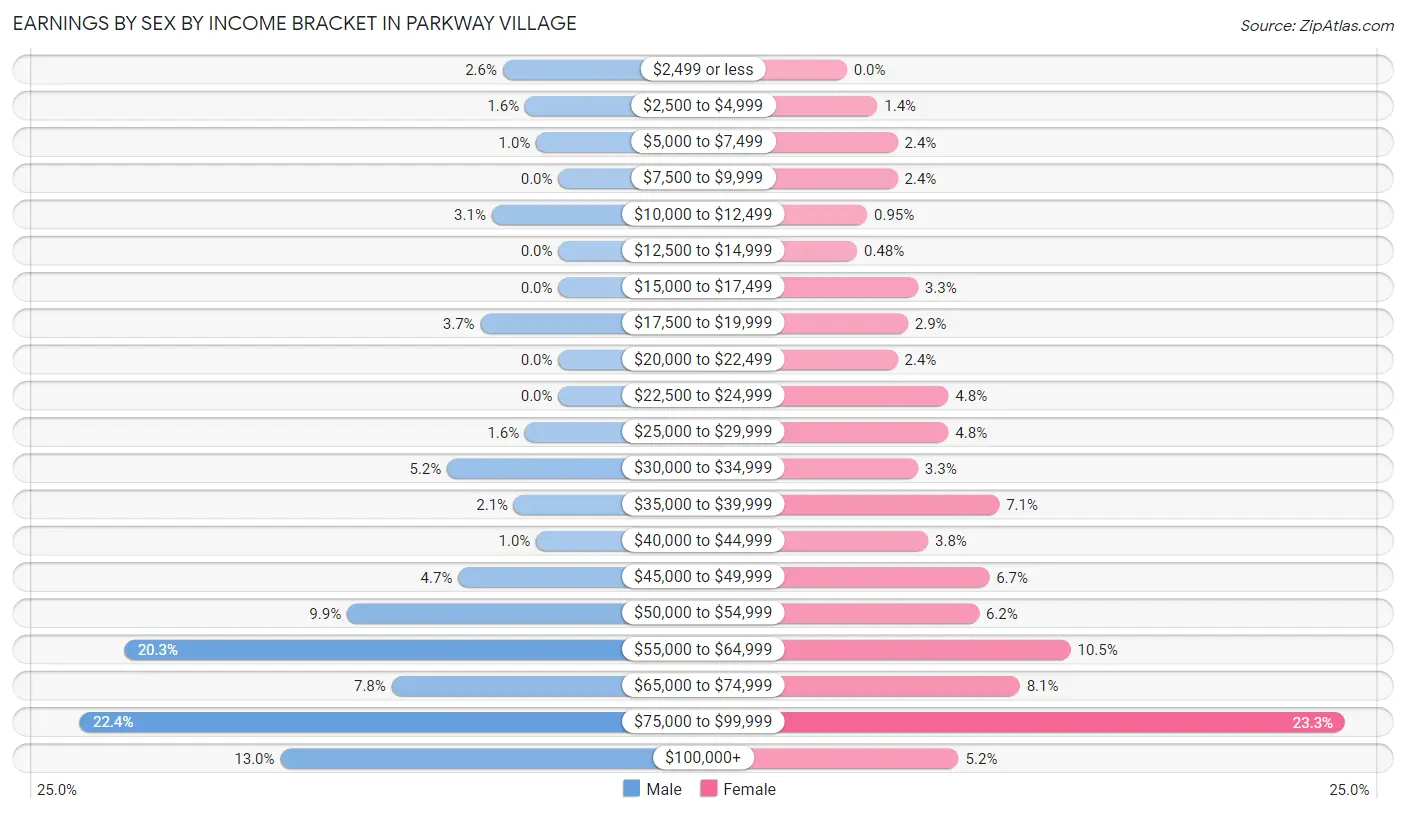
Earnings by Sex by Income Bracket in Parkway Village
The most common earnings brackets in Parkway Village are $75,000 to $99,999 for men (43 | 22.4%) and $75,000 to $99,999 for women (49 | 23.3%).
| Income | Male | Female |
| $2,499 or less | 5 (2.6%) | 0 (0.0%) |
| $2,500 to $4,999 | 3 (1.6%) | 3 (1.4%) |
| $5,000 to $7,499 | 2 (1.0%) | 5 (2.4%) |
| $7,500 to $9,999 | 0 (0.0%) | 5 (2.4%) |
| $10,000 to $12,499 | 6 (3.1%) | 2 (0.9%) |
| $12,500 to $14,999 | 0 (0.0%) | 1 (0.5%) |
| $15,000 to $17,499 | 0 (0.0%) | 7 (3.3%) |
| $17,500 to $19,999 | 7 (3.6%) | 6 (2.9%) |
| $20,000 to $22,499 | 0 (0.0%) | 5 (2.4%) |
| $22,500 to $24,999 | 0 (0.0%) | 10 (4.8%) |
| $25,000 to $29,999 | 3 (1.6%) | 10 (4.8%) |
| $30,000 to $34,999 | 10 (5.2%) | 7 (3.3%) |
| $35,000 to $39,999 | 4 (2.1%) | 15 (7.1%) |
| $40,000 to $44,999 | 2 (1.0%) | 8 (3.8%) |
| $45,000 to $49,999 | 9 (4.7%) | 14 (6.7%) |
| $50,000 to $54,999 | 19 (9.9%) | 13 (6.2%) |
| $55,000 to $64,999 | 39 (20.3%) | 22 (10.5%) |
| $65,000 to $74,999 | 15 (7.8%) | 17 (8.1%) |
| $75,000 to $99,999 | 43 (22.4%) | 49 (23.3%) |
| $100,000+ | 25 (13.0%) | 11 (5.2%) |
| Total | 192 (100.0%) | 210 (100.0%) |
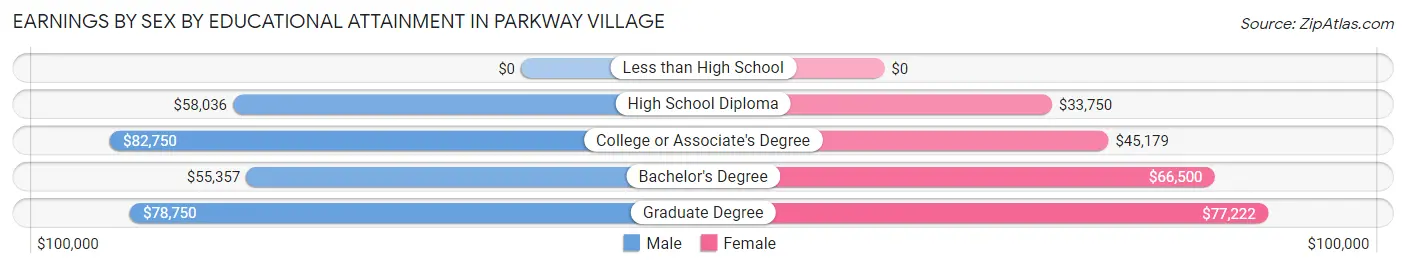
Earnings by Sex by Educational Attainment in Parkway Village
Average earnings in Parkway Village are $59,107 for men and $52,500 for women, a difference of 11.2%. Men with an educational attainment of college or associate's degree enjoy the highest average annual earnings of $82,750, while those with bachelor's degree education earn the least with $55,357. Women with an educational attainment of graduate degree earn the most with the average annual earnings of $77,222, while those with high school diploma education have the smallest earnings of $33,750.
| Educational Attainment | Male Income | Female Income |
| Less than High School | - | - |
| High School Diploma | $58,036 | $33,750 |
| College or Associate's Degree | $82,750 | $45,179 |
| Bachelor's Degree | $55,357 | $66,500 |
| Graduate Degree | $78,750 | $77,222 |
| Total | $59,107 | $52,500 |
Family Income in Parkway Village
Family Income Brackets in Parkway Village
According to the Parkway Village family income data, there are 76 families falling into the $100,000 to $149,999 income range, which is the most common income bracket and makes up 48.4% of all families.
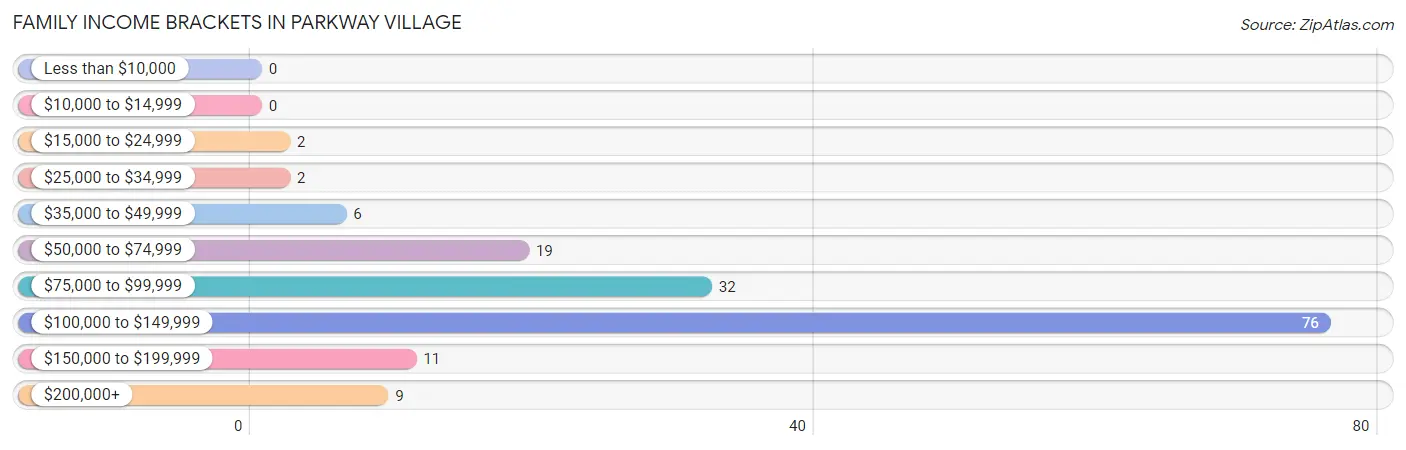
| Income Bracket | # Families | % Families |
| Less than $10,000 | 0 | 0.0% |
| $10,000 to $14,999 | 0 | 0.0% |
| $15,000 to $24,999 | 2 | 1.3% |
| $25,000 to $34,999 | 2 | 1.3% |
| $35,000 to $49,999 | 6 | 3.8% |
| $50,000 to $74,999 | 19 | 12.1% |
| $75,000 to $99,999 | 32 | 20.4% |
| $100,000 to $149,999 | 76 | 48.4% |
| $150,000 to $199,999 | 11 | 7.0% |
| $200,000+ | 9 | 5.7% |
Family Income by Famaliy Size in Parkway Village
3-person families (55 | 35.0%) account for the highest median family income in Parkway Village with $120,625 per family, while 2-person families (68 | 43.3%) have the highest median income of $55,714 per family member.
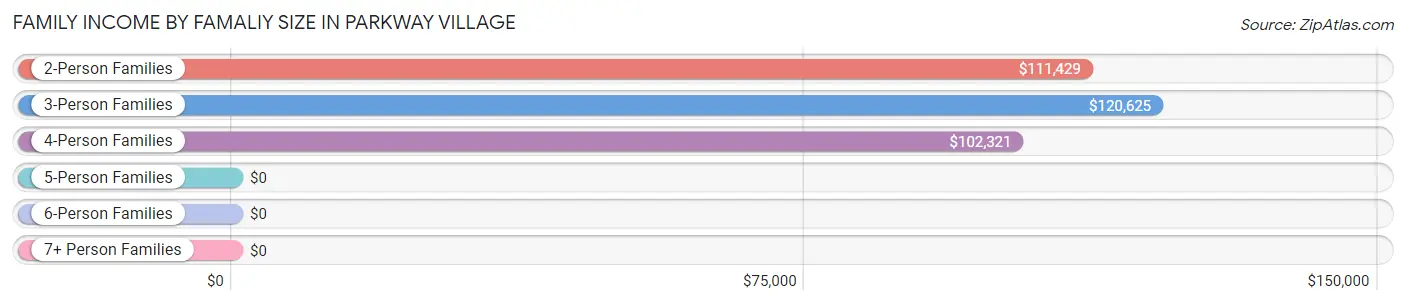
| Income Bracket | # Families | Median Income |
| 2-Person Families | 68 (43.3%) | $111,429 |
| 3-Person Families | 55 (35.0%) | $120,625 |
| 4-Person Families | 13 (8.3%) | $102,321 |
| 5-Person Families | 18 (11.5%) | $0 |
| 6-Person Families | 3 (1.9%) | $0 |
| 7+ Person Families | 0 (0.0%) | $0 |
| Total | 157 (100.0%) | $109,375 |
Family Income by Number of Earners in Parkway Village
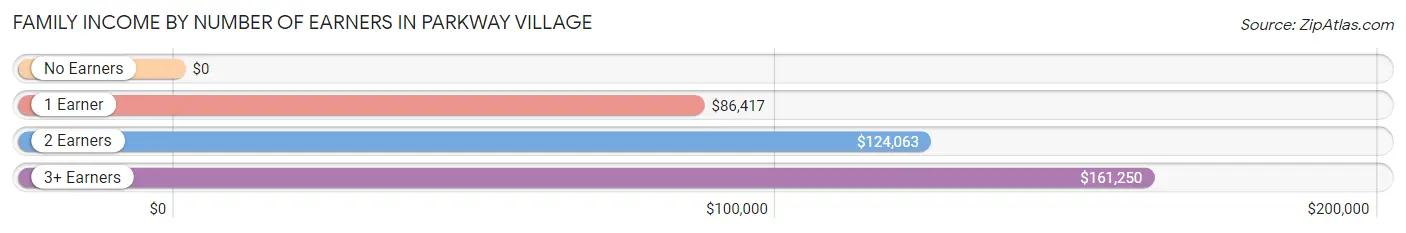
| Number of Earners | # Families | Median Income |
| No Earners | 5 (3.2%) | $0 |
| 1 Earner | 53 (33.8%) | $86,417 |
| 2 Earners | 89 (56.7%) | $124,063 |
| 3+ Earners | 10 (6.4%) | $161,250 |
| Total | 157 (100.0%) | $109,375 |
Household Income in Parkway Village
Household Income Brackets in Parkway Village
With 94 households falling in the category, the $100,000 to $149,999 income range is the most frequent in Parkway Village, accounting for 32.4% of all households. In contrast, only 3 households (1.0%) fall into the less than $10,000 income bracket, making it the least populous group.
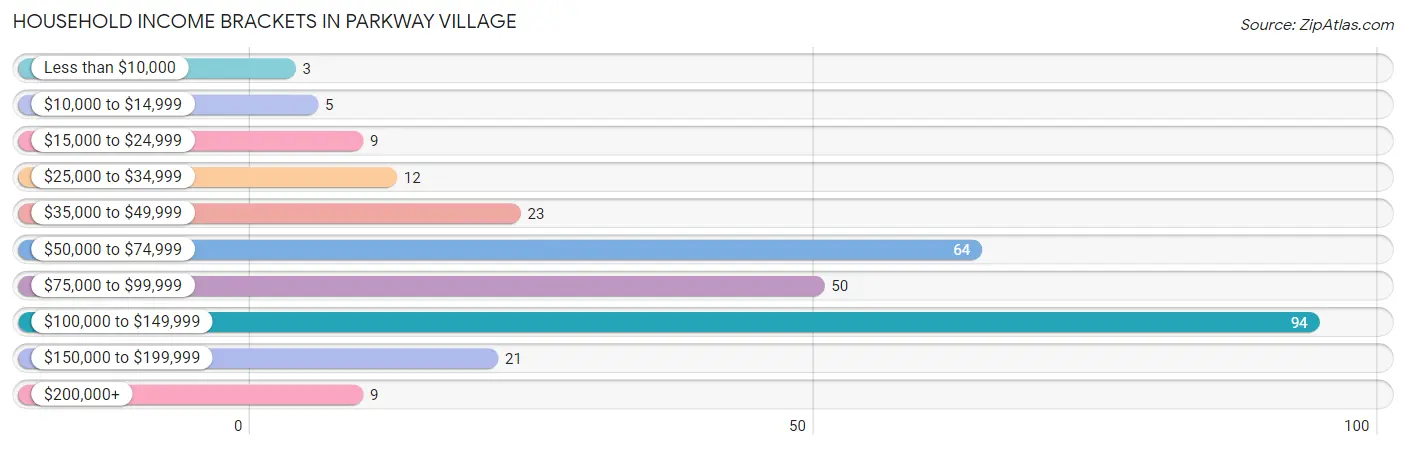
| Income Bracket | # Households | % Households |
| Less than $10,000 | 3 | 1.0% |
| $10,000 to $14,999 | 5 | 1.7% |
| $15,000 to $24,999 | 9 | 3.1% |
| $25,000 to $34,999 | 12 | 4.1% |
| $35,000 to $49,999 | 23 | 7.9% |
| $50,000 to $74,999 | 64 | 22.1% |
| $75,000 to $99,999 | 50 | 17.2% |
| $100,000 to $149,999 | 94 | 32.4% |
| $150,000 to $199,999 | 21 | 7.2% |
| $200,000+ | 9 | 3.1% |
Household Income by Householder Age in Parkway Village
The median household income in Parkway Village is $88,182, with the highest median household income of $111,071 found in the 45 to 64 years age bracket for the primary householder. A total of 64 households (22.1%) fall into this category. Meanwhile, the 15 to 24 years age bracket for the primary householder has the lowest median household income of $0, with 3 households (1.0%) in this group.
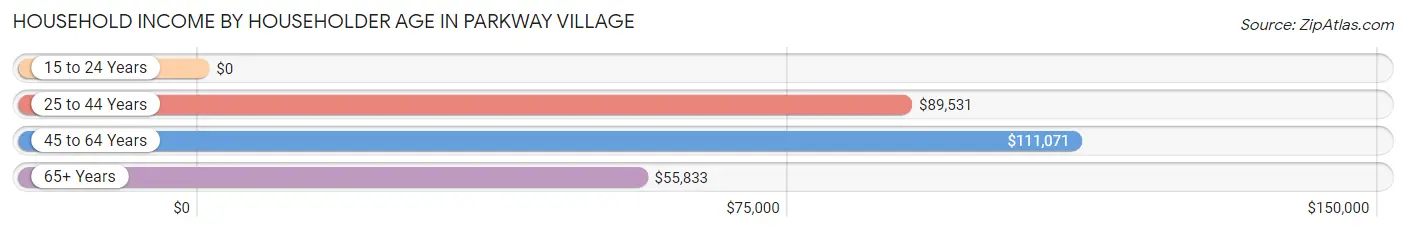
| Income Bracket | # Households | Median Income |
| 15 to 24 Years | 3 (1.0%) | $0 |
| 25 to 44 Years | 145 (50.0%) | $89,531 |
| 45 to 64 Years | 64 (22.1%) | $111,071 |
| 65+ Years | 78 (26.9%) | $55,833 |
| Total | 290 (100.0%) | $88,182 |
Poverty in Parkway Village
Income Below Poverty by Sex and Age in Parkway Village
With 0.7% poverty level for males and 2.5% for females among the residents of Parkway Village, 65 to 74 year old males and 18 to 24 year old females are the most vulnerable to poverty, with 2 males (6.5%) and 3 females (21.4%) in their respective age groups living below the poverty level.
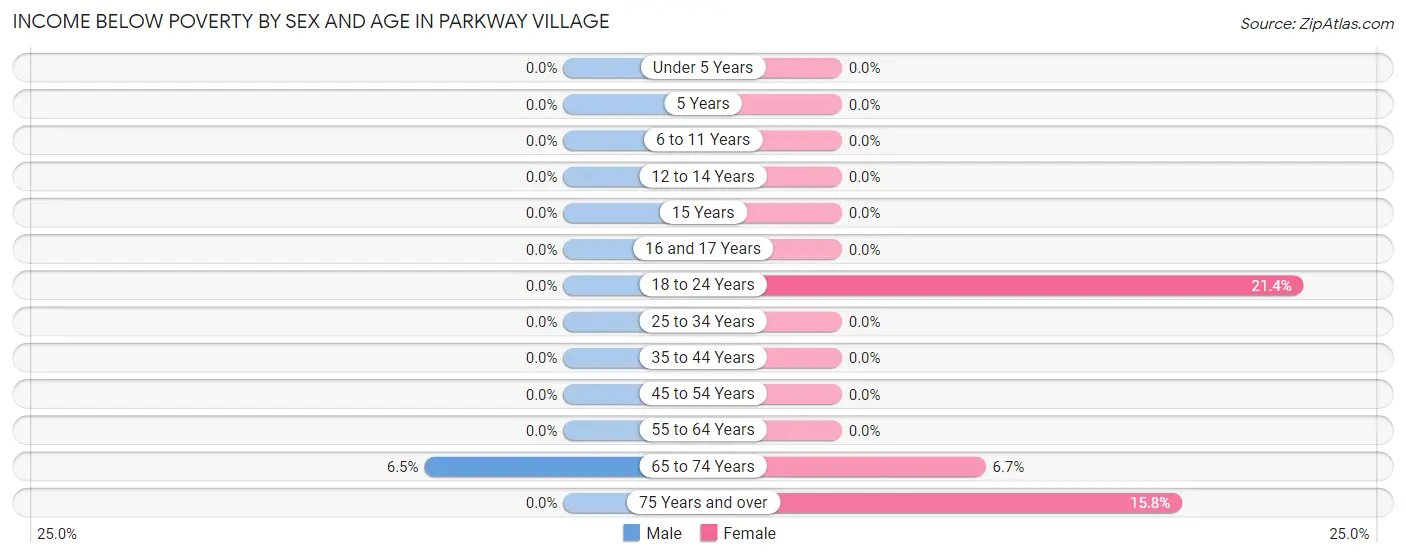
| Age Bracket | Male | Female |
| Under 5 Years | 0 (0.0%) | 0 (0.0%) |
| 5 Years | 0 (0.0%) | 0 (0.0%) |
| 6 to 11 Years | 0 (0.0%) | 0 (0.0%) |
| 12 to 14 Years | 0 (0.0%) | 0 (0.0%) |
| 15 Years | 0 (0.0%) | 0 (0.0%) |
| 16 and 17 Years | 0 (0.0%) | 0 (0.0%) |
| 18 to 24 Years | 0 (0.0%) | 3 (21.4%) |
| 25 to 34 Years | 0 (0.0%) | 0 (0.0%) |
| 35 to 44 Years | 0 (0.0%) | 0 (0.0%) |
| 45 to 54 Years | 0 (0.0%) | 0 (0.0%) |
| 55 to 64 Years | 0 (0.0%) | 0 (0.0%) |
| 65 to 74 Years | 2 (6.5%) | 3 (6.7%) |
| 75 Years and over | 0 (0.0%) | 3 (15.8%) |
| Total | 2 (0.7%) | 9 (2.5%) |
Income Above Poverty by Sex and Age in Parkway Village
According to the poverty statistics in Parkway Village, males aged under 5 years and females aged under 5 years are the age groups that are most secure financially, with 100.0% of males and 100.0% of females in these age groups living above the poverty line.
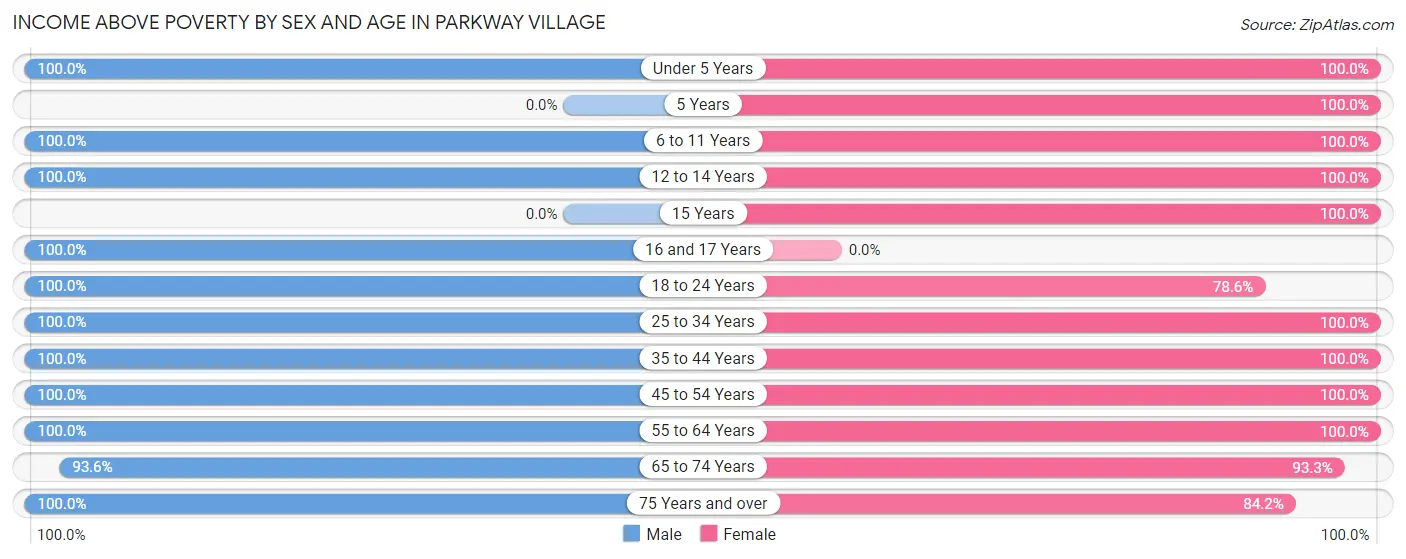
| Age Bracket | Male | Female |
| Under 5 Years | 13 (100.0%) | 16 (100.0%) |
| 5 Years | 0 (0.0%) | 12 (100.0%) |
| 6 to 11 Years | 32 (100.0%) | 13 (100.0%) |
| 12 to 14 Years | 3 (100.0%) | 19 (100.0%) |
| 15 Years | 0 (0.0%) | 7 (100.0%) |
| 16 and 17 Years | 2 (100.0%) | 0 (0.0%) |
| 18 to 24 Years | 5 (100.0%) | 11 (78.6%) |
| 25 to 34 Years | 57 (100.0%) | 69 (100.0%) |
| 35 to 44 Years | 50 (100.0%) | 65 (100.0%) |
| 45 to 54 Years | 42 (100.0%) | 32 (100.0%) |
| 55 to 64 Years | 31 (100.0%) | 42 (100.0%) |
| 65 to 74 Years | 29 (93.5%) | 42 (93.3%) |
| 75 Years and over | 3 (100.0%) | 16 (84.2%) |
| Total | 267 (99.3%) | 344 (97.5%) |
Income Below Poverty Among Married-Couple Families in Parkway Village
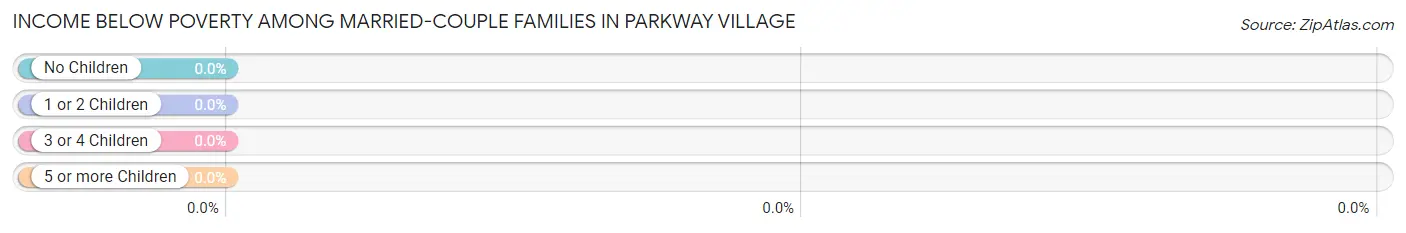
| Children | Above Poverty | Below Poverty |
| No Children | 66 (100.0%) | 0 (0.0%) |
| 1 or 2 Children | 34 (100.0%) | 0 (0.0%) |
| 3 or 4 Children | 21 (100.0%) | 0 (0.0%) |
| 5 or more Children | 0 (0.0%) | 0 (0.0%) |
| Total | 121 (100.0%) | 0 (0.0%) |
Income Below Poverty Among Single-Parent Households in Parkway Village
| Children | Single Father | Single Mother |
| No Children | 0 (0.0%) | 0 (0.0%) |
| 1 or 2 Children | 0 (0.0%) | 0 (0.0%) |
| 3 or 4 Children | 0 (0.0%) | 0 (0.0%) |
| 5 or more Children | 0 (0.0%) | 0 (0.0%) |
| Total | 0 (0.0%) | 0 (0.0%) |
Income Below Poverty Among Married-Couple vs Single-Parent Households in Parkway Village
| Children | Married-Couple Families | Single-Parent Households |
| No Children | 0 (0.0%) | 0 (0.0%) |
| 1 or 2 Children | 0 (0.0%) | 0 (0.0%) |
| 3 or 4 Children | 0 (0.0%) | 0 (0.0%) |
| 5 or more Children | 0 (0.0%) | 0 (0.0%) |
| Total | 0 (0.0%) | 0 (0.0%) |
Race in Parkway Village
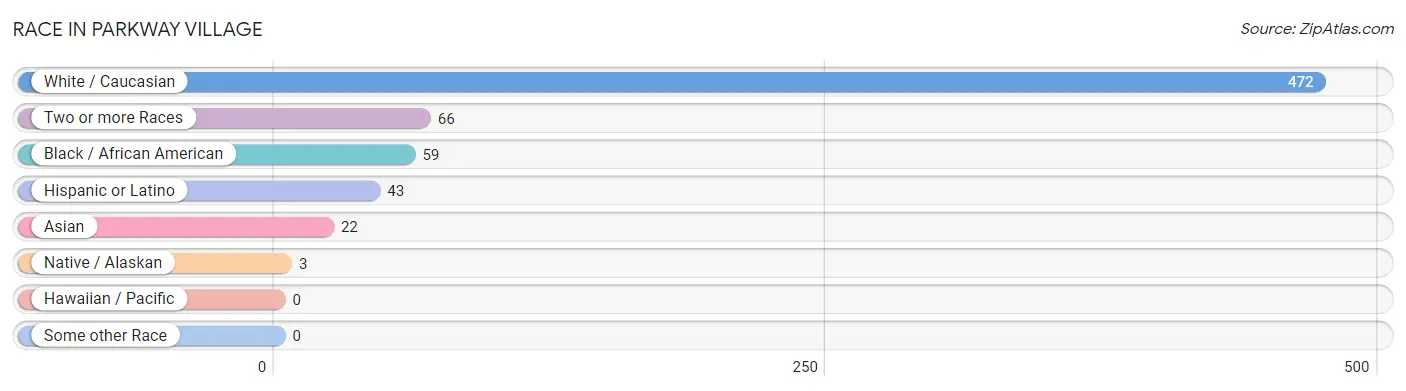
The most populous races in Parkway Village are White / Caucasian (472 | 75.9%), Two or more Races (66 | 10.6%), and Black / African American (59 | 9.5%).
| Race | # Population | % Population |
| Asian | 22 | 3.5% |
| Black / African American | 59 | 9.5% |
| Hawaiian / Pacific | 0 | 0.0% |
| Hispanic or Latino | 43 | 6.9% |
| Native / Alaskan | 3 | 0.5% |
| White / Caucasian | 472 | 75.9% |
| Two or more Races | 66 | 10.6% |
| Some other Race | 0 | 0.0% |
| Total | 622 | 100.0% |
Ancestry in Parkway Village
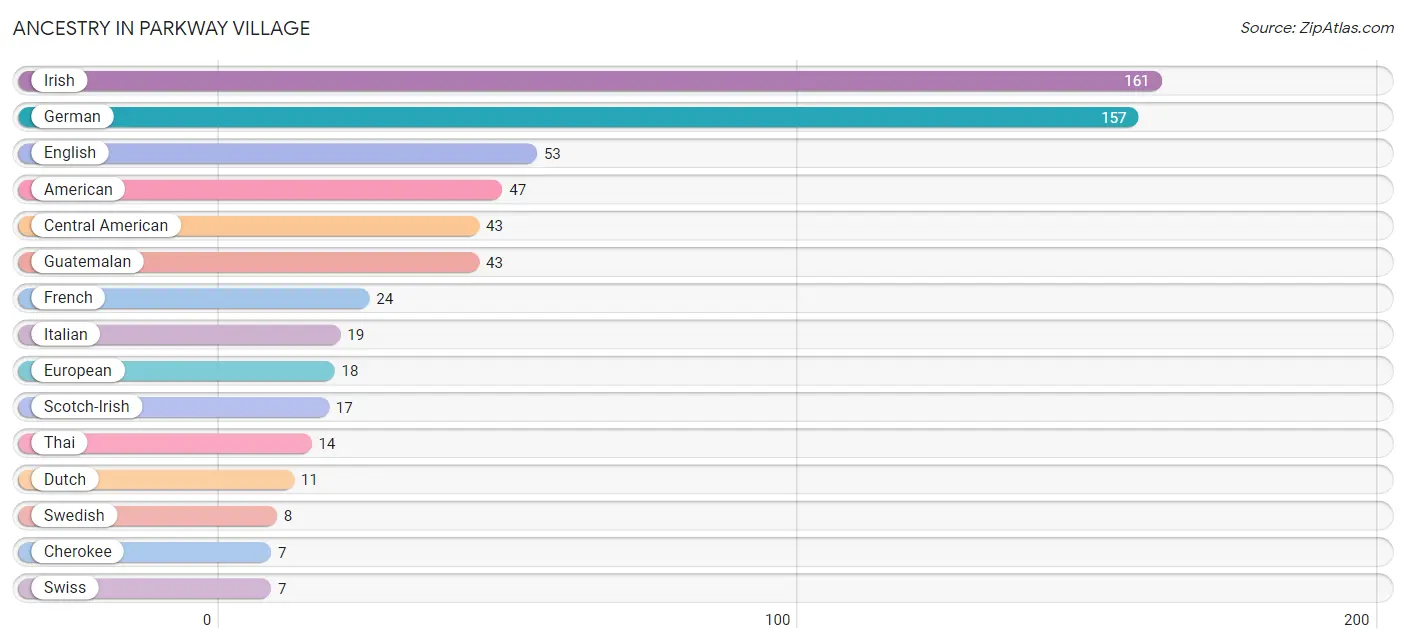
The most populous ancestries reported in Parkway Village are Irish (161 | 25.9%), German (157 | 25.2%), English (53 | 8.5%), American (47 | 7.6%), and Central American (43 | 6.9%), together accounting for 74.1% of all Parkway Village residents.
| Ancestry | # Population | % Population |
| American | 47 | 7.6% |
| Arab | 6 | 1.0% |
| British | 2 | 0.3% |
| Central American | 43 | 6.9% |
| Cherokee | 7 | 1.1% |
| Dutch | 11 | 1.8% |
| English | 53 | 8.5% |
| European | 18 | 2.9% |
| French | 24 | 3.9% |
| German | 157 | 25.2% |
| Guatemalan | 43 | 6.9% |
| Indian (Asian) | 5 | 0.8% |
| Irish | 161 | 25.9% |
| Italian | 19 | 3.0% |
| Lebanese | 2 | 0.3% |
| Northern European | 2 | 0.3% |
| Polish | 5 | 0.8% |
| Scotch-Irish | 17 | 2.7% |
| Scottish | 3 | 0.5% |
| Slavic | 2 | 0.3% |
| Sri Lankan | 5 | 0.8% |
| Subsaharan African | 3 | 0.5% |
| Swedish | 8 | 1.3% |
| Swiss | 7 | 1.1% |
| Syrian | 2 | 0.3% |
| Thai | 14 | 2.2% |
| Trinidadian and Tobagonian | 3 | 0.5% |
| Welsh | 4 | 0.6% | View All 28 Rows |
Immigrants in Parkway Village
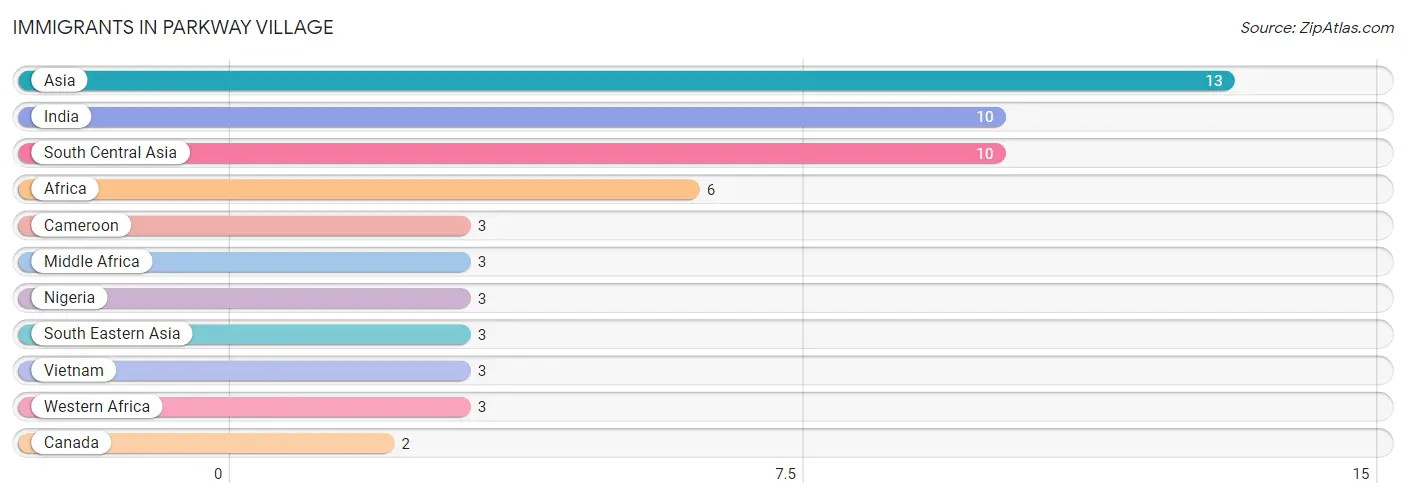
The most numerous immigrant groups reported in Parkway Village came from Asia (13 | 2.1%), India (10 | 1.6%), South Central Asia (10 | 1.6%), Africa (6 | 1.0%), and Cameroon (3 | 0.5%), together accounting for 6.7% of all Parkway Village residents.
| Immigration Origin | # Population | % Population |
| Africa | 6 | 1.0% |
| Asia | 13 | 2.1% |
| Cameroon | 3 | 0.5% |
| Canada | 2 | 0.3% |
| India | 10 | 1.6% |
| Middle Africa | 3 | 0.5% |
| Nigeria | 3 | 0.5% |
| South Central Asia | 10 | 1.6% |
| South Eastern Asia | 3 | 0.5% |
| Vietnam | 3 | 0.5% |
| Western Africa | 3 | 0.5% | View All 11 Rows |
Sex and Age in Parkway Village
Sex and Age in Parkway Village
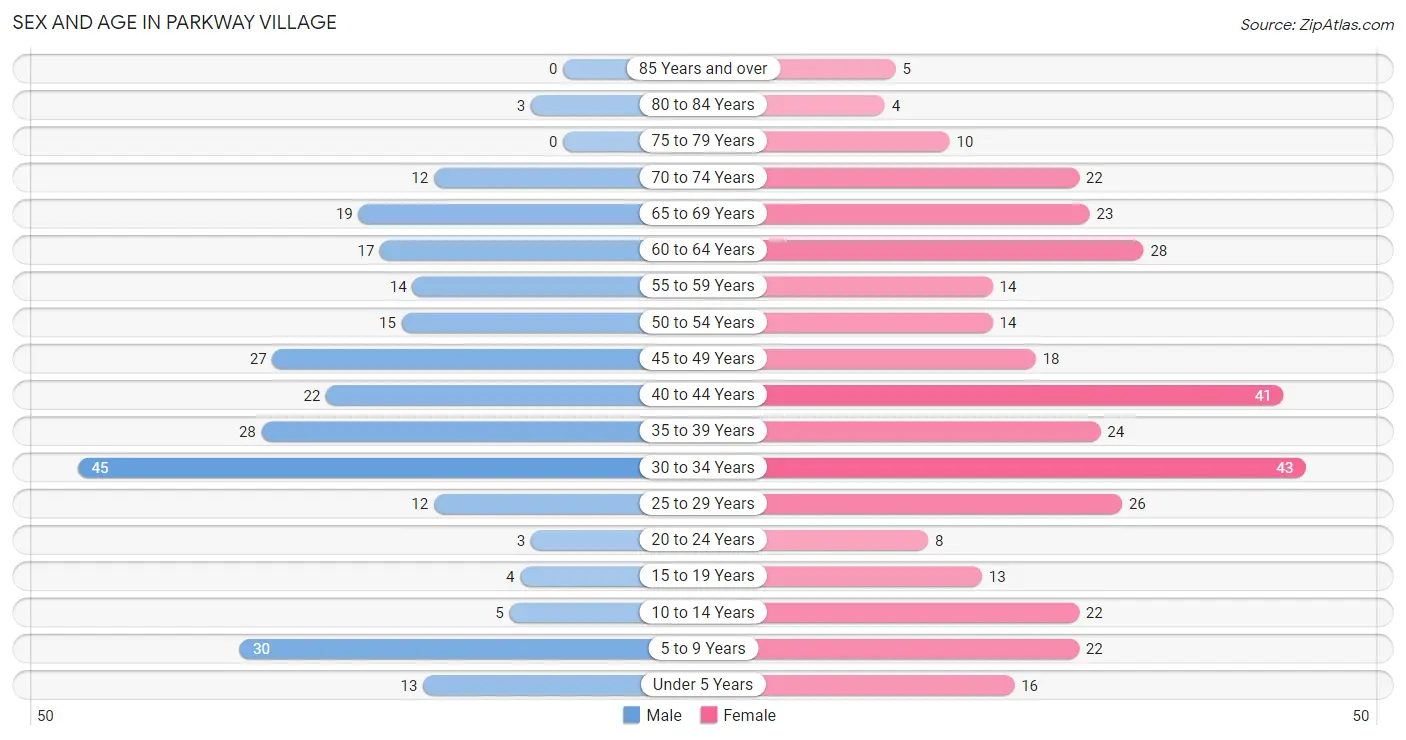
The most populous age groups in Parkway Village are 30 to 34 Years (45 | 16.7%) for men and 30 to 34 Years (43 | 12.2%) for women.
| Age Bracket | Male | Female |
| Under 5 Years | 13 (4.8%) | 16 (4.5%) |
| 5 to 9 Years | 30 (11.2%) | 22 (6.2%) |
| 10 to 14 Years | 5 (1.9%) | 22 (6.2%) |
| 15 to 19 Years | 4 (1.5%) | 13 (3.7%) |
| 20 to 24 Years | 3 (1.1%) | 8 (2.3%) |
| 25 to 29 Years | 12 (4.5%) | 26 (7.4%) |
| 30 to 34 Years | 45 (16.7%) | 43 (12.2%) |
| 35 to 39 Years | 28 (10.4%) | 24 (6.8%) |
| 40 to 44 Years | 22 (8.2%) | 41 (11.6%) |
| 45 to 49 Years | 27 (10.0%) | 18 (5.1%) |
| 50 to 54 Years | 15 (5.6%) | 14 (4.0%) |
| 55 to 59 Years | 14 (5.2%) | 14 (4.0%) |
| 60 to 64 Years | 17 (6.3%) | 28 (7.9%) |
| 65 to 69 Years | 19 (7.1%) | 23 (6.5%) |
| 70 to 74 Years | 12 (4.5%) | 22 (6.2%) |
| 75 to 79 Years | 0 (0.0%) | 10 (2.8%) |
| 80 to 84 Years | 3 (1.1%) | 4 (1.1%) |
| 85 Years and over | 0 (0.0%) | 5 (1.4%) |
| Total | 269 (100.0%) | 353 (100.0%) |
Families and Households in Parkway Village
Median Family Size in Parkway Village
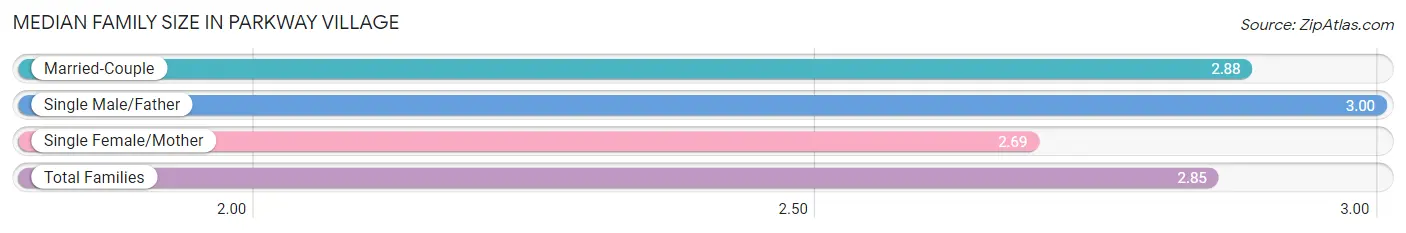
The median family size in Parkway Village is 2.85 persons per family, with single male/father families (7 | 4.5%) accounting for the largest median family size of 3 persons per family. On the other hand, single female/mother families (29 | 18.5%) represent the smallest median family size with 2.69 persons per family.
| Family Type | # Families | Family Size |
| Married-Couple | 121 (77.1%) | 2.88 |
| Single Male/Father | 7 (4.5%) | 3.00 |
| Single Female/Mother | 29 (18.5%) | 2.69 |
| Total Families | 157 (100.0%) | 2.85 |
Median Household Size in Parkway Village
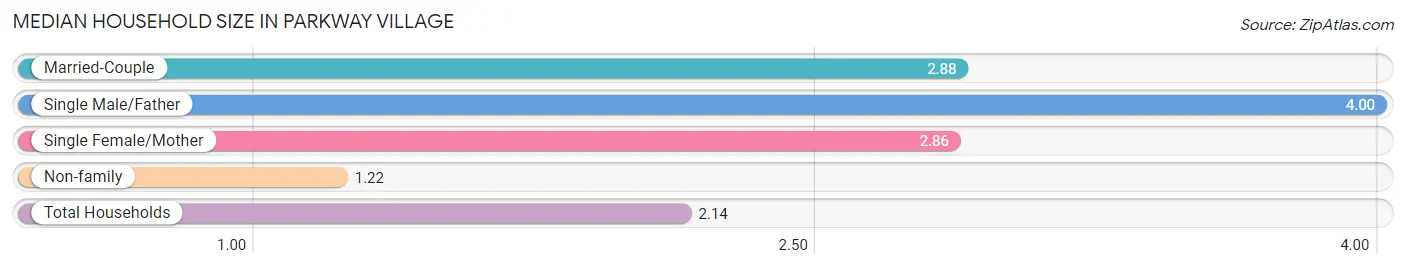
The median household size in Parkway Village is 2.14 persons per household, with single male/father households (7 | 2.4%) accounting for the largest median household size of 4 persons per household. non-family households (133 | 45.9%) represent the smallest median household size with 1.22 persons per household.
| Household Type | # Households | Household Size |
| Married-Couple | 121 (41.7%) | 2.88 |
| Single Male/Father | 7 (2.4%) | 4.00 |
| Single Female/Mother | 29 (10.0%) | 2.86 |
| Non-family | 133 (45.9%) | 1.22 |
| Total Households | 290 (100.0%) | 2.14 |
Household Size by Marriage Status in Parkway Village
Out of a total of 290 households in Parkway Village, 157 (54.1%) are family households, while 133 (45.9%) are nonfamily households. The most numerous type of family households are 2-person households, comprising 66, and the most common type of nonfamily households are 1-person households, comprising 111.
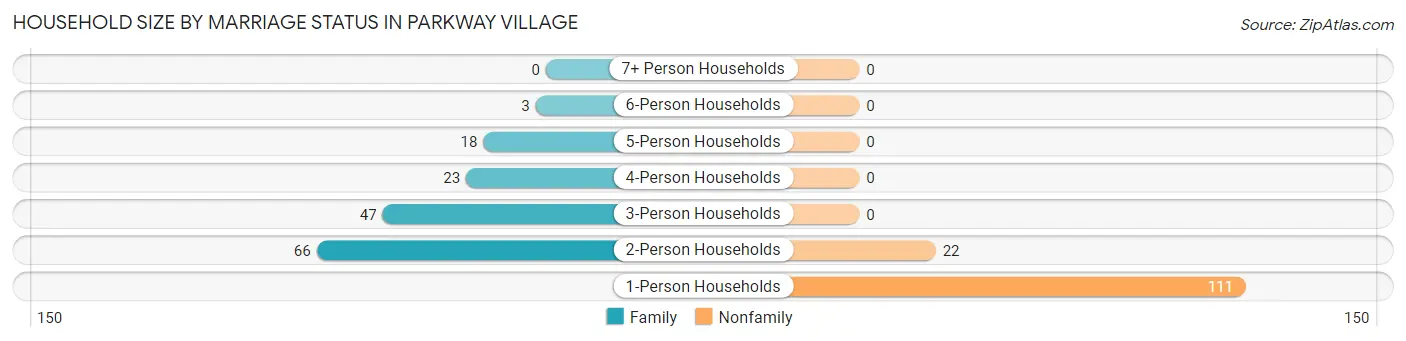
| Household Size | Family Households | Nonfamily Households |
| 1-Person Households | - | 111 (38.3%) |
| 2-Person Households | 66 (22.8%) | 22 (7.6%) |
| 3-Person Households | 47 (16.2%) | 0 (0.0%) |
| 4-Person Households | 23 (7.9%) | 0 (0.0%) |
| 5-Person Households | 18 (6.2%) | 0 (0.0%) |
| 6-Person Households | 3 (1.0%) | 0 (0.0%) |
| 7+ Person Households | 0 (0.0%) | 0 (0.0%) |
| Total | 157 (54.1%) | 133 (45.9%) |
Female Fertility in Parkway Village
Fertility by Age in Parkway Village
Average fertility rate in Parkway Village is 29.0 births per 1,000 women. Women in the age bracket of 20 to 34 years have the highest fertility rate with 39.0 births per 1,000 women. Women in the age bracket of 20 to 34 years acount for 60.0% of all women with births.
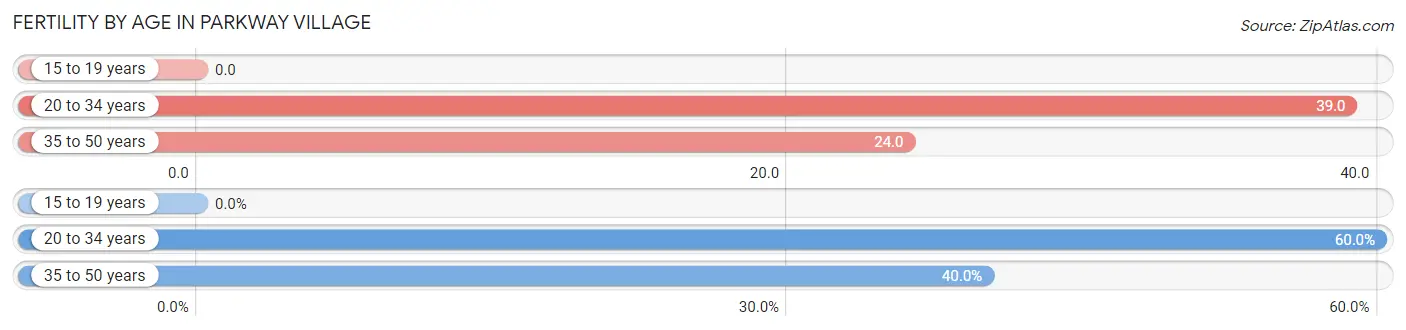
| Age Bracket | Women with Births | Births / 1,000 Women |
| 15 to 19 years | 0 (0.0%) | 0.0 |
| 20 to 34 years | 3 (60.0%) | 39.0 |
| 35 to 50 years | 2 (40.0%) | 24.0 |
| Total | 5 (100.0%) | 29.0 |
Fertility by Age by Marriage Status in Parkway Village
40.0% of women with births (5) in Parkway Village are married. The highest percentage of unmarried women with births falls into 20 to 34 years age bracket with 100.0% of them unmarried at the time of birth, while the lowest percentage of unmarried women with births belong to 35 to 50 years age bracket with 0.0% of them unmarried.
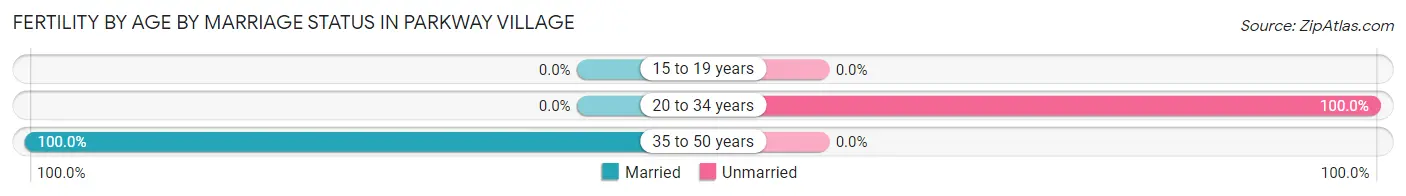
| Age Bracket | Married | Unmarried |
| 15 to 19 years | 0 (0.0%) | 0 (0.0%) |
| 20 to 34 years | 0 (0.0%) | 3 (100.0%) |
| 35 to 50 years | 2 (100.0%) | 0 (0.0%) |
| Total | 2 (40.0%) | 3 (60.0%) |
Fertility by Education in Parkway Village
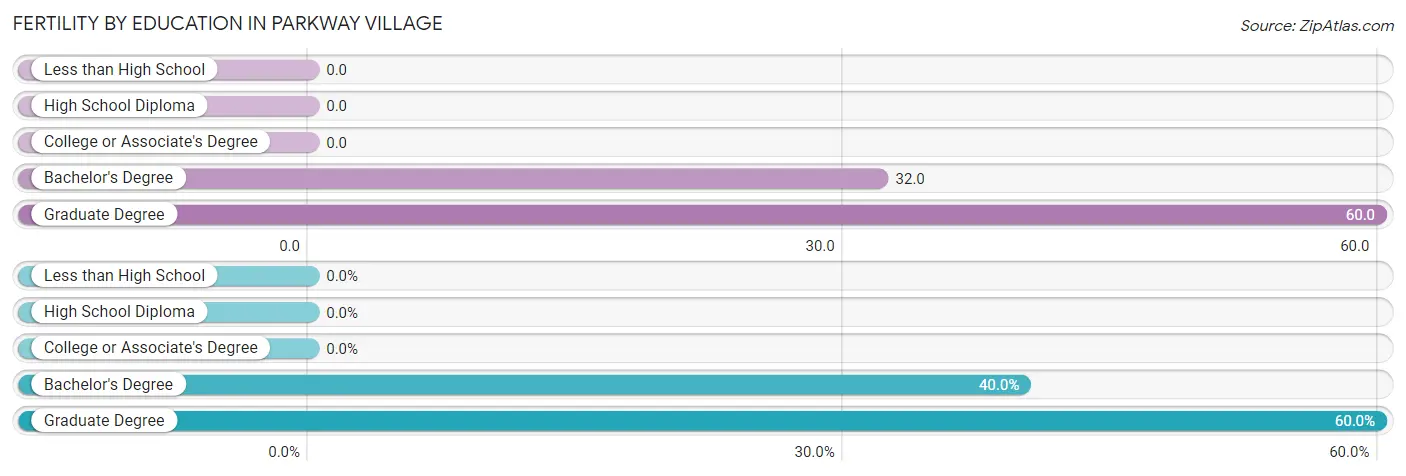
| Educational Attainment | Women with Births | Births / 1,000 Women |
| Less than High School | 0 (0.0%) | 0.0 |
| High School Diploma | 0 (0.0%) | 0.0 |
| College or Associate's Degree | 0 (0.0%) | 0.0 |
| Bachelor's Degree | 2 (40.0%) | 32.0 |
| Graduate Degree | 3 (60.0%) | 60.0 |
| Total | 5 (100.0%) | 29.0 |
Fertility by Education by Marriage Status in Parkway Village
60.0% of women with births in Parkway Village are unmarried. Women with the educational attainment of bachelor's degree are most likely to be married with 100.0% of them married at childbirth, while women with the educational attainment of graduate degree are least likely to be married with 100.0% of them unmarried at childbirth.
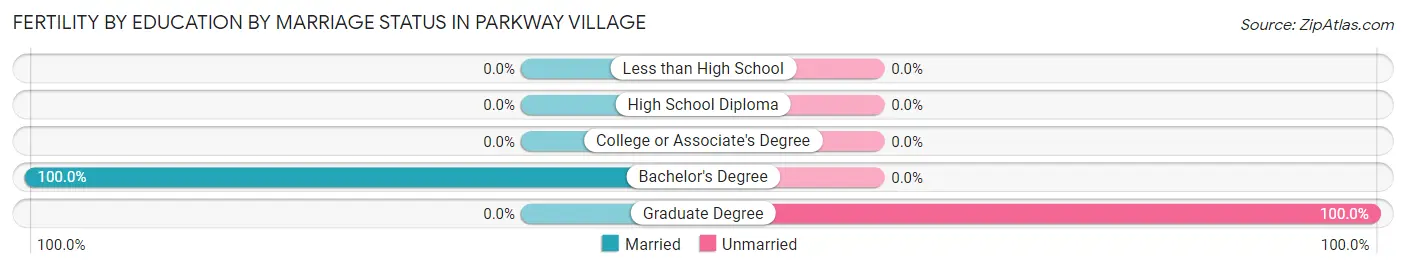
| Educational Attainment | Married | Unmarried |
| Less than High School | 0 (0.0%) | 0 (0.0%) |
| High School Diploma | 0 (0.0%) | 0 (0.0%) |
| College or Associate's Degree | 0 (0.0%) | 0 (0.0%) |
| Bachelor's Degree | 2 (100.0%) | 0 (0.0%) |
| Graduate Degree | 0 (0.0%) | 3 (100.0%) |
| Total | 2 (40.0%) | 3 (60.0%) |
Employment Characteristics in Parkway Village
Employment by Class of Employer in Parkway Village
Among the 383 employed individuals in Parkway Village, private company employees (278 | 72.6%), not-for-profit organizations (35 | 9.1%), and local government employees (35 | 9.1%) make up the most common classes of employment.
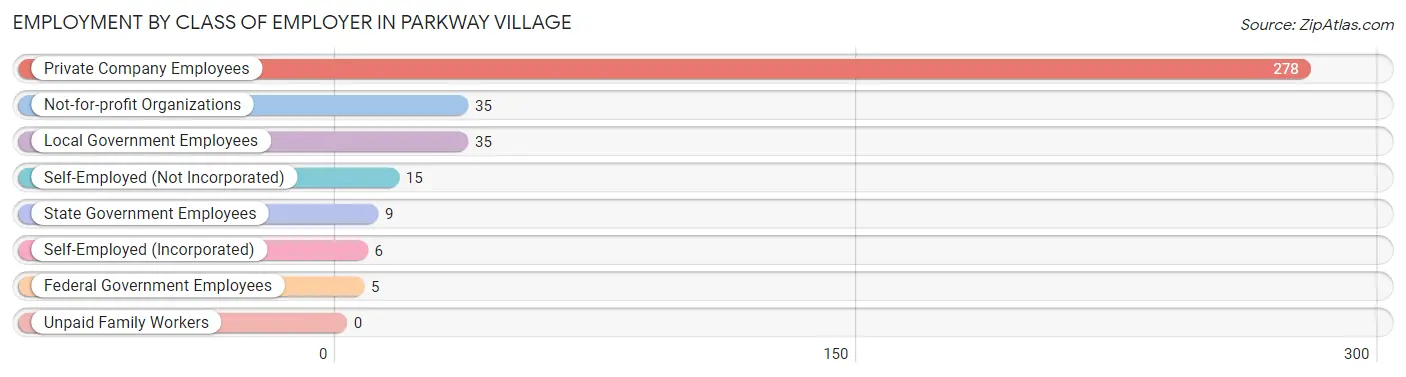
| Employer Class | # Employees | % Employees |
| Private Company Employees | 278 | 72.6% |
| Self-Employed (Incorporated) | 6 | 1.6% |
| Self-Employed (Not Incorporated) | 15 | 3.9% |
| Not-for-profit Organizations | 35 | 9.1% |
| Local Government Employees | 35 | 9.1% |
| State Government Employees | 9 | 2.4% |
| Federal Government Employees | 5 | 1.3% |
| Unpaid Family Workers | 0 | 0.0% |
| Total | 383 | 100.0% |
Employment Status by Age in Parkway Village
According to the labor force statistics for Parkway Village, out of the total population over 16 years of age (507), 77.5% or 393 individuals are in the labor force, with 1.3% or 5 of them unemployed. The age group with the highest labor force participation rate is 25 to 29 years, with 100.0% or 38 individuals in the labor force. Within the labor force, the 20 to 24 years age range has the highest percentage of unemployed individuals, with 37.5% or 3 of them being unemployed.
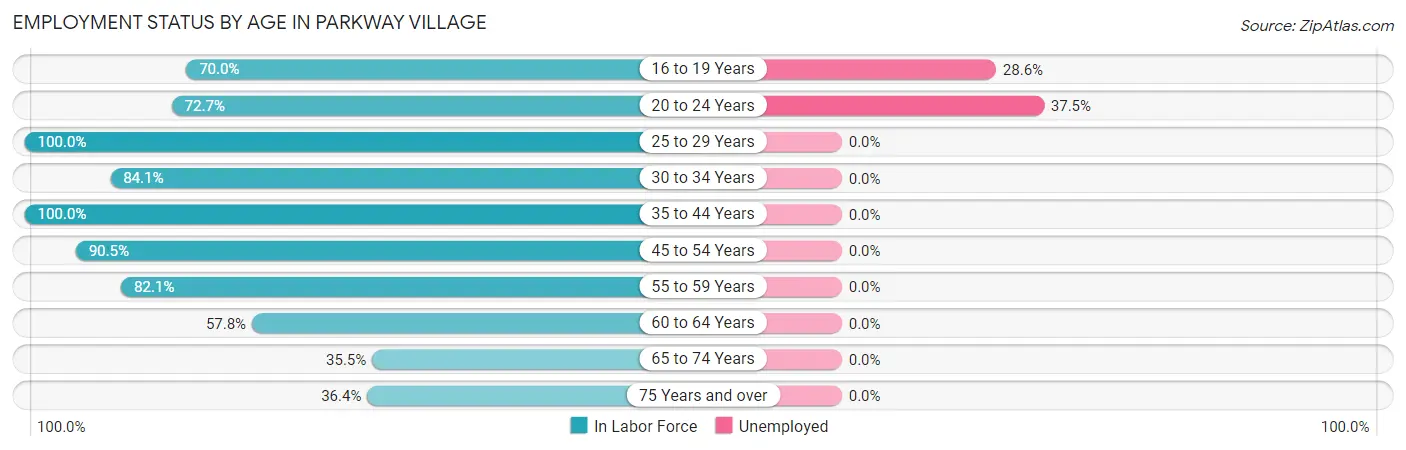
| Age Bracket | In Labor Force | Unemployed |
| 16 to 19 Years | 7 (70.0%) | 2 (28.6%) |
| 20 to 24 Years | 8 (72.7%) | 3 (37.5%) |
| 25 to 29 Years | 38 (100.0%) | 0 (0.0%) |
| 30 to 34 Years | 74 (84.1%) | 0 (0.0%) |
| 35 to 44 Years | 115 (100.0%) | 0 (0.0%) |
| 45 to 54 Years | 67 (90.5%) | 0 (0.0%) |
| 55 to 59 Years | 23 (82.1%) | 0 (0.0%) |
| 60 to 64 Years | 26 (57.8%) | 0 (0.0%) |
| 65 to 74 Years | 27 (35.5%) | 0 (0.0%) |
| 75 Years and over | 8 (36.4%) | 0 (0.0%) |
| Total | 393 (77.5%) | 5 (1.3%) |
Employment Status by Educational Attainment in Parkway Village
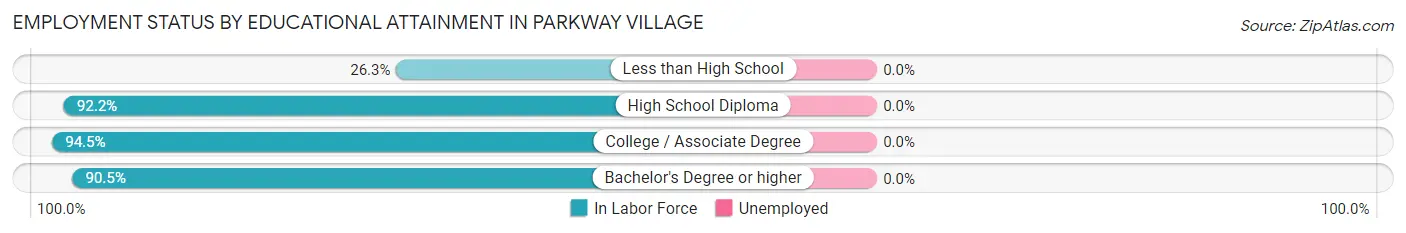
| Educational Attainment | In Labor Force | Unemployed |
| Less than High School | 5 (26.3%) | 0 (0.0%) |
| High School Diploma | 59 (92.2%) | 0 (0.0%) |
| College / Associate Degree | 69 (94.5%) | 0 (0.0%) |
| Bachelor's Degree or higher | 210 (90.5%) | 0 (0.0%) |
| Total | 343 (88.4%) | 0 (0.0%) |
Employment Occupations by Sex in Parkway Village
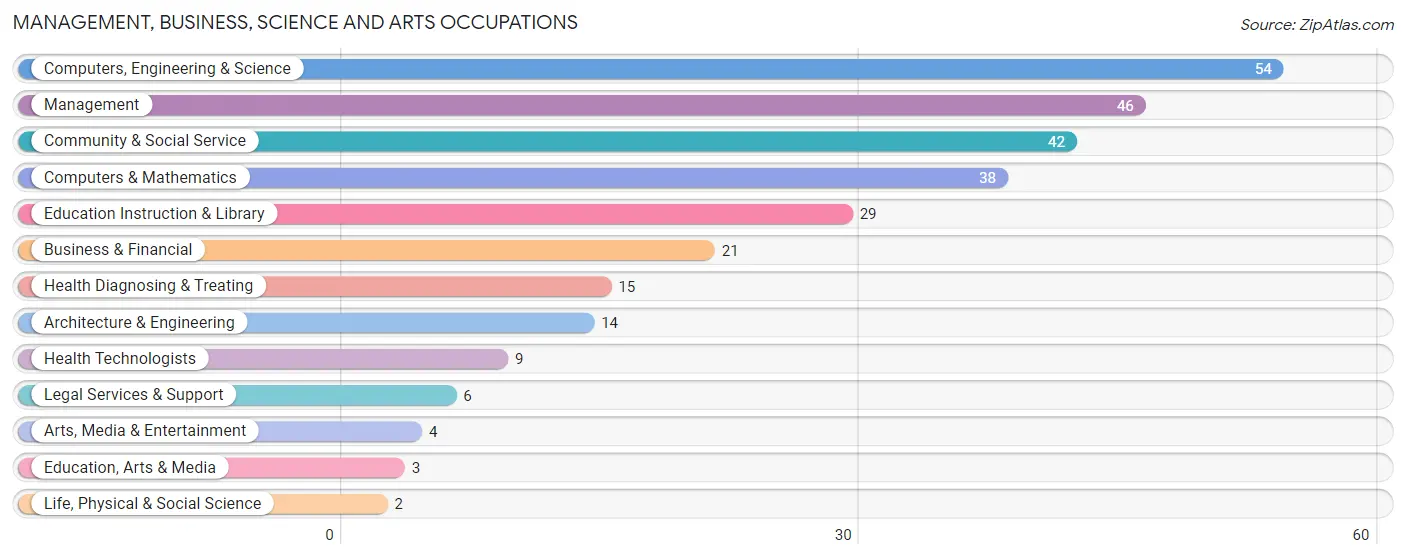
Management, Business, Science and Arts Occupations
The most common Management, Business, Science and Arts occupations in Parkway Village are Computers, Engineering & Science (54 | 13.9%), Management (46 | 11.9%), Community & Social Service (42 | 10.8%), Computers & Mathematics (38 | 9.8%), and Education Instruction & Library (29 | 7.5%).
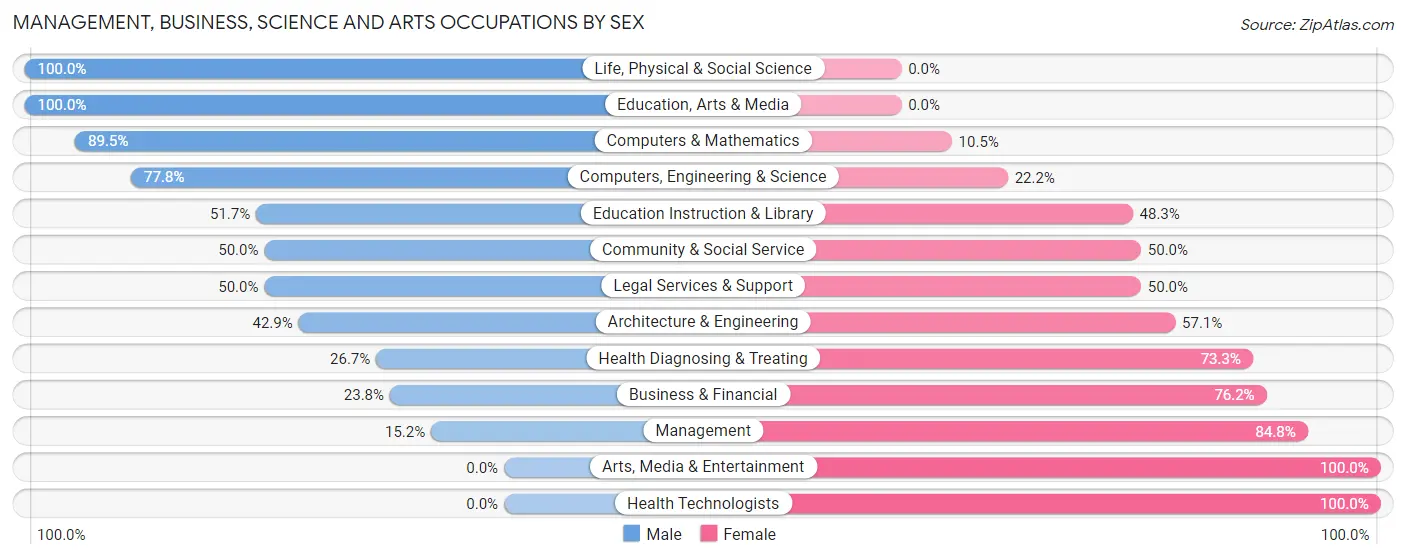
Management, Business, Science and Arts Occupations by Sex
Within the Management, Business, Science and Arts occupations in Parkway Village, the most male-oriented occupations are Life, Physical & Social Science (100.0%), Education, Arts & Media (100.0%), and Computers & Mathematics (89.5%), while the most female-oriented occupations are Arts, Media & Entertainment (100.0%), Health Technologists (100.0%), and Management (84.8%).
| Occupation | Male | Female |
| Management | 7 (15.2%) | 39 (84.8%) |
| Business & Financial | 5 (23.8%) | 16 (76.2%) |
| Computers, Engineering & Science | 42 (77.8%) | 12 (22.2%) |
| Computers & Mathematics | 34 (89.5%) | 4 (10.5%) |
| Architecture & Engineering | 6 (42.9%) | 8 (57.1%) |
| Life, Physical & Social Science | 2 (100.0%) | 0 (0.0%) |
| Community & Social Service | 21 (50.0%) | 21 (50.0%) |
| Education, Arts & Media | 3 (100.0%) | 0 (0.0%) |
| Legal Services & Support | 3 (50.0%) | 3 (50.0%) |
| Education Instruction & Library | 15 (51.7%) | 14 (48.3%) |
| Arts, Media & Entertainment | 0 (0.0%) | 4 (100.0%) |
| Health Diagnosing & Treating | 4 (26.7%) | 11 (73.3%) |
| Health Technologists | 0 (0.0%) | 9 (100.0%) |
| Total (Category) | 79 (44.4%) | 99 (55.6%) |
| Total (Overall) | 181 (46.7%) | 207 (53.3%) |
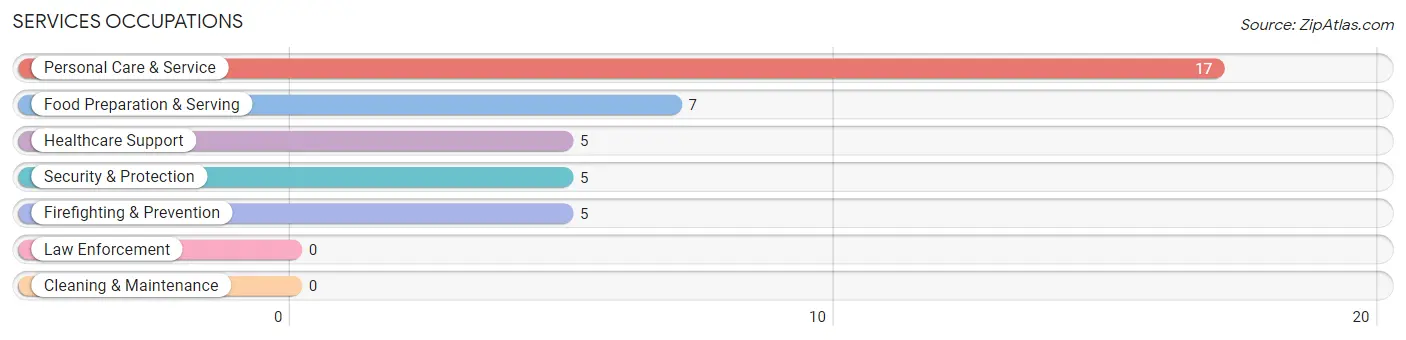
Services Occupations
The most common Services occupations in Parkway Village are Personal Care & Service (17 | 4.4%), Food Preparation & Serving (7 | 1.8%), Healthcare Support (5 | 1.3%), Security & Protection (5 | 1.3%), and Firefighting & Prevention (5 | 1.3%).
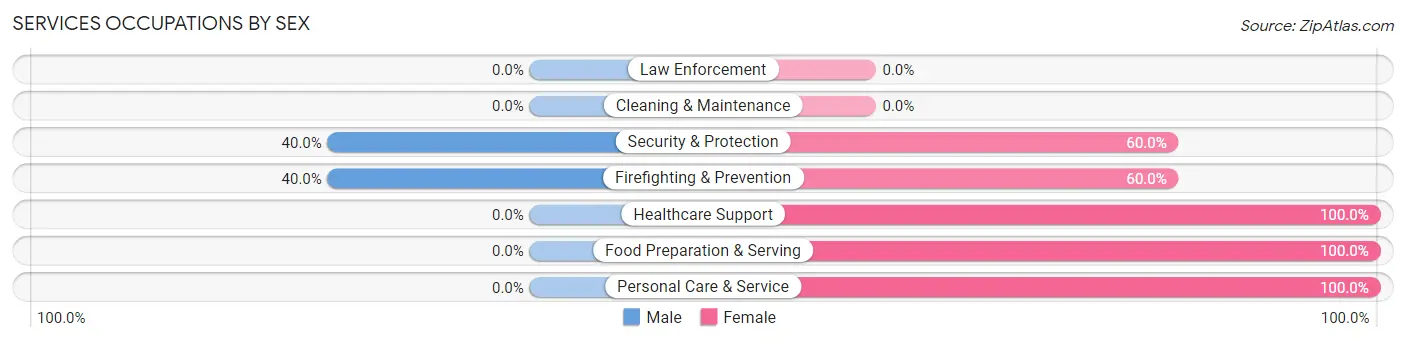
Services Occupations by Sex
Within the Services occupations in Parkway Village, the most male-oriented occupations are Security & Protection (40.0%), and Firefighting & Prevention (40.0%), while the most female-oriented occupations are Healthcare Support (100.0%), Food Preparation & Serving (100.0%), and Personal Care & Service (100.0%).
| Occupation | Male | Female |
| Healthcare Support | 0 (0.0%) | 5 (100.0%) |
| Security & Protection | 2 (40.0%) | 3 (60.0%) |
| Firefighting & Prevention | 2 (40.0%) | 3 (60.0%) |
| Law Enforcement | 0 (0.0%) | 0 (0.0%) |
| Food Preparation & Serving | 0 (0.0%) | 7 (100.0%) |
| Cleaning & Maintenance | 0 (0.0%) | 0 (0.0%) |
| Personal Care & Service | 0 (0.0%) | 17 (100.0%) |
| Total (Category) | 2 (5.9%) | 32 (94.1%) |
| Total (Overall) | 181 (46.7%) | 207 (53.3%) |
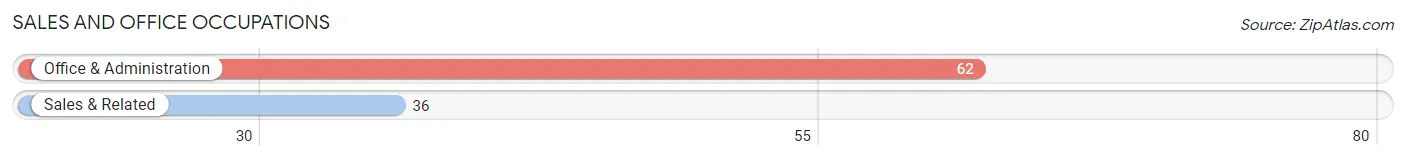
Sales and Office Occupations
The most common Sales and Office occupations in Parkway Village are Office & Administration (62 | 16.0%), and Sales & Related (36 | 9.3%).
Sales and Office Occupations by Sex
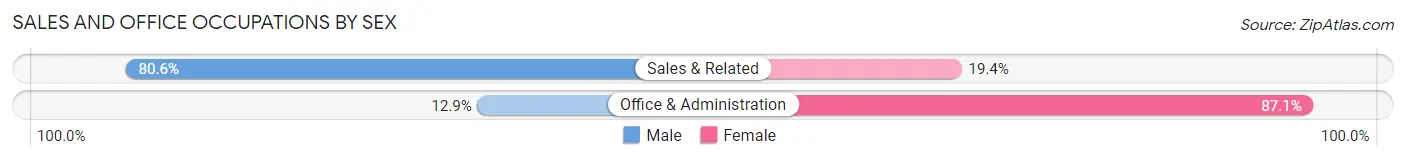
| Occupation | Male | Female |
| Sales & Related | 29 (80.6%) | 7 (19.4%) |
| Office & Administration | 8 (12.9%) | 54 (87.1%) |
| Total (Category) | 37 (37.8%) | 61 (62.2%) |
| Total (Overall) | 181 (46.7%) | 207 (53.3%) |
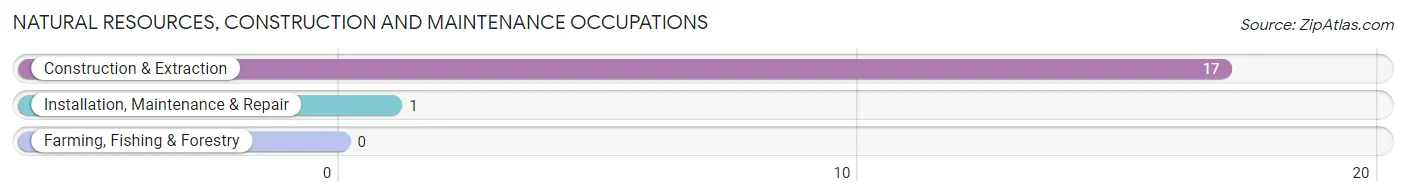
Natural Resources, Construction and Maintenance Occupations
The most common Natural Resources, Construction and Maintenance occupations in Parkway Village are Construction & Extraction (17 | 4.4%), and Installation, Maintenance & Repair (1 | 0.3%).
Natural Resources, Construction and Maintenance Occupations by Sex
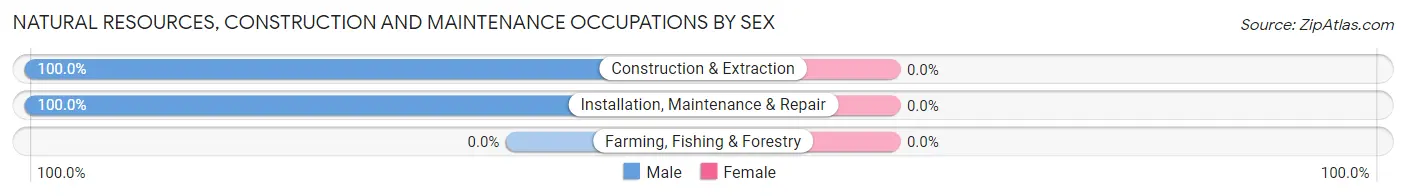
| Occupation | Male | Female |
| Farming, Fishing & Forestry | 0 (0.0%) | 0 (0.0%) |
| Construction & Extraction | 17 (100.0%) | 0 (0.0%) |
| Installation, Maintenance & Repair | 1 (100.0%) | 0 (0.0%) |
| Total (Category) | 18 (100.0%) | 0 (0.0%) |
| Total (Overall) | 181 (46.7%) | 207 (53.3%) |
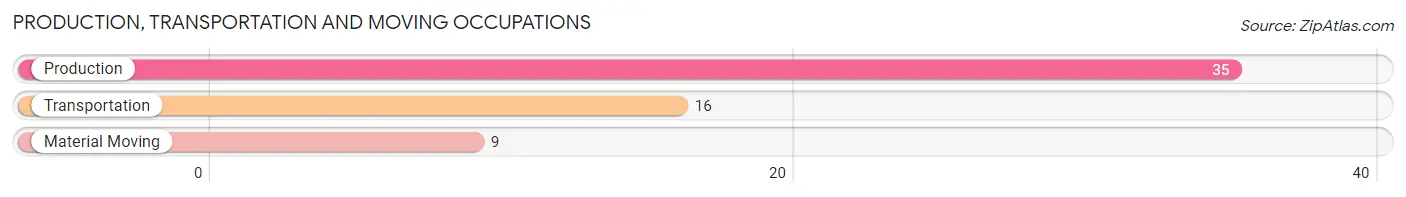
Production, Transportation and Moving Occupations
The most common Production, Transportation and Moving occupations in Parkway Village are Production (35 | 9.0%), Transportation (16 | 4.1%), and Material Moving (9 | 2.3%).
Production, Transportation and Moving Occupations by Sex
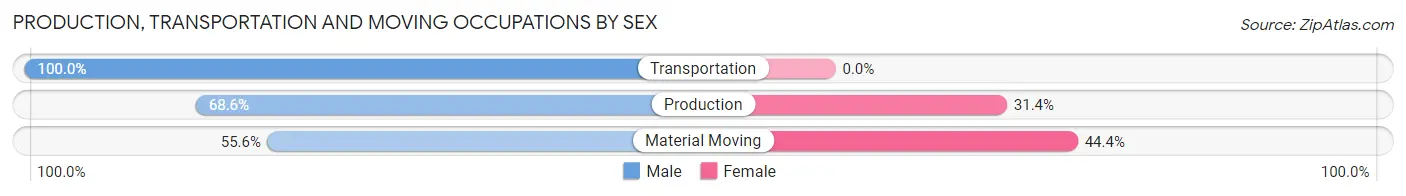
| Occupation | Male | Female |
| Production | 24 (68.6%) | 11 (31.4%) |
| Transportation | 16 (100.0%) | 0 (0.0%) |
| Material Moving | 5 (55.6%) | 4 (44.4%) |
| Total (Category) | 45 (75.0%) | 15 (25.0%) |
| Total (Overall) | 181 (46.7%) | 207 (53.3%) |
Employment Industries by Sex in Parkway Village
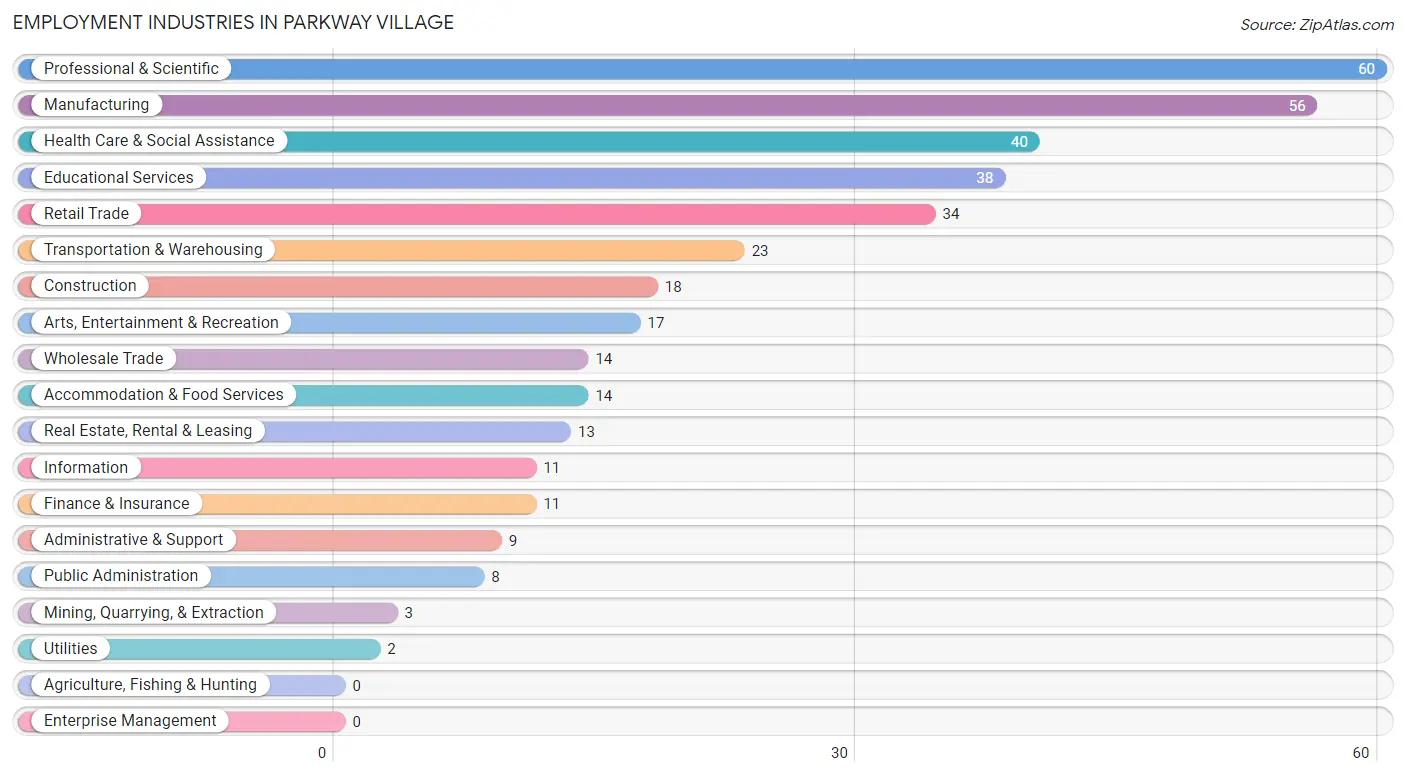
Employment Industries in Parkway Village
The major employment industries in Parkway Village include Professional & Scientific (60 | 15.5%), Manufacturing (56 | 14.4%), Health Care & Social Assistance (40 | 10.3%), Educational Services (38 | 9.8%), and Retail Trade (34 | 8.8%).
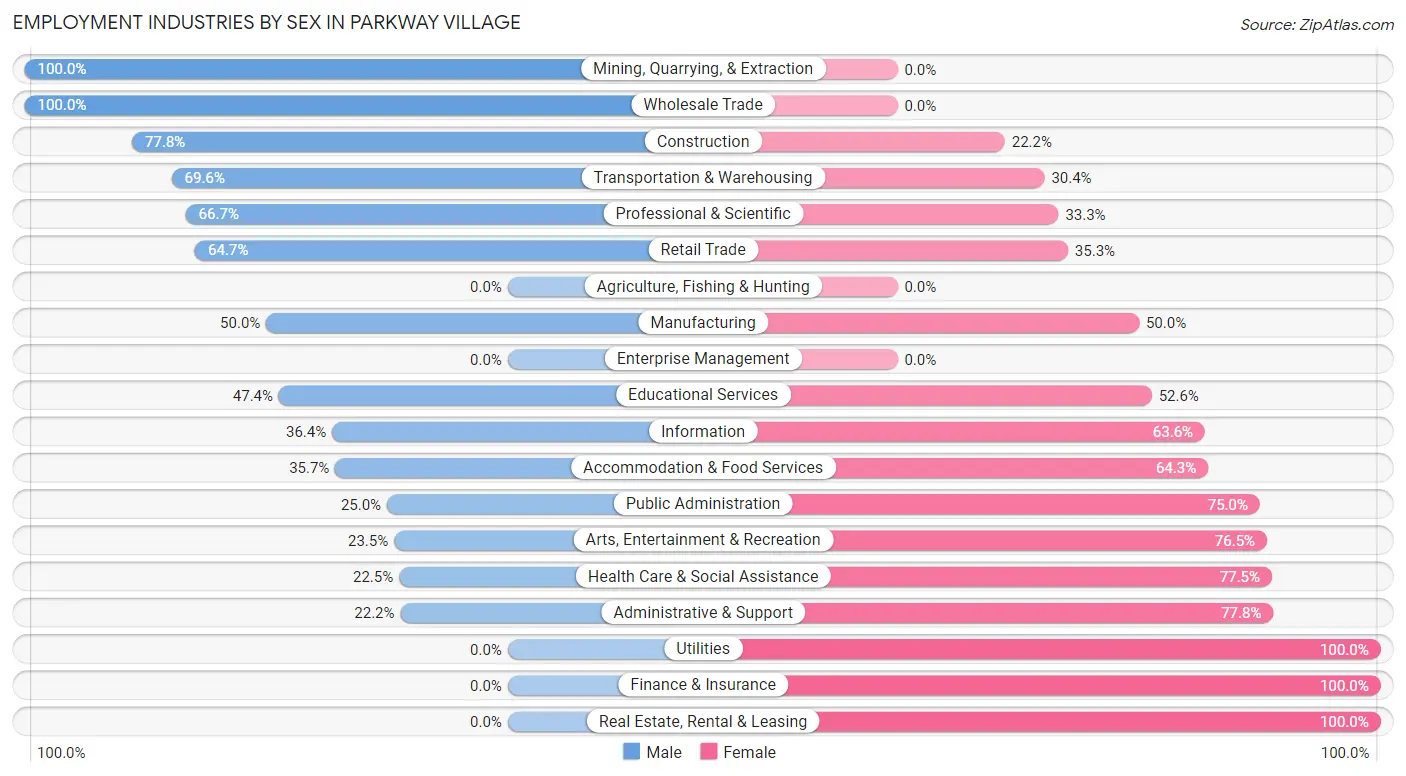
Employment Industries by Sex in Parkway Village
The Parkway Village industries that see more men than women are Mining, Quarrying, & Extraction (100.0%), Wholesale Trade (100.0%), and Construction (77.8%), whereas the industries that tend to have a higher number of women are Utilities (100.0%), Finance & Insurance (100.0%), and Real Estate, Rental & Leasing (100.0%).
| Industry | Male | Female |
| Agriculture, Fishing & Hunting | 0 (0.0%) | 0 (0.0%) |
| Mining, Quarrying, & Extraction | 3 (100.0%) | 0 (0.0%) |
| Construction | 14 (77.8%) | 4 (22.2%) |
| Manufacturing | 28 (50.0%) | 28 (50.0%) |
| Wholesale Trade | 14 (100.0%) | 0 (0.0%) |
| Retail Trade | 22 (64.7%) | 12 (35.3%) |
| Transportation & Warehousing | 16 (69.6%) | 7 (30.4%) |
| Utilities | 0 (0.0%) | 2 (100.0%) |
| Information | 4 (36.4%) | 7 (63.6%) |
| Finance & Insurance | 0 (0.0%) | 11 (100.0%) |
| Real Estate, Rental & Leasing | 0 (0.0%) | 13 (100.0%) |
| Professional & Scientific | 40 (66.7%) | 20 (33.3%) |
| Enterprise Management | 0 (0.0%) | 0 (0.0%) |
| Administrative & Support | 2 (22.2%) | 7 (77.8%) |
| Educational Services | 18 (47.4%) | 20 (52.6%) |
| Health Care & Social Assistance | 9 (22.5%) | 31 (77.5%) |
| Arts, Entertainment & Recreation | 4 (23.5%) | 13 (76.5%) |
| Accommodation & Food Services | 5 (35.7%) | 9 (64.3%) |
| Public Administration | 2 (25.0%) | 6 (75.0%) |
| Total | 181 (46.7%) | 207 (53.3%) |
Education in Parkway Village
School Enrollment in Parkway Village
The most common levels of schooling among the 105 students in Parkway Village are high school (33 | 31.4%), middle school (25 | 23.8%), and elementary school (13 | 12.4%).
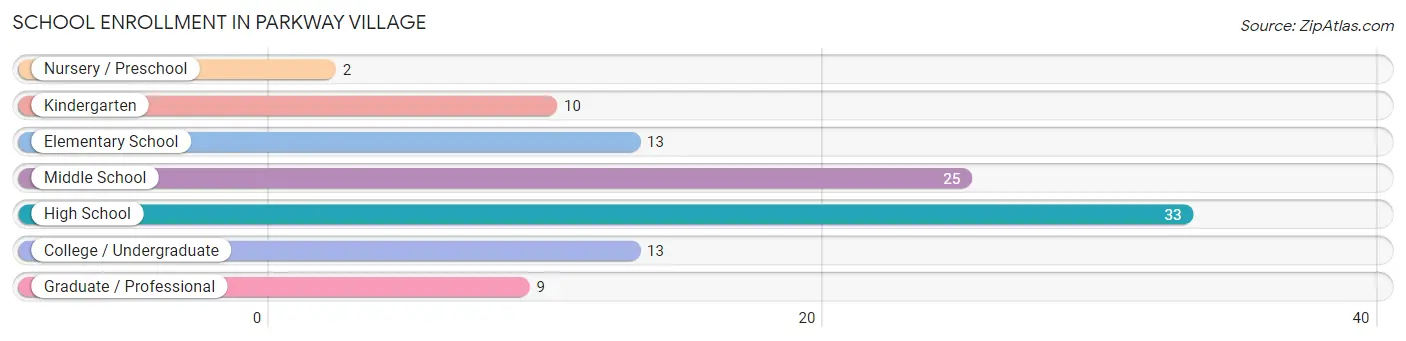
| School Level | # Students | % Students |
| Nursery / Preschool | 2 | 1.9% |
| Kindergarten | 10 | 9.5% |
| Elementary School | 13 | 12.4% |
| Middle School | 25 | 23.8% |
| High School | 33 | 31.4% |
| College / Undergraduate | 13 | 12.4% |
| Graduate / Professional | 9 | 8.6% |
| Total | 105 | 100.0% |
School Enrollment by Age by Funding Source in Parkway Village
Out of a total of 105 students who are enrolled in schools in Parkway Village, 27 (25.7%) attend a private institution, while the remaining 78 (74.3%) are enrolled in public schools. The age group of 25 to 34 year olds has the highest likelihood of being enrolled in private schools, with 6 (100.0% in the age bracket) enrolled. Conversely, the age group of 18 to 19 year olds has the lowest likelihood of being enrolled in a private school, with 6 (100.0% in the age bracket) attending a public institution.
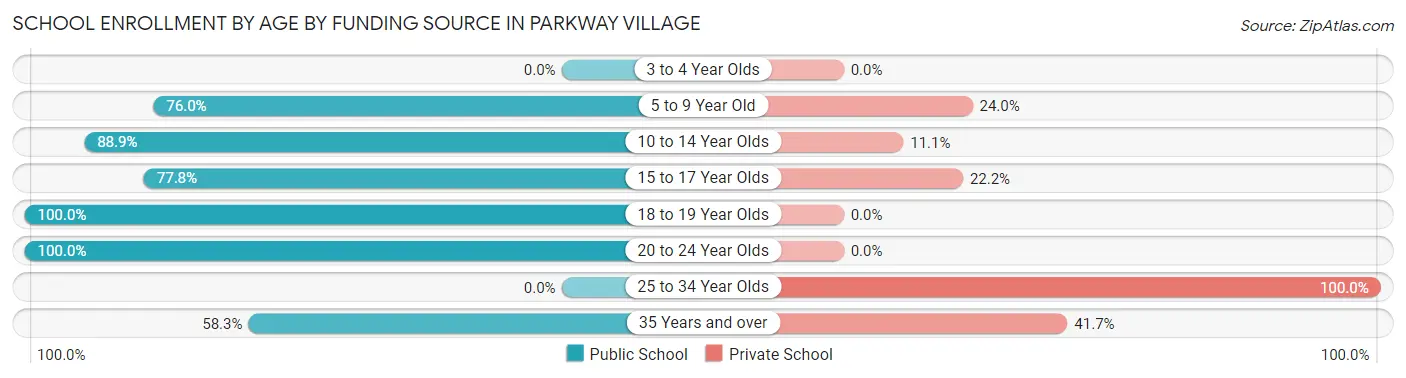
| Age Bracket | Public School | Private School |
| 3 to 4 Year Olds | 0 (0.0%) | 0 (0.0%) |
| 5 to 9 Year Old | 19 (76.0%) | 6 (24.0%) |
| 10 to 14 Year Olds | 24 (88.9%) | 3 (11.1%) |
| 15 to 17 Year Olds | 7 (77.8%) | 2 (22.2%) |
| 18 to 19 Year Olds | 6 (100.0%) | 0 (0.0%) |
| 20 to 24 Year Olds | 8 (100.0%) | 0 (0.0%) |
| 25 to 34 Year Olds | 0 (0.0%) | 6 (100.0%) |
| 35 Years and over | 14 (58.3%) | 10 (41.7%) |
| Total | 78 (74.3%) | 27 (25.7%) |
Educational Attainment by Field of Study in Parkway Village
Liberal arts & history (36 | 12.0%), communications (36 | 12.0%), business (34 | 11.3%), arts & humanities (26 | 8.7%), and education (25 | 8.3%) are the most common fields of study among 300 individuals in Parkway Village who have obtained a bachelor's degree or higher.
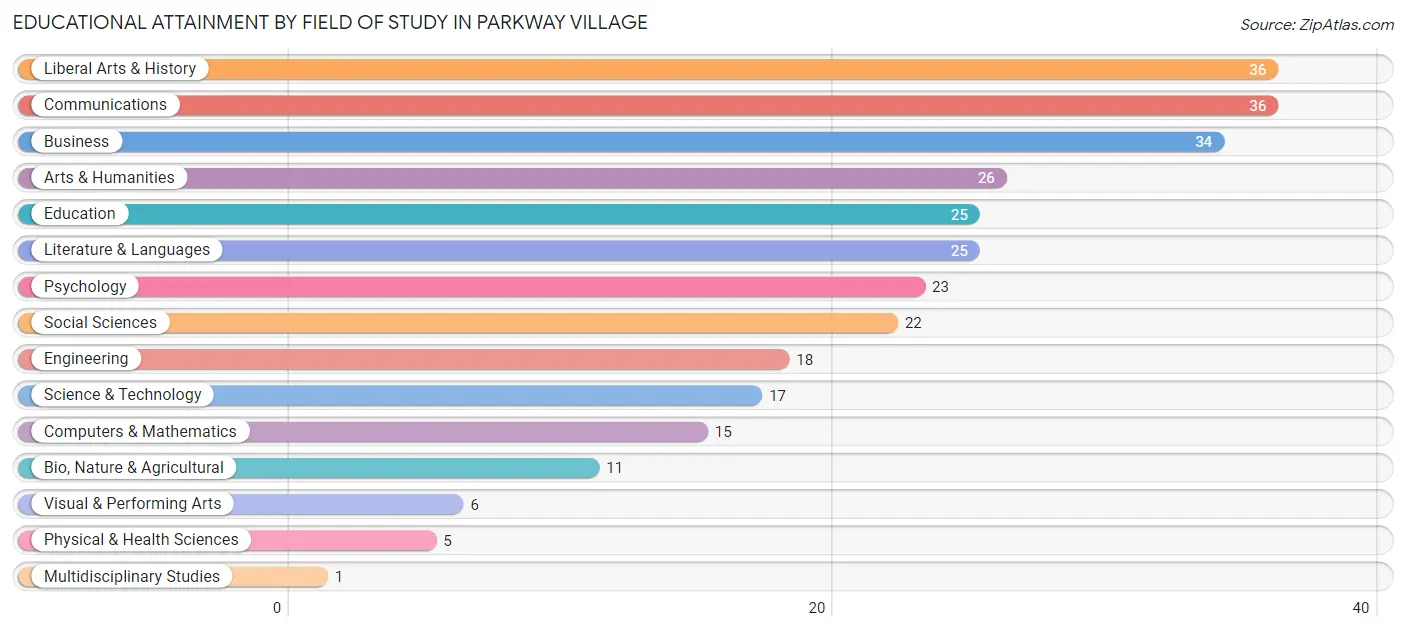
| Field of Study | # Graduates | % Graduates |
| Computers & Mathematics | 15 | 5.0% |
| Bio, Nature & Agricultural | 11 | 3.7% |
| Physical & Health Sciences | 5 | 1.7% |
| Psychology | 23 | 7.7% |
| Social Sciences | 22 | 7.3% |
| Engineering | 18 | 6.0% |
| Multidisciplinary Studies | 1 | 0.3% |
| Science & Technology | 17 | 5.7% |
| Business | 34 | 11.3% |
| Education | 25 | 8.3% |
| Literature & Languages | 25 | 8.3% |
| Liberal Arts & History | 36 | 12.0% |
| Visual & Performing Arts | 6 | 2.0% |
| Communications | 36 | 12.0% |
| Arts & Humanities | 26 | 8.7% |
| Total | 300 | 100.0% |
Transportation & Commute in Parkway Village
Vehicle Availability by Sex in Parkway Village
The most prevalent vehicle ownership categories in Parkway Village are males with 2 vehicles (139, accounting for 77.6%) and females with 2 vehicles (114, making up 68.1%).
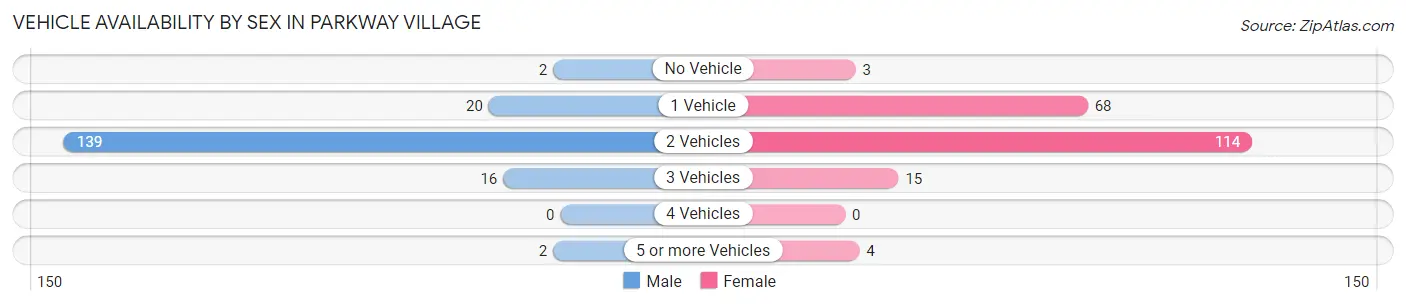
| Vehicles Available | Male | Female |
| No Vehicle | 2 (1.1%) | 3 (1.5%) |
| 1 Vehicle | 20 (11.2%) | 68 (33.3%) |
| 2 Vehicles | 139 (77.6%) | 114 (55.9%) |
| 3 Vehicles | 16 (8.9%) | 15 (7.3%) |
| 4 Vehicles | 0 (0.0%) | 0 (0.0%) |
| 5 or more Vehicles | 2 (1.1%) | 4 (2.0%) |
| Total | 179 (100.0%) | 204 (100.0%) |
Commute Time in Parkway Village
The most frequently occuring commute durations in Parkway Village are 10 to 14 minutes (78 commuters, 24.0%), 15 to 19 minutes (75 commuters, 23.1%), and 20 to 24 minutes (74 commuters, 22.8%).
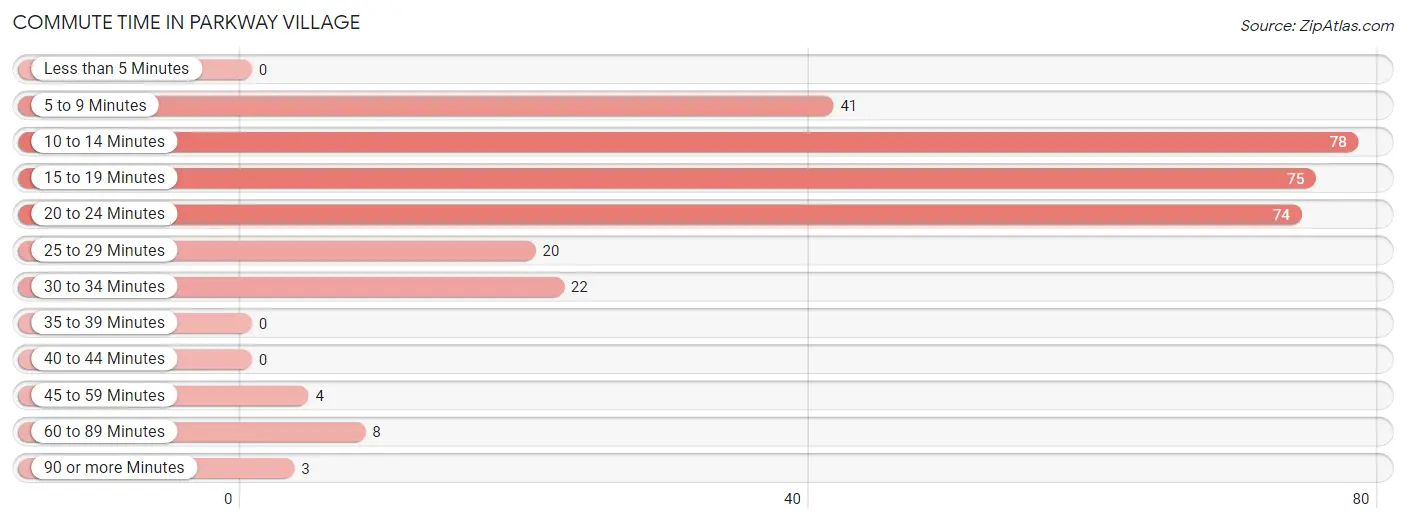
| Commute Time | # Commuters | % Commuters |
| Less than 5 Minutes | 0 | 0.0% |
| 5 to 9 Minutes | 41 | 12.6% |
| 10 to 14 Minutes | 78 | 24.0% |
| 15 to 19 Minutes | 75 | 23.1% |
| 20 to 24 Minutes | 74 | 22.8% |
| 25 to 29 Minutes | 20 | 6.1% |
| 30 to 34 Minutes | 22 | 6.8% |
| 35 to 39 Minutes | 0 | 0.0% |
| 40 to 44 Minutes | 0 | 0.0% |
| 45 to 59 Minutes | 4 | 1.2% |
| 60 to 89 Minutes | 8 | 2.5% |
| 90 or more Minutes | 3 | 0.9% |
Commute Time by Sex in Parkway Village
The most common commute times in Parkway Village are 10 to 14 minutes (40 commuters, 27.6%) for males and 20 to 24 minutes (43 commuters, 23.9%) for females.
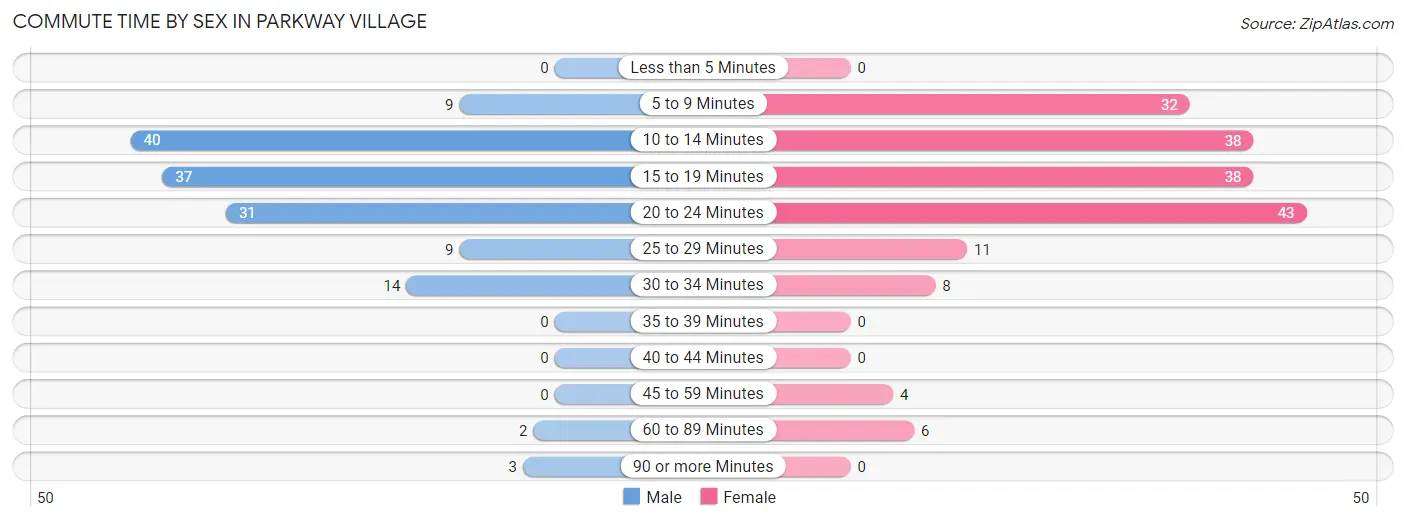
| Commute Time | Male | Female |
| Less than 5 Minutes | 0 (0.0%) | 0 (0.0%) |
| 5 to 9 Minutes | 9 (6.2%) | 32 (17.8%) |
| 10 to 14 Minutes | 40 (27.6%) | 38 (21.1%) |
| 15 to 19 Minutes | 37 (25.5%) | 38 (21.1%) |
| 20 to 24 Minutes | 31 (21.4%) | 43 (23.9%) |
| 25 to 29 Minutes | 9 (6.2%) | 11 (6.1%) |
| 30 to 34 Minutes | 14 (9.7%) | 8 (4.4%) |
| 35 to 39 Minutes | 0 (0.0%) | 0 (0.0%) |
| 40 to 44 Minutes | 0 (0.0%) | 0 (0.0%) |
| 45 to 59 Minutes | 0 (0.0%) | 4 (2.2%) |
| 60 to 89 Minutes | 2 (1.4%) | 6 (3.3%) |
| 90 or more Minutes | 3 (2.1%) | 0 (0.0%) |
Time of Departure to Work by Sex in Parkway Village
The most frequent times of departure to work in Parkway Village are 6:30 AM to 6:59 AM (33, 22.8%) for males and 7:00 AM to 7:29 AM (47, 26.1%) for females.
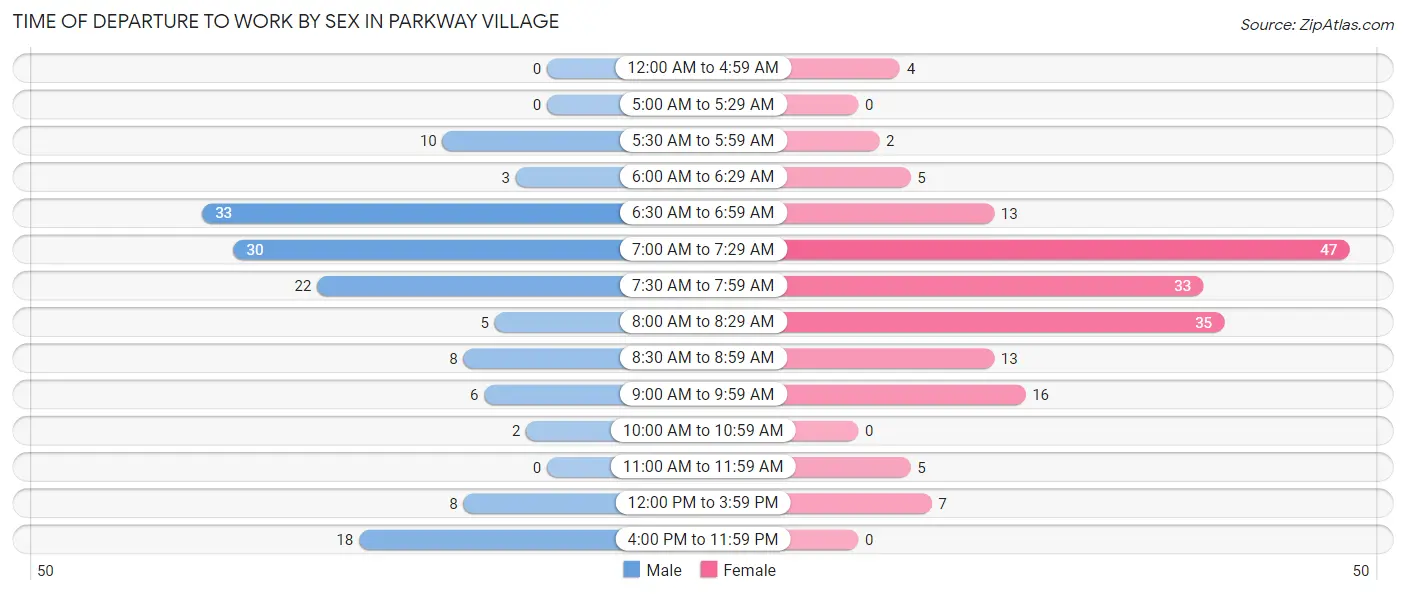
| Time of Departure | Male | Female |
| 12:00 AM to 4:59 AM | 0 (0.0%) | 4 (2.2%) |
| 5:00 AM to 5:29 AM | 0 (0.0%) | 0 (0.0%) |
| 5:30 AM to 5:59 AM | 10 (6.9%) | 2 (1.1%) |
| 6:00 AM to 6:29 AM | 3 (2.1%) | 5 (2.8%) |
| 6:30 AM to 6:59 AM | 33 (22.8%) | 13 (7.2%) |
| 7:00 AM to 7:29 AM | 30 (20.7%) | 47 (26.1%) |
| 7:30 AM to 7:59 AM | 22 (15.2%) | 33 (18.3%) |
| 8:00 AM to 8:29 AM | 5 (3.5%) | 35 (19.4%) |
| 8:30 AM to 8:59 AM | 8 (5.5%) | 13 (7.2%) |
| 9:00 AM to 9:59 AM | 6 (4.1%) | 16 (8.9%) |
| 10:00 AM to 10:59 AM | 2 (1.4%) | 0 (0.0%) |
| 11:00 AM to 11:59 AM | 0 (0.0%) | 5 (2.8%) |
| 12:00 PM to 3:59 PM | 8 (5.5%) | 7 (3.9%) |
| 4:00 PM to 11:59 PM | 18 (12.4%) | 0 (0.0%) |
| Total | 145 (100.0%) | 180 (100.0%) |
Housing Occupancy in Parkway Village
Occupancy by Ownership in Parkway Village
Of the total 290 dwellings in Parkway Village, owner-occupied units account for 248 (85.5%), while renter-occupied units make up 42 (14.5%).
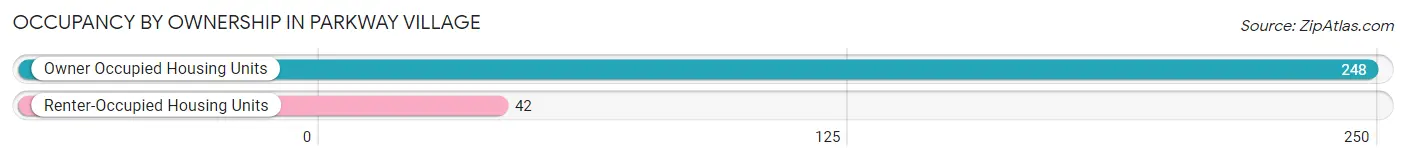
| Occupancy | # Housing Units | % Housing Units |
| Owner Occupied Housing Units | 248 | 85.5% |
| Renter-Occupied Housing Units | 42 | 14.5% |
| Total Occupied Housing Units | 290 | 100.0% |
Occupancy by Household Size in Parkway Village
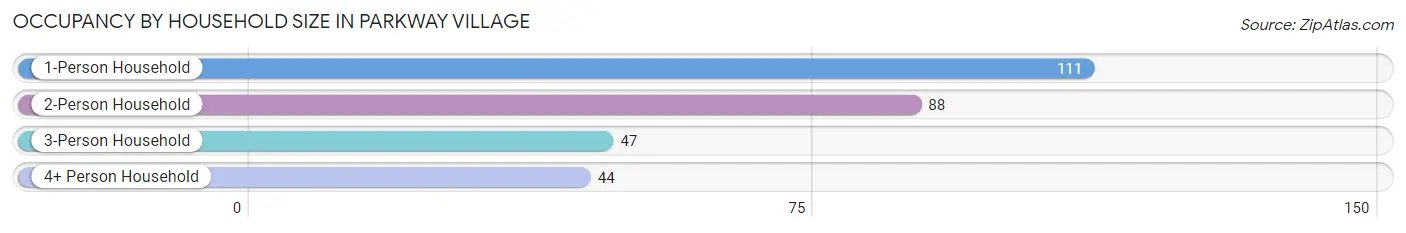
| Household Size | # Housing Units | % Housing Units |
| 1-Person Household | 111 | 38.3% |
| 2-Person Household | 88 | 30.3% |
| 3-Person Household | 47 | 16.2% |
| 4+ Person Household | 44 | 15.2% |
| Total Housing Units | 290 | 100.0% |
Occupancy by Ownership by Household Size in Parkway Village
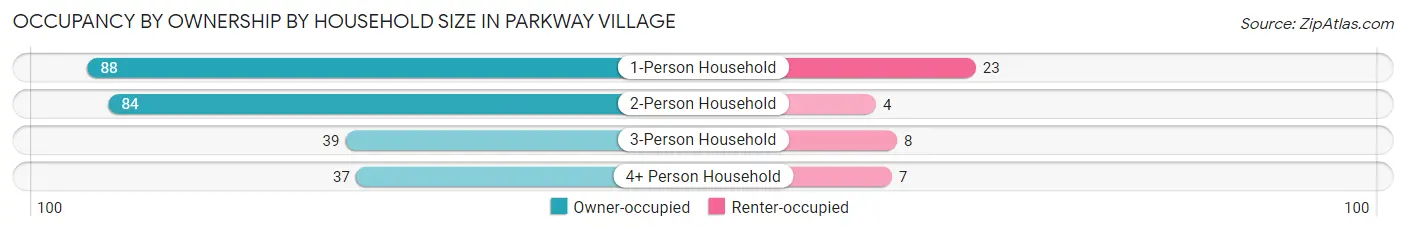
| Household Size | Owner-occupied | Renter-occupied |
| 1-Person Household | 88 (79.3%) | 23 (20.7%) |
| 2-Person Household | 84 (95.5%) | 4 (4.5%) |
| 3-Person Household | 39 (83.0%) | 8 (17.0%) |
| 4+ Person Household | 37 (84.1%) | 7 (15.9%) |
| Total Housing Units | 248 (85.5%) | 42 (14.5%) |
Occupancy by Educational Attainment in Parkway Village
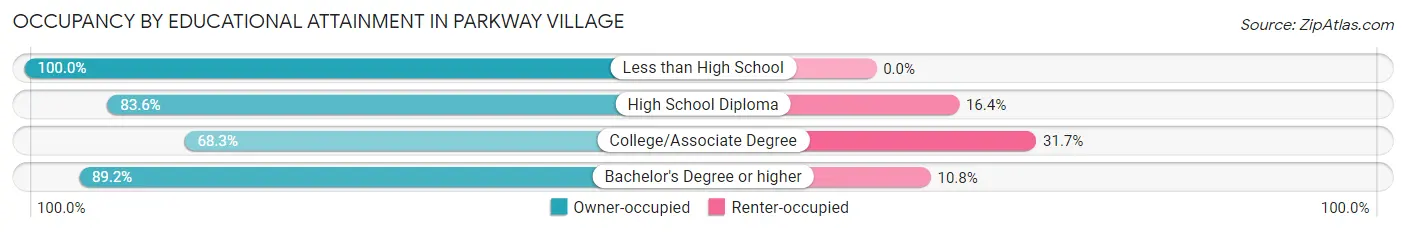
| Household Size | Owner-occupied | Renter-occupied |
| Less than High School | 15 (100.0%) | 0 (0.0%) |
| High School Diploma | 56 (83.6%) | 11 (16.4%) |
| College/Associate Degree | 28 (68.3%) | 13 (31.7%) |
| Bachelor's Degree or higher | 149 (89.2%) | 18 (10.8%) |
Occupancy by Age of Householder in Parkway Village
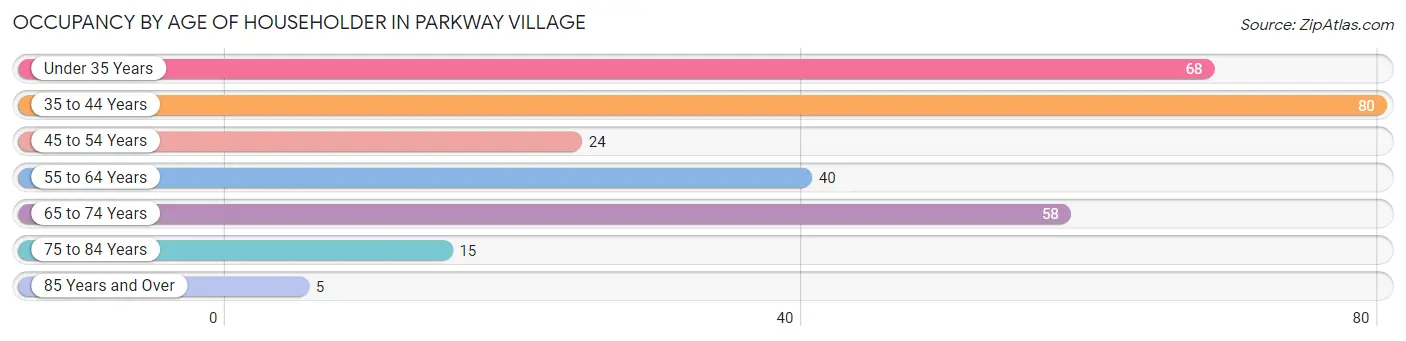
| Age Bracket | # Households | % Households |
| Under 35 Years | 68 | 23.4% |
| 35 to 44 Years | 80 | 27.6% |
| 45 to 54 Years | 24 | 8.3% |
| 55 to 64 Years | 40 | 13.8% |
| 65 to 74 Years | 58 | 20.0% |
| 75 to 84 Years | 15 | 5.2% |
| 85 Years and Over | 5 | 1.7% |
| Total | 290 | 100.0% |
Housing Finances in Parkway Village
Median Income by Occupancy in Parkway Village
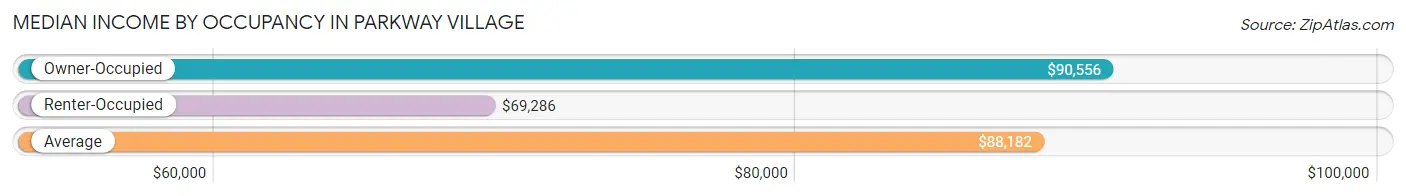
| Occupancy Type | # Households | Median Income |
| Owner-Occupied | 248 (85.5%) | $90,556 |
| Renter-Occupied | 42 (14.5%) | $69,286 |
| Average | 290 (100.0%) | $88,182 |
Occupancy by Householder Income Bracket in Parkway Village
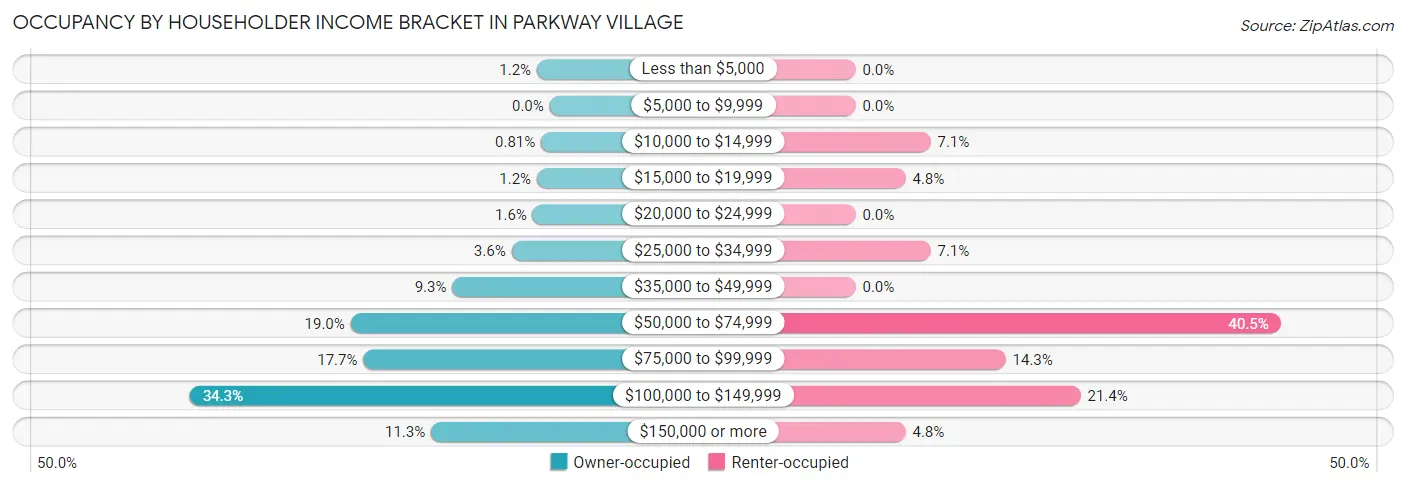
| Income Bracket | Owner-occupied | Renter-occupied |
| Less than $5,000 | 3 (1.2%) | 0 (0.0%) |
| $5,000 to $9,999 | 0 (0.0%) | 0 (0.0%) |
| $10,000 to $14,999 | 2 (0.8%) | 3 (7.1%) |
| $15,000 to $19,999 | 3 (1.2%) | 2 (4.8%) |
| $20,000 to $24,999 | 4 (1.6%) | 0 (0.0%) |
| $25,000 to $34,999 | 9 (3.6%) | 3 (7.1%) |
| $35,000 to $49,999 | 23 (9.3%) | 0 (0.0%) |
| $50,000 to $74,999 | 47 (19.0%) | 17 (40.5%) |
| $75,000 to $99,999 | 44 (17.7%) | 6 (14.3%) |
| $100,000 to $149,999 | 85 (34.3%) | 9 (21.4%) |
| $150,000 or more | 28 (11.3%) | 2 (4.8%) |
| Total | 248 (100.0%) | 42 (100.0%) |
Monthly Housing Cost Tiers in Parkway Village
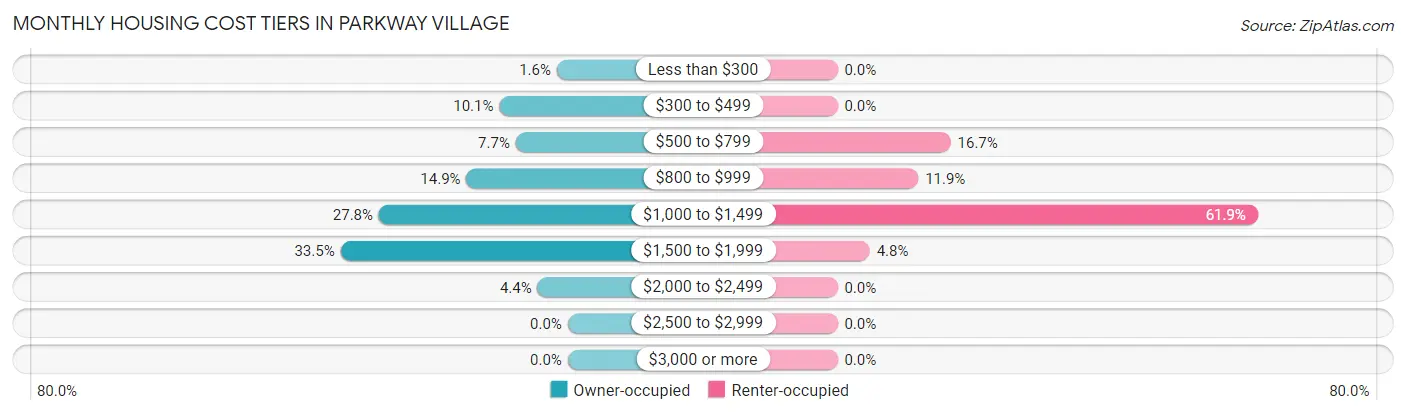
| Monthly Cost | Owner-occupied | Renter-occupied |
| Less than $300 | 4 (1.6%) | 0 (0.0%) |
| $300 to $499 | 25 (10.1%) | 0 (0.0%) |
| $500 to $799 | 19 (7.7%) | 7 (16.7%) |
| $800 to $999 | 37 (14.9%) | 5 (11.9%) |
| $1,000 to $1,499 | 69 (27.8%) | 26 (61.9%) |
| $1,500 to $1,999 | 83 (33.5%) | 2 (4.8%) |
| $2,000 to $2,499 | 11 (4.4%) | 0 (0.0%) |
| $2,500 to $2,999 | 0 (0.0%) | 0 (0.0%) |
| $3,000 or more | 0 (0.0%) | 0 (0.0%) |
| Total | 248 (100.0%) | 42 (100.0%) |
Physical Housing Characteristics in Parkway Village
Housing Structures in Parkway Village
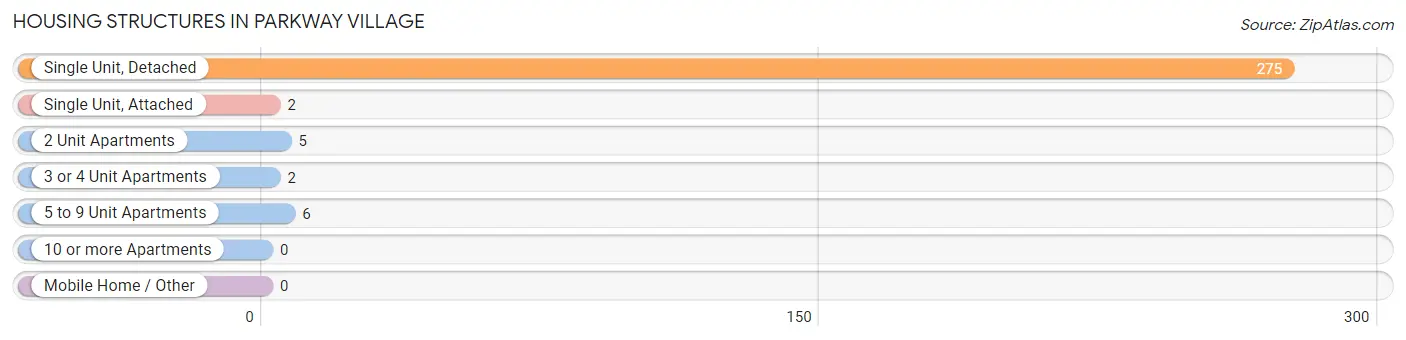
| Structure Type | # Housing Units | % Housing Units |
| Single Unit, Detached | 275 | 94.8% |
| Single Unit, Attached | 2 | 0.7% |
| 2 Unit Apartments | 5 | 1.7% |
| 3 or 4 Unit Apartments | 2 | 0.7% |
| 5 to 9 Unit Apartments | 6 | 2.1% |
| 10 or more Apartments | 0 | 0.0% |
| Mobile Home / Other | 0 | 0.0% |
| Total | 290 | 100.0% |
Housing Structures by Occupancy in Parkway Village
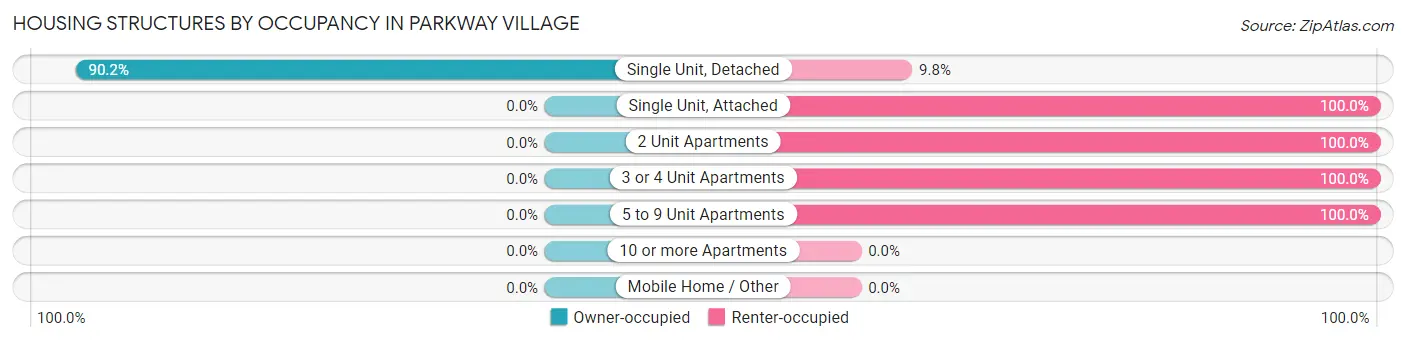
| Structure Type | Owner-occupied | Renter-occupied |
| Single Unit, Detached | 248 (90.2%) | 27 (9.8%) |
| Single Unit, Attached | 0 (0.0%) | 2 (100.0%) |
| 2 Unit Apartments | 0 (0.0%) | 5 (100.0%) |
| 3 or 4 Unit Apartments | 0 (0.0%) | 2 (100.0%) |
| 5 to 9 Unit Apartments | 0 (0.0%) | 6 (100.0%) |
| 10 or more Apartments | 0 (0.0%) | 0 (0.0%) |
| Mobile Home / Other | 0 (0.0%) | 0 (0.0%) |
| Total | 248 (85.5%) | 42 (14.5%) |
Housing Structures by Number of Rooms in Parkway Village
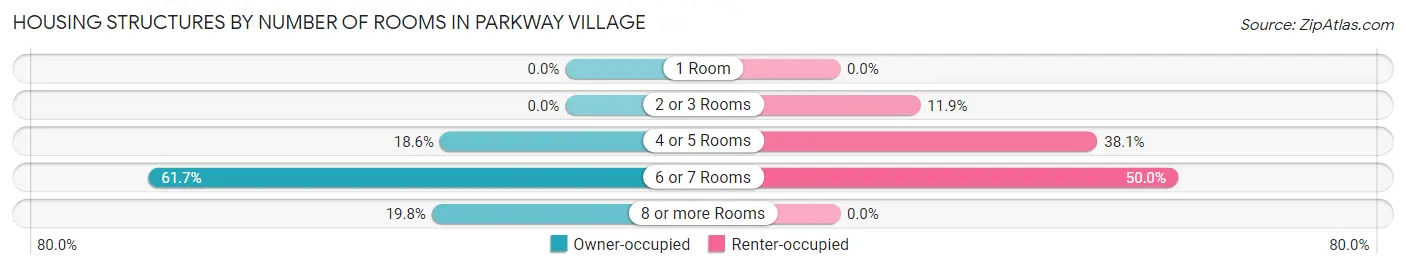
| Number of Rooms | Owner-occupied | Renter-occupied |
| 1 Room | 0 (0.0%) | 0 (0.0%) |
| 2 or 3 Rooms | 0 (0.0%) | 5 (11.9%) |
| 4 or 5 Rooms | 46 (18.5%) | 16 (38.1%) |
| 6 or 7 Rooms | 153 (61.7%) | 21 (50.0%) |
| 8 or more Rooms | 49 (19.8%) | 0 (0.0%) |
| Total | 248 (100.0%) | 42 (100.0%) |
Housing Structure by Heating Type in Parkway Village
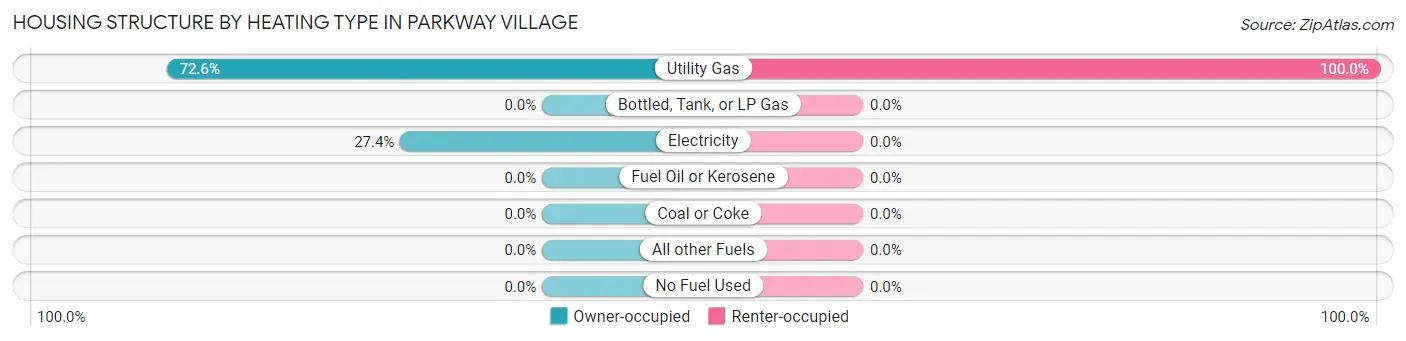
| Heating Type | Owner-occupied | Renter-occupied |
| Utility Gas | 180 (72.6%) | 42 (100.0%) |
| Bottled, Tank, or LP Gas | 0 (0.0%) | 0 (0.0%) |
| Electricity | 68 (27.4%) | 0 (0.0%) |
| Fuel Oil or Kerosene | 0 (0.0%) | 0 (0.0%) |
| Coal or Coke | 0 (0.0%) | 0 (0.0%) |
| All other Fuels | 0 (0.0%) | 0 (0.0%) |
| No Fuel Used | 0 (0.0%) | 0 (0.0%) |
| Total | 248 (100.0%) | 42 (100.0%) |
Household Vehicle Usage in Parkway Village
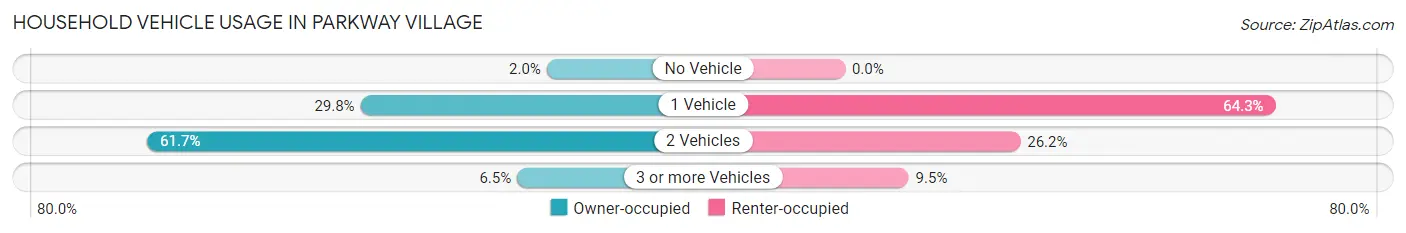
| Vehicles per Household | Owner-occupied | Renter-occupied |
| No Vehicle | 5 (2.0%) | 0 (0.0%) |
| 1 Vehicle | 74 (29.8%) | 27 (64.3%) |
| 2 Vehicles | 153 (61.7%) | 11 (26.2%) |
| 3 or more Vehicles | 16 (6.5%) | 4 (9.5%) |
| Total | 248 (100.0%) | 42 (100.0%) |
Real Estate & Mortgages in Parkway Village
Real Estate and Mortgage Overview in Parkway Village
| Characteristic | Without Mortgage | With Mortgage |
| Housing Units | 49 | 199 |
| Median Property Value | $206,900 | $225,600 |
| Median Household Income | $63,542 | $22 |
| Monthly Housing Costs | $476 | $0 |
| Real Estate Taxes | $1,297 | $5 |
Property Value by Mortgage Status in Parkway Village
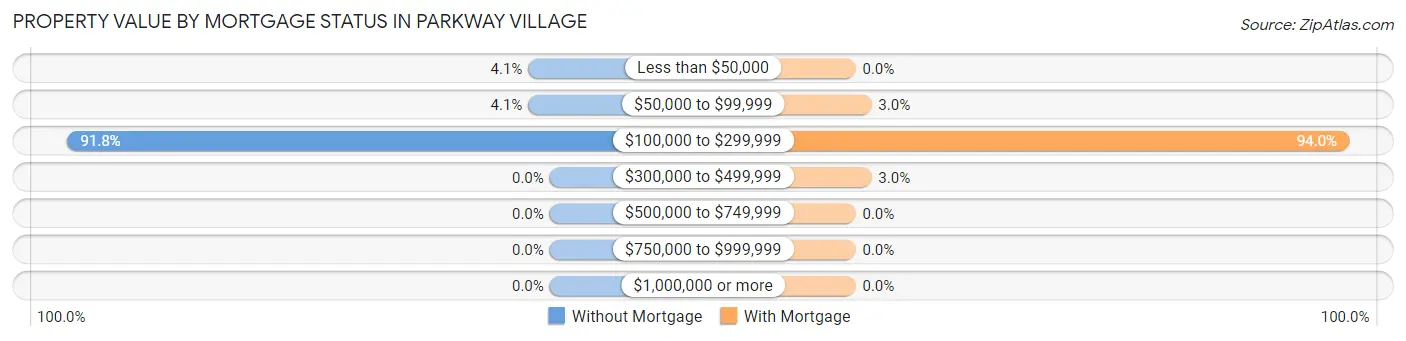
| Property Value | Without Mortgage | With Mortgage |
| Less than $50,000 | 2 (4.1%) | 0 (0.0%) |
| $50,000 to $99,999 | 2 (4.1%) | 6 (3.0%) |
| $100,000 to $299,999 | 45 (91.8%) | 187 (94.0%) |
| $300,000 to $499,999 | 0 (0.0%) | 6 (3.0%) |
| $500,000 to $749,999 | 0 (0.0%) | 0 (0.0%) |
| $750,000 to $999,999 | 0 (0.0%) | 0 (0.0%) |
| $1,000,000 or more | 0 (0.0%) | 0 (0.0%) |
| Total | 49 (100.0%) | 199 (100.0%) |
Household Income by Mortgage Status in Parkway Village
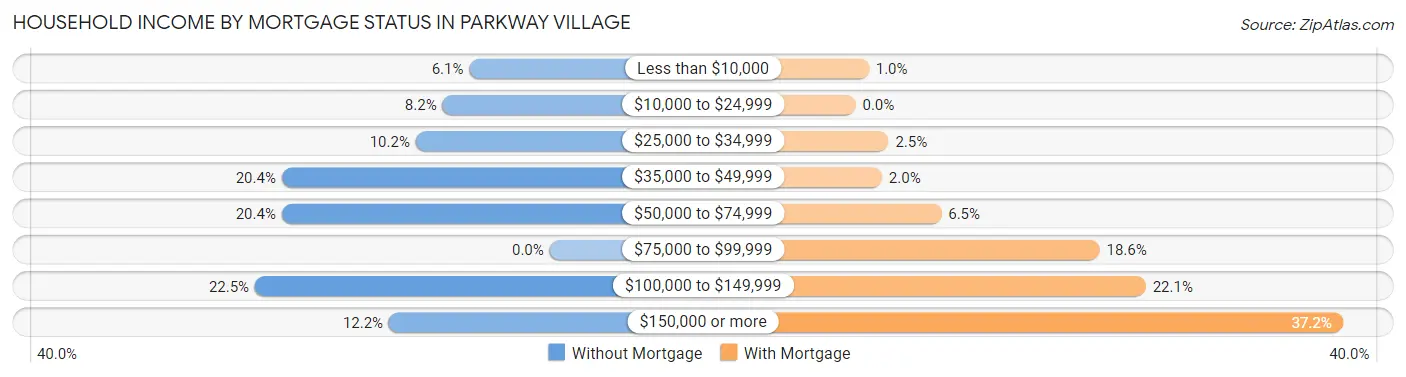
| Household Income | Without Mortgage | With Mortgage |
| Less than $10,000 | 3 (6.1%) | 2 (1.0%) |
| $10,000 to $24,999 | 4 (8.2%) | 0 (0.0%) |
| $25,000 to $34,999 | 5 (10.2%) | 5 (2.5%) |
| $35,000 to $49,999 | 10 (20.4%) | 4 (2.0%) |
| $50,000 to $74,999 | 10 (20.4%) | 13 (6.5%) |
| $75,000 to $99,999 | 0 (0.0%) | 37 (18.6%) |
| $100,000 to $149,999 | 11 (22.5%) | 44 (22.1%) |
| $150,000 or more | 6 (12.2%) | 74 (37.2%) |
| Total | 49 (100.0%) | 199 (100.0%) |
Property Value to Household Income Ratio in Parkway Village
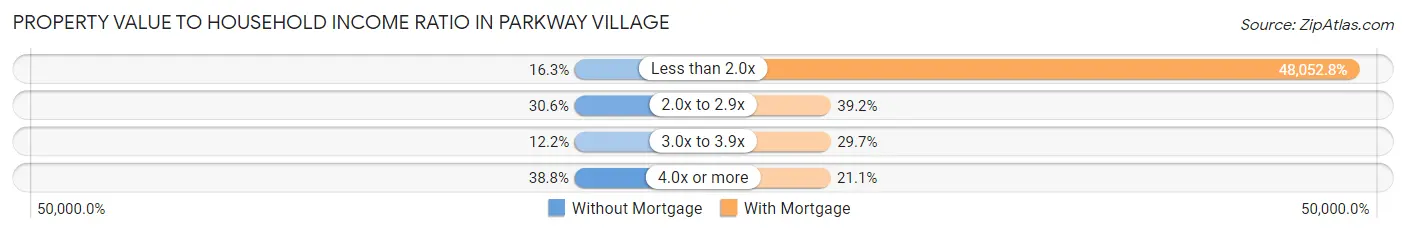
| Value-to-Income Ratio | Without Mortgage | With Mortgage |
| Less than 2.0x | 8 (16.3%) | 95,625 (48,052.8%) |
| 2.0x to 2.9x | 15 (30.6%) | 78 (39.2%) |
| 3.0x to 3.9x | 6 (12.2%) | 59 (29.6%) |
| 4.0x or more | 19 (38.8%) | 42 (21.1%) |
| Total | 49 (100.0%) | 199 (100.0%) |
Real Estate Taxes by Mortgage Status in Parkway Village
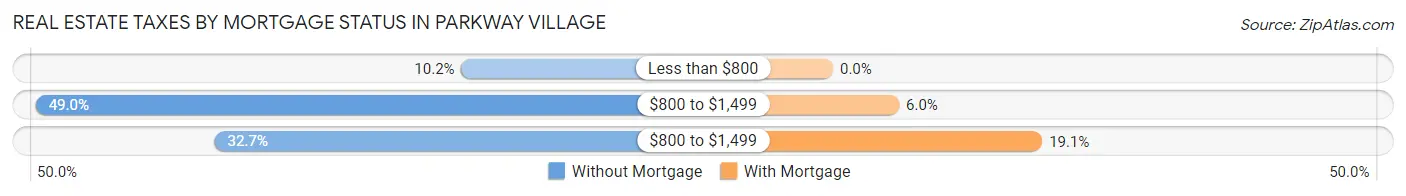
| Property Taxes | Without Mortgage | With Mortgage |
| Less than $800 | 5 (10.2%) | 0 (0.0%) |
| $800 to $1,499 | 24 (49.0%) | 12 (6.0%) |
| $800 to $1,499 | 16 (32.7%) | 38 (19.1%) |
| Total | 49 (100.0%) | 199 (100.0%) |
Health & Disability in Parkway Village
Health Insurance Coverage by Age in Parkway Village
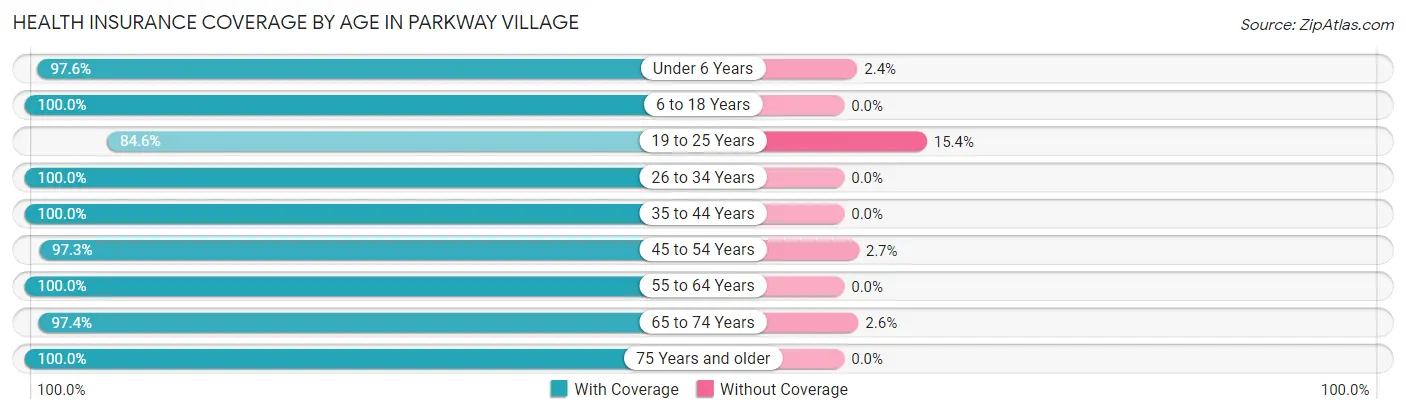
| Age Bracket | With Coverage | Without Coverage |
| Under 6 Years | 40 (97.6%) | 1 (2.4%) |
| 6 to 18 Years | 82 (100.0%) | 0 (0.0%) |
| 19 to 25 Years | 11 (84.6%) | 2 (15.4%) |
| 26 to 34 Years | 126 (100.0%) | 0 (0.0%) |
| 35 to 44 Years | 115 (100.0%) | 0 (0.0%) |
| 45 to 54 Years | 72 (97.3%) | 2 (2.7%) |
| 55 to 64 Years | 73 (100.0%) | 0 (0.0%) |
| 65 to 74 Years | 74 (97.4%) | 2 (2.6%) |
| 75 Years and older | 22 (100.0%) | 0 (0.0%) |
| Total | 615 (98.9%) | 7 (1.1%) |
Health Insurance Coverage by Citizenship Status in Parkway Village
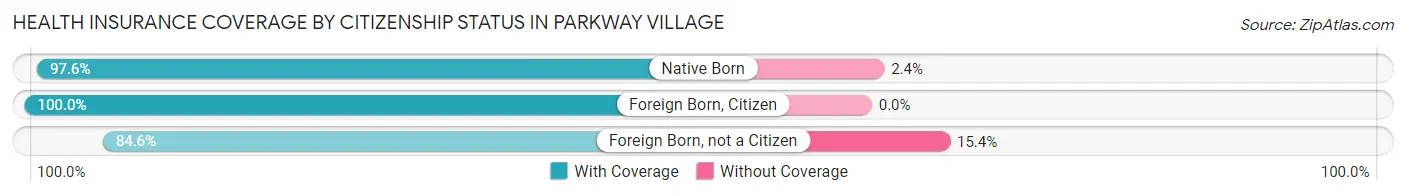
| Citizenship Status | With Coverage | Without Coverage |
| Native Born | 40 (97.6%) | 1 (2.4%) |
| Foreign Born, Citizen | 82 (100.0%) | 0 (0.0%) |
| Foreign Born, not a Citizen | 11 (84.6%) | 2 (15.4%) |
Health Insurance Coverage by Household Income in Parkway Village
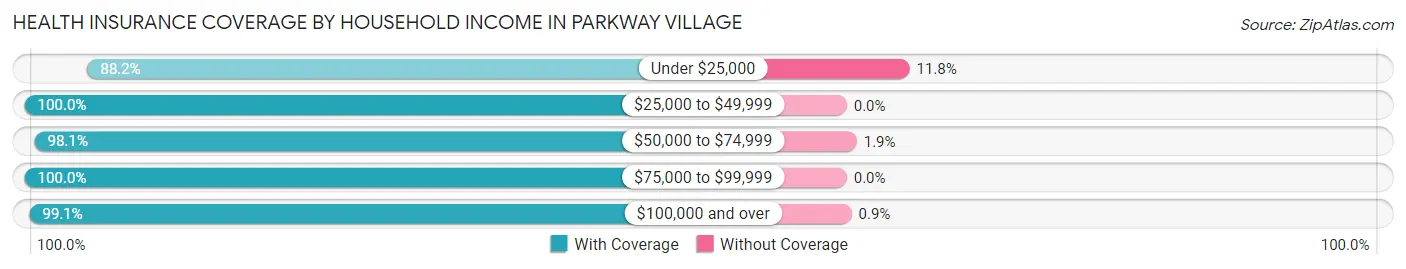
| Household Income | With Coverage | Without Coverage |
| Under $25,000 | 15 (88.2%) | 2 (11.8%) |
| $25,000 to $49,999 | 47 (100.0%) | 0 (0.0%) |
| $50,000 to $74,999 | 105 (98.1%) | 2 (1.9%) |
| $75,000 to $99,999 | 118 (100.0%) | 0 (0.0%) |
| $100,000 and over | 330 (99.1%) | 3 (0.9%) |
Public vs Private Health Insurance Coverage by Age in Parkway Village
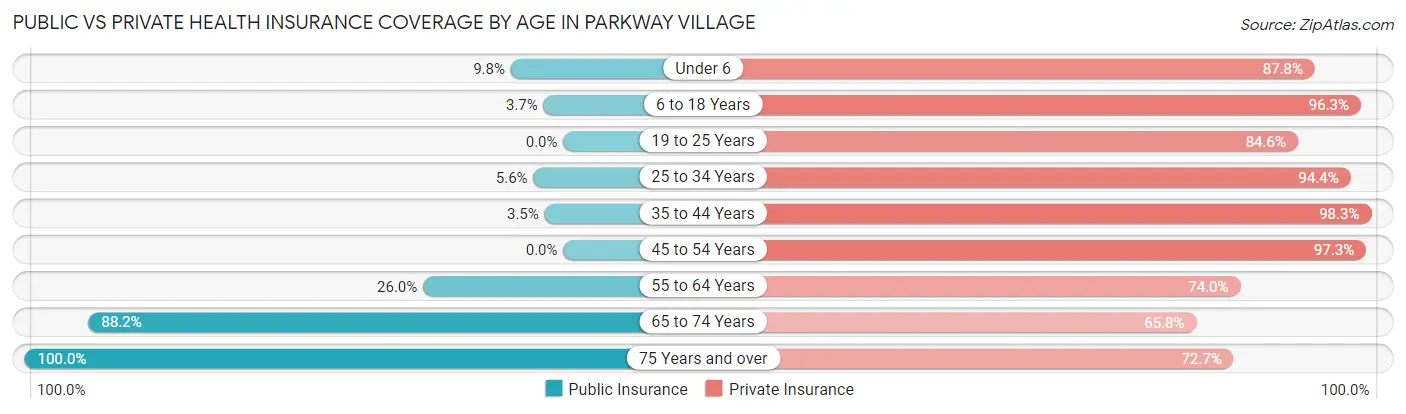
| Age Bracket | Public Insurance | Private Insurance |
| Under 6 | 4 (9.8%) | 36 (87.8%) |
| 6 to 18 Years | 3 (3.7%) | 79 (96.3%) |
| 19 to 25 Years | 0 (0.0%) | 11 (84.6%) |
| 25 to 34 Years | 7 (5.6%) | 119 (94.4%) |
| 35 to 44 Years | 4 (3.5%) | 113 (98.3%) |
| 45 to 54 Years | 0 (0.0%) | 72 (97.3%) |
| 55 to 64 Years | 19 (26.0%) | 54 (74.0%) |
| 65 to 74 Years | 67 (88.2%) | 50 (65.8%) |
| 75 Years and over | 22 (100.0%) | 16 (72.7%) |
| Total | 126 (20.3%) | 550 (88.4%) |
Disability Status by Sex by Age in Parkway Village
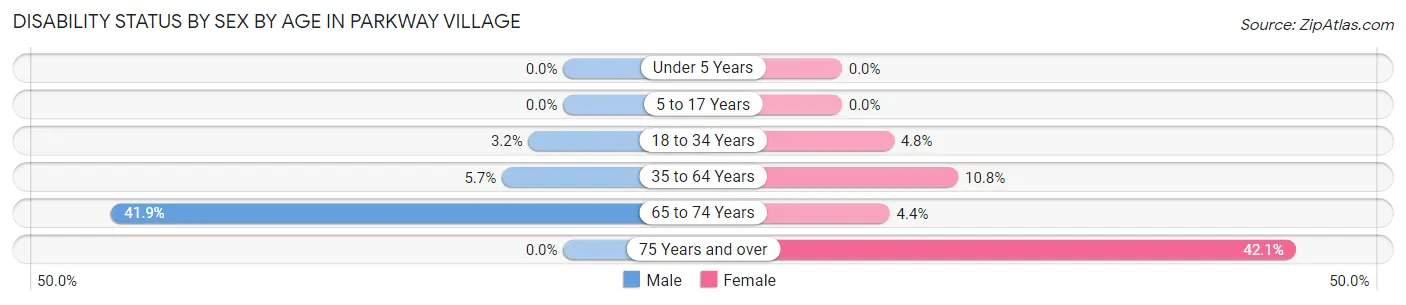
| Age Bracket | Male | Female |
| Under 5 Years | 0 (0.0%) | 0 (0.0%) |
| 5 to 17 Years | 0 (0.0%) | 0 (0.0%) |
| 18 to 34 Years | 2 (3.2%) | 4 (4.8%) |
| 35 to 64 Years | 7 (5.7%) | 15 (10.8%) |
| 65 to 74 Years | 13 (41.9%) | 2 (4.4%) |
| 75 Years and over | 0 (0.0%) | 8 (42.1%) |
Disability Class by Sex by Age in Parkway Village
Disability Class: Hearing Difficulty
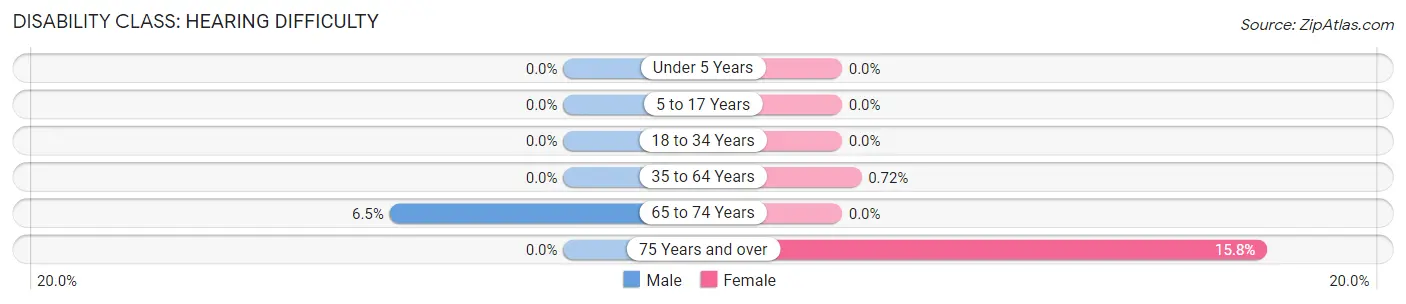
| Age Bracket | Male | Female |
| Under 5 Years | 0 (0.0%) | 0 (0.0%) |
| 5 to 17 Years | 0 (0.0%) | 0 (0.0%) |
| 18 to 34 Years | 0 (0.0%) | 0 (0.0%) |
| 35 to 64 Years | 0 (0.0%) | 1 (0.7%) |
| 65 to 74 Years | 2 (6.5%) | 0 (0.0%) |
| 75 Years and over | 0 (0.0%) | 3 (15.8%) |
Disability Class: Vision Difficulty
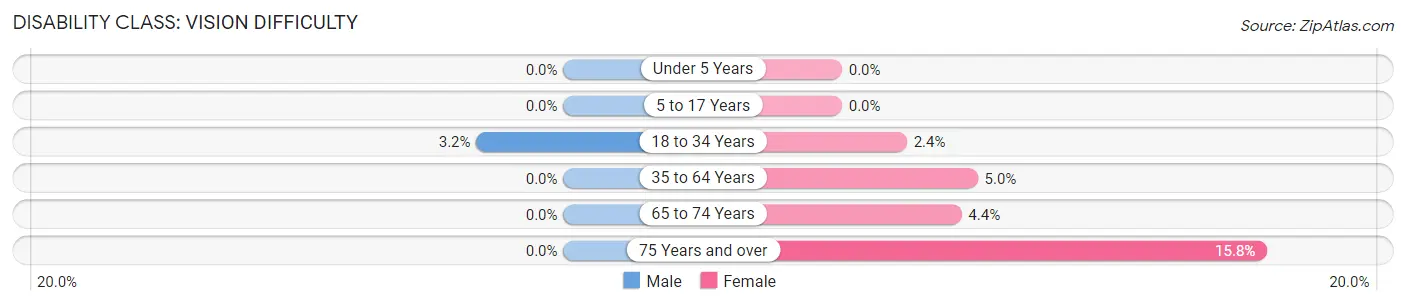
| Age Bracket | Male | Female |
| Under 5 Years | 0 (0.0%) | 0 (0.0%) |
| 5 to 17 Years | 0 (0.0%) | 0 (0.0%) |
| 18 to 34 Years | 2 (3.2%) | 2 (2.4%) |
| 35 to 64 Years | 0 (0.0%) | 7 (5.0%) |
| 65 to 74 Years | 0 (0.0%) | 2 (4.4%) |
| 75 Years and over | 0 (0.0%) | 3 (15.8%) |
Disability Class: Cognitive Difficulty
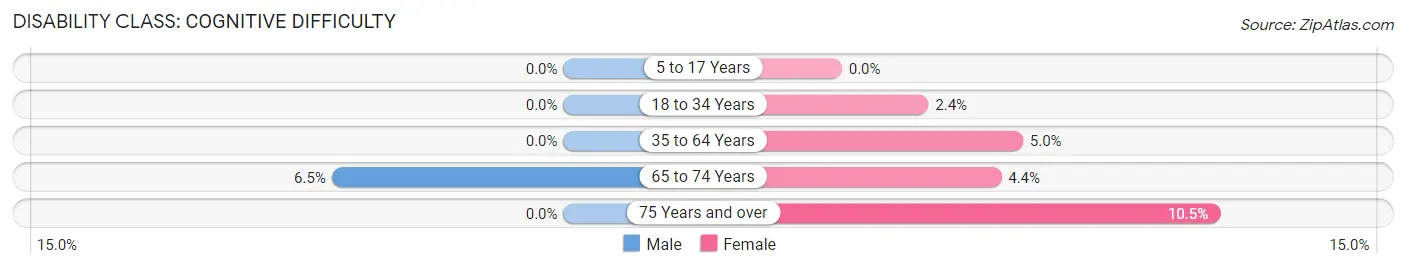
| Age Bracket | Male | Female |
| 5 to 17 Years | 0 (0.0%) | 0 (0.0%) |
| 18 to 34 Years | 0 (0.0%) | 2 (2.4%) |
| 35 to 64 Years | 0 (0.0%) | 7 (5.0%) |
| 65 to 74 Years | 2 (6.5%) | 2 (4.4%) |
| 75 Years and over | 0 (0.0%) | 2 (10.5%) |
Disability Class: Ambulatory Difficulty
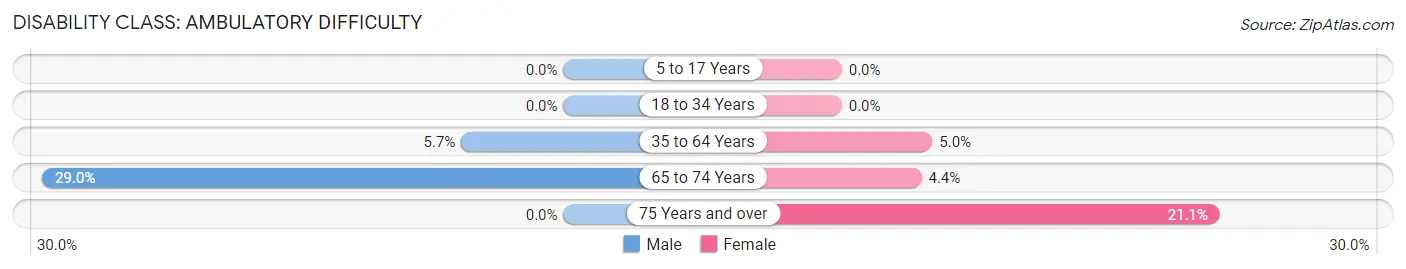
| Age Bracket | Male | Female |
| 5 to 17 Years | 0 (0.0%) | 0 (0.0%) |
| 18 to 34 Years | 0 (0.0%) | 0 (0.0%) |
| 35 to 64 Years | 7 (5.7%) | 7 (5.0%) |
| 65 to 74 Years | 9 (29.0%) | 2 (4.4%) |
| 75 Years and over | 0 (0.0%) | 4 (21.0%) |
Disability Class: Self-Care Difficulty
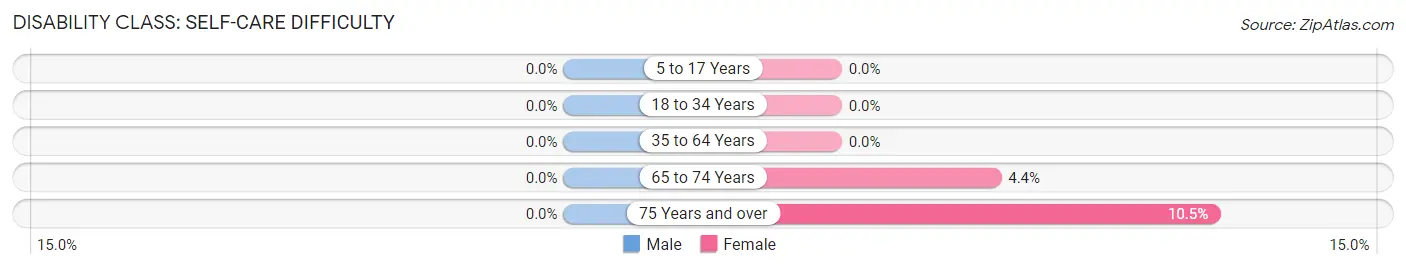
| Age Bracket | Male | Female |
| 5 to 17 Years | 0 (0.0%) | 0 (0.0%) |
| 18 to 34 Years | 0 (0.0%) | 0 (0.0%) |
| 35 to 64 Years | 0 (0.0%) | 0 (0.0%) |
| 65 to 74 Years | 0 (0.0%) | 2 (4.4%) |
| 75 Years and over | 0 (0.0%) | 2 (10.5%) |
Technology Access in Parkway Village
Computing Device Access in Parkway Village
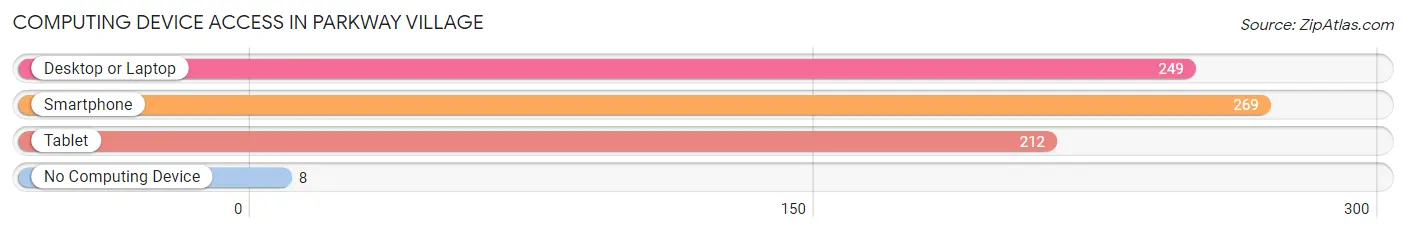
| Device Type | # Households | % Households |
| Desktop or Laptop | 249 | 85.9% |
| Smartphone | 269 | 92.8% |
| Tablet | 212 | 73.1% |
| No Computing Device | 8 | 2.8% |
| Total | 290 | 100.0% |
Internet Access in Parkway Village
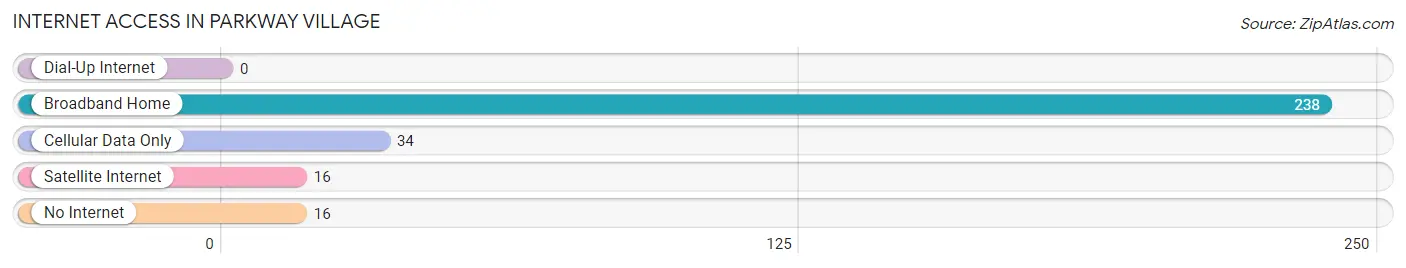
| Internet Type | # Households | % Households |
| Dial-Up Internet | 0 | 0.0% |
| Broadband Home | 238 | 82.1% |
| Cellular Data Only | 34 | 11.7% |
| Satellite Internet | 16 | 5.5% |
| No Internet | 16 | 5.5% |
| Total | 290 | 100.0% |
Parkway Village Summary
Parkway Village is a small unincorporated community located in the western part of Kentucky, in the United States. It is situated in the county of Warren, and is part of the Bowling Green Metropolitan Statistical Area. The population of Parkway Village was estimated to be around 1,000 people in the year 2000.
History
Parkway Village was first settled in the early 1800s by a group of settlers from Virginia. The area was originally known as “Parker’s Station”, named after the first settler, William Parker. The area was later renamed “Parkway Village” in the late 1800s. The village was originally a farming community, and the main crops grown were corn, wheat, and tobacco.
In the early 1900s, the village began to grow and develop. The first school was built in the village in 1910, and the first post office was established in 1912. The village also had a general store, a blacksmith shop, and a few other small businesses.
Geography
Parkway Village is located in the western part of Kentucky, in the county of Warren. It is situated in the Bowling Green Metropolitan Statistical Area. The village is located on the banks of the Barren River, and is surrounded by rolling hills and farmland. The climate in the area is generally mild, with hot summers and cold winters.
Economy
The economy of Parkway Village is largely based on agriculture. The main crops grown in the area are corn, wheat, and tobacco. The village also has a few small businesses, such as a general store, a blacksmith shop, and a few other small businesses.
Demographics
As of the year 2000, the population of Parkway Village was estimated to be around 1,000 people. The racial makeup of the village was 97.2% White, 0.7% African American, 0.3% Native American, 0.3% Asian, and 1.5% from other races. The median household income in the village was $30,000, and the median family income was $35,000. The per capita income in the village was $14,000.
Common Questions
What is Per Capita Income in Parkway Village?
Per Capita income in Parkway Village is $44,891.
What is the Median Family Income in Parkway Village?
Median Family Income in Parkway Village is $109,375.
What is the Median Household income in Parkway Village?
Median Household Income in Parkway Village is $88,182.
What is Income or Wage Gap in Parkway Village?
Income or Wage Gap in Parkway Village is 10.2%.
Women in Parkway Village earn 89.8 cents for every dollar earned by a man.
What is Inequality or Gini Index in Parkway Village?
Inequality or Gini Index in Parkway Village is 0.29.
What is the Total Population of Parkway Village?
Total Population of Parkway Village is 622.
What is the Total Male Population of Parkway Village?
Total Male Population of Parkway Village is 269.
What is the Total Female Population of Parkway Village?
Total Female Population of Parkway Village is 353.
What is the Ratio of Males per 100 Females in Parkway Village?
There are 76.20 Males per 100 Females in Parkway Village.
What is the Ratio of Females per 100 Males in Parkway Village?
There are 131.23 Females per 100 Males in Parkway Village.
What is the Median Population Age in Parkway Village?
Median Population Age in Parkway Village is 38.8 Years.
What is the Average Family Size in Parkway Village
Average Family Size in Parkway Village is 2.9 People.
What is the Average Household Size in Parkway Village
Average Household Size in Parkway Village is 2.1 People.
How Large is the Labor Force in Parkway Village?
There are 393 People in the Labor Forcein in Parkway Village.
What is the Percentage of People in the Labor Force in Parkway Village?
77.5% of People are in the Labor Force in Parkway Village.
What is the Unemployment Rate in Parkway Village?
Unemployment Rate in Parkway Village is 1.3%.