Millersburg, KY Map & Demographics
Millersburg Map

Millersburg Overview
$22,950
PER CAPITA INCOME
$48,615
AVG FAMILY INCOME
$40,769
AVG HOUSEHOLD INCOME
0.39
INEQUALITY / GINI INDEX
808
TOTAL POPULATION
439
MALE POPULATION
369
FEMALE POPULATION
118.97
MALES / 100 FEMALES
84.05
FEMALES / 100 MALES
54.4
MEDIAN AGE
2.3
AVG FAMILY SIZE
1.9
AVG HOUSEHOLD SIZE
390
LABOR FORCE [ PEOPLE ]
56.3%
PERCENT IN LABOR FORCE
7.4%
UNEMPLOYMENT RATE
Millersburg Zip Codes
Millersburg Area Codes
Income in Millersburg
Income Overview in Millersburg
Per Capita Income in Millersburg is $22,950, while median incomes of families and households are $48,615 and $40,769 respectively.
| Characteristic | Number | Measure |
| Per Capita Income | 808 | $22,950 |
| Median Family Income | 225 | $48,615 |
| Mean Family Income | 225 | $57,394 |
| Median Household Income | 416 | $40,769 |
| Mean Household Income | 416 | $43,094 |
| Income Deficit | 225 | $0 |
| Wage / Income Gap (%) | 808 | 0.00% |
| Wage / Income Gap ($) | 808 | 100.00¢ per $1 |
| Gini / Inequality Index | 808 | 0.39 |
Earnings by Sex in Millersburg
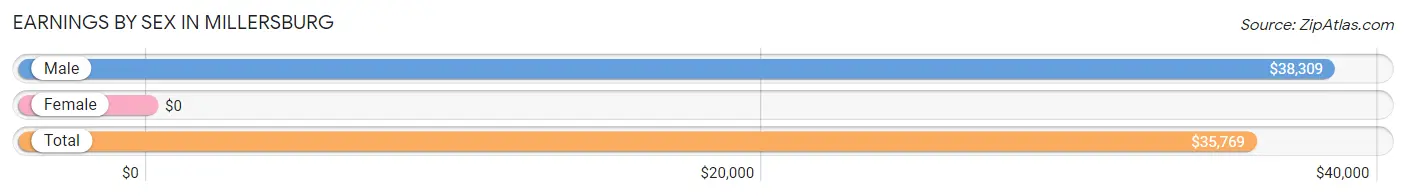
| Sex | Number | Average Earnings |
| Male | 169 (39.5%) | $38,309 |
| Female | 259 (60.5%) | $0 |
| Total | 428 (100.0%) | $35,769 |
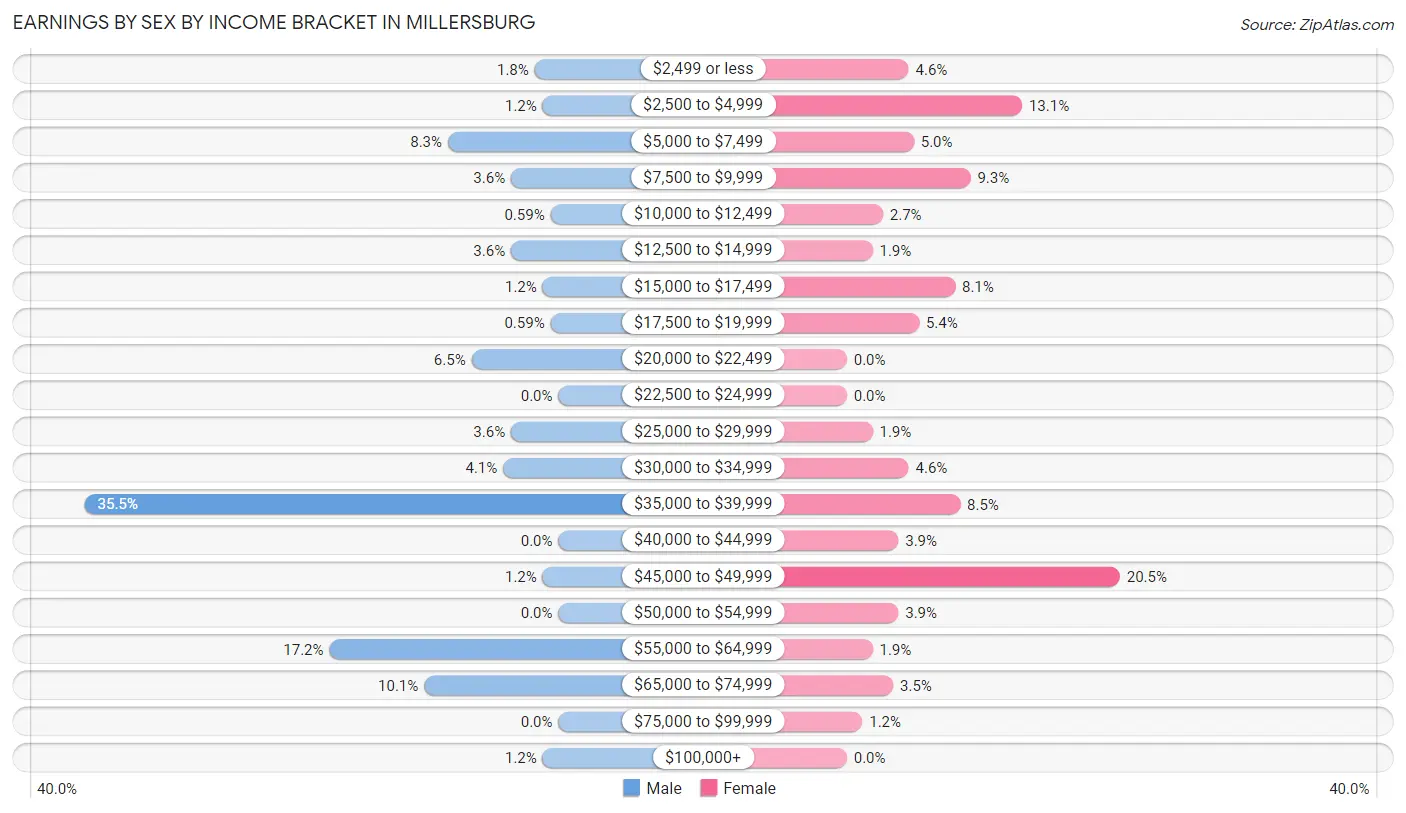
Earnings by Sex by Income Bracket in Millersburg
The most common earnings brackets in Millersburg are $35,000 to $39,999 for men (60 | 35.5%) and $45,000 to $49,999 for women (53 | 20.5%).
| Income | Male | Female |
| $2,499 or less | 3 (1.8%) | 12 (4.6%) |
| $2,500 to $4,999 | 2 (1.2%) | 34 (13.1%) |
| $5,000 to $7,499 | 14 (8.3%) | 13 (5.0%) |
| $7,500 to $9,999 | 6 (3.5%) | 24 (9.3%) |
| $10,000 to $12,499 | 1 (0.6%) | 7 (2.7%) |
| $12,500 to $14,999 | 6 (3.5%) | 5 (1.9%) |
| $15,000 to $17,499 | 2 (1.2%) | 21 (8.1%) |
| $17,500 to $19,999 | 1 (0.6%) | 14 (5.4%) |
| $20,000 to $22,499 | 11 (6.5%) | 0 (0.0%) |
| $22,500 to $24,999 | 0 (0.0%) | 0 (0.0%) |
| $25,000 to $29,999 | 6 (3.5%) | 5 (1.9%) |
| $30,000 to $34,999 | 7 (4.1%) | 12 (4.6%) |
| $35,000 to $39,999 | 60 (35.5%) | 22 (8.5%) |
| $40,000 to $44,999 | 0 (0.0%) | 10 (3.9%) |
| $45,000 to $49,999 | 2 (1.2%) | 53 (20.5%) |
| $50,000 to $54,999 | 0 (0.0%) | 10 (3.9%) |
| $55,000 to $64,999 | 29 (17.2%) | 5 (1.9%) |
| $65,000 to $74,999 | 17 (10.1%) | 9 (3.5%) |
| $75,000 to $99,999 | 0 (0.0%) | 3 (1.2%) |
| $100,000+ | 2 (1.2%) | 0 (0.0%) |
| Total | 169 (100.0%) | 259 (100.0%) |
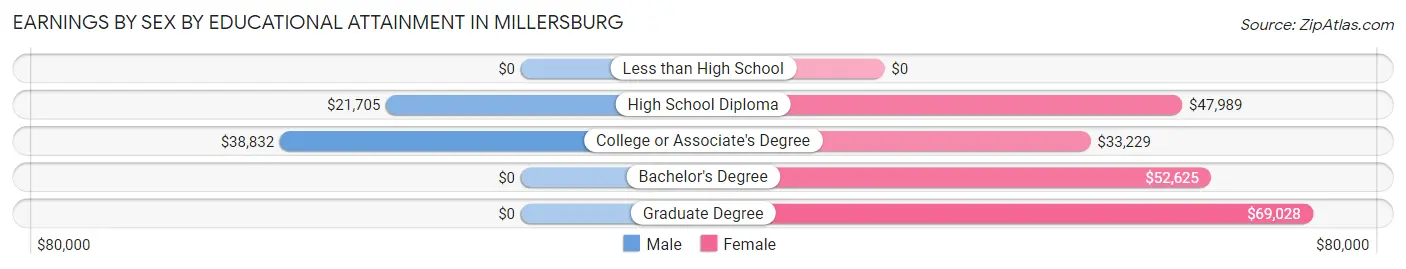
Earnings by Sex by Educational Attainment in Millersburg
Average earnings in Millersburg are $38,088 for men and $36,838 for women, a difference of 3.3%. Men with an educational attainment of college or associate's degree enjoy the highest average annual earnings of $38,832, while those with high school diploma education earn the least with $21,705. Women with an educational attainment of graduate degree earn the most with the average annual earnings of $69,028, while those with college or associate's degree education have the smallest earnings of $33,229.
| Educational Attainment | Male Income | Female Income |
| Less than High School | - | - |
| High School Diploma | $21,705 | $47,989 |
| College or Associate's Degree | $38,832 | $33,229 |
| Bachelor's Degree | - | - |
| Graduate Degree | - | - |
| Total | $38,088 | $36,838 |
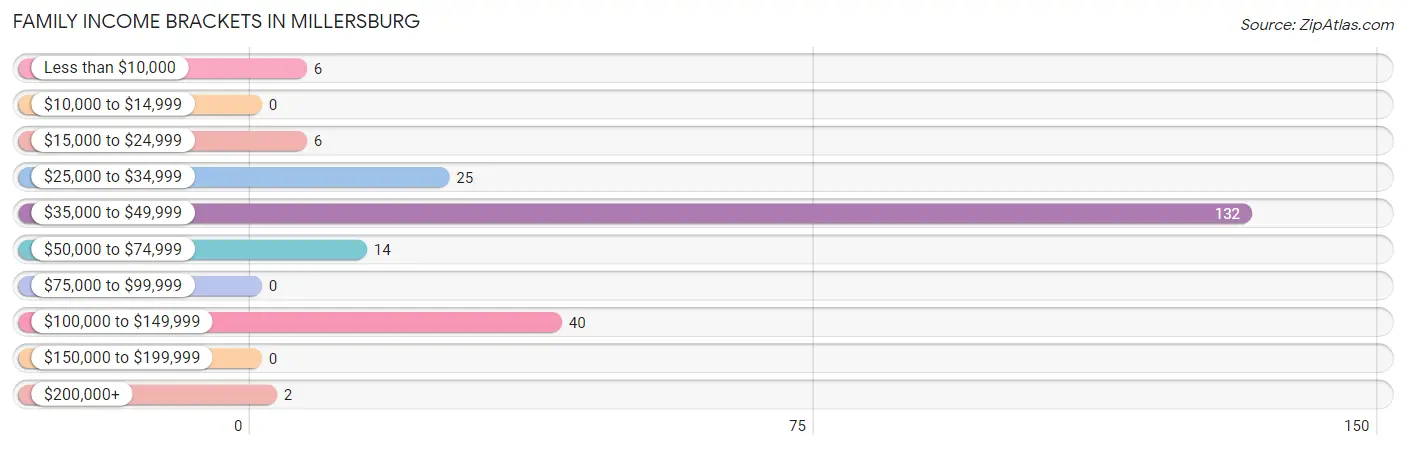
Family Income in Millersburg
Family Income Brackets in Millersburg
According to the Millersburg family income data, there are 132 families falling into the $35,000 to $49,999 income range, which is the most common income bracket and makes up 58.7% of all families.
| Income Bracket | # Families | % Families |
| Less than $10,000 | 6 | 2.7% |
| $10,000 to $14,999 | 0 | 0.0% |
| $15,000 to $24,999 | 6 | 2.7% |
| $25,000 to $34,999 | 25 | 11.1% |
| $35,000 to $49,999 | 132 | 58.7% |
| $50,000 to $74,999 | 14 | 6.2% |
| $75,000 to $99,999 | 0 | 0.0% |
| $100,000 to $149,999 | 40 | 17.8% |
| $150,000 to $199,999 | 0 | 0.0% |
| $200,000+ | 2 | 0.9% |
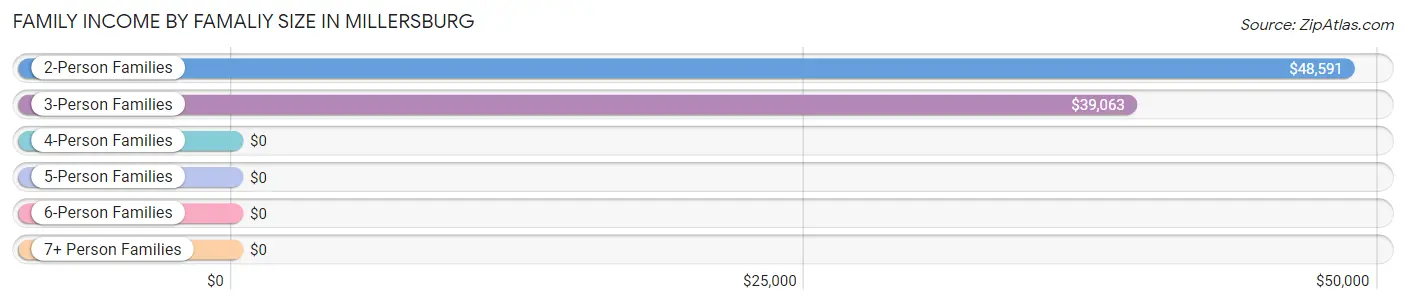
Family Income by Famaliy Size in Millersburg
2-person families (183 | 81.3%) account for the highest median family income in Millersburg with $48,591 per family, while 2-person families (183 | 81.3%) have the highest median income of $24,296 per family member.
| Income Bracket | # Families | Median Income |
| 2-Person Families | 183 (81.3%) | $48,591 |
| 3-Person Families | 27 (12.0%) | $39,063 |
| 4-Person Families | 2 (0.9%) | $0 |
| 5-Person Families | 13 (5.8%) | $0 |
| 6-Person Families | 0 (0.0%) | $0 |
| 7+ Person Families | 0 (0.0%) | $0 |
| Total | 225 (100.0%) | $48,615 |
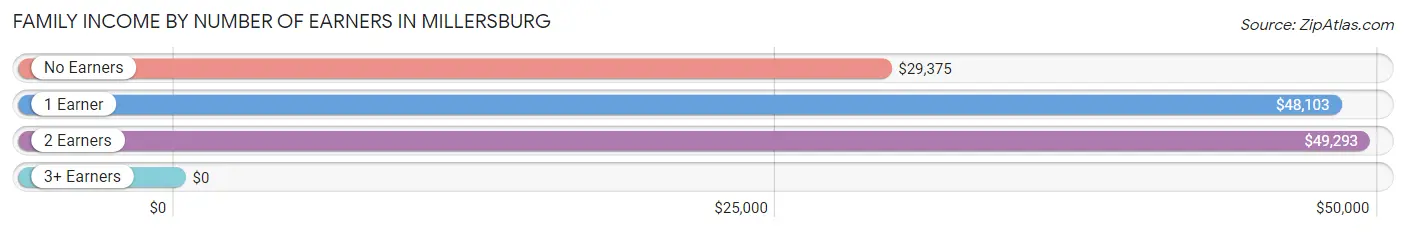
Family Income by Number of Earners in Millersburg
| Number of Earners | # Families | Median Income |
| No Earners | 25 (11.1%) | $29,375 |
| 1 Earner | 123 (54.7%) | $48,103 |
| 2 Earners | 66 (29.3%) | $49,293 |
| 3+ Earners | 11 (4.9%) | $0 |
| Total | 225 (100.0%) | $48,615 |
Household Income in Millersburg
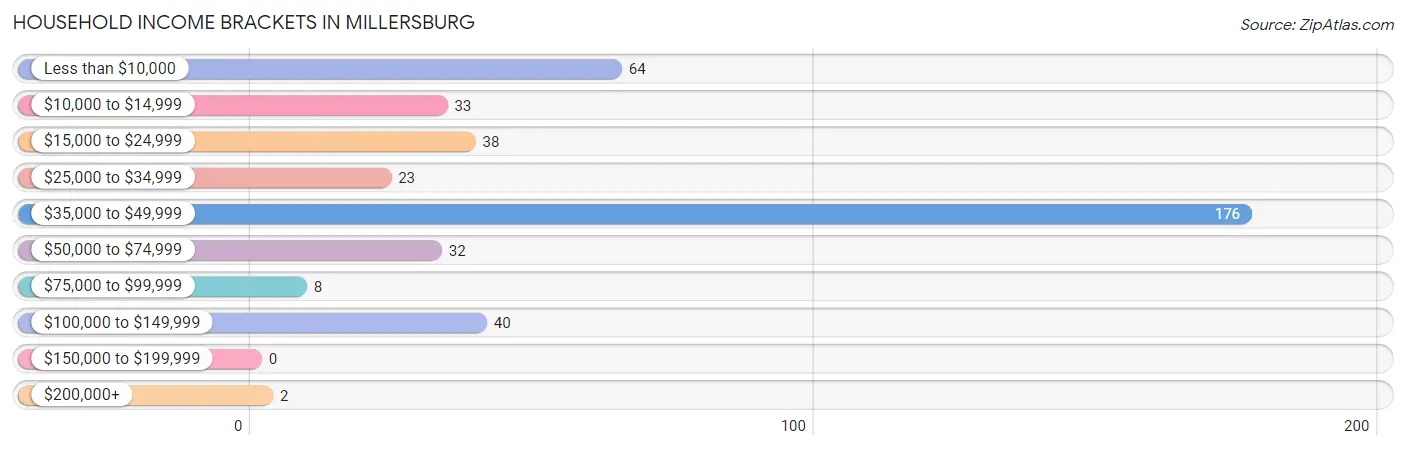
Household Income Brackets in Millersburg
With 176 households falling in the category, the $35,000 to $49,999 income range is the most frequent in Millersburg, accounting for 42.3% of all households.
| Income Bracket | # Households | % Households |
| Less than $10,000 | 64 | 15.4% |
| $10,000 to $14,999 | 33 | 7.9% |
| $15,000 to $24,999 | 38 | 9.1% |
| $25,000 to $34,999 | 23 | 5.5% |
| $35,000 to $49,999 | 176 | 42.3% |
| $50,000 to $74,999 | 32 | 7.7% |
| $75,000 to $99,999 | 8 | 1.9% |
| $100,000 to $149,999 | 40 | 9.6% |
| $150,000 to $199,999 | 0 | 0.0% |
| $200,000+ | 2 | 0.5% |
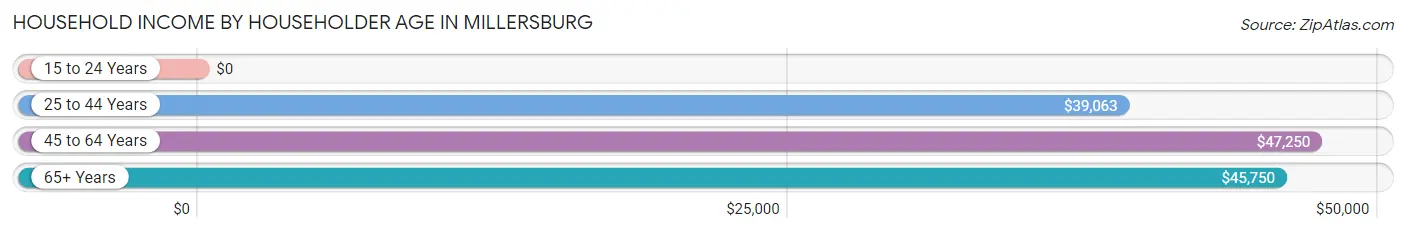
Household Income by Householder Age in Millersburg
The median household income in Millersburg is $40,769, with the highest median household income of $47,250 found in the 45 to 64 years age bracket for the primary householder. A total of 269 households (64.7%) fall into this category. Meanwhile, the 15 to 24 years age bracket for the primary householder has the lowest median household income of $0, with 21 households (5.1%) in this group.
| Income Bracket | # Households | Median Income |
| 15 to 24 Years | 21 (5.1%) | $0 |
| 25 to 44 Years | 31 (7.4%) | $39,063 |
| 45 to 64 Years | 269 (64.7%) | $47,250 |
| 65+ Years | 95 (22.8%) | $45,750 |
| Total | 416 (100.0%) | $40,769 |
Poverty in Millersburg
Income Below Poverty by Sex and Age in Millersburg
With 27.0% poverty level for males and 18.2% for females among the residents of Millersburg, 16 and 17 year old males and 15 year old females are the most vulnerable to poverty, with 15 males (68.2%) and 11 females (100.0%) in their respective age groups living below the poverty level.
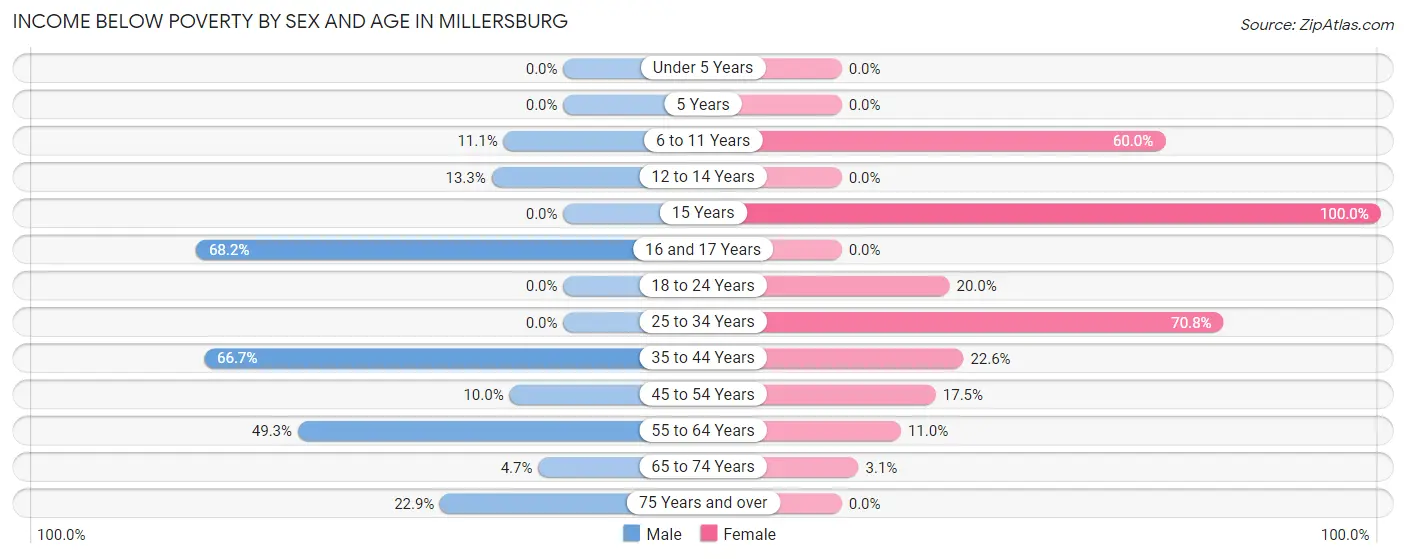
| Age Bracket | Male | Female |
| Under 5 Years | 0 (0.0%) | 0 (0.0%) |
| 5 Years | 0 (0.0%) | 0 (0.0%) |
| 6 to 11 Years | 1 (11.1%) | 3 (60.0%) |
| 12 to 14 Years | 6 (13.3%) | 0 (0.0%) |
| 15 Years | 0 (0.0%) | 11 (100.0%) |
| 16 and 17 Years | 15 (68.2%) | 0 (0.0%) |
| 18 to 24 Years | 0 (0.0%) | 7 (20.0%) |
| 25 to 34 Years | 0 (0.0%) | 17 (70.8%) |
| 35 to 44 Years | 4 (66.7%) | 7 (22.6%) |
| 45 to 54 Years | 6 (10.0%) | 11 (17.5%) |
| 55 to 64 Years | 68 (49.3%) | 10 (11.0%) |
| 65 to 74 Years | 2 (4.6%) | 1 (3.1%) |
| 75 Years and over | 8 (22.9%) | 0 (0.0%) |
| Total | 110 (27.0%) | 67 (18.2%) |
Income Above Poverty by Sex and Age in Millersburg
According to the poverty statistics in Millersburg, males aged under 5 years and females aged under 5 years are the age groups that are most secure financially, with 100.0% of males and 100.0% of females in these age groups living above the poverty line.
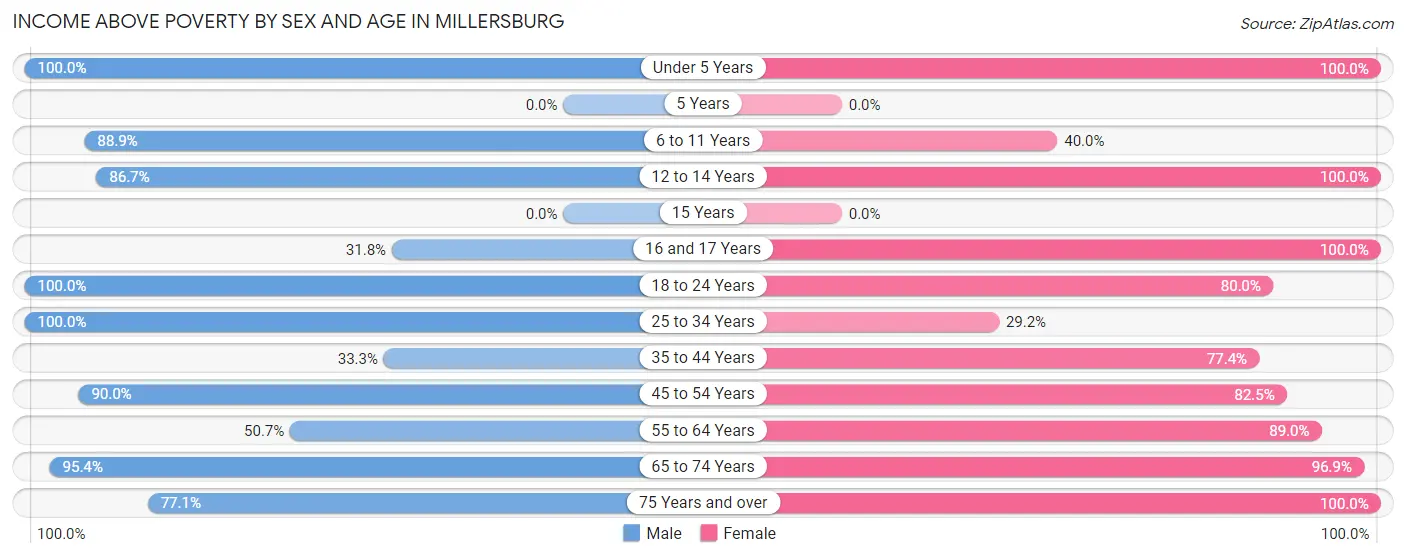
| Age Bracket | Male | Female |
| Under 5 Years | 2 (100.0%) | 11 (100.0%) |
| 5 Years | 0 (0.0%) | 0 (0.0%) |
| 6 to 11 Years | 8 (88.9%) | 2 (40.0%) |
| 12 to 14 Years | 39 (86.7%) | 10 (100.0%) |
| 15 Years | 0 (0.0%) | 0 (0.0%) |
| 16 and 17 Years | 7 (31.8%) | 27 (100.0%) |
| 18 to 24 Years | 36 (100.0%) | 28 (80.0%) |
| 25 to 34 Years | 11 (100.0%) | 7 (29.2%) |
| 35 to 44 Years | 2 (33.3%) | 24 (77.4%) |
| 45 to 54 Years | 54 (90.0%) | 52 (82.5%) |
| 55 to 64 Years | 70 (50.7%) | 81 (89.0%) |
| 65 to 74 Years | 41 (95.4%) | 31 (96.9%) |
| 75 Years and over | 27 (77.1%) | 29 (100.0%) |
| Total | 297 (73.0%) | 302 (81.8%) |
Income Below Poverty Among Married-Couple Families in Millersburg
The poverty statistics for married-couple families in Millersburg show that 4.5% or 6 of the total 132 families live below the poverty line. Families with no children have the highest poverty rate of 5.1%, comprising of 6 families. On the other hand, families with 1 or 2 children have the lowest poverty rate of 0.0%, which includes 0 families.
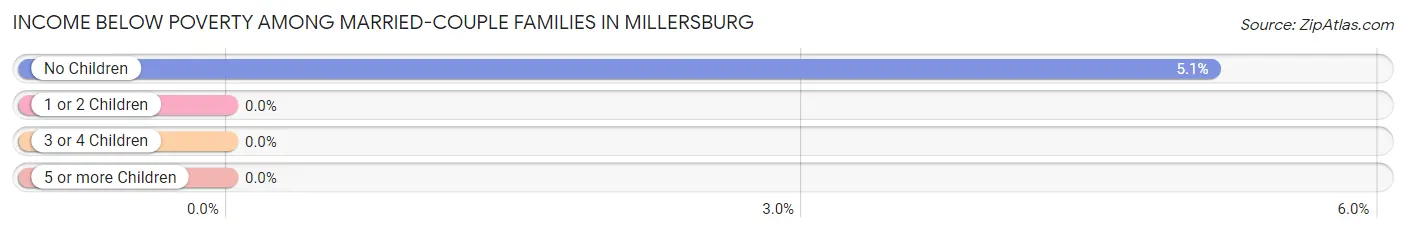
| Children | Above Poverty | Below Poverty |
| No Children | 111 (94.9%) | 6 (5.1%) |
| 1 or 2 Children | 15 (100.0%) | 0 (0.0%) |
| 3 or 4 Children | 0 (0.0%) | 0 (0.0%) |
| 5 or more Children | 0 (0.0%) | 0 (0.0%) |
| Total | 126 (95.5%) | 6 (4.5%) |
Income Below Poverty Among Single-Parent Households in Millersburg
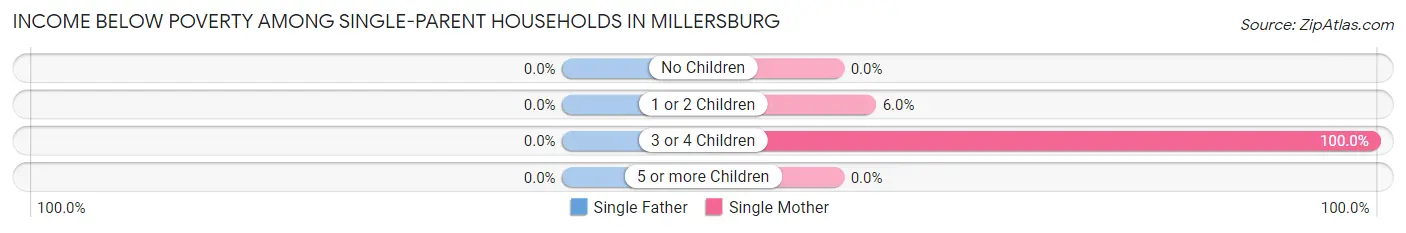
| Children | Single Father | Single Mother |
| No Children | 0 (0.0%) | 0 (0.0%) |
| 1 or 2 Children | 0 (0.0%) | 4 (6.0%) |
| 3 or 4 Children | 0 (0.0%) | 2 (100.0%) |
| 5 or more Children | 0 (0.0%) | 0 (0.0%) |
| Total | 0 (0.0%) | 6 (8.7%) |
Income Below Poverty Among Married-Couple vs Single-Parent Households in Millersburg
The poverty data for Millersburg shows that 6 of the married-couple family households (4.5%) and 6 of the single-parent households (6.5%) are living below the poverty level. Within the married-couple family households, those with no children have the highest poverty rate, with 6 households (5.1%) falling below the poverty line. Among the single-parent households, those with 3 or 4 children have the highest poverty rate, with 2 household (100.0%) living below poverty.
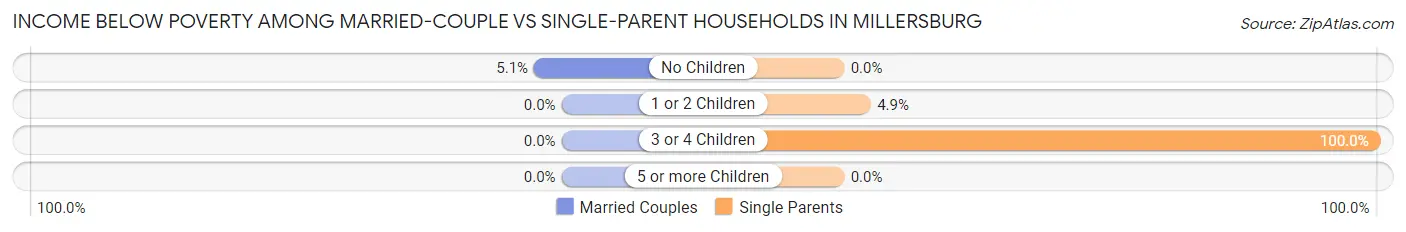
| Children | Married-Couple Families | Single-Parent Households |
| No Children | 6 (5.1%) | 0 (0.0%) |
| 1 or 2 Children | 0 (0.0%) | 4 (4.9%) |
| 3 or 4 Children | 0 (0.0%) | 2 (100.0%) |
| 5 or more Children | 0 (0.0%) | 0 (0.0%) |
| Total | 6 (4.5%) | 6 (6.5%) |
Race in Millersburg
The most populous races in Millersburg are White / Caucasian (682 | 84.4%), Black / African American (78 | 9.7%), and Two or more Races (48 | 5.9%).
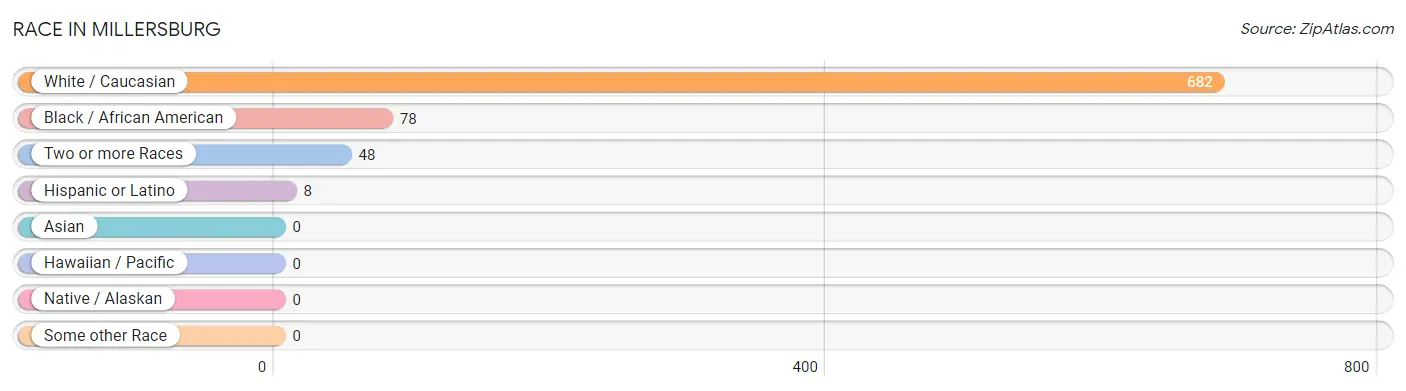
| Race | # Population | % Population |
| Asian | 0 | 0.0% |
| Black / African American | 78 | 9.7% |
| Hawaiian / Pacific | 0 | 0.0% |
| Hispanic or Latino | 8 | 1.0% |
| Native / Alaskan | 0 | 0.0% |
| White / Caucasian | 682 | 84.4% |
| Two or more Races | 48 | 5.9% |
| Some other Race | 0 | 0.0% |
| Total | 808 | 100.0% |
Ancestry in Millersburg
The most populous ancestries reported in Millersburg are American (330 | 40.8%), Irish (152 | 18.8%), English (68 | 8.4%), German (66 | 8.2%), and French (12 | 1.5%), together accounting for 77.7% of all Millersburg residents.
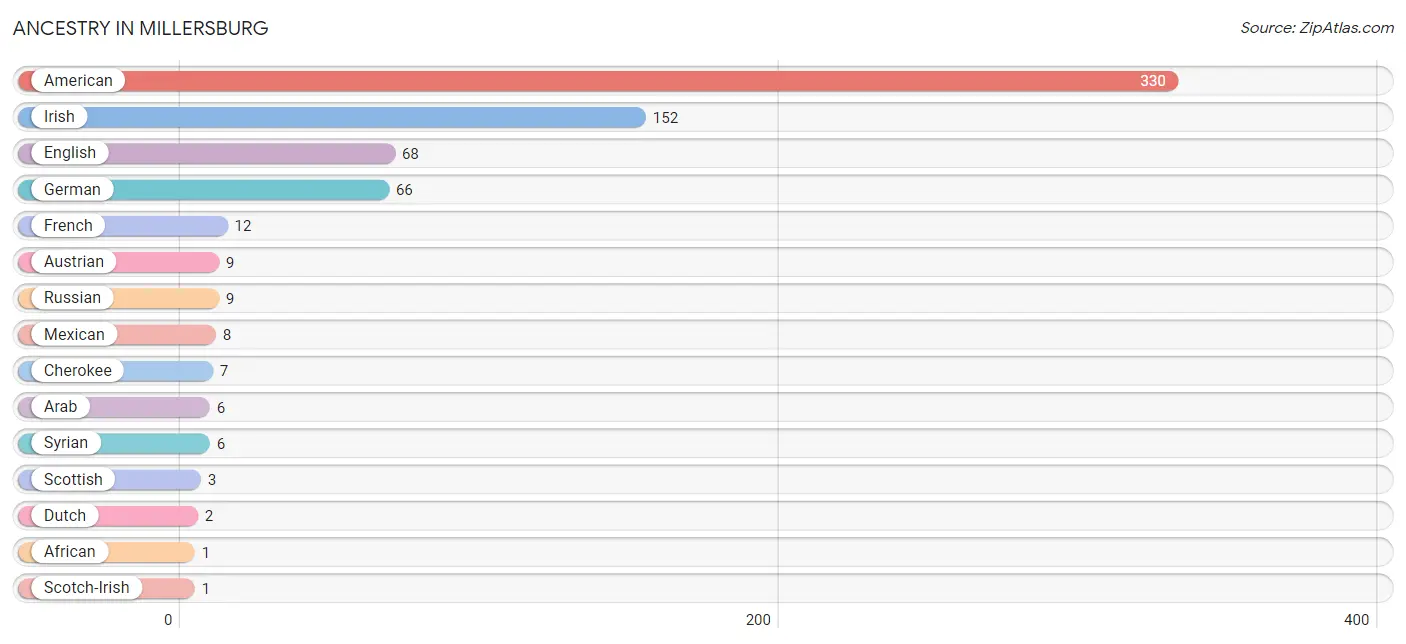
| Ancestry | # Population | % Population |
| African | 1 | 0.1% |
| American | 330 | 40.8% |
| Arab | 6 | 0.7% |
| Austrian | 9 | 1.1% |
| Cherokee | 7 | 0.9% |
| Dutch | 2 | 0.3% |
| English | 68 | 8.4% |
| French | 12 | 1.5% |
| German | 66 | 8.2% |
| Irish | 152 | 18.8% |
| Mexican | 8 | 1.0% |
| Russian | 9 | 1.1% |
| Scotch-Irish | 1 | 0.1% |
| Scottish | 3 | 0.4% |
| Subsaharan African | 1 | 0.1% |
| Syrian | 6 | 0.7% | View All 16 Rows |
Immigrants in Millersburg

| Immigration Origin | # Population | % Population | View All 0 Rows |
Sex and Age in Millersburg
Sex and Age in Millersburg
The most populous age groups in Millersburg are 55 to 59 Years (110 | 25.1%) for men and 55 to 59 Years (81 | 22.0%) for women.
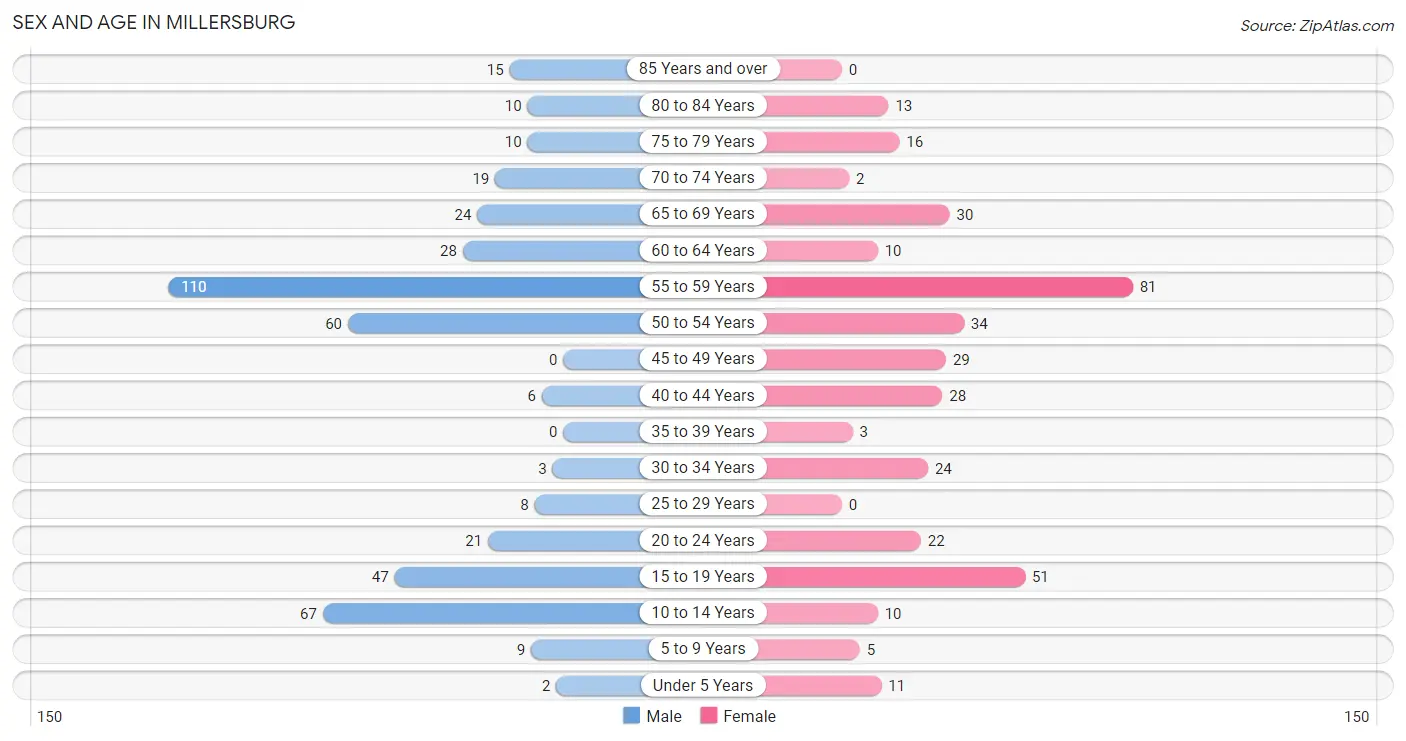
| Age Bracket | Male | Female |
| Under 5 Years | 2 (0.5%) | 11 (3.0%) |
| 5 to 9 Years | 9 (2.1%) | 5 (1.4%) |
| 10 to 14 Years | 67 (15.3%) | 10 (2.7%) |
| 15 to 19 Years | 47 (10.7%) | 51 (13.8%) |
| 20 to 24 Years | 21 (4.8%) | 22 (6.0%) |
| 25 to 29 Years | 8 (1.8%) | 0 (0.0%) |
| 30 to 34 Years | 3 (0.7%) | 24 (6.5%) |
| 35 to 39 Years | 0 (0.0%) | 3 (0.8%) |
| 40 to 44 Years | 6 (1.4%) | 28 (7.6%) |
| 45 to 49 Years | 0 (0.0%) | 29 (7.9%) |
| 50 to 54 Years | 60 (13.7%) | 34 (9.2%) |
| 55 to 59 Years | 110 (25.1%) | 81 (22.0%) |
| 60 to 64 Years | 28 (6.4%) | 10 (2.7%) |
| 65 to 69 Years | 24 (5.5%) | 30 (8.1%) |
| 70 to 74 Years | 19 (4.3%) | 2 (0.5%) |
| 75 to 79 Years | 10 (2.3%) | 16 (4.3%) |
| 80 to 84 Years | 10 (2.3%) | 13 (3.5%) |
| 85 Years and over | 15 (3.4%) | 0 (0.0%) |
| Total | 439 (100.0%) | 369 (100.0%) |
Families and Households in Millersburg
Median Family Size in Millersburg
The median family size in Millersburg is 2.31 persons per family, with single male/father families (24 | 10.7%) accounting for the largest median family size of 2.83 persons per family. On the other hand, single female/mother families (69 | 30.7%) represent the smallest median family size with 1.97 persons per family.
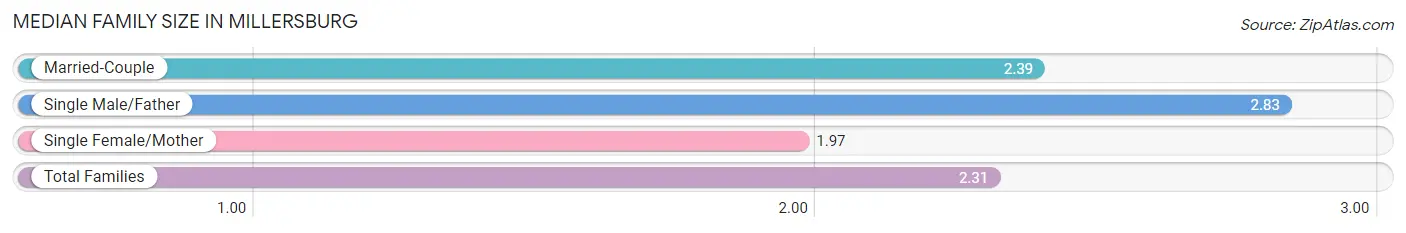
| Family Type | # Families | Family Size |
| Married-Couple | 132 (58.7%) | 2.39 |
| Single Male/Father | 24 (10.7%) | 2.83 |
| Single Female/Mother | 69 (30.7%) | 1.97 |
| Total Families | 225 (100.0%) | 2.31 |
Median Household Size in Millersburg
The median household size in Millersburg is 1.92 persons per household, with single male/father households (24 | 5.8%) accounting for the largest median household size of 3.75 persons per household. non-family households (191 | 45.9%) represent the smallest median household size with 1.29 persons per household.
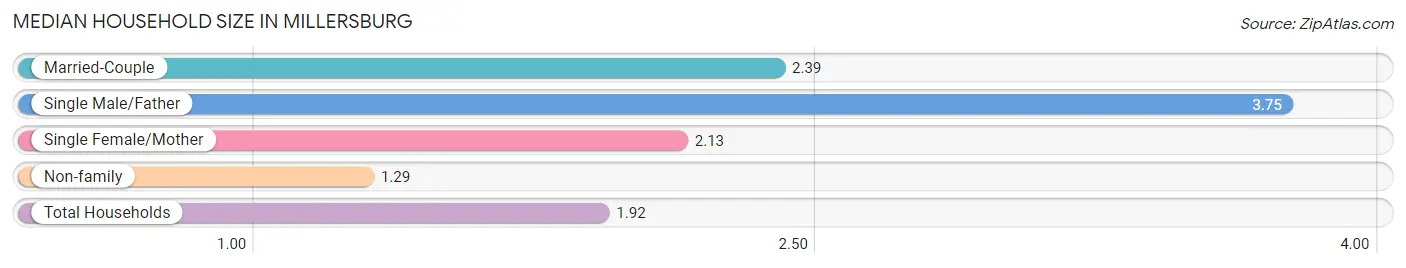
| Household Type | # Households | Household Size |
| Married-Couple | 132 (31.7%) | 2.39 |
| Single Male/Father | 24 (5.8%) | 3.75 |
| Single Female/Mother | 69 (16.6%) | 2.13 |
| Non-family | 191 (45.9%) | 1.29 |
| Total Households | 416 (100.0%) | 1.92 |
Household Size by Marriage Status in Millersburg
Out of a total of 416 households in Millersburg, 225 (54.1%) are family households, while 191 (45.9%) are nonfamily households. The most numerous type of family households are 2-person households, comprising 171, and the most common type of nonfamily households are 1-person households, comprising 166.
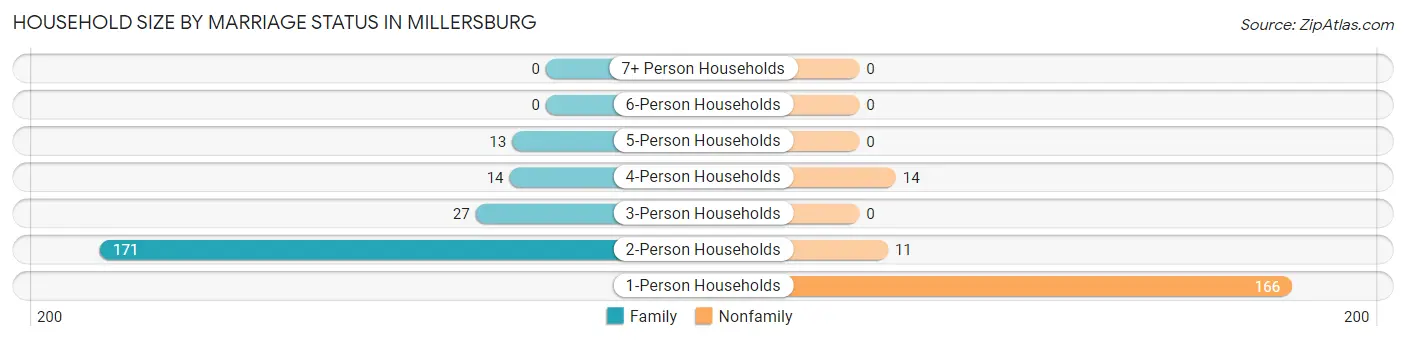
| Household Size | Family Households | Nonfamily Households |
| 1-Person Households | - | 166 (39.9%) |
| 2-Person Households | 171 (41.1%) | 11 (2.6%) |
| 3-Person Households | 27 (6.5%) | 0 (0.0%) |
| 4-Person Households | 14 (3.4%) | 14 (3.4%) |
| 5-Person Households | 13 (3.1%) | 0 (0.0%) |
| 6-Person Households | 0 (0.0%) | 0 (0.0%) |
| 7+ Person Households | 0 (0.0%) | 0 (0.0%) |
| Total | 225 (54.1%) | 191 (45.9%) |
Female Fertility in Millersburg
Fertility by Age in Millersburg
Average fertility rate in Millersburg is 6.0 births per 1,000 women. Women in the age bracket of 20 to 34 years have the highest fertility rate with 22.0 births per 1,000 women. Women in the age bracket of 20 to 34 years acount for 100.0% of all women with births.
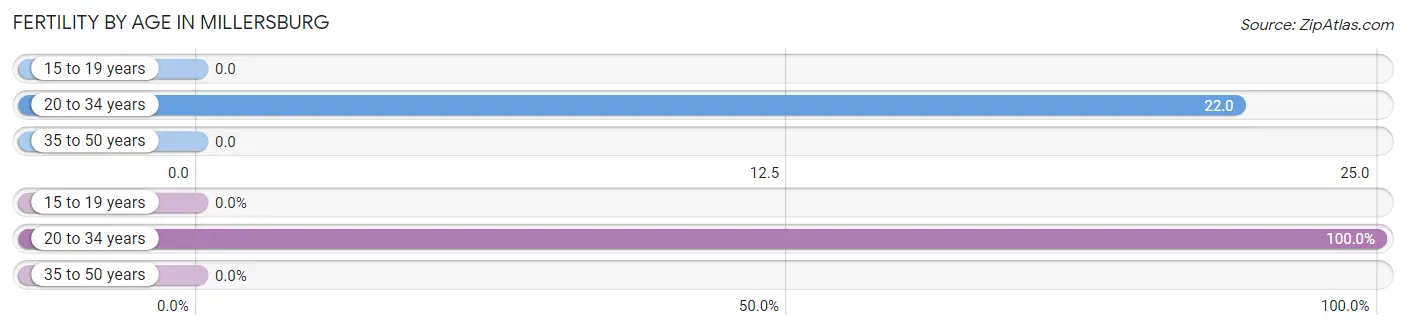
| Age Bracket | Women with Births | Births / 1,000 Women |
| 15 to 19 years | 0 (0.0%) | 0.0 |
| 20 to 34 years | 1 (100.0%) | 22.0 |
| 35 to 50 years | 0 (0.0%) | 0.0 |
| Total | 1 (100.0%) | 6.0 |
Fertility by Age by Marriage Status in Millersburg
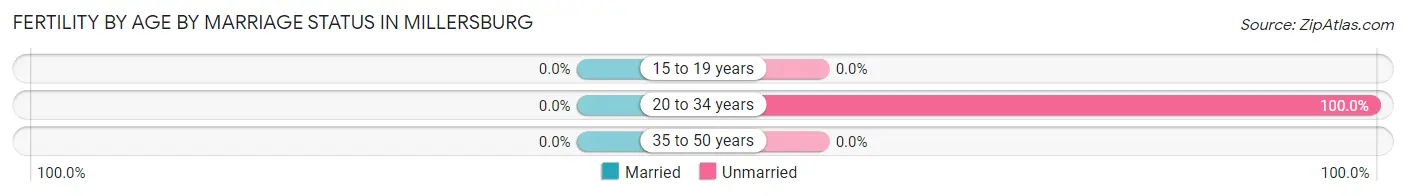
| Age Bracket | Married | Unmarried |
| 15 to 19 years | 0 (0.0%) | 0 (0.0%) |
| 20 to 34 years | 0 (0.0%) | 1 (100.0%) |
| 35 to 50 years | 0 (0.0%) | 0 (0.0%) |
| Total | 0 (0.0%) | 1 (100.0%) |
Fertility by Education in Millersburg
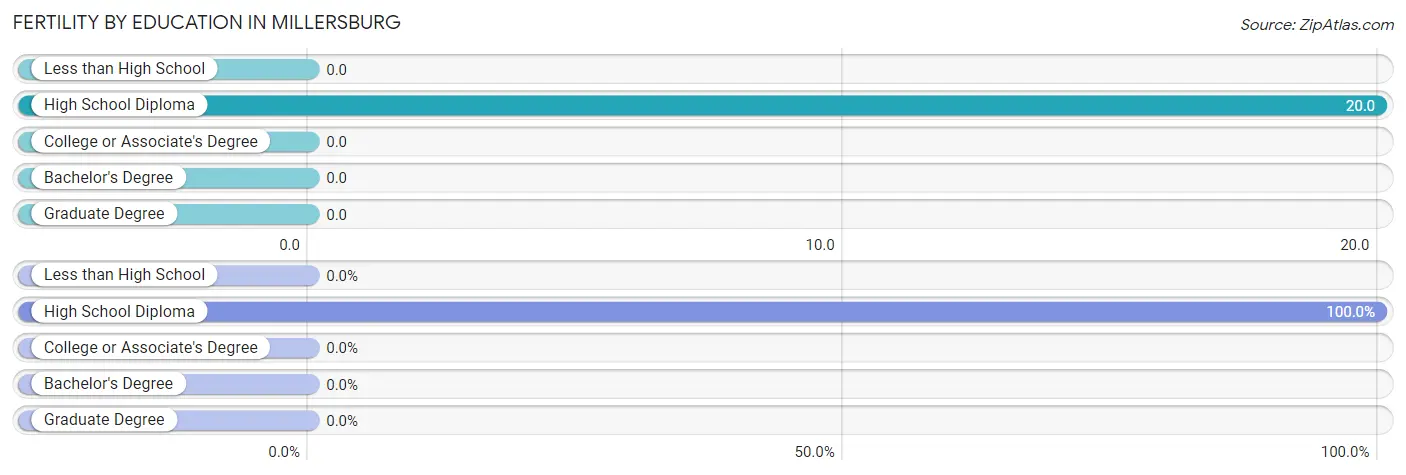
| Educational Attainment | Women with Births | Births / 1,000 Women |
| Less than High School | 0 (0.0%) | 0.0 |
| High School Diploma | 1 (100.0%) | 20.0 |
| College or Associate's Degree | 0 (0.0%) | 0.0 |
| Bachelor's Degree | 0 (0.0%) | 0.0 |
| Graduate Degree | 0 (0.0%) | 0.0 |
| Total | 1 (100.0%) | 6.0 |
Fertility by Education by Marriage Status in Millersburg
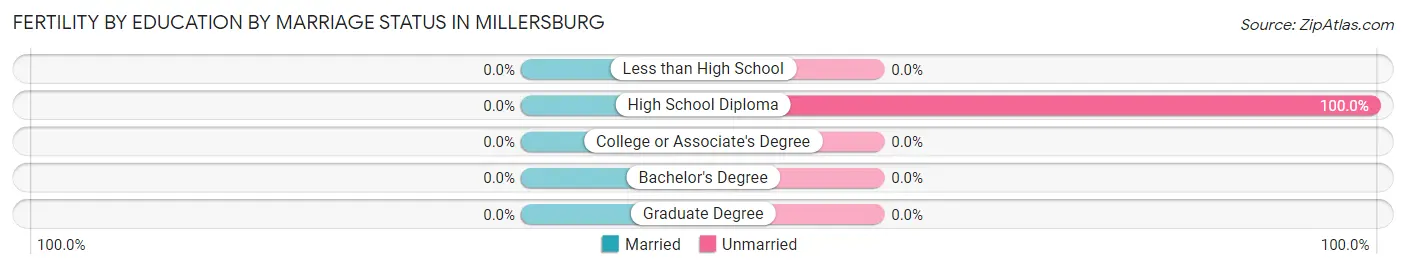
| Educational Attainment | Married | Unmarried |
| Less than High School | 0 (0.0%) | 0 (0.0%) |
| High School Diploma | 0 (0.0%) | 1 (100.0%) |
| College or Associate's Degree | 0 (0.0%) | 0 (0.0%) |
| Bachelor's Degree | 0 (0.0%) | 0 (0.0%) |
| Graduate Degree | 0 (0.0%) | 0 (0.0%) |
| Total | 0 (0.0%) | 1 (100.0%) |
Employment Characteristics in Millersburg
Employment by Class of Employer in Millersburg
Among the 352 employed individuals in Millersburg, private company employees (300 | 85.2%), not-for-profit organizations (20 | 5.7%), and self-employed (not incorporated) (15 | 4.3%) make up the most common classes of employment.
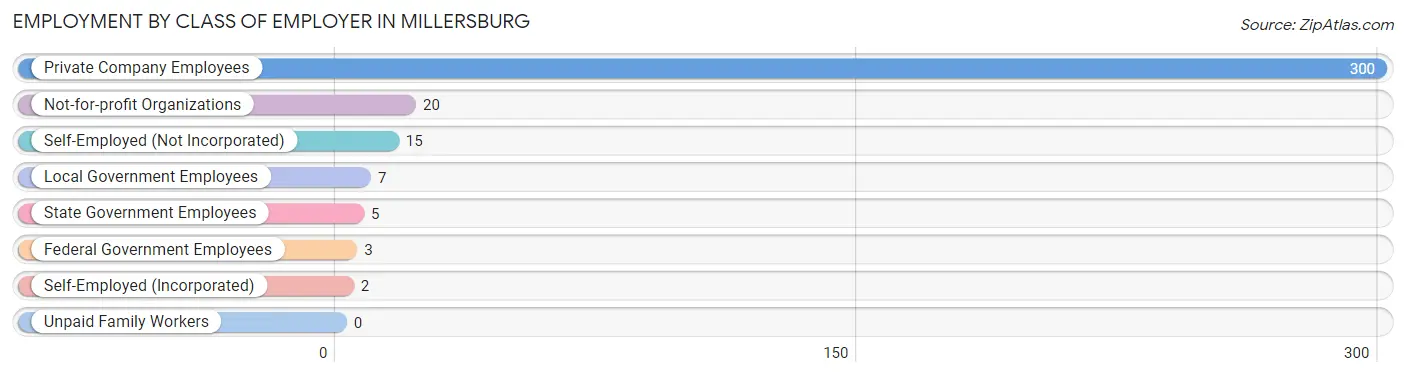
| Employer Class | # Employees | % Employees |
| Private Company Employees | 300 | 85.2% |
| Self-Employed (Incorporated) | 2 | 0.6% |
| Self-Employed (Not Incorporated) | 15 | 4.3% |
| Not-for-profit Organizations | 20 | 5.7% |
| Local Government Employees | 7 | 2.0% |
| State Government Employees | 5 | 1.4% |
| Federal Government Employees | 3 | 0.9% |
| Unpaid Family Workers | 0 | 0.0% |
| Total | 352 | 100.0% |
Employment Status by Age in Millersburg
According to the labor force statistics for Millersburg, out of the total population over 16 years of age (693), 56.3% or 390 individuals are in the labor force, with 7.4% or 29 of them unemployed. The age group with the highest labor force participation rate is 25 to 29 years, with 100.0% or 8 individuals in the labor force. Within the labor force, the 75 years and over age range has the highest percentage of unemployed individuals, with 41.7% or 5 of them being unemployed.
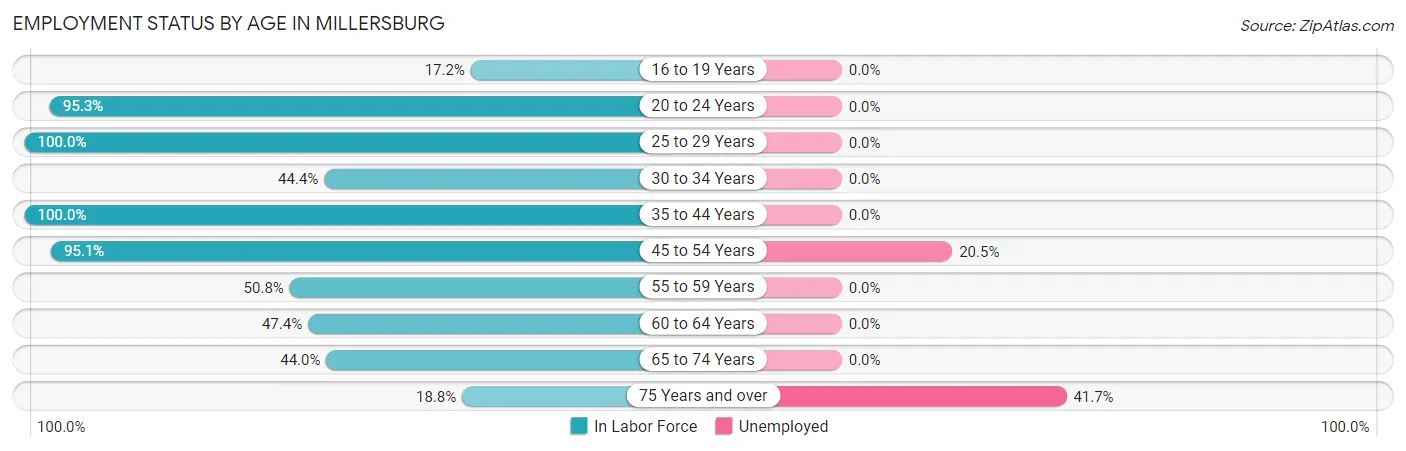
| Age Bracket | In Labor Force | Unemployed |
| 16 to 19 Years | 15 (17.2%) | 0 (0.0%) |
| 20 to 24 Years | 41 (95.3%) | 0 (0.0%) |
| 25 to 29 Years | 8 (100.0%) | 0 (0.0%) |
| 30 to 34 Years | 12 (44.4%) | 0 (0.0%) |
| 35 to 44 Years | 37 (100.0%) | 0 (0.0%) |
| 45 to 54 Years | 117 (95.1%) | 24 (20.5%) |
| 55 to 59 Years | 97 (50.8%) | 0 (0.0%) |
| 60 to 64 Years | 18 (47.4%) | 0 (0.0%) |
| 65 to 74 Years | 33 (44.0%) | 0 (0.0%) |
| 75 Years and over | 12 (18.8%) | 5 (41.7%) |
| Total | 390 (56.3%) | 29 (7.4%) |
Employment Status by Educational Attainment in Millersburg
According to labor force statistics for Millersburg, 68.2% of individuals (289) out of the total population between 25 and 64 years of age (424) are in the labor force, with 8.3% or 24 of them being unemployed. The group with the highest labor force participation rate are those with the educational attainment of college / associate degree, with 84.0% or 110 individuals in the labor force. Within the labor force, individuals with less than high school education have the highest percentage of unemployment, with 57.1% or 24 of them being unemployed.
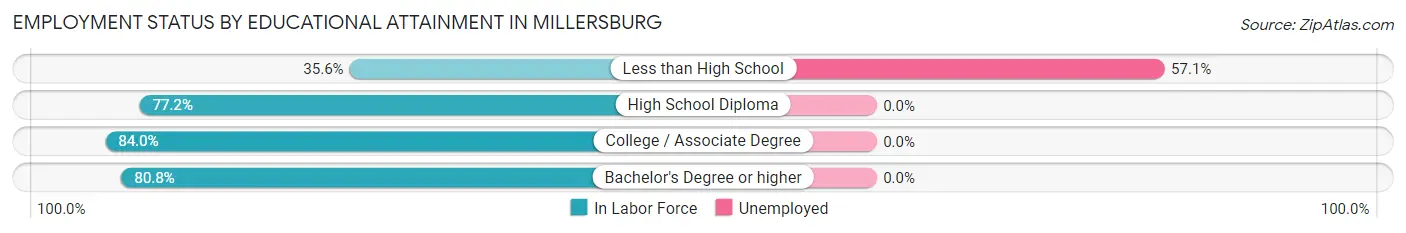
| Educational Attainment | In Labor Force | Unemployed |
| Less than High School | 42 (35.6%) | 67 (57.1%) |
| High School Diploma | 95 (77.2%) | 0 (0.0%) |
| College / Associate Degree | 110 (84.0%) | 0 (0.0%) |
| Bachelor's Degree or higher | 42 (80.8%) | 0 (0.0%) |
| Total | 289 (68.2%) | 35 (8.3%) |
Employment Occupations by Sex in Millersburg
Management, Business, Science and Arts Occupations
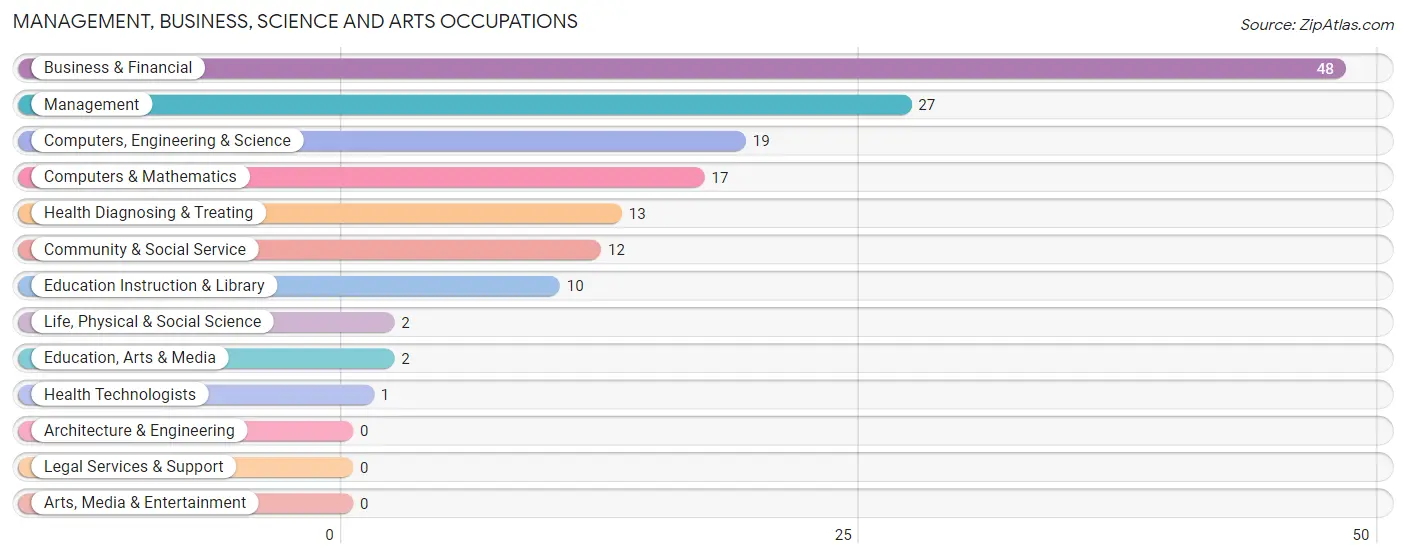
The most common Management, Business, Science and Arts occupations in Millersburg are Business & Financial (48 | 13.3%), Management (27 | 7.5%), Computers, Engineering & Science (19 | 5.3%), Computers & Mathematics (17 | 4.7%), and Health Diagnosing & Treating (13 | 3.6%).
Management, Business, Science and Arts Occupations by Sex
Within the Management, Business, Science and Arts occupations in Millersburg, the most male-oriented occupations are Computers, Engineering & Science (100.0%), Computers & Mathematics (100.0%), and Life, Physical & Social Science (100.0%), while the most female-oriented occupations are Health Diagnosing & Treating (100.0%), Health Technologists (100.0%), and Management (88.9%).
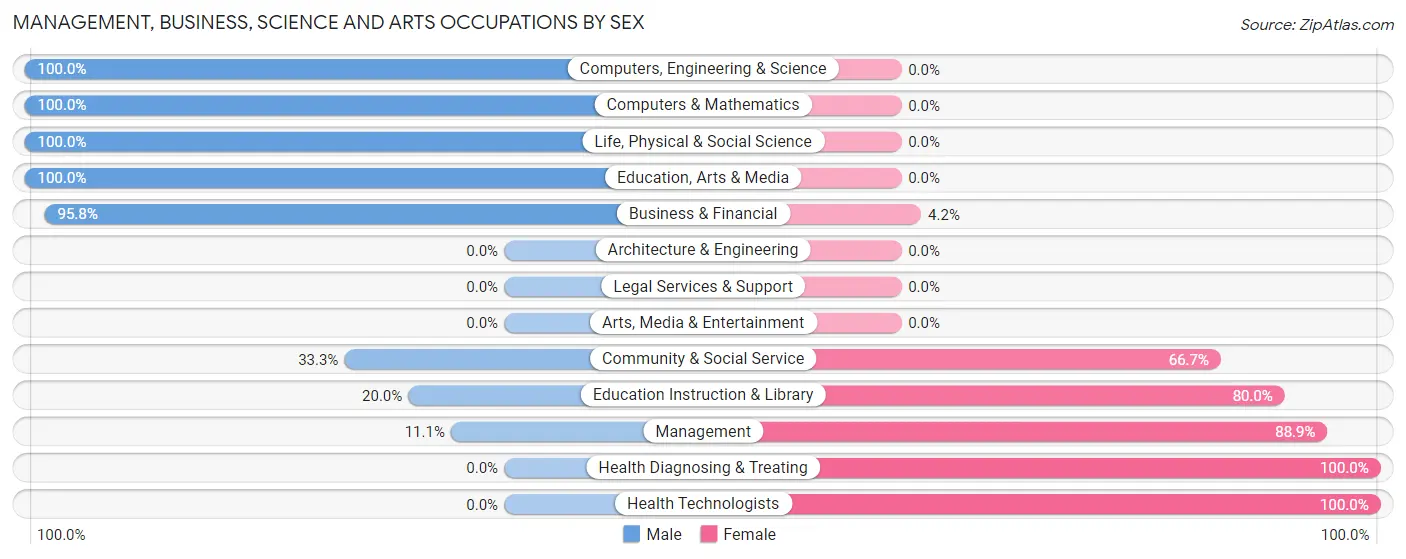
| Occupation | Male | Female |
| Management | 3 (11.1%) | 24 (88.9%) |
| Business & Financial | 46 (95.8%) | 2 (4.2%) |
| Computers, Engineering & Science | 19 (100.0%) | 0 (0.0%) |
| Computers & Mathematics | 17 (100.0%) | 0 (0.0%) |
| Architecture & Engineering | 0 (0.0%) | 0 (0.0%) |
| Life, Physical & Social Science | 2 (100.0%) | 0 (0.0%) |
| Community & Social Service | 4 (33.3%) | 8 (66.7%) |
| Education, Arts & Media | 2 (100.0%) | 0 (0.0%) |
| Legal Services & Support | 0 (0.0%) | 0 (0.0%) |
| Education Instruction & Library | 2 (20.0%) | 8 (80.0%) |
| Arts, Media & Entertainment | 0 (0.0%) | 0 (0.0%) |
| Health Diagnosing & Treating | 0 (0.0%) | 13 (100.0%) |
| Health Technologists | 0 (0.0%) | 1 (100.0%) |
| Total (Category) | 72 (60.5%) | 47 (39.5%) |
| Total (Overall) | 155 (42.9%) | 206 (57.1%) |
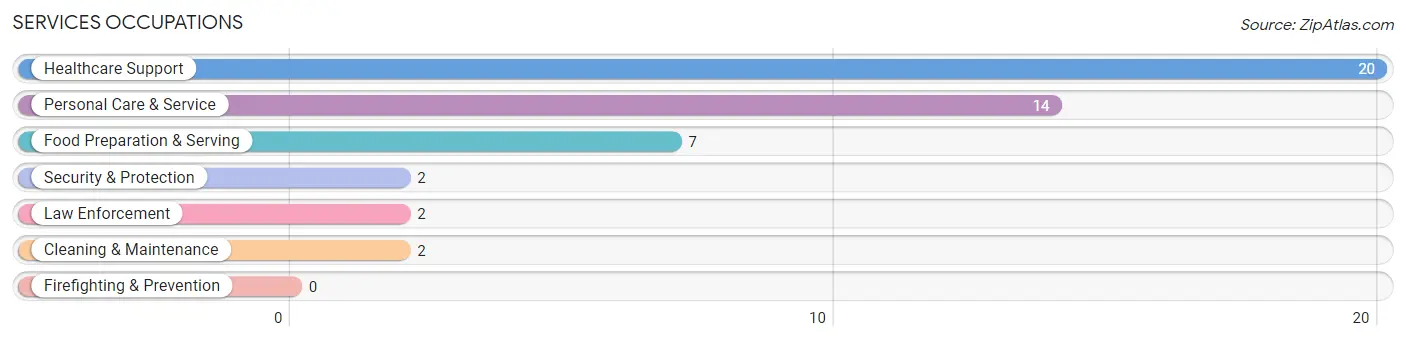
Services Occupations
The most common Services occupations in Millersburg are Healthcare Support (20 | 5.5%), Personal Care & Service (14 | 3.9%), Food Preparation & Serving (7 | 1.9%), Security & Protection (2 | 0.5%), and Law Enforcement (2 | 0.5%).
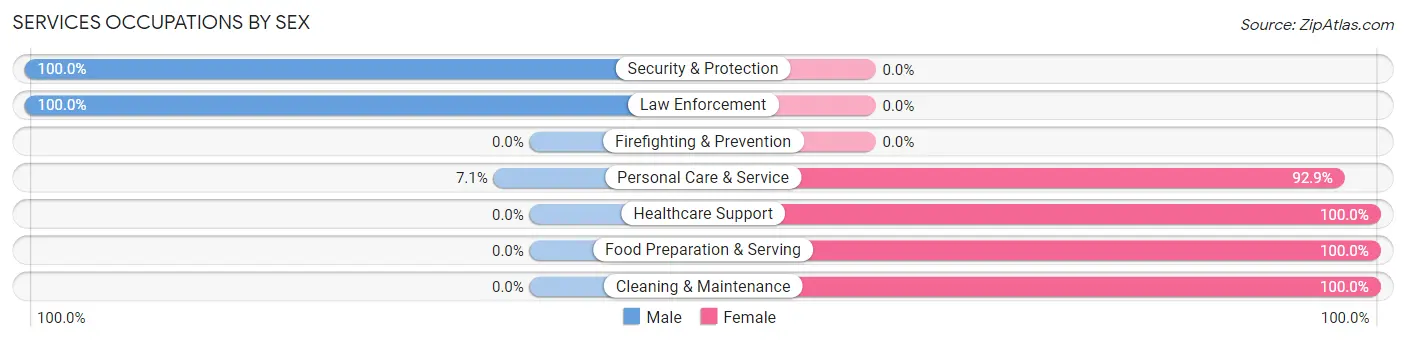
Services Occupations by Sex
Within the Services occupations in Millersburg, the most male-oriented occupations are Security & Protection (100.0%), Law Enforcement (100.0%), and Personal Care & Service (7.1%), while the most female-oriented occupations are Healthcare Support (100.0%), Food Preparation & Serving (100.0%), and Cleaning & Maintenance (100.0%).
| Occupation | Male | Female |
| Healthcare Support | 0 (0.0%) | 20 (100.0%) |
| Security & Protection | 2 (100.0%) | 0 (0.0%) |
| Firefighting & Prevention | 0 (0.0%) | 0 (0.0%) |
| Law Enforcement | 2 (100.0%) | 0 (0.0%) |
| Food Preparation & Serving | 0 (0.0%) | 7 (100.0%) |
| Cleaning & Maintenance | 0 (0.0%) | 2 (100.0%) |
| Personal Care & Service | 1 (7.1%) | 13 (92.9%) |
| Total (Category) | 3 (6.7%) | 42 (93.3%) |
| Total (Overall) | 155 (42.9%) | 206 (57.1%) |
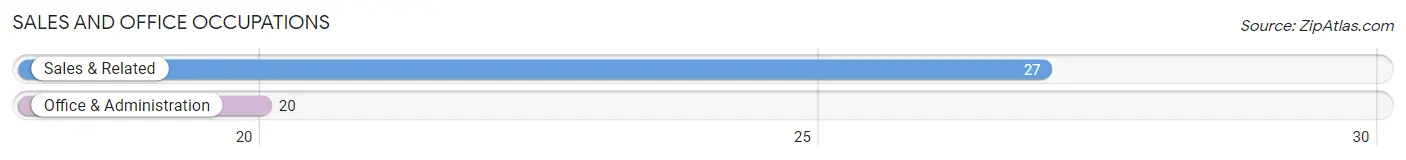
Sales and Office Occupations
The most common Sales and Office occupations in Millersburg are Sales & Related (27 | 7.5%), and Office & Administration (20 | 5.5%).
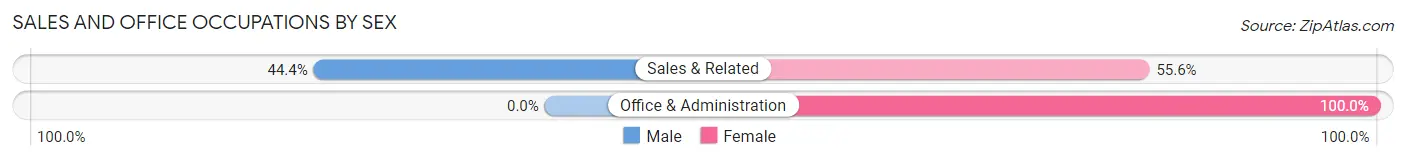
Sales and Office Occupations by Sex
| Occupation | Male | Female |
| Sales & Related | 12 (44.4%) | 15 (55.6%) |
| Office & Administration | 0 (0.0%) | 20 (100.0%) |
| Total (Category) | 12 (25.5%) | 35 (74.5%) |
| Total (Overall) | 155 (42.9%) | 206 (57.1%) |
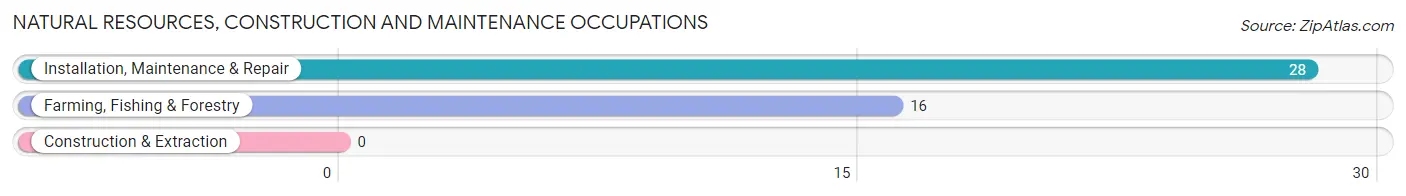
Natural Resources, Construction and Maintenance Occupations
The most common Natural Resources, Construction and Maintenance occupations in Millersburg are Installation, Maintenance & Repair (28 | 7.8%), and Farming, Fishing & Forestry (16 | 4.4%).
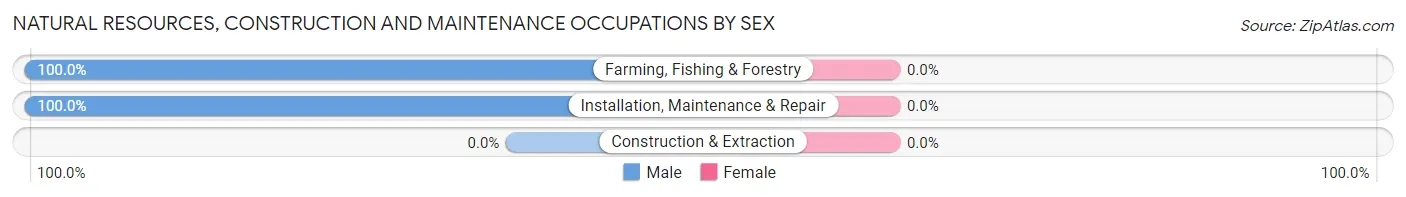
Natural Resources, Construction and Maintenance Occupations by Sex
| Occupation | Male | Female |
| Farming, Fishing & Forestry | 16 (100.0%) | 0 (0.0%) |
| Construction & Extraction | 0 (0.0%) | 0 (0.0%) |
| Installation, Maintenance & Repair | 28 (100.0%) | 0 (0.0%) |
| Total (Category) | 44 (100.0%) | 0 (0.0%) |
| Total (Overall) | 155 (42.9%) | 206 (57.1%) |
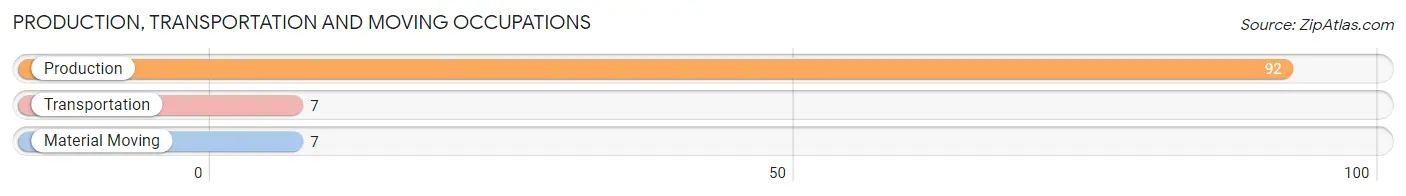
Production, Transportation and Moving Occupations
The most common Production, Transportation and Moving occupations in Millersburg are Production (92 | 25.5%), Transportation (7 | 1.9%), and Material Moving (7 | 1.9%).
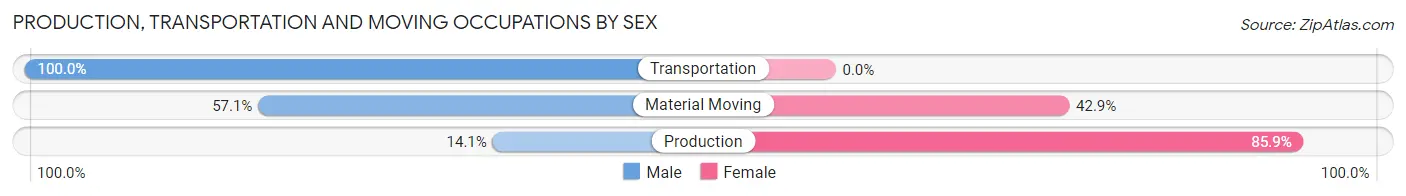
Production, Transportation and Moving Occupations by Sex
| Occupation | Male | Female |
| Production | 13 (14.1%) | 79 (85.9%) |
| Transportation | 7 (100.0%) | 0 (0.0%) |
| Material Moving | 4 (57.1%) | 3 (42.9%) |
| Total (Category) | 24 (22.6%) | 82 (77.4%) |
| Total (Overall) | 155 (42.9%) | 206 (57.1%) |
Employment Industries by Sex in Millersburg
Employment Industries in Millersburg
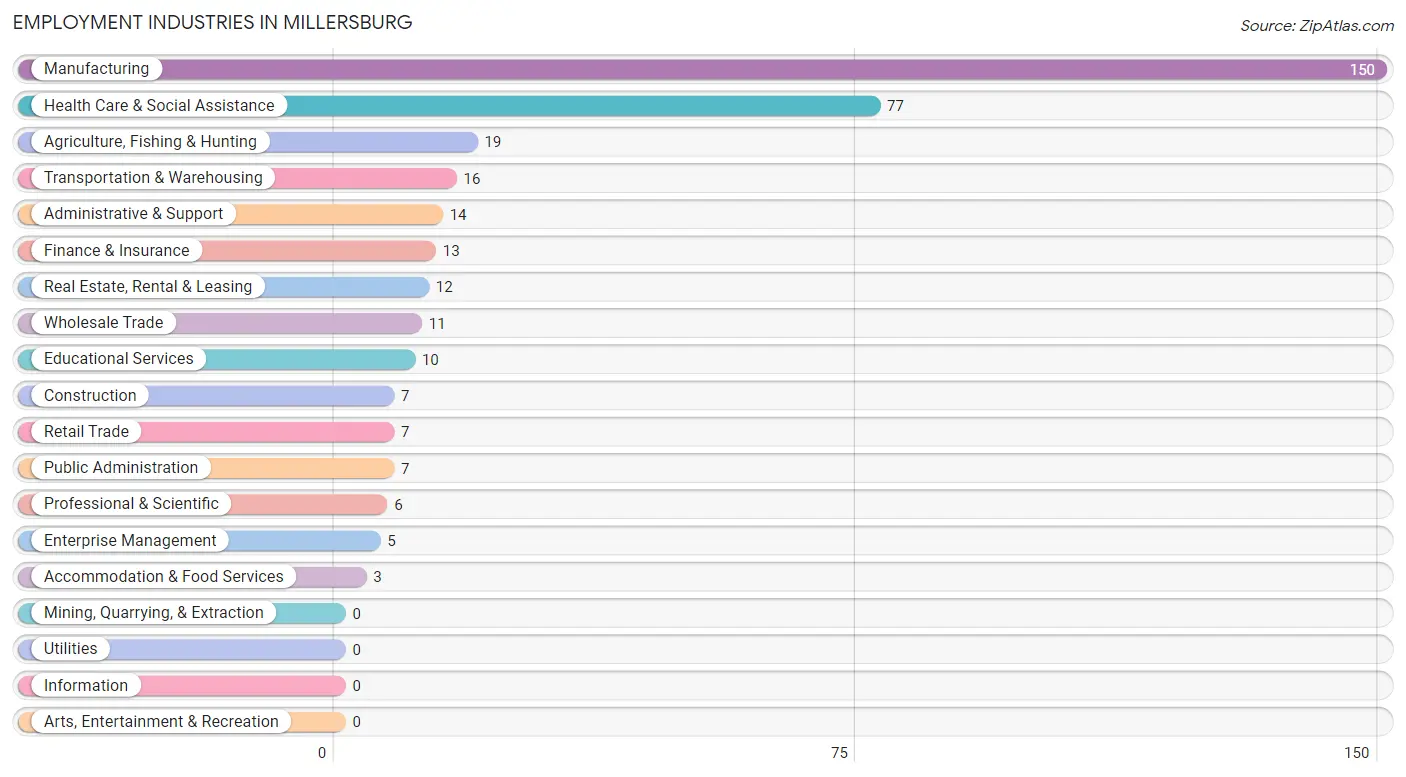
The major employment industries in Millersburg include Manufacturing (150 | 41.5%), Health Care & Social Assistance (77 | 21.3%), Agriculture, Fishing & Hunting (19 | 5.3%), Transportation & Warehousing (16 | 4.4%), and Administrative & Support (14 | 3.9%).
Employment Industries by Sex in Millersburg
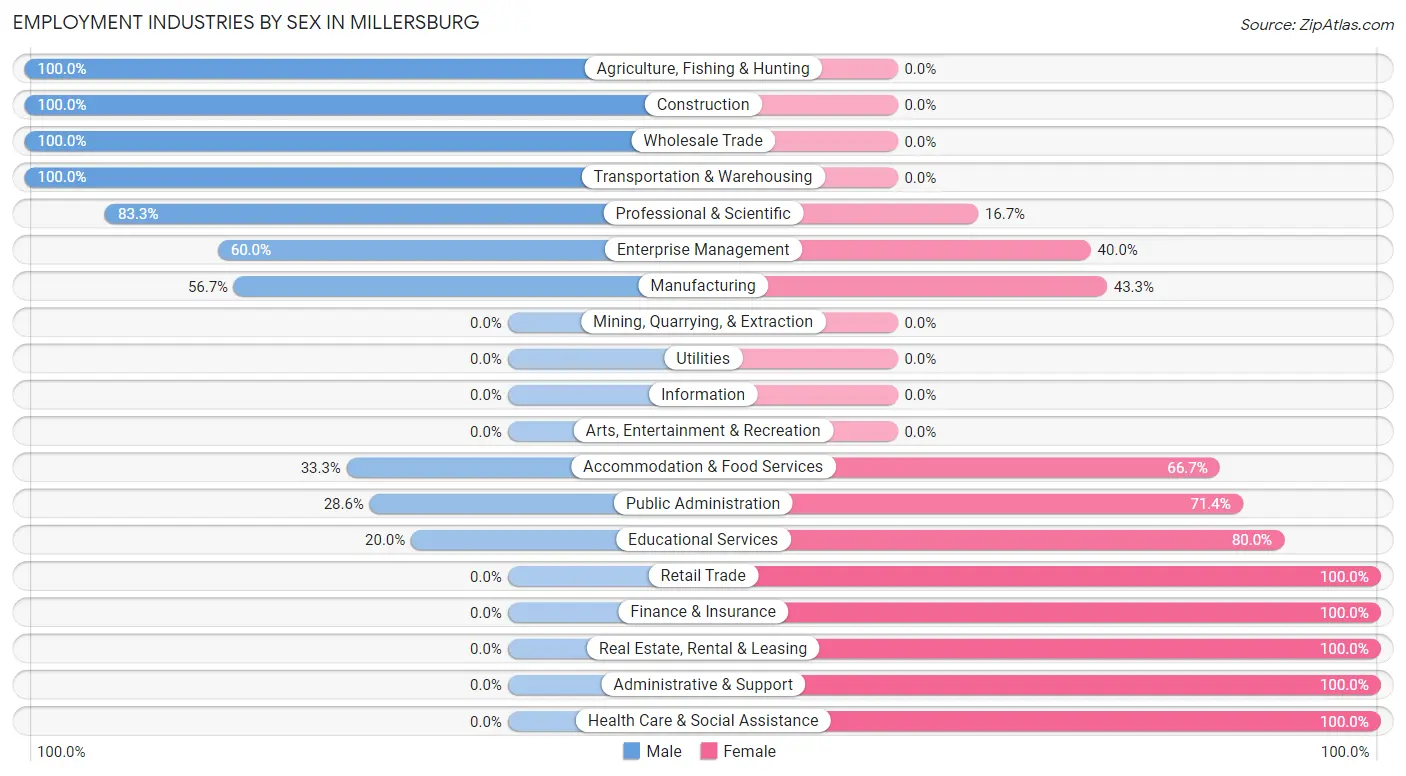
The Millersburg industries that see more men than women are Agriculture, Fishing & Hunting (100.0%), Construction (100.0%), and Wholesale Trade (100.0%), whereas the industries that tend to have a higher number of women are Retail Trade (100.0%), Finance & Insurance (100.0%), and Real Estate, Rental & Leasing (100.0%).
| Industry | Male | Female |
| Agriculture, Fishing & Hunting | 19 (100.0%) | 0 (0.0%) |
| Mining, Quarrying, & Extraction | 0 (0.0%) | 0 (0.0%) |
| Construction | 7 (100.0%) | 0 (0.0%) |
| Manufacturing | 85 (56.7%) | 65 (43.3%) |
| Wholesale Trade | 11 (100.0%) | 0 (0.0%) |
| Retail Trade | 0 (0.0%) | 7 (100.0%) |
| Transportation & Warehousing | 16 (100.0%) | 0 (0.0%) |
| Utilities | 0 (0.0%) | 0 (0.0%) |
| Information | 0 (0.0%) | 0 (0.0%) |
| Finance & Insurance | 0 (0.0%) | 13 (100.0%) |
| Real Estate, Rental & Leasing | 0 (0.0%) | 12 (100.0%) |
| Professional & Scientific | 5 (83.3%) | 1 (16.7%) |
| Enterprise Management | 3 (60.0%) | 2 (40.0%) |
| Administrative & Support | 0 (0.0%) | 14 (100.0%) |
| Educational Services | 2 (20.0%) | 8 (80.0%) |
| Health Care & Social Assistance | 0 (0.0%) | 77 (100.0%) |
| Arts, Entertainment & Recreation | 0 (0.0%) | 0 (0.0%) |
| Accommodation & Food Services | 1 (33.3%) | 2 (66.7%) |
| Public Administration | 2 (28.6%) | 5 (71.4%) |
| Total | 155 (42.9%) | 206 (57.1%) |
Education in Millersburg
School Enrollment in Millersburg
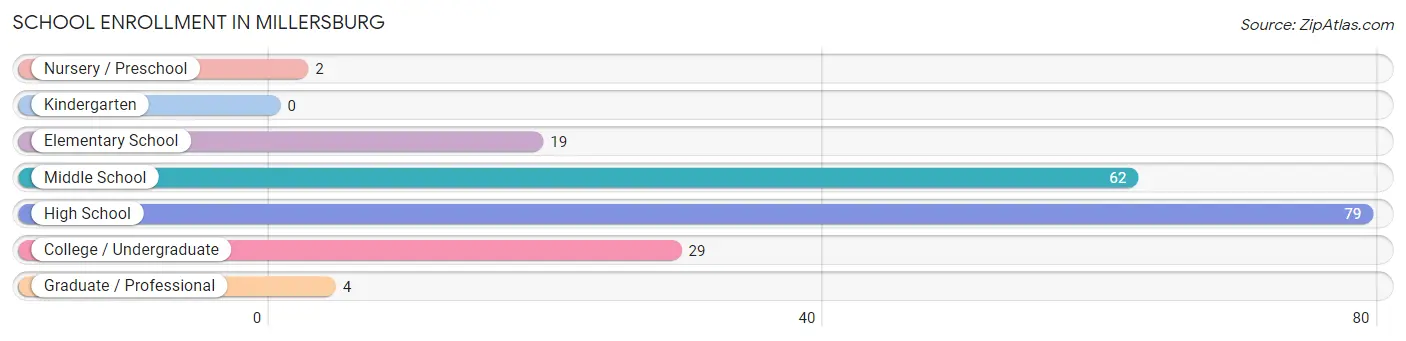
The most common levels of schooling among the 195 students in Millersburg are high school (79 | 40.5%), middle school (62 | 31.8%), and college / undergraduate (29 | 14.9%).
| School Level | # Students | % Students |
| Nursery / Preschool | 2 | 1.0% |
| Kindergarten | 0 | 0.0% |
| Elementary School | 19 | 9.7% |
| Middle School | 62 | 31.8% |
| High School | 79 | 40.5% |
| College / Undergraduate | 29 | 14.9% |
| Graduate / Professional | 4 | 2.1% |
| Total | 195 | 100.0% |
School Enrollment by Age by Funding Source in Millersburg
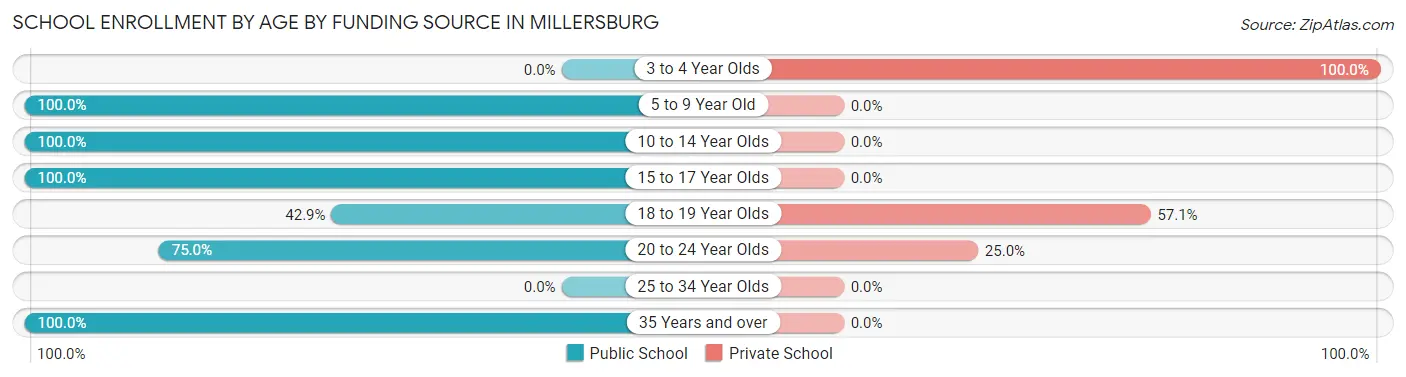
Out of a total of 195 students who are enrolled in schools in Millersburg, 23 (11.8%) attend a private institution, while the remaining 172 (88.2%) are enrolled in public schools. The age group of 3 to 4 year olds has the highest likelihood of being enrolled in private schools, with 2 (100.0% in the age bracket) enrolled. Conversely, the age group of 5 to 9 year old has the lowest likelihood of being enrolled in a private school, with 14 (100.0% in the age bracket) attending a public institution.
| Age Bracket | Public School | Private School |
| 3 to 4 Year Olds | 0 (0.0%) | 2 (100.0%) |
| 5 to 9 Year Old | 14 (100.0%) | 0 (0.0%) |
| 10 to 14 Year Olds | 77 (100.0%) | 0 (0.0%) |
| 15 to 17 Year Olds | 60 (100.0%) | 0 (0.0%) |
| 18 to 19 Year Olds | 15 (42.9%) | 20 (57.1%) |
| 20 to 24 Year Olds | 3 (75.0%) | 1 (25.0%) |
| 25 to 34 Year Olds | 0 (0.0%) | 0 (0.0%) |
| 35 Years and over | 3 (100.0%) | 0 (0.0%) |
| Total | 172 (88.2%) | 23 (11.8%) |
Educational Attainment by Field of Study in Millersburg
Business (26 | 28.6%), education (19 | 20.9%), science & technology (12 | 13.2%), psychology (11 | 12.1%), and computers & mathematics (8 | 8.8%) are the most common fields of study among 91 individuals in Millersburg who have obtained a bachelor's degree or higher.
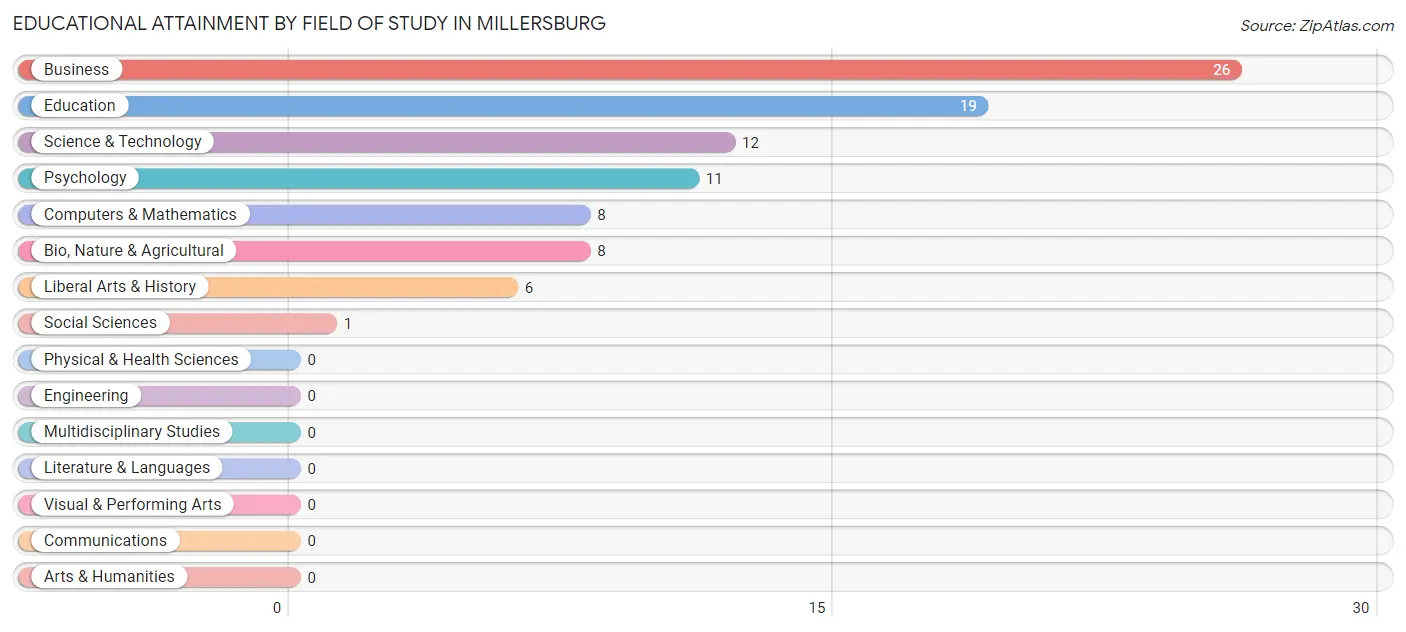
| Field of Study | # Graduates | % Graduates |
| Computers & Mathematics | 8 | 8.8% |
| Bio, Nature & Agricultural | 8 | 8.8% |
| Physical & Health Sciences | 0 | 0.0% |
| Psychology | 11 | 12.1% |
| Social Sciences | 1 | 1.1% |
| Engineering | 0 | 0.0% |
| Multidisciplinary Studies | 0 | 0.0% |
| Science & Technology | 12 | 13.2% |
| Business | 26 | 28.6% |
| Education | 19 | 20.9% |
| Literature & Languages | 0 | 0.0% |
| Liberal Arts & History | 6 | 6.6% |
| Visual & Performing Arts | 0 | 0.0% |
| Communications | 0 | 0.0% |
| Arts & Humanities | 0 | 0.0% |
| Total | 91 | 100.0% |
Transportation & Commute in Millersburg
Vehicle Availability by Sex in Millersburg
The most prevalent vehicle ownership categories in Millersburg are males with 2 vehicles (99, accounting for 65.6%) and females with 2 vehicles (102, making up 50.2%).
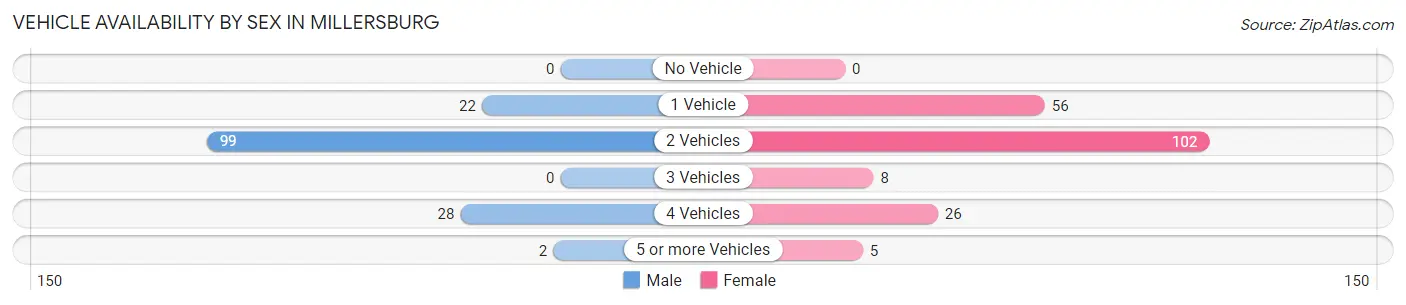
| Vehicles Available | Male | Female |
| No Vehicle | 0 (0.0%) | 0 (0.0%) |
| 1 Vehicle | 22 (14.6%) | 56 (28.4%) |
| 2 Vehicles | 99 (65.6%) | 102 (51.8%) |
| 3 Vehicles | 0 (0.0%) | 8 (4.1%) |
| 4 Vehicles | 28 (18.5%) | 26 (13.2%) |
| 5 or more Vehicles | 2 (1.3%) | 5 (2.5%) |
| Total | 151 (100.0%) | 197 (100.0%) |
Commute Time in Millersburg
The most frequently occuring commute durations in Millersburg are 15 to 19 minutes (119 commuters, 34.9%), 45 to 59 minutes (73 commuters, 21.4%), and 20 to 24 minutes (49 commuters, 14.4%).
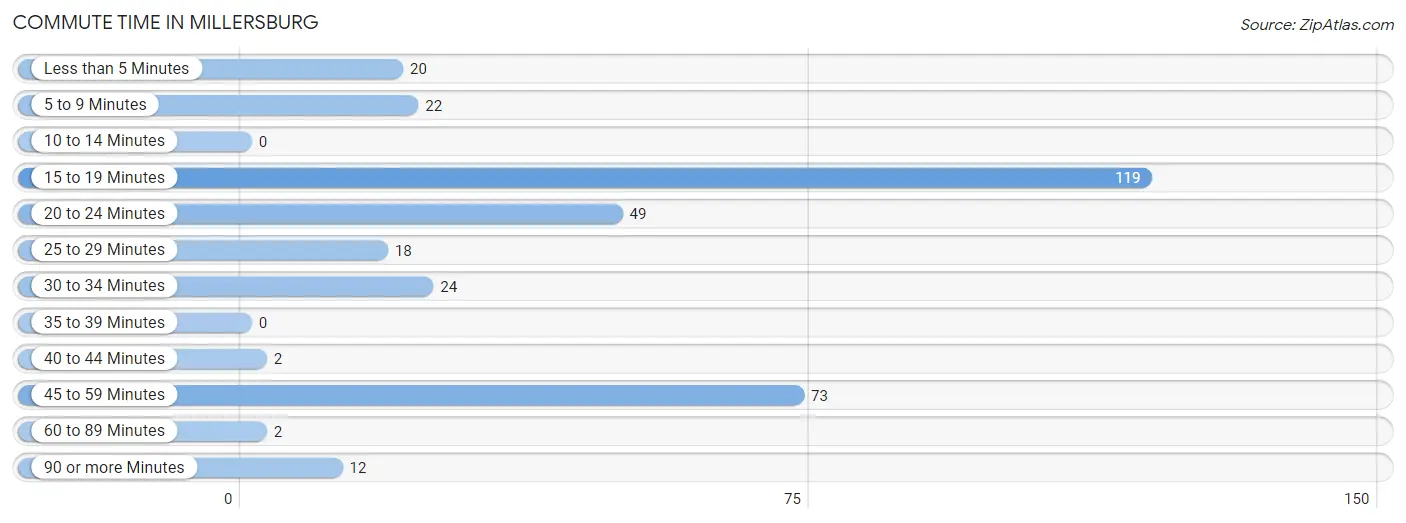
| Commute Time | # Commuters | % Commuters |
| Less than 5 Minutes | 20 | 5.9% |
| 5 to 9 Minutes | 22 | 6.5% |
| 10 to 14 Minutes | 0 | 0.0% |
| 15 to 19 Minutes | 119 | 34.9% |
| 20 to 24 Minutes | 49 | 14.4% |
| 25 to 29 Minutes | 18 | 5.3% |
| 30 to 34 Minutes | 24 | 7.0% |
| 35 to 39 Minutes | 0 | 0.0% |
| 40 to 44 Minutes | 2 | 0.6% |
| 45 to 59 Minutes | 73 | 21.4% |
| 60 to 89 Minutes | 2 | 0.6% |
| 90 or more Minutes | 12 | 3.5% |
Commute Time by Sex in Millersburg
The most common commute times in Millersburg are 15 to 19 minutes (56 commuters, 36.4%) for males and 15 to 19 minutes (63 commuters, 33.7%) for females.
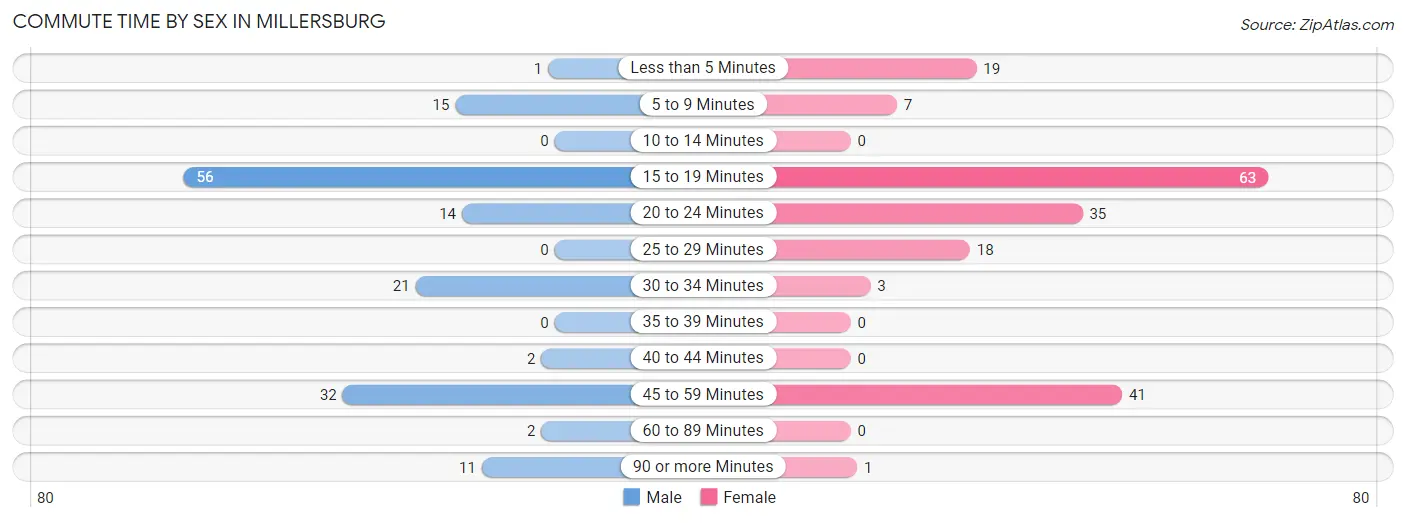
| Commute Time | Male | Female |
| Less than 5 Minutes | 1 (0.6%) | 19 (10.2%) |
| 5 to 9 Minutes | 15 (9.7%) | 7 (3.7%) |
| 10 to 14 Minutes | 0 (0.0%) | 0 (0.0%) |
| 15 to 19 Minutes | 56 (36.4%) | 63 (33.7%) |
| 20 to 24 Minutes | 14 (9.1%) | 35 (18.7%) |
| 25 to 29 Minutes | 0 (0.0%) | 18 (9.6%) |
| 30 to 34 Minutes | 21 (13.6%) | 3 (1.6%) |
| 35 to 39 Minutes | 0 (0.0%) | 0 (0.0%) |
| 40 to 44 Minutes | 2 (1.3%) | 0 (0.0%) |
| 45 to 59 Minutes | 32 (20.8%) | 41 (21.9%) |
| 60 to 89 Minutes | 2 (1.3%) | 0 (0.0%) |
| 90 or more Minutes | 11 (7.1%) | 1 (0.5%) |
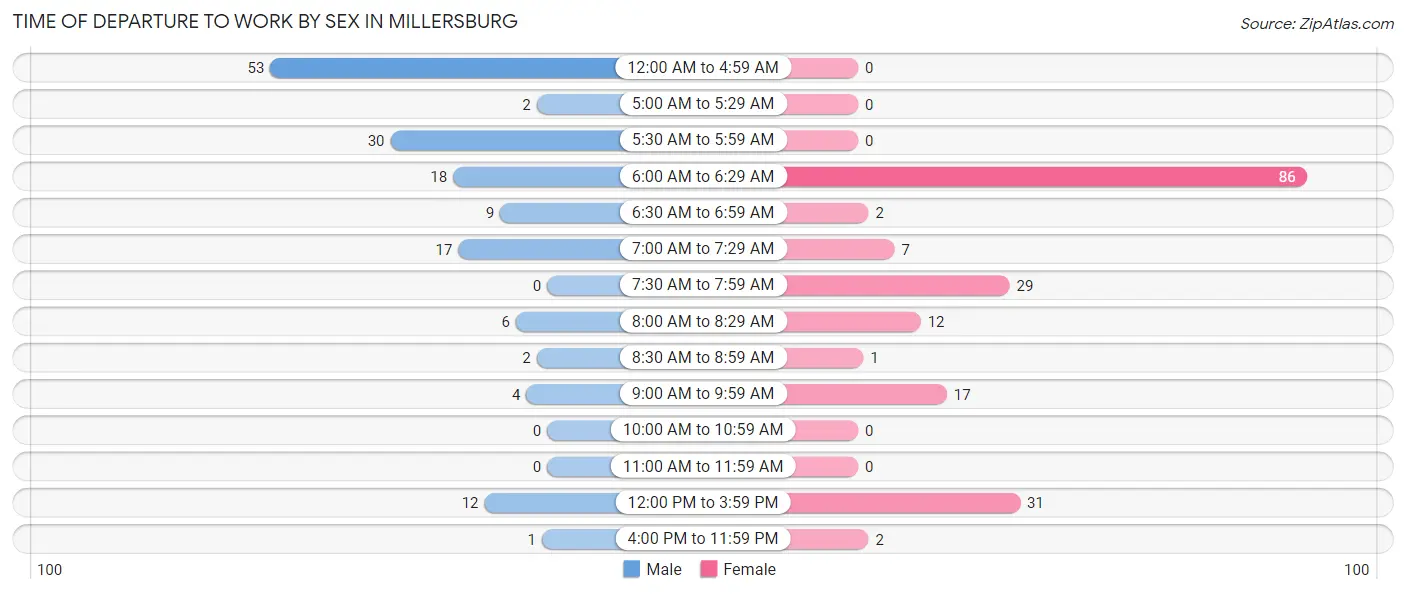
Time of Departure to Work by Sex in Millersburg
The most frequent times of departure to work in Millersburg are 12:00 AM to 4:59 AM (53, 34.4%) for males and 6:00 AM to 6:29 AM (86, 46.0%) for females.
| Time of Departure | Male | Female |
| 12:00 AM to 4:59 AM | 53 (34.4%) | 0 (0.0%) |
| 5:00 AM to 5:29 AM | 2 (1.3%) | 0 (0.0%) |
| 5:30 AM to 5:59 AM | 30 (19.5%) | 0 (0.0%) |
| 6:00 AM to 6:29 AM | 18 (11.7%) | 86 (46.0%) |
| 6:30 AM to 6:59 AM | 9 (5.8%) | 2 (1.1%) |
| 7:00 AM to 7:29 AM | 17 (11.0%) | 7 (3.7%) |
| 7:30 AM to 7:59 AM | 0 (0.0%) | 29 (15.5%) |
| 8:00 AM to 8:29 AM | 6 (3.9%) | 12 (6.4%) |
| 8:30 AM to 8:59 AM | 2 (1.3%) | 1 (0.5%) |
| 9:00 AM to 9:59 AM | 4 (2.6%) | 17 (9.1%) |
| 10:00 AM to 10:59 AM | 0 (0.0%) | 0 (0.0%) |
| 11:00 AM to 11:59 AM | 0 (0.0%) | 0 (0.0%) |
| 12:00 PM to 3:59 PM | 12 (7.8%) | 31 (16.6%) |
| 4:00 PM to 11:59 PM | 1 (0.6%) | 2 (1.1%) |
| Total | 154 (100.0%) | 187 (100.0%) |
Housing Occupancy in Millersburg
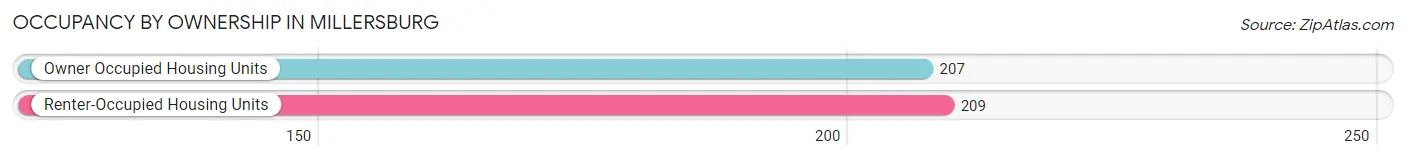
Occupancy by Ownership in Millersburg
Of the total 416 dwellings in Millersburg, owner-occupied units account for 207 (49.8%), while renter-occupied units make up 209 (50.2%).
| Occupancy | # Housing Units | % Housing Units |
| Owner Occupied Housing Units | 207 | 49.8% |
| Renter-Occupied Housing Units | 209 | 50.2% |
| Total Occupied Housing Units | 416 | 100.0% |
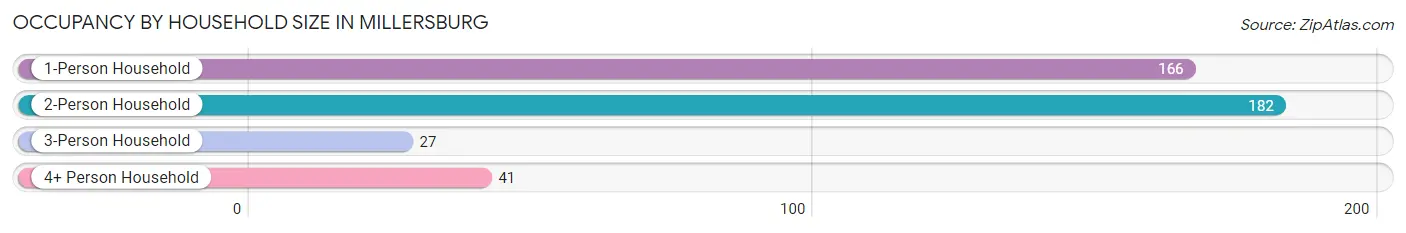
Occupancy by Household Size in Millersburg
| Household Size | # Housing Units | % Housing Units |
| 1-Person Household | 166 | 39.9% |
| 2-Person Household | 182 | 43.8% |
| 3-Person Household | 27 | 6.5% |
| 4+ Person Household | 41 | 9.9% |
| Total Housing Units | 416 | 100.0% |
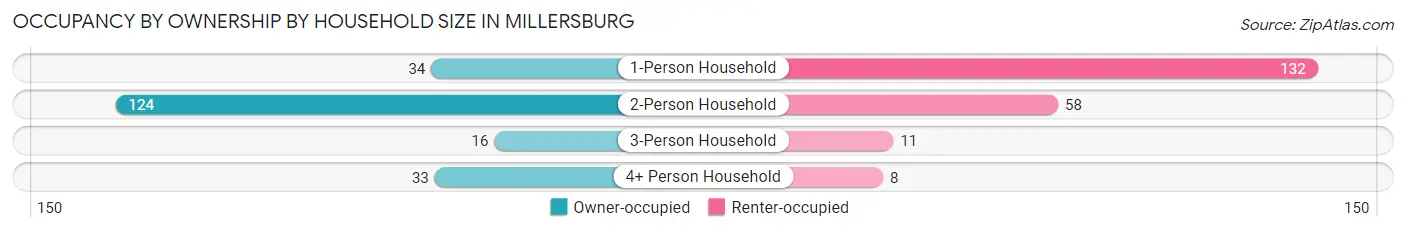
Occupancy by Ownership by Household Size in Millersburg
| Household Size | Owner-occupied | Renter-occupied |
| 1-Person Household | 34 (20.5%) | 132 (79.5%) |
| 2-Person Household | 124 (68.1%) | 58 (31.9%) |
| 3-Person Household | 16 (59.3%) | 11 (40.7%) |
| 4+ Person Household | 33 (80.5%) | 8 (19.5%) |
| Total Housing Units | 207 (49.8%) | 209 (50.2%) |
Occupancy by Educational Attainment in Millersburg
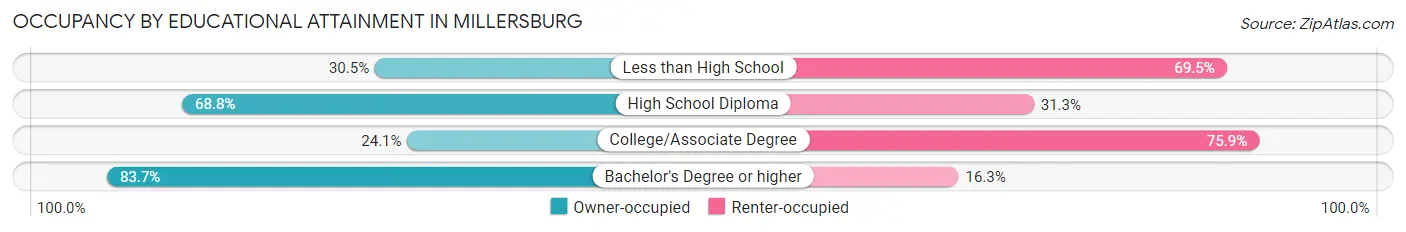
| Household Size | Owner-occupied | Renter-occupied |
| Less than High School | 29 (30.5%) | 66 (69.5%) |
| High School Diploma | 110 (68.8%) | 50 (31.2%) |
| College/Associate Degree | 27 (24.1%) | 85 (75.9%) |
| Bachelor's Degree or higher | 41 (83.7%) | 8 (16.3%) |
Occupancy by Age of Householder in Millersburg
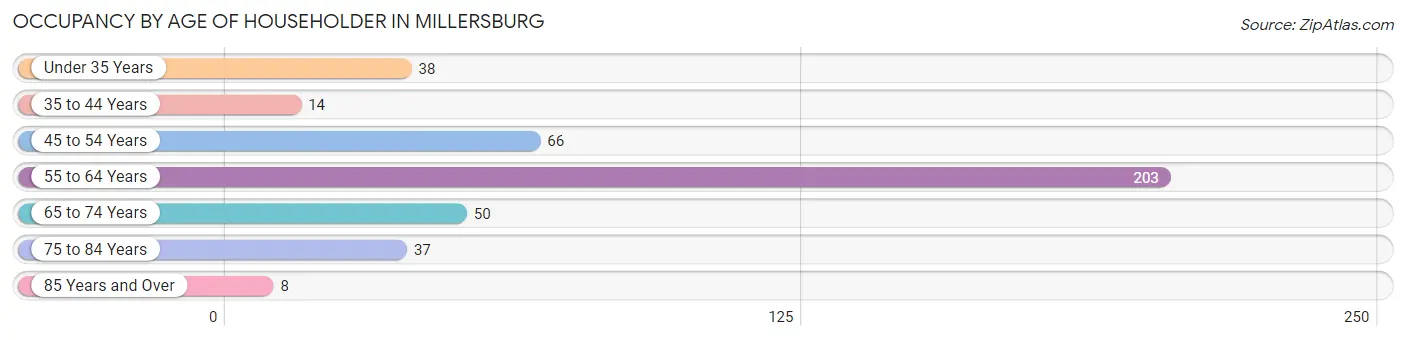
| Age Bracket | # Households | % Households |
| Under 35 Years | 38 | 9.1% |
| 35 to 44 Years | 14 | 3.4% |
| 45 to 54 Years | 66 | 15.9% |
| 55 to 64 Years | 203 | 48.8% |
| 65 to 74 Years | 50 | 12.0% |
| 75 to 84 Years | 37 | 8.9% |
| 85 Years and Over | 8 | 1.9% |
| Total | 416 | 100.0% |
Housing Finances in Millersburg
Median Income by Occupancy in Millersburg
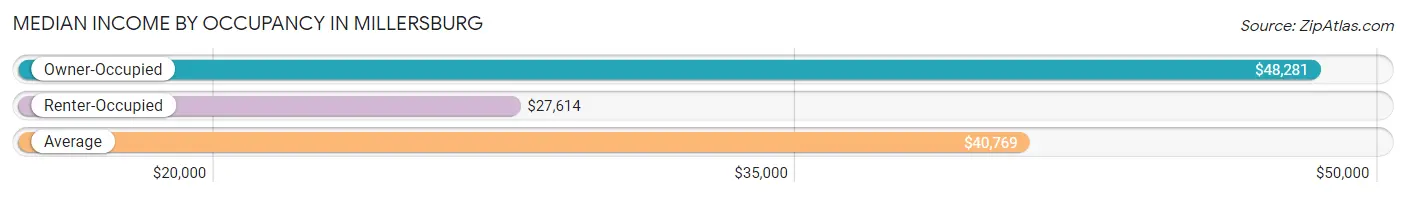
| Occupancy Type | # Households | Median Income |
| Owner-Occupied | 207 (49.8%) | $48,281 |
| Renter-Occupied | 209 (50.2%) | $27,614 |
| Average | 416 (100.0%) | $40,769 |
Occupancy by Householder Income Bracket in Millersburg
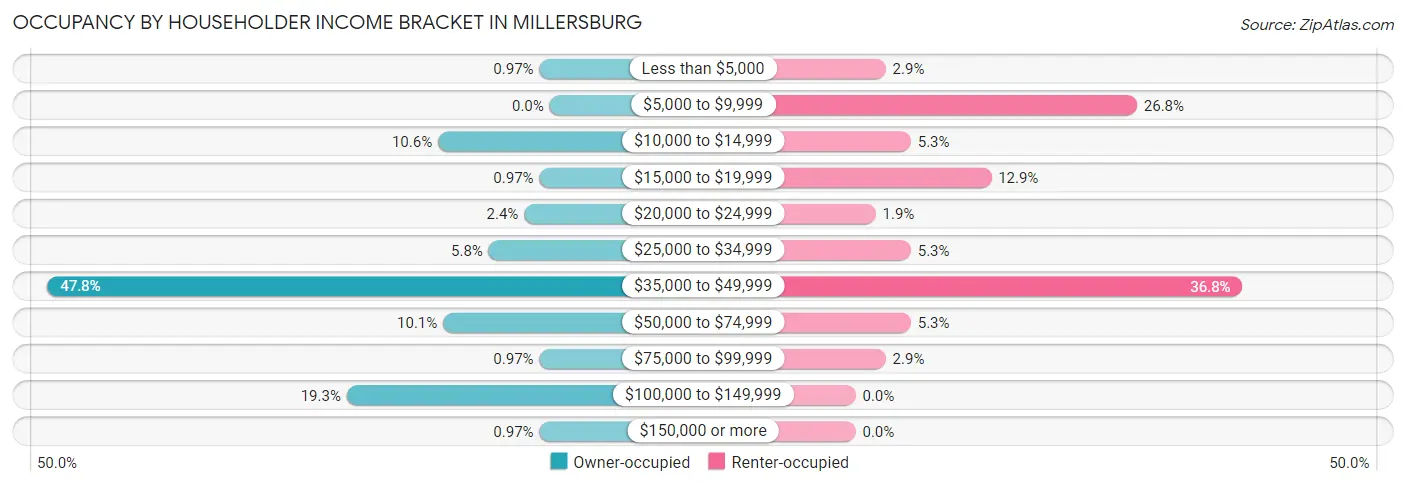
| Income Bracket | Owner-occupied | Renter-occupied |
| Less than $5,000 | 2 (1.0%) | 6 (2.9%) |
| $5,000 to $9,999 | 0 (0.0%) | 56 (26.8%) |
| $10,000 to $14,999 | 22 (10.6%) | 11 (5.3%) |
| $15,000 to $19,999 | 2 (1.0%) | 27 (12.9%) |
| $20,000 to $24,999 | 5 (2.4%) | 4 (1.9%) |
| $25,000 to $34,999 | 12 (5.8%) | 11 (5.3%) |
| $35,000 to $49,999 | 99 (47.8%) | 77 (36.8%) |
| $50,000 to $74,999 | 21 (10.1%) | 11 (5.3%) |
| $75,000 to $99,999 | 2 (1.0%) | 6 (2.9%) |
| $100,000 to $149,999 | 40 (19.3%) | 0 (0.0%) |
| $150,000 or more | 2 (1.0%) | 0 (0.0%) |
| Total | 207 (100.0%) | 209 (100.0%) |
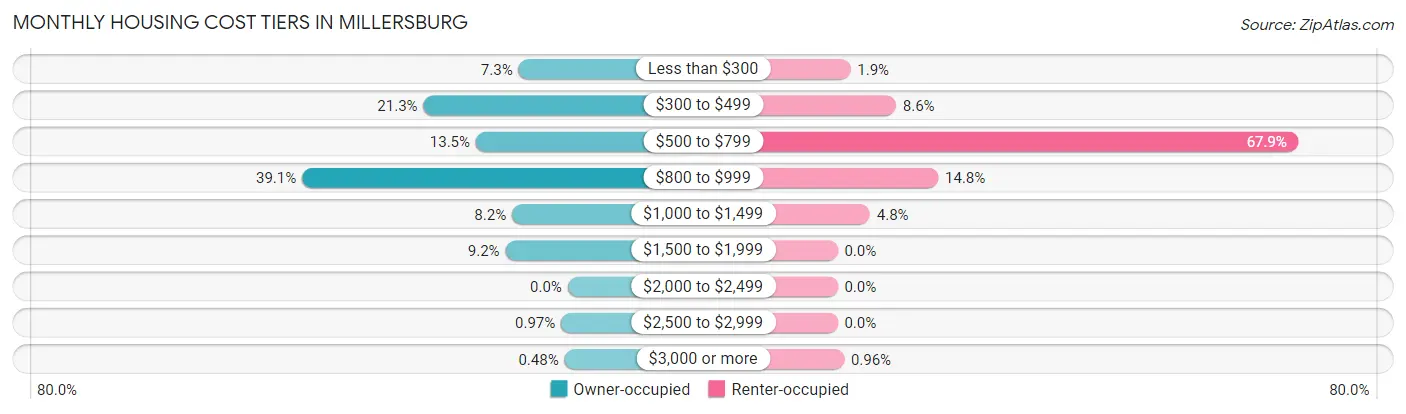
Monthly Housing Cost Tiers in Millersburg
| Monthly Cost | Owner-occupied | Renter-occupied |
| Less than $300 | 15 (7.2%) | 4 (1.9%) |
| $300 to $499 | 44 (21.3%) | 18 (8.6%) |
| $500 to $799 | 28 (13.5%) | 142 (67.9%) |
| $800 to $999 | 81 (39.1%) | 31 (14.8%) |
| $1,000 to $1,499 | 17 (8.2%) | 10 (4.8%) |
| $1,500 to $1,999 | 19 (9.2%) | 0 (0.0%) |
| $2,000 to $2,499 | 0 (0.0%) | 0 (0.0%) |
| $2,500 to $2,999 | 2 (1.0%) | 0 (0.0%) |
| $3,000 or more | 1 (0.5%) | 2 (1.0%) |
| Total | 207 (100.0%) | 209 (100.0%) |
Physical Housing Characteristics in Millersburg
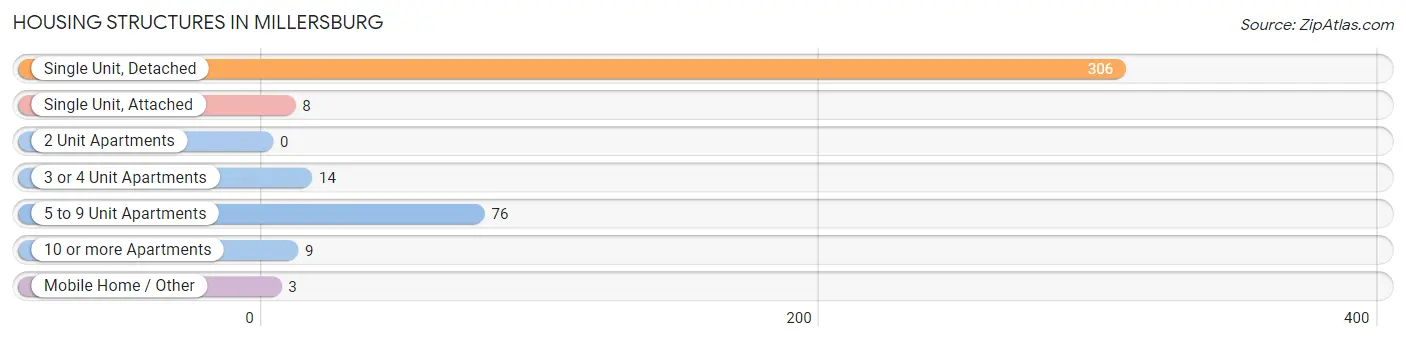
Housing Structures in Millersburg
| Structure Type | # Housing Units | % Housing Units |
| Single Unit, Detached | 306 | 73.6% |
| Single Unit, Attached | 8 | 1.9% |
| 2 Unit Apartments | 0 | 0.0% |
| 3 or 4 Unit Apartments | 14 | 3.4% |
| 5 to 9 Unit Apartments | 76 | 18.3% |
| 10 or more Apartments | 9 | 2.2% |
| Mobile Home / Other | 3 | 0.7% |
| Total | 416 | 100.0% |
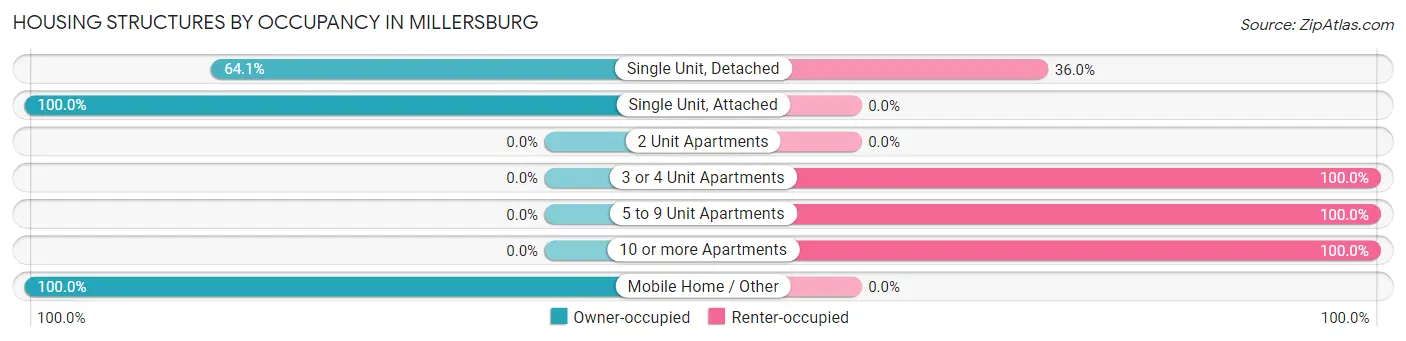
Housing Structures by Occupancy in Millersburg
| Structure Type | Owner-occupied | Renter-occupied |
| Single Unit, Detached | 196 (64.0%) | 110 (35.9%) |
| Single Unit, Attached | 8 (100.0%) | 0 (0.0%) |
| 2 Unit Apartments | 0 (0.0%) | 0 (0.0%) |
| 3 or 4 Unit Apartments | 0 (0.0%) | 14 (100.0%) |
| 5 to 9 Unit Apartments | 0 (0.0%) | 76 (100.0%) |
| 10 or more Apartments | 0 (0.0%) | 9 (100.0%) |
| Mobile Home / Other | 3 (100.0%) | 0 (0.0%) |
| Total | 207 (49.8%) | 209 (50.2%) |
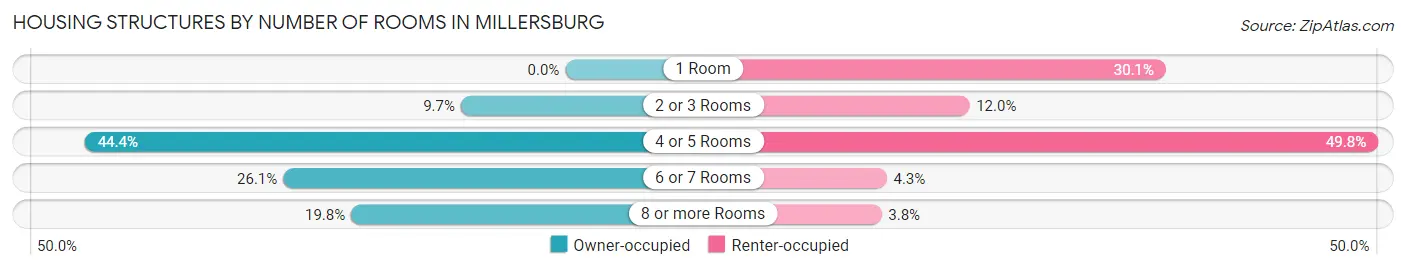
Housing Structures by Number of Rooms in Millersburg
| Number of Rooms | Owner-occupied | Renter-occupied |
| 1 Room | 0 (0.0%) | 63 (30.1%) |
| 2 or 3 Rooms | 20 (9.7%) | 25 (12.0%) |
| 4 or 5 Rooms | 92 (44.4%) | 104 (49.8%) |
| 6 or 7 Rooms | 54 (26.1%) | 9 (4.3%) |
| 8 or more Rooms | 41 (19.8%) | 8 (3.8%) |
| Total | 207 (100.0%) | 209 (100.0%) |
Housing Structure by Heating Type in Millersburg
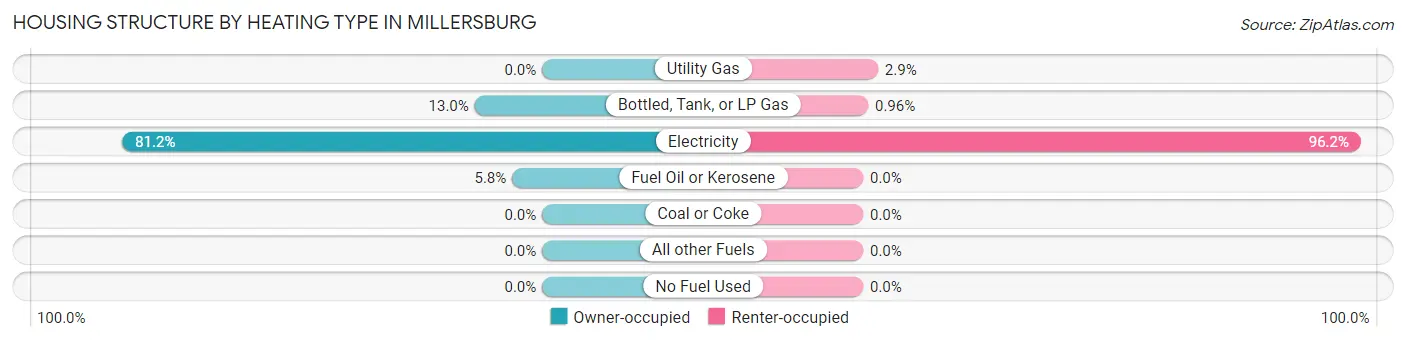
| Heating Type | Owner-occupied | Renter-occupied |
| Utility Gas | 0 (0.0%) | 6 (2.9%) |
| Bottled, Tank, or LP Gas | 27 (13.0%) | 2 (1.0%) |
| Electricity | 168 (81.2%) | 201 (96.2%) |
| Fuel Oil or Kerosene | 12 (5.8%) | 0 (0.0%) |
| Coal or Coke | 0 (0.0%) | 0 (0.0%) |
| All other Fuels | 0 (0.0%) | 0 (0.0%) |
| No Fuel Used | 0 (0.0%) | 0 (0.0%) |
| Total | 207 (100.0%) | 209 (100.0%) |
Household Vehicle Usage in Millersburg
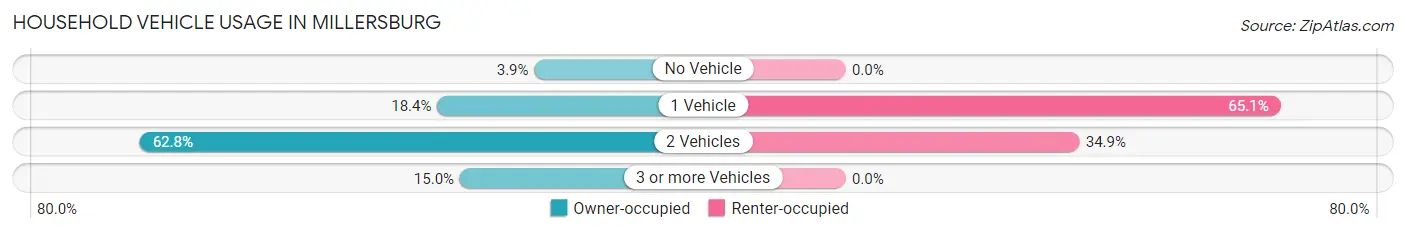
| Vehicles per Household | Owner-occupied | Renter-occupied |
| No Vehicle | 8 (3.9%) | 0 (0.0%) |
| 1 Vehicle | 38 (18.4%) | 136 (65.1%) |
| 2 Vehicles | 130 (62.8%) | 73 (34.9%) |
| 3 or more Vehicles | 31 (15.0%) | 0 (0.0%) |
| Total | 207 (100.0%) | 209 (100.0%) |
Real Estate & Mortgages in Millersburg
Real Estate and Mortgage Overview in Millersburg
| Characteristic | Without Mortgage | With Mortgage |
| Housing Units | 84 | 123 |
| Median Property Value | $108,900 | $136,000 |
| Median Household Income | $39,318 | $2 |
| Monthly Housing Costs | $371 | $1 |
| Real Estate Taxes | $900 | $4 |
Property Value by Mortgage Status in Millersburg
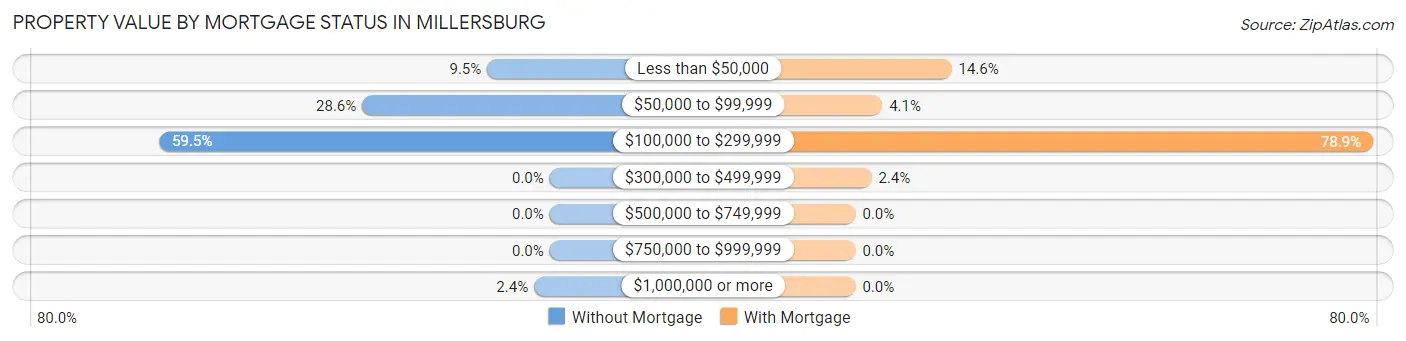
| Property Value | Without Mortgage | With Mortgage |
| Less than $50,000 | 8 (9.5%) | 18 (14.6%) |
| $50,000 to $99,999 | 24 (28.6%) | 5 (4.1%) |
| $100,000 to $299,999 | 50 (59.5%) | 97 (78.9%) |
| $300,000 to $499,999 | 0 (0.0%) | 3 (2.4%) |
| $500,000 to $749,999 | 0 (0.0%) | 0 (0.0%) |
| $750,000 to $999,999 | 0 (0.0%) | 0 (0.0%) |
| $1,000,000 or more | 2 (2.4%) | 0 (0.0%) |
| Total | 84 (100.0%) | 123 (100.0%) |
Household Income by Mortgage Status in Millersburg
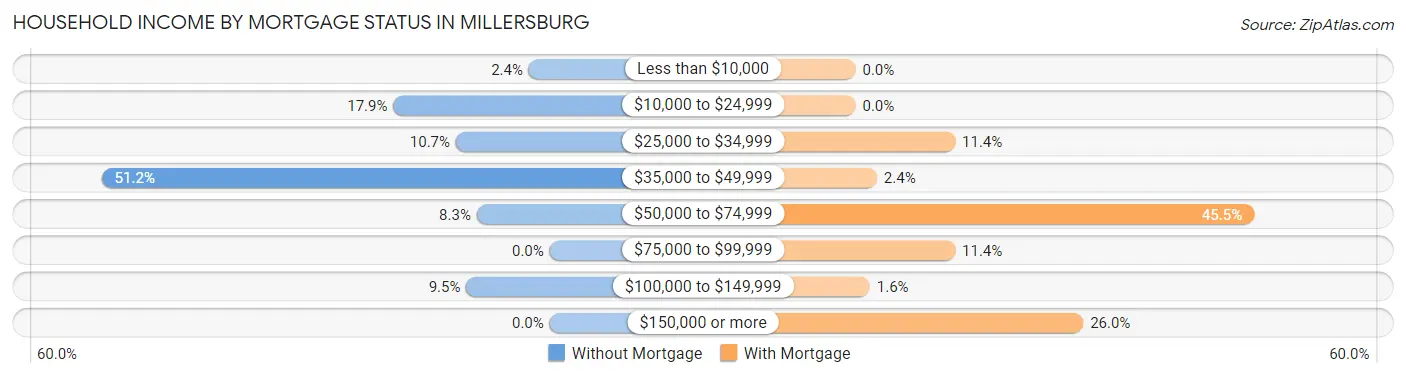
| Household Income | Without Mortgage | With Mortgage |
| Less than $10,000 | 2 (2.4%) | 0 (0.0%) |
| $10,000 to $24,999 | 15 (17.9%) | 0 (0.0%) |
| $25,000 to $34,999 | 9 (10.7%) | 14 (11.4%) |
| $35,000 to $49,999 | 43 (51.2%) | 3 (2.4%) |
| $50,000 to $74,999 | 7 (8.3%) | 56 (45.5%) |
| $75,000 to $99,999 | 0 (0.0%) | 14 (11.4%) |
| $100,000 to $149,999 | 8 (9.5%) | 2 (1.6%) |
| $150,000 or more | 0 (0.0%) | 32 (26.0%) |
| Total | 84 (100.0%) | 123 (100.0%) |
Property Value to Household Income Ratio in Millersburg
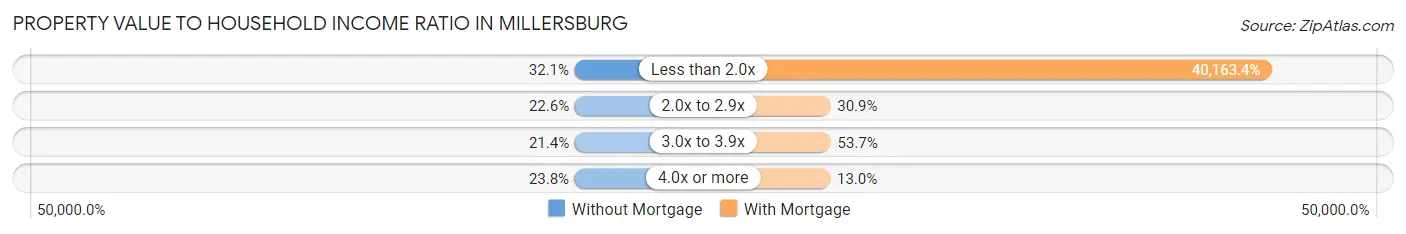
| Value-to-Income Ratio | Without Mortgage | With Mortgage |
| Less than 2.0x | 27 (32.1%) | 49,401 (40,163.4%) |
| 2.0x to 2.9x | 19 (22.6%) | 38 (30.9%) |
| 3.0x to 3.9x | 18 (21.4%) | 66 (53.7%) |
| 4.0x or more | 20 (23.8%) | 16 (13.0%) |
| Total | 84 (100.0%) | 123 (100.0%) |
Real Estate Taxes by Mortgage Status in Millersburg
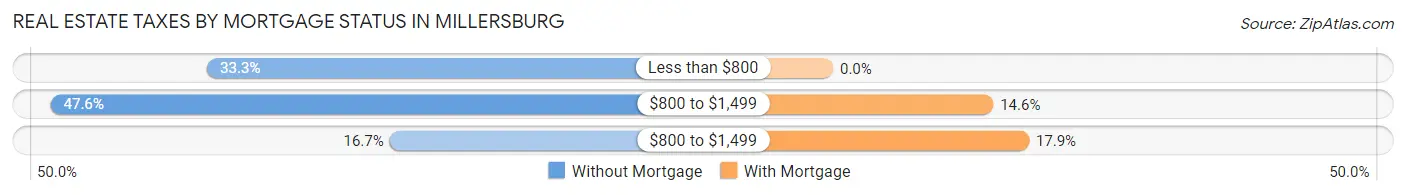
| Property Taxes | Without Mortgage | With Mortgage |
| Less than $800 | 28 (33.3%) | 0 (0.0%) |
| $800 to $1,499 | 40 (47.6%) | 18 (14.6%) |
| $800 to $1,499 | 14 (16.7%) | 22 (17.9%) |
| Total | 84 (100.0%) | 123 (100.0%) |
Health & Disability in Millersburg
Health Insurance Coverage by Age in Millersburg
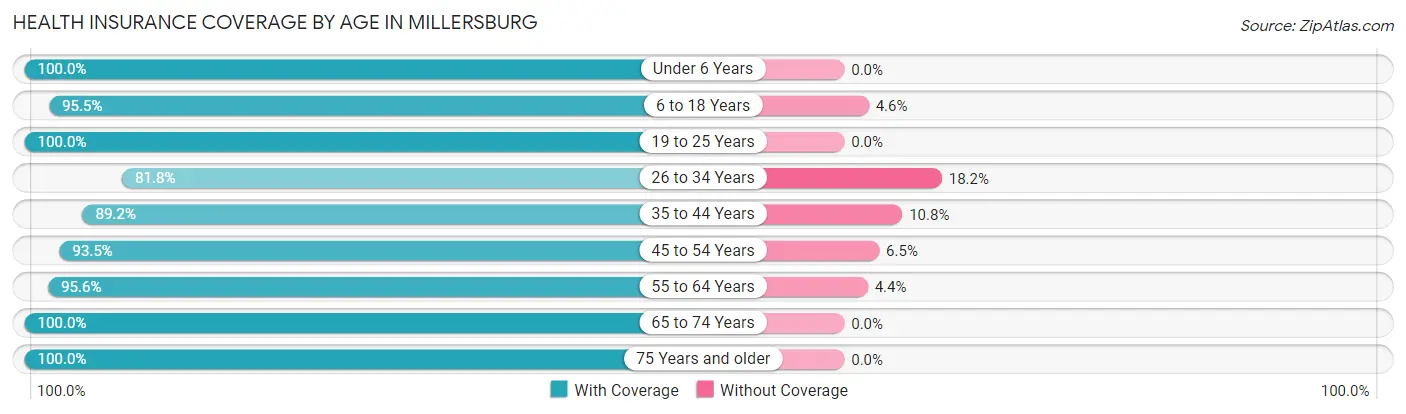
| Age Bracket | With Coverage | Without Coverage |
| Under 6 Years | 13 (100.0%) | 0 (0.0%) |
| 6 to 18 Years | 147 (95.5%) | 7 (4.5%) |
| 19 to 25 Years | 80 (100.0%) | 0 (0.0%) |
| 26 to 34 Years | 27 (81.8%) | 6 (18.2%) |
| 35 to 44 Years | 33 (89.2%) | 4 (10.8%) |
| 45 to 54 Years | 115 (93.5%) | 8 (6.5%) |
| 55 to 64 Years | 219 (95.6%) | 10 (4.4%) |
| 65 to 74 Years | 75 (100.0%) | 0 (0.0%) |
| 75 Years and older | 64 (100.0%) | 0 (0.0%) |
| Total | 773 (95.7%) | 35 (4.3%) |
Health Insurance Coverage by Citizenship Status in Millersburg
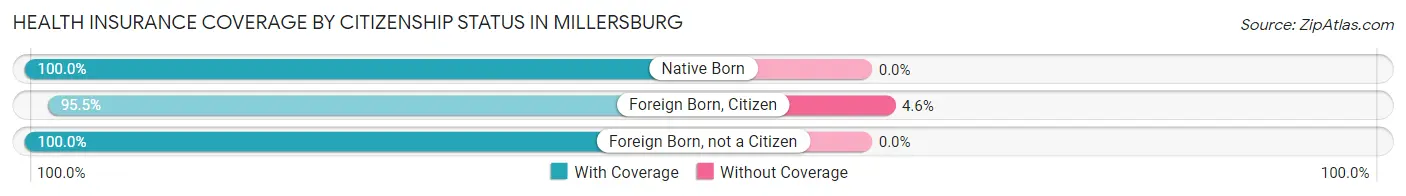
| Citizenship Status | With Coverage | Without Coverage |
| Native Born | 13 (100.0%) | 0 (0.0%) |
| Foreign Born, Citizen | 147 (95.5%) | 7 (4.5%) |
| Foreign Born, not a Citizen | 80 (100.0%) | 0 (0.0%) |
Health Insurance Coverage by Household Income in Millersburg
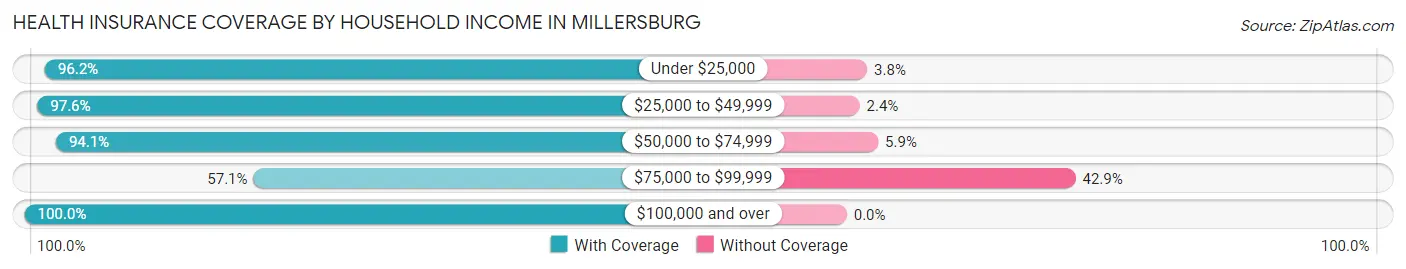
| Household Income | With Coverage | Without Coverage |
| Under $25,000 | 202 (96.2%) | 8 (3.8%) |
| $25,000 to $49,999 | 325 (97.6%) | 8 (2.4%) |
| $50,000 to $74,999 | 64 (94.1%) | 4 (5.9%) |
| $75,000 to $99,999 | 20 (57.1%) | 15 (42.9%) |
| $100,000 and over | 152 (100.0%) | 0 (0.0%) |
Public vs Private Health Insurance Coverage by Age in Millersburg
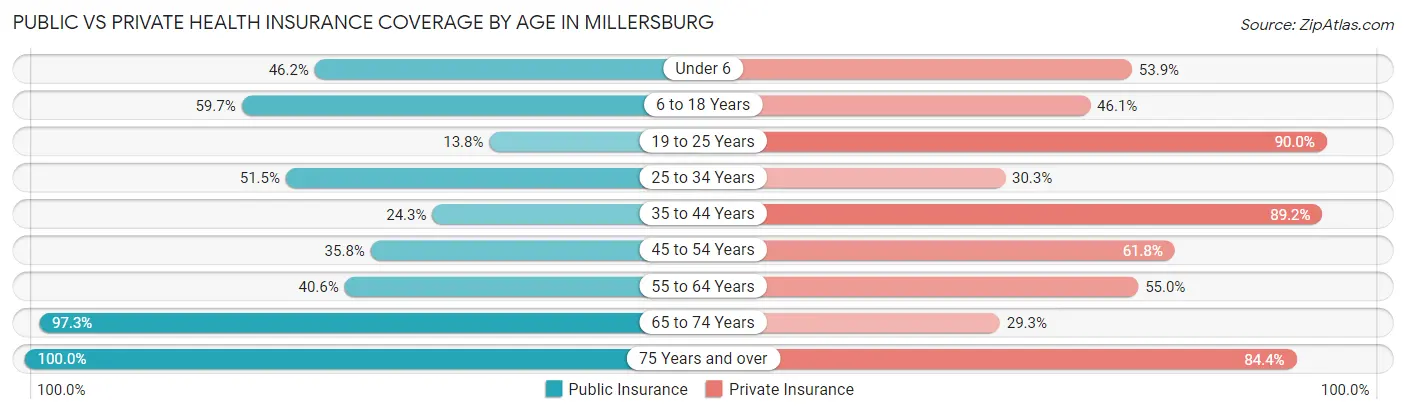
| Age Bracket | Public Insurance | Private Insurance |
| Under 6 | 6 (46.2%) | 7 (53.8%) |
| 6 to 18 Years | 92 (59.7%) | 71 (46.1%) |
| 19 to 25 Years | 11 (13.8%) | 72 (90.0%) |
| 25 to 34 Years | 17 (51.5%) | 10 (30.3%) |
| 35 to 44 Years | 9 (24.3%) | 33 (89.2%) |
| 45 to 54 Years | 44 (35.8%) | 76 (61.8%) |
| 55 to 64 Years | 93 (40.6%) | 126 (55.0%) |
| 65 to 74 Years | 73 (97.3%) | 22 (29.3%) |
| 75 Years and over | 64 (100.0%) | 54 (84.4%) |
| Total | 409 (50.6%) | 471 (58.3%) |
Disability Status by Sex by Age in Millersburg
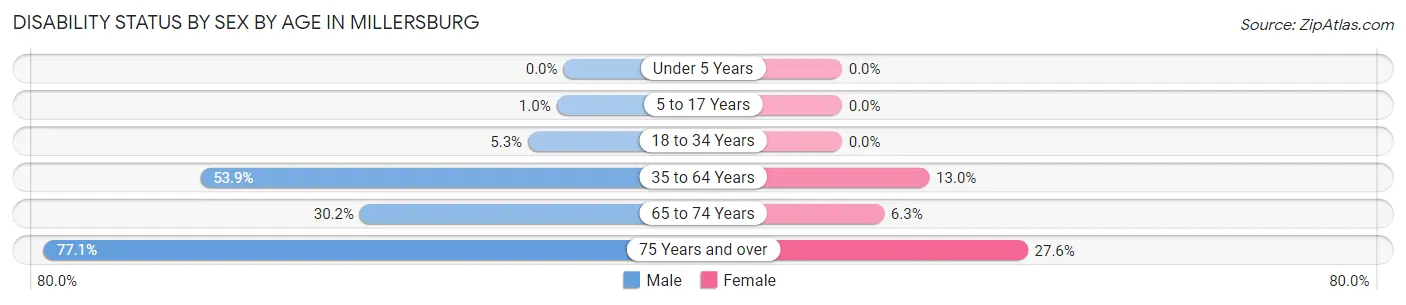
| Age Bracket | Male | Female |
| Under 5 Years | 0 (0.0%) | 0 (0.0%) |
| 5 to 17 Years | 1 (1.0%) | 0 (0.0%) |
| 18 to 34 Years | 3 (5.3%) | 0 (0.0%) |
| 35 to 64 Years | 110 (53.9%) | 24 (13.0%) |
| 65 to 74 Years | 13 (30.2%) | 2 (6.2%) |
| 75 Years and over | 27 (77.1%) | 8 (27.6%) |
Disability Class by Sex by Age in Millersburg
Disability Class: Hearing Difficulty
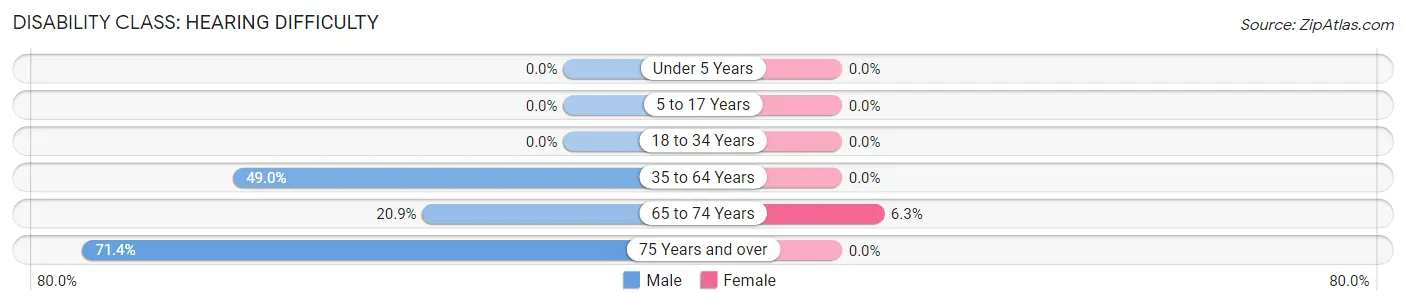
| Age Bracket | Male | Female |
| Under 5 Years | 0 (0.0%) | 0 (0.0%) |
| 5 to 17 Years | 0 (0.0%) | 0 (0.0%) |
| 18 to 34 Years | 0 (0.0%) | 0 (0.0%) |
| 35 to 64 Years | 100 (49.0%) | 0 (0.0%) |
| 65 to 74 Years | 9 (20.9%) | 2 (6.2%) |
| 75 Years and over | 25 (71.4%) | 0 (0.0%) |
Disability Class: Vision Difficulty
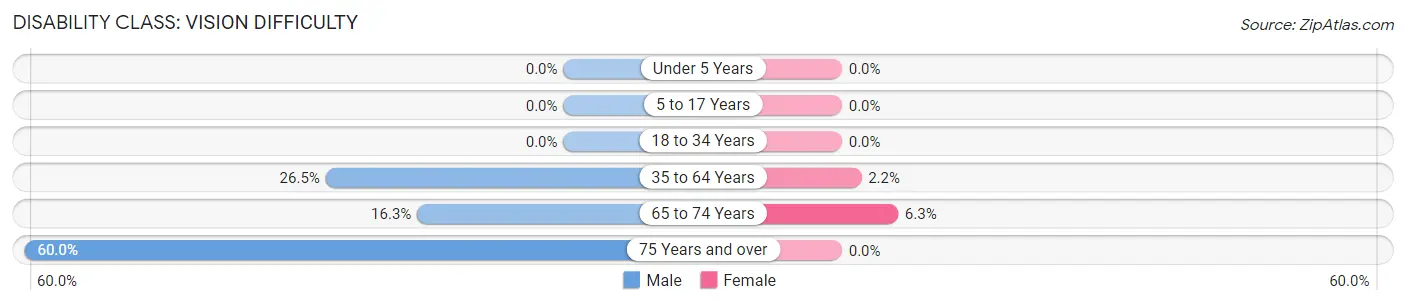
| Age Bracket | Male | Female |
| Under 5 Years | 0 (0.0%) | 0 (0.0%) |
| 5 to 17 Years | 0 (0.0%) | 0 (0.0%) |
| 18 to 34 Years | 0 (0.0%) | 0 (0.0%) |
| 35 to 64 Years | 54 (26.5%) | 4 (2.2%) |
| 65 to 74 Years | 7 (16.3%) | 2 (6.2%) |
| 75 Years and over | 21 (60.0%) | 0 (0.0%) |
Disability Class: Cognitive Difficulty
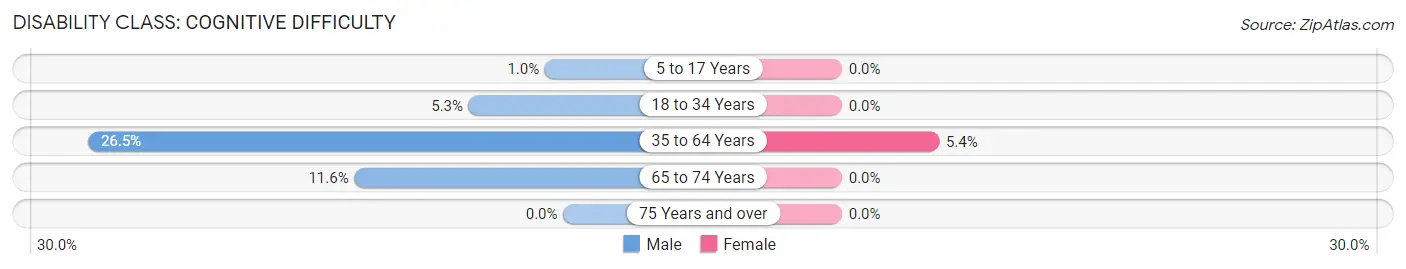
| Age Bracket | Male | Female |
| 5 to 17 Years | 1 (1.0%) | 0 (0.0%) |
| 18 to 34 Years | 3 (5.3%) | 0 (0.0%) |
| 35 to 64 Years | 54 (26.5%) | 10 (5.4%) |
| 65 to 74 Years | 5 (11.6%) | 0 (0.0%) |
| 75 Years and over | 0 (0.0%) | 0 (0.0%) |
Disability Class: Ambulatory Difficulty
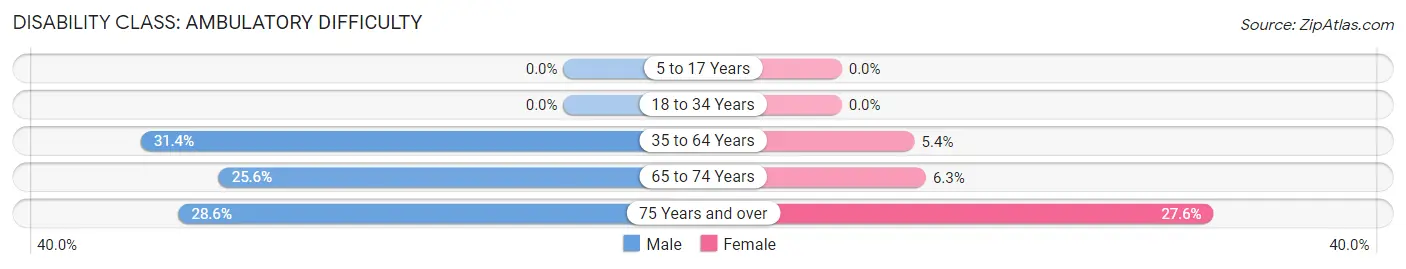
| Age Bracket | Male | Female |
| 5 to 17 Years | 0 (0.0%) | 0 (0.0%) |
| 18 to 34 Years | 0 (0.0%) | 0 (0.0%) |
| 35 to 64 Years | 64 (31.4%) | 10 (5.4%) |
| 65 to 74 Years | 11 (25.6%) | 2 (6.2%) |
| 75 Years and over | 10 (28.6%) | 8 (27.6%) |
Disability Class: Self-Care Difficulty
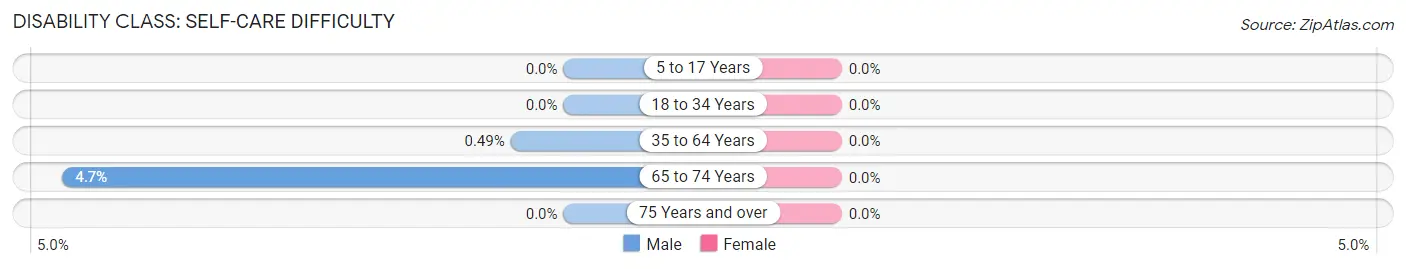
| Age Bracket | Male | Female |
| 5 to 17 Years | 0 (0.0%) | 0 (0.0%) |
| 18 to 34 Years | 0 (0.0%) | 0 (0.0%) |
| 35 to 64 Years | 1 (0.5%) | 0 (0.0%) |
| 65 to 74 Years | 2 (4.6%) | 0 (0.0%) |
| 75 Years and over | 0 (0.0%) | 0 (0.0%) |
Technology Access in Millersburg
Computing Device Access in Millersburg
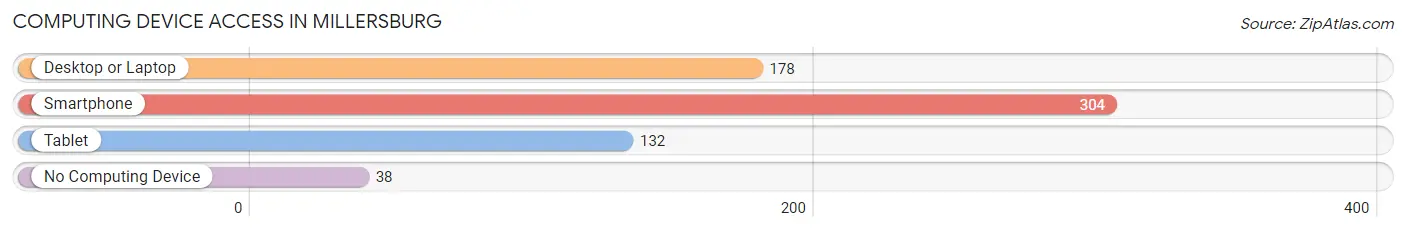
| Device Type | # Households | % Households |
| Desktop or Laptop | 178 | 42.8% |
| Smartphone | 304 | 73.1% |
| Tablet | 132 | 31.7% |
| No Computing Device | 38 | 9.1% |
| Total | 416 | 100.0% |
Internet Access in Millersburg
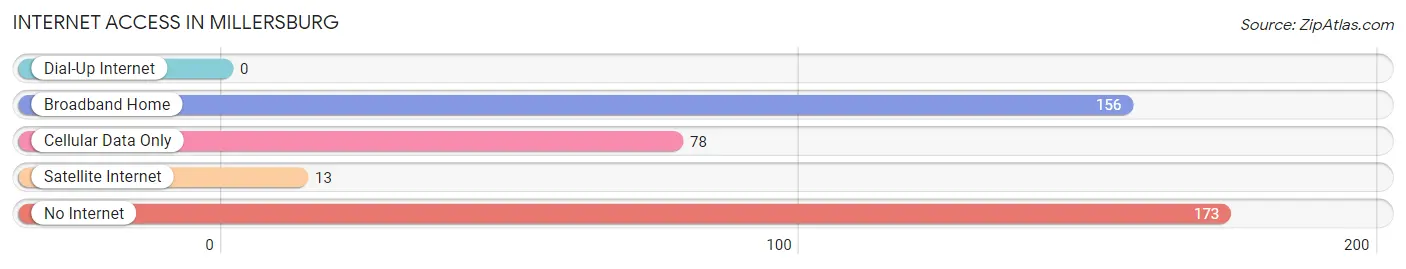
| Internet Type | # Households | % Households |
| Dial-Up Internet | 0 | 0.0% |
| Broadband Home | 156 | 37.5% |
| Cellular Data Only | 78 | 18.8% |
| Satellite Internet | 13 | 3.1% |
| No Internet | 173 | 41.6% |
| Total | 416 | 100.0% |
Millersburg Summary
Millerburg is a small town located in Bourbon County, Kentucky. It is situated on the banks of the Licking River, and is the county seat of Bourbon County. The town was founded in 1820 and was named after the Miller family, who were early settlers in the area. The population of Millerburg was 1,845 at the 2010 census.
Geography
Millerburg is located at 38°14'25" North, 84°17'45" West (38.240278, -84.295833). It is situated on the banks of the Licking River, and is the county seat of Bourbon County. The town is located in the Bluegrass region of Kentucky, and is surrounded by rolling hills and farmland. The climate is humid subtropical, with hot summers and cold winters.
Economy
Millerburg's economy is largely based on agriculture and tourism. The town is home to several small businesses, including a grocery store, a hardware store, and a few restaurants. The town also has a few small manufacturing companies, such as a furniture factory and a woodworking shop. The town is also home to a few wineries, which attract tourists from all over the state.
Demographics
As of the 2010 census, Millerburg had a population of 1,845. The racial makeup of the town was 97.2% White, 0.9% African American, 0.2% Native American, 0.2% Asian, 0.1% Pacific Islander, 0.3% from other races, and 0.9% from two or more races. Hispanic or Latino of any race were 1.2% of the population.
The median income for a household in Millerburg was $37,917, and the median income for a family was $45,625. Males had a median income of $31,250 versus $22,500 for females. The per capita income for the town was $17,945. About 8.2% of families and 10.2% of the population were below the poverty line, including 14.2% of those under age 18 and 8.3% of those age 65 or over.
History
Millerburg was founded in 1820 and was named after the Miller family, who were early settlers in the area. The town was originally a trading post and was the site of a ferry crossing over the Licking River. The town was incorporated in 1837 and was made the county seat of Bourbon County in 1838.
In the late 19th century, Millerburg was a thriving agricultural center, with several mills and factories located in the town. The town was also home to a number of distilleries, which produced bourbon whiskey. The town was also home to a number of churches, including the Millerburg Methodist Church, which was founded in 1845.
In the early 20th century, Millerburg was a popular tourist destination, with several hotels and resorts located in the town. The town was also home to a number of theaters, including the Millerburg Opera House, which opened in 1910. The town was also home to a number of schools, including the Millerburg Academy, which was founded in 1845.
In the late 20th century, Millerburg began to decline, as many of the town's businesses and industries closed. The town has since become a quiet, rural community, with a focus on agriculture and tourism. The town is home to several historic sites, including the Millerburg Historic District, which is listed on the National Register of Historic Places.
Common Questions
What is Per Capita Income in Millersburg?
Per Capita income in Millersburg is $22,950.
What is the Median Family Income in Millersburg?
Median Family Income in Millersburg is $48,615.
What is the Median Household income in Millersburg?
Median Household Income in Millersburg is $40,769.
What is Inequality or Gini Index in Millersburg?
Inequality or Gini Index in Millersburg is 0.39.
What is the Total Population of Millersburg?
Total Population of Millersburg is 808.
What is the Total Male Population of Millersburg?
Total Male Population of Millersburg is 439.
What is the Total Female Population of Millersburg?
Total Female Population of Millersburg is 369.
What is the Ratio of Males per 100 Females in Millersburg?
There are 118.97 Males per 100 Females in Millersburg.
What is the Ratio of Females per 100 Males in Millersburg?
There are 84.05 Females per 100 Males in Millersburg.
What is the Median Population Age in Millersburg?
Median Population Age in Millersburg is 54.4 Years.
What is the Average Family Size in Millersburg
Average Family Size in Millersburg is 2.3 People.
What is the Average Household Size in Millersburg
Average Household Size in Millersburg is 1.9 People.
How Large is the Labor Force in Millersburg?
There are 390 People in the Labor Forcein in Millersburg.
What is the Percentage of People in the Labor Force in Millersburg?
56.3% of People are in the Labor Force in Millersburg.
What is the Unemployment Rate in Millersburg?
Unemployment Rate in Millersburg is 7.4%.