Buffalo, KY Map & Demographics
Buffalo Map
Buffalo Overview
$19,036
PER CAPITA INCOME
$29,286
AVG FAMILY INCOME
$29,291
AVG HOUSEHOLD INCOME
25.4%
WAGE / INCOME GAP [ % ]
74.6¢/ $1
WAGE / INCOME GAP [ $ ]
0.45
INEQUALITY / GINI INDEX
565
TOTAL POPULATION
316
MALE POPULATION
249
FEMALE POPULATION
126.91
MALES / 100 FEMALES
78.80
FEMALES / 100 MALES
34.4
MEDIAN AGE
2.4
AVG FAMILY SIZE
2.0
AVG HOUSEHOLD SIZE
195
LABOR FORCE [ PEOPLE ]
41.9%
PERCENT IN LABOR FORCE
Buffalo Zip Codes
Buffalo Area Codes
Income in Buffalo
Income Overview in Buffalo
Per Capita Income in Buffalo is $19,036, while median incomes of families and households are $29,286 and $29,291 respectively.
| Characteristic | Number | Measure |
| Per Capita Income | 565 | $19,036 |
| Median Family Income | 204 | $29,286 |
| Mean Family Income | 204 | $39,774 |
| Median Household Income | 286 | $29,291 |
| Mean Household Income | 286 | $37,284 |
| Income Deficit | 204 | $0 |
| Wage / Income Gap (%) | 565 | 25.35% |
| Wage / Income Gap ($) | 565 | 74.65¢ per $1 |
| Gini / Inequality Index | 565 | 0.45 |
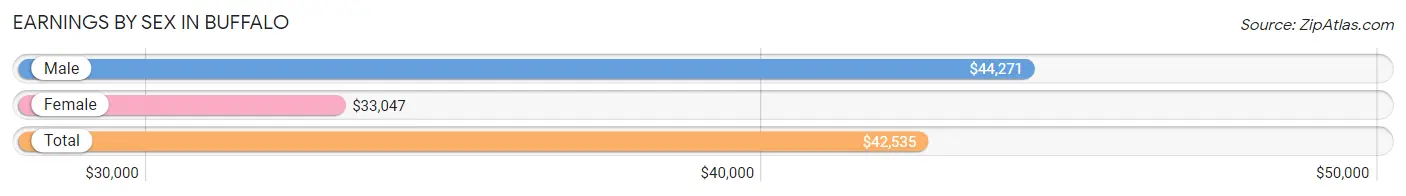
Earnings by Sex in Buffalo
Average Earnings in Buffalo are $42,535, $44,271 for men and $33,047 for women, a difference of 25.4%.
| Sex | Number | Average Earnings |
| Male | 139 (62.9%) | $44,271 |
| Female | 82 (37.1%) | $33,047 |
| Total | 221 (100.0%) | $42,535 |
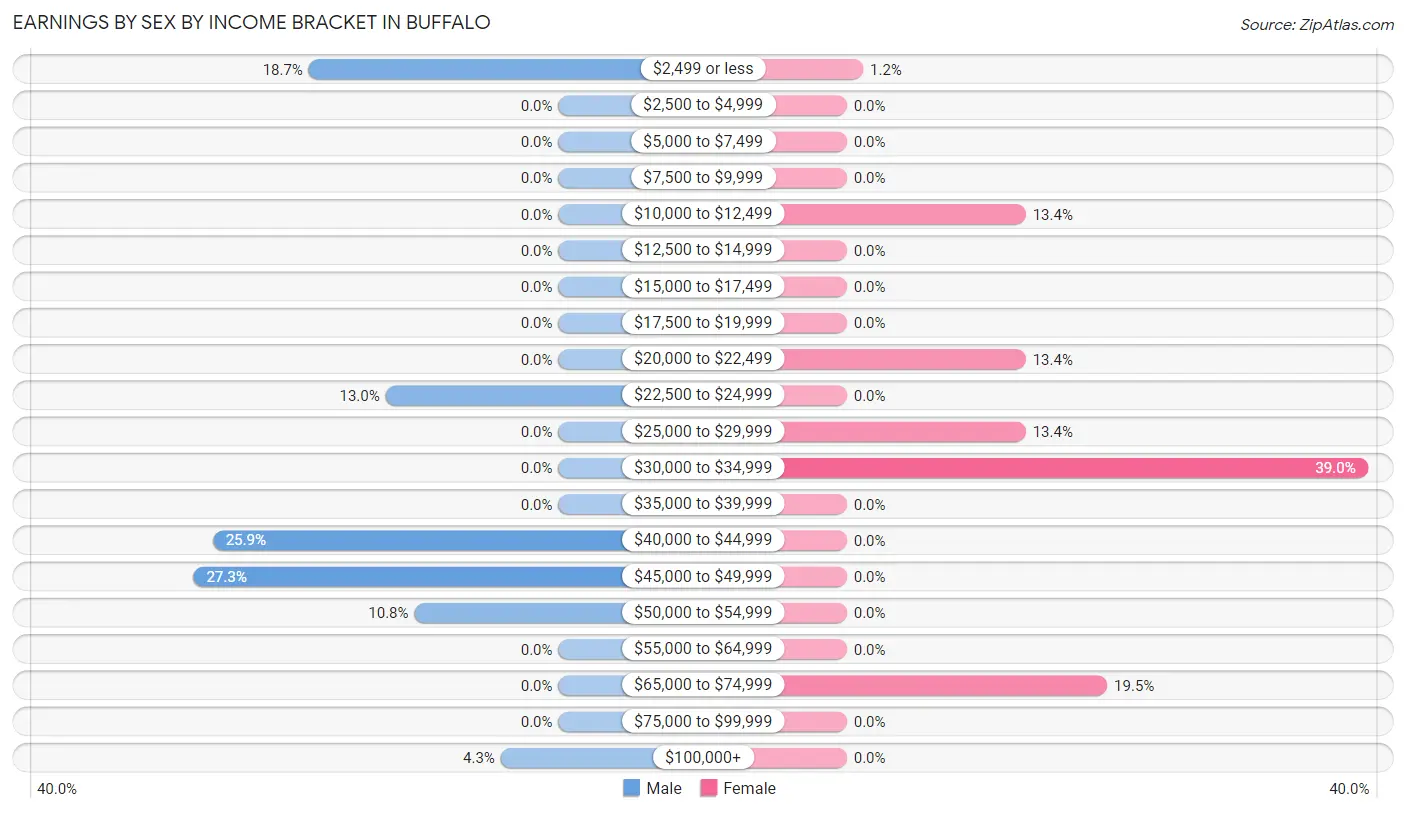
Earnings by Sex by Income Bracket in Buffalo
The most common earnings brackets in Buffalo are $45,000 to $49,999 for men (38 | 27.3%) and $30,000 to $34,999 for women (32 | 39.0%).
| Income | Male | Female |
| $2,499 or less | 26 (18.7%) | 1 (1.2%) |
| $2,500 to $4,999 | 0 (0.0%) | 0 (0.0%) |
| $5,000 to $7,499 | 0 (0.0%) | 0 (0.0%) |
| $7,500 to $9,999 | 0 (0.0%) | 0 (0.0%) |
| $10,000 to $12,499 | 0 (0.0%) | 11 (13.4%) |
| $12,500 to $14,999 | 0 (0.0%) | 0 (0.0%) |
| $15,000 to $17,499 | 0 (0.0%) | 0 (0.0%) |
| $17,500 to $19,999 | 0 (0.0%) | 0 (0.0%) |
| $20,000 to $22,499 | 0 (0.0%) | 11 (13.4%) |
| $22,500 to $24,999 | 18 (13.0%) | 0 (0.0%) |
| $25,000 to $29,999 | 0 (0.0%) | 11 (13.4%) |
| $30,000 to $34,999 | 0 (0.0%) | 32 (39.0%) |
| $35,000 to $39,999 | 0 (0.0%) | 0 (0.0%) |
| $40,000 to $44,999 | 36 (25.9%) | 0 (0.0%) |
| $45,000 to $49,999 | 38 (27.3%) | 0 (0.0%) |
| $50,000 to $54,999 | 15 (10.8%) | 0 (0.0%) |
| $55,000 to $64,999 | 0 (0.0%) | 0 (0.0%) |
| $65,000 to $74,999 | 0 (0.0%) | 16 (19.5%) |
| $75,000 to $99,999 | 0 (0.0%) | 0 (0.0%) |
| $100,000+ | 6 (4.3%) | 0 (0.0%) |
| Total | 139 (100.0%) | 82 (100.0%) |
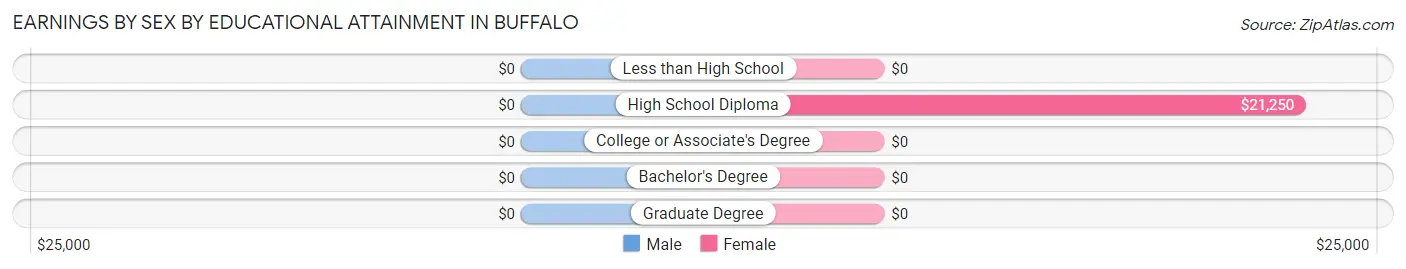
Earnings by Sex by Educational Attainment in Buffalo
| Educational Attainment | Male Income | Female Income |
| Less than High School | - | - |
| High School Diploma | - | - |
| College or Associate's Degree | - | - |
| Bachelor's Degree | - | - |
| Graduate Degree | - | - |
| Total | $2,499 | $33,086 |
Family Income in Buffalo
Family Income Brackets in Buffalo
According to the Buffalo family income data, there are 73 families falling into the $25,000 to $34,999 income range, which is the most common income bracket and makes up 35.8% of all families.
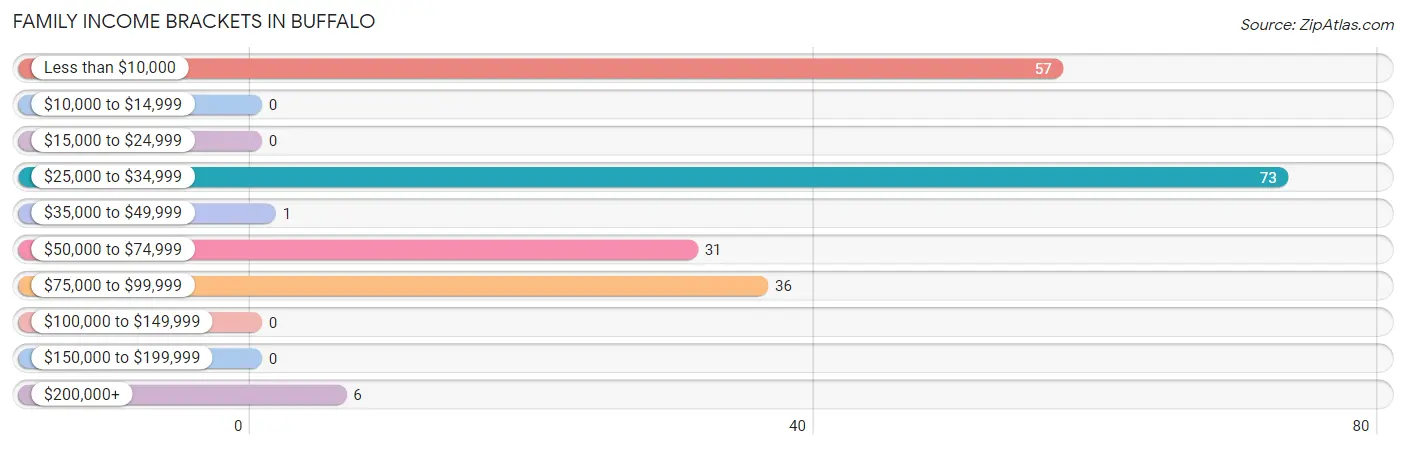
| Income Bracket | # Families | % Families |
| Less than $10,000 | 57 | 27.9% |
| $10,000 to $14,999 | 0 | 0.0% |
| $15,000 to $24,999 | 0 | 0.0% |
| $25,000 to $34,999 | 73 | 35.8% |
| $35,000 to $49,999 | 1 | 0.5% |
| $50,000 to $74,999 | 31 | 15.2% |
| $75,000 to $99,999 | 36 | 17.6% |
| $100,000 to $149,999 | 0 | 0.0% |
| $150,000 to $199,999 | 0 | 0.0% |
| $200,000+ | 6 | 2.9% |
Family Income by Famaliy Size in Buffalo
2-person families (110 | 53.9%) account for the highest median family income in Buffalo with $28,452 per family, while 2-person families (110 | 53.9%) have the highest median income of $14,226 per family member.
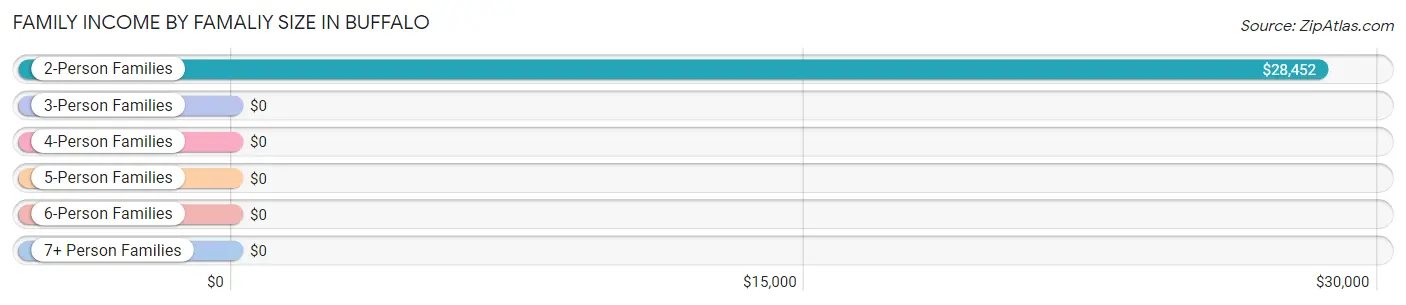
| Income Bracket | # Families | Median Income |
| 2-Person Families | 110 (53.9%) | $28,452 |
| 3-Person Families | 58 (28.4%) | $0 |
| 4-Person Families | 0 (0.0%) | $0 |
| 5-Person Families | 36 (17.6%) | $0 |
| 6-Person Families | 0 (0.0%) | $0 |
| 7+ Person Families | 0 (0.0%) | $0 |
| Total | 204 (100.0%) | $29,286 |
Family Income by Number of Earners in Buffalo
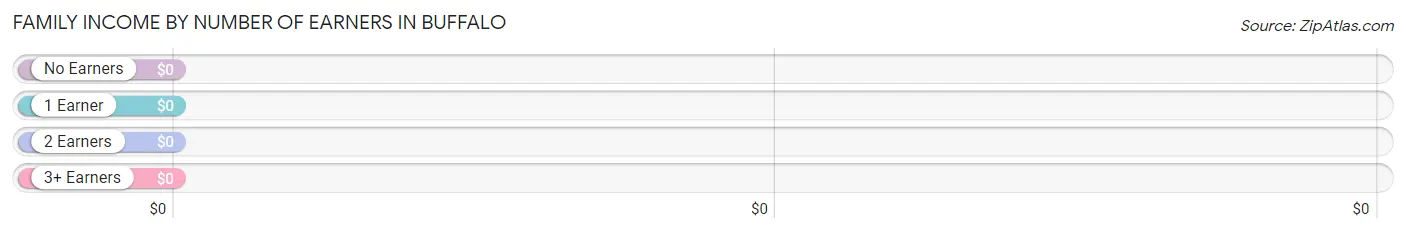
| Number of Earners | # Families | Median Income |
| No Earners | 94 (46.1%) | $0 |
| 1 Earner | 68 (33.3%) | $0 |
| 2 Earners | 42 (20.6%) | $0 |
| 3+ Earners | 0 (0.0%) | $0 |
| Total | 204 (100.0%) | $29,286 |
Household Income in Buffalo
Household Income Brackets in Buffalo
With 84 households falling in the category, the $25,000 to $34,999 income range is the most frequent in Buffalo, accounting for 29.4% of all households.
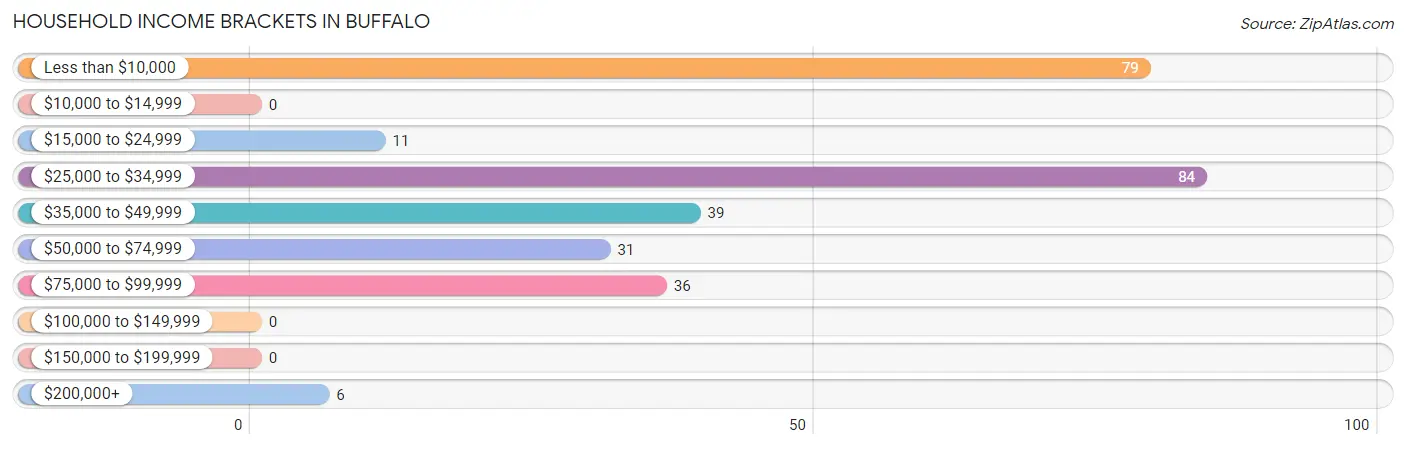
| Income Bracket | # Households | % Households |
| Less than $10,000 | 79 | 27.6% |
| $10,000 to $14,999 | 0 | 0.0% |
| $15,000 to $24,999 | 11 | 3.8% |
| $25,000 to $34,999 | 84 | 29.4% |
| $35,000 to $49,999 | 39 | 13.6% |
| $50,000 to $74,999 | 31 | 10.8% |
| $75,000 to $99,999 | 36 | 12.6% |
| $100,000 to $149,999 | 0 | 0.0% |
| $150,000 to $199,999 | 0 | 0.0% |
| $200,000+ | 6 | 2.1% |
Household Income by Householder Age in Buffalo
The median household income in Buffalo is $29,291, with the highest median household income of $28,810 found in the 65+ years age bracket for the primary householder. A total of 80 households (28.0%) fall into this category. Meanwhile, the 15 to 24 years age bracket for the primary householder has the lowest median household income of $0, with 74 households (25.9%) in this group.
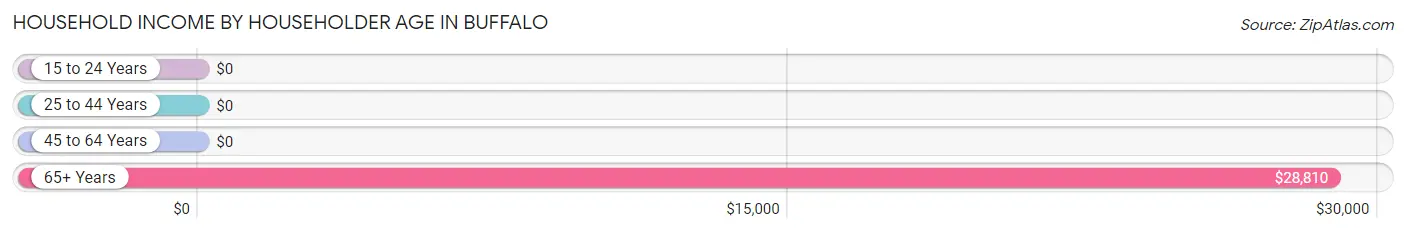
| Income Bracket | # Households | Median Income |
| 15 to 24 Years | 74 (25.9%) | $0 |
| 25 to 44 Years | 55 (19.2%) | $0 |
| 45 to 64 Years | 77 (26.9%) | $0 |
| 65+ Years | 80 (28.0%) | $28,810 |
| Total | 286 (100.0%) | $29,291 |
Poverty in Buffalo
Income Below Poverty by Sex and Age in Buffalo
With 29.7% poverty level for males and 22.5% for females among the residents of Buffalo, under 5 year old males and 55 to 64 year old females are the most vulnerable to poverty, with 9 males (100.0%) and 32 females (59.3%) in their respective age groups living below the poverty level.
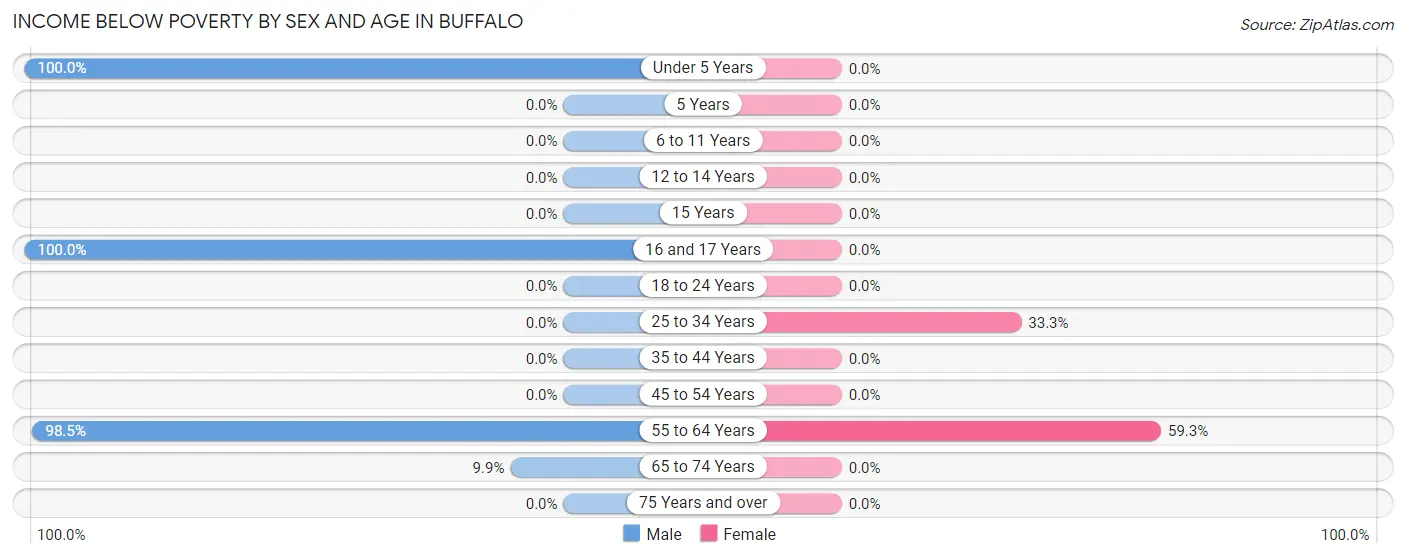
| Age Bracket | Male | Female |
| Under 5 Years | 9 (100.0%) | 0 (0.0%) |
| 5 Years | 0 (0.0%) | 0 (0.0%) |
| 6 to 11 Years | 0 (0.0%) | 0 (0.0%) |
| 12 to 14 Years | 0 (0.0%) | 0 (0.0%) |
| 15 Years | 0 (0.0%) | 0 (0.0%) |
| 16 and 17 Years | 12 (100.0%) | 0 (0.0%) |
| 18 to 24 Years | 0 (0.0%) | 0 (0.0%) |
| 25 to 34 Years | 0 (0.0%) | 24 (33.3%) |
| 35 to 44 Years | 0 (0.0%) | 0 (0.0%) |
| 45 to 54 Years | 0 (0.0%) | 0 (0.0%) |
| 55 to 64 Years | 66 (98.5%) | 32 (59.3%) |
| 65 to 74 Years | 7 (9.9%) | 0 (0.0%) |
| 75 Years and over | 0 (0.0%) | 0 (0.0%) |
| Total | 94 (29.7%) | 56 (22.5%) |
Income Above Poverty by Sex and Age in Buffalo
According to the poverty statistics in Buffalo, males aged 6 to 11 years and females aged under 5 years are the age groups that are most secure financially, with 100.0% of males and 100.0% of females in these age groups living above the poverty line.
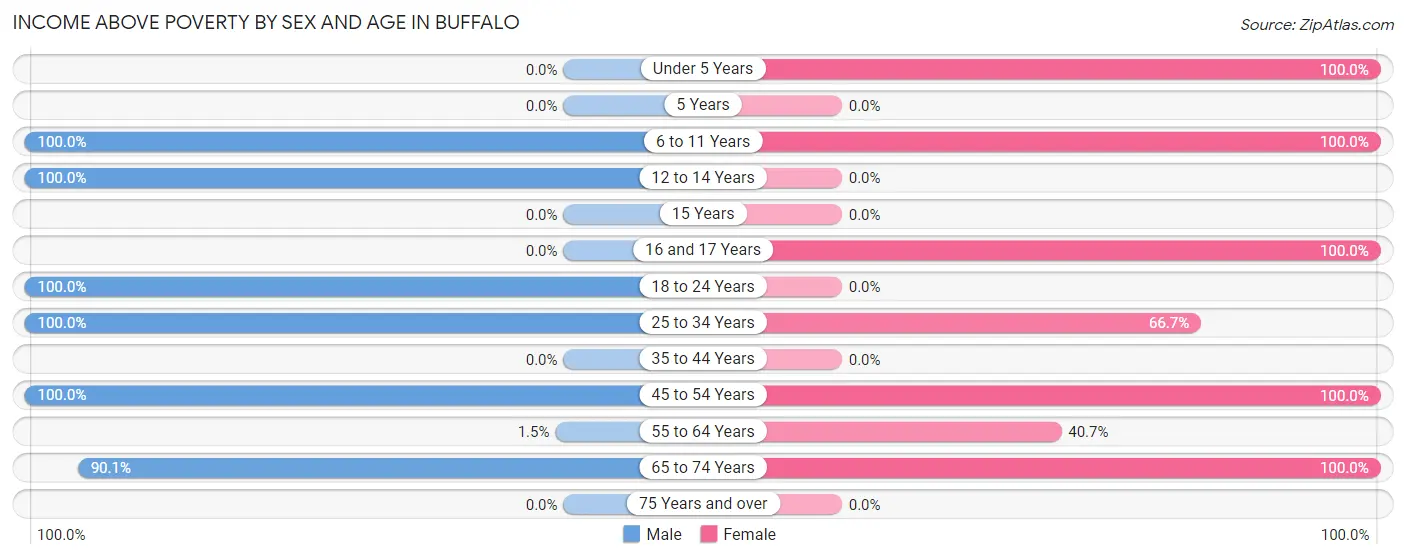
| Age Bracket | Male | Female |
| Under 5 Years | 0 (0.0%) | 11 (100.0%) |
| 5 Years | 0 (0.0%) | 0 (0.0%) |
| 6 to 11 Years | 28 (100.0%) | 36 (100.0%) |
| 12 to 14 Years | 16 (100.0%) | 0 (0.0%) |
| 15 Years | 0 (0.0%) | 0 (0.0%) |
| 16 and 17 Years | 0 (0.0%) | 1 (100.0%) |
| 18 to 24 Years | 92 (100.0%) | 0 (0.0%) |
| 25 to 34 Years | 15 (100.0%) | 48 (66.7%) |
| 35 to 44 Years | 0 (0.0%) | 0 (0.0%) |
| 45 to 54 Years | 6 (100.0%) | 11 (100.0%) |
| 55 to 64 Years | 1 (1.5%) | 22 (40.7%) |
| 65 to 74 Years | 64 (90.1%) | 64 (100.0%) |
| 75 Years and over | 0 (0.0%) | 0 (0.0%) |
| Total | 222 (70.3%) | 193 (77.5%) |
Income Below Poverty Among Married-Couple Families in Buffalo
The poverty statistics for married-couple families in Buffalo show that 6.0% or 7 of the total 116 families live below the poverty line. Families with no children have the highest poverty rate of 8.7%, comprising of 7 families. On the other hand, families with 3 or 4 children have the lowest poverty rate of 0.0%, which includes 0 families.
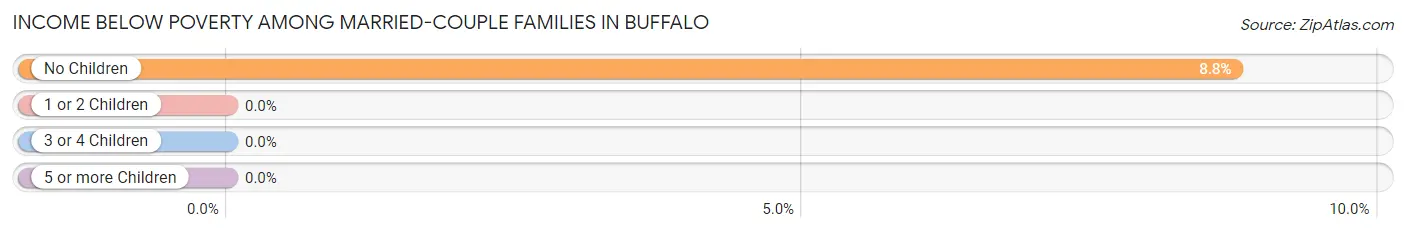
| Children | Above Poverty | Below Poverty |
| No Children | 73 (91.2%) | 7 (8.7%) |
| 1 or 2 Children | 0 (0.0%) | 0 (0.0%) |
| 3 or 4 Children | 36 (100.0%) | 0 (0.0%) |
| 5 or more Children | 0 (0.0%) | 0 (0.0%) |
| Total | 109 (94.0%) | 7 (6.0%) |
Income Below Poverty Among Single-Parent Households in Buffalo
According to the poverty data in Buffalo, 54.2% or 26 single-father households and 60.0% or 24 single-mother households are living below the poverty line. Among single-father households, those with 1 or 2 children have the highest poverty rate, with 26 households (61.9%) experiencing poverty. Likewise, among single-mother households, those with 1 or 2 children have the highest poverty rate, with 24 households (60.0%) falling below the poverty line.
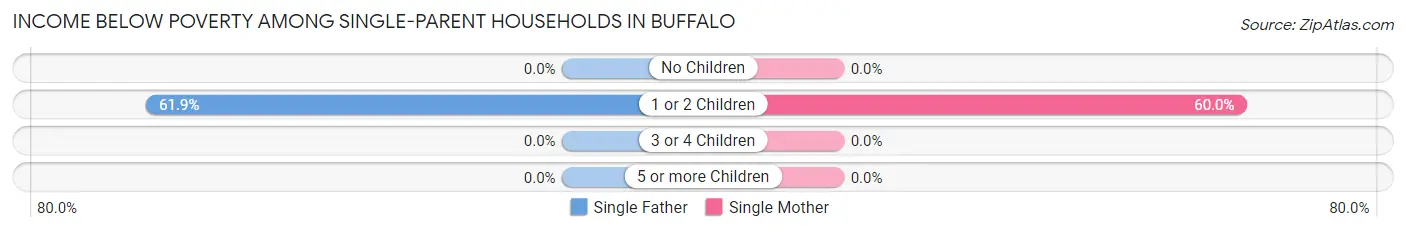
| Children | Single Father | Single Mother |
| No Children | 0 (0.0%) | 0 (0.0%) |
| 1 or 2 Children | 26 (61.9%) | 24 (60.0%) |
| 3 or 4 Children | 0 (0.0%) | 0 (0.0%) |
| 5 or more Children | 0 (0.0%) | 0 (0.0%) |
| Total | 26 (54.2%) | 24 (60.0%) |
Income Below Poverty Among Married-Couple vs Single-Parent Households in Buffalo
The poverty data for Buffalo shows that 7 of the married-couple family households (6.0%) and 50 of the single-parent households (56.8%) are living below the poverty level. Within the married-couple family households, those with no children have the highest poverty rate, with 7 households (8.7%) falling below the poverty line. Among the single-parent households, those with 1 or 2 children have the highest poverty rate, with 50 household (61.0%) living below poverty.
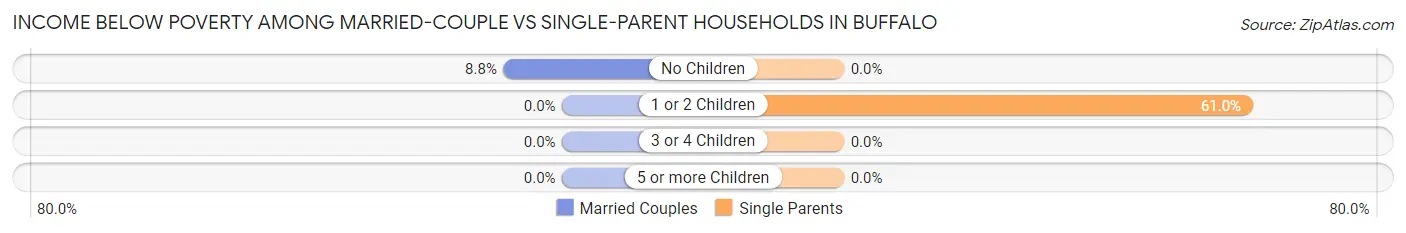
| Children | Married-Couple Families | Single-Parent Households |
| No Children | 7 (8.7%) | 0 (0.0%) |
| 1 or 2 Children | 0 (0.0%) | 50 (61.0%) |
| 3 or 4 Children | 0 (0.0%) | 0 (0.0%) |
| 5 or more Children | 0 (0.0%) | 0 (0.0%) |
| Total | 7 (6.0%) | 50 (56.8%) |
Race in Buffalo
The most populous races in Buffalo are White / Caucasian (469 | 83.0%), Two or more Races (51 | 9.0%), and Hispanic or Latino (46 | 8.1%).
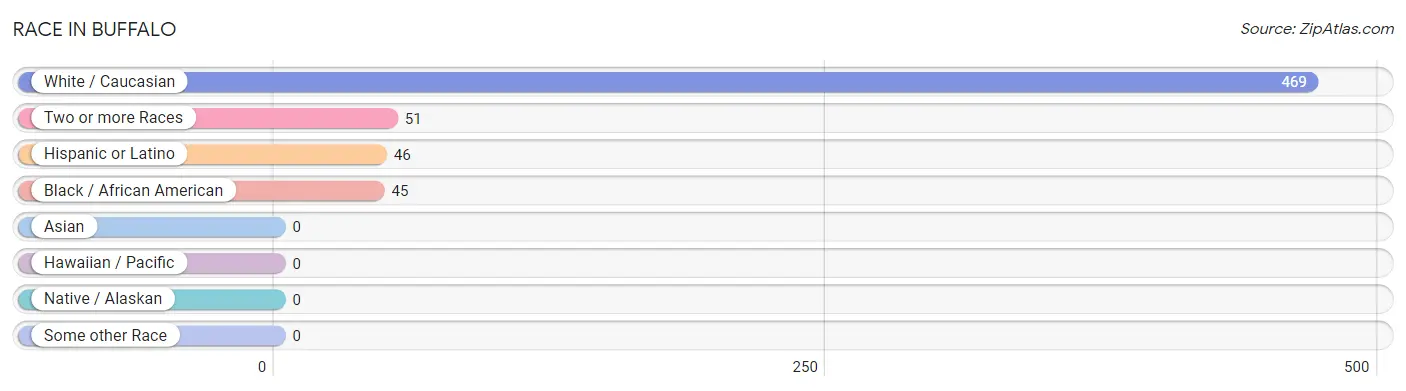
| Race | # Population | % Population |
| Asian | 0 | 0.0% |
| Black / African American | 45 | 8.0% |
| Hawaiian / Pacific | 0 | 0.0% |
| Hispanic or Latino | 46 | 8.1% |
| Native / Alaskan | 0 | 0.0% |
| White / Caucasian | 469 | 83.0% |
| Two or more Races | 51 | 9.0% |
| Some other Race | 0 | 0.0% |
| Total | 565 | 100.0% |
Ancestry in Buffalo
The most populous ancestries reported in Buffalo are Irish (78 | 13.8%), American (58 | 10.3%), Italian (38 | 6.7%), Central American (24 | 4.3%), and Guatemalan (24 | 4.3%), together accounting for 39.3% of all Buffalo residents.
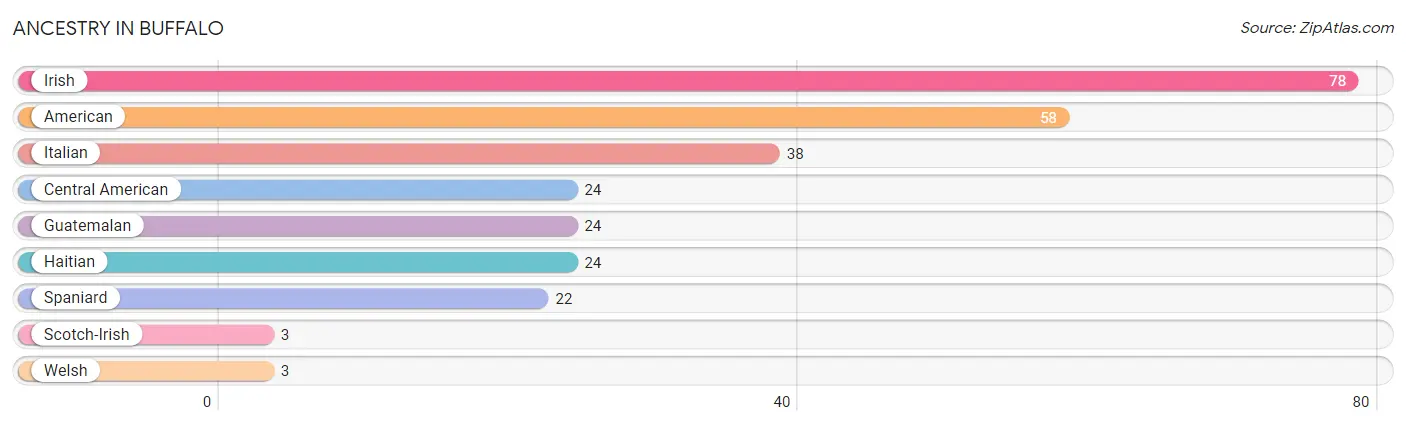
| Ancestry | # Population | % Population |
| American | 58 | 10.3% |
| Central American | 24 | 4.3% |
| Guatemalan | 24 | 4.3% |
| Haitian | 24 | 4.3% |
| Irish | 78 | 13.8% |
| Italian | 38 | 6.7% |
| Scotch-Irish | 3 | 0.5% |
| Spaniard | 22 | 3.9% |
| Welsh | 3 | 0.5% | View All 9 Rows |
Immigrants in Buffalo
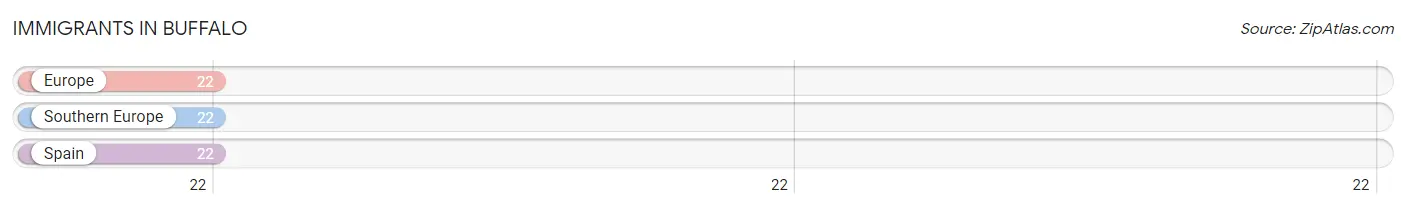
The most numerous immigrant groups reported in Buffalo came from Europe (22 | 3.9%), Southern Europe (22 | 3.9%), and Spain (22 | 3.9%), together accounting for 11.7% of all Buffalo residents.
| Immigration Origin | # Population | % Population |
| Europe | 22 | 3.9% |
| Southern Europe | 22 | 3.9% |
| Spain | 22 | 3.9% | View All 3 Rows |
Sex and Age in Buffalo
Sex and Age in Buffalo
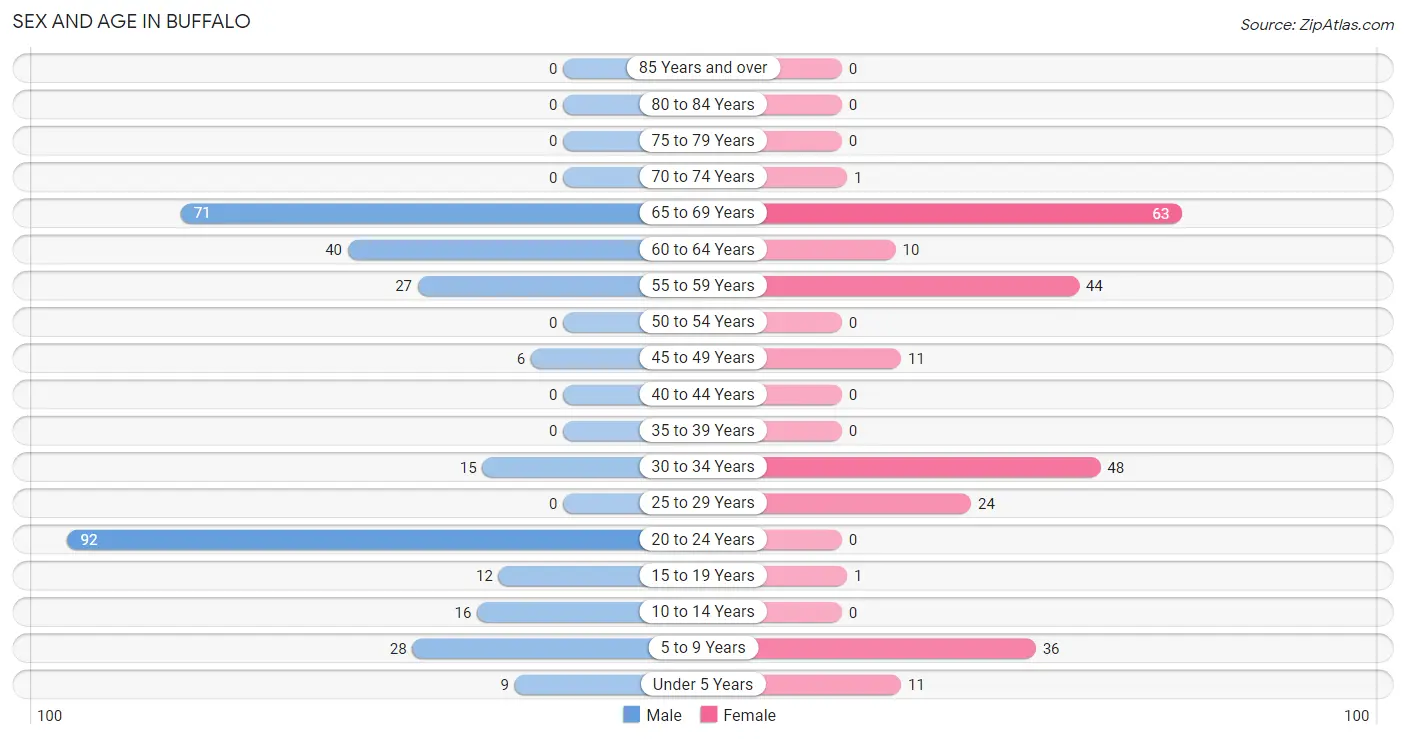
The most populous age groups in Buffalo are 20 to 24 Years (92 | 29.1%) for men and 65 to 69 Years (63 | 25.3%) for women.
| Age Bracket | Male | Female |
| Under 5 Years | 9 (2.9%) | 11 (4.4%) |
| 5 to 9 Years | 28 (8.9%) | 36 (14.5%) |
| 10 to 14 Years | 16 (5.1%) | 0 (0.0%) |
| 15 to 19 Years | 12 (3.8%) | 1 (0.4%) |
| 20 to 24 Years | 92 (29.1%) | 0 (0.0%) |
| 25 to 29 Years | 0 (0.0%) | 24 (9.6%) |
| 30 to 34 Years | 15 (4.8%) | 48 (19.3%) |
| 35 to 39 Years | 0 (0.0%) | 0 (0.0%) |
| 40 to 44 Years | 0 (0.0%) | 0 (0.0%) |
| 45 to 49 Years | 6 (1.9%) | 11 (4.4%) |
| 50 to 54 Years | 0 (0.0%) | 0 (0.0%) |
| 55 to 59 Years | 27 (8.5%) | 44 (17.7%) |
| 60 to 64 Years | 40 (12.7%) | 10 (4.0%) |
| 65 to 69 Years | 71 (22.5%) | 63 (25.3%) |
| 70 to 74 Years | 0 (0.0%) | 1 (0.4%) |
| 75 to 79 Years | 0 (0.0%) | 0 (0.0%) |
| 80 to 84 Years | 0 (0.0%) | 0 (0.0%) |
| 85 Years and over | 0 (0.0%) | 0 (0.0%) |
| Total | 316 (100.0%) | 249 (100.0%) |
Families and Households in Buffalo
Median Family Size in Buffalo
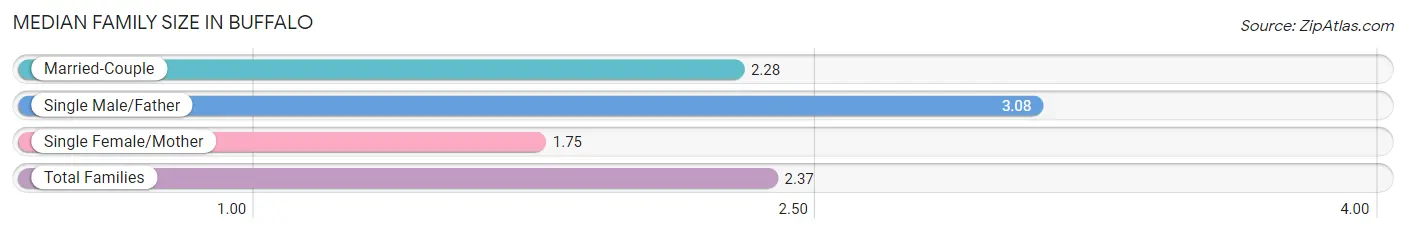
The median family size in Buffalo is 2.37 persons per family, with single male/father families (48 | 23.5%) accounting for the largest median family size of 3.08 persons per family. On the other hand, single female/mother families (40 | 19.6%) represent the smallest median family size with 1.75 persons per family.
| Family Type | # Families | Family Size |
| Married-Couple | 116 (56.9%) | 2.28 |
| Single Male/Father | 48 (23.5%) | 3.08 |
| Single Female/Mother | 40 (19.6%) | 1.75 |
| Total Families | 204 (100.0%) | 2.37 |
Median Household Size in Buffalo
| Household Type | # Households | Household Size |
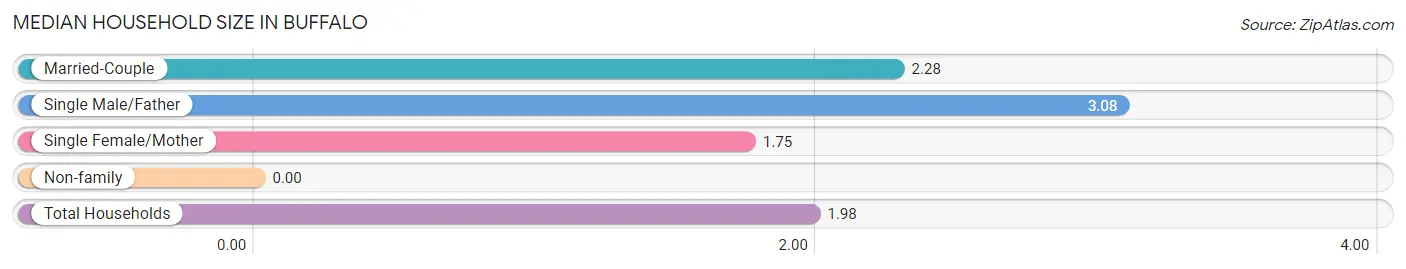
| Married-Couple | 116 (40.6%) | 2.28 |
| Single Male/Father | 48 (16.8%) | 3.08 |
| Single Female/Mother | 40 (14.0%) | 1.75 |
| Non-family | 82 (28.7%) | - |
| Total Households | 286 (100.0%) | 1.98 |
Household Size by Marriage Status in Buffalo
Out of a total of 286 households in Buffalo, 204 (71.3%) are family households, while 82 (28.7%) are nonfamily households. The most numerous type of family households are 2-person households, comprising 110, and the most common type of nonfamily households are 1-person households, comprising 82.
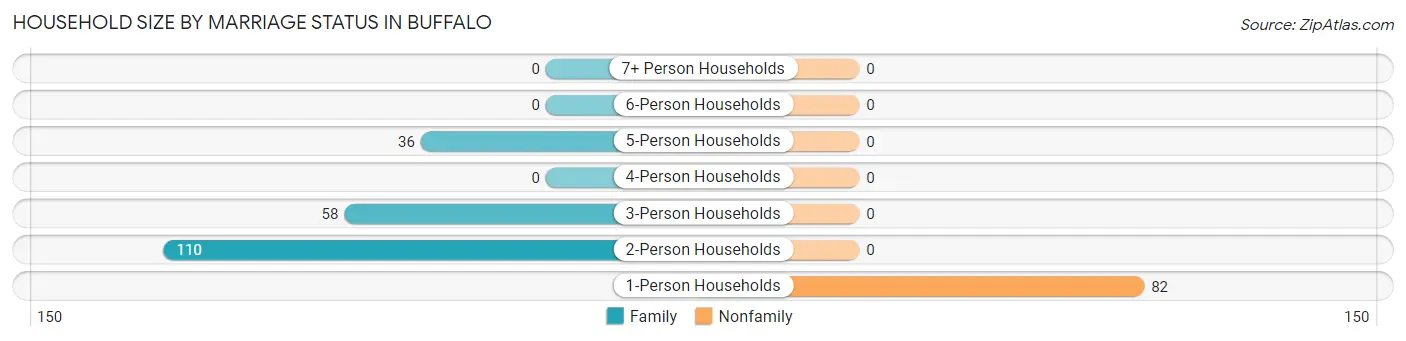
| Household Size | Family Households | Nonfamily Households |
| 1-Person Households | - | 82 (28.7%) |
| 2-Person Households | 110 (38.5%) | 0 (0.0%) |
| 3-Person Households | 58 (20.3%) | 0 (0.0%) |
| 4-Person Households | 0 (0.0%) | 0 (0.0%) |
| 5-Person Households | 36 (12.6%) | 0 (0.0%) |
| 6-Person Households | 0 (0.0%) | 0 (0.0%) |
| 7+ Person Households | 0 (0.0%) | 0 (0.0%) |
| Total | 204 (71.3%) | 82 (28.7%) |
Female Fertility in Buffalo
Fertility by Age in Buffalo
Average fertility rate in Buffalo is 286.0 births per 1,000 women. Women in the age bracket of 20 to 34 years have the highest fertility rate with 333.0 births per 1,000 women. Women in the age bracket of 20 to 34 years acount for 100.0% of all women with births.
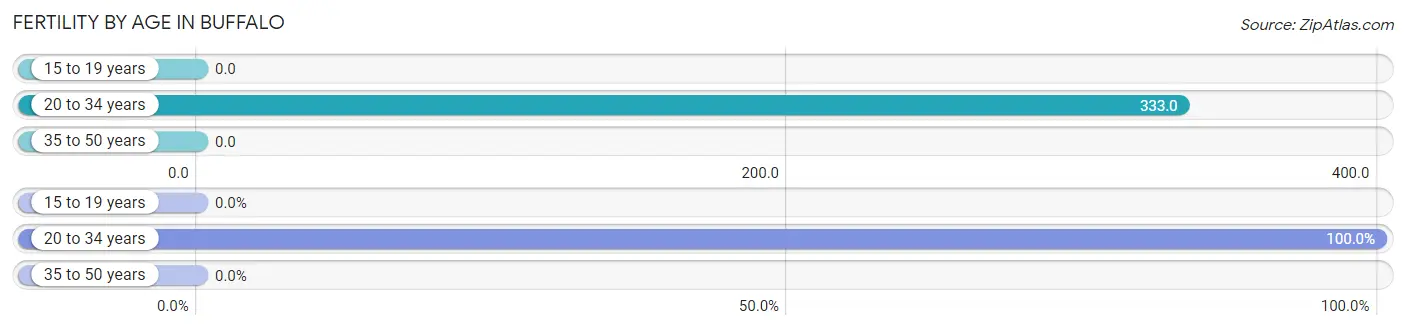
| Age Bracket | Women with Births | Births / 1,000 Women |
| 15 to 19 years | 0 (0.0%) | 0.0 |
| 20 to 34 years | 24 (100.0%) | 333.0 |
| 35 to 50 years | 0 (0.0%) | 0.0 |
| Total | 24 (100.0%) | 286.0 |
Fertility by Age by Marriage Status in Buffalo
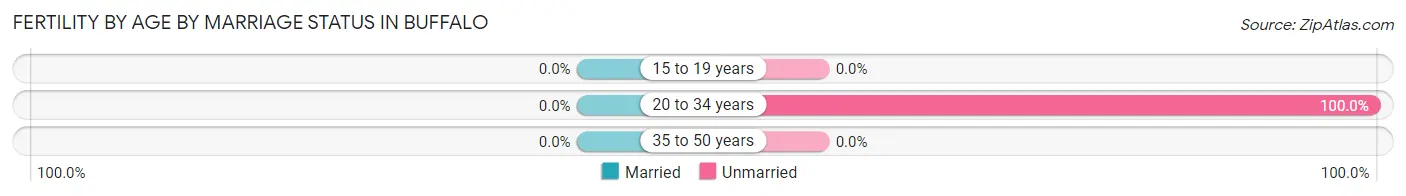
| Age Bracket | Married | Unmarried |
| 15 to 19 years | 0 (0.0%) | 0 (0.0%) |
| 20 to 34 years | 0 (0.0%) | 24 (100.0%) |
| 35 to 50 years | 0 (0.0%) | 0 (0.0%) |
| Total | 0 (0.0%) | 24 (100.0%) |
Fertility by Education in Buffalo
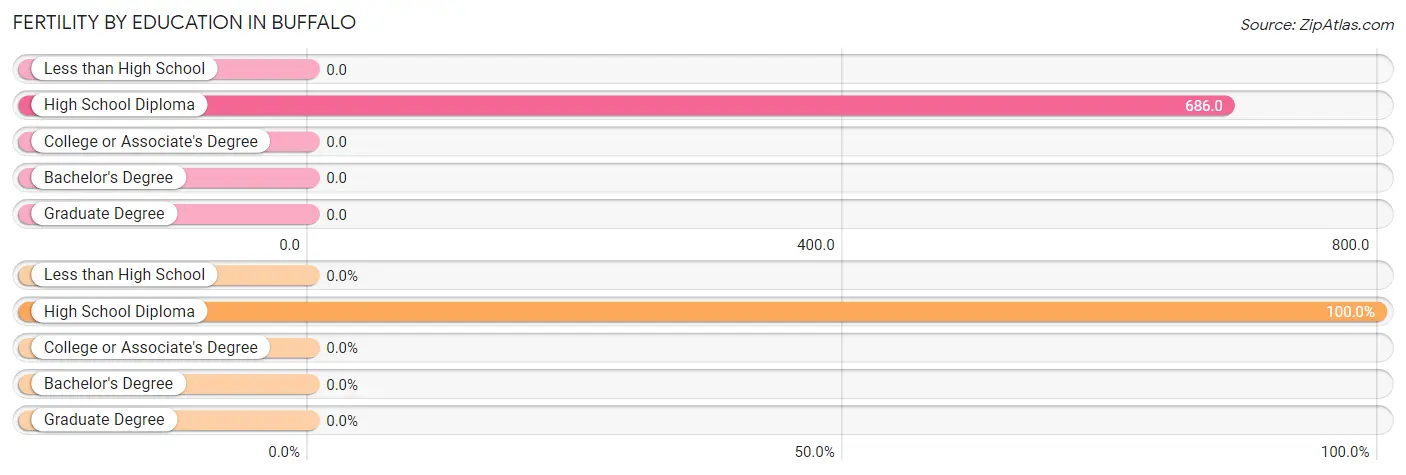
| Educational Attainment | Women with Births | Births / 1,000 Women |
| Less than High School | 0 (0.0%) | 0.0 |
| High School Diploma | 24 (100.0%) | 686.0 |
| College or Associate's Degree | 0 (0.0%) | 0.0 |
| Bachelor's Degree | 0 (0.0%) | 0.0 |
| Graduate Degree | 0 (0.0%) | 0.0 |
| Total | 24 (100.0%) | 286.0 |
Fertility by Education by Marriage Status in Buffalo
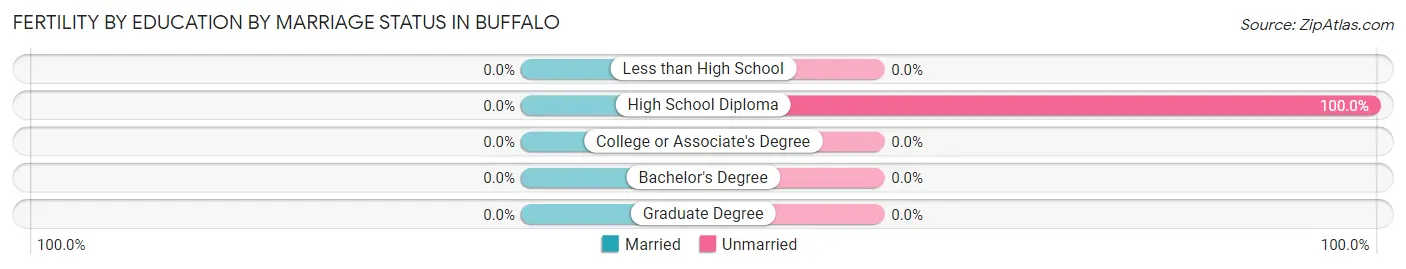
| Educational Attainment | Married | Unmarried |
| Less than High School | 0 (0.0%) | 0 (0.0%) |
| High School Diploma | 0 (0.0%) | 24 (100.0%) |
| College or Associate's Degree | 0 (0.0%) | 0 (0.0%) |
| Bachelor's Degree | 0 (0.0%) | 0 (0.0%) |
| Graduate Degree | 0 (0.0%) | 0 (0.0%) |
| Total | 0 (0.0%) | 24 (100.0%) |
Employment Characteristics in Buffalo
Employment by Class of Employer in Buffalo
Among the 184 employed individuals in Buffalo, private company employees (163 | 88.6%), not-for-profit organizations (15 | 8.2%), and self-employed (incorporated) (6 | 3.3%) make up the most common classes of employment.
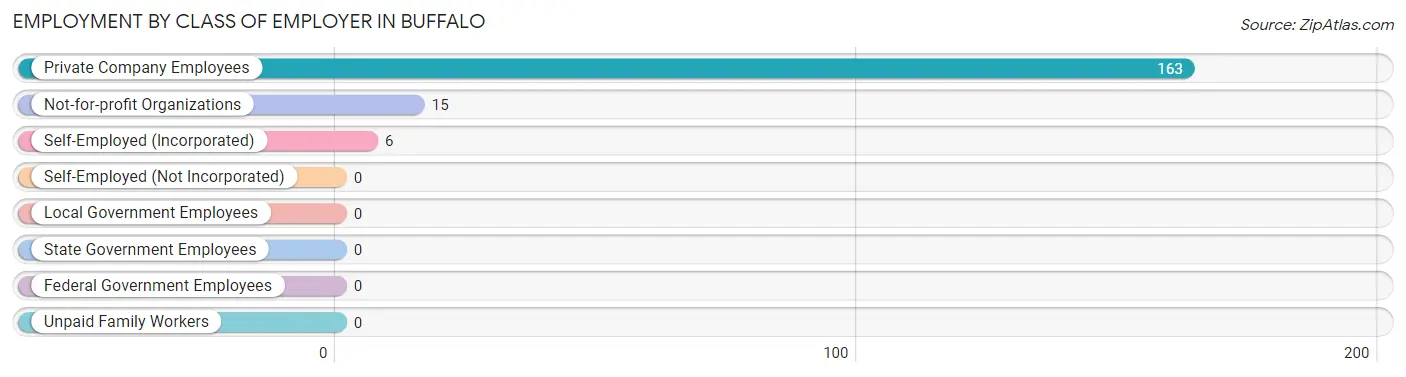
| Employer Class | # Employees | % Employees |
| Private Company Employees | 163 | 88.6% |
| Self-Employed (Incorporated) | 6 | 3.3% |
| Self-Employed (Not Incorporated) | 0 | 0.0% |
| Not-for-profit Organizations | 15 | 8.2% |
| Local Government Employees | 0 | 0.0% |
| State Government Employees | 0 | 0.0% |
| Federal Government Employees | 0 | 0.0% |
| Unpaid Family Workers | 0 | 0.0% |
| Total | 184 | 100.0% |
Employment Status by Age in Buffalo
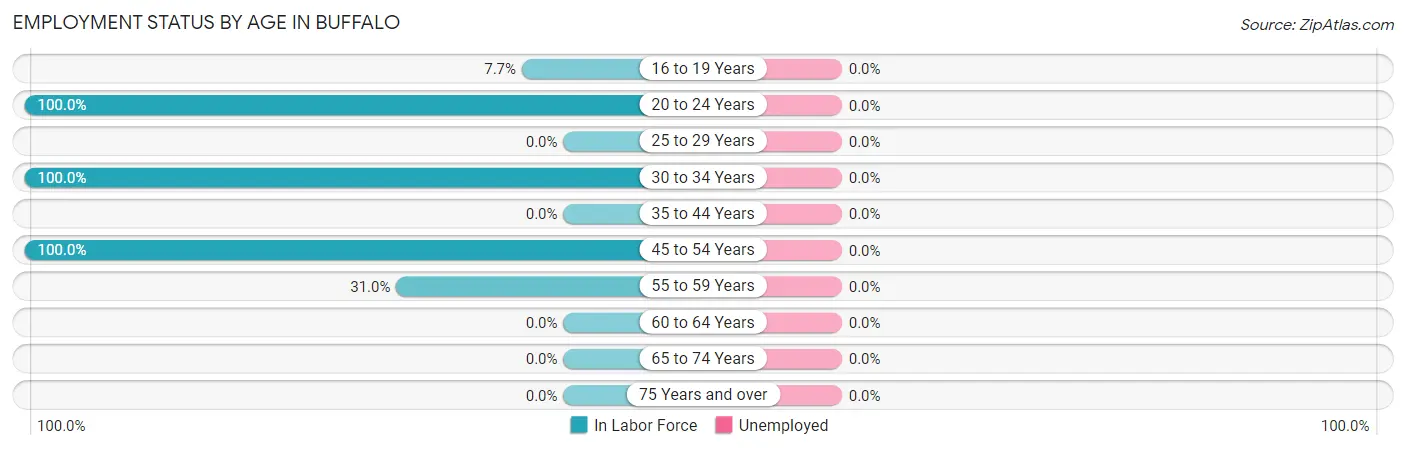
| Age Bracket | In Labor Force | Unemployed |
| 16 to 19 Years | 1 (7.7%) | 0 (0.0%) |
| 20 to 24 Years | 92 (100.0%) | 0 (0.0%) |
| 25 to 29 Years | 0 (0.0%) | 0 (0.0%) |
| 30 to 34 Years | 63 (100.0%) | 0 (0.0%) |
| 35 to 44 Years | 0 (0.0%) | 0 (0.0%) |
| 45 to 54 Years | 17 (100.0%) | 0 (0.0%) |
| 55 to 59 Years | 22 (31.0%) | 0 (0.0%) |
| 60 to 64 Years | 0 (0.0%) | 0 (0.0%) |
| 65 to 74 Years | 0 (0.0%) | 0 (0.0%) |
| 75 Years and over | 0 (0.0%) | 0 (0.0%) |
| Total | 195 (41.9%) | 0 (0.0%) |
Employment Status by Educational Attainment in Buffalo
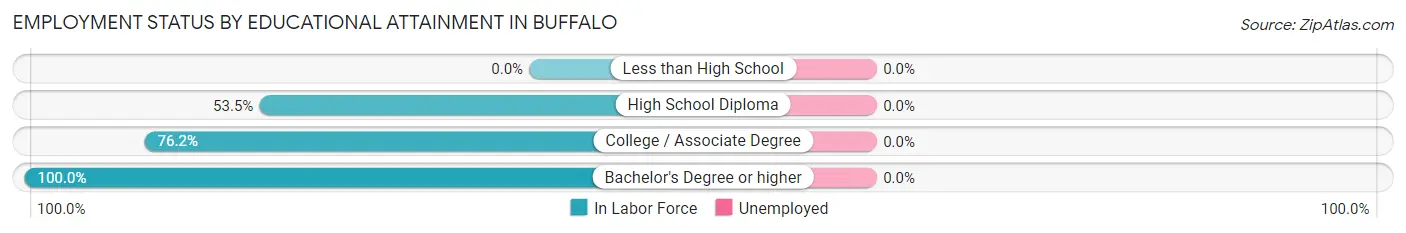
| Educational Attainment | In Labor Force | Unemployed |
| Less than High School | 0 (0.0%) | 0 (0.0%) |
| High School Diploma | 54 (53.5%) | 0 (0.0%) |
| College / Associate Degree | 32 (76.2%) | 0 (0.0%) |
| Bachelor's Degree or higher | 16 (100.0%) | 0 (0.0%) |
| Total | 102 (45.3%) | 0 (0.0%) |
Employment Occupations by Sex in Buffalo
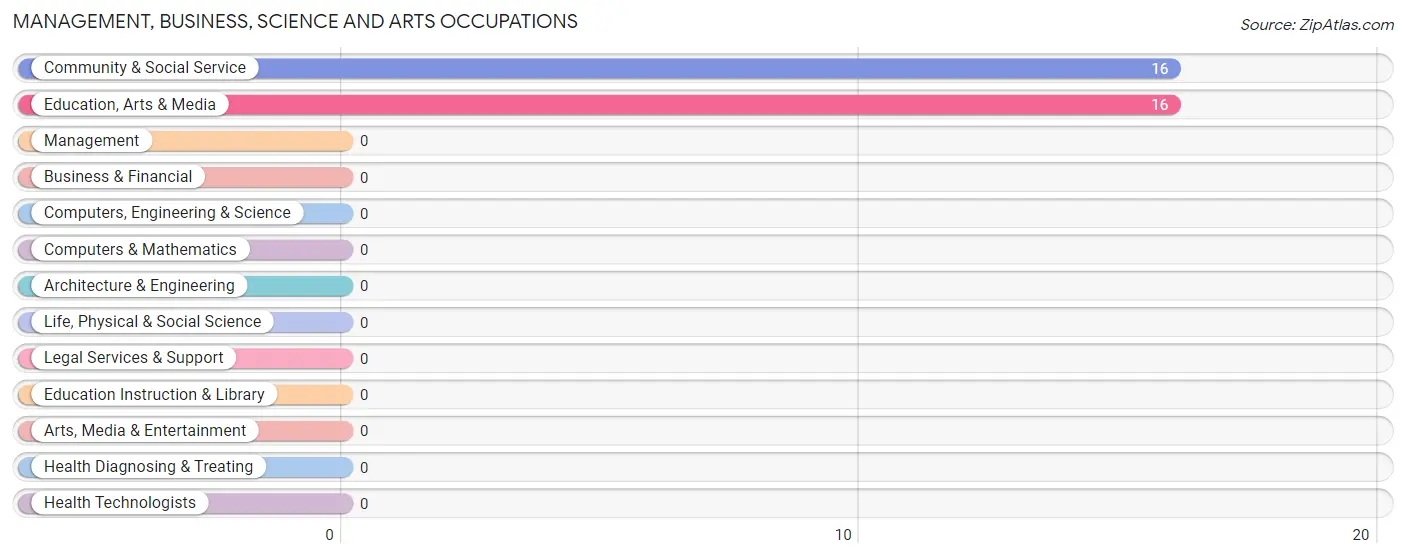
Management, Business, Science and Arts Occupations
The most common Management, Business, Science and Arts occupations in Buffalo are Community & Social Service (16 | 8.2%), and Education, Arts & Media (16 | 8.2%).
Management, Business, Science and Arts Occupations by Sex
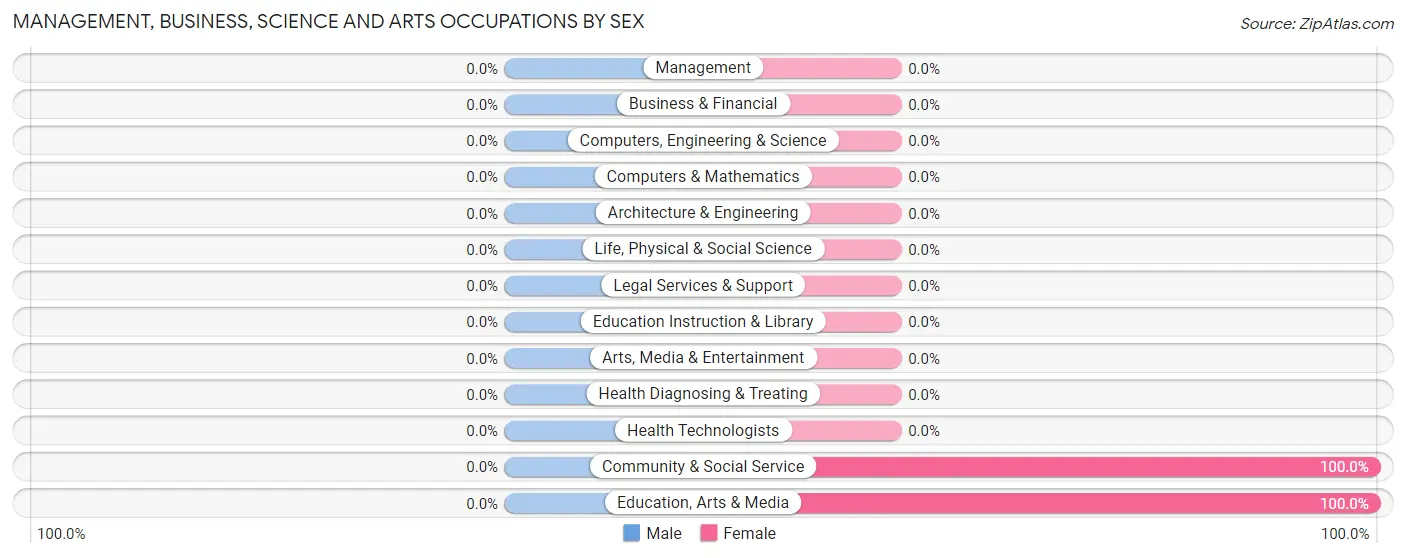
| Occupation | Male | Female |
| Management | 0 (0.0%) | 0 (0.0%) |
| Business & Financial | 0 (0.0%) | 0 (0.0%) |
| Computers, Engineering & Science | 0 (0.0%) | 0 (0.0%) |
| Computers & Mathematics | 0 (0.0%) | 0 (0.0%) |
| Architecture & Engineering | 0 (0.0%) | 0 (0.0%) |
| Life, Physical & Social Science | 0 (0.0%) | 0 (0.0%) |
| Community & Social Service | 0 (0.0%) | 16 (100.0%) |
| Education, Arts & Media | 0 (0.0%) | 16 (100.0%) |
| Legal Services & Support | 0 (0.0%) | 0 (0.0%) |
| Education Instruction & Library | 0 (0.0%) | 0 (0.0%) |
| Arts, Media & Entertainment | 0 (0.0%) | 0 (0.0%) |
| Health Diagnosing & Treating | 0 (0.0%) | 0 (0.0%) |
| Health Technologists | 0 (0.0%) | 0 (0.0%) |
| Total (Category) | 0 (0.0%) | 16 (100.0%) |
| Total (Overall) | 113 (58.0%) | 82 (42.0%) |
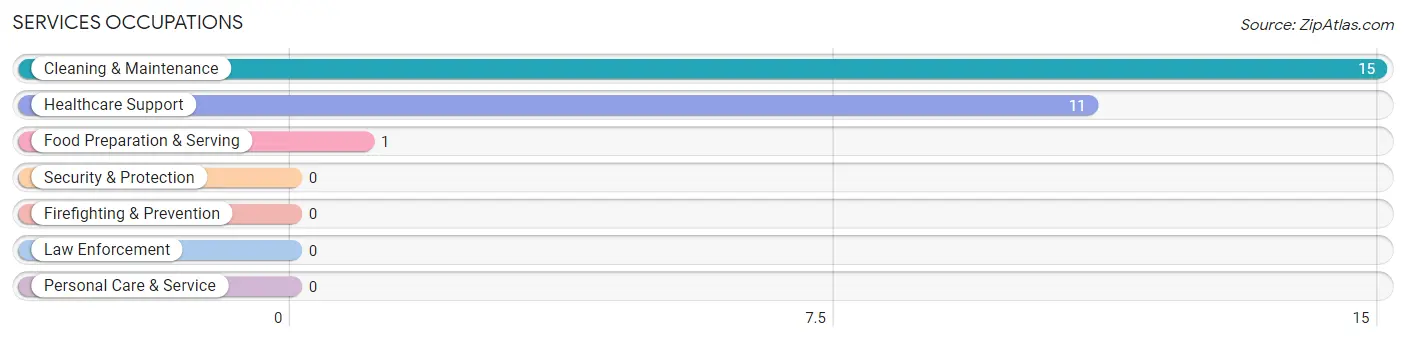
Services Occupations
The most common Services occupations in Buffalo are Cleaning & Maintenance (15 | 7.7%), Healthcare Support (11 | 5.6%), and Food Preparation & Serving (1 | 0.5%).
Services Occupations by Sex
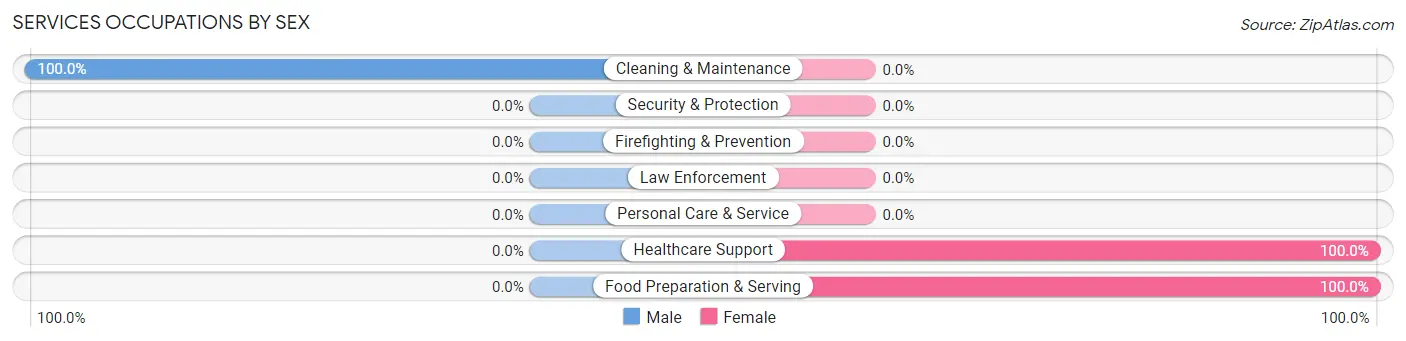
| Occupation | Male | Female |
| Healthcare Support | 0 (0.0%) | 11 (100.0%) |
| Security & Protection | 0 (0.0%) | 0 (0.0%) |
| Firefighting & Prevention | 0 (0.0%) | 0 (0.0%) |
| Law Enforcement | 0 (0.0%) | 0 (0.0%) |
| Food Preparation & Serving | 0 (0.0%) | 1 (100.0%) |
| Cleaning & Maintenance | 15 (100.0%) | 0 (0.0%) |
| Personal Care & Service | 0 (0.0%) | 0 (0.0%) |
| Total (Category) | 15 (55.6%) | 12 (44.4%) |
| Total (Overall) | 113 (58.0%) | 82 (42.0%) |
Sales and Office Occupations
The most common Sales and Office occupations in Buffalo are Sales & Related (38 | 19.5%), and Office & Administration (11 | 5.6%).
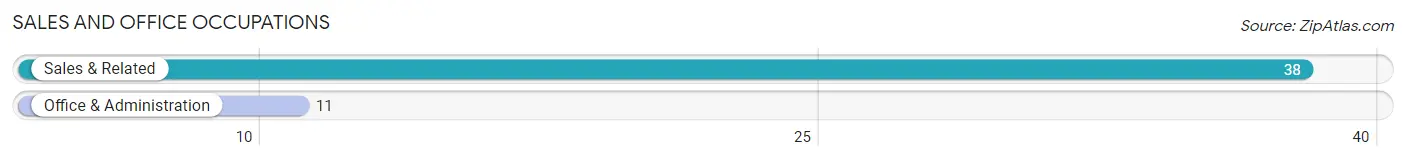
Sales and Office Occupations by Sex

| Occupation | Male | Female |
| Sales & Related | 6 (15.8%) | 32 (84.2%) |
| Office & Administration | 0 (0.0%) | 11 (100.0%) |
| Total (Category) | 6 (12.2%) | 43 (87.8%) |
| Total (Overall) | 113 (58.0%) | 82 (42.0%) |
Natural Resources, Construction and Maintenance Occupations
The most common Natural Resources, Construction and Maintenance occupations in Buffalo are Construction & Extraction (38 | 19.5%), and Installation, Maintenance & Repair (36 | 18.5%).
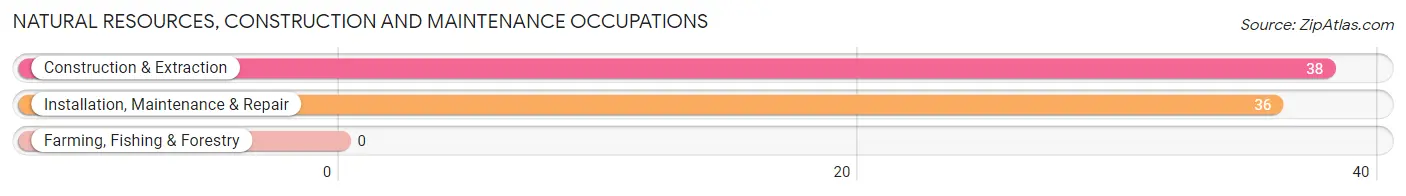
Natural Resources, Construction and Maintenance Occupations by Sex

| Occupation | Male | Female |
| Farming, Fishing & Forestry | 0 (0.0%) | 0 (0.0%) |
| Construction & Extraction | 38 (100.0%) | 0 (0.0%) |
| Installation, Maintenance & Repair | 36 (100.0%) | 0 (0.0%) |
| Total (Category) | 74 (100.0%) | 0 (0.0%) |
| Total (Overall) | 113 (58.0%) | 82 (42.0%) |
Production, Transportation and Moving Occupations
The most common Production, Transportation and Moving occupations in Buffalo are Material Moving (18 | 9.2%), and Transportation (11 | 5.6%).
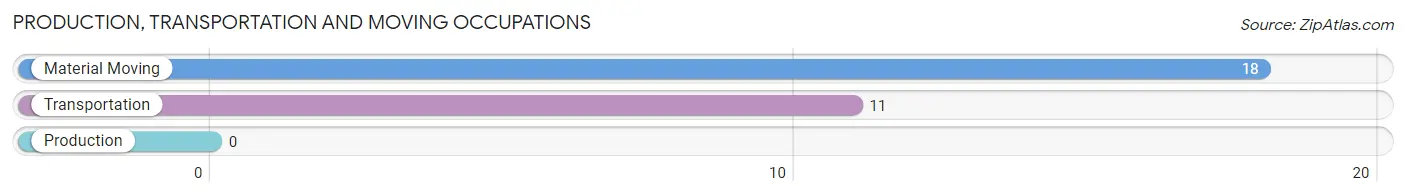
Production, Transportation and Moving Occupations by Sex
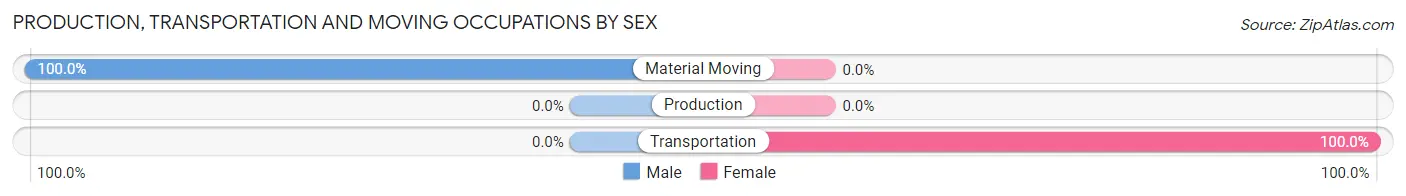
| Occupation | Male | Female |
| Production | 0 (0.0%) | 0 (0.0%) |
| Transportation | 0 (0.0%) | 11 (100.0%) |
| Material Moving | 18 (100.0%) | 0 (0.0%) |
| Total (Category) | 18 (62.1%) | 11 (37.9%) |
| Total (Overall) | 113 (58.0%) | 82 (42.0%) |
Employment Industries by Sex in Buffalo
Employment Industries in Buffalo
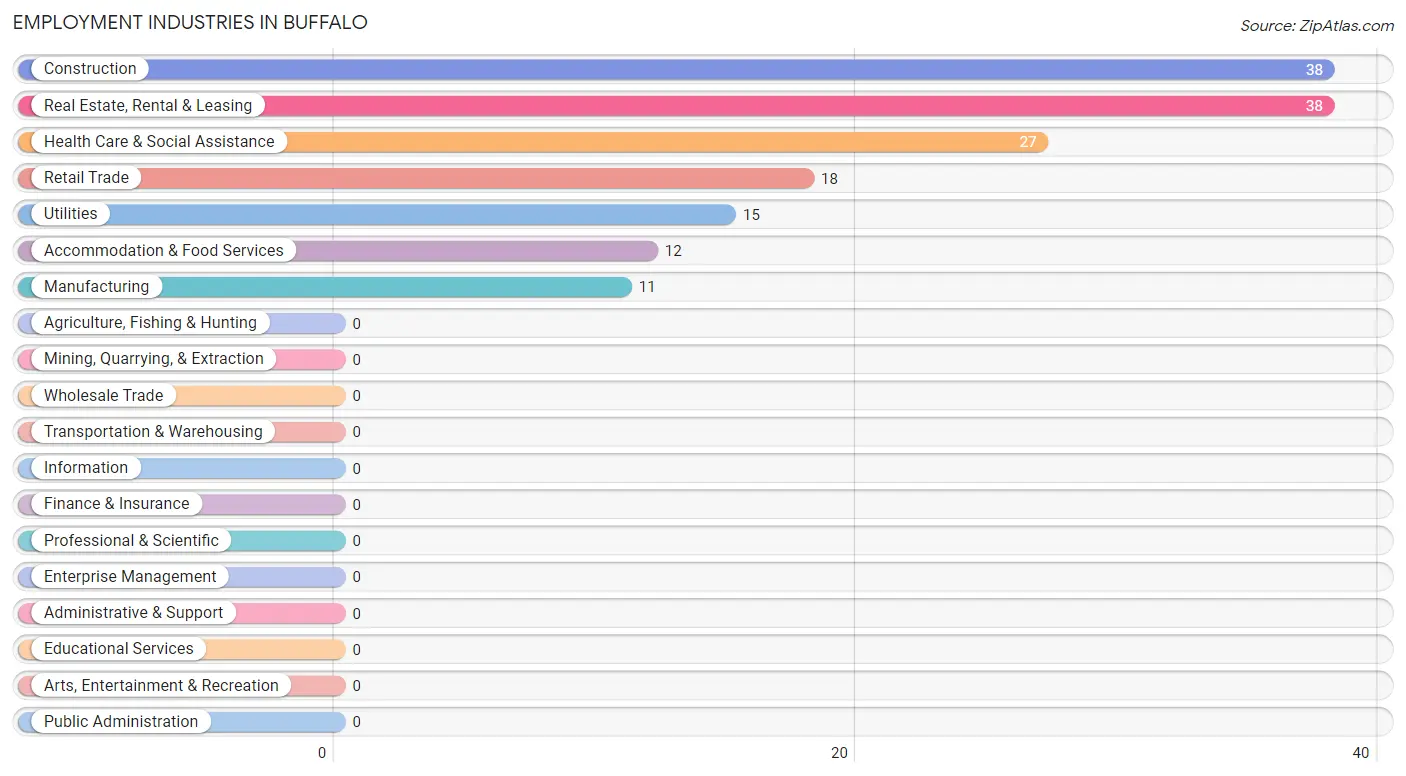
The major employment industries in Buffalo include Construction (38 | 19.5%), Real Estate, Rental & Leasing (38 | 19.5%), Health Care & Social Assistance (27 | 13.9%), Retail Trade (18 | 9.2%), and Utilities (15 | 7.7%).
Employment Industries by Sex in Buffalo
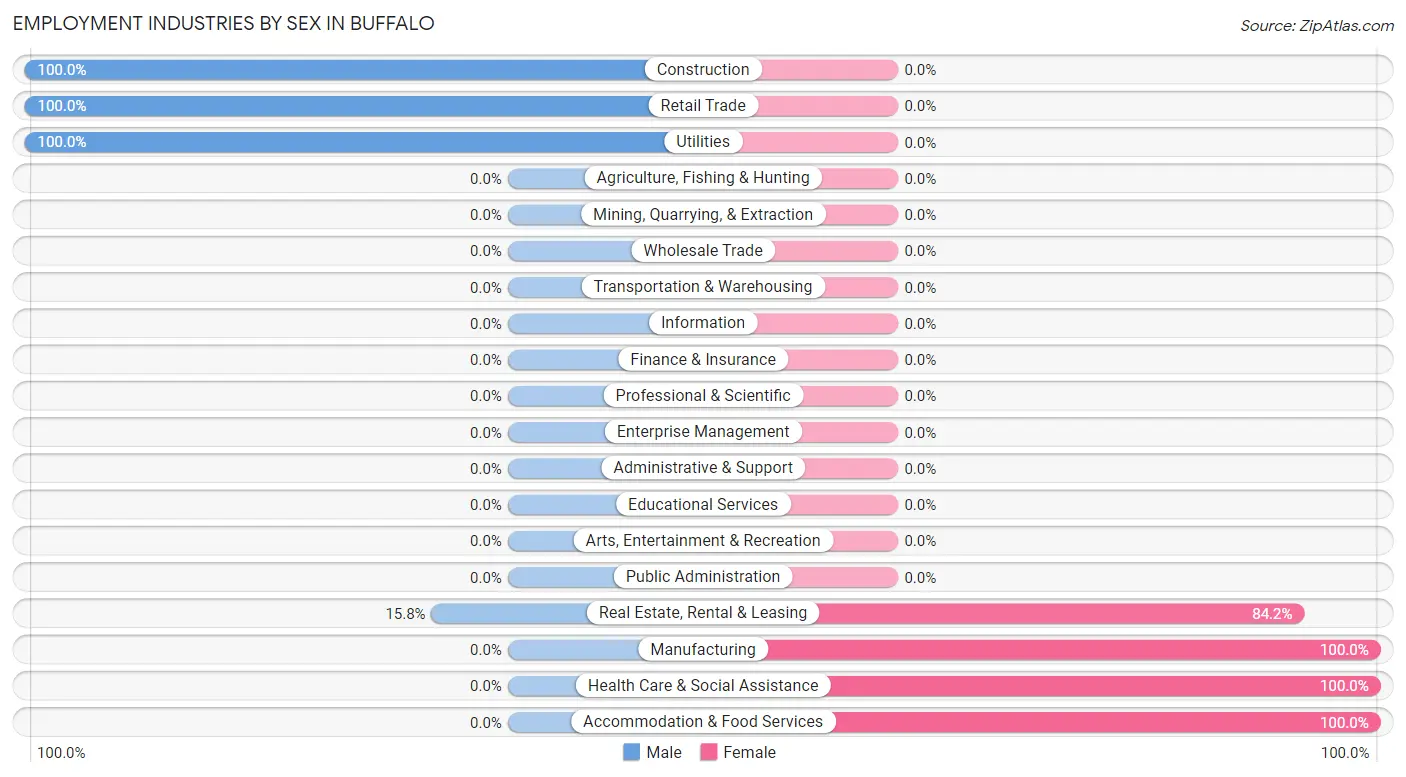
The Buffalo industries that see more men than women are Construction (100.0%), Retail Trade (100.0%), and Utilities (100.0%), whereas the industries that tend to have a higher number of women are Manufacturing (100.0%), Health Care & Social Assistance (100.0%), and Accommodation & Food Services (100.0%).
| Industry | Male | Female |
| Agriculture, Fishing & Hunting | 0 (0.0%) | 0 (0.0%) |
| Mining, Quarrying, & Extraction | 0 (0.0%) | 0 (0.0%) |
| Construction | 38 (100.0%) | 0 (0.0%) |
| Manufacturing | 0 (0.0%) | 11 (100.0%) |
| Wholesale Trade | 0 (0.0%) | 0 (0.0%) |
| Retail Trade | 18 (100.0%) | 0 (0.0%) |
| Transportation & Warehousing | 0 (0.0%) | 0 (0.0%) |
| Utilities | 15 (100.0%) | 0 (0.0%) |
| Information | 0 (0.0%) | 0 (0.0%) |
| Finance & Insurance | 0 (0.0%) | 0 (0.0%) |
| Real Estate, Rental & Leasing | 6 (15.8%) | 32 (84.2%) |
| Professional & Scientific | 0 (0.0%) | 0 (0.0%) |
| Enterprise Management | 0 (0.0%) | 0 (0.0%) |
| Administrative & Support | 0 (0.0%) | 0 (0.0%) |
| Educational Services | 0 (0.0%) | 0 (0.0%) |
| Health Care & Social Assistance | 0 (0.0%) | 27 (100.0%) |
| Arts, Entertainment & Recreation | 0 (0.0%) | 0 (0.0%) |
| Accommodation & Food Services | 0 (0.0%) | 12 (100.0%) |
| Public Administration | 0 (0.0%) | 0 (0.0%) |
| Total | 113 (58.0%) | 82 (42.0%) |
Education in Buffalo
School Enrollment in Buffalo
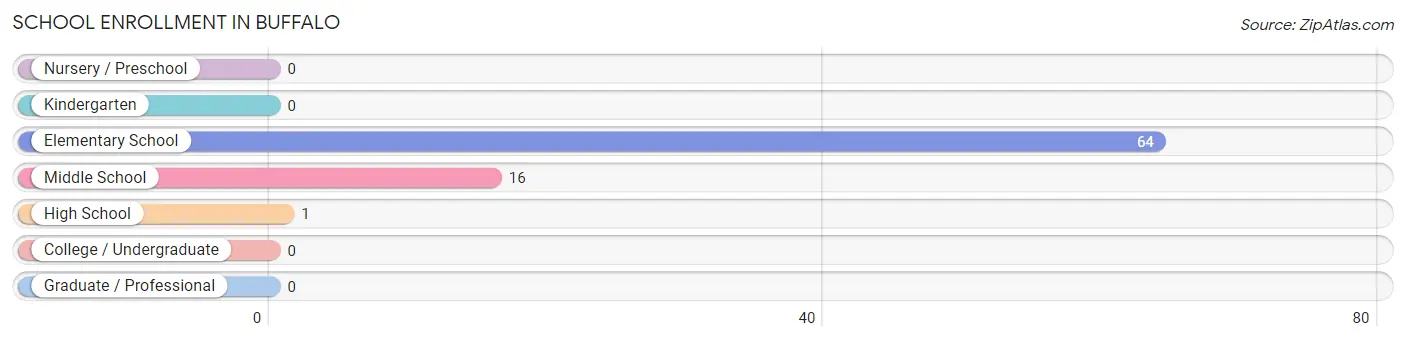
The most common levels of schooling among the 81 students in Buffalo are elementary school (64 | 79.0%), middle school (16 | 19.8%), and high school (1 | 1.2%).
| School Level | # Students | % Students |
| Nursery / Preschool | 0 | 0.0% |
| Kindergarten | 0 | 0.0% |
| Elementary School | 64 | 79.0% |
| Middle School | 16 | 19.8% |
| High School | 1 | 1.2% |
| College / Undergraduate | 0 | 0.0% |
| Graduate / Professional | 0 | 0.0% |
| Total | 81 | 100.0% |
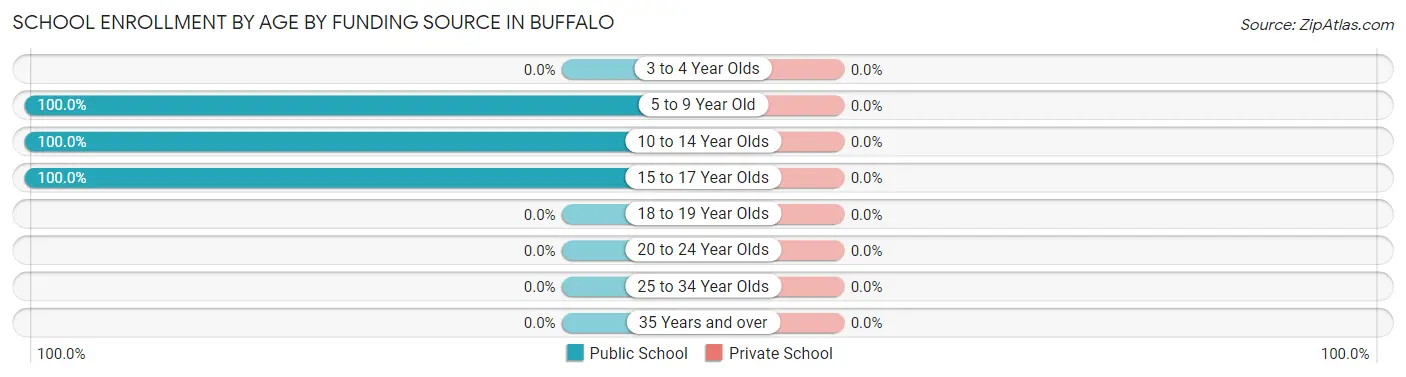
School Enrollment by Age by Funding Source in Buffalo
| Age Bracket | Public School | Private School |
| 3 to 4 Year Olds | 0 (0.0%) | 0 (0.0%) |
| 5 to 9 Year Old | 64 (100.0%) | 0 (0.0%) |
| 10 to 14 Year Olds | 16 (100.0%) | 0 (0.0%) |
| 15 to 17 Year Olds | 1 (100.0%) | 0 (0.0%) |
| 18 to 19 Year Olds | 0 (0.0%) | 0 (0.0%) |
| 20 to 24 Year Olds | 0 (0.0%) | 0 (0.0%) |
| 25 to 34 Year Olds | 0 (0.0%) | 0 (0.0%) |
| 35 Years and over | 0 (0.0%) | 0 (0.0%) |
| Total | 81 (100.0%) | 0 (0.0%) |
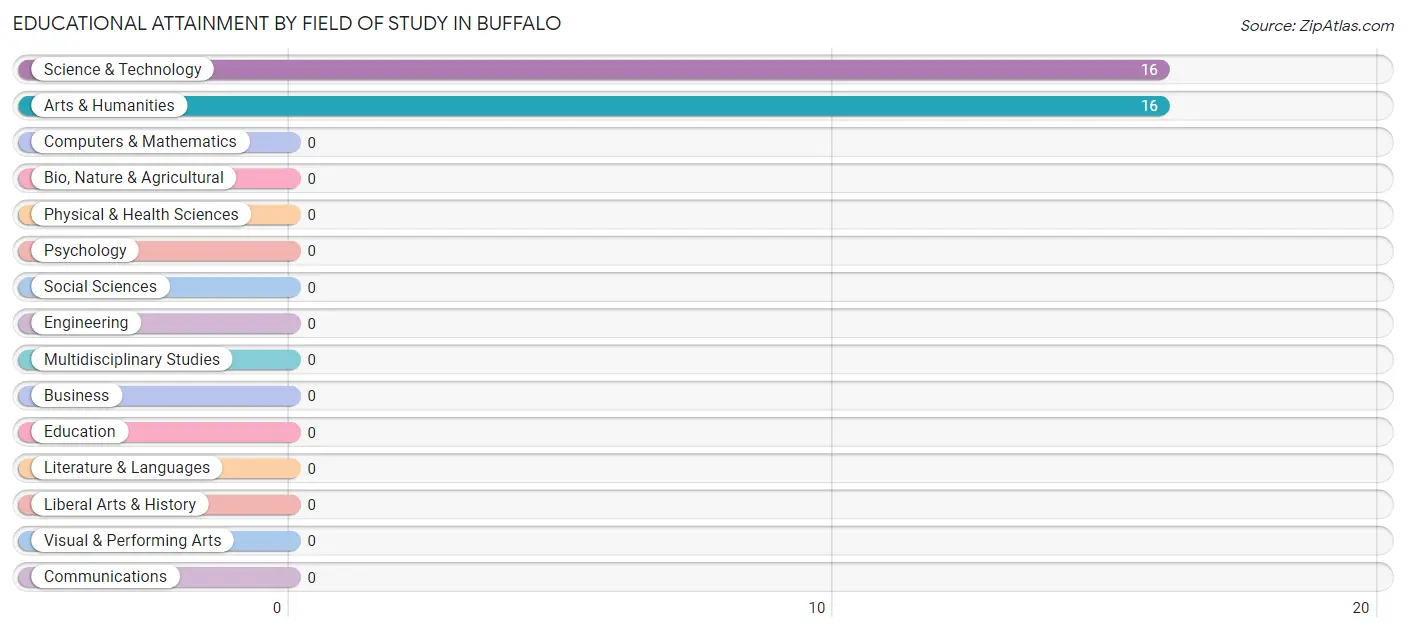
Educational Attainment by Field of Study in Buffalo
Science & technology (16 | 50.0%), and arts & humanities (16 | 50.0%) are the most common fields of study among 32 individuals in Buffalo who have obtained a bachelor's degree or higher.
| Field of Study | # Graduates | % Graduates |
| Computers & Mathematics | 0 | 0.0% |
| Bio, Nature & Agricultural | 0 | 0.0% |
| Physical & Health Sciences | 0 | 0.0% |
| Psychology | 0 | 0.0% |
| Social Sciences | 0 | 0.0% |
| Engineering | 0 | 0.0% |
| Multidisciplinary Studies | 0 | 0.0% |
| Science & Technology | 16 | 50.0% |
| Business | 0 | 0.0% |
| Education | 0 | 0.0% |
| Literature & Languages | 0 | 0.0% |
| Liberal Arts & History | 0 | 0.0% |
| Visual & Performing Arts | 0 | 0.0% |
| Communications | 0 | 0.0% |
| Arts & Humanities | 16 | 50.0% |
| Total | 32 | 100.0% |
Transportation & Commute in Buffalo
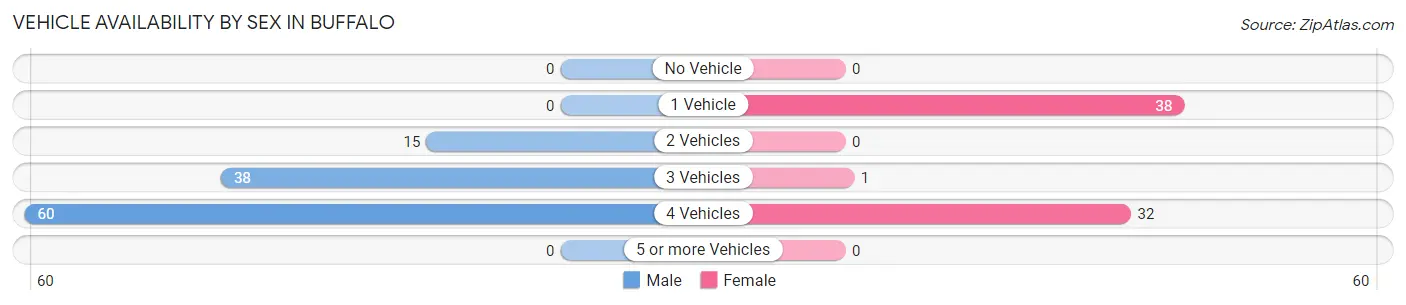
Vehicle Availability by Sex in Buffalo
The most prevalent vehicle ownership categories in Buffalo are males with 4 vehicles (60, accounting for 53.1%) and females with 4 vehicles (32, making up 84.5%).
| Vehicles Available | Male | Female |
| No Vehicle | 0 (0.0%) | 0 (0.0%) |
| 1 Vehicle | 0 (0.0%) | 38 (53.5%) |
| 2 Vehicles | 15 (13.3%) | 0 (0.0%) |
| 3 Vehicles | 38 (33.6%) | 1 (1.4%) |
| 4 Vehicles | 60 (53.1%) | 32 (45.1%) |
| 5 or more Vehicles | 0 (0.0%) | 0 (0.0%) |
| Total | 113 (100.0%) | 71 (100.0%) |
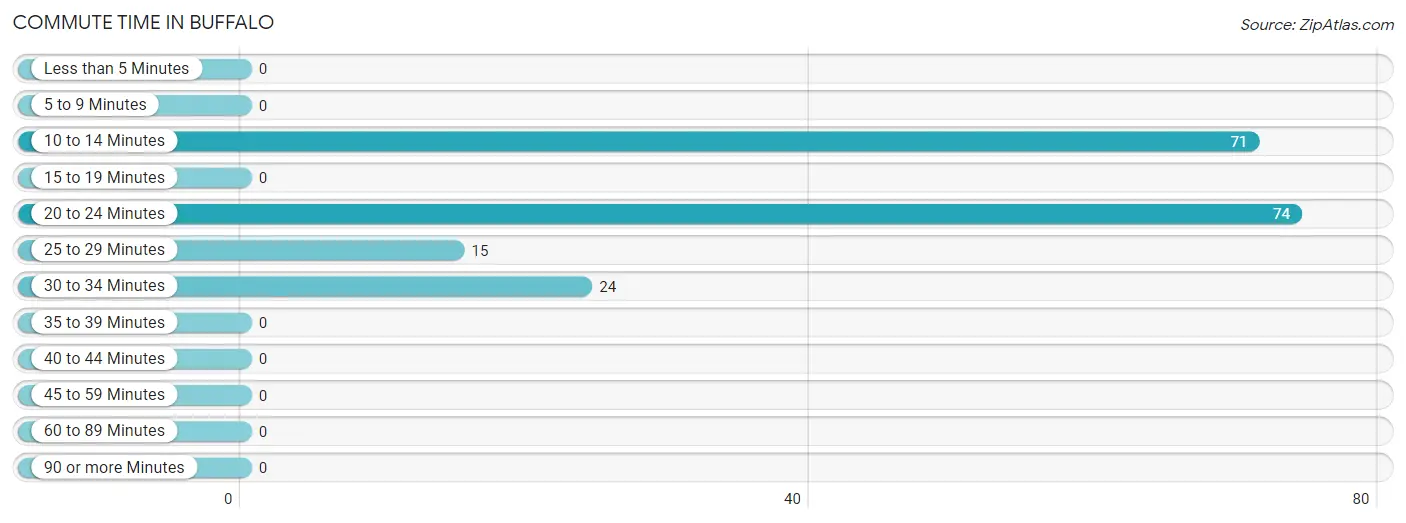
Commute Time in Buffalo
The most frequently occuring commute durations in Buffalo are 20 to 24 minutes (74 commuters, 40.2%), 10 to 14 minutes (71 commuters, 38.6%), and 30 to 34 minutes (24 commuters, 13.0%).
| Commute Time | # Commuters | % Commuters |
| Less than 5 Minutes | 0 | 0.0% |
| 5 to 9 Minutes | 0 | 0.0% |
| 10 to 14 Minutes | 71 | 38.6% |
| 15 to 19 Minutes | 0 | 0.0% |
| 20 to 24 Minutes | 74 | 40.2% |
| 25 to 29 Minutes | 15 | 8.2% |
| 30 to 34 Minutes | 24 | 13.0% |
| 35 to 39 Minutes | 0 | 0.0% |
| 40 to 44 Minutes | 0 | 0.0% |
| 45 to 59 Minutes | 0 | 0.0% |
| 60 to 89 Minutes | 0 | 0.0% |
| 90 or more Minutes | 0 | 0.0% |
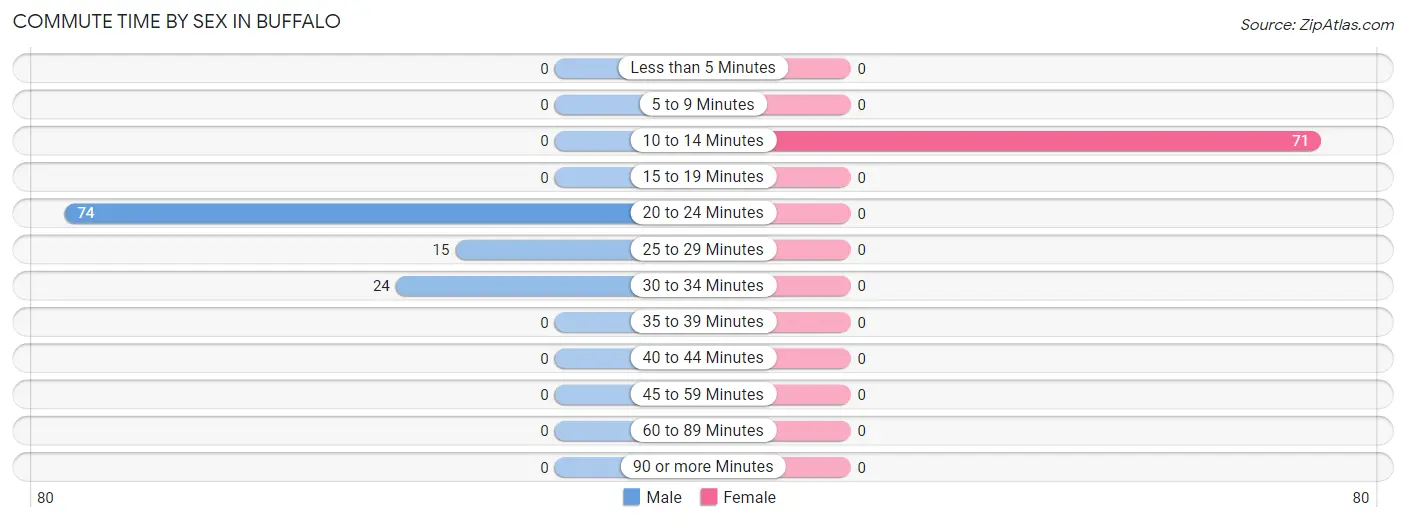
Commute Time by Sex in Buffalo
The most common commute times in Buffalo are 20 to 24 minutes (74 commuters, 65.5%) for males and 10 to 14 minutes (71 commuters, 100.0%) for females.
| Commute Time | Male | Female |
| Less than 5 Minutes | 0 (0.0%) | 0 (0.0%) |
| 5 to 9 Minutes | 0 (0.0%) | 0 (0.0%) |
| 10 to 14 Minutes | 0 (0.0%) | 71 (100.0%) |
| 15 to 19 Minutes | 0 (0.0%) | 0 (0.0%) |
| 20 to 24 Minutes | 74 (65.5%) | 0 (0.0%) |
| 25 to 29 Minutes | 15 (13.3%) | 0 (0.0%) |
| 30 to 34 Minutes | 24 (21.2%) | 0 (0.0%) |
| 35 to 39 Minutes | 0 (0.0%) | 0 (0.0%) |
| 40 to 44 Minutes | 0 (0.0%) | 0 (0.0%) |
| 45 to 59 Minutes | 0 (0.0%) | 0 (0.0%) |
| 60 to 89 Minutes | 0 (0.0%) | 0 (0.0%) |
| 90 or more Minutes | 0 (0.0%) | 0 (0.0%) |
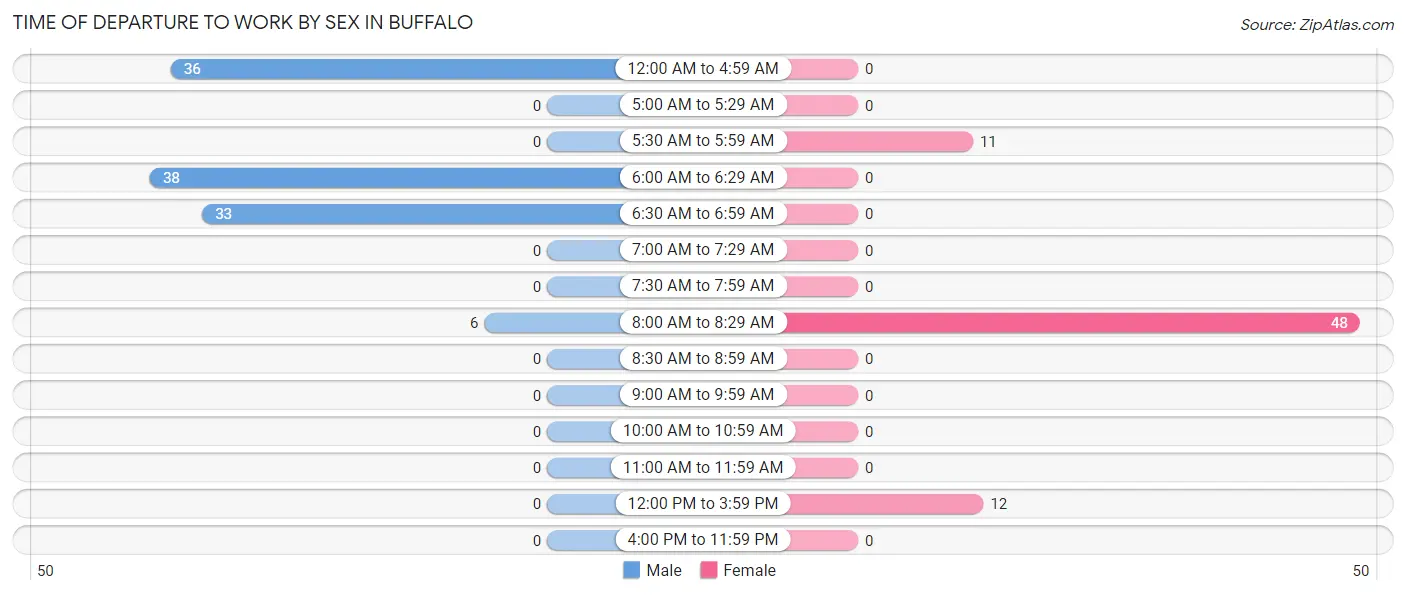
Time of Departure to Work by Sex in Buffalo
The most frequent times of departure to work in Buffalo are 6:00 AM to 6:29 AM (38, 33.6%) for males and 8:00 AM to 8:29 AM (48, 67.6%) for females.
| Time of Departure | Male | Female |
| 12:00 AM to 4:59 AM | 36 (31.9%) | 0 (0.0%) |
| 5:00 AM to 5:29 AM | 0 (0.0%) | 0 (0.0%) |
| 5:30 AM to 5:59 AM | 0 (0.0%) | 11 (15.5%) |
| 6:00 AM to 6:29 AM | 38 (33.6%) | 0 (0.0%) |
| 6:30 AM to 6:59 AM | 33 (29.2%) | 0 (0.0%) |
| 7:00 AM to 7:29 AM | 0 (0.0%) | 0 (0.0%) |
| 7:30 AM to 7:59 AM | 0 (0.0%) | 0 (0.0%) |
| 8:00 AM to 8:29 AM | 6 (5.3%) | 48 (67.6%) |
| 8:30 AM to 8:59 AM | 0 (0.0%) | 0 (0.0%) |
| 9:00 AM to 9:59 AM | 0 (0.0%) | 0 (0.0%) |
| 10:00 AM to 10:59 AM | 0 (0.0%) | 0 (0.0%) |
| 11:00 AM to 11:59 AM | 0 (0.0%) | 0 (0.0%) |
| 12:00 PM to 3:59 PM | 0 (0.0%) | 12 (16.9%) |
| 4:00 PM to 11:59 PM | 0 (0.0%) | 0 (0.0%) |
| Total | 113 (100.0%) | 71 (100.0%) |
Housing Occupancy in Buffalo
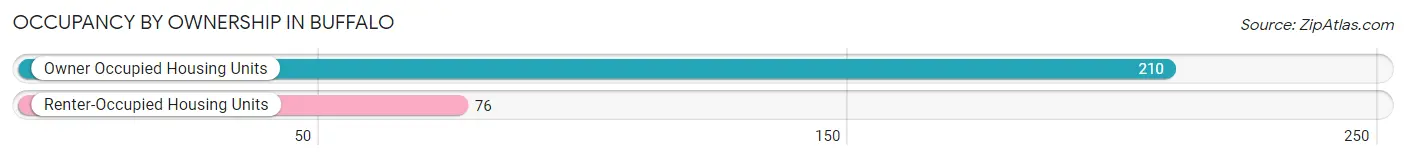
Occupancy by Ownership in Buffalo
Of the total 286 dwellings in Buffalo, owner-occupied units account for 210 (73.4%), while renter-occupied units make up 76 (26.6%).
| Occupancy | # Housing Units | % Housing Units |
| Owner Occupied Housing Units | 210 | 73.4% |
| Renter-Occupied Housing Units | 76 | 26.6% |
| Total Occupied Housing Units | 286 | 100.0% |
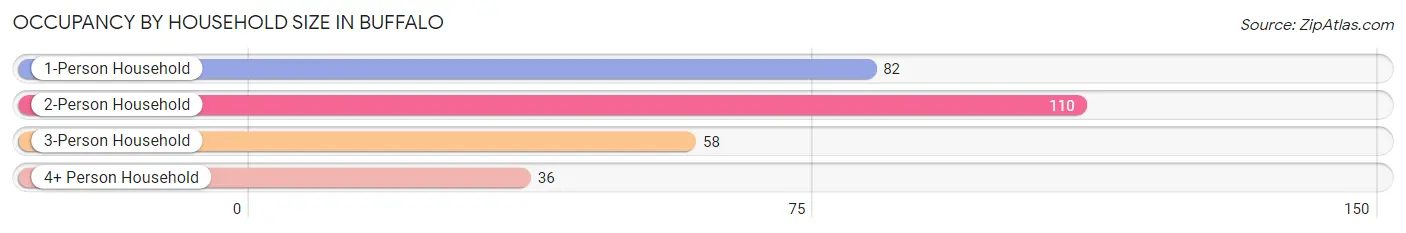
Occupancy by Household Size in Buffalo
| Household Size | # Housing Units | % Housing Units |
| 1-Person Household | 82 | 28.7% |
| 2-Person Household | 110 | 38.5% |
| 3-Person Household | 58 | 20.3% |
| 4+ Person Household | 36 | 12.6% |
| Total Housing Units | 286 | 100.0% |
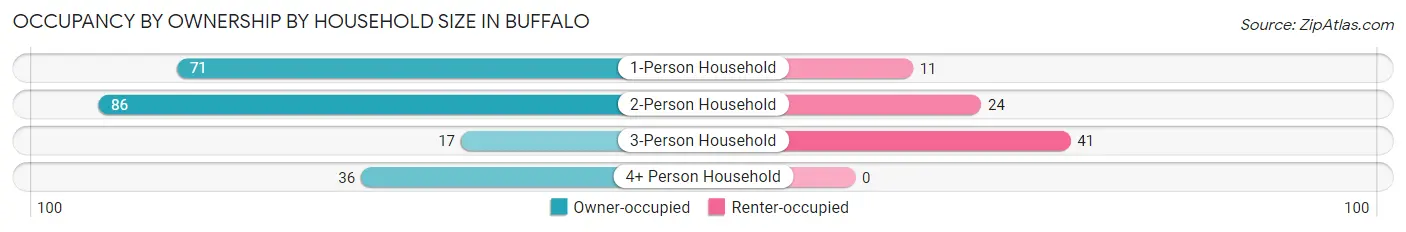
Occupancy by Ownership by Household Size in Buffalo
| Household Size | Owner-occupied | Renter-occupied |
| 1-Person Household | 71 (86.6%) | 11 (13.4%) |
| 2-Person Household | 86 (78.2%) | 24 (21.8%) |
| 3-Person Household | 17 (29.3%) | 41 (70.7%) |
| 4+ Person Household | 36 (100.0%) | 0 (0.0%) |
| Total Housing Units | 210 (73.4%) | 76 (26.6%) |
Occupancy by Educational Attainment in Buffalo
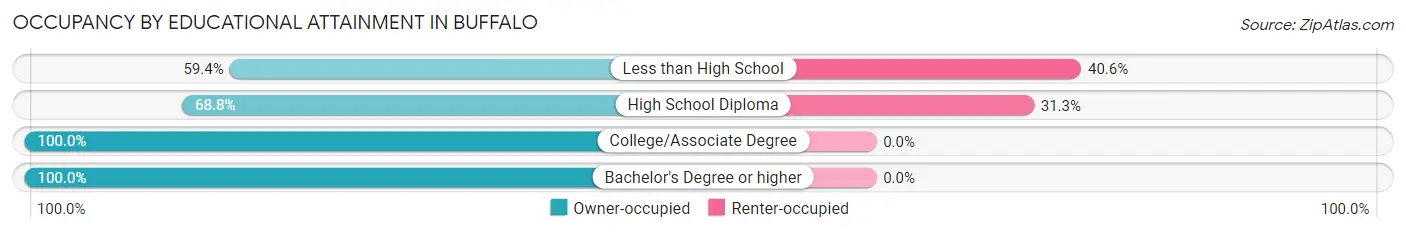
| Household Size | Owner-occupied | Renter-occupied |
| Less than High School | 38 (59.4%) | 26 (40.6%) |
| High School Diploma | 110 (68.8%) | 50 (31.2%) |
| College/Associate Degree | 46 (100.0%) | 0 (0.0%) |
| Bachelor's Degree or higher | 16 (100.0%) | 0 (0.0%) |
Occupancy by Age of Householder in Buffalo
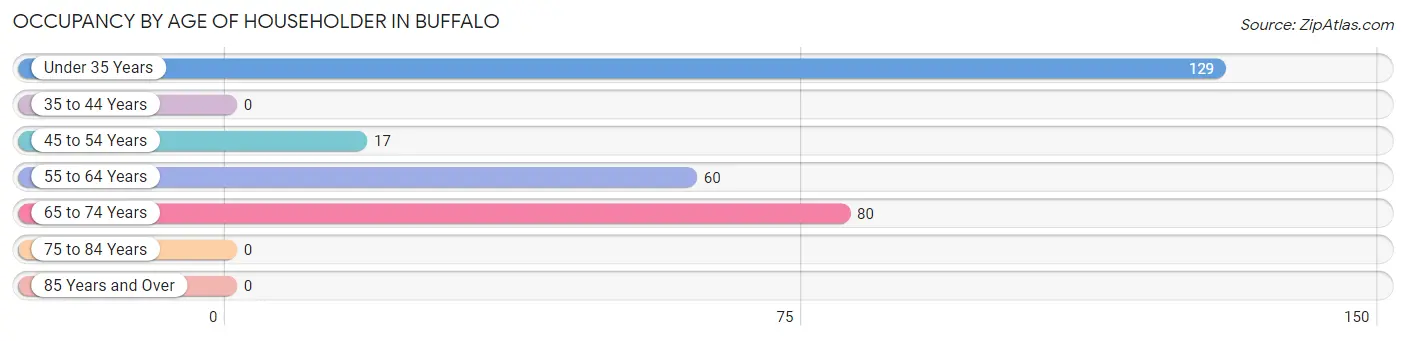
| Age Bracket | # Households | % Households |
| Under 35 Years | 129 | 45.1% |
| 35 to 44 Years | 0 | 0.0% |
| 45 to 54 Years | 17 | 5.9% |
| 55 to 64 Years | 60 | 21.0% |
| 65 to 74 Years | 80 | 28.0% |
| 75 to 84 Years | 0 | 0.0% |
| 85 Years and Over | 0 | 0.0% |
| Total | 286 | 100.0% |
Housing Finances in Buffalo
Median Income by Occupancy in Buffalo
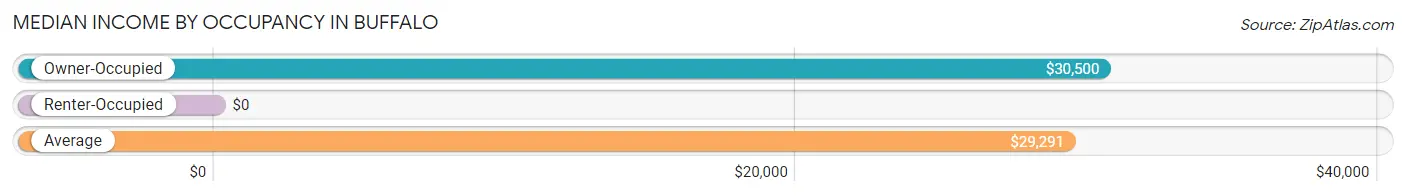
| Occupancy Type | # Households | Median Income |
| Owner-Occupied | 210 (73.4%) | $30,500 |
| Renter-Occupied | 76 (26.6%) | $0 |
| Average | 286 (100.0%) | $29,291 |
Occupancy by Householder Income Bracket in Buffalo
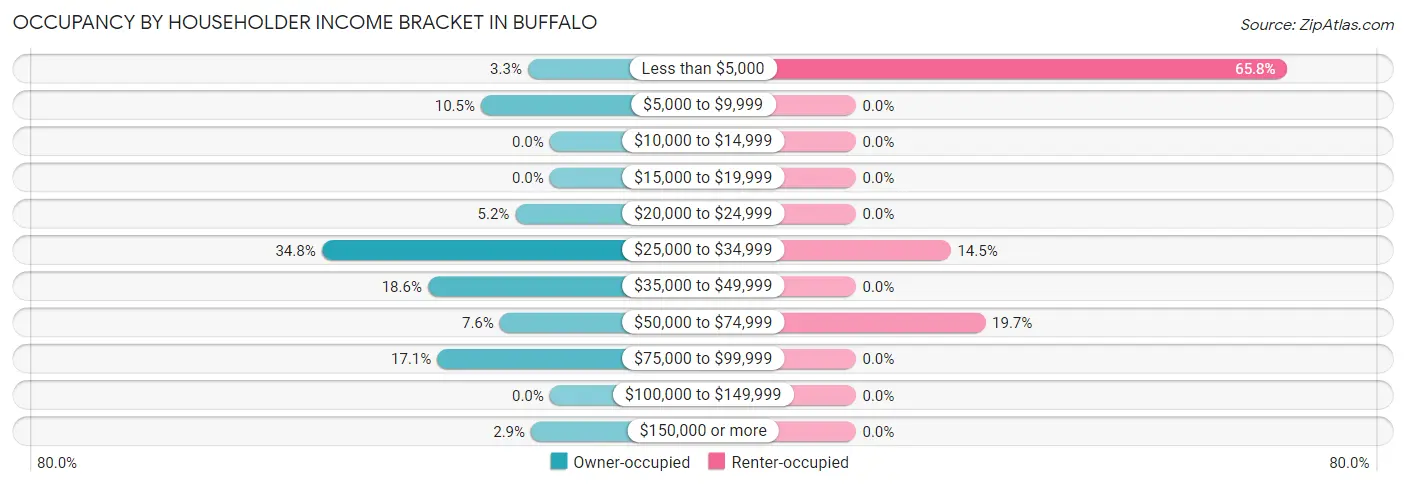
| Income Bracket | Owner-occupied | Renter-occupied |
| Less than $5,000 | 7 (3.3%) | 50 (65.8%) |
| $5,000 to $9,999 | 22 (10.5%) | 0 (0.0%) |
| $10,000 to $14,999 | 0 (0.0%) | 0 (0.0%) |
| $15,000 to $19,999 | 0 (0.0%) | 0 (0.0%) |
| $20,000 to $24,999 | 11 (5.2%) | 0 (0.0%) |
| $25,000 to $34,999 | 73 (34.8%) | 11 (14.5%) |
| $35,000 to $49,999 | 39 (18.6%) | 0 (0.0%) |
| $50,000 to $74,999 | 16 (7.6%) | 15 (19.7%) |
| $75,000 to $99,999 | 36 (17.1%) | 0 (0.0%) |
| $100,000 to $149,999 | 0 (0.0%) | 0 (0.0%) |
| $150,000 or more | 6 (2.9%) | 0 (0.0%) |
| Total | 210 (100.0%) | 76 (100.0%) |
Monthly Housing Cost Tiers in Buffalo
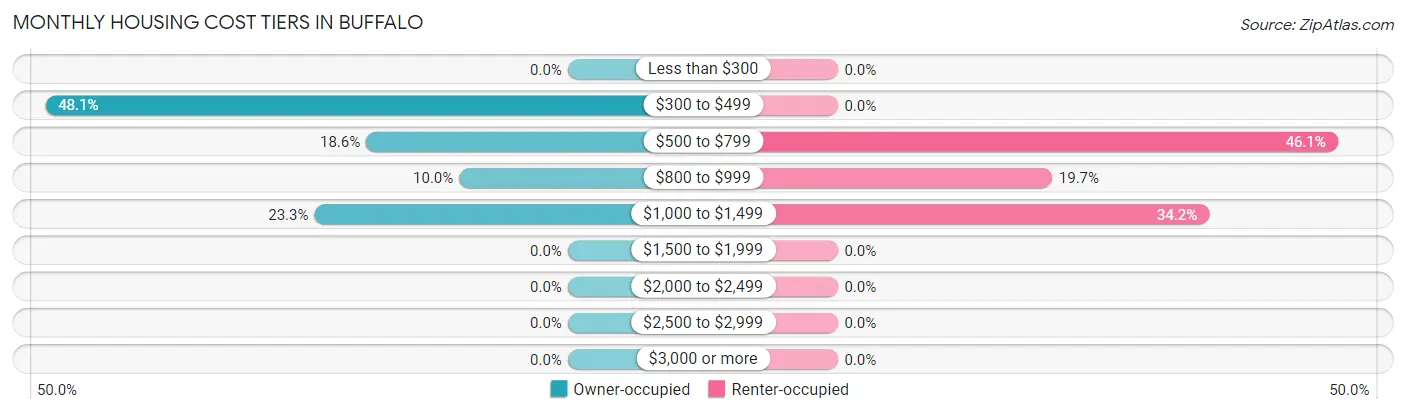
| Monthly Cost | Owner-occupied | Renter-occupied |
| Less than $300 | 0 (0.0%) | 0 (0.0%) |
| $300 to $499 | 101 (48.1%) | 0 (0.0%) |
| $500 to $799 | 39 (18.6%) | 35 (46.1%) |
| $800 to $999 | 21 (10.0%) | 15 (19.7%) |
| $1,000 to $1,499 | 49 (23.3%) | 26 (34.2%) |
| $1,500 to $1,999 | 0 (0.0%) | 0 (0.0%) |
| $2,000 to $2,499 | 0 (0.0%) | 0 (0.0%) |
| $2,500 to $2,999 | 0 (0.0%) | 0 (0.0%) |
| $3,000 or more | 0 (0.0%) | 0 (0.0%) |
| Total | 210 (100.0%) | 76 (100.0%) |
Physical Housing Characteristics in Buffalo
Housing Structures in Buffalo
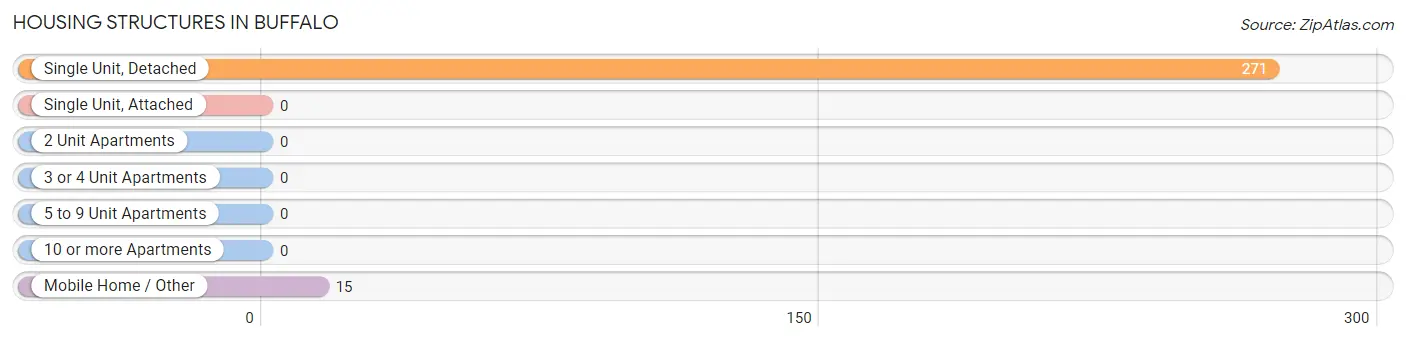
| Structure Type | # Housing Units | % Housing Units |
| Single Unit, Detached | 271 | 94.8% |
| Single Unit, Attached | 0 | 0.0% |
| 2 Unit Apartments | 0 | 0.0% |
| 3 or 4 Unit Apartments | 0 | 0.0% |
| 5 to 9 Unit Apartments | 0 | 0.0% |
| 10 or more Apartments | 0 | 0.0% |
| Mobile Home / Other | 15 | 5.2% |
| Total | 286 | 100.0% |
Housing Structures by Occupancy in Buffalo
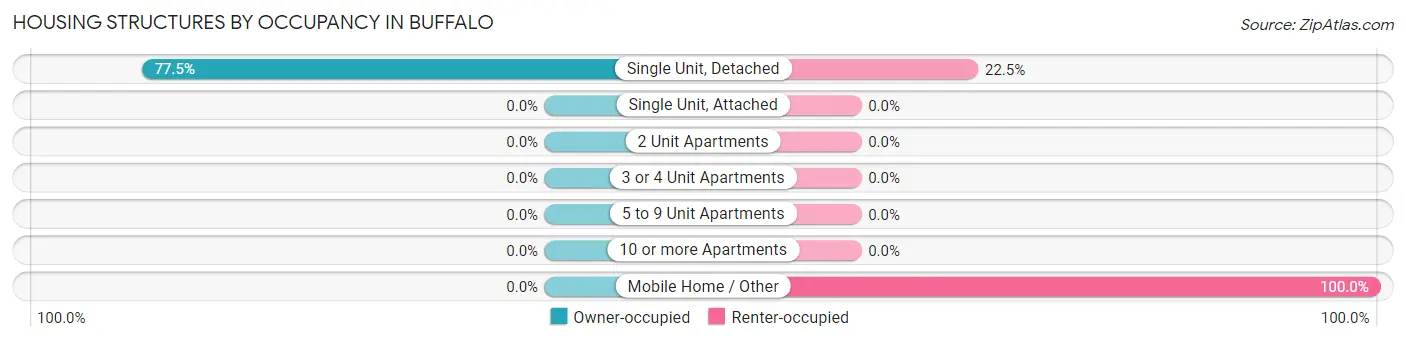
| Structure Type | Owner-occupied | Renter-occupied |
| Single Unit, Detached | 210 (77.5%) | 61 (22.5%) |
| Single Unit, Attached | 0 (0.0%) | 0 (0.0%) |
| 2 Unit Apartments | 0 (0.0%) | 0 (0.0%) |
| 3 or 4 Unit Apartments | 0 (0.0%) | 0 (0.0%) |
| 5 to 9 Unit Apartments | 0 (0.0%) | 0 (0.0%) |
| 10 or more Apartments | 0 (0.0%) | 0 (0.0%) |
| Mobile Home / Other | 0 (0.0%) | 15 (100.0%) |
| Total | 210 (73.4%) | 76 (26.6%) |
Housing Structures by Number of Rooms in Buffalo
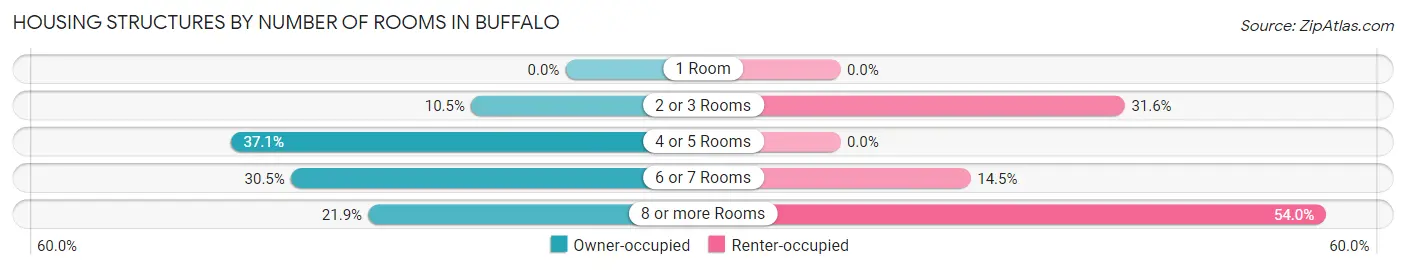
| Number of Rooms | Owner-occupied | Renter-occupied |
| 1 Room | 0 (0.0%) | 0 (0.0%) |
| 2 or 3 Rooms | 22 (10.5%) | 24 (31.6%) |
| 4 or 5 Rooms | 78 (37.1%) | 0 (0.0%) |
| 6 or 7 Rooms | 64 (30.5%) | 11 (14.5%) |
| 8 or more Rooms | 46 (21.9%) | 41 (53.9%) |
| Total | 210 (100.0%) | 76 (100.0%) |
Housing Structure by Heating Type in Buffalo
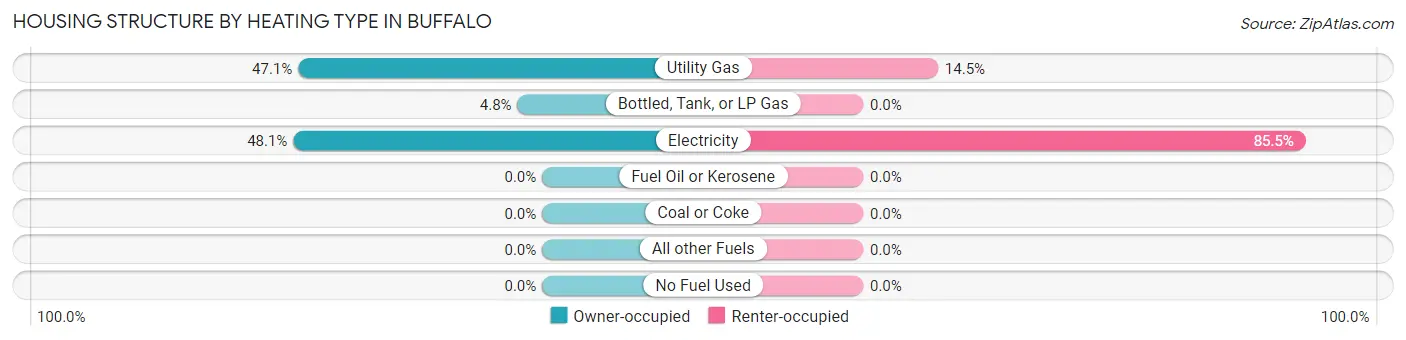
| Heating Type | Owner-occupied | Renter-occupied |
| Utility Gas | 99 (47.1%) | 11 (14.5%) |
| Bottled, Tank, or LP Gas | 10 (4.8%) | 0 (0.0%) |
| Electricity | 101 (48.1%) | 65 (85.5%) |
| Fuel Oil or Kerosene | 0 (0.0%) | 0 (0.0%) |
| Coal or Coke | 0 (0.0%) | 0 (0.0%) |
| All other Fuels | 0 (0.0%) | 0 (0.0%) |
| No Fuel Used | 0 (0.0%) | 0 (0.0%) |
| Total | 210 (100.0%) | 76 (100.0%) |
Household Vehicle Usage in Buffalo
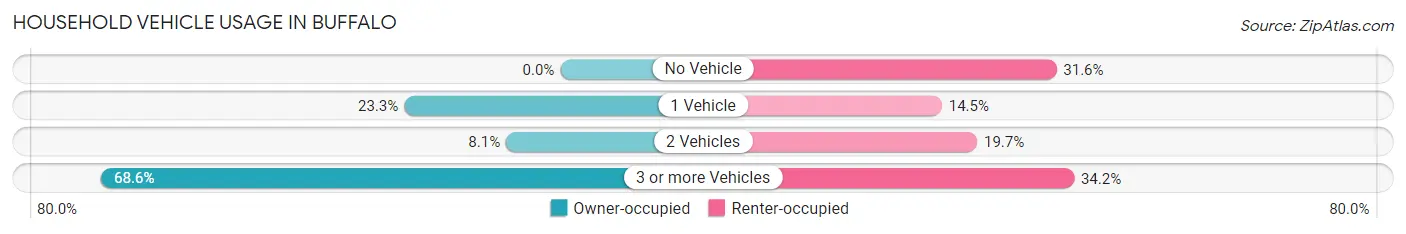
| Vehicles per Household | Owner-occupied | Renter-occupied |
| No Vehicle | 0 (0.0%) | 24 (31.6%) |
| 1 Vehicle | 49 (23.3%) | 11 (14.5%) |
| 2 Vehicles | 17 (8.1%) | 15 (19.7%) |
| 3 or more Vehicles | 144 (68.6%) | 26 (34.2%) |
| Total | 210 (100.0%) | 76 (100.0%) |
Real Estate & Mortgages in Buffalo
Real Estate and Mortgage Overview in Buffalo
| Characteristic | Without Mortgage | With Mortgage |
| Housing Units | 133 | 77 |
| Median Property Value | $267,100 | $204,900 |
| Median Household Income | $29,266 | $6 |
| Monthly Housing Costs | $409 | $0 |
| Real Estate Taxes | $710 | $0 |
Property Value by Mortgage Status in Buffalo
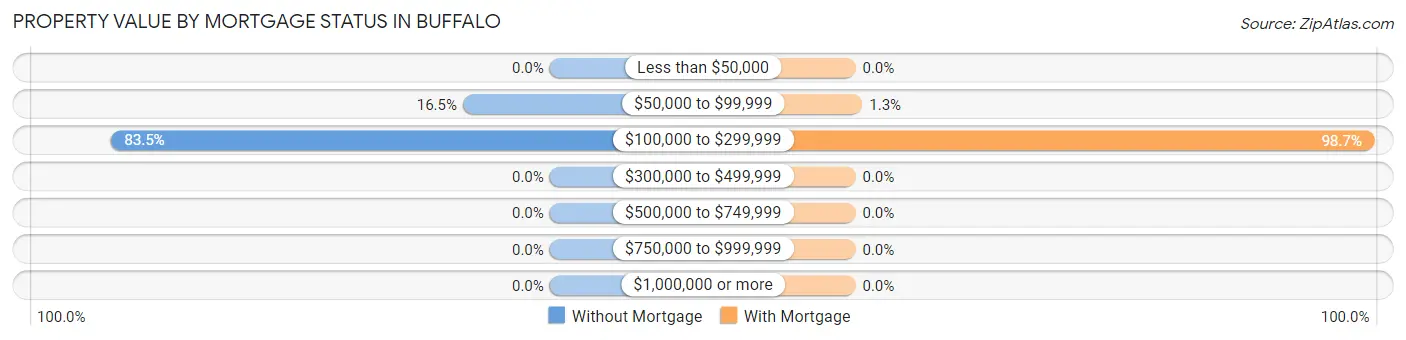
| Property Value | Without Mortgage | With Mortgage |
| Less than $50,000 | 0 (0.0%) | 0 (0.0%) |
| $50,000 to $99,999 | 22 (16.5%) | 1 (1.3%) |
| $100,000 to $299,999 | 111 (83.5%) | 76 (98.7%) |
| $300,000 to $499,999 | 0 (0.0%) | 0 (0.0%) |
| $500,000 to $749,999 | 0 (0.0%) | 0 (0.0%) |
| $750,000 to $999,999 | 0 (0.0%) | 0 (0.0%) |
| $1,000,000 or more | 0 (0.0%) | 0 (0.0%) |
| Total | 133 (100.0%) | 77 (100.0%) |
Household Income by Mortgage Status in Buffalo
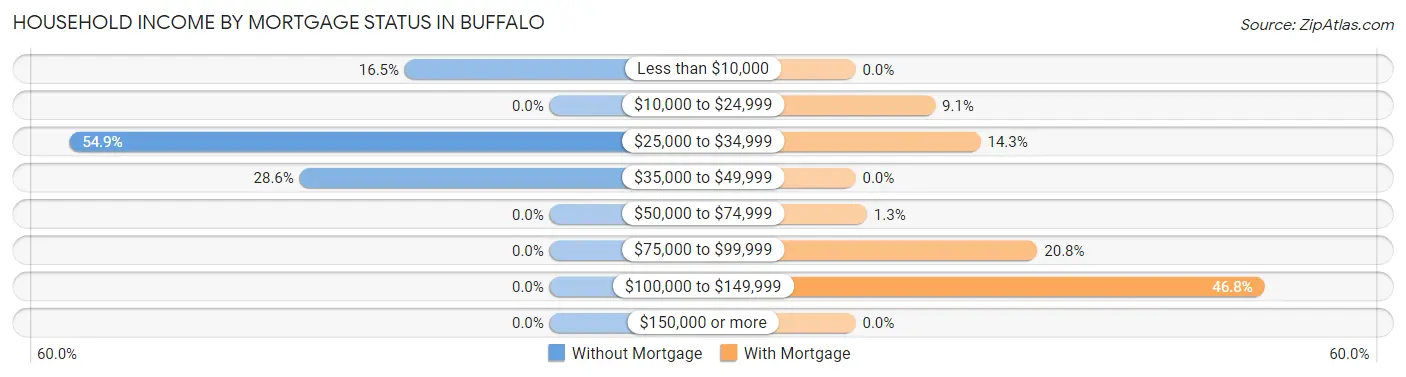
| Household Income | Without Mortgage | With Mortgage |
| Less than $10,000 | 22 (16.5%) | 0 (0.0%) |
| $10,000 to $24,999 | 0 (0.0%) | 7 (9.1%) |
| $25,000 to $34,999 | 73 (54.9%) | 11 (14.3%) |
| $35,000 to $49,999 | 38 (28.6%) | 0 (0.0%) |
| $50,000 to $74,999 | 0 (0.0%) | 1 (1.3%) |
| $75,000 to $99,999 | 0 (0.0%) | 16 (20.8%) |
| $100,000 to $149,999 | 0 (0.0%) | 36 (46.8%) |
| $150,000 or more | 0 (0.0%) | 0 (0.0%) |
| Total | 133 (100.0%) | 77 (100.0%) |
Property Value to Household Income Ratio in Buffalo
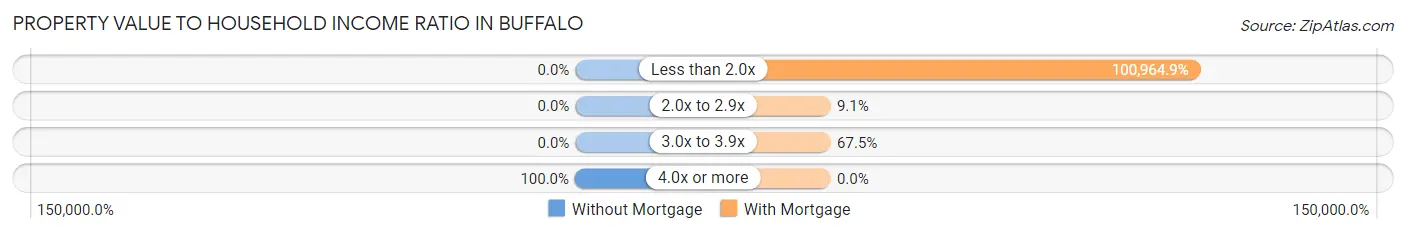
| Value-to-Income Ratio | Without Mortgage | With Mortgage |
| Less than 2.0x | 0 (0.0%) | 77,743 (100,964.9%) |
| 2.0x to 2.9x | 0 (0.0%) | 7 (9.1%) |
| 3.0x to 3.9x | 0 (0.0%) | 52 (67.5%) |
| 4.0x or more | 133 (100.0%) | 0 (0.0%) |
| Total | 133 (100.0%) | 77 (100.0%) |
Real Estate Taxes by Mortgage Status in Buffalo
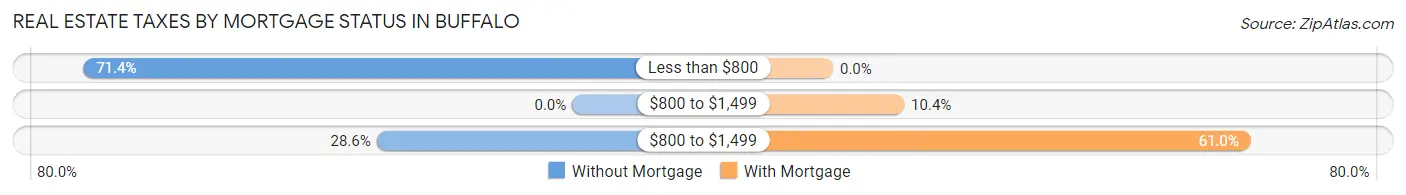
| Property Taxes | Without Mortgage | With Mortgage |
| Less than $800 | 95 (71.4%) | 0 (0.0%) |
| $800 to $1,499 | 0 (0.0%) | 8 (10.4%) |
| $800 to $1,499 | 38 (28.6%) | 47 (61.0%) |
| Total | 133 (100.0%) | 77 (100.0%) |
Health & Disability in Buffalo
Health Insurance Coverage by Age in Buffalo
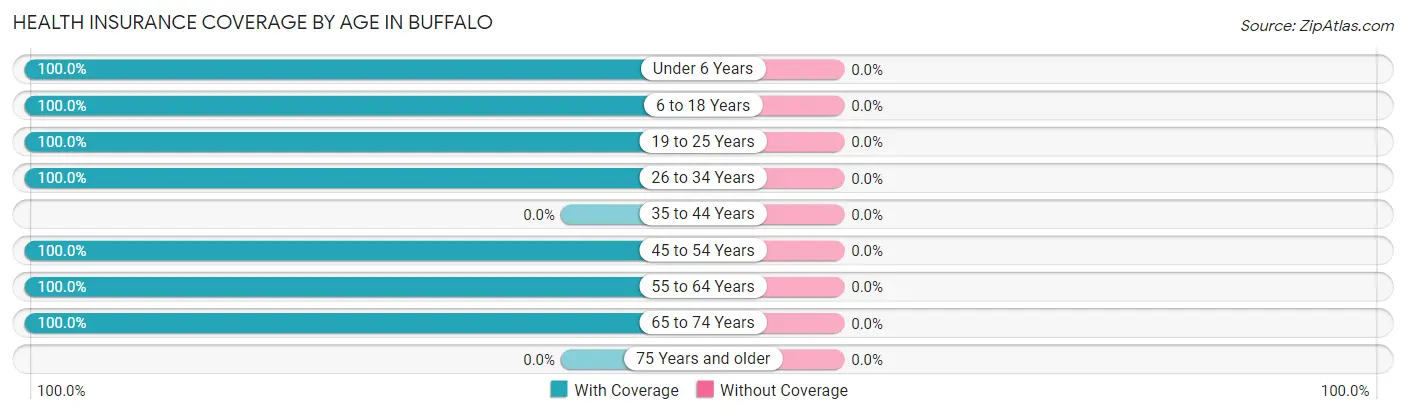
| Age Bracket | With Coverage | Without Coverage |
| Under 6 Years | 20 (100.0%) | 0 (0.0%) |
| 6 to 18 Years | 93 (100.0%) | 0 (0.0%) |
| 19 to 25 Years | 116 (100.0%) | 0 (0.0%) |
| 26 to 34 Years | 63 (100.0%) | 0 (0.0%) |
| 35 to 44 Years | 0 (0.0%) | 0 (0.0%) |
| 45 to 54 Years | 17 (100.0%) | 0 (0.0%) |
| 55 to 64 Years | 121 (100.0%) | 0 (0.0%) |
| 65 to 74 Years | 135 (100.0%) | 0 (0.0%) |
| 75 Years and older | 0 (0.0%) | 0 (0.0%) |
| Total | 565 (100.0%) | 0 (0.0%) |
Health Insurance Coverage by Citizenship Status in Buffalo
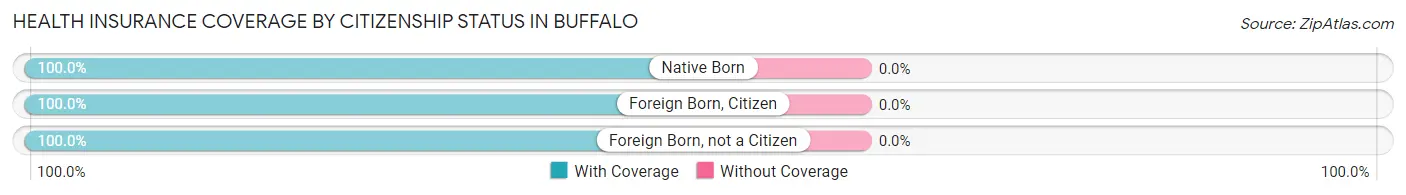
| Citizenship Status | With Coverage | Without Coverage |
| Native Born | 20 (100.0%) | 0 (0.0%) |
| Foreign Born, Citizen | 93 (100.0%) | 0 (0.0%) |
| Foreign Born, not a Citizen | 116 (100.0%) | 0 (0.0%) |
Health Insurance Coverage by Household Income in Buffalo
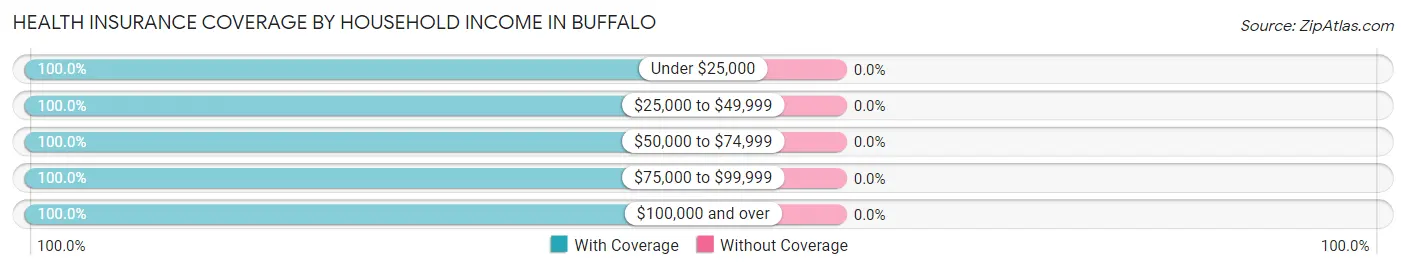
| Household Income | With Coverage | Without Coverage |
| Under $25,000 | 161 (100.0%) | 0 (0.0%) |
| $25,000 to $49,999 | 190 (100.0%) | 0 (0.0%) |
| $50,000 to $74,999 | 80 (100.0%) | 0 (0.0%) |
| $75,000 to $99,999 | 110 (100.0%) | 0 (0.0%) |
| $100,000 and over | 24 (100.0%) | 0 (0.0%) |
Public vs Private Health Insurance Coverage by Age in Buffalo
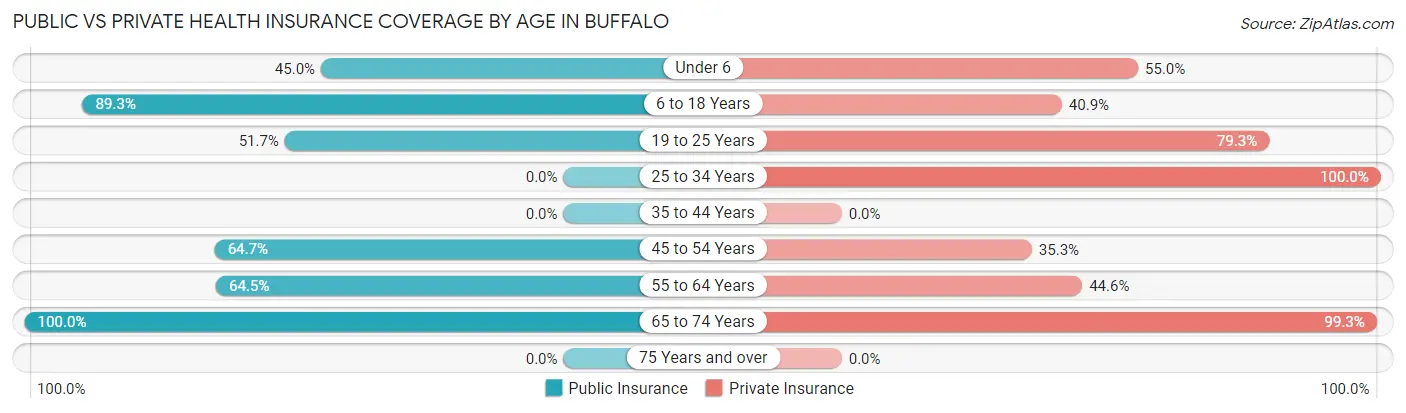
| Age Bracket | Public Insurance | Private Insurance |
| Under 6 | 9 (45.0%) | 11 (55.0%) |
| 6 to 18 Years | 83 (89.2%) | 38 (40.9%) |
| 19 to 25 Years | 60 (51.7%) | 92 (79.3%) |
| 25 to 34 Years | 0 (0.0%) | 63 (100.0%) |
| 35 to 44 Years | 0 (0.0%) | 0 (0.0%) |
| 45 to 54 Years | 11 (64.7%) | 6 (35.3%) |
| 55 to 64 Years | 78 (64.5%) | 54 (44.6%) |
| 65 to 74 Years | 135 (100.0%) | 134 (99.3%) |
| 75 Years and over | 0 (0.0%) | 0 (0.0%) |
| Total | 376 (66.5%) | 398 (70.4%) |
Disability Status by Sex by Age in Buffalo
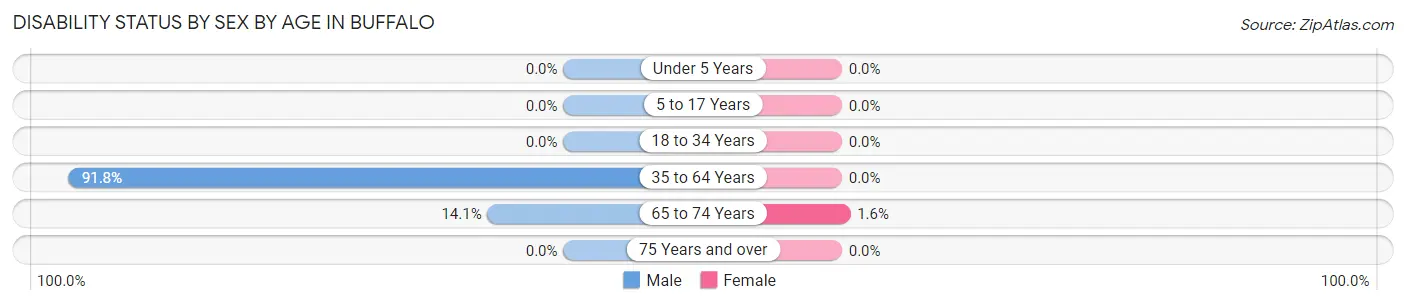
| Age Bracket | Male | Female |
| Under 5 Years | 0 (0.0%) | 0 (0.0%) |
| 5 to 17 Years | 0 (0.0%) | 0 (0.0%) |
| 18 to 34 Years | 0 (0.0%) | 0 (0.0%) |
| 35 to 64 Years | 67 (91.8%) | 0 (0.0%) |
| 65 to 74 Years | 10 (14.1%) | 1 (1.6%) |
| 75 Years and over | 0 (0.0%) | 0 (0.0%) |
Disability Class by Sex by Age in Buffalo
Disability Class: Hearing Difficulty
| Age Bracket | Male | Female |
| Under 5 Years | 0 (0.0%) | 0 (0.0%) |
| 5 to 17 Years | 0 (0.0%) | 0 (0.0%) |
| 18 to 34 Years | 0 (0.0%) | 0 (0.0%) |
| 35 to 64 Years | 0 (0.0%) | 0 (0.0%) |
| 65 to 74 Years | 0 (0.0%) | 0 (0.0%) |
| 75 Years and over | 0 (0.0%) | 0 (0.0%) |
Disability Class: Vision Difficulty
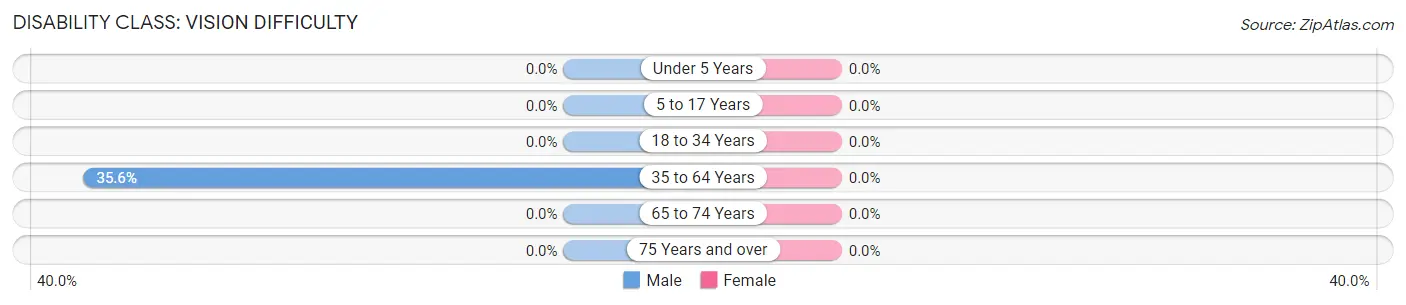
| Age Bracket | Male | Female |
| Under 5 Years | 0 (0.0%) | 0 (0.0%) |
| 5 to 17 Years | 0 (0.0%) | 0 (0.0%) |
| 18 to 34 Years | 0 (0.0%) | 0 (0.0%) |
| 35 to 64 Years | 26 (35.6%) | 0 (0.0%) |
| 65 to 74 Years | 0 (0.0%) | 0 (0.0%) |
| 75 Years and over | 0 (0.0%) | 0 (0.0%) |
Disability Class: Cognitive Difficulty
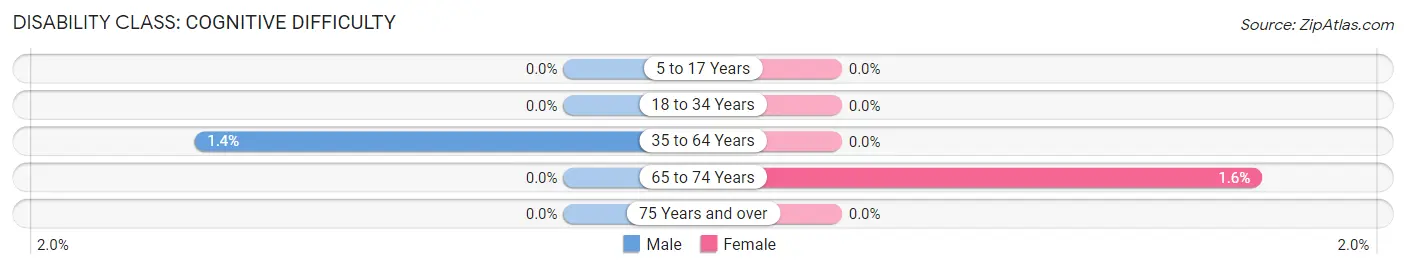
| Age Bracket | Male | Female |
| 5 to 17 Years | 0 (0.0%) | 0 (0.0%) |
| 18 to 34 Years | 0 (0.0%) | 0 (0.0%) |
| 35 to 64 Years | 1 (1.4%) | 0 (0.0%) |
| 65 to 74 Years | 0 (0.0%) | 1 (1.6%) |
| 75 Years and over | 0 (0.0%) | 0 (0.0%) |
Disability Class: Ambulatory Difficulty
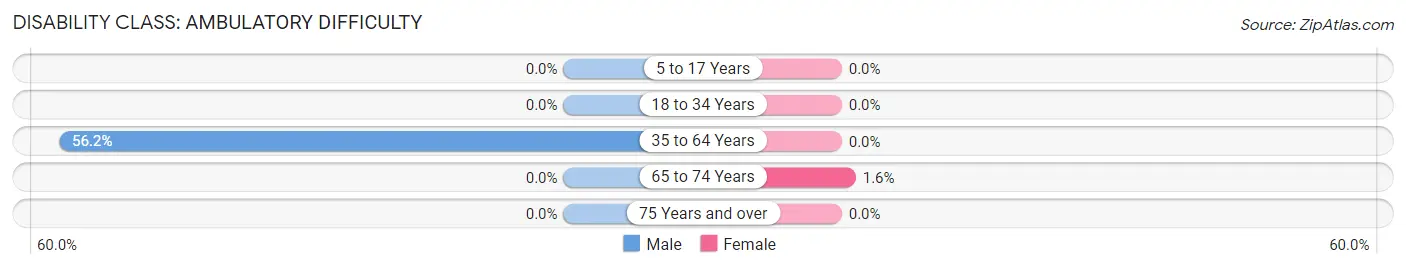
| Age Bracket | Male | Female |
| 5 to 17 Years | 0 (0.0%) | 0 (0.0%) |
| 18 to 34 Years | 0 (0.0%) | 0 (0.0%) |
| 35 to 64 Years | 41 (56.2%) | 0 (0.0%) |
| 65 to 74 Years | 0 (0.0%) | 1 (1.6%) |
| 75 Years and over | 0 (0.0%) | 0 (0.0%) |
Disability Class: Self-Care Difficulty
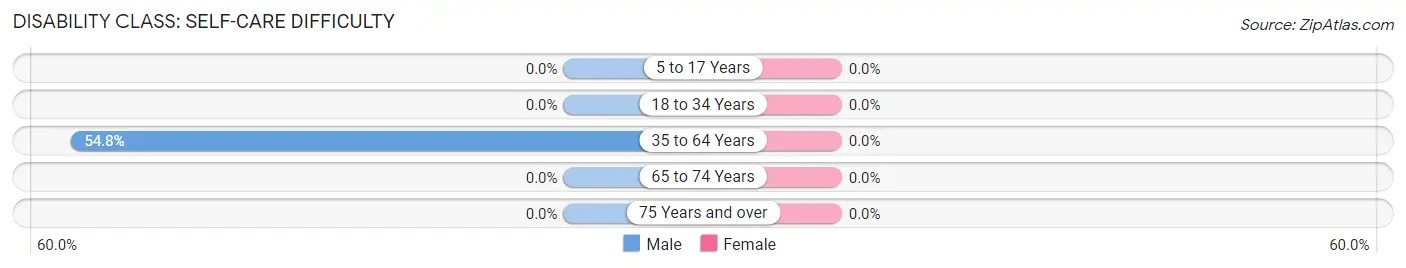
| Age Bracket | Male | Female |
| 5 to 17 Years | 0 (0.0%) | 0 (0.0%) |
| 18 to 34 Years | 0 (0.0%) | 0 (0.0%) |
| 35 to 64 Years | 40 (54.8%) | 0 (0.0%) |
| 65 to 74 Years | 0 (0.0%) | 0 (0.0%) |
| 75 Years and over | 0 (0.0%) | 0 (0.0%) |
Technology Access in Buffalo
Computing Device Access in Buffalo
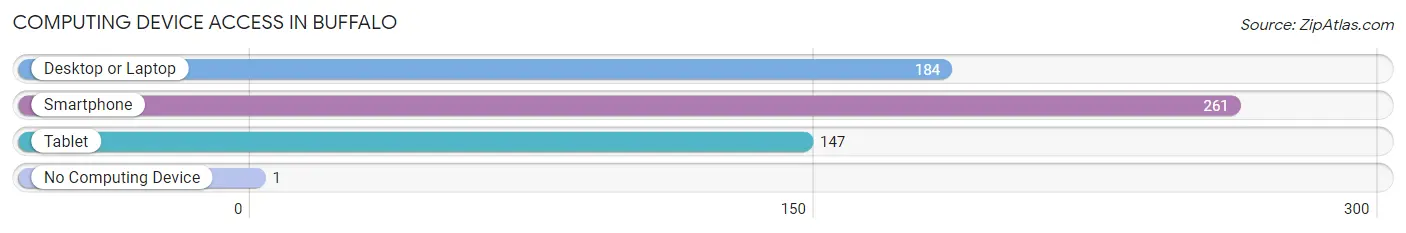
| Device Type | # Households | % Households |
| Desktop or Laptop | 184 | 64.3% |
| Smartphone | 261 | 91.3% |
| Tablet | 147 | 51.4% |
| No Computing Device | 1 | 0.4% |
| Total | 286 | 100.0% |
Internet Access in Buffalo
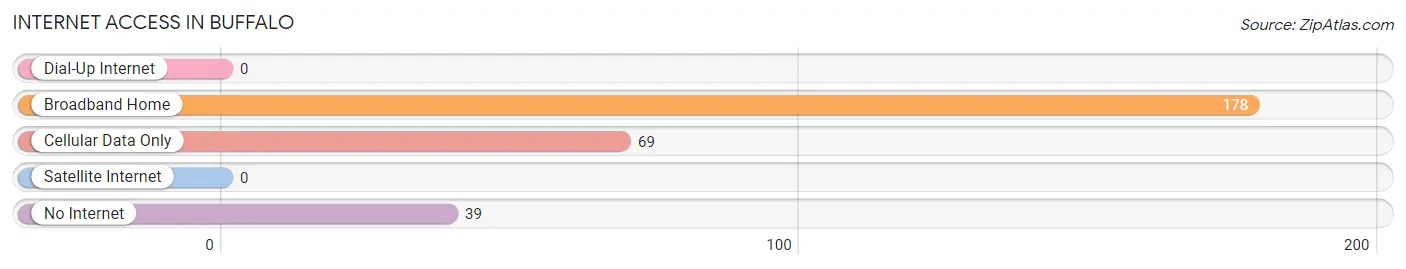
| Internet Type | # Households | % Households |
| Dial-Up Internet | 0 | 0.0% |
| Broadband Home | 178 | 62.2% |
| Cellular Data Only | 69 | 24.1% |
| Satellite Internet | 0 | 0.0% |
| No Internet | 39 | 13.6% |
| Total | 286 | 100.0% |
Buffalo Summary
Buffalo, Kentucky is a small unincorporated community located in Warren County, Kentucky. It is situated on the banks of the Green River, approximately 10 miles south of Bowling Green. The population of Buffalo was estimated to be around 200 people in 2020.
History
Buffalo was first settled in the early 1800s by a group of settlers from Virginia. The town was named after the nearby Buffalo Creek, which was named for the large number of buffalo that roamed the area. The town was incorporated in 1820 and was a thriving community for many years. It was home to a variety of businesses, including a general store, a blacksmith shop, a grist mill, and a sawmill.
In the late 1800s, the town began to decline as the railroad bypassed it and the population began to move away. By the early 1900s, the town had become a ghost town. In the 1950s, the town was revived when the Green River was dammed and the lake created. The lake brought new life to the area and the town began to grow again.
Geography
Buffalo is located in Warren County, Kentucky, approximately 10 miles south of Bowling Green. It is situated on the banks of the Green River, which is part of the Cumberland River system. The town is surrounded by rolling hills and farmland. The climate in Buffalo is humid subtropical, with hot summers and mild winters.
Economy
The economy of Buffalo is largely based on agriculture and tourism. The town is home to several farms, which produce a variety of crops, including corn, soybeans, and wheat. The town is also home to several tourist attractions, including the Green River Lake State Park, which offers camping, fishing, and boating.
Demographics
According to the 2010 census, the population of Buffalo was estimated to be around 200 people. The racial makeup of the town was 97.5% White, 0.5% African American, 0.5% Native American, and 1.5% from other races. The median household income in Buffalo was $35,000, and the median home value was $90,000.
Conclusion
Buffalo, Kentucky is a small unincorporated community located in Warren County, Kentucky. It is situated on the banks of the Green River, approximately 10 miles south of Bowling Green. The population of Buffalo was estimated to be around 200 people in 2020. The economy of Buffalo is largely based on agriculture and tourism, and the town is home to several farms and tourist attractions. The racial makeup of the town was 97.5% White, 0.5% African American, 0.5% Native American, and 1.5% from other races. The median household income in Buffalo was $35,000, and the median home value was $90,000.
Common Questions
What is Per Capita Income in Buffalo?
Per Capita income in Buffalo is $19,036.
What is the Median Family Income in Buffalo?
Median Family Income in Buffalo is $29,286.
What is the Median Household income in Buffalo?
Median Household Income in Buffalo is $29,291.
What is Income or Wage Gap in Buffalo?
Income or Wage Gap in Buffalo is 25.4%.
Women in Buffalo earn 74.6 cents for every dollar earned by a man.
What is Inequality or Gini Index in Buffalo?
Inequality or Gini Index in Buffalo is 0.45.
What is the Total Population of Buffalo?
Total Population of Buffalo is 565.
What is the Total Male Population of Buffalo?
Total Male Population of Buffalo is 316.
What is the Total Female Population of Buffalo?
Total Female Population of Buffalo is 249.
What is the Ratio of Males per 100 Females in Buffalo?
There are 126.91 Males per 100 Females in Buffalo.
What is the Ratio of Females per 100 Males in Buffalo?
There are 78.80 Females per 100 Males in Buffalo.
What is the Median Population Age in Buffalo?
Median Population Age in Buffalo is 34.4 Years.
What is the Average Family Size in Buffalo
Average Family Size in Buffalo is 2.4 People.
What is the Average Household Size in Buffalo
Average Household Size in Buffalo is 2.0 People.
How Large is the Labor Force in Buffalo?
There are 195 People in the Labor Forcein in Buffalo.
What is the Percentage of People in the Labor Force in Buffalo?
41.9% of People are in the Labor Force in Buffalo.