Eubank, KY Map & Demographics
Eubank Map
Eubank Overview
$20,280
PER CAPITA INCOME
$46,875
AVG FAMILY INCOME
$44,205
AVG HOUSEHOLD INCOME
0.38
INEQUALITY / GINI INDEX
471
TOTAL POPULATION
242
MALE POPULATION
229
FEMALE POPULATION
105.68
MALES / 100 FEMALES
94.63
FEMALES / 100 MALES
33.4
MEDIAN AGE
3.1
AVG FAMILY SIZE
2.8
AVG HOUSEHOLD SIZE
193
LABOR FORCE [ PEOPLE ]
50.3%
PERCENT IN LABOR FORCE
13.0%
UNEMPLOYMENT RATE
Eubank Zip Codes
Eubank Area Codes
Income in Eubank
Income Overview in Eubank
Per Capita Income in Eubank is $20,280, while median incomes of families and households are $46,875 and $44,205 respectively.
| Characteristic | Number | Measure |
| Per Capita Income | 471 | $20,280 |
| Median Family Income | 128 | $46,875 |
| Mean Family Income | 128 | $47,680 |
| Median Household Income | 171 | $44,205 |
| Mean Household Income | 171 | $52,667 |
| Income Deficit | 128 | $0 |
| Wage / Income Gap (%) | 471 | 0.00% |
| Wage / Income Gap ($) | 471 | 100.00¢ per $1 |
| Gini / Inequality Index | 471 | 0.38 |
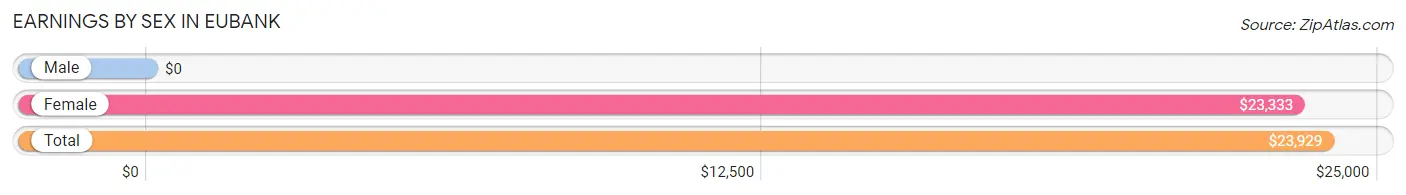
Earnings by Sex in Eubank
| Sex | Number | Average Earnings |
| Male | 96 (51.1%) | $0 |
| Female | 92 (48.9%) | $23,333 |
| Total | 188 (100.0%) | $23,929 |
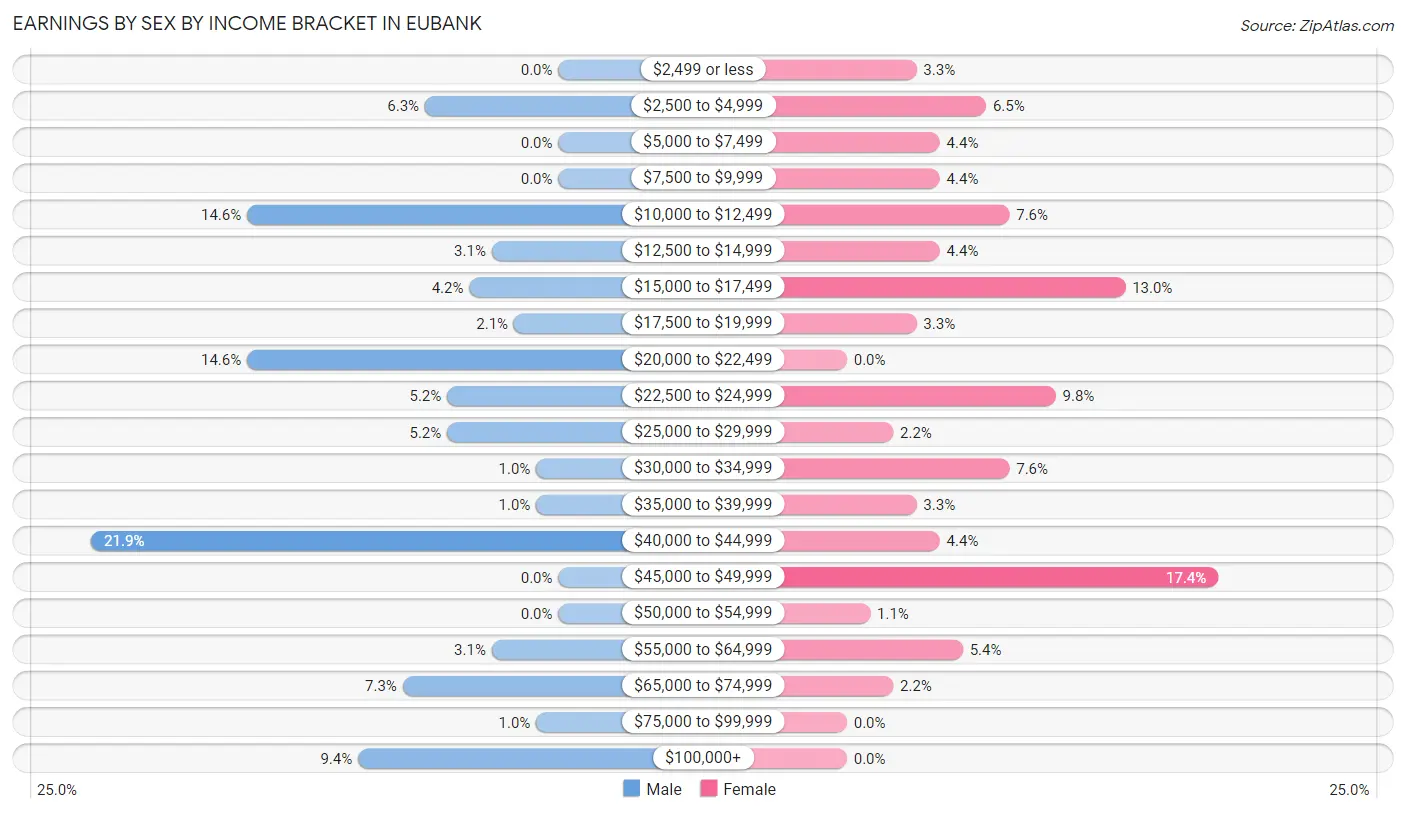
Earnings by Sex by Income Bracket in Eubank
The most common earnings brackets in Eubank are $40,000 to $44,999 for men (21 | 21.9%) and $45,000 to $49,999 for women (16 | 17.4%).
| Income | Male | Female |
| $2,499 or less | 0 (0.0%) | 3 (3.3%) |
| $2,500 to $4,999 | 6 (6.2%) | 6 (6.5%) |
| $5,000 to $7,499 | 0 (0.0%) | 4 (4.3%) |
| $7,500 to $9,999 | 0 (0.0%) | 4 (4.3%) |
| $10,000 to $12,499 | 14 (14.6%) | 7 (7.6%) |
| $12,500 to $14,999 | 3 (3.1%) | 4 (4.3%) |
| $15,000 to $17,499 | 4 (4.2%) | 12 (13.0%) |
| $17,500 to $19,999 | 2 (2.1%) | 3 (3.3%) |
| $20,000 to $22,499 | 14 (14.6%) | 0 (0.0%) |
| $22,500 to $24,999 | 5 (5.2%) | 9 (9.8%) |
| $25,000 to $29,999 | 5 (5.2%) | 2 (2.2%) |
| $30,000 to $34,999 | 1 (1.0%) | 7 (7.6%) |
| $35,000 to $39,999 | 1 (1.0%) | 3 (3.3%) |
| $40,000 to $44,999 | 21 (21.9%) | 4 (4.3%) |
| $45,000 to $49,999 | 0 (0.0%) | 16 (17.4%) |
| $50,000 to $54,999 | 0 (0.0%) | 1 (1.1%) |
| $55,000 to $64,999 | 3 (3.1%) | 5 (5.4%) |
| $65,000 to $74,999 | 7 (7.3%) | 2 (2.2%) |
| $75,000 to $99,999 | 1 (1.0%) | 0 (0.0%) |
| $100,000+ | 9 (9.4%) | 0 (0.0%) |
| Total | 96 (100.0%) | 92 (100.0%) |
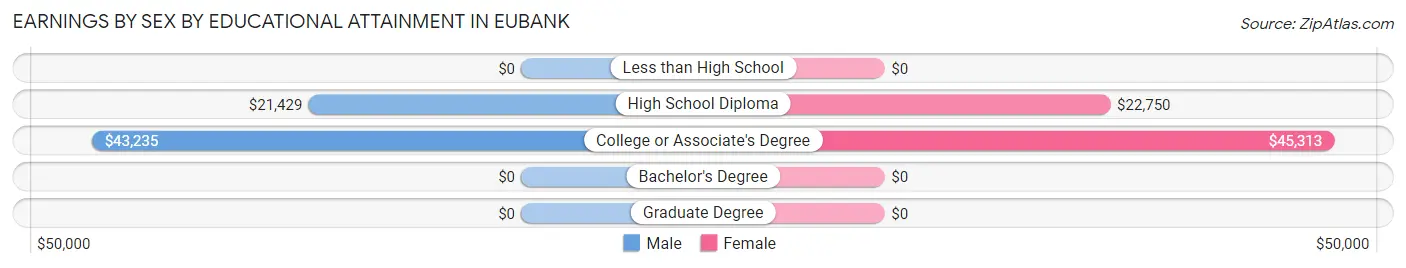
Earnings by Sex by Educational Attainment in Eubank
| Educational Attainment | Male Income | Female Income |
| Less than High School | - | - |
| High School Diploma | $21,429 | $22,750 |
| College or Associate's Degree | $43,235 | $45,313 |
| Bachelor's Degree | - | - |
| Graduate Degree | - | - |
| Total | - | - |
Family Income in Eubank
Family Income Brackets in Eubank
According to the Eubank family income data, there are 50 families falling into the $50,000 to $74,999 income range, which is the most common income bracket and makes up 39.1% of all families.
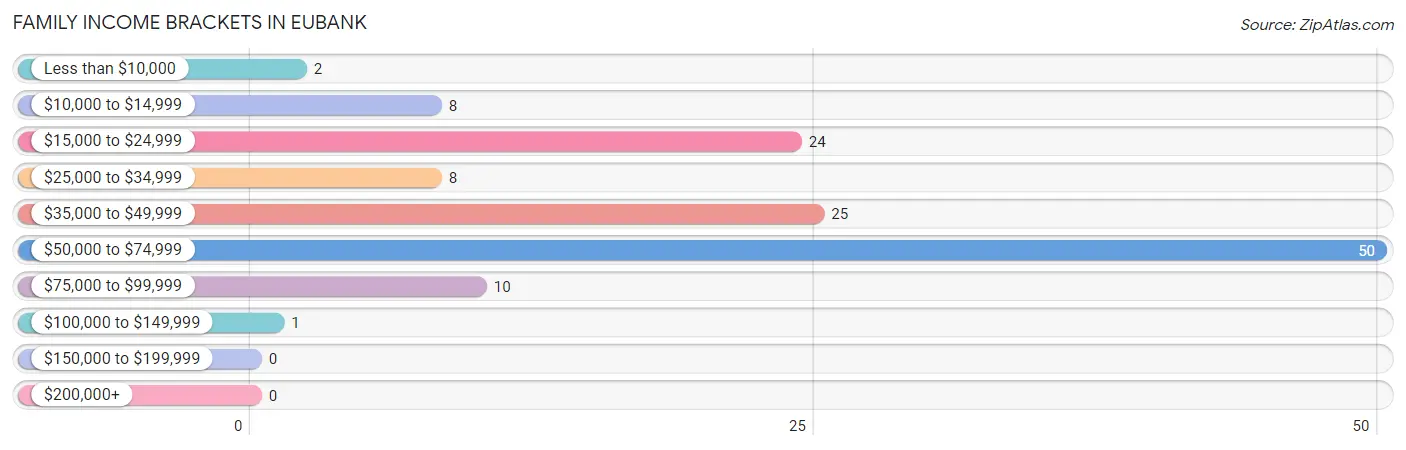
| Income Bracket | # Families | % Families |
| Less than $10,000 | 2 | 1.6% |
| $10,000 to $14,999 | 8 | 6.3% |
| $15,000 to $24,999 | 24 | 18.8% |
| $25,000 to $34,999 | 8 | 6.3% |
| $35,000 to $49,999 | 25 | 19.5% |
| $50,000 to $74,999 | 50 | 39.1% |
| $75,000 to $99,999 | 10 | 7.8% |
| $100,000 to $149,999 | 1 | 0.8% |
| $150,000 to $199,999 | 0 | 0.0% |
| $200,000+ | 0 | 0.0% |
Family Income by Famaliy Size in Eubank
2-person families (66 | 51.6%) account for the highest median family income in Eubank with $51,250 per family, while 2-person families (66 | 51.6%) have the highest median income of $25,625 per family member.
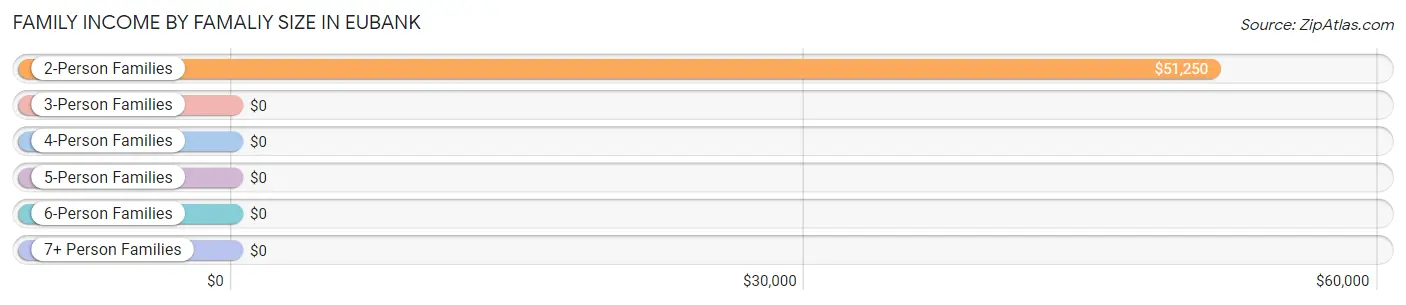
| Income Bracket | # Families | Median Income |
| 2-Person Families | 66 (51.6%) | $51,250 |
| 3-Person Families | 32 (25.0%) | $0 |
| 4-Person Families | 9 (7.0%) | $0 |
| 5-Person Families | 16 (12.5%) | $0 |
| 6-Person Families | 5 (3.9%) | $0 |
| 7+ Person Families | 0 (0.0%) | $0 |
| Total | 128 (100.0%) | $46,875 |
Family Income by Number of Earners in Eubank
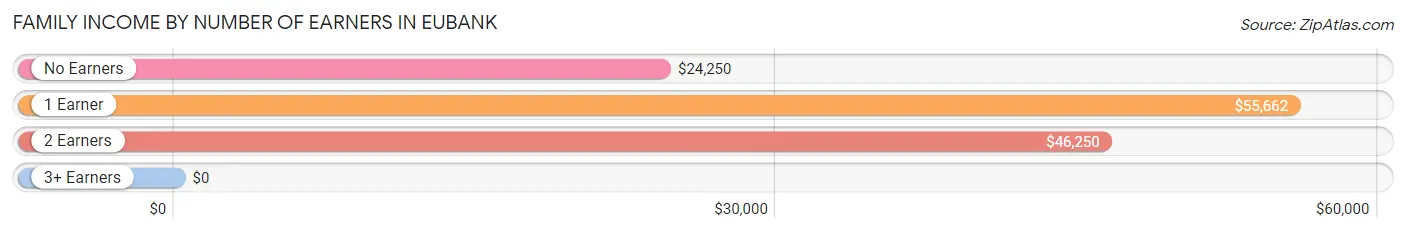
| Number of Earners | # Families | Median Income |
| No Earners | 20 (15.6%) | $24,250 |
| 1 Earner | 73 (57.0%) | $55,662 |
| 2 Earners | 33 (25.8%) | $46,250 |
| 3+ Earners | 2 (1.6%) | $0 |
| Total | 128 (100.0%) | $46,875 |
Household Income in Eubank
Household Income Brackets in Eubank
With 57 households falling in the category, the $50,000 to $74,999 income range is the most frequent in Eubank, accounting for 33.3% of all households.
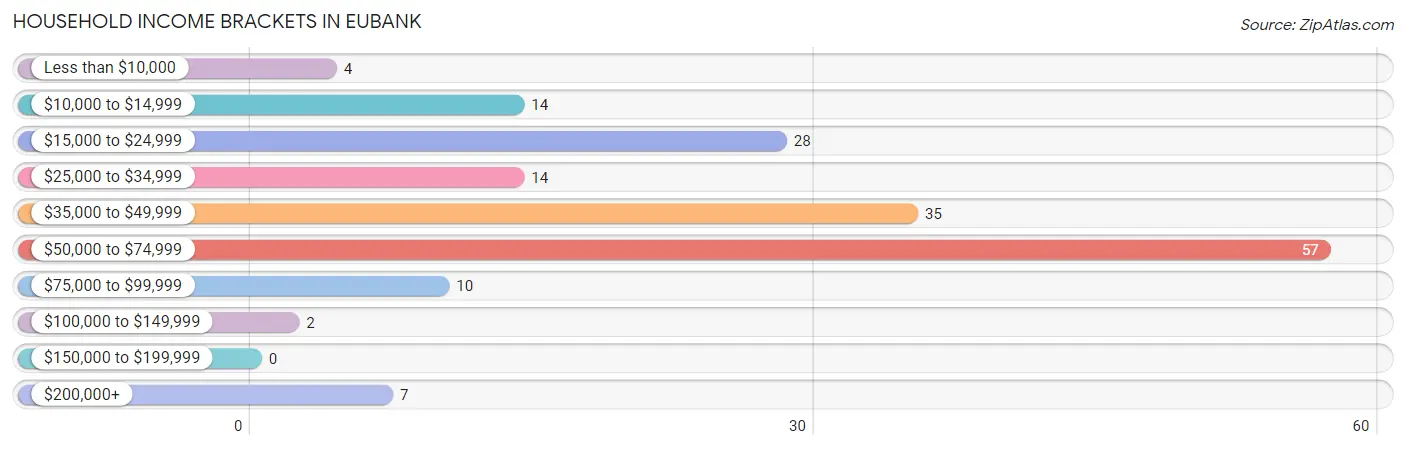
| Income Bracket | # Households | % Households |
| Less than $10,000 | 4 | 2.3% |
| $10,000 to $14,999 | 14 | 8.2% |
| $15,000 to $24,999 | 28 | 16.4% |
| $25,000 to $34,999 | 14 | 8.2% |
| $35,000 to $49,999 | 35 | 20.5% |
| $50,000 to $74,999 | 57 | 33.3% |
| $75,000 to $99,999 | 10 | 5.8% |
| $100,000 to $149,999 | 2 | 1.2% |
| $150,000 to $199,999 | 0 | 0.0% |
| $200,000+ | 7 | 4.1% |
Household Income by Householder Age in Eubank
The median household income in Eubank is $44,205, with the highest median household income of $70,625 found in the 25 to 44 years age bracket for the primary householder. A total of 44 households (25.7%) fall into this category. Meanwhile, the 15 to 24 years age bracket for the primary householder has the lowest median household income of $0, with 20 households (11.7%) in this group.
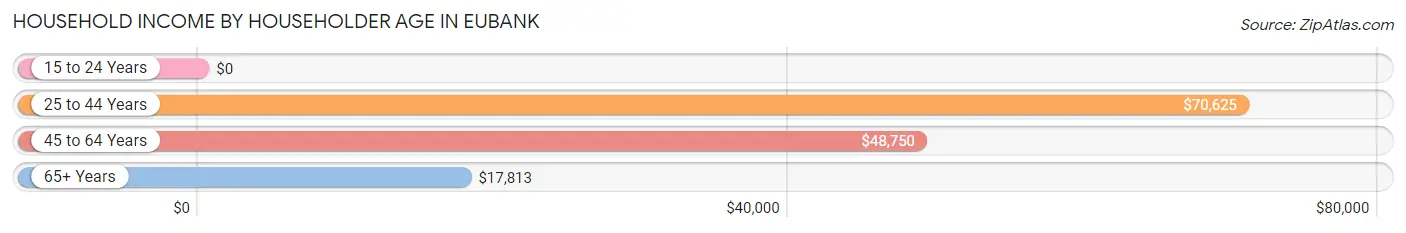
| Income Bracket | # Households | Median Income |
| 15 to 24 Years | 20 (11.7%) | $0 |
| 25 to 44 Years | 44 (25.7%) | $70,625 |
| 45 to 64 Years | 72 (42.1%) | $48,750 |
| 65+ Years | 35 (20.5%) | $17,813 |
| Total | 171 (100.0%) | $44,205 |
Poverty in Eubank
Income Below Poverty by Sex and Age in Eubank
With 15.3% poverty level for males and 23.3% for females among the residents of Eubank, under 5 year old males and under 5 year old females are the most vulnerable to poverty, with 13 males (81.2%) and 9 females (75.0%) in their respective age groups living below the poverty level.
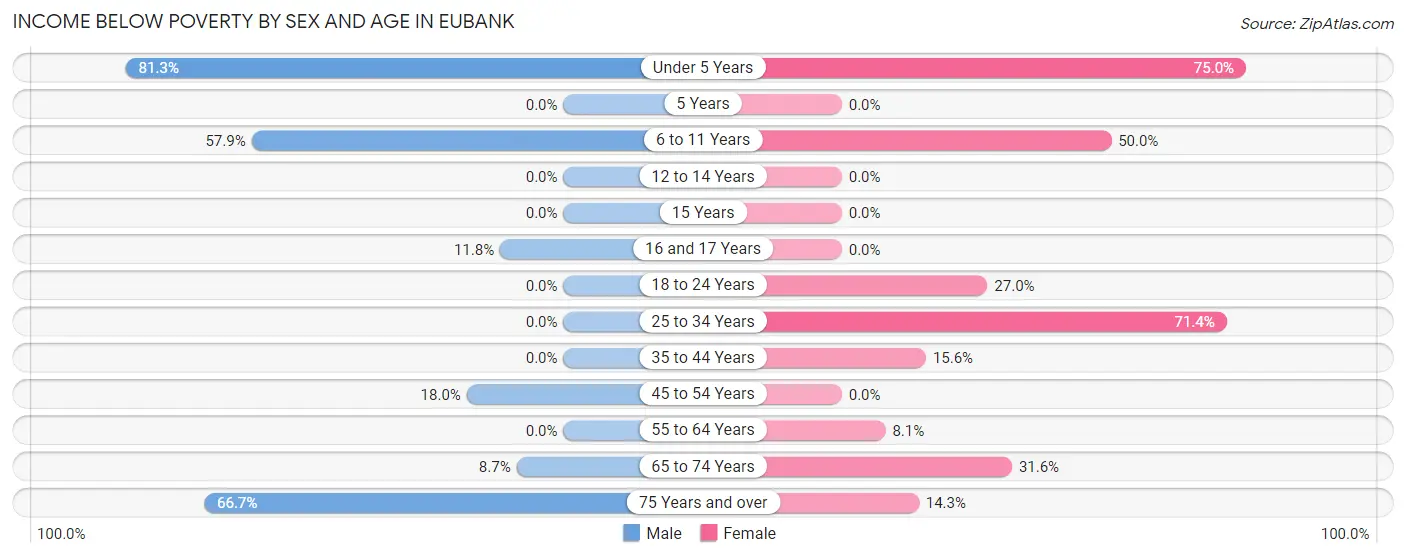
| Age Bracket | Male | Female |
| Under 5 Years | 13 (81.2%) | 9 (75.0%) |
| 5 Years | 0 (0.0%) | 0 (0.0%) |
| 6 to 11 Years | 11 (57.9%) | 8 (50.0%) |
| 12 to 14 Years | 0 (0.0%) | 0 (0.0%) |
| 15 Years | 0 (0.0%) | 0 (0.0%) |
| 16 and 17 Years | 2 (11.8%) | 0 (0.0%) |
| 18 to 24 Years | 0 (0.0%) | 10 (27.0%) |
| 25 to 34 Years | 0 (0.0%) | 10 (71.4%) |
| 35 to 44 Years | 0 (0.0%) | 5 (15.6%) |
| 45 to 54 Years | 7 (17.9%) | 0 (0.0%) |
| 55 to 64 Years | 0 (0.0%) | 3 (8.1%) |
| 65 to 74 Years | 2 (8.7%) | 6 (31.6%) |
| 75 Years and over | 2 (66.7%) | 1 (14.3%) |
| Total | 37 (15.3%) | 52 (23.3%) |
Income Above Poverty by Sex and Age in Eubank
According to the poverty statistics in Eubank, males aged 12 to 14 years and females aged 12 to 14 years are the age groups that are most secure financially, with 100.0% of males and 100.0% of females in these age groups living above the poverty line.
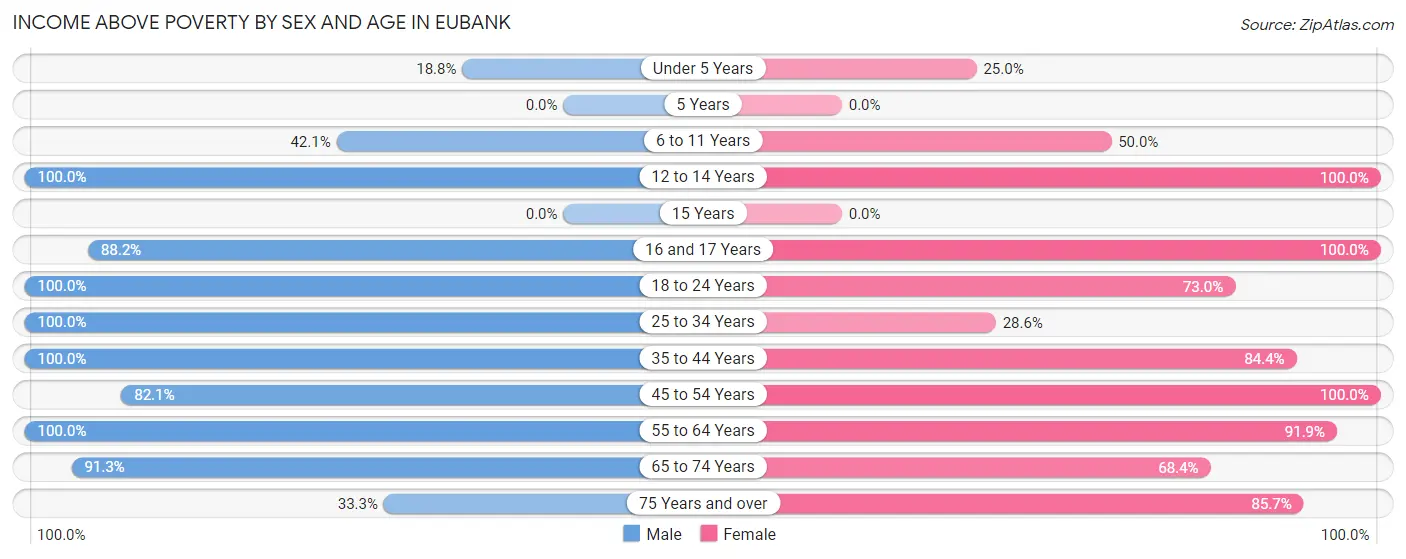
| Age Bracket | Male | Female |
| Under 5 Years | 3 (18.8%) | 3 (25.0%) |
| 5 Years | 0 (0.0%) | 0 (0.0%) |
| 6 to 11 Years | 8 (42.1%) | 8 (50.0%) |
| 12 to 14 Years | 14 (100.0%) | 4 (100.0%) |
| 15 Years | 0 (0.0%) | 0 (0.0%) |
| 16 and 17 Years | 15 (88.2%) | 8 (100.0%) |
| 18 to 24 Years | 28 (100.0%) | 27 (73.0%) |
| 25 to 34 Years | 47 (100.0%) | 4 (28.6%) |
| 35 to 44 Years | 19 (100.0%) | 27 (84.4%) |
| 45 to 54 Years | 32 (82.1%) | 37 (100.0%) |
| 55 to 64 Years | 17 (100.0%) | 34 (91.9%) |
| 65 to 74 Years | 21 (91.3%) | 13 (68.4%) |
| 75 Years and over | 1 (33.3%) | 6 (85.7%) |
| Total | 205 (84.7%) | 171 (76.7%) |
Income Below Poverty Among Married-Couple Families in Eubank
The poverty statistics for married-couple families in Eubank show that 3.6% or 3 of the total 83 families live below the poverty line. Families with no children have the highest poverty rate of 4.8%, comprising of 3 families. On the other hand, families with 1 or 2 children have the lowest poverty rate of 0.0%, which includes 0 families.
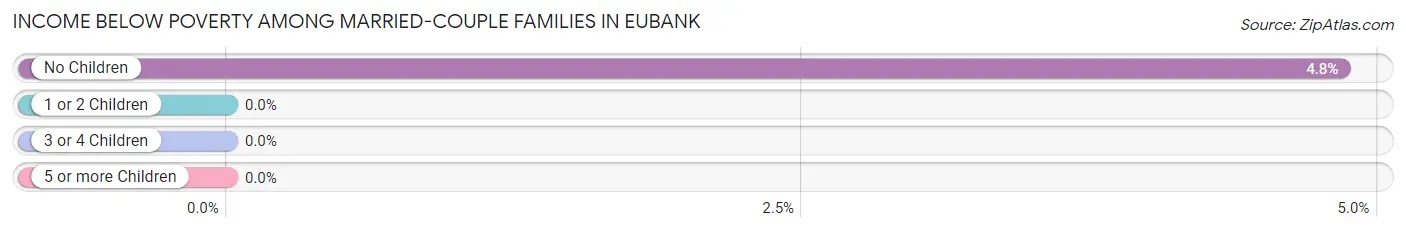
| Children | Above Poverty | Below Poverty |
| No Children | 59 (95.2%) | 3 (4.8%) |
| 1 or 2 Children | 21 (100.0%) | 0 (0.0%) |
| 3 or 4 Children | 0 (0.0%) | 0 (0.0%) |
| 5 or more Children | 0 (0.0%) | 0 (0.0%) |
| Total | 80 (96.4%) | 3 (3.6%) |
Income Below Poverty Among Single-Parent Households in Eubank
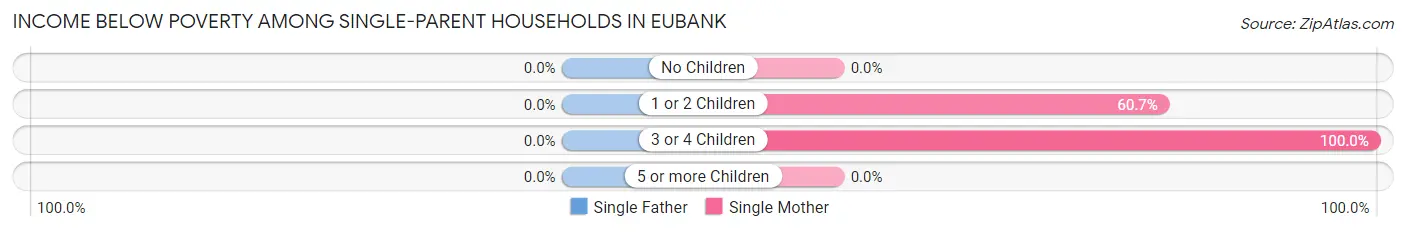
| Children | Single Father | Single Mother |
| No Children | 0 (0.0%) | 0 (0.0%) |
| 1 or 2 Children | 0 (0.0%) | 17 (60.7%) |
| 3 or 4 Children | 0 (0.0%) | 2 (100.0%) |
| 5 or more Children | 0 (0.0%) | 0 (0.0%) |
| Total | 0 (0.0%) | 19 (57.6%) |
Income Below Poverty Among Married-Couple vs Single-Parent Households in Eubank
The poverty data for Eubank shows that 3 of the married-couple family households (3.6%) and 19 of the single-parent households (42.2%) are living below the poverty level. Within the married-couple family households, those with no children have the highest poverty rate, with 3 households (4.8%) falling below the poverty line. Among the single-parent households, those with 3 or 4 children have the highest poverty rate, with 2 household (100.0%) living below poverty.
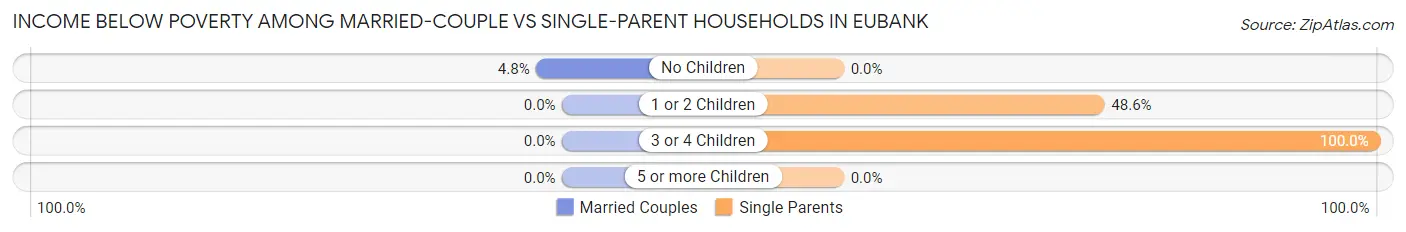
| Children | Married-Couple Families | Single-Parent Households |
| No Children | 3 (4.8%) | 0 (0.0%) |
| 1 or 2 Children | 0 (0.0%) | 17 (48.6%) |
| 3 or 4 Children | 0 (0.0%) | 2 (100.0%) |
| 5 or more Children | 0 (0.0%) | 0 (0.0%) |
| Total | 3 (3.6%) | 19 (42.2%) |
Race in Eubank
The most populous races in Eubank are , and White / Caucasian (471 | 100.0%).
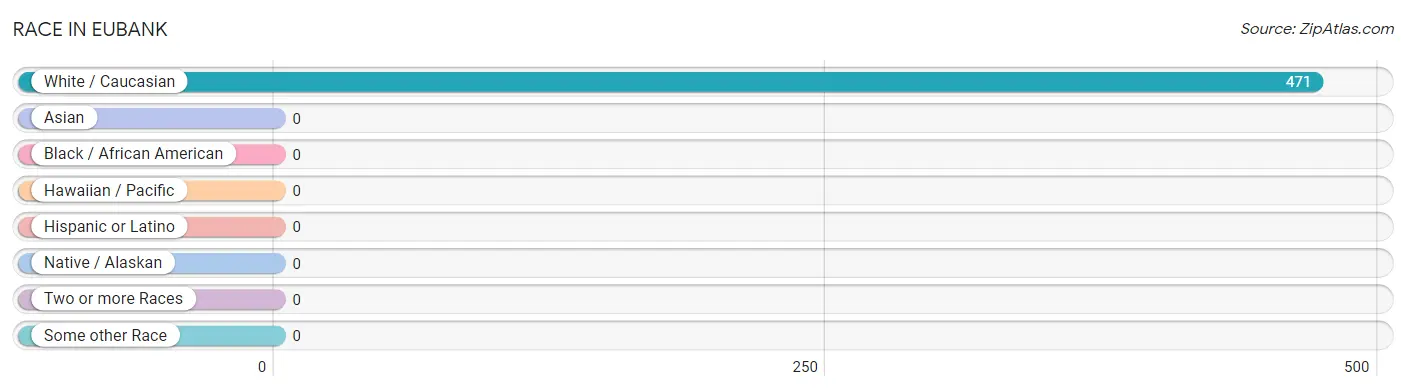
| Race | # Population | % Population |
| Asian | 0 | 0.0% |
| Black / African American | 0 | 0.0% |
| Hawaiian / Pacific | 0 | 0.0% |
| Hispanic or Latino | 0 | 0.0% |
| Native / Alaskan | 0 | 0.0% |
| White / Caucasian | 471 | 100.0% |
| Two or more Races | 0 | 0.0% |
| Some other Race | 0 | 0.0% |
| Total | 471 | 100.0% |
Ancestry in Eubank
The most populous ancestries reported in Eubank are Irish (63 | 13.4%), Italian (58 | 12.3%), American (51 | 10.8%), English (42 | 8.9%), and German (37 | 7.9%), together accounting for 53.3% of all Eubank residents.
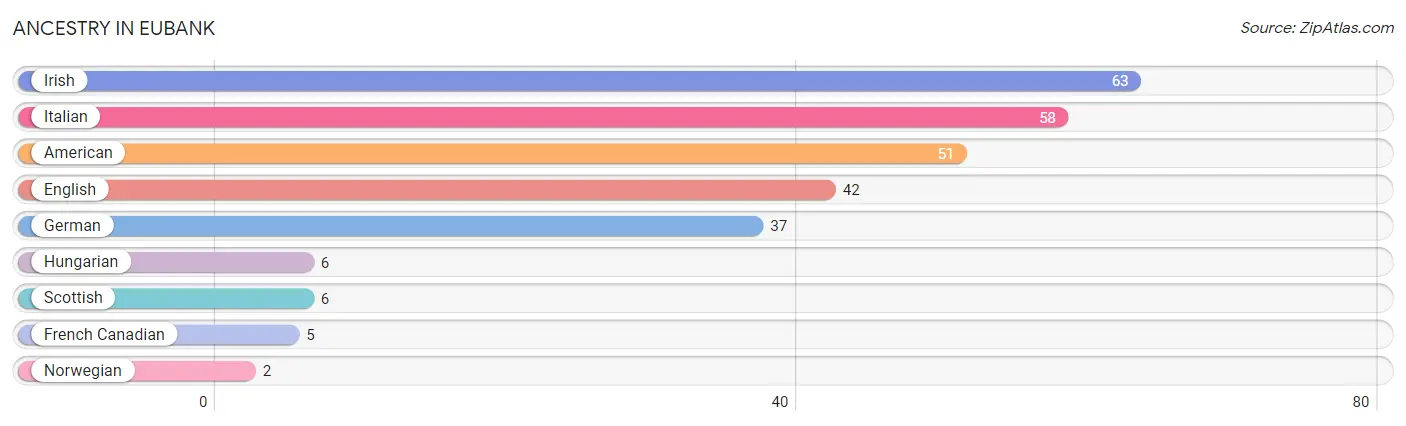
| Ancestry | # Population | % Population |
| American | 51 | 10.8% |
| English | 42 | 8.9% |
| French Canadian | 5 | 1.1% |
| German | 37 | 7.9% |
| Hungarian | 6 | 1.3% |
| Irish | 63 | 13.4% |
| Italian | 58 | 12.3% |
| Norwegian | 2 | 0.4% |
| Scottish | 6 | 1.3% | View All 9 Rows |
Immigrants in Eubank

| Immigration Origin | # Population | % Population | View All 0 Rows |
Sex and Age in Eubank
Sex and Age in Eubank
The most populous age groups in Eubank are 15 to 19 Years (42 | 17.4%) for men and 20 to 24 Years (37 | 16.2%) for women.
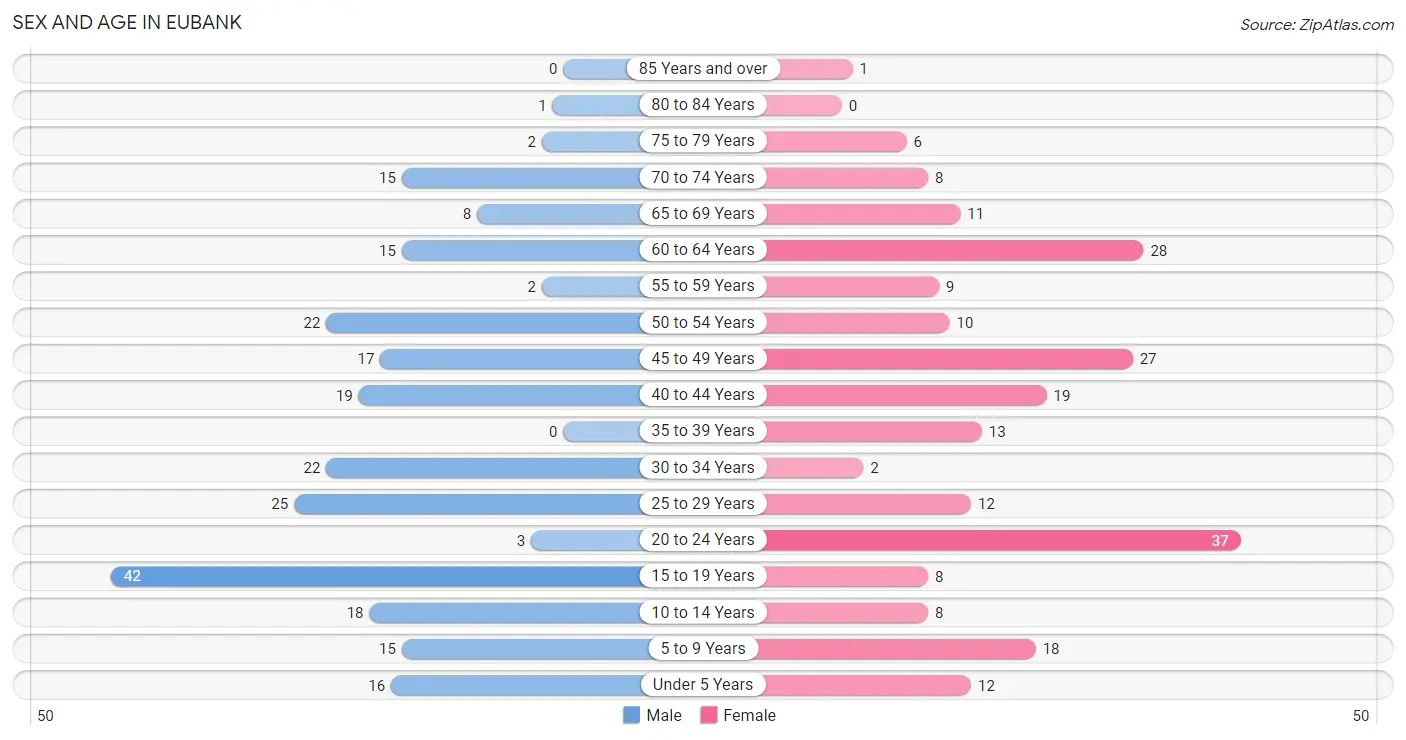
| Age Bracket | Male | Female |
| Under 5 Years | 16 (6.6%) | 12 (5.2%) |
| 5 to 9 Years | 15 (6.2%) | 18 (7.9%) |
| 10 to 14 Years | 18 (7.4%) | 8 (3.5%) |
| 15 to 19 Years | 42 (17.4%) | 8 (3.5%) |
| 20 to 24 Years | 3 (1.2%) | 37 (16.2%) |
| 25 to 29 Years | 25 (10.3%) | 12 (5.2%) |
| 30 to 34 Years | 22 (9.1%) | 2 (0.9%) |
| 35 to 39 Years | 0 (0.0%) | 13 (5.7%) |
| 40 to 44 Years | 19 (7.9%) | 19 (8.3%) |
| 45 to 49 Years | 17 (7.0%) | 27 (11.8%) |
| 50 to 54 Years | 22 (9.1%) | 10 (4.4%) |
| 55 to 59 Years | 2 (0.8%) | 9 (3.9%) |
| 60 to 64 Years | 15 (6.2%) | 28 (12.2%) |
| 65 to 69 Years | 8 (3.3%) | 11 (4.8%) |
| 70 to 74 Years | 15 (6.2%) | 8 (3.5%) |
| 75 to 79 Years | 2 (0.8%) | 6 (2.6%) |
| 80 to 84 Years | 1 (0.4%) | 0 (0.0%) |
| 85 Years and over | 0 (0.0%) | 1 (0.4%) |
| Total | 242 (100.0%) | 229 (100.0%) |
Families and Households in Eubank
Median Family Size in Eubank
The median family size in Eubank is 3.13 persons per family, with single female/mother families (33 | 25.8%) accounting for the largest median family size of 3.76 persons per family. On the other hand, married-couple families (83 | 64.8%) represent the smallest median family size with 2.88 persons per family.
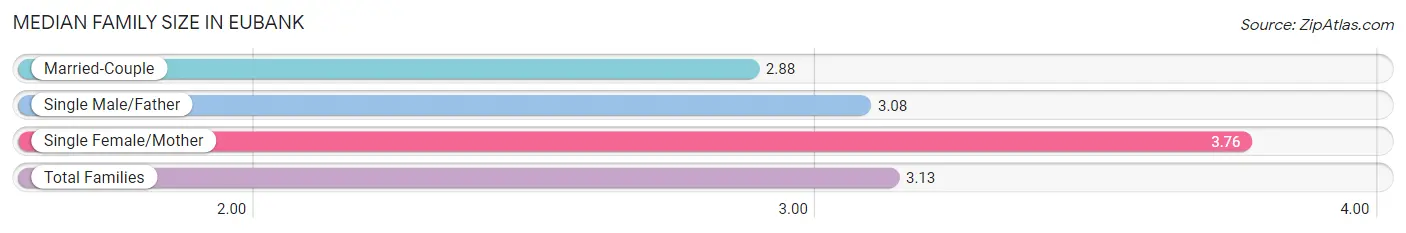
| Family Type | # Families | Family Size |
| Married-Couple | 83 (64.8%) | 2.88 |
| Single Male/Father | 12 (9.4%) | 3.08 |
| Single Female/Mother | 33 (25.8%) | 3.76 |
| Total Families | 128 (100.0%) | 3.13 |
Median Household Size in Eubank
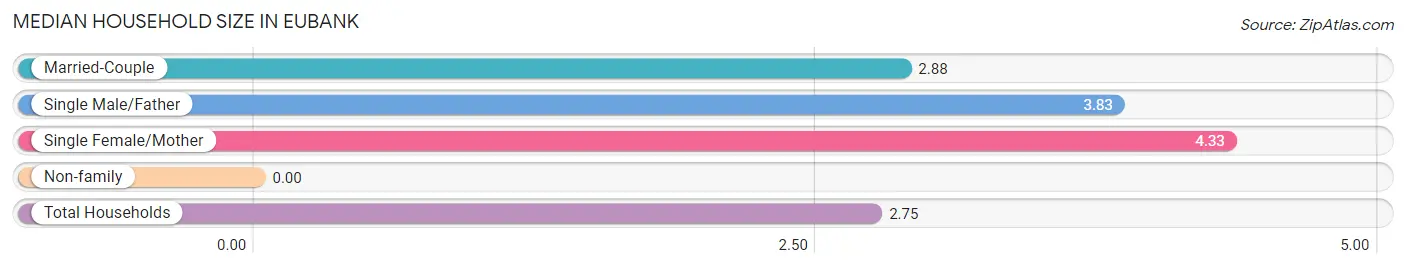
| Household Type | # Households | Household Size |
| Married-Couple | 83 (48.5%) | 2.88 |
| Single Male/Father | 12 (7.0%) | 3.83 |
| Single Female/Mother | 33 (19.3%) | 4.33 |
| Non-family | 43 (25.2%) | - |
| Total Households | 171 (100.0%) | 2.75 |
Household Size by Marriage Status in Eubank
Out of a total of 171 households in Eubank, 128 (74.9%) are family households, while 43 (25.2%) are nonfamily households. The most numerous type of family households are 2-person households, comprising 66, and the most common type of nonfamily households are 1-person households, comprising 43.
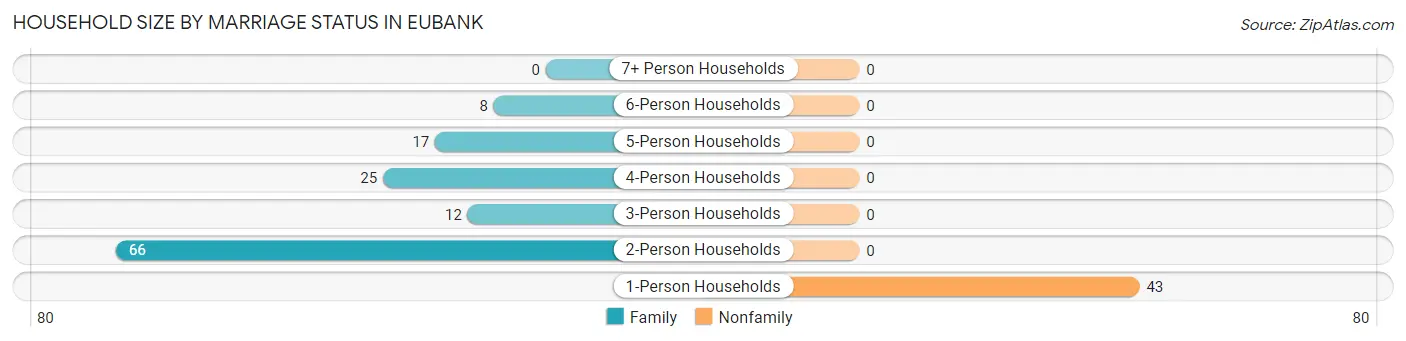
| Household Size | Family Households | Nonfamily Households |
| 1-Person Households | - | 43 (25.2%) |
| 2-Person Households | 66 (38.6%) | 0 (0.0%) |
| 3-Person Households | 12 (7.0%) | 0 (0.0%) |
| 4-Person Households | 25 (14.6%) | 0 (0.0%) |
| 5-Person Households | 17 (9.9%) | 0 (0.0%) |
| 6-Person Households | 8 (4.7%) | 0 (0.0%) |
| 7+ Person Households | 0 (0.0%) | 0 (0.0%) |
| Total | 128 (74.9%) | 43 (25.2%) |
Female Fertility in Eubank
Fertility by Age in Eubank
Average fertility rate in Eubank is 102.0 births per 1,000 women. Women in the age bracket of 20 to 34 years have the highest fertility rate with 196.0 births per 1,000 women. Women in the age bracket of 20 to 34 years acount for 83.3% of all women with births.
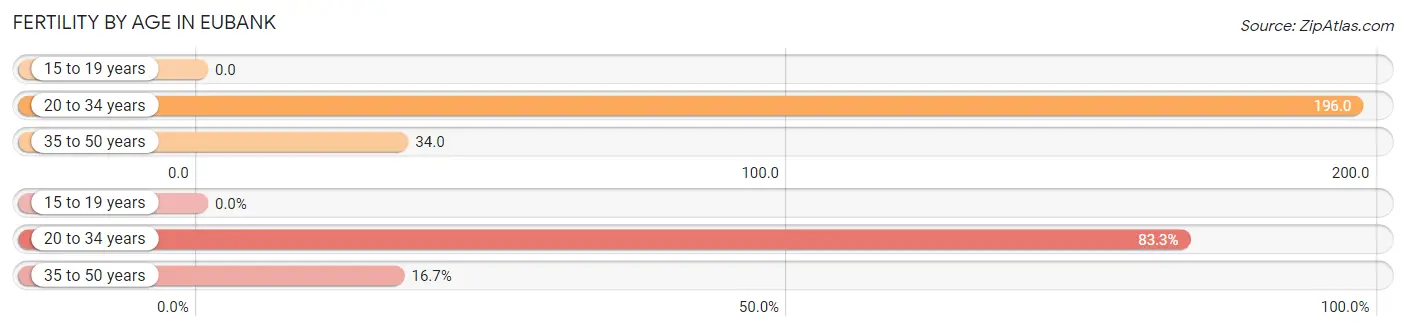
| Age Bracket | Women with Births | Births / 1,000 Women |
| 15 to 19 years | 0 (0.0%) | 0.0 |
| 20 to 34 years | 10 (83.3%) | 196.0 |
| 35 to 50 years | 2 (16.7%) | 34.0 |
| Total | 12 (100.0%) | 102.0 |
Fertility by Age by Marriage Status in Eubank
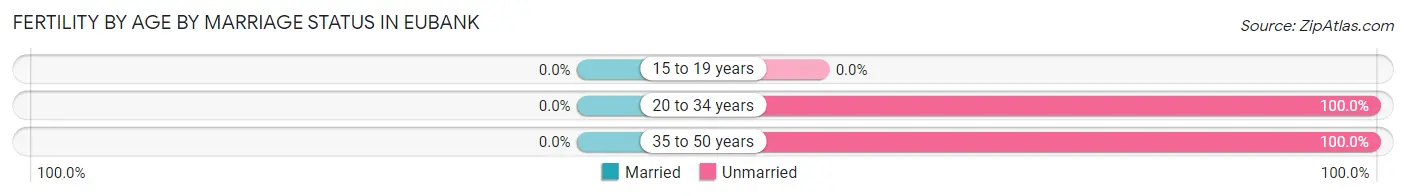
| Age Bracket | Married | Unmarried |
| 15 to 19 years | 0 (0.0%) | 0 (0.0%) |
| 20 to 34 years | 0 (0.0%) | 10 (100.0%) |
| 35 to 50 years | 0 (0.0%) | 2 (100.0%) |
| Total | 0 (0.0%) | 12 (100.0%) |
Fertility by Education in Eubank
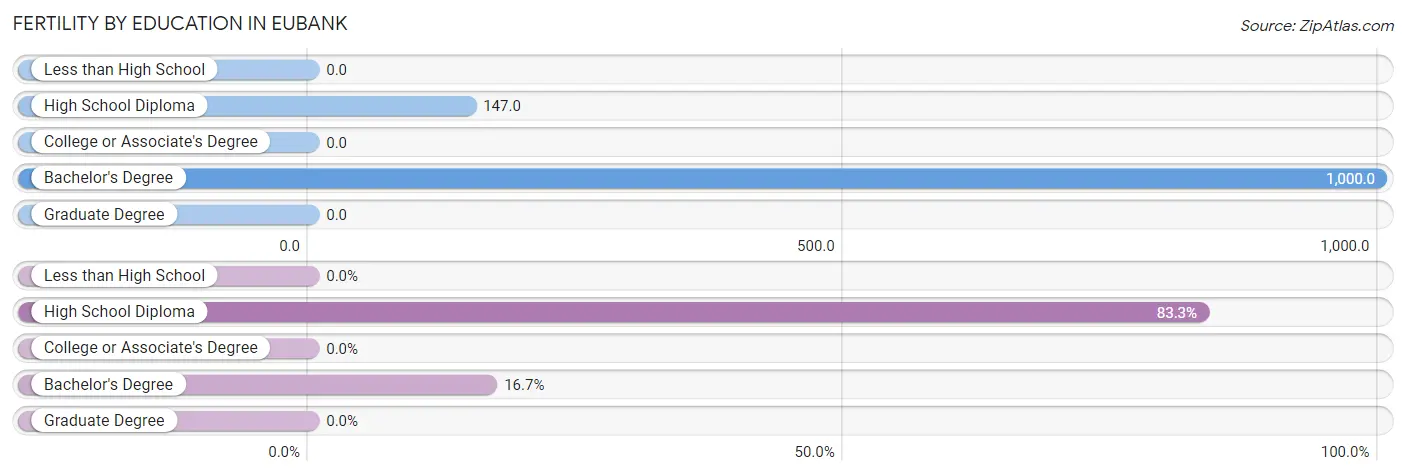
| Educational Attainment | Women with Births | Births / 1,000 Women |
| Less than High School | 0 (0.0%) | 0.0 |
| High School Diploma | 10 (83.3%) | 147.0 |
| College or Associate's Degree | 0 (0.0%) | 0.0 |
| Bachelor's Degree | 2 (16.7%) | 1,000.0 |
| Graduate Degree | 0 (0.0%) | 0.0 |
| Total | 12 (100.0%) | 102.0 |
Fertility by Education by Marriage Status in Eubank
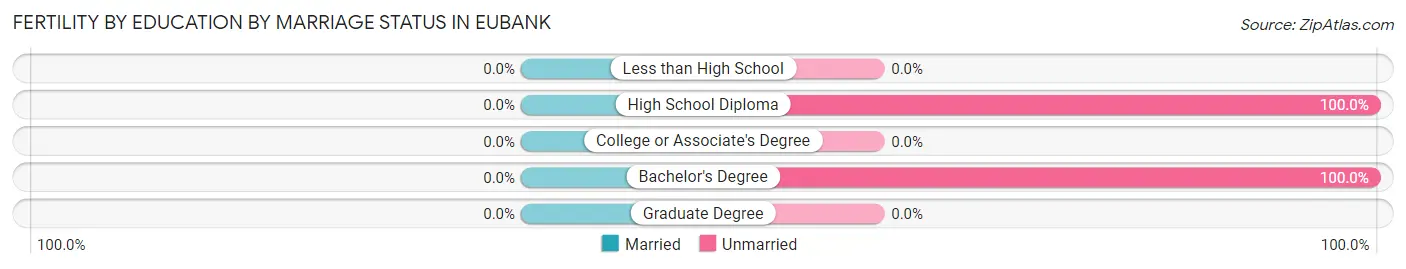
| Educational Attainment | Married | Unmarried |
| Less than High School | 0 (0.0%) | 0 (0.0%) |
| High School Diploma | 0 (0.0%) | 10 (100.0%) |
| College or Associate's Degree | 0 (0.0%) | 0 (0.0%) |
| Bachelor's Degree | 0 (0.0%) | 2 (100.0%) |
| Graduate Degree | 0 (0.0%) | 0 (0.0%) |
| Total | 0 (0.0%) | 12 (100.0%) |
Employment Characteristics in Eubank
Employment by Class of Employer in Eubank
Among the 150 employed individuals in Eubank, private company employees (129 | 86.0%), local government employees (8 | 5.3%), and self-employed (incorporated) (4 | 2.7%) make up the most common classes of employment.
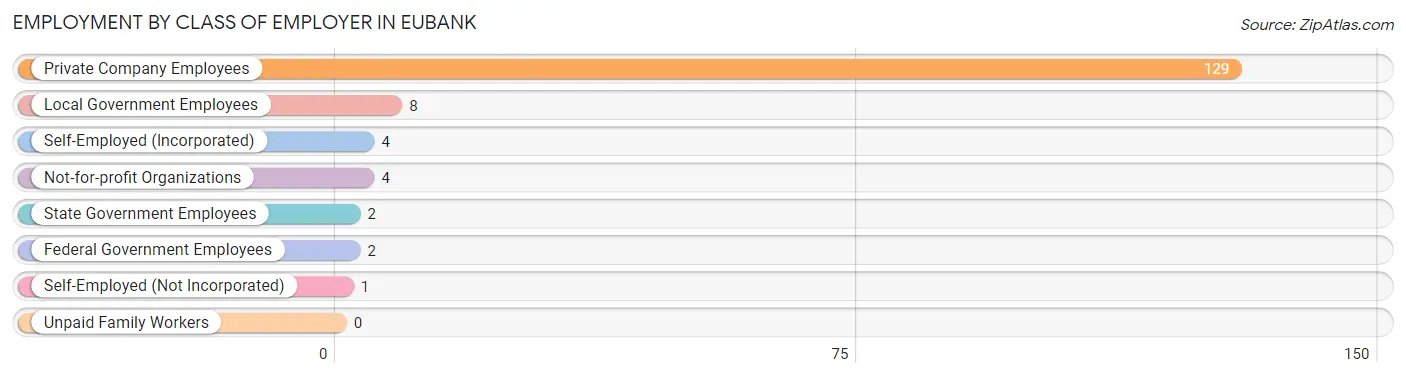
| Employer Class | # Employees | % Employees |
| Private Company Employees | 129 | 86.0% |
| Self-Employed (Incorporated) | 4 | 2.7% |
| Self-Employed (Not Incorporated) | 1 | 0.7% |
| Not-for-profit Organizations | 4 | 2.7% |
| Local Government Employees | 8 | 5.3% |
| State Government Employees | 2 | 1.3% |
| Federal Government Employees | 2 | 1.3% |
| Unpaid Family Workers | 0 | 0.0% |
| Total | 150 | 100.0% |
Employment Status by Age in Eubank
According to the labor force statistics for Eubank, out of the total population over 16 years of age (384), 50.3% or 193 individuals are in the labor force, with 13.0% or 25 of them unemployed. The age group with the highest labor force participation rate is 25 to 29 years, with 91.9% or 34 individuals in the labor force. Within the labor force, the 20 to 24 years age range has the highest percentage of unemployed individuals, with 56.7% or 17 of them being unemployed.
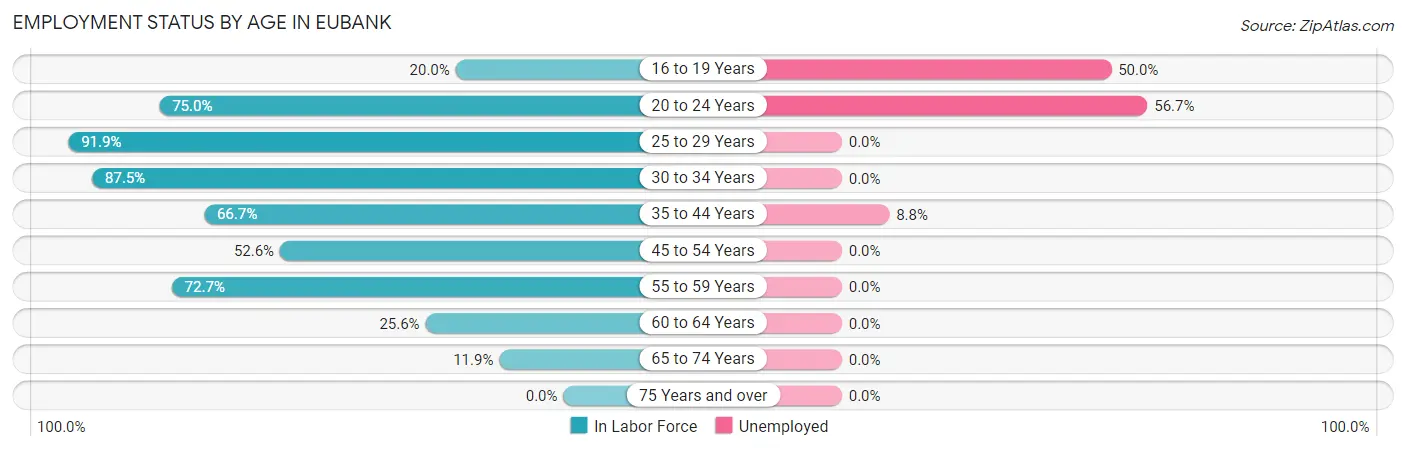
| Age Bracket | In Labor Force | Unemployed |
| 16 to 19 Years | 10 (20.0%) | 5 (50.0%) |
| 20 to 24 Years | 30 (75.0%) | 17 (56.7%) |
| 25 to 29 Years | 34 (91.9%) | 0 (0.0%) |
| 30 to 34 Years | 21 (87.5%) | 0 (0.0%) |
| 35 to 44 Years | 34 (66.7%) | 3 (8.8%) |
| 45 to 54 Years | 40 (52.6%) | 0 (0.0%) |
| 55 to 59 Years | 8 (72.7%) | 0 (0.0%) |
| 60 to 64 Years | 11 (25.6%) | 0 (0.0%) |
| 65 to 74 Years | 5 (11.9%) | 0 (0.0%) |
| 75 Years and over | 0 (0.0%) | 0 (0.0%) |
| Total | 193 (50.3%) | 25 (13.0%) |
Employment Status by Educational Attainment in Eubank
According to labor force statistics for Eubank, 61.2% of individuals (148) out of the total population between 25 and 64 years of age (242) are in the labor force, with 2.0% or 3 of them being unemployed. The group with the highest labor force participation rate are those with the educational attainment of bachelor's degree or higher, with 100.0% or 3 individuals in the labor force. Within the labor force, individuals with high school diploma education have the highest percentage of unemployment, with 3.6% or 3 of them being unemployed.
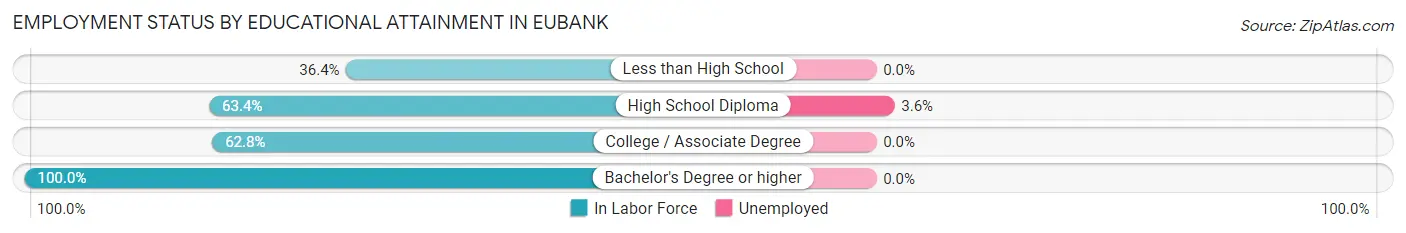
| Educational Attainment | In Labor Force | Unemployed |
| Less than High School | 8 (36.4%) | 0 (0.0%) |
| High School Diploma | 83 (63.4%) | 5 (3.6%) |
| College / Associate Degree | 54 (62.8%) | 0 (0.0%) |
| Bachelor's Degree or higher | 3 (100.0%) | 0 (0.0%) |
| Total | 148 (61.2%) | 5 (2.0%) |
Employment Occupations by Sex in Eubank
Management, Business, Science and Arts Occupations
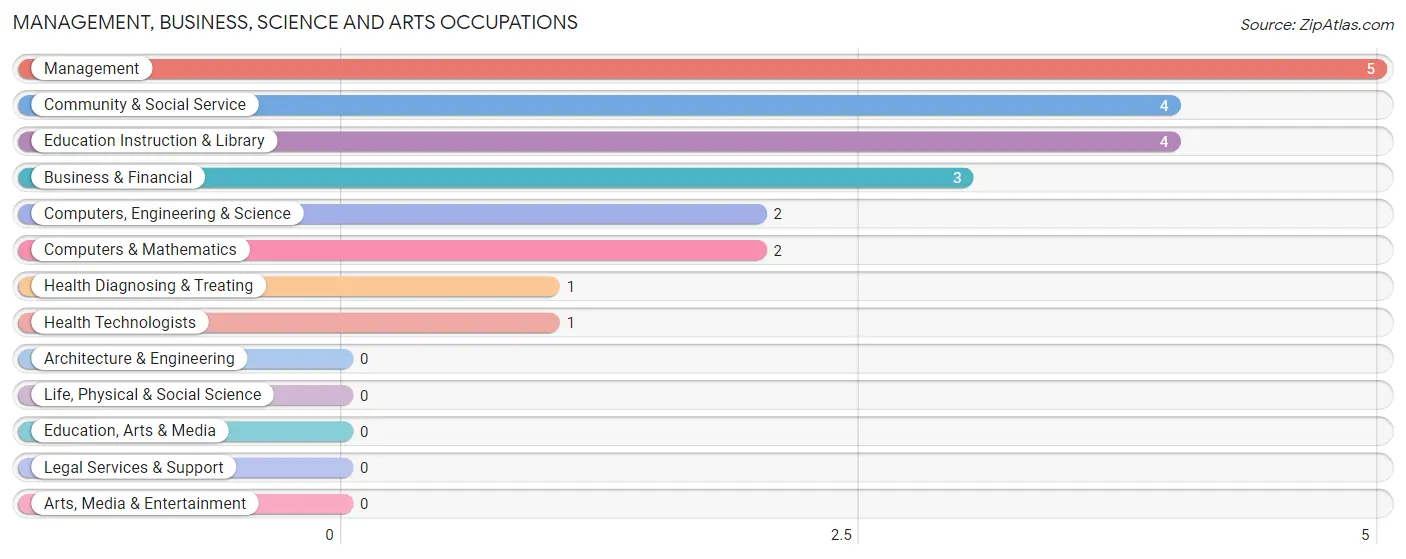
The most common Management, Business, Science and Arts occupations in Eubank are Management (5 | 3.0%), Community & Social Service (4 | 2.4%), Education Instruction & Library (4 | 2.4%), Business & Financial (3 | 1.8%), and Computers, Engineering & Science (2 | 1.2%).
Management, Business, Science and Arts Occupations by Sex
Within the Management, Business, Science and Arts occupations in Eubank, the most male-oriented occupations are Health Diagnosing & Treating (100.0%), and Health Technologists (100.0%), while the most female-oriented occupations are Management (100.0%), Business & Financial (100.0%), and Computers, Engineering & Science (100.0%).
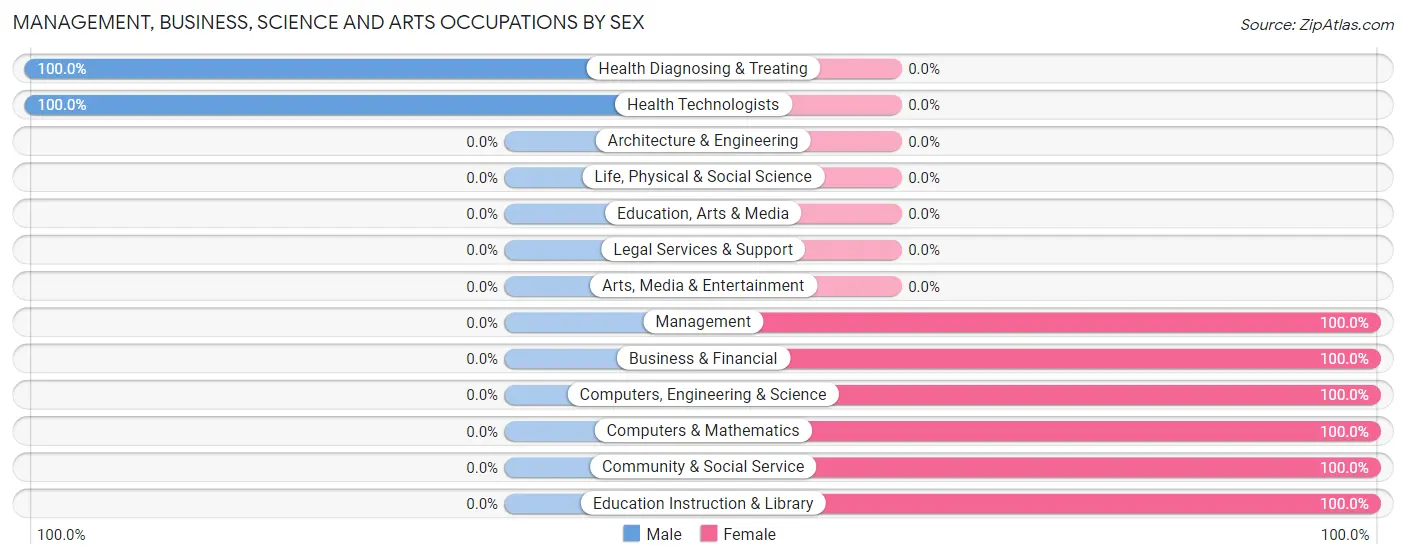
| Occupation | Male | Female |
| Management | 0 (0.0%) | 5 (100.0%) |
| Business & Financial | 0 (0.0%) | 3 (100.0%) |
| Computers, Engineering & Science | 0 (0.0%) | 2 (100.0%) |
| Computers & Mathematics | 0 (0.0%) | 2 (100.0%) |
| Architecture & Engineering | 0 (0.0%) | 0 (0.0%) |
| Life, Physical & Social Science | 0 (0.0%) | 0 (0.0%) |
| Community & Social Service | 0 (0.0%) | 4 (100.0%) |
| Education, Arts & Media | 0 (0.0%) | 0 (0.0%) |
| Legal Services & Support | 0 (0.0%) | 0 (0.0%) |
| Education Instruction & Library | 0 (0.0%) | 4 (100.0%) |
| Arts, Media & Entertainment | 0 (0.0%) | 0 (0.0%) |
| Health Diagnosing & Treating | 1 (100.0%) | 0 (0.0%) |
| Health Technologists | 1 (100.0%) | 0 (0.0%) |
| Total (Category) | 1 (6.7%) | 14 (93.3%) |
| Total (Overall) | 96 (57.1%) | 72 (42.9%) |
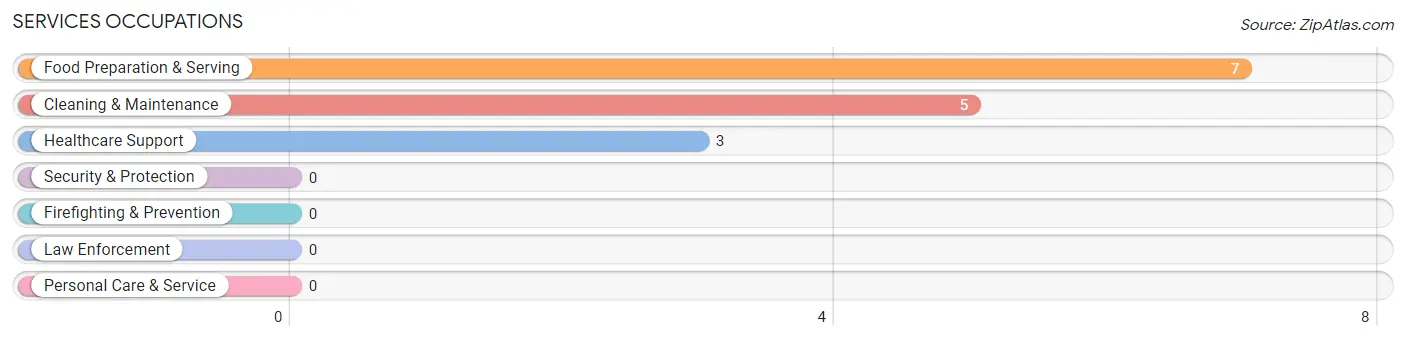
Services Occupations
The most common Services occupations in Eubank are Food Preparation & Serving (7 | 4.2%), Cleaning & Maintenance (5 | 3.0%), and Healthcare Support (3 | 1.8%).
Services Occupations by Sex
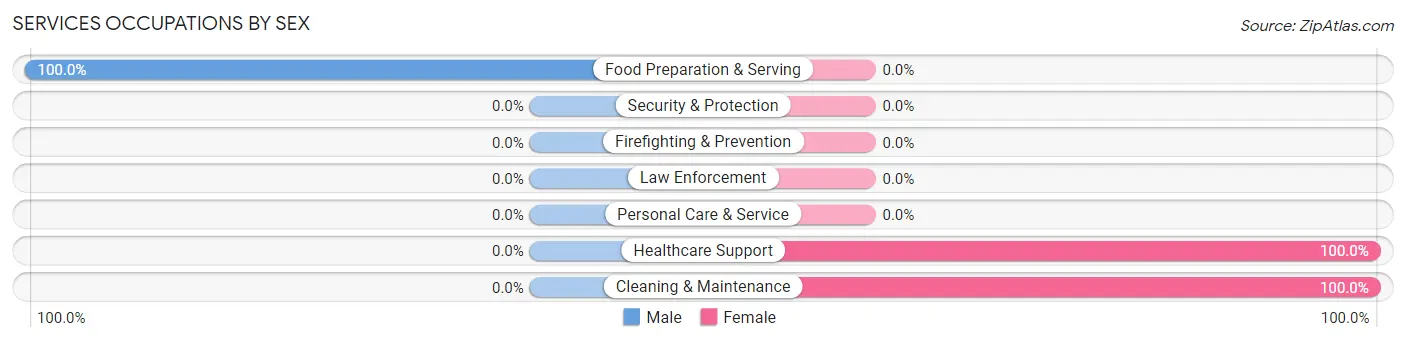
| Occupation | Male | Female |
| Healthcare Support | 0 (0.0%) | 3 (100.0%) |
| Security & Protection | 0 (0.0%) | 0 (0.0%) |
| Firefighting & Prevention | 0 (0.0%) | 0 (0.0%) |
| Law Enforcement | 0 (0.0%) | 0 (0.0%) |
| Food Preparation & Serving | 7 (100.0%) | 0 (0.0%) |
| Cleaning & Maintenance | 0 (0.0%) | 5 (100.0%) |
| Personal Care & Service | 0 (0.0%) | 0 (0.0%) |
| Total (Category) | 7 (46.7%) | 8 (53.3%) |
| Total (Overall) | 96 (57.1%) | 72 (42.9%) |
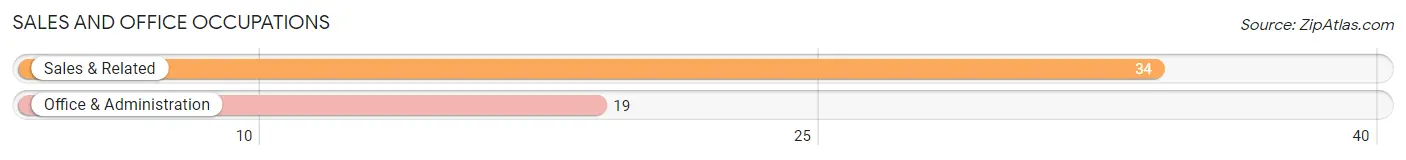
Sales and Office Occupations
The most common Sales and Office occupations in Eubank are Sales & Related (34 | 20.2%), and Office & Administration (19 | 11.3%).
Sales and Office Occupations by Sex
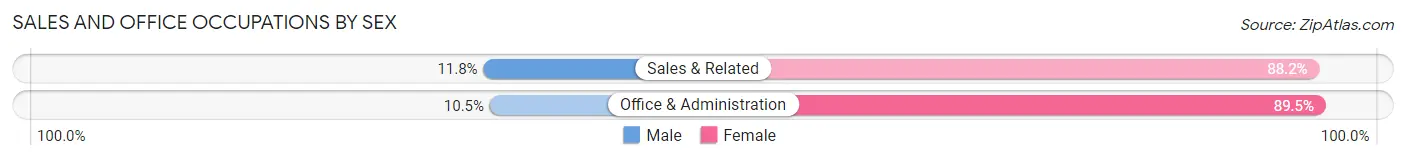
| Occupation | Male | Female |
| Sales & Related | 4 (11.8%) | 30 (88.2%) |
| Office & Administration | 2 (10.5%) | 17 (89.5%) |
| Total (Category) | 6 (11.3%) | 47 (88.7%) |
| Total (Overall) | 96 (57.1%) | 72 (42.9%) |
Natural Resources, Construction and Maintenance Occupations
The most common Natural Resources, Construction and Maintenance occupations in Eubank are Construction & Extraction (23 | 13.7%), and Installation, Maintenance & Repair (11 | 6.6%).
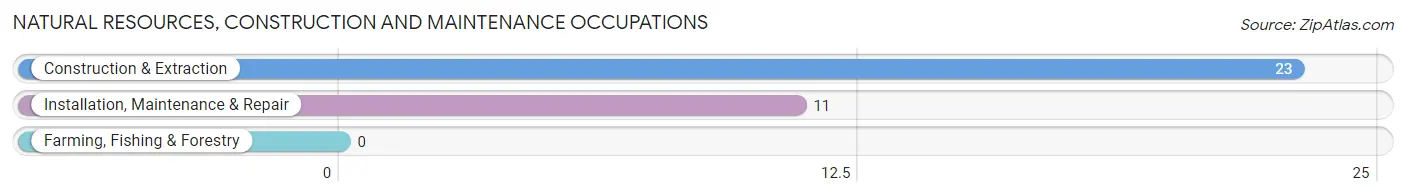
Natural Resources, Construction and Maintenance Occupations by Sex
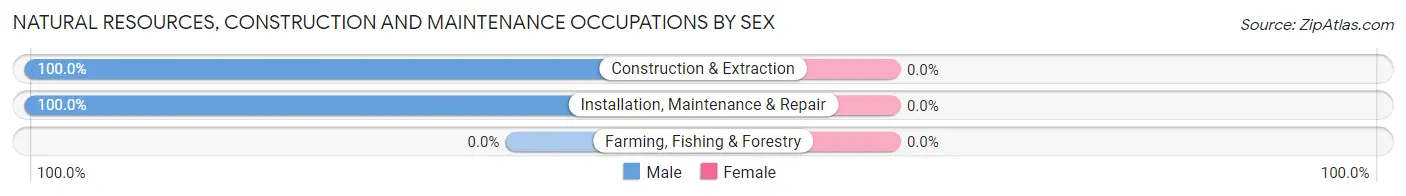
| Occupation | Male | Female |
| Farming, Fishing & Forestry | 0 (0.0%) | 0 (0.0%) |
| Construction & Extraction | 23 (100.0%) | 0 (0.0%) |
| Installation, Maintenance & Repair | 11 (100.0%) | 0 (0.0%) |
| Total (Category) | 34 (100.0%) | 0 (0.0%) |
| Total (Overall) | 96 (57.1%) | 72 (42.9%) |
Production, Transportation and Moving Occupations
The most common Production, Transportation and Moving occupations in Eubank are Production (25 | 14.9%), Transportation (19 | 11.3%), and Material Moving (7 | 4.2%).
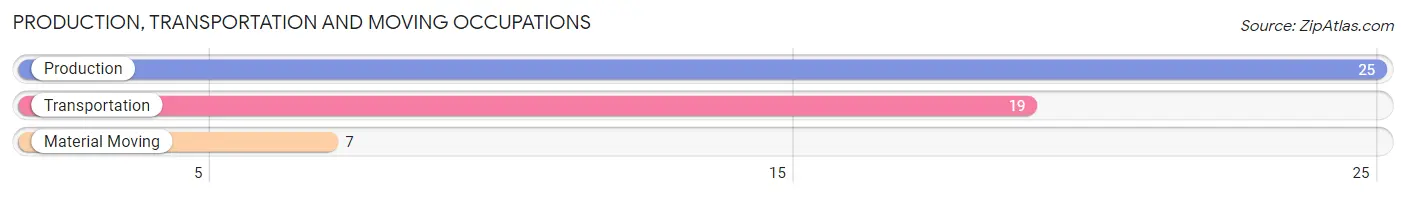
Production, Transportation and Moving Occupations by Sex
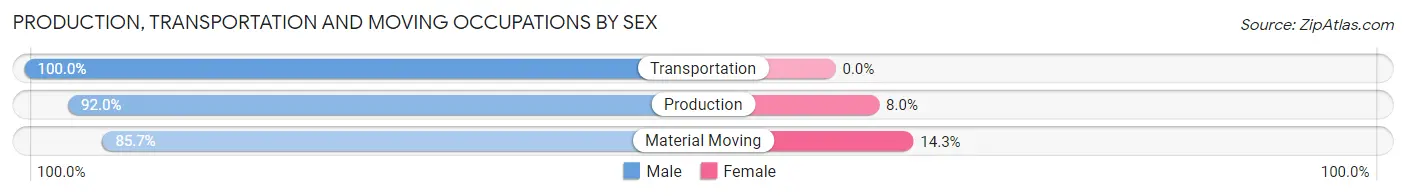
| Occupation | Male | Female |
| Production | 23 (92.0%) | 2 (8.0%) |
| Transportation | 19 (100.0%) | 0 (0.0%) |
| Material Moving | 6 (85.7%) | 1 (14.3%) |
| Total (Category) | 48 (94.1%) | 3 (5.9%) |
| Total (Overall) | 96 (57.1%) | 72 (42.9%) |
Employment Industries by Sex in Eubank
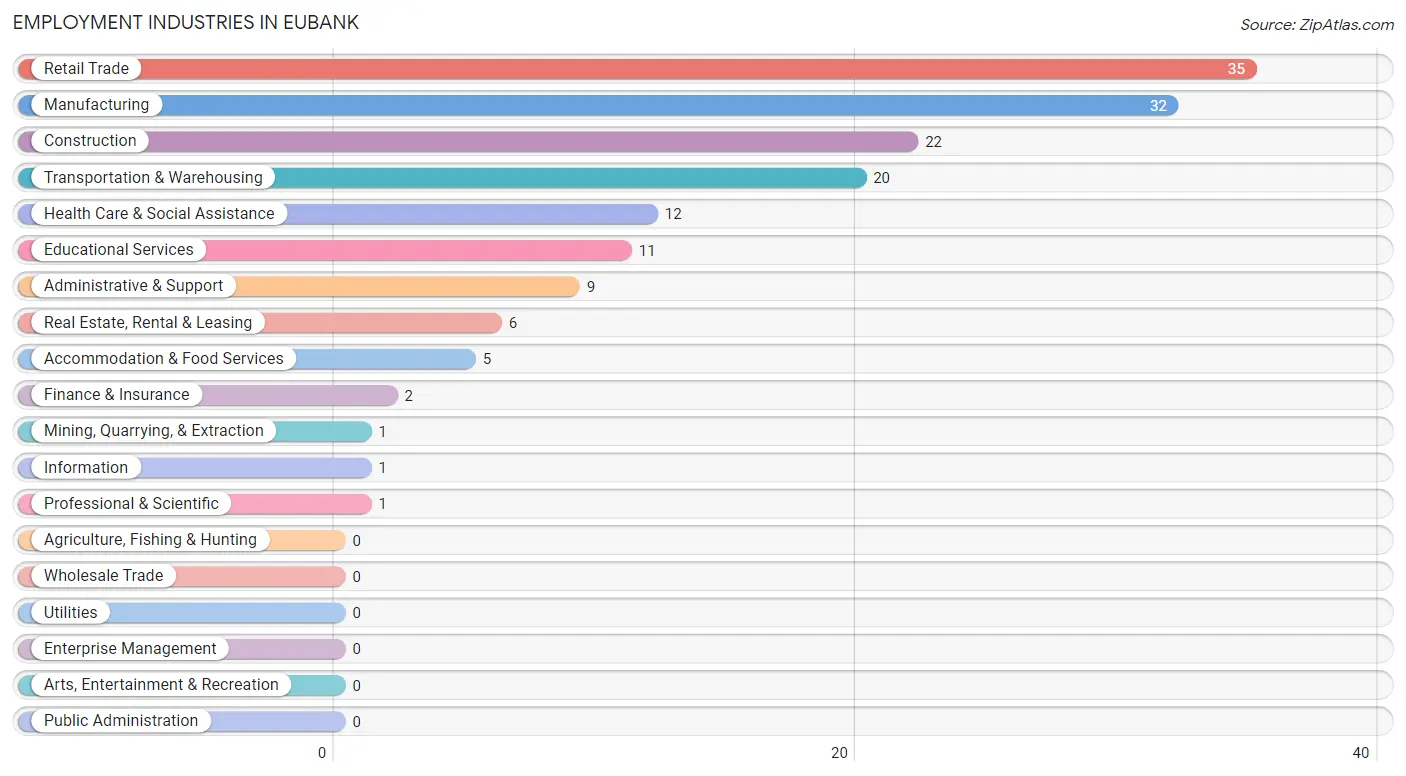
Employment Industries in Eubank
The major employment industries in Eubank include Retail Trade (35 | 20.8%), Manufacturing (32 | 19.1%), Construction (22 | 13.1%), Transportation & Warehousing (20 | 11.9%), and Health Care & Social Assistance (12 | 7.1%).
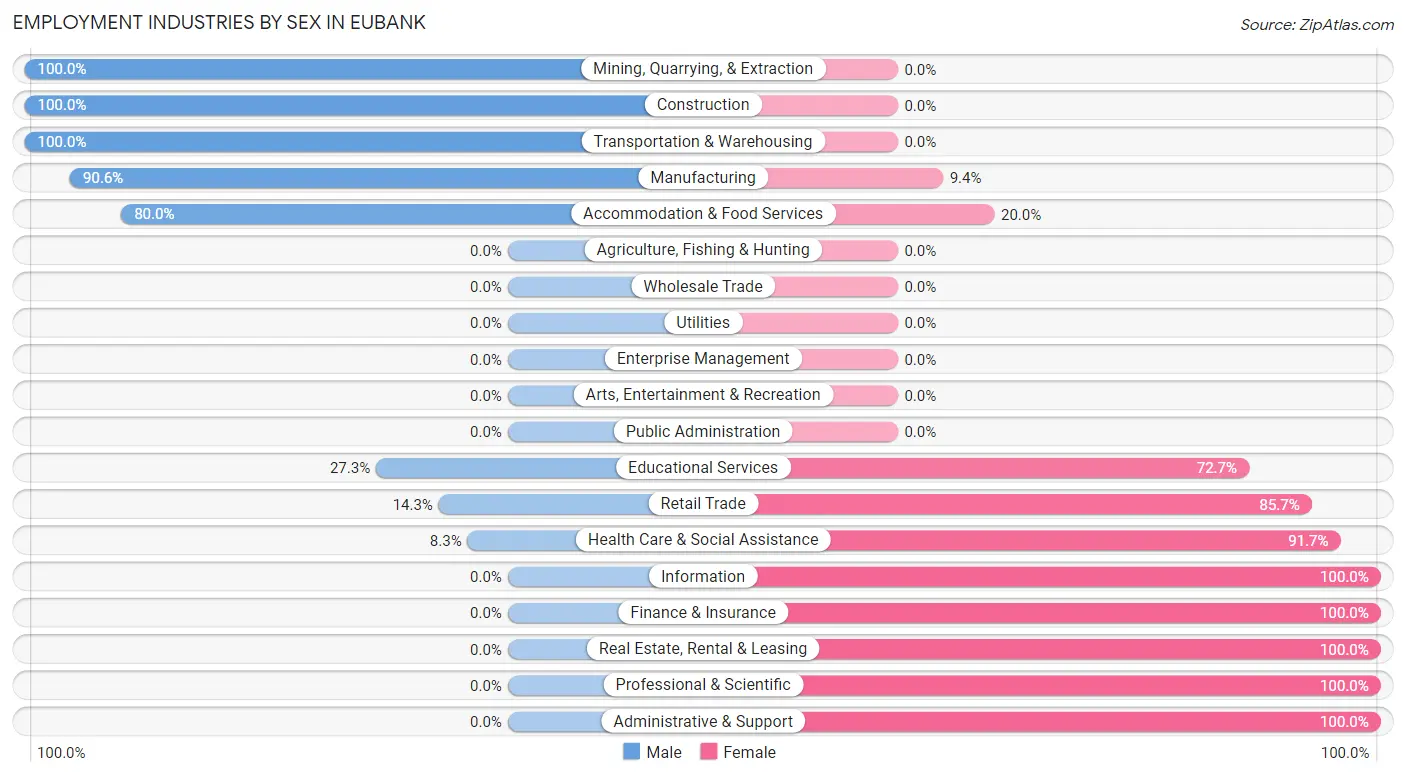
Employment Industries by Sex in Eubank
The Eubank industries that see more men than women are Mining, Quarrying, & Extraction (100.0%), Construction (100.0%), and Transportation & Warehousing (100.0%), whereas the industries that tend to have a higher number of women are Information (100.0%), Finance & Insurance (100.0%), and Real Estate, Rental & Leasing (100.0%).
| Industry | Male | Female |
| Agriculture, Fishing & Hunting | 0 (0.0%) | 0 (0.0%) |
| Mining, Quarrying, & Extraction | 1 (100.0%) | 0 (0.0%) |
| Construction | 22 (100.0%) | 0 (0.0%) |
| Manufacturing | 29 (90.6%) | 3 (9.4%) |
| Wholesale Trade | 0 (0.0%) | 0 (0.0%) |
| Retail Trade | 5 (14.3%) | 30 (85.7%) |
| Transportation & Warehousing | 20 (100.0%) | 0 (0.0%) |
| Utilities | 0 (0.0%) | 0 (0.0%) |
| Information | 0 (0.0%) | 1 (100.0%) |
| Finance & Insurance | 0 (0.0%) | 2 (100.0%) |
| Real Estate, Rental & Leasing | 0 (0.0%) | 6 (100.0%) |
| Professional & Scientific | 0 (0.0%) | 1 (100.0%) |
| Enterprise Management | 0 (0.0%) | 0 (0.0%) |
| Administrative & Support | 0 (0.0%) | 9 (100.0%) |
| Educational Services | 3 (27.3%) | 8 (72.7%) |
| Health Care & Social Assistance | 1 (8.3%) | 11 (91.7%) |
| Arts, Entertainment & Recreation | 0 (0.0%) | 0 (0.0%) |
| Accommodation & Food Services | 4 (80.0%) | 1 (20.0%) |
| Public Administration | 0 (0.0%) | 0 (0.0%) |
| Total | 96 (57.1%) | 72 (42.9%) |
Education in Eubank
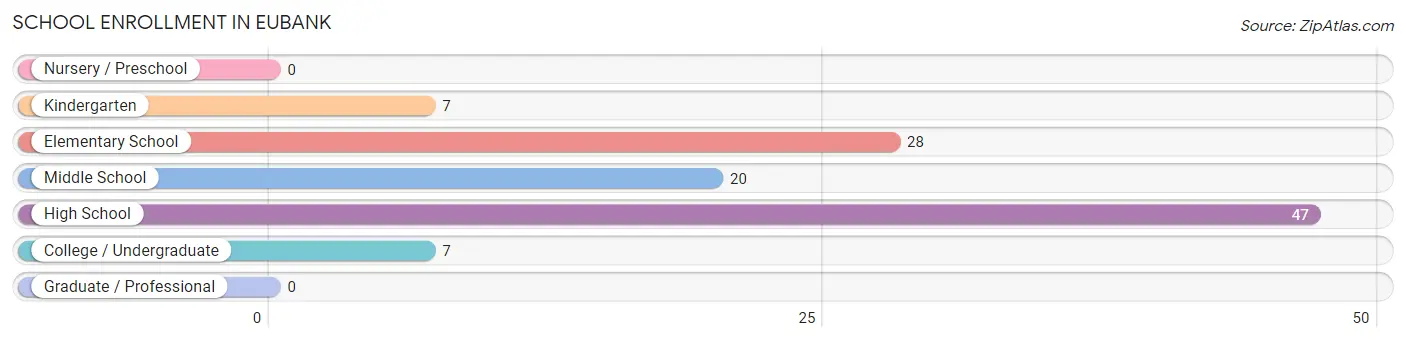
School Enrollment in Eubank
The most common levels of schooling among the 109 students in Eubank are high school (47 | 43.1%), elementary school (28 | 25.7%), and middle school (20 | 18.3%).
| School Level | # Students | % Students |
| Nursery / Preschool | 0 | 0.0% |
| Kindergarten | 7 | 6.4% |
| Elementary School | 28 | 25.7% |
| Middle School | 20 | 18.3% |
| High School | 47 | 43.1% |
| College / Undergraduate | 7 | 6.4% |
| Graduate / Professional | 0 | 0.0% |
| Total | 109 | 100.0% |
School Enrollment by Age by Funding Source in Eubank
Out of a total of 109 students who are enrolled in schools in Eubank, 2 (1.8%) attend a private institution, while the remaining 107 (98.2%) are enrolled in public schools. The age group of 10 to 14 year olds has the highest likelihood of being enrolled in private schools, with 2 (7.7% in the age bracket) enrolled. Conversely, the age group of 5 to 9 year old has the lowest likelihood of being enrolled in a private school, with 33 (100.0% in the age bracket) attending a public institution.
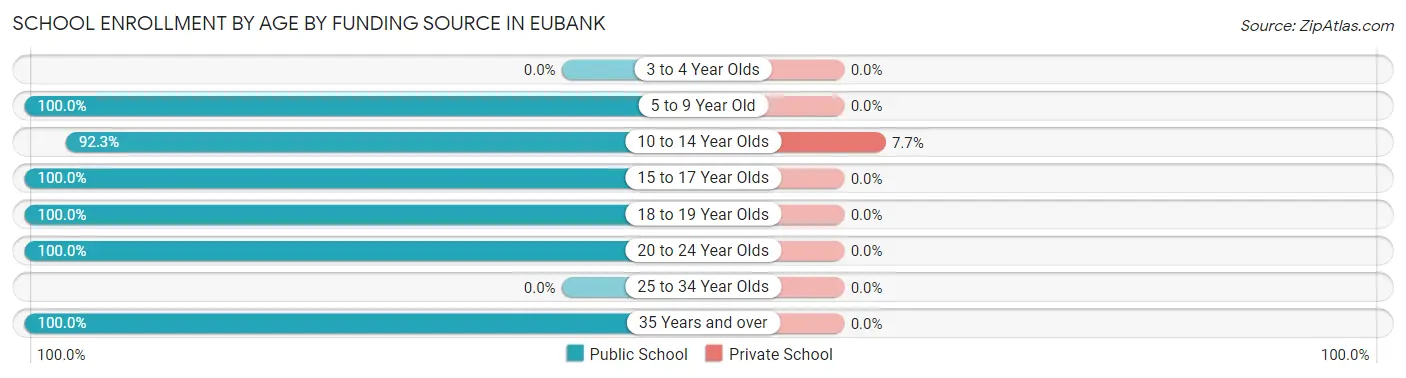
| Age Bracket | Public School | Private School |
| 3 to 4 Year Olds | 0 (0.0%) | 0 (0.0%) |
| 5 to 9 Year Old | 33 (100.0%) | 0 (0.0%) |
| 10 to 14 Year Olds | 24 (92.3%) | 2 (7.7%) |
| 15 to 17 Year Olds | 23 (100.0%) | 0 (0.0%) |
| 18 to 19 Year Olds | 20 (100.0%) | 0 (0.0%) |
| 20 to 24 Year Olds | 4 (100.0%) | 0 (0.0%) |
| 25 to 34 Year Olds | 0 (0.0%) | 0 (0.0%) |
| 35 Years and over | 3 (100.0%) | 0 (0.0%) |
| Total | 107 (98.2%) | 2 (1.8%) |
Educational Attainment by Field of Study in Eubank
Business (2 | 66.7%), and education (1 | 33.3%) are the most common fields of study among 3 individuals in Eubank who have obtained a bachelor's degree or higher.
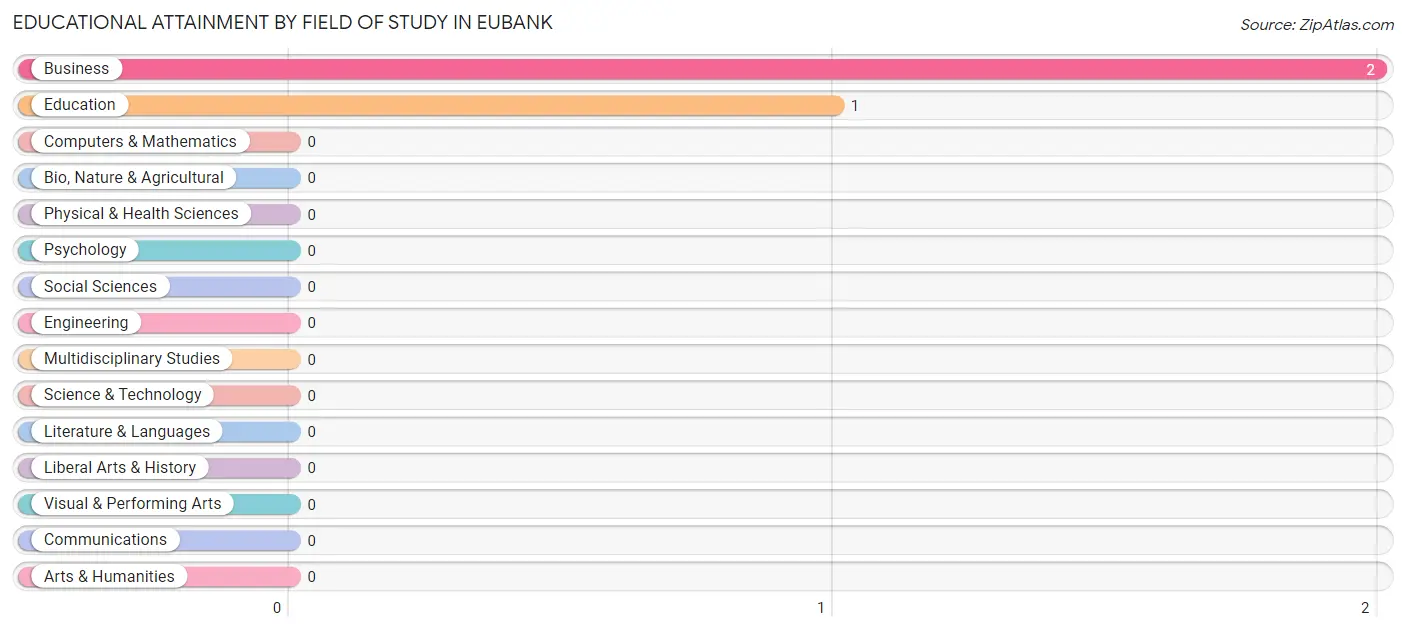
| Field of Study | # Graduates | % Graduates |
| Computers & Mathematics | 0 | 0.0% |
| Bio, Nature & Agricultural | 0 | 0.0% |
| Physical & Health Sciences | 0 | 0.0% |
| Psychology | 0 | 0.0% |
| Social Sciences | 0 | 0.0% |
| Engineering | 0 | 0.0% |
| Multidisciplinary Studies | 0 | 0.0% |
| Science & Technology | 0 | 0.0% |
| Business | 2 | 66.7% |
| Education | 1 | 33.3% |
| Literature & Languages | 0 | 0.0% |
| Liberal Arts & History | 0 | 0.0% |
| Visual & Performing Arts | 0 | 0.0% |
| Communications | 0 | 0.0% |
| Arts & Humanities | 0 | 0.0% |
| Total | 3 | 100.0% |
Transportation & Commute in Eubank
Vehicle Availability by Sex in Eubank
The most prevalent vehicle ownership categories in Eubank are males with 2 vehicles (54, accounting for 67.5%) and females with 2 vehicles (25, making up 77.1%).
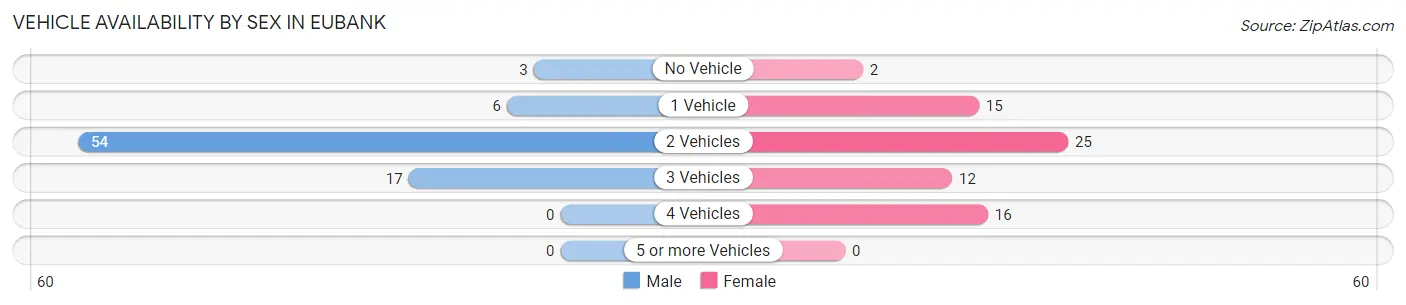
| Vehicles Available | Male | Female |
| No Vehicle | 3 (3.7%) | 2 (2.9%) |
| 1 Vehicle | 6 (7.5%) | 15 (21.4%) |
| 2 Vehicles | 54 (67.5%) | 25 (35.7%) |
| 3 Vehicles | 17 (21.2%) | 12 (17.1%) |
| 4 Vehicles | 0 (0.0%) | 16 (22.9%) |
| 5 or more Vehicles | 0 (0.0%) | 0 (0.0%) |
| Total | 80 (100.0%) | 70 (100.0%) |
Commute Time in Eubank
The most frequently occuring commute durations in Eubank are 25 to 29 minutes (32 commuters, 22.9%), 45 to 59 minutes (21 commuters, 15.0%), and 20 to 24 minutes (20 commuters, 14.3%).
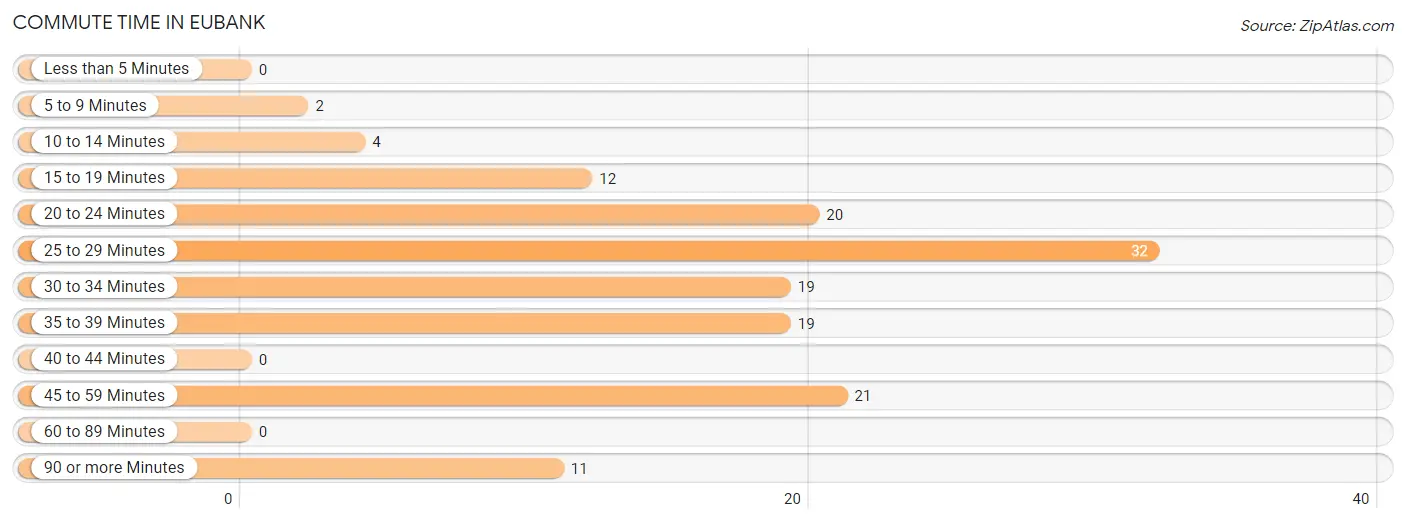
| Commute Time | # Commuters | % Commuters |
| Less than 5 Minutes | 0 | 0.0% |
| 5 to 9 Minutes | 2 | 1.4% |
| 10 to 14 Minutes | 4 | 2.9% |
| 15 to 19 Minutes | 12 | 8.6% |
| 20 to 24 Minutes | 20 | 14.3% |
| 25 to 29 Minutes | 32 | 22.9% |
| 30 to 34 Minutes | 19 | 13.6% |
| 35 to 39 Minutes | 19 | 13.6% |
| 40 to 44 Minutes | 0 | 0.0% |
| 45 to 59 Minutes | 21 | 15.0% |
| 60 to 89 Minutes | 0 | 0.0% |
| 90 or more Minutes | 11 | 7.9% |
Commute Time by Sex in Eubank
The most common commute times in Eubank are 35 to 39 minutes (19 commuters, 23.7%) for males and 25 to 29 minutes (26 commuters, 43.3%) for females.
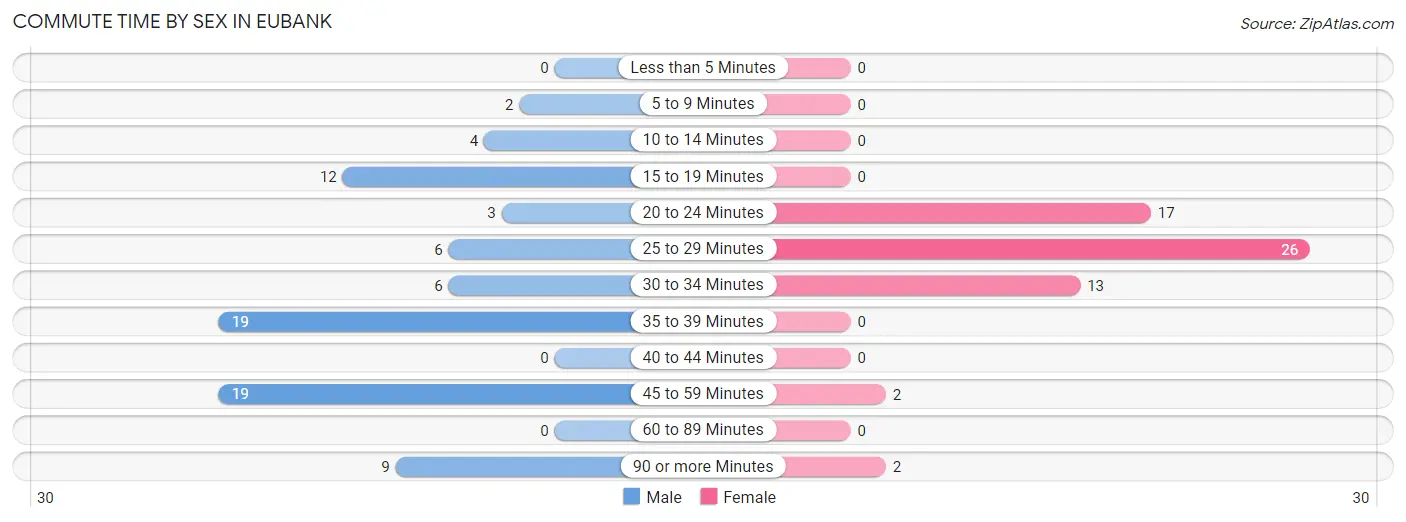
| Commute Time | Male | Female |
| Less than 5 Minutes | 0 (0.0%) | 0 (0.0%) |
| 5 to 9 Minutes | 2 (2.5%) | 0 (0.0%) |
| 10 to 14 Minutes | 4 (5.0%) | 0 (0.0%) |
| 15 to 19 Minutes | 12 (15.0%) | 0 (0.0%) |
| 20 to 24 Minutes | 3 (3.7%) | 17 (28.3%) |
| 25 to 29 Minutes | 6 (7.5%) | 26 (43.3%) |
| 30 to 34 Minutes | 6 (7.5%) | 13 (21.7%) |
| 35 to 39 Minutes | 19 (23.7%) | 0 (0.0%) |
| 40 to 44 Minutes | 0 (0.0%) | 0 (0.0%) |
| 45 to 59 Minutes | 19 (23.7%) | 2 (3.3%) |
| 60 to 89 Minutes | 0 (0.0%) | 0 (0.0%) |
| 90 or more Minutes | 9 (11.3%) | 2 (3.3%) |
Time of Departure to Work by Sex in Eubank
The most frequent times of departure to work in Eubank are 5:00 AM to 5:29 AM (18, 22.5%) for males and 7:30 AM to 7:59 AM (18, 30.0%) for females.
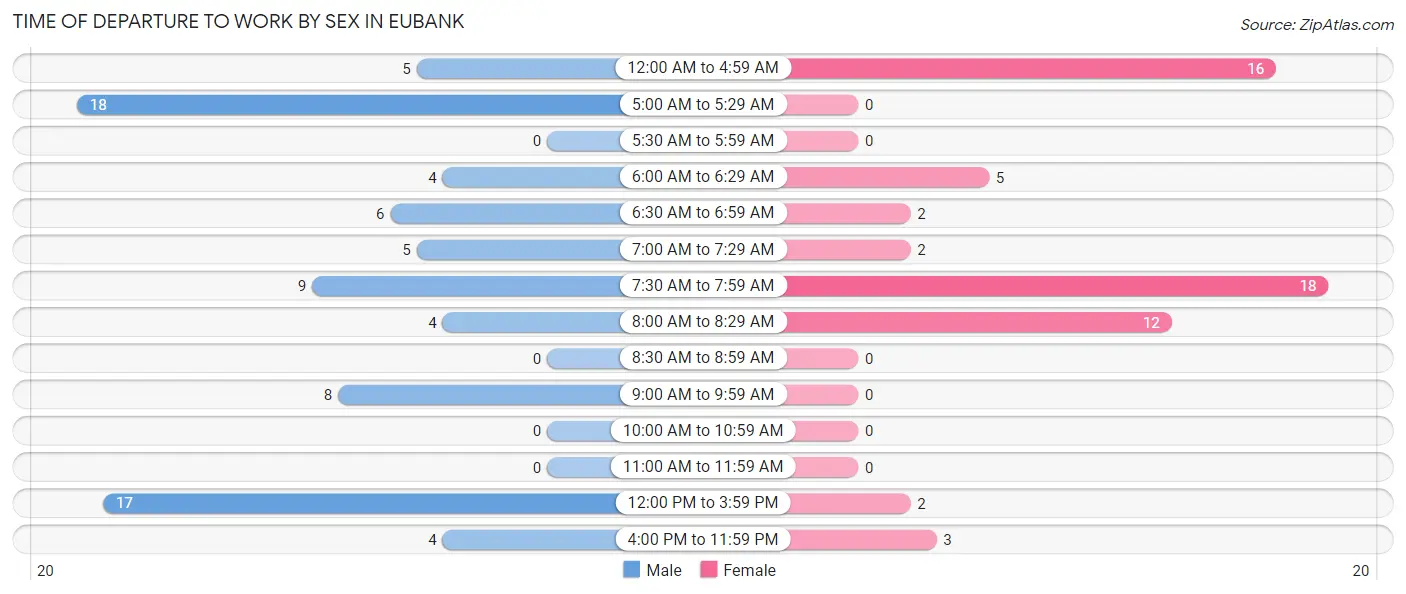
| Time of Departure | Male | Female |
| 12:00 AM to 4:59 AM | 5 (6.2%) | 16 (26.7%) |
| 5:00 AM to 5:29 AM | 18 (22.5%) | 0 (0.0%) |
| 5:30 AM to 5:59 AM | 0 (0.0%) | 0 (0.0%) |
| 6:00 AM to 6:29 AM | 4 (5.0%) | 5 (8.3%) |
| 6:30 AM to 6:59 AM | 6 (7.5%) | 2 (3.3%) |
| 7:00 AM to 7:29 AM | 5 (6.2%) | 2 (3.3%) |
| 7:30 AM to 7:59 AM | 9 (11.3%) | 18 (30.0%) |
| 8:00 AM to 8:29 AM | 4 (5.0%) | 12 (20.0%) |
| 8:30 AM to 8:59 AM | 0 (0.0%) | 0 (0.0%) |
| 9:00 AM to 9:59 AM | 8 (10.0%) | 0 (0.0%) |
| 10:00 AM to 10:59 AM | 0 (0.0%) | 0 (0.0%) |
| 11:00 AM to 11:59 AM | 0 (0.0%) | 0 (0.0%) |
| 12:00 PM to 3:59 PM | 17 (21.2%) | 2 (3.3%) |
| 4:00 PM to 11:59 PM | 4 (5.0%) | 3 (5.0%) |
| Total | 80 (100.0%) | 60 (100.0%) |
Housing Occupancy in Eubank
Occupancy by Ownership in Eubank
Of the total 171 dwellings in Eubank, owner-occupied units account for 99 (57.9%), while renter-occupied units make up 72 (42.1%).
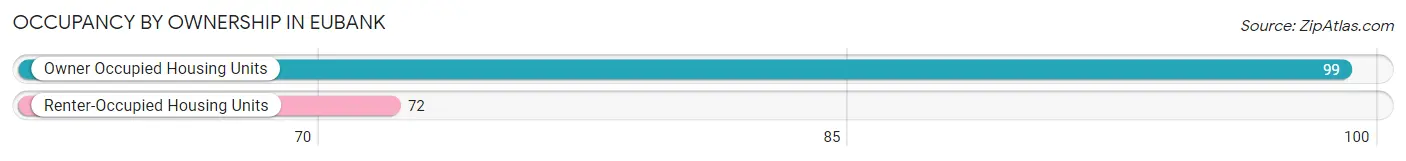
| Occupancy | # Housing Units | % Housing Units |
| Owner Occupied Housing Units | 99 | 57.9% |
| Renter-Occupied Housing Units | 72 | 42.1% |
| Total Occupied Housing Units | 171 | 100.0% |
Occupancy by Household Size in Eubank
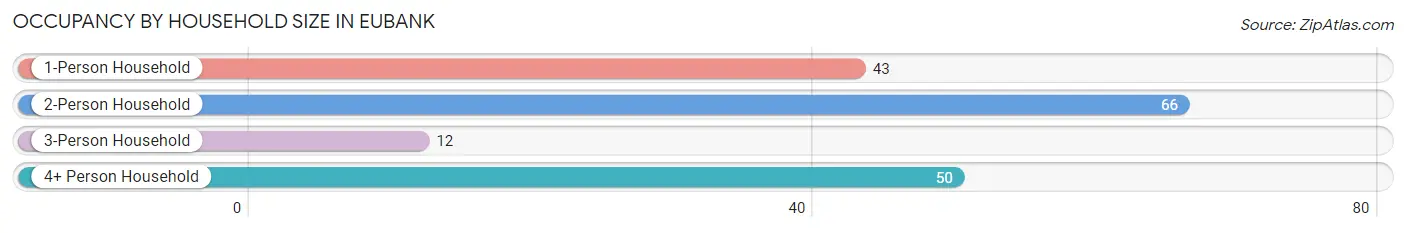
| Household Size | # Housing Units | % Housing Units |
| 1-Person Household | 43 | 25.2% |
| 2-Person Household | 66 | 38.6% |
| 3-Person Household | 12 | 7.0% |
| 4+ Person Household | 50 | 29.2% |
| Total Housing Units | 171 | 100.0% |
Occupancy by Ownership by Household Size in Eubank
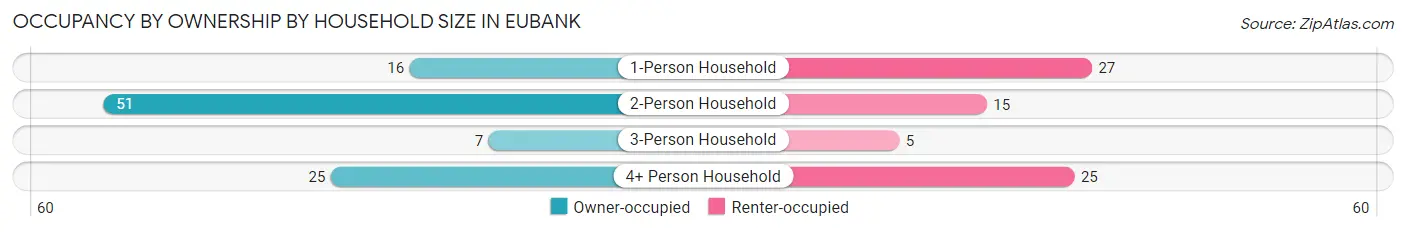
| Household Size | Owner-occupied | Renter-occupied |
| 1-Person Household | 16 (37.2%) | 27 (62.8%) |
| 2-Person Household | 51 (77.3%) | 15 (22.7%) |
| 3-Person Household | 7 (58.3%) | 5 (41.7%) |
| 4+ Person Household | 25 (50.0%) | 25 (50.0%) |
| Total Housing Units | 99 (57.9%) | 72 (42.1%) |
Occupancy by Educational Attainment in Eubank
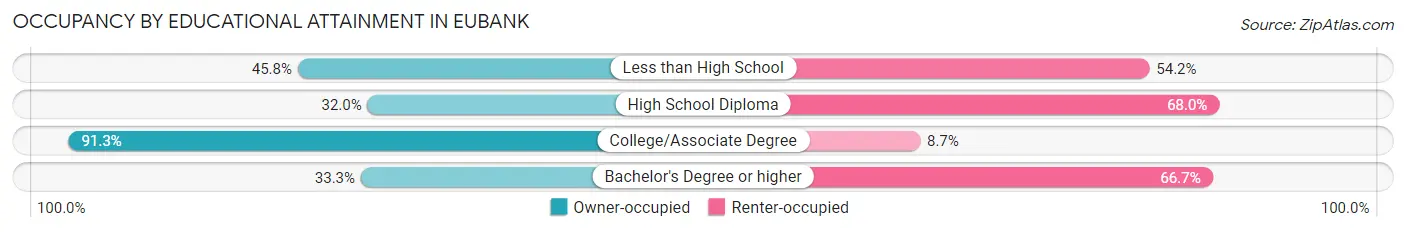
| Household Size | Owner-occupied | Renter-occupied |
| Less than High School | 11 (45.8%) | 13 (54.2%) |
| High School Diploma | 24 (32.0%) | 51 (68.0%) |
| College/Associate Degree | 63 (91.3%) | 6 (8.7%) |
| Bachelor's Degree or higher | 1 (33.3%) | 2 (66.7%) |
Occupancy by Age of Householder in Eubank
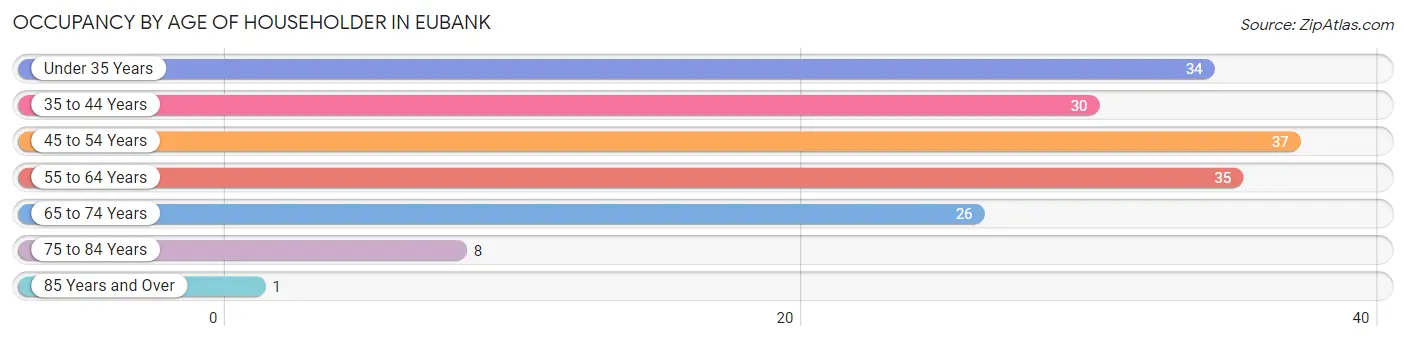
| Age Bracket | # Households | % Households |
| Under 35 Years | 34 | 19.9% |
| 35 to 44 Years | 30 | 17.5% |
| 45 to 54 Years | 37 | 21.6% |
| 55 to 64 Years | 35 | 20.5% |
| 65 to 74 Years | 26 | 15.2% |
| 75 to 84 Years | 8 | 4.7% |
| 85 Years and Over | 1 | 0.6% |
| Total | 171 | 100.0% |
Housing Finances in Eubank
Median Income by Occupancy in Eubank
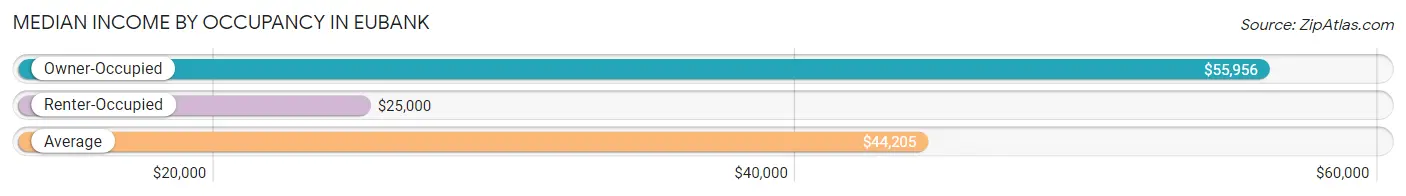
| Occupancy Type | # Households | Median Income |
| Owner-Occupied | 99 (57.9%) | $55,956 |
| Renter-Occupied | 72 (42.1%) | $25,000 |
| Average | 171 (100.0%) | $44,205 |
Occupancy by Householder Income Bracket in Eubank
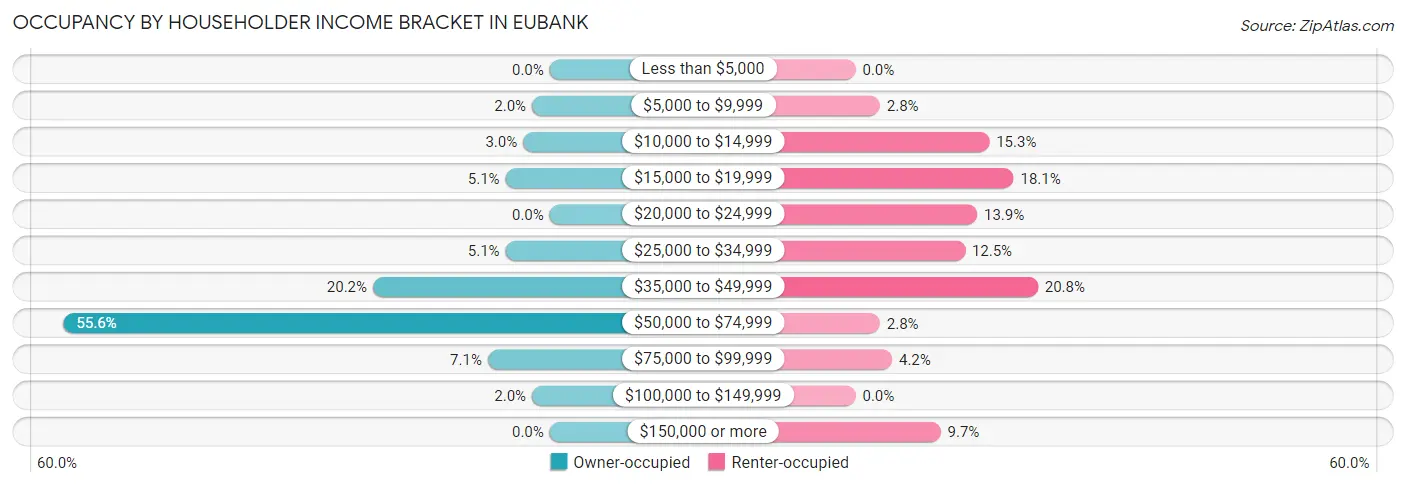
| Income Bracket | Owner-occupied | Renter-occupied |
| Less than $5,000 | 0 (0.0%) | 0 (0.0%) |
| $5,000 to $9,999 | 2 (2.0%) | 2 (2.8%) |
| $10,000 to $14,999 | 3 (3.0%) | 11 (15.3%) |
| $15,000 to $19,999 | 5 (5.1%) | 13 (18.1%) |
| $20,000 to $24,999 | 0 (0.0%) | 10 (13.9%) |
| $25,000 to $34,999 | 5 (5.1%) | 9 (12.5%) |
| $35,000 to $49,999 | 20 (20.2%) | 15 (20.8%) |
| $50,000 to $74,999 | 55 (55.6%) | 2 (2.8%) |
| $75,000 to $99,999 | 7 (7.1%) | 3 (4.2%) |
| $100,000 to $149,999 | 2 (2.0%) | 0 (0.0%) |
| $150,000 or more | 0 (0.0%) | 7 (9.7%) |
| Total | 99 (100.0%) | 72 (100.0%) |
Monthly Housing Cost Tiers in Eubank
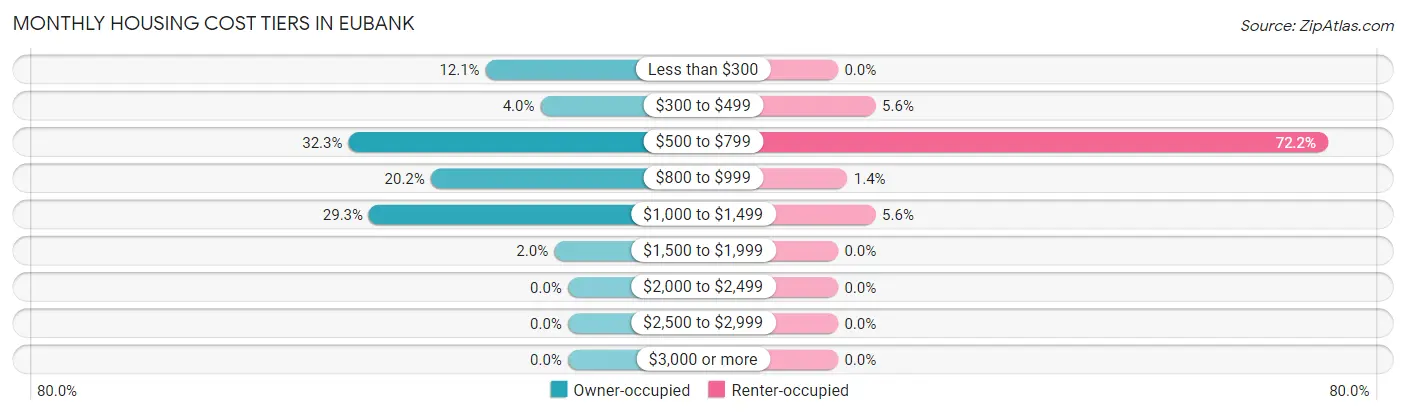
| Monthly Cost | Owner-occupied | Renter-occupied |
| Less than $300 | 12 (12.1%) | 0 (0.0%) |
| $300 to $499 | 4 (4.0%) | 4 (5.6%) |
| $500 to $799 | 32 (32.3%) | 52 (72.2%) |
| $800 to $999 | 20 (20.2%) | 1 (1.4%) |
| $1,000 to $1,499 | 29 (29.3%) | 4 (5.6%) |
| $1,500 to $1,999 | 2 (2.0%) | 0 (0.0%) |
| $2,000 to $2,499 | 0 (0.0%) | 0 (0.0%) |
| $2,500 to $2,999 | 0 (0.0%) | 0 (0.0%) |
| $3,000 or more | 0 (0.0%) | 0 (0.0%) |
| Total | 99 (100.0%) | 72 (100.0%) |
Physical Housing Characteristics in Eubank
Housing Structures in Eubank
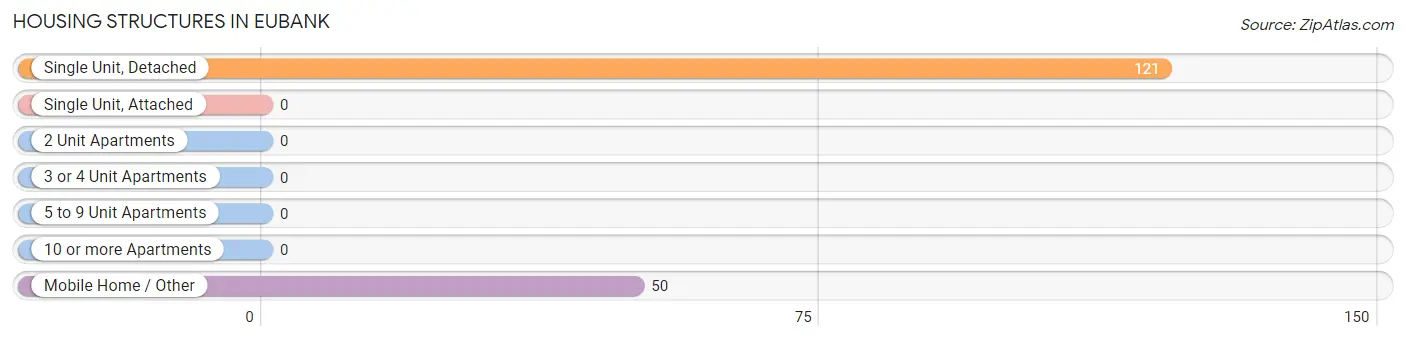
| Structure Type | # Housing Units | % Housing Units |
| Single Unit, Detached | 121 | 70.8% |
| Single Unit, Attached | 0 | 0.0% |
| 2 Unit Apartments | 0 | 0.0% |
| 3 or 4 Unit Apartments | 0 | 0.0% |
| 5 to 9 Unit Apartments | 0 | 0.0% |
| 10 or more Apartments | 0 | 0.0% |
| Mobile Home / Other | 50 | 29.2% |
| Total | 171 | 100.0% |
Housing Structures by Occupancy in Eubank
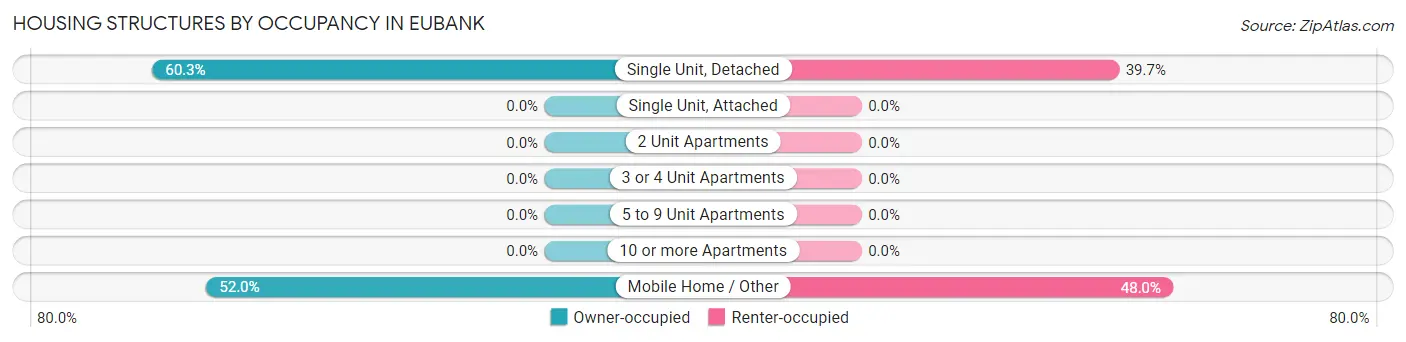
| Structure Type | Owner-occupied | Renter-occupied |
| Single Unit, Detached | 73 (60.3%) | 48 (39.7%) |
| Single Unit, Attached | 0 (0.0%) | 0 (0.0%) |
| 2 Unit Apartments | 0 (0.0%) | 0 (0.0%) |
| 3 or 4 Unit Apartments | 0 (0.0%) | 0 (0.0%) |
| 5 to 9 Unit Apartments | 0 (0.0%) | 0 (0.0%) |
| 10 or more Apartments | 0 (0.0%) | 0 (0.0%) |
| Mobile Home / Other | 26 (52.0%) | 24 (48.0%) |
| Total | 99 (57.9%) | 72 (42.1%) |
Housing Structures by Number of Rooms in Eubank
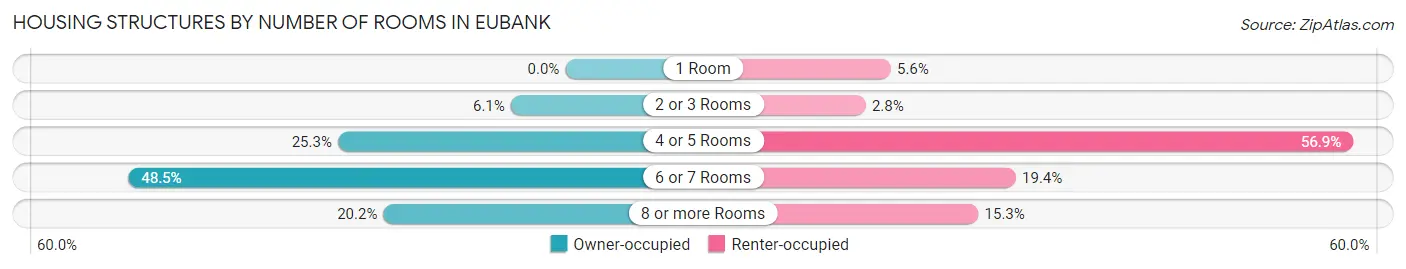
| Number of Rooms | Owner-occupied | Renter-occupied |
| 1 Room | 0 (0.0%) | 4 (5.6%) |
| 2 or 3 Rooms | 6 (6.1%) | 2 (2.8%) |
| 4 or 5 Rooms | 25 (25.3%) | 41 (56.9%) |
| 6 or 7 Rooms | 48 (48.5%) | 14 (19.4%) |
| 8 or more Rooms | 20 (20.2%) | 11 (15.3%) |
| Total | 99 (100.0%) | 72 (100.0%) |
Housing Structure by Heating Type in Eubank
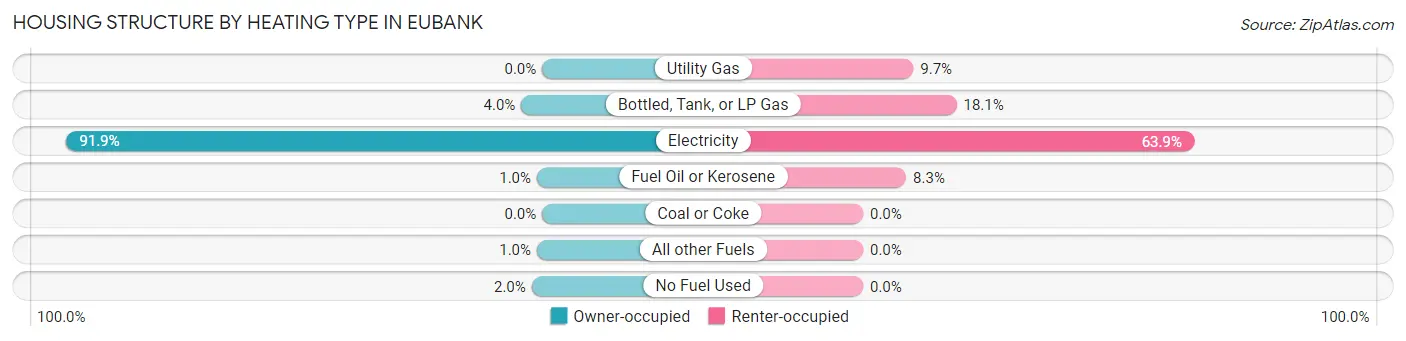
| Heating Type | Owner-occupied | Renter-occupied |
| Utility Gas | 0 (0.0%) | 7 (9.7%) |
| Bottled, Tank, or LP Gas | 4 (4.0%) | 13 (18.1%) |
| Electricity | 91 (91.9%) | 46 (63.9%) |
| Fuel Oil or Kerosene | 1 (1.0%) | 6 (8.3%) |
| Coal or Coke | 0 (0.0%) | 0 (0.0%) |
| All other Fuels | 1 (1.0%) | 0 (0.0%) |
| No Fuel Used | 2 (2.0%) | 0 (0.0%) |
| Total | 99 (100.0%) | 72 (100.0%) |
Household Vehicle Usage in Eubank
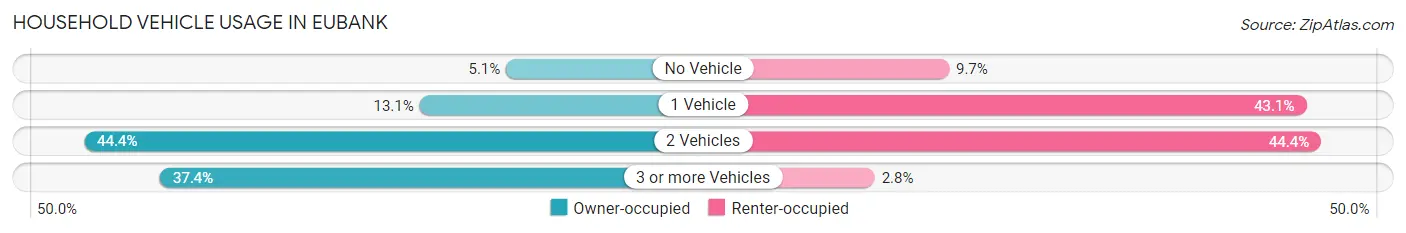
| Vehicles per Household | Owner-occupied | Renter-occupied |
| No Vehicle | 5 (5.1%) | 7 (9.7%) |
| 1 Vehicle | 13 (13.1%) | 31 (43.1%) |
| 2 Vehicles | 44 (44.4%) | 32 (44.4%) |
| 3 or more Vehicles | 37 (37.4%) | 2 (2.8%) |
| Total | 99 (100.0%) | 72 (100.0%) |
Real Estate & Mortgages in Eubank
Real Estate and Mortgage Overview in Eubank
| Characteristic | Without Mortgage | With Mortgage |
| Housing Units | 30 | 69 |
| Median Property Value | $52,500 | $117,100 |
| Median Household Income | $48,750 | $0 |
| Monthly Housing Costs | $467 | $0 |
| Real Estate Taxes | $199 | $2 |
Property Value by Mortgage Status in Eubank
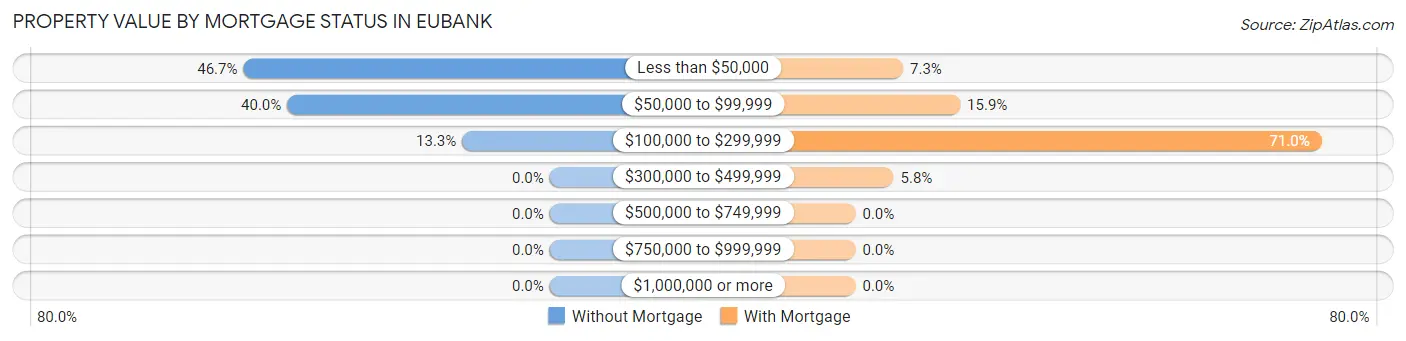
| Property Value | Without Mortgage | With Mortgage |
| Less than $50,000 | 14 (46.7%) | 5 (7.2%) |
| $50,000 to $99,999 | 12 (40.0%) | 11 (15.9%) |
| $100,000 to $299,999 | 4 (13.3%) | 49 (71.0%) |
| $300,000 to $499,999 | 0 (0.0%) | 4 (5.8%) |
| $500,000 to $749,999 | 0 (0.0%) | 0 (0.0%) |
| $750,000 to $999,999 | 0 (0.0%) | 0 (0.0%) |
| $1,000,000 or more | 0 (0.0%) | 0 (0.0%) |
| Total | 30 (100.0%) | 69 (100.0%) |
Household Income by Mortgage Status in Eubank
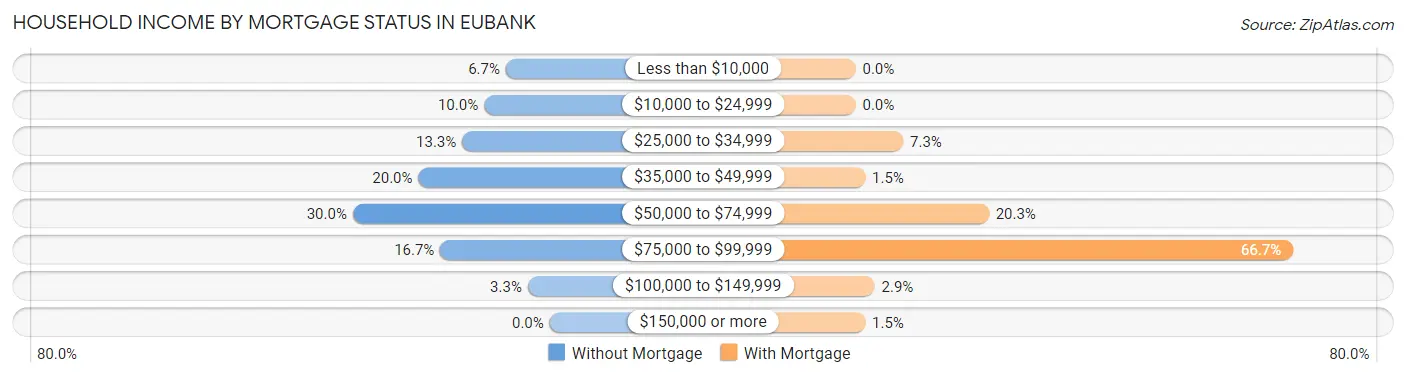
| Household Income | Without Mortgage | With Mortgage |
| Less than $10,000 | 2 (6.7%) | 0 (0.0%) |
| $10,000 to $24,999 | 3 (10.0%) | 0 (0.0%) |
| $25,000 to $34,999 | 4 (13.3%) | 5 (7.2%) |
| $35,000 to $49,999 | 6 (20.0%) | 1 (1.5%) |
| $50,000 to $74,999 | 9 (30.0%) | 14 (20.3%) |
| $75,000 to $99,999 | 5 (16.7%) | 46 (66.7%) |
| $100,000 to $149,999 | 1 (3.3%) | 2 (2.9%) |
| $150,000 or more | 0 (0.0%) | 1 (1.5%) |
| Total | 30 (100.0%) | 69 (100.0%) |
Property Value to Household Income Ratio in Eubank
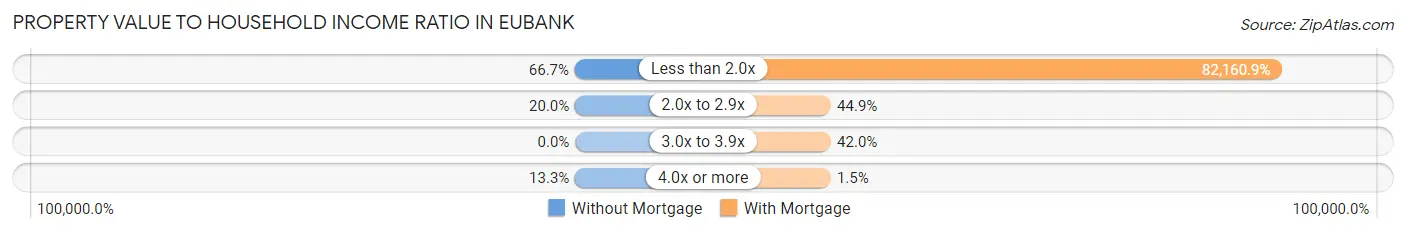
| Value-to-Income Ratio | Without Mortgage | With Mortgage |
| Less than 2.0x | 20 (66.7%) | 56,691 (82,160.9%) |
| 2.0x to 2.9x | 6 (20.0%) | 31 (44.9%) |
| 3.0x to 3.9x | 0 (0.0%) | 29 (42.0%) |
| 4.0x or more | 4 (13.3%) | 1 (1.5%) |
| Total | 30 (100.0%) | 69 (100.0%) |
Real Estate Taxes by Mortgage Status in Eubank
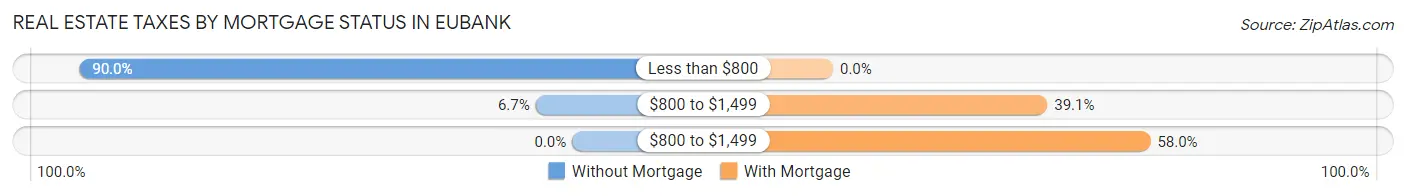
| Property Taxes | Without Mortgage | With Mortgage |
| Less than $800 | 27 (90.0%) | 0 (0.0%) |
| $800 to $1,499 | 2 (6.7%) | 27 (39.1%) |
| $800 to $1,499 | 0 (0.0%) | 40 (58.0%) |
| Total | 30 (100.0%) | 69 (100.0%) |
Health & Disability in Eubank
Health Insurance Coverage by Age in Eubank
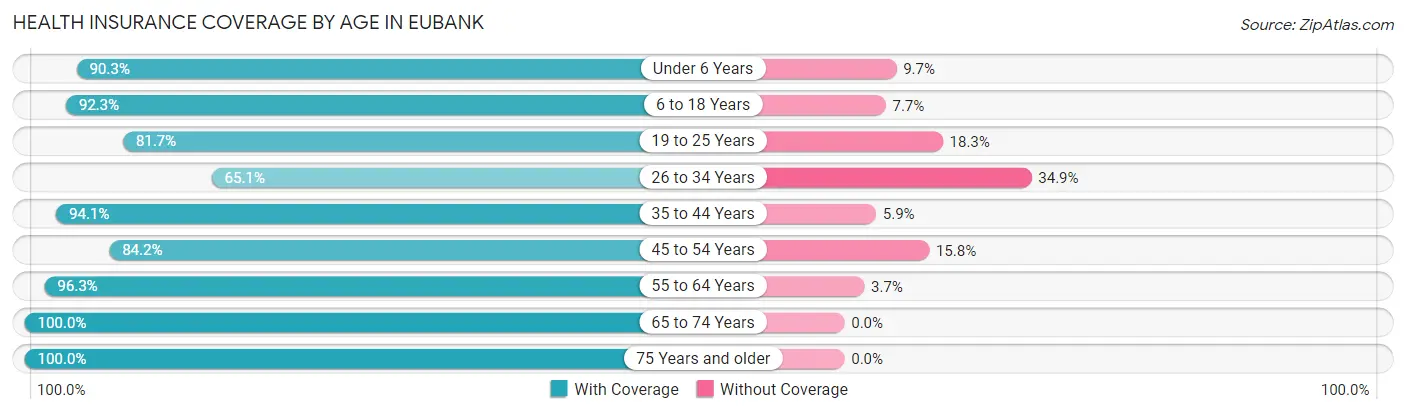
| Age Bracket | With Coverage | Without Coverage |
| Under 6 Years | 28 (90.3%) | 3 (9.7%) |
| 6 to 18 Years | 96 (92.3%) | 8 (7.7%) |
| 19 to 25 Years | 49 (81.7%) | 11 (18.3%) |
| 26 to 34 Years | 28 (65.1%) | 15 (34.9%) |
| 35 to 44 Years | 48 (94.1%) | 3 (5.9%) |
| 45 to 54 Years | 64 (84.2%) | 12 (15.8%) |
| 55 to 64 Years | 52 (96.3%) | 2 (3.7%) |
| 65 to 74 Years | 42 (100.0%) | 0 (0.0%) |
| 75 Years and older | 10 (100.0%) | 0 (0.0%) |
| Total | 417 (88.5%) | 54 (11.5%) |
Health Insurance Coverage by Citizenship Status in Eubank
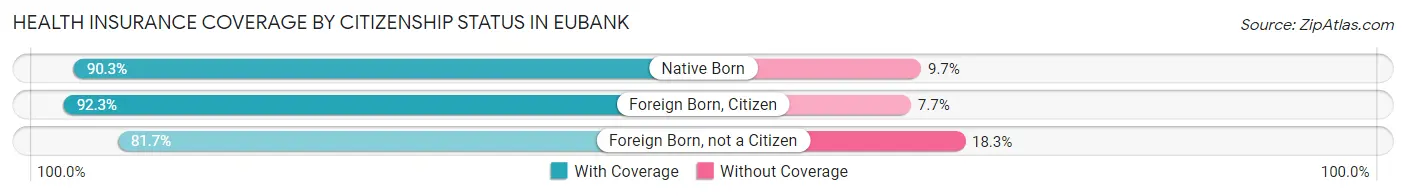
| Citizenship Status | With Coverage | Without Coverage |
| Native Born | 28 (90.3%) | 3 (9.7%) |
| Foreign Born, Citizen | 96 (92.3%) | 8 (7.7%) |
| Foreign Born, not a Citizen | 49 (81.7%) | 11 (18.3%) |
Health Insurance Coverage by Household Income in Eubank
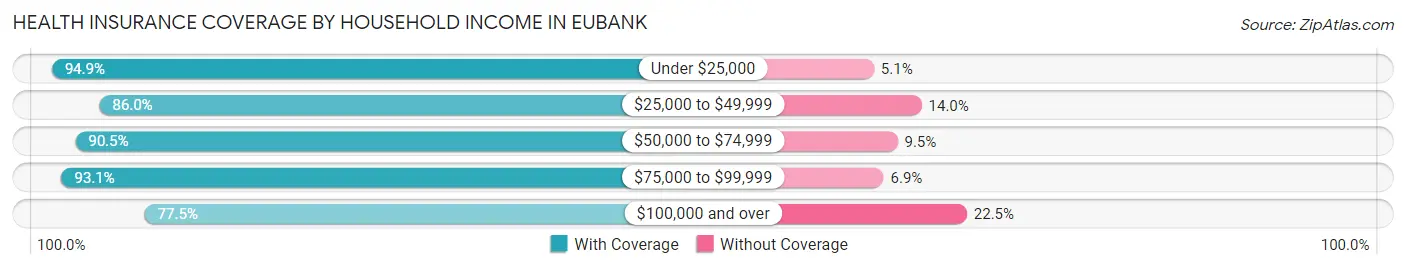
| Household Income | With Coverage | Without Coverage |
| Under $25,000 | 56 (94.9%) | 3 (5.1%) |
| $25,000 to $49,999 | 141 (86.0%) | 23 (14.0%) |
| $50,000 to $74,999 | 162 (90.5%) | 17 (9.5%) |
| $75,000 to $99,999 | 27 (93.1%) | 2 (6.9%) |
| $100,000 and over | 31 (77.5%) | 9 (22.5%) |
Public vs Private Health Insurance Coverage by Age in Eubank
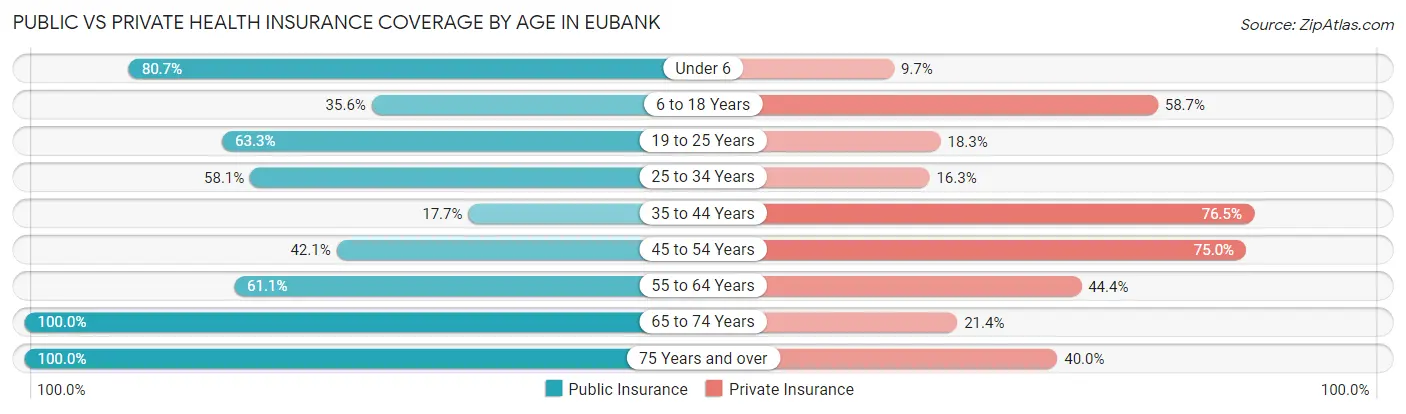
| Age Bracket | Public Insurance | Private Insurance |
| Under 6 | 25 (80.6%) | 3 (9.7%) |
| 6 to 18 Years | 37 (35.6%) | 61 (58.7%) |
| 19 to 25 Years | 38 (63.3%) | 11 (18.3%) |
| 25 to 34 Years | 25 (58.1%) | 7 (16.3%) |
| 35 to 44 Years | 9 (17.6%) | 39 (76.5%) |
| 45 to 54 Years | 32 (42.1%) | 57 (75.0%) |
| 55 to 64 Years | 33 (61.1%) | 24 (44.4%) |
| 65 to 74 Years | 42 (100.0%) | 9 (21.4%) |
| 75 Years and over | 10 (100.0%) | 4 (40.0%) |
| Total | 251 (53.3%) | 215 (45.7%) |
Disability Status by Sex by Age in Eubank
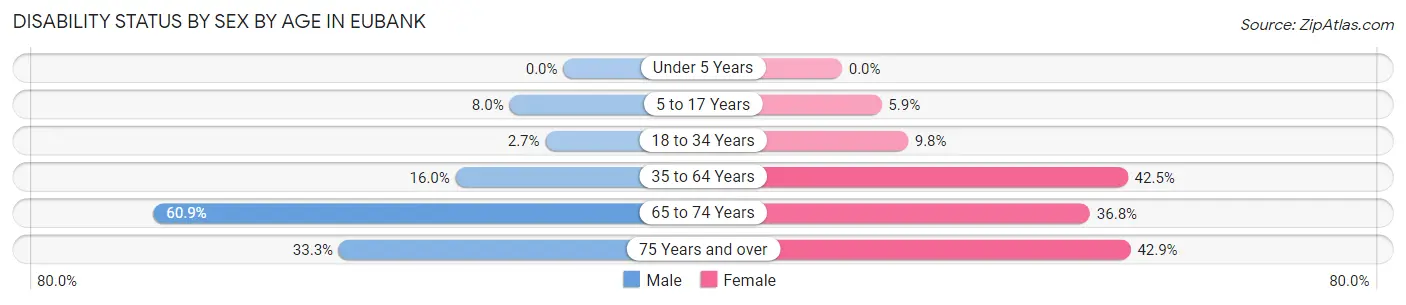
| Age Bracket | Male | Female |
| Under 5 Years | 0 (0.0%) | 0 (0.0%) |
| 5 to 17 Years | 4 (8.0%) | 2 (5.9%) |
| 18 to 34 Years | 2 (2.7%) | 5 (9.8%) |
| 35 to 64 Years | 12 (16.0%) | 45 (42.4%) |
| 65 to 74 Years | 14 (60.9%) | 7 (36.8%) |
| 75 Years and over | 1 (33.3%) | 3 (42.9%) |
Disability Class by Sex by Age in Eubank
Disability Class: Hearing Difficulty
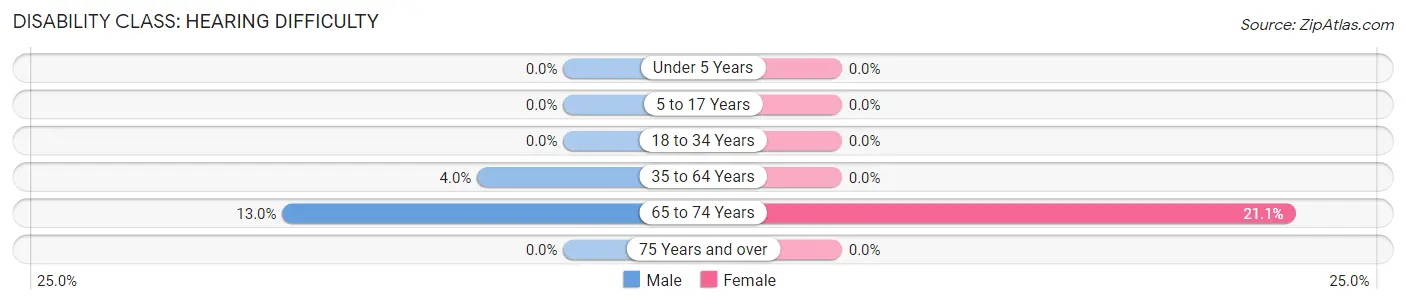
| Age Bracket | Male | Female |
| Under 5 Years | 0 (0.0%) | 0 (0.0%) |
| 5 to 17 Years | 0 (0.0%) | 0 (0.0%) |
| 18 to 34 Years | 0 (0.0%) | 0 (0.0%) |
| 35 to 64 Years | 3 (4.0%) | 0 (0.0%) |
| 65 to 74 Years | 3 (13.0%) | 4 (21.0%) |
| 75 Years and over | 0 (0.0%) | 0 (0.0%) |
Disability Class: Vision Difficulty
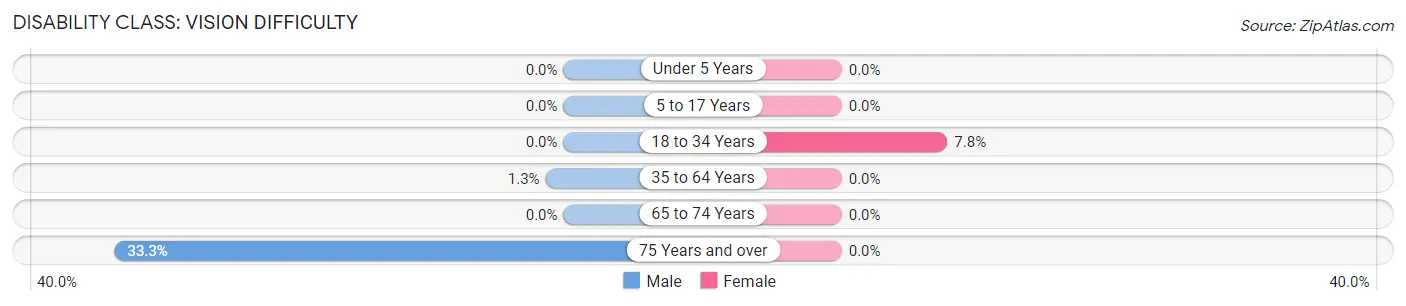
| Age Bracket | Male | Female |
| Under 5 Years | 0 (0.0%) | 0 (0.0%) |
| 5 to 17 Years | 0 (0.0%) | 0 (0.0%) |
| 18 to 34 Years | 0 (0.0%) | 4 (7.8%) |
| 35 to 64 Years | 1 (1.3%) | 0 (0.0%) |
| 65 to 74 Years | 0 (0.0%) | 0 (0.0%) |
| 75 Years and over | 1 (33.3%) | 0 (0.0%) |
Disability Class: Cognitive Difficulty
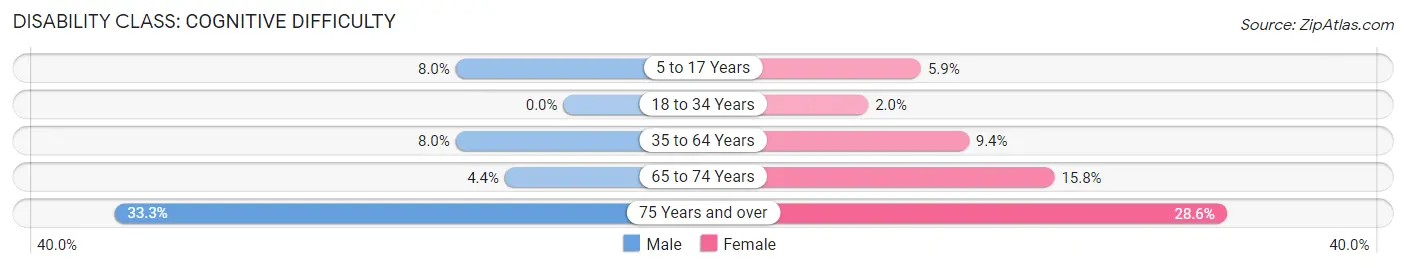
| Age Bracket | Male | Female |
| 5 to 17 Years | 4 (8.0%) | 2 (5.9%) |
| 18 to 34 Years | 0 (0.0%) | 1 (2.0%) |
| 35 to 64 Years | 6 (8.0%) | 10 (9.4%) |
| 65 to 74 Years | 1 (4.3%) | 3 (15.8%) |
| 75 Years and over | 1 (33.3%) | 2 (28.6%) |
Disability Class: Ambulatory Difficulty
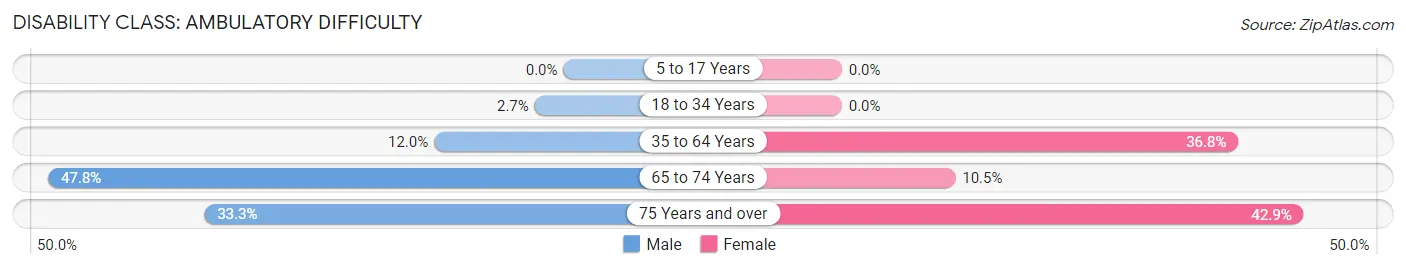
| Age Bracket | Male | Female |
| 5 to 17 Years | 0 (0.0%) | 0 (0.0%) |
| 18 to 34 Years | 2 (2.7%) | 0 (0.0%) |
| 35 to 64 Years | 9 (12.0%) | 39 (36.8%) |
| 65 to 74 Years | 11 (47.8%) | 2 (10.5%) |
| 75 Years and over | 1 (33.3%) | 3 (42.9%) |
Disability Class: Self-Care Difficulty
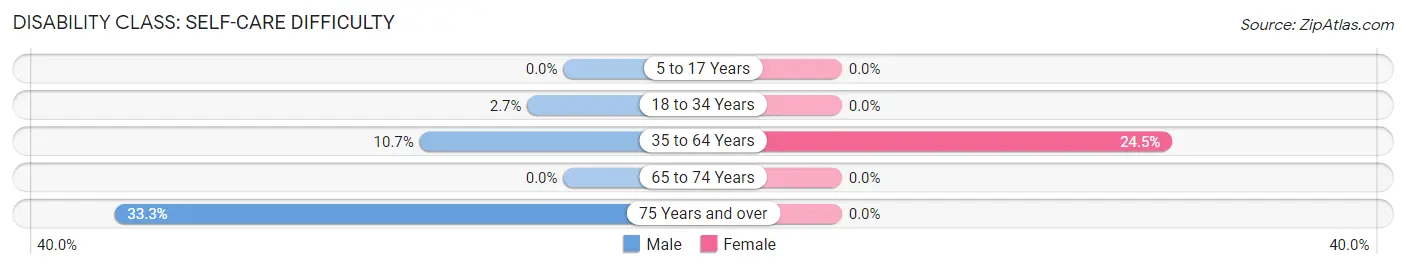
| Age Bracket | Male | Female |
| 5 to 17 Years | 0 (0.0%) | 0 (0.0%) |
| 18 to 34 Years | 2 (2.7%) | 0 (0.0%) |
| 35 to 64 Years | 8 (10.7%) | 26 (24.5%) |
| 65 to 74 Years | 0 (0.0%) | 0 (0.0%) |
| 75 Years and over | 1 (33.3%) | 0 (0.0%) |
Technology Access in Eubank
Computing Device Access in Eubank
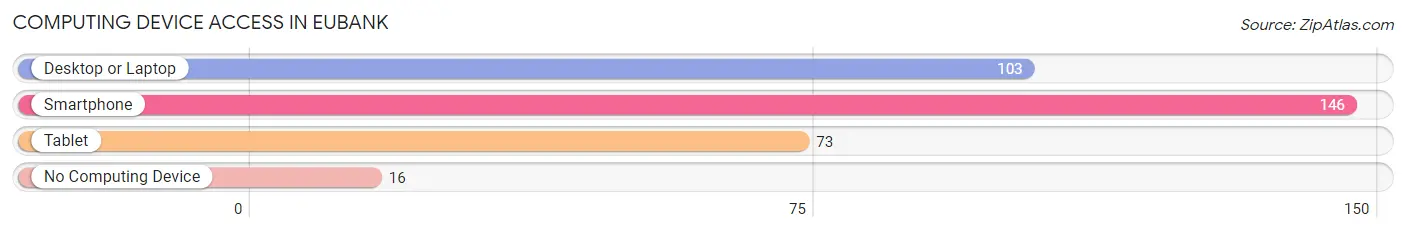
| Device Type | # Households | % Households |
| Desktop or Laptop | 103 | 60.2% |
| Smartphone | 146 | 85.4% |
| Tablet | 73 | 42.7% |
| No Computing Device | 16 | 9.4% |
| Total | 171 | 100.0% |
Internet Access in Eubank
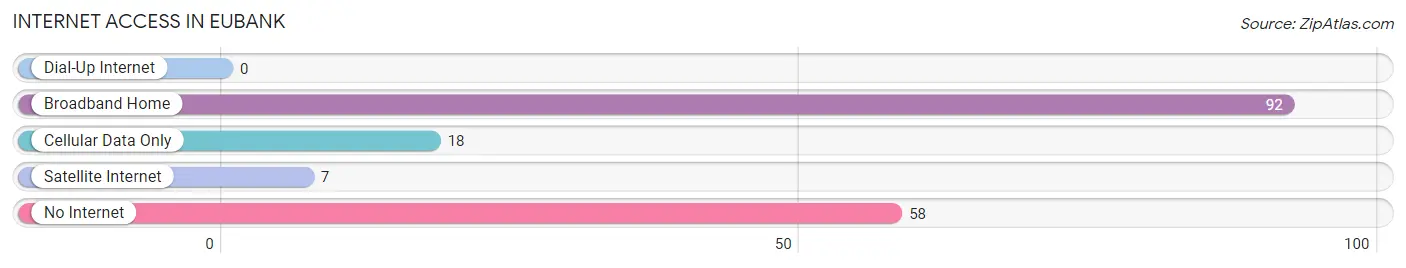
| Internet Type | # Households | % Households |
| Dial-Up Internet | 0 | 0.0% |
| Broadband Home | 92 | 53.8% |
| Cellular Data Only | 18 | 10.5% |
| Satellite Internet | 7 | 4.1% |
| No Internet | 58 | 33.9% |
| Total | 171 | 100.0% |
Eubank Summary
Eubank, Kentucky is a small town located in Pulaski County, Kentucky. It is situated in the foothills of the Appalachian Mountains and is part of the Cumberland Plateau. The town was founded in 1820 and has a population of approximately 1,000 people.
Geography
Eubank is located in the southeastern part of Pulaski County, Kentucky. It is situated in the foothills of the Appalachian Mountains and is part of the Cumberland Plateau. The town is located at an elevation of 890 feet above sea level. The town is surrounded by rolling hills and is located near the Cumberland River. The climate in Eubank is humid subtropical, with hot summers and mild winters.
Economy
The economy of Eubank is largely based on agriculture and forestry. The town is home to several farms and timber companies. The town also has a few small businesses, including a grocery store, a hardware store, and a few restaurants. The town is also home to a few manufacturing companies, including a furniture factory and a plastics factory.
Demographics
As of the 2010 census, the population of Eubank was 1,000 people. The racial makeup of the town was 97.2% White, 0.7% African American, 0.2% Native American, 0.2% Asian, 0.2% from other races, and 1.7% from two or more races. The median household income in Eubank was $30,000, and the median family income was $35,000.
History
Eubank was founded in 1820 by a group of settlers from North Carolina. The town was named after a local family, the Eubanks. The town was originally a farming community, and the main crops grown were corn, wheat, and tobacco. In the late 19th century, the town began to grow as the timber industry began to expand in the area. The town was also home to several coal mines, which provided employment for many of the town’s residents.
In the early 20th century, the town began to decline as the timber industry began to decline. The town was also affected by the Great Depression, and many of the town’s residents left in search of work. In the late 20th century, the town began to experience a resurgence as the timber industry began to recover. The town is now home to several small businesses and is a popular tourist destination.
Common Questions
What is Per Capita Income in Eubank?
Per Capita income in Eubank is $20,280.
What is the Median Family Income in Eubank?
Median Family Income in Eubank is $46,875.
What is the Median Household income in Eubank?
Median Household Income in Eubank is $44,205.
What is Inequality or Gini Index in Eubank?
Inequality or Gini Index in Eubank is 0.38.
What is the Total Population of Eubank?
Total Population of Eubank is 471.
What is the Total Male Population of Eubank?
Total Male Population of Eubank is 242.
What is the Total Female Population of Eubank?
Total Female Population of Eubank is 229.
What is the Ratio of Males per 100 Females in Eubank?
There are 105.68 Males per 100 Females in Eubank.
What is the Ratio of Females per 100 Males in Eubank?
There are 94.63 Females per 100 Males in Eubank.
What is the Median Population Age in Eubank?
Median Population Age in Eubank is 33.4 Years.
What is the Average Family Size in Eubank
Average Family Size in Eubank is 3.1 People.
What is the Average Household Size in Eubank
Average Household Size in Eubank is 2.8 People.
How Large is the Labor Force in Eubank?
There are 193 People in the Labor Forcein in Eubank.
What is the Percentage of People in the Labor Force in Eubank?
50.3% of People are in the Labor Force in Eubank.
What is the Unemployment Rate in Eubank?
Unemployment Rate in Eubank is 13.0%.