Zip Codes with the Highest Percentage of Population with a Degree in Liberal Arts and History in the United States
RELATED REPORTS & OPTIONS
Liberal Arts and History
United States
Compare Zip Codes
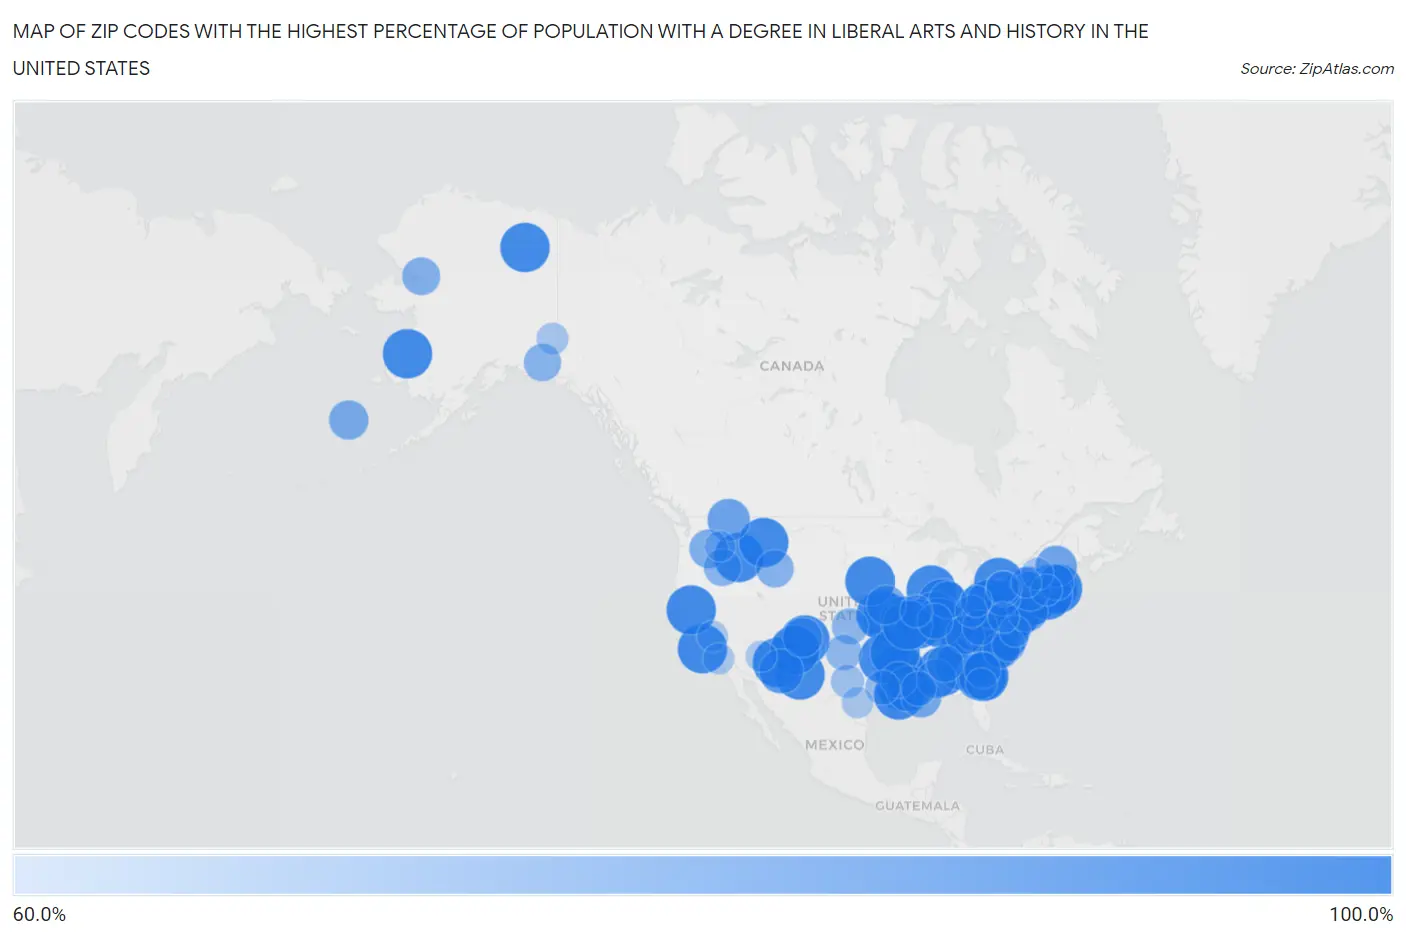
Map of Zip Codes with the Highest Percentage of Population with a Degree in Liberal Arts and History in the United States
60.0%
100.0%
Zip Codes with the Highest Percentage of Population with a Degree in Liberal Arts and History in the United States
| Zip Code | % Graduates | vs State | vs National | |
| 1. | 93410 | 100.0% | 5.5%(+94.5)#1 | 4.9%(+95.1)#1 |
| 2. | 21252 | 100.0% | 5.0%(+95.0)#1 | 4.9%(+95.1)#2 |
| 3. | 28223 | 100.0% | 4.9%(+95.1)#1 | 4.9%(+95.1)#3 |
| 4. | 30609 | 100.0% | 4.1%(+95.9)#1 | 4.9%(+95.1)#4 |
| 5. | 02918 | 100.0% | 5.5%(+94.5)#1 | 4.9%(+95.1)#5 |
| 6. | 21250 | 100.0% | 5.0%(+95.0)#2 | 4.9%(+95.1)#6 |
| 7. | 30597 | 100.0% | 4.1%(+95.9)#2 | 4.9%(+95.1)#7 |
| 8. | 88004 | 100.0% | 5.5%(+94.5)#1 | 4.9%(+95.1)#8 |
| 9. | 87530 | 100.0% | 5.5%(+94.5)#2 | 4.9%(+95.1)#9 |
| 10. | 15451 | 100.0% | 4.6%(+95.4)#1 | 4.9%(+95.1)#10 |
| 11. | 85926 | 100.0% | 4.3%(+95.7)#1 | 4.9%(+95.1)#11 |
| 12. | 64147 | 100.0% | 4.6%(+95.4)#1 | 4.9%(+95.1)#12 |
| 13. | 36790 | 100.0% | 4.6%(+95.4)#1 | 4.9%(+95.1)#13 |
| 14. | 30250 | 100.0% | 4.1%(+95.9)#3 | 4.9%(+95.1)#14 |
| 15. | 24811 | 100.0% | 4.5%(+95.5)#1 | 4.9%(+95.1)#15 |
| 16. | 31318 | 100.0% | 4.1%(+95.9)#4 | 4.9%(+95.1)#16 |
| 17. | 18221 | 100.0% | 4.6%(+95.4)#2 | 4.9%(+95.1)#17 |
| 18. | 66429 | 100.0% | 4.6%(+95.4)#1 | 4.9%(+95.1)#18 |
| 19. | 83677 | 100.0% | 4.2%(+95.8)#1 | 4.9%(+95.1)#19 |
| 20. | 95913 | 100.0% | 5.5%(+94.5)#2 | 4.9%(+95.1)#20 |
| 21. | 87049 | 100.0% | 5.5%(+94.5)#3 | 4.9%(+95.1)#21 |
| 22. | 24869 | 100.0% | 4.5%(+95.5)#2 | 4.9%(+95.1)#22 |
| 23. | 23952 | 100.0% | 5.9%(+94.1)#1 | 4.9%(+95.1)#23 |
| 24. | 12720 | 100.0% | 5.7%(+94.3)#1 | 4.9%(+95.1)#24 |
| 25. | 70585 | 100.0% | 7.4%(+92.6)#1 | 4.9%(+95.1)#25 |
| 26. | 60539 | 100.0% | 4.7%(+95.3)#1 | 4.9%(+95.1)#26 |
| 27. | 70632 | 100.0% | 7.4%(+92.6)#2 | 4.9%(+95.1)#27 |
| 28. | 02366 | 100.0% | 5.5%(+94.5)#1 | 4.9%(+95.1)#28 |
| 29. | 99585 | 100.0% | 5.6%(+94.4)#1 | 4.9%(+95.1)#29 |
| 30. | 99722 | 100.0% | 5.6%(+94.4)#2 | 4.9%(+95.1)#30 |
| 31. | 25666 | 100.0% | 4.5%(+95.5)#3 | 4.9%(+95.1)#31 |
| 32. | 25090 | 100.0% | 4.5%(+95.5)#4 | 4.9%(+95.1)#32 |
| 33. | 65048 | 100.0% | 4.6%(+95.4)#2 | 4.9%(+95.1)#33 |
| 34. | 47983 | 100.0% | 5.8%(+94.2)#1 | 4.9%(+95.1)#34 |
| 35. | 62464 | 100.0% | 4.7%(+95.3)#2 | 4.9%(+95.1)#35 |
| 36. | 59625 | 100.0% | 5.3%(+94.7)#1 | 4.9%(+95.1)#36 |
| 37. | 71048 | 100.0% | 7.4%(+92.6)#3 | 4.9%(+95.1)#37 |
| 38. | 43972 | 100.0% | 4.2%(+95.8)#1 | 4.9%(+95.1)#38 |
| 39. | 74755 | 100.0% | 4.9%(+95.1)#1 | 4.9%(+95.1)#39 |
| 40. | 72828 | 100.0% | 4.9%(+95.1)#1 | 4.9%(+95.1)#40 |
| 41. | 18357 | 100.0% | 4.6%(+95.4)#3 | 4.9%(+95.1)#41 |
| 42. | 08890 | 100.0% | 4.6%(+95.4)#1 | 4.9%(+95.1)#42 |
| 43. | 62279 | 100.0% | 4.7%(+95.3)#3 | 4.9%(+95.1)#43 |
| 44. | 68751 | 100.0% | 4.0%(+96.0)#1 | 4.9%(+95.1)#44 |
| 45. | 14035 | 100.0% | 5.7%(+94.3)#2 | 4.9%(+95.1)#45 |
| 46. | 06390 | 100.0% | 5.7%(+94.3)#3 | 4.9%(+95.1)#46 |
| 47. | 27340 | 100.0% | 4.9%(+95.1)#2 | 4.9%(+95.1)#47 |
| 48. | 47683 | 100.0% | 5.8%(+94.2)#2 | 4.9%(+95.1)#48 |
| 49. | 31421 | 100.0% | 4.1%(+95.9)#5 | 4.9%(+95.1)#49 |
| 50. | 65409 | 100.0% | 4.6%(+95.4)#3 | 4.9%(+95.1)#50 |
| 51. | 15123 | 100.0% | 4.6%(+95.4)#4 | 4.9%(+95.1)#51 |
| 52. | 70756 | 92.6% | 7.4%(+85.1)#4 | 4.9%(+87.7)#52 |
| 53. | 85551 | 89.5% | 4.3%(+85.2)#2 | 4.9%(+84.6)#53 |
| 54. | 83848 | 85.5% | 4.2%(+81.3)#2 | 4.9%(+80.6)#54 |
| 55. | 04267 | 83.3% | 6.4%(+77.0)#1 | 4.9%(+78.5)#55 |
| 56. | 08350 | 81.4% | 4.6%(+76.8)#2 | 4.9%(+76.5)#56 |
| 57. | 70082 | 80.4% | 7.4%(+73.0)#5 | 4.9%(+75.6)#57 |
| 58. | 36446 | 79.4% | 4.6%(+74.9)#2 | 4.9%(+74.5)#58 |
| 59. | 87575 | 79.3% | 5.5%(+73.9)#4 | 4.9%(+74.4)#59 |
| 60. | 99660 | 79.2% | 5.6%(+73.5)#3 | 4.9%(+74.3)#60 |
| 61. | 64433 | 79.1% | 4.6%(+74.5)#4 | 4.9%(+74.2)#61 |
| 62. | 12781 | 79.1% | 5.7%(+73.4)#4 | 4.9%(+74.2)#62 |
| 63. | 99345 | 78.1% | 5.1%(+73.0)#1 | 4.9%(+73.3)#63 |
| 64. | 40997 | 76.9% | 5.3%(+71.6)#1 | 4.9%(+72.1)#64 |
| 65. | 99770 | 76.2% | 5.6%(+70.6)#4 | 4.9%(+71.3)#65 |
| 66. | 83013 | 75.5% | 4.7%(+70.7)#1 | 4.9%(+70.6)#66 |
| 67. | 46967 | 75.0% | 5.8%(+69.2)#3 | 4.9%(+70.1)#67 |
| 68. | 99566 | 75.0% | 5.6%(+69.4)#5 | 4.9%(+70.1)#68 |
| 69. | 97920 | 75.0% | 6.1%(+68.9)#1 | 4.9%(+70.1)#69 |
| 70. | 35052 | 73.7% | 4.6%(+69.1)#3 | 4.9%(+68.8)#70 |
| 71. | 28331 | 73.3% | 4.9%(+68.4)#3 | 4.9%(+68.5)#71 |
| 72. | 71452 | 73.1% | 7.4%(+65.6)#6 | 4.9%(+68.2)#72 |
| 73. | 67882 | 72.7% | 4.6%(+68.2)#2 | 4.9%(+67.9)#73 |
| 74. | 29923 | 72.7% | 5.2%(+67.5)#1 | 4.9%(+67.9)#74 |
| 75. | 16825 | 72.6% | 4.6%(+68.0)#5 | 4.9%(+67.7)#75 |
| 76. | 16750 | 71.4% | 4.6%(+66.8)#6 | 4.9%(+66.6)#76 |
| 77. | 79240 | 71.4% | 4.2%(+67.3)#1 | 4.9%(+66.6)#77 |
| 78. | 62852 | 71.4% | 4.7%(+66.7)#4 | 4.9%(+66.6)#78 |
| 79. | 24849 | 71.1% | 4.5%(+66.6)#5 | 4.9%(+66.2)#79 |
| 80. | 01965 | 70.9% | 5.5%(+65.4)#2 | 4.9%(+66.0)#80 |
| 81. | 70457 | 69.8% | 7.4%(+62.3)#7 | 4.9%(+64.9)#81 |
| 82. | 77359 | 69.2% | 4.2%(+65.1)#2 | 4.9%(+64.4)#82 |
| 83. | 27827 | 66.7% | 4.9%(+61.8)#4 | 4.9%(+61.8)#83 |
| 84. | 76940 | 66.7% | 4.2%(+62.5)#3 | 4.9%(+61.8)#84 |
| 85. | 14788 | 65.5% | 5.7%(+59.8)#5 | 4.9%(+60.6)#85 |
| 86. | 62078 | 65.0% | 4.7%(+60.3)#5 | 4.9%(+60.1)#86 |
| 87. | 43101 | 64.7% | 4.2%(+60.5)#2 | 4.9%(+59.8)#87 |
| 88. | 12821 | 64.6% | 5.7%(+58.9)#6 | 4.9%(+59.7)#88 |
| 89. | 99764 | 64.3% | 5.6%(+58.6)#6 | 4.9%(+59.4)#89 |
| 90. | 78005 | 63.2% | 4.2%(+59.1)#4 | 4.9%(+58.3)#90 |
| 91. | 06269 | 62.9% | 5.5%(+57.4)#1 | 4.9%(+58.0)#91 |
| 92. | 44661 | 62.9% | 4.2%(+58.7)#3 | 4.9%(+58.0)#92 |
| 93. | 86329 | 62.5% | 4.3%(+58.2)#3 | 4.9%(+57.6)#93 |
| 94. | 23691 | 62.5% | 5.9%(+56.6)#2 | 4.9%(+57.6)#94 |
| 95. | 31561 | 62.5% | 4.1%(+58.4)#6 | 4.9%(+57.6)#95 |
| 96. | 93621 | 62.5% | 5.5%(+57.0)#3 | 4.9%(+57.6)#96 |
| 97. | 91046 | 62.5% | 5.5%(+57.0)#4 | 4.9%(+57.6)#97 |
| 98. | 22623 | 62.0% | 5.9%(+56.1)#3 | 4.9%(+57.1)#98 |
| 99. | 99329 | 61.5% | 5.1%(+56.4)#2 | 4.9%(+56.7)#99 |
| 100. | 13861 | 60.8% | 5.7%(+55.1)#7 | 4.9%(+55.9)#100 |
Common Questions
What are the Top 10 Zip Codes with the Highest Percentage of Population with a Degree in Liberal Arts and History in the United States?
Top 10 Zip Codes with the Highest Percentage of Population with a Degree in Liberal Arts and History in the United States are:
#1
100.0%
#2
100.0%
#3
100.0%
#4
100.0%
#5
100.0%
#6
100.0%
#7
100.0%
#8
100.0%
#9
100.0%
#10
100.0%
What zip code has the Highest Percentage of Population with a Degree in Liberal Arts and History in the United States?
93410 has the Highest Percentage of Population with a Degree in Liberal Arts and History in the United States with 100.0%.
What is the Percentage of Population with a Degree in Liberal Arts and History in the United States?
Percentage of Population with a Degree in Liberal Arts and History in the United States is 4.9%.