Fort Apache, AZ Map & Demographics
Fort Apache Map
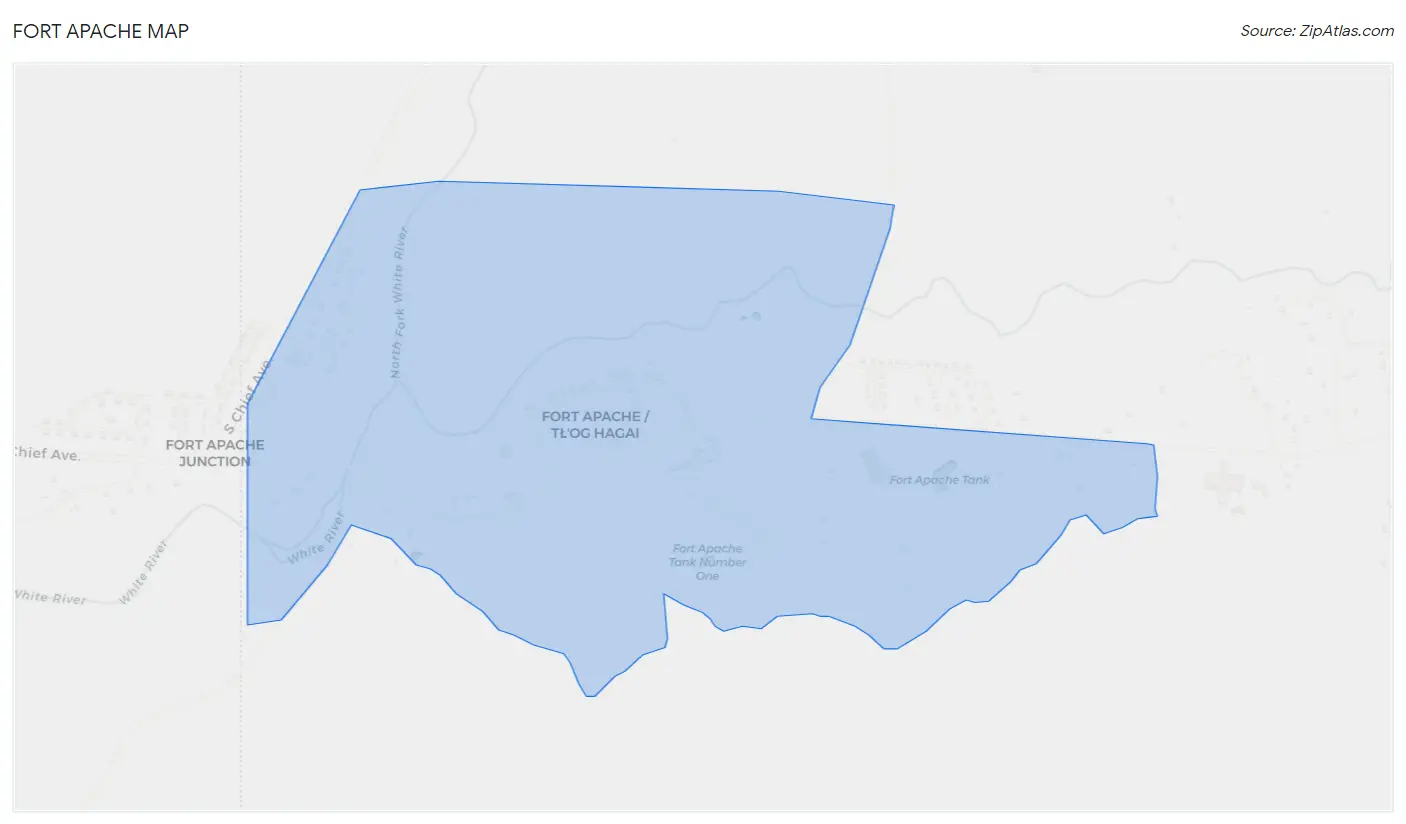
Fort Apache Overview
$19,730
PER CAPITA INCOME
$73,393
AVG HOUSEHOLD INCOME
0.32
INEQUALITY / GINI INDEX
185
TOTAL POPULATION
106
MALE POPULATION
79
FEMALE POPULATION
134.18
MALES / 100 FEMALES
74.53
FEMALES / 100 MALES
26.8
MEDIAN AGE
3.1
AVG FAMILY SIZE
3.0
AVG HOUSEHOLD SIZE
43
LABOR FORCE [ PEOPLE ]
37.1%
PERCENT IN LABOR FORCE
Fort Apache Zip Codes
Fort Apache Area Codes
Income in Fort Apache
Income Overview in Fort Apache
| Characteristic | Number | Measure |
| Per Capita Income | 185 | $19,730 |
| Median Family Income | 54 | $0 |
| Mean Family Income | 54 | $65,706 |
| Median Household Income | 61 | $73,393 |
| Mean Household Income | 61 | $66,738 |
| Income Deficit | 54 | $0 |
| Wage / Income Gap (%) | 185 | 0.00% |
| Wage / Income Gap ($) | 185 | 100.00¢ per $1 |
| Gini / Inequality Index | 185 | 0.32 |
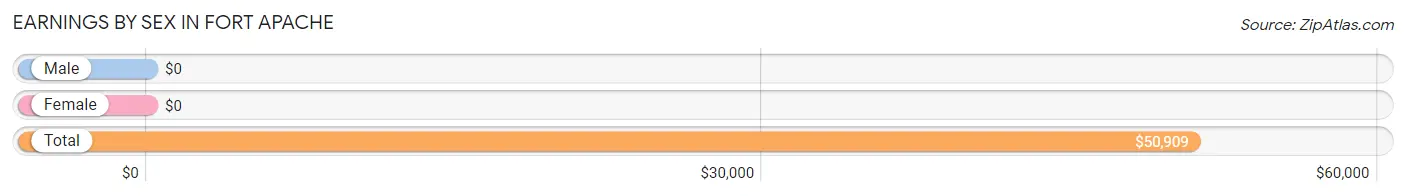
Earnings by Sex in Fort Apache
| Sex | Number | Average Earnings |
| Male | 25 (50.0%) | $0 |
| Female | 25 (50.0%) | $0 |
| Total | 50 (100.0%) | $50,909 |
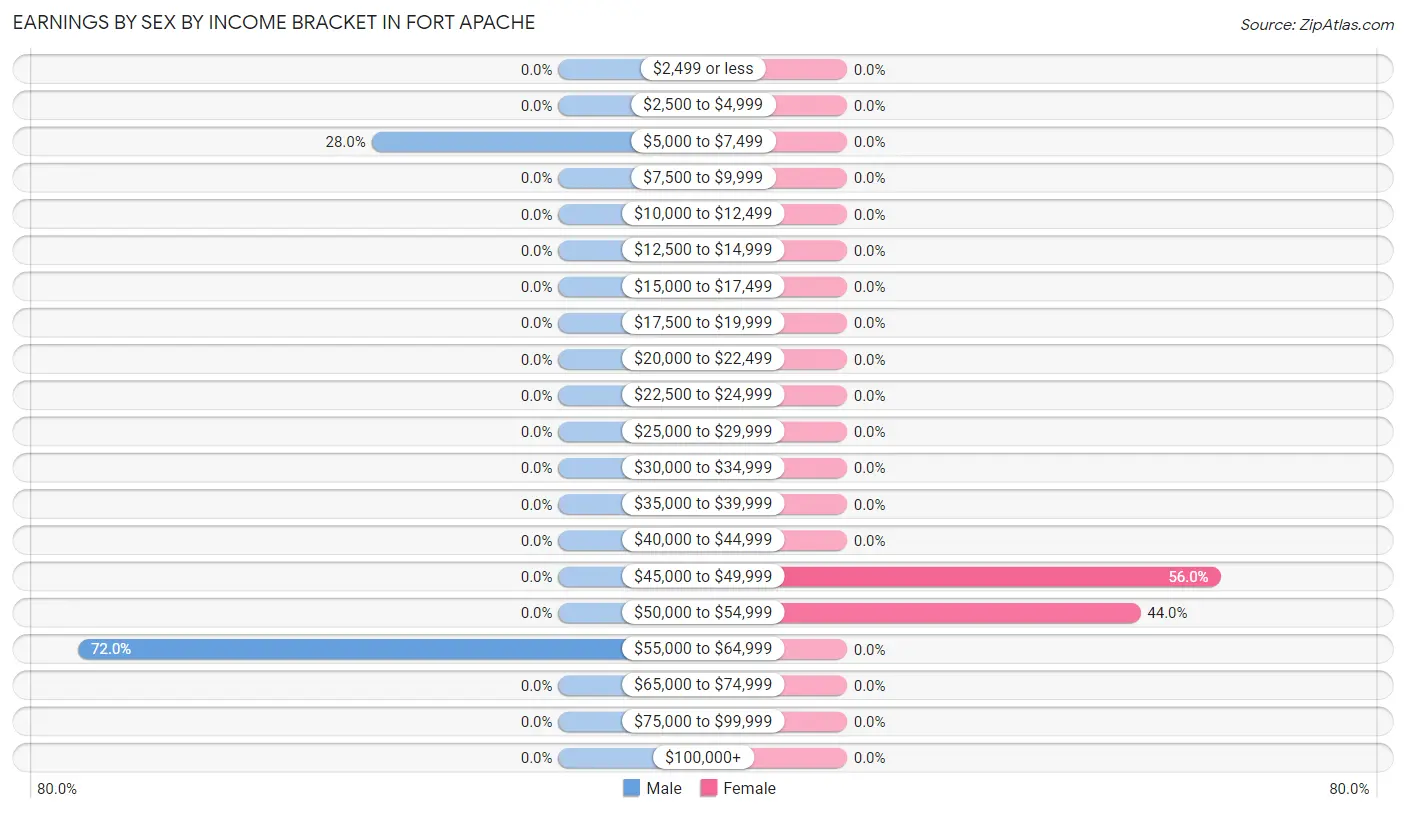
Earnings by Sex by Income Bracket in Fort Apache
The most common earnings brackets in Fort Apache are $55,000 to $64,999 for men (18 | 72.0%) and $45,000 to $49,999 for women (14 | 56.0%).
| Income | Male | Female |
| $2,499 or less | 0 (0.0%) | 0 (0.0%) |
| $2,500 to $4,999 | 0 (0.0%) | 0 (0.0%) |
| $5,000 to $7,499 | 7 (28.0%) | 0 (0.0%) |
| $7,500 to $9,999 | 0 (0.0%) | 0 (0.0%) |
| $10,000 to $12,499 | 0 (0.0%) | 0 (0.0%) |
| $12,500 to $14,999 | 0 (0.0%) | 0 (0.0%) |
| $15,000 to $17,499 | 0 (0.0%) | 0 (0.0%) |
| $17,500 to $19,999 | 0 (0.0%) | 0 (0.0%) |
| $20,000 to $22,499 | 0 (0.0%) | 0 (0.0%) |
| $22,500 to $24,999 | 0 (0.0%) | 0 (0.0%) |
| $25,000 to $29,999 | 0 (0.0%) | 0 (0.0%) |
| $30,000 to $34,999 | 0 (0.0%) | 0 (0.0%) |
| $35,000 to $39,999 | 0 (0.0%) | 0 (0.0%) |
| $40,000 to $44,999 | 0 (0.0%) | 0 (0.0%) |
| $45,000 to $49,999 | 0 (0.0%) | 14 (56.0%) |
| $50,000 to $54,999 | 0 (0.0%) | 11 (44.0%) |
| $55,000 to $64,999 | 18 (72.0%) | 0 (0.0%) |
| $65,000 to $74,999 | 0 (0.0%) | 0 (0.0%) |
| $75,000 to $99,999 | 0 (0.0%) | 0 (0.0%) |
| $100,000+ | 0 (0.0%) | 0 (0.0%) |
| Total | 25 (100.0%) | 25 (100.0%) |
Earnings by Sex by Educational Attainment in Fort Apache
| Educational Attainment | Male Income | Female Income |
| Less than High School | - | - |
| High School Diploma | - | - |
| College or Associate's Degree | - | - |
| Bachelor's Degree | - | - |
| Graduate Degree | - | - |
| Total | - | - |
Family Income in Fort Apache
Family Income Brackets in Fort Apache
According to the Fort Apache family income data, there are 18 families falling into the $100,000 to $149,999 income range, which is the most common income bracket and makes up 33.3% of all families.
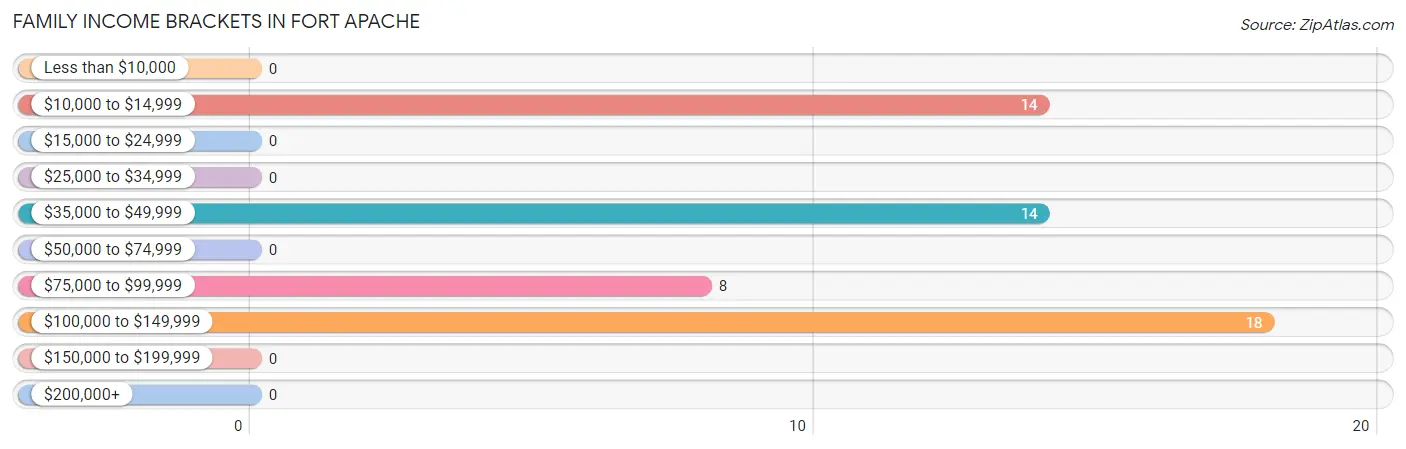
| Income Bracket | # Families | % Families |
| Less than $10,000 | 0 | 0.0% |
| $10,000 to $14,999 | 14 | 25.9% |
| $15,000 to $24,999 | 0 | 0.0% |
| $25,000 to $34,999 | 0 | 0.0% |
| $35,000 to $49,999 | 14 | 25.9% |
| $50,000 to $74,999 | 0 | 0.0% |
| $75,000 to $99,999 | 8 | 14.8% |
| $100,000 to $149,999 | 18 | 33.3% |
| $150,000 to $199,999 | 0 | 0.0% |
| $200,000+ | 0 | 0.0% |
Family Income by Famaliy Size in Fort Apache
| Income Bracket | # Families | Median Income |
| 2-Person Families | 22 (40.7%) | $0 |
| 3-Person Families | 0 (0.0%) | $0 |
| 4-Person Families | 14 (25.9%) | $0 |
| 5-Person Families | 0 (0.0%) | $0 |
| 6-Person Families | 18 (33.3%) | $0 |
| 7+ Person Families | 0 (0.0%) | $0 |
| Total | 54 (100.0%) | $0 |
Family Income by Number of Earners in Fort Apache
| Number of Earners | # Families | Median Income |
| No Earners | 22 (40.7%) | $0 |
| 1 Earner | 14 (25.9%) | $0 |
| 2 Earners | 18 (33.3%) | $0 |
| 3+ Earners | 0 (0.0%) | $0 |
| Total | 54 (100.0%) | $0 |
Household Income in Fort Apache
Household Income Brackets in Fort Apache
With 18 households falling in the category, the $100,000 to $149,999 income range is the most frequent in Fort Apache, accounting for 29.5% of all households.
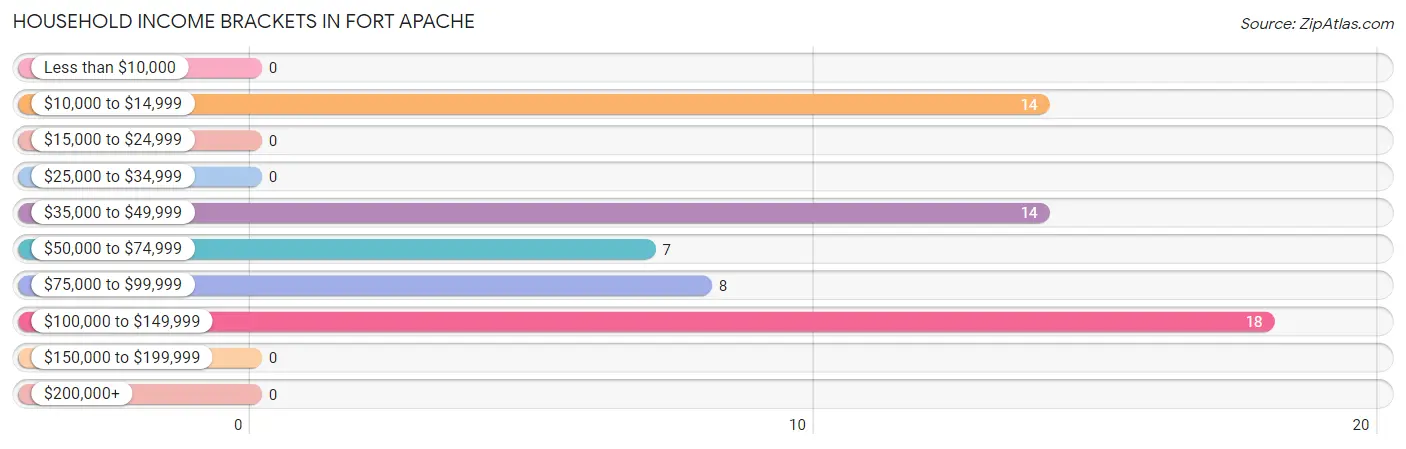
| Income Bracket | # Households | % Households |
| Less than $10,000 | 0 | 0.0% |
| $10,000 to $14,999 | 14 | 23.0% |
| $15,000 to $24,999 | 0 | 0.0% |
| $25,000 to $34,999 | 0 | 0.0% |
| $35,000 to $49,999 | 14 | 23.0% |
| $50,000 to $74,999 | 7 | 11.5% |
| $75,000 to $99,999 | 8 | 13.1% |
| $100,000 to $149,999 | 18 | 29.5% |
| $150,000 to $199,999 | 0 | 0.0% |
| $200,000+ | 0 | 0.0% |
Household Income by Householder Age in Fort Apache
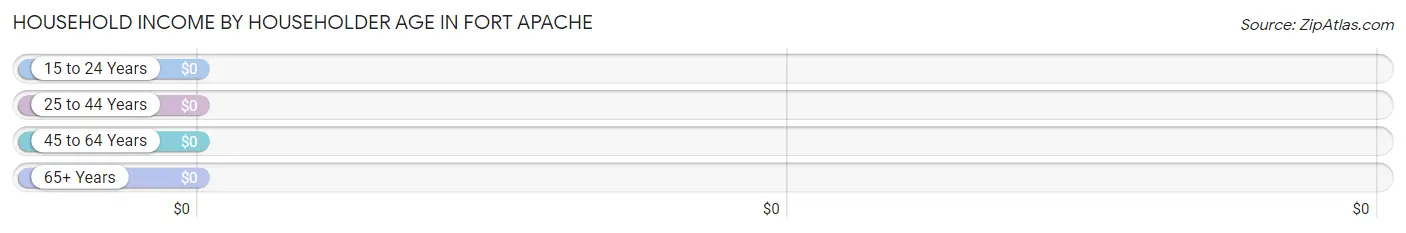
| Income Bracket | # Households | Median Income |
| 15 to 24 Years | 0 (0.0%) | $0 |
| 25 to 44 Years | 46 (75.4%) | $0 |
| 45 to 64 Years | 0 (0.0%) | $0 |
| 65+ Years | 15 (24.6%) | $0 |
| Total | 61 (100.0%) | $73,393 |
Poverty in Fort Apache
Income Below Poverty by Sex and Age in Fort Apache
With 22.6% poverty level for males and 41.8% for females among the residents of Fort Apache, 6 to 11 year old males and 12 to 14 year old females are the most vulnerable to poverty, with 10 males (100.0%) and 12 females (100.0%) in their respective age groups living below the poverty level.
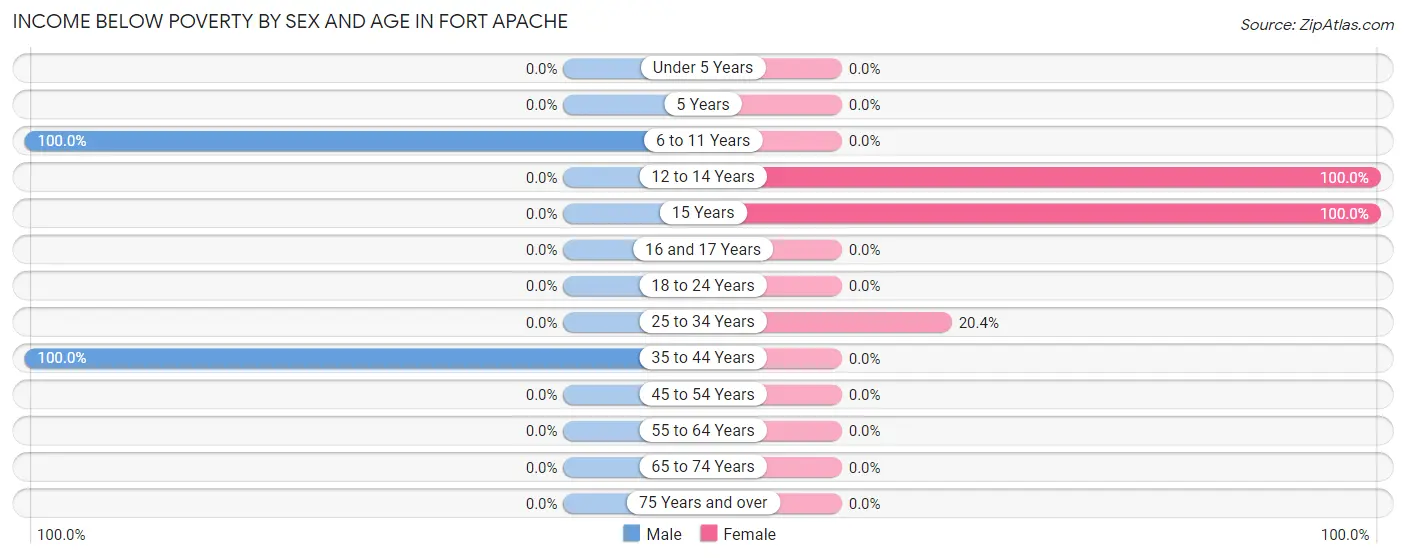
| Age Bracket | Male | Female |
| Under 5 Years | 0 (0.0%) | 0 (0.0%) |
| 5 Years | 0 (0.0%) | 0 (0.0%) |
| 6 to 11 Years | 10 (100.0%) | 0 (0.0%) |
| 12 to 14 Years | 0 (0.0%) | 12 (100.0%) |
| 15 Years | 0 (0.0%) | 11 (100.0%) |
| 16 and 17 Years | 0 (0.0%) | 0 (0.0%) |
| 18 to 24 Years | 0 (0.0%) | 0 (0.0%) |
| 25 to 34 Years | 0 (0.0%) | 10 (20.4%) |
| 35 to 44 Years | 14 (100.0%) | 0 (0.0%) |
| 45 to 54 Years | 0 (0.0%) | 0 (0.0%) |
| 55 to 64 Years | 0 (0.0%) | 0 (0.0%) |
| 65 to 74 Years | 0 (0.0%) | 0 (0.0%) |
| 75 Years and over | 0 (0.0%) | 0 (0.0%) |
| Total | 24 (22.6%) | 33 (41.8%) |
Income Above Poverty by Sex and Age in Fort Apache
According to the poverty statistics in Fort Apache, males aged under 5 years and females aged 55 to 64 years are the age groups that are most secure financially, with 100.0% of males and 100.0% of females in these age groups living above the poverty line.
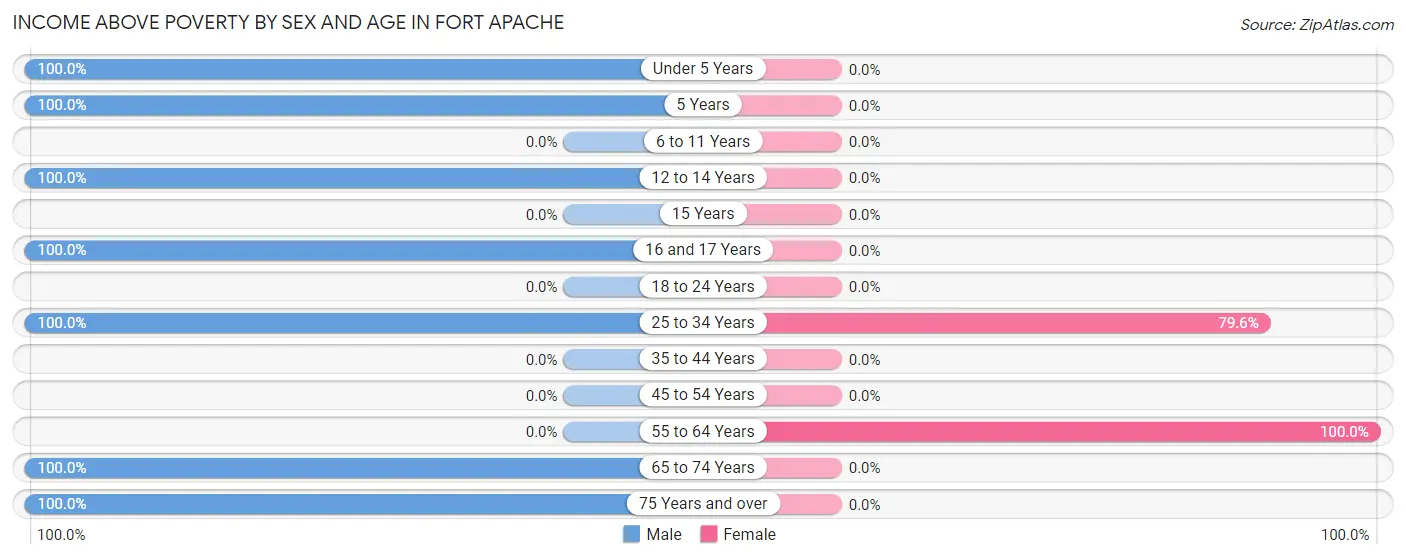
| Age Bracket | Male | Female |
| Under 5 Years | 12 (100.0%) | 0 (0.0%) |
| 5 Years | 12 (100.0%) | 0 (0.0%) |
| 6 to 11 Years | 0 (0.0%) | 0 (0.0%) |
| 12 to 14 Years | 12 (100.0%) | 0 (0.0%) |
| 15 Years | 0 (0.0%) | 0 (0.0%) |
| 16 and 17 Years | 13 (100.0%) | 0 (0.0%) |
| 18 to 24 Years | 0 (0.0%) | 0 (0.0%) |
| 25 to 34 Years | 18 (100.0%) | 39 (79.6%) |
| 35 to 44 Years | 0 (0.0%) | 0 (0.0%) |
| 45 to 54 Years | 0 (0.0%) | 0 (0.0%) |
| 55 to 64 Years | 0 (0.0%) | 7 (100.0%) |
| 65 to 74 Years | 7 (100.0%) | 0 (0.0%) |
| 75 Years and over | 8 (100.0%) | 0 (0.0%) |
| Total | 82 (77.4%) | 46 (58.2%) |
Income Below Poverty Among Married-Couple Families in Fort Apache
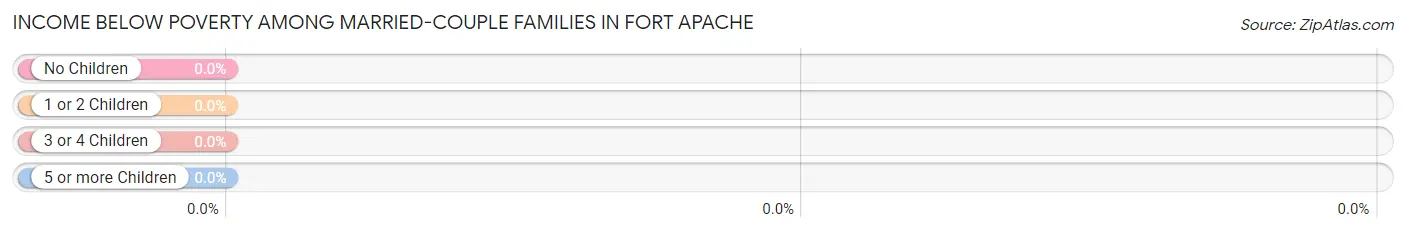
| Children | Above Poverty | Below Poverty |
| No Children | 8 (100.0%) | 0 (0.0%) |
| 1 or 2 Children | 0 (0.0%) | 0 (0.0%) |
| 3 or 4 Children | 18 (100.0%) | 0 (0.0%) |
| 5 or more Children | 0 (0.0%) | 0 (0.0%) |
| Total | 26 (100.0%) | 0 (0.0%) |
Income Below Poverty Among Single-Parent Households in Fort Apache
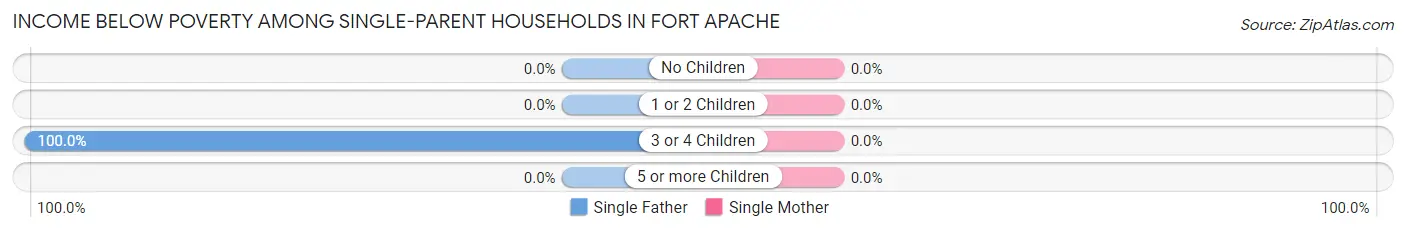
| Children | Single Father | Single Mother |
| No Children | 0 (0.0%) | 0 (0.0%) |
| 1 or 2 Children | 0 (0.0%) | 0 (0.0%) |
| 3 or 4 Children | 14 (100.0%) | 0 (0.0%) |
| 5 or more Children | 0 (0.0%) | 0 (0.0%) |
| Total | 14 (100.0%) | 0 (0.0%) |
Income Below Poverty Among Married-Couple vs Single-Parent Households in Fort Apache
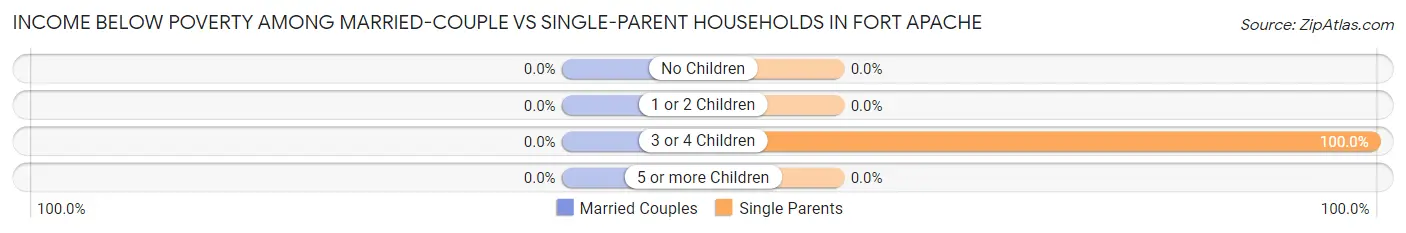
| Children | Married-Couple Families | Single-Parent Households |
| No Children | 0 (0.0%) | 0 (0.0%) |
| 1 or 2 Children | 0 (0.0%) | 0 (0.0%) |
| 3 or 4 Children | 0 (0.0%) | 14 (100.0%) |
| 5 or more Children | 0 (0.0%) | 0 (0.0%) |
| Total | 0 (0.0%) | 14 (50.0%) |
Race in Fort Apache
The most populous races in Fort Apache are Native / Alaskan (171 | 92.4%), and White / Caucasian (14 | 7.6%).
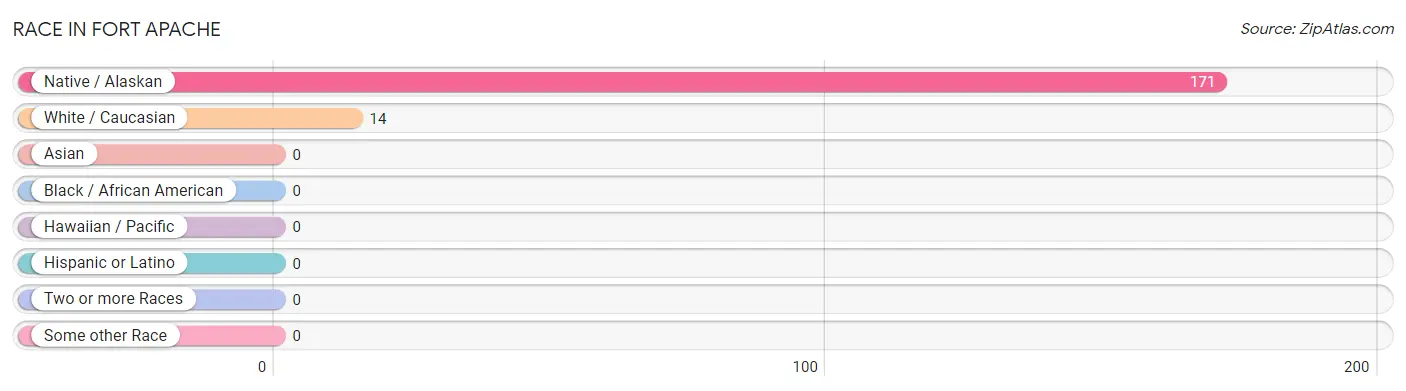
| Race | # Population | % Population |
| Asian | 0 | 0.0% |
| Black / African American | 0 | 0.0% |
| Hawaiian / Pacific | 0 | 0.0% |
| Hispanic or Latino | 0 | 0.0% |
| Native / Alaskan | 171 | 92.4% |
| White / Caucasian | 14 | 7.6% |
| Two or more Races | 0 | 0.0% |
| Some other Race | 0 | 0.0% |
| Total | 185 | 100.0% |
Ancestry in Fort Apache
The most populous ancestries reported in Fort Apache are Apache (171 | 92.4%), German (7 | 3.8%), and Italian (7 | 3.8%), together accounting for 100.0% of all Fort Apache residents.
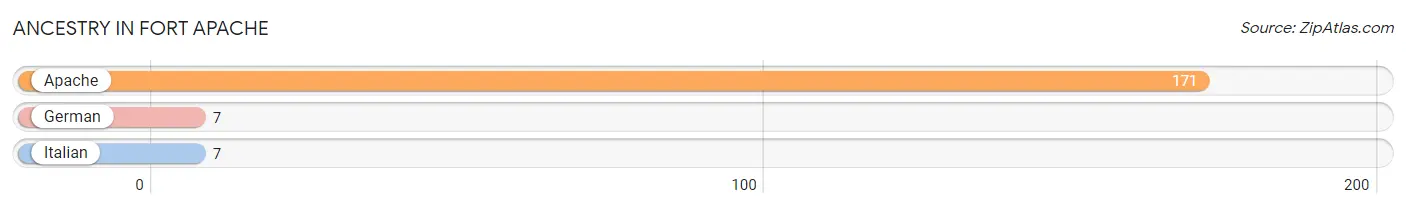
| Ancestry | # Population | % Population |
| Apache | 171 | 92.4% |
| German | 7 | 3.8% |
| Italian | 7 | 3.8% | View All 3 Rows |
Immigrants in Fort Apache

| Immigration Origin | # Population | % Population | View All 0 Rows |
Sex and Age in Fort Apache
Sex and Age in Fort Apache
The most populous age groups in Fort Apache are 5 to 9 Years (22 | 20.7%) for men and 25 to 29 Years (28 | 35.4%) for women.
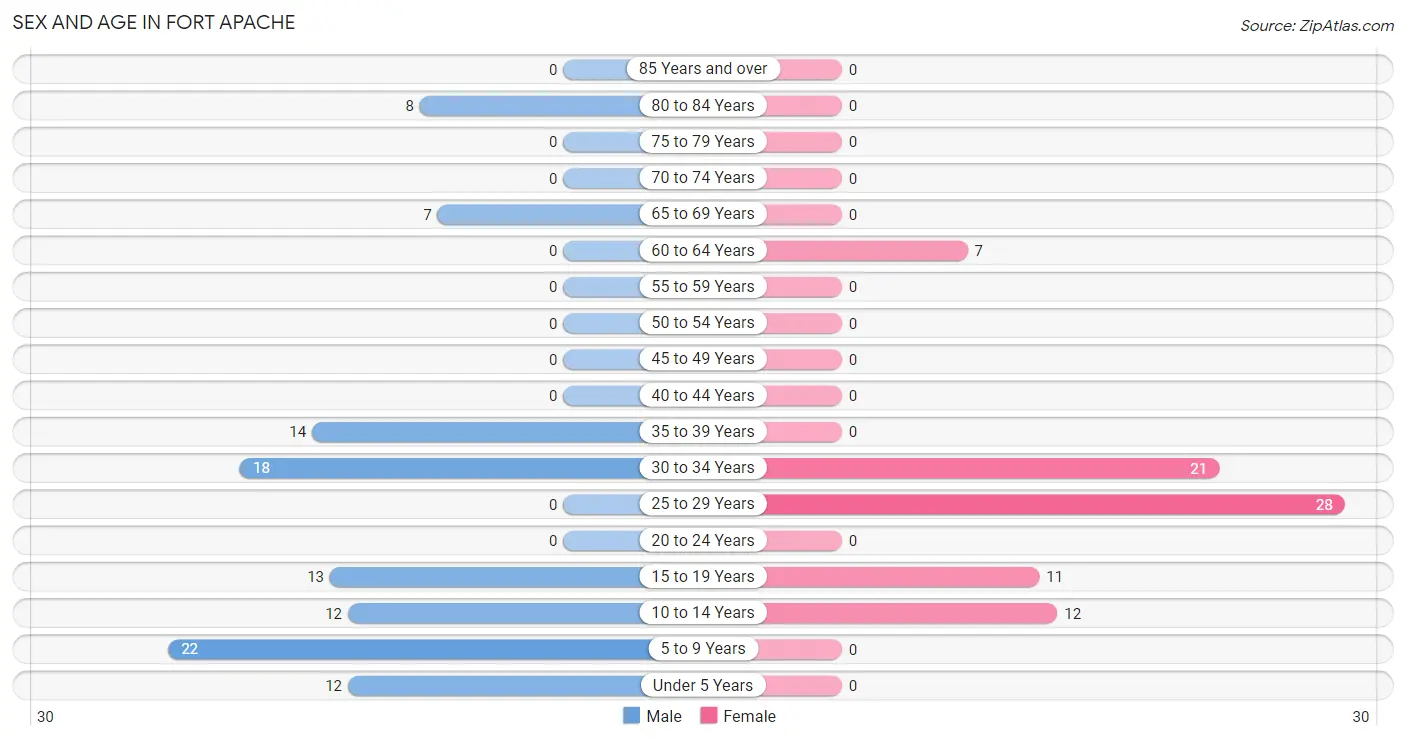
| Age Bracket | Male | Female |
| Under 5 Years | 12 (11.3%) | 0 (0.0%) |
| 5 to 9 Years | 22 (20.7%) | 0 (0.0%) |
| 10 to 14 Years | 12 (11.3%) | 12 (15.2%) |
| 15 to 19 Years | 13 (12.3%) | 11 (13.9%) |
| 20 to 24 Years | 0 (0.0%) | 0 (0.0%) |
| 25 to 29 Years | 0 (0.0%) | 28 (35.4%) |
| 30 to 34 Years | 18 (17.0%) | 21 (26.6%) |
| 35 to 39 Years | 14 (13.2%) | 0 (0.0%) |
| 40 to 44 Years | 0 (0.0%) | 0 (0.0%) |
| 45 to 49 Years | 0 (0.0%) | 0 (0.0%) |
| 50 to 54 Years | 0 (0.0%) | 0 (0.0%) |
| 55 to 59 Years | 0 (0.0%) | 0 (0.0%) |
| 60 to 64 Years | 0 (0.0%) | 7 (8.9%) |
| 65 to 69 Years | 7 (6.6%) | 0 (0.0%) |
| 70 to 74 Years | 0 (0.0%) | 0 (0.0%) |
| 75 to 79 Years | 0 (0.0%) | 0 (0.0%) |
| 80 to 84 Years | 8 (7.5%) | 0 (0.0%) |
| 85 Years and over | 0 (0.0%) | 0 (0.0%) |
| Total | 106 (100.0%) | 79 (100.0%) |
Families and Households in Fort Apache
Median Family Size in Fort Apache
The median family size in Fort Apache is 3.11 persons per family, with married-couple families (26 | 48.1%) accounting for the largest median family size of 3.58 persons per family. On the other hand, single female/mother families (14 | 25.9%) represent the smallest median family size with 2.00 persons per family.
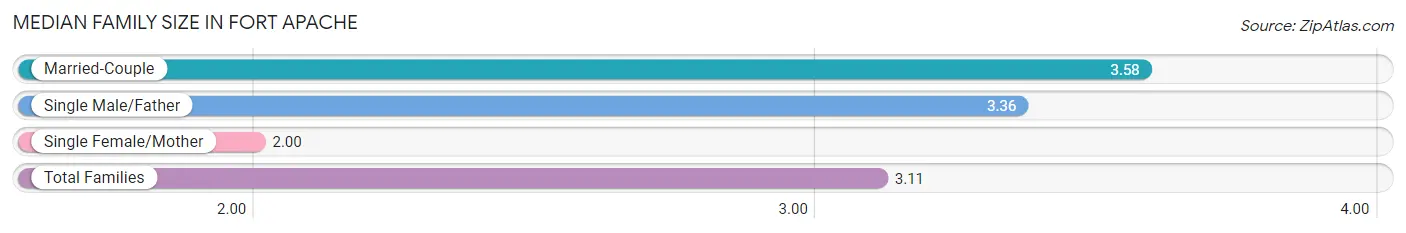
| Family Type | # Families | Family Size |
| Married-Couple | 26 (48.1%) | 3.58 |
| Single Male/Father | 14 (25.9%) | 3.36 |
| Single Female/Mother | 14 (25.9%) | 2.00 |
| Total Families | 54 (100.0%) | 3.11 |
Median Household Size in Fort Apache
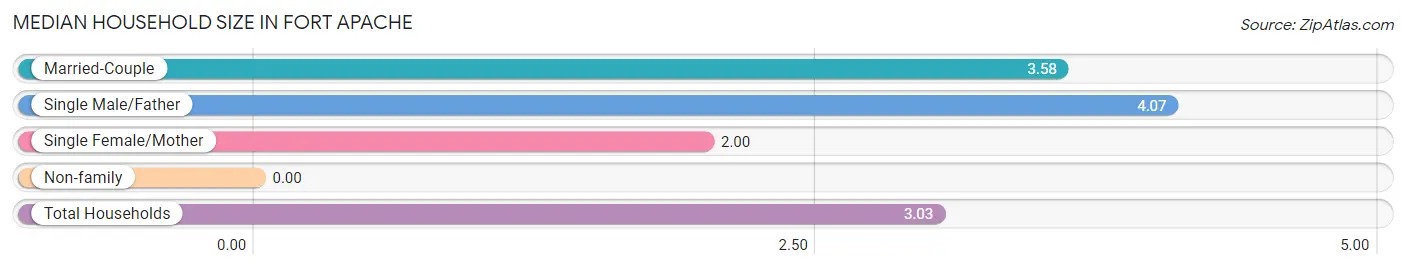
| Household Type | # Households | Household Size |
| Married-Couple | 26 (42.6%) | 3.58 |
| Single Male/Father | 14 (23.0%) | 4.07 |
| Single Female/Mother | 14 (23.0%) | 2.00 |
| Non-family | 7 (11.5%) | - |
| Total Households | 61 (100.0%) | 3.03 |
Household Size by Marriage Status in Fort Apache
Out of a total of 61 households in Fort Apache, 54 (88.5%) are family households, while 7 (11.5%) are nonfamily households. The most numerous type of family households are 2-person households, comprising 22, and the most common type of nonfamily households are 1-person households, comprising 7.
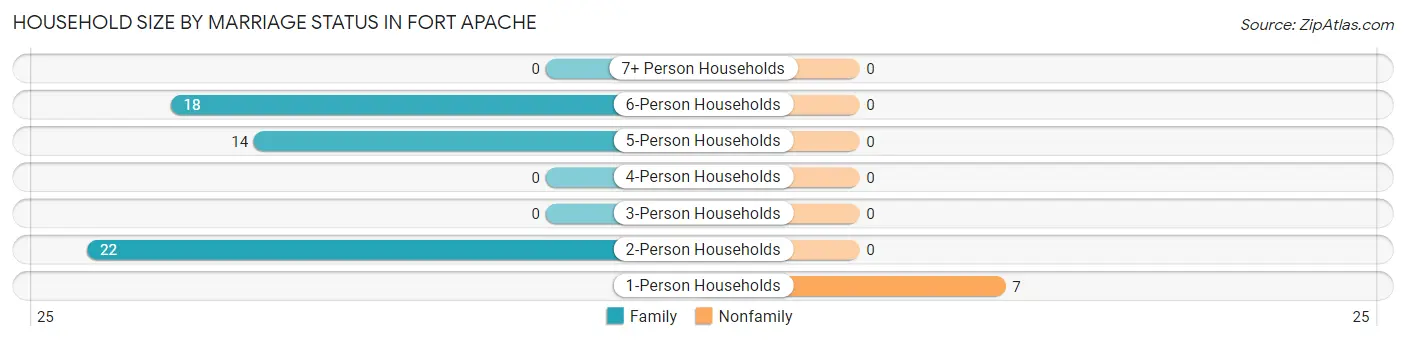
| Household Size | Family Households | Nonfamily Households |
| 1-Person Households | - | 7 (11.5%) |
| 2-Person Households | 22 (36.1%) | 0 (0.0%) |
| 3-Person Households | 0 (0.0%) | 0 (0.0%) |
| 4-Person Households | 0 (0.0%) | 0 (0.0%) |
| 5-Person Households | 14 (23.0%) | 0 (0.0%) |
| 6-Person Households | 18 (29.5%) | 0 (0.0%) |
| 7+ Person Households | 0 (0.0%) | 0 (0.0%) |
| Total | 54 (88.5%) | 7 (11.5%) |
Female Fertility in Fort Apache
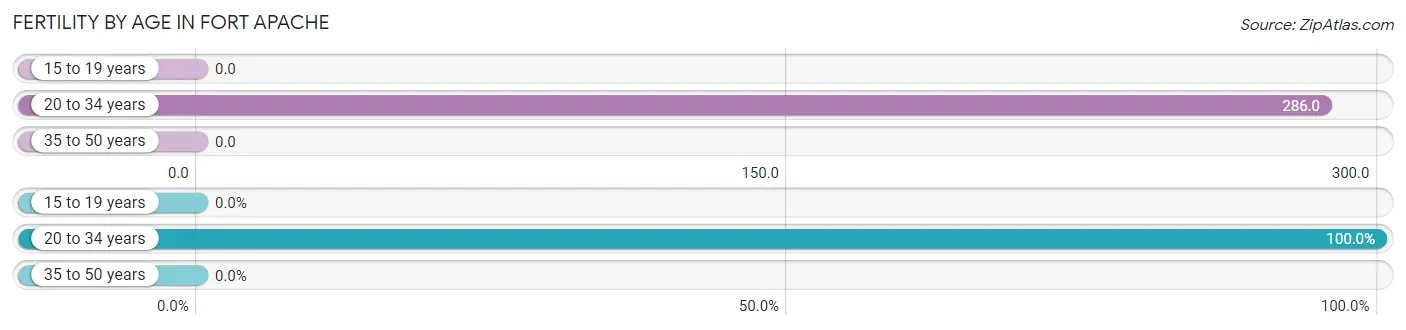
Fertility by Age in Fort Apache
Average fertility rate in Fort Apache is 233.0 births per 1,000 women. Women in the age bracket of 20 to 34 years have the highest fertility rate with 286.0 births per 1,000 women. Women in the age bracket of 20 to 34 years acount for 100.0% of all women with births.
| Age Bracket | Women with Births | Births / 1,000 Women |
| 15 to 19 years | 0 (0.0%) | 0.0 |
| 20 to 34 years | 14 (100.0%) | 286.0 |
| 35 to 50 years | 0 (0.0%) | 0.0 |
| Total | 14 (100.0%) | 233.0 |
Fertility by Age by Marriage Status in Fort Apache
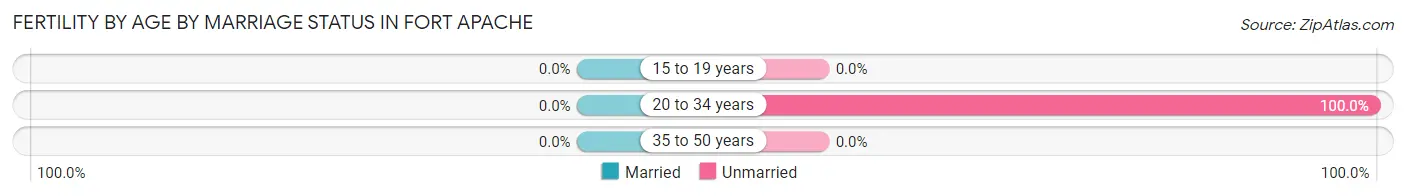
| Age Bracket | Married | Unmarried |
| 15 to 19 years | 0 (0.0%) | 0 (0.0%) |
| 20 to 34 years | 0 (0.0%) | 14 (100.0%) |
| 35 to 50 years | 0 (0.0%) | 0 (0.0%) |
| Total | 0 (0.0%) | 14 (100.0%) |
Fertility by Education in Fort Apache
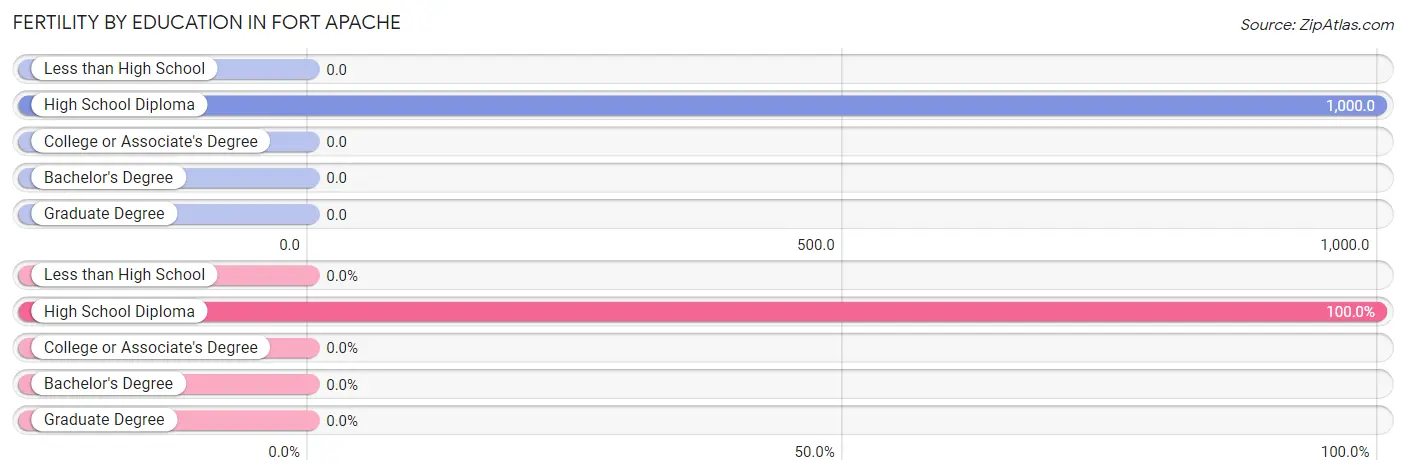
| Educational Attainment | Women with Births | Births / 1,000 Women |
| Less than High School | 0 (0.0%) | 0.0 |
| High School Diploma | 14 (100.0%) | 1,000.0 |
| College or Associate's Degree | 0 (0.0%) | 0.0 |
| Bachelor's Degree | 0 (0.0%) | 0.0 |
| Graduate Degree | 0 (0.0%) | 0.0 |
| Total | 14 (100.0%) | 233.0 |
Fertility by Education by Marriage Status in Fort Apache
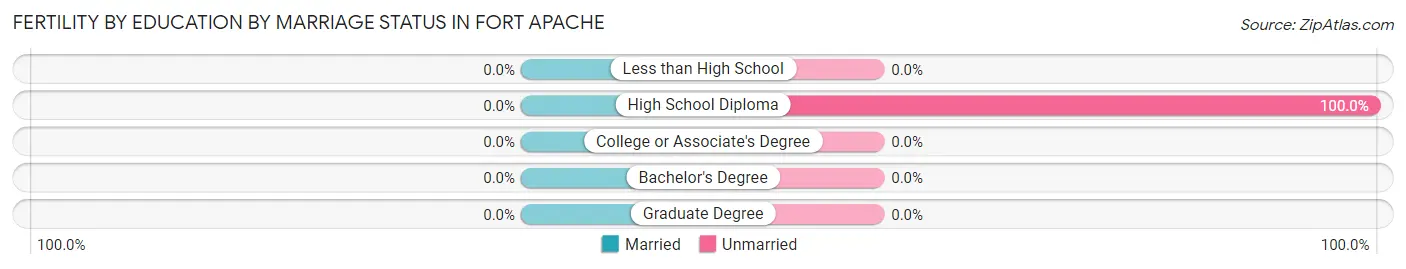
| Educational Attainment | Married | Unmarried |
| Less than High School | 0 (0.0%) | 0 (0.0%) |
| High School Diploma | 0 (0.0%) | 14 (100.0%) |
| College or Associate's Degree | 0 (0.0%) | 0 (0.0%) |
| Bachelor's Degree | 0 (0.0%) | 0 (0.0%) |
| Graduate Degree | 0 (0.0%) | 0 (0.0%) |
| Total | 0 (0.0%) | 14 (100.0%) |
Employment Characteristics in Fort Apache
Employment by Class of Employer in Fort Apache
Among the 43 employed individuals in Fort Apache, private company employees (25 | 58.1%), and local government employees (18 | 41.9%) make up the most common classes of employment.
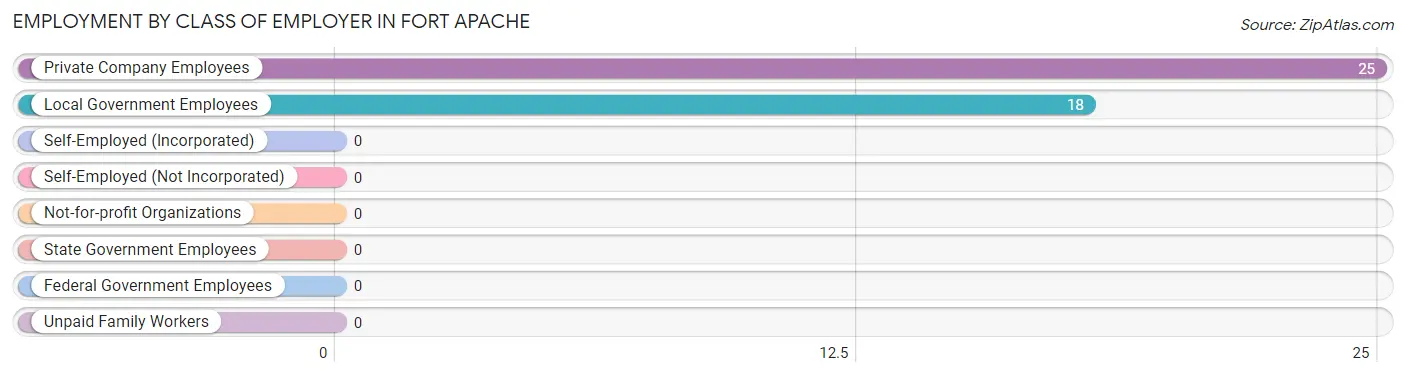
| Employer Class | # Employees | % Employees |
| Private Company Employees | 25 | 58.1% |
| Self-Employed (Incorporated) | 0 | 0.0% |
| Self-Employed (Not Incorporated) | 0 | 0.0% |
| Not-for-profit Organizations | 0 | 0.0% |
| Local Government Employees | 18 | 41.9% |
| State Government Employees | 0 | 0.0% |
| Federal Government Employees | 0 | 0.0% |
| Unpaid Family Workers | 0 | 0.0% |
| Total | 43 | 100.0% |
Employment Status by Age in Fort Apache
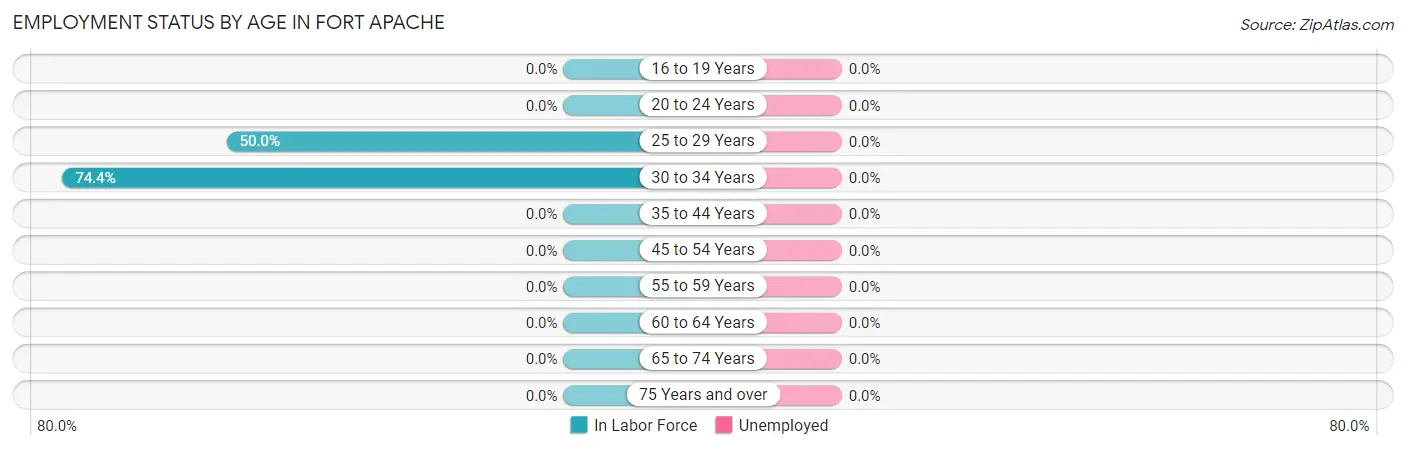
| Age Bracket | In Labor Force | Unemployed |
| 16 to 19 Years | 0 (0.0%) | 0 (0.0%) |
| 20 to 24 Years | 0 (0.0%) | 0 (0.0%) |
| 25 to 29 Years | 14 (50.0%) | 0 (0.0%) |
| 30 to 34 Years | 29 (74.4%) | 0 (0.0%) |
| 35 to 44 Years | 0 (0.0%) | 0 (0.0%) |
| 45 to 54 Years | 0 (0.0%) | 0 (0.0%) |
| 55 to 59 Years | 0 (0.0%) | 0 (0.0%) |
| 60 to 64 Years | 0 (0.0%) | 0 (0.0%) |
| 65 to 74 Years | 0 (0.0%) | 0 (0.0%) |
| 75 Years and over | 0 (0.0%) | 0 (0.0%) |
| Total | 43 (37.1%) | 0 (0.0%) |
Employment Status by Educational Attainment in Fort Apache
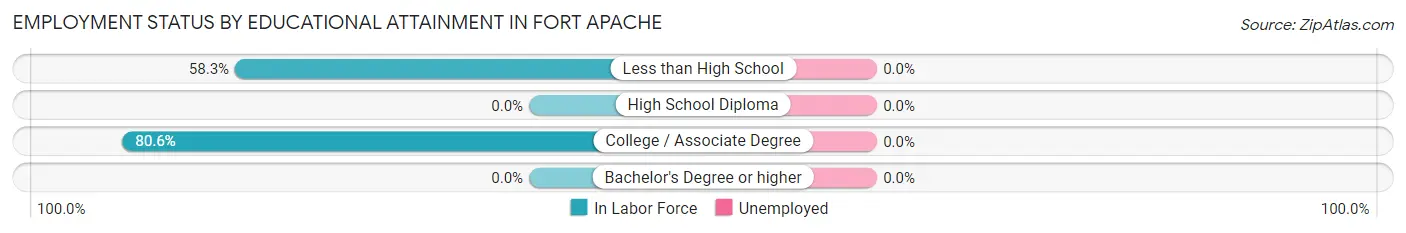
| Educational Attainment | In Labor Force | Unemployed |
| Less than High School | 14 (58.3%) | 0 (0.0%) |
| High School Diploma | 0 (0.0%) | 0 (0.0%) |
| College / Associate Degree | 29 (80.6%) | 0 (0.0%) |
| Bachelor's Degree or higher | 0 (0.0%) | 0 (0.0%) |
| Total | 43 (48.9%) | 0 (0.0%) |
Employment Occupations by Sex in Fort Apache
Management, Business, Science and Arts Occupations
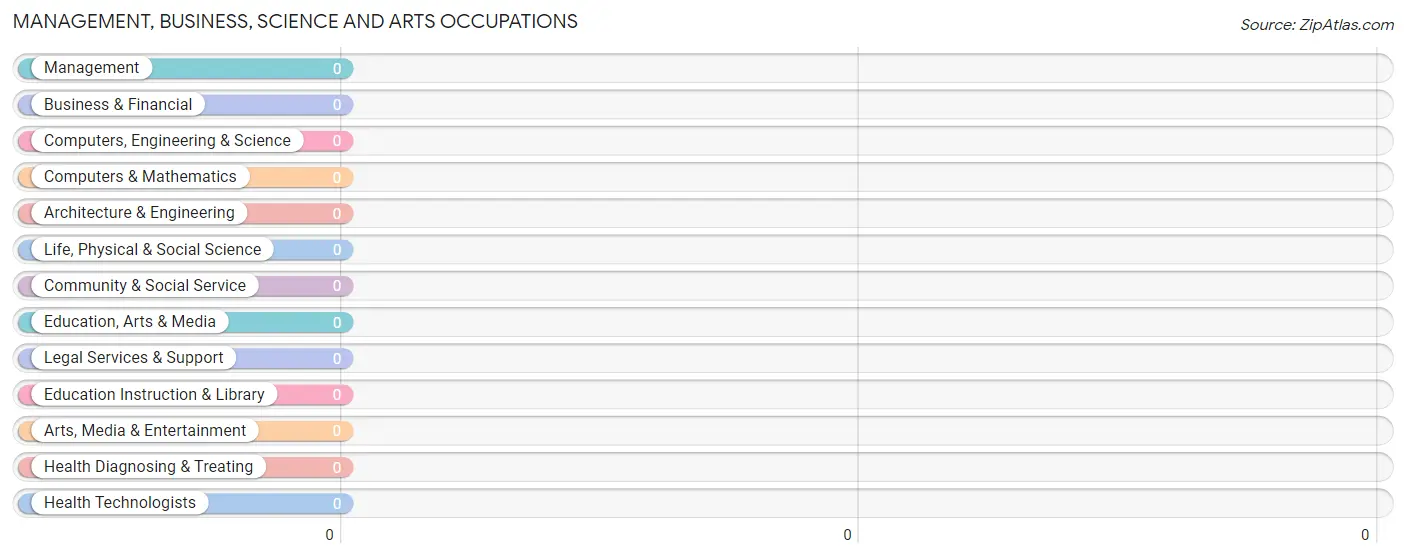
Management, Business, Science and Arts Occupations by Sex
| Occupation | Male | Female |
| Management | 0 (0.0%) | 0 (0.0%) |
| Business & Financial | 0 (0.0%) | 0 (0.0%) |
| Computers, Engineering & Science | 0 (0.0%) | 0 (0.0%) |
| Computers & Mathematics | 0 (0.0%) | 0 (0.0%) |
| Architecture & Engineering | 0 (0.0%) | 0 (0.0%) |
| Life, Physical & Social Science | 0 (0.0%) | 0 (0.0%) |
| Community & Social Service | 0 (0.0%) | 0 (0.0%) |
| Education, Arts & Media | 0 (0.0%) | 0 (0.0%) |
| Legal Services & Support | 0 (0.0%) | 0 (0.0%) |
| Education Instruction & Library | 0 (0.0%) | 0 (0.0%) |
| Arts, Media & Entertainment | 0 (0.0%) | 0 (0.0%) |
| Health Diagnosing & Treating | 0 (0.0%) | 0 (0.0%) |
| Health Technologists | 0 (0.0%) | 0 (0.0%) |
| Total (Category) | 0 (0.0%) | 0 (0.0%) |
| Total (Overall) | 18 (41.9%) | 25 (58.1%) |
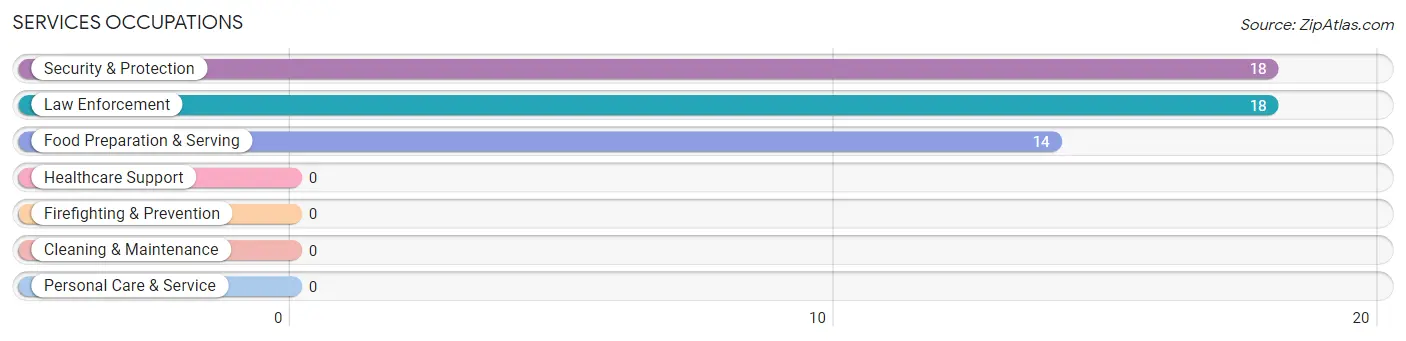
Services Occupations
The most common Services occupations in Fort Apache are Security & Protection (18 | 41.9%), Law Enforcement (18 | 41.9%), and Food Preparation & Serving (14 | 32.6%).
Services Occupations by Sex
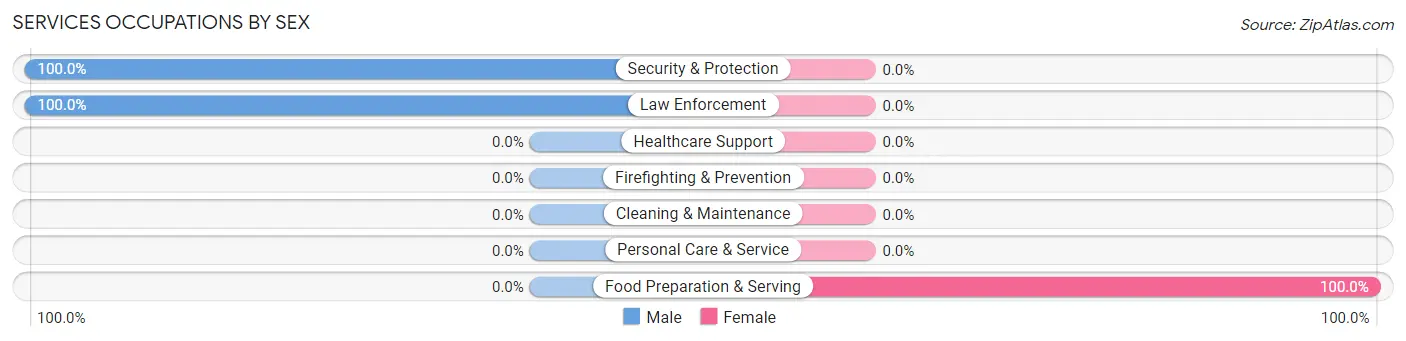
| Occupation | Male | Female |
| Healthcare Support | 0 (0.0%) | 0 (0.0%) |
| Security & Protection | 18 (100.0%) | 0 (0.0%) |
| Firefighting & Prevention | 0 (0.0%) | 0 (0.0%) |
| Law Enforcement | 18 (100.0%) | 0 (0.0%) |
| Food Preparation & Serving | 0 (0.0%) | 14 (100.0%) |
| Cleaning & Maintenance | 0 (0.0%) | 0 (0.0%) |
| Personal Care & Service | 0 (0.0%) | 0 (0.0%) |
| Total (Category) | 18 (56.2%) | 14 (43.8%) |
| Total (Overall) | 18 (41.9%) | 25 (58.1%) |
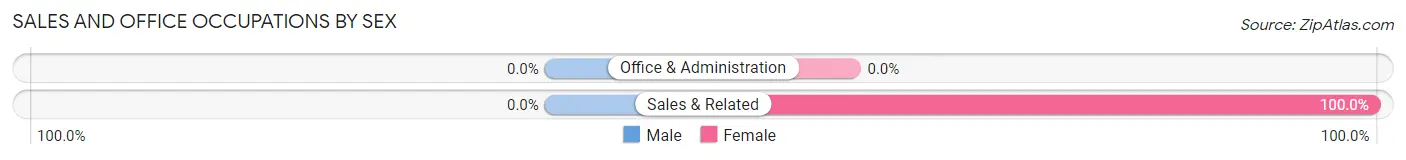
Sales and Office Occupations
The most common Sales and Office occupations in Fort Apache are , and Sales & Related (11 | 25.6%).
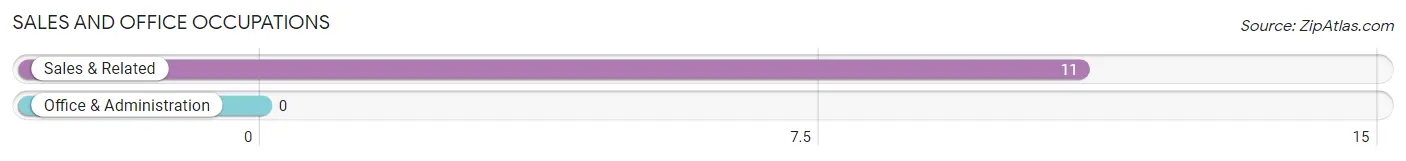
Sales and Office Occupations by Sex
| Occupation | Male | Female |
| Sales & Related | 0 (0.0%) | 11 (100.0%) |
| Office & Administration | 0 (0.0%) | 0 (0.0%) |
| Total (Category) | 0 (0.0%) | 11 (100.0%) |
| Total (Overall) | 18 (41.9%) | 25 (58.1%) |
Natural Resources, Construction and Maintenance Occupations
Natural Resources, Construction and Maintenance Occupations by Sex
| Occupation | Male | Female |
| Farming, Fishing & Forestry | 0 (0.0%) | 0 (0.0%) |
| Construction & Extraction | 0 (0.0%) | 0 (0.0%) |
| Installation, Maintenance & Repair | 0 (0.0%) | 0 (0.0%) |
| Total (Category) | 0 (0.0%) | 0 (0.0%) |
| Total (Overall) | 18 (41.9%) | 25 (58.1%) |
Production, Transportation and Moving Occupations
Production, Transportation and Moving Occupations by Sex
| Occupation | Male | Female |
| Production | 0 (0.0%) | 0 (0.0%) |
| Transportation | 0 (0.0%) | 0 (0.0%) |
| Material Moving | 0 (0.0%) | 0 (0.0%) |
| Total (Category) | 0 (0.0%) | 0 (0.0%) |
| Total (Overall) | 18 (41.9%) | 25 (58.1%) |
Employment Industries by Sex in Fort Apache
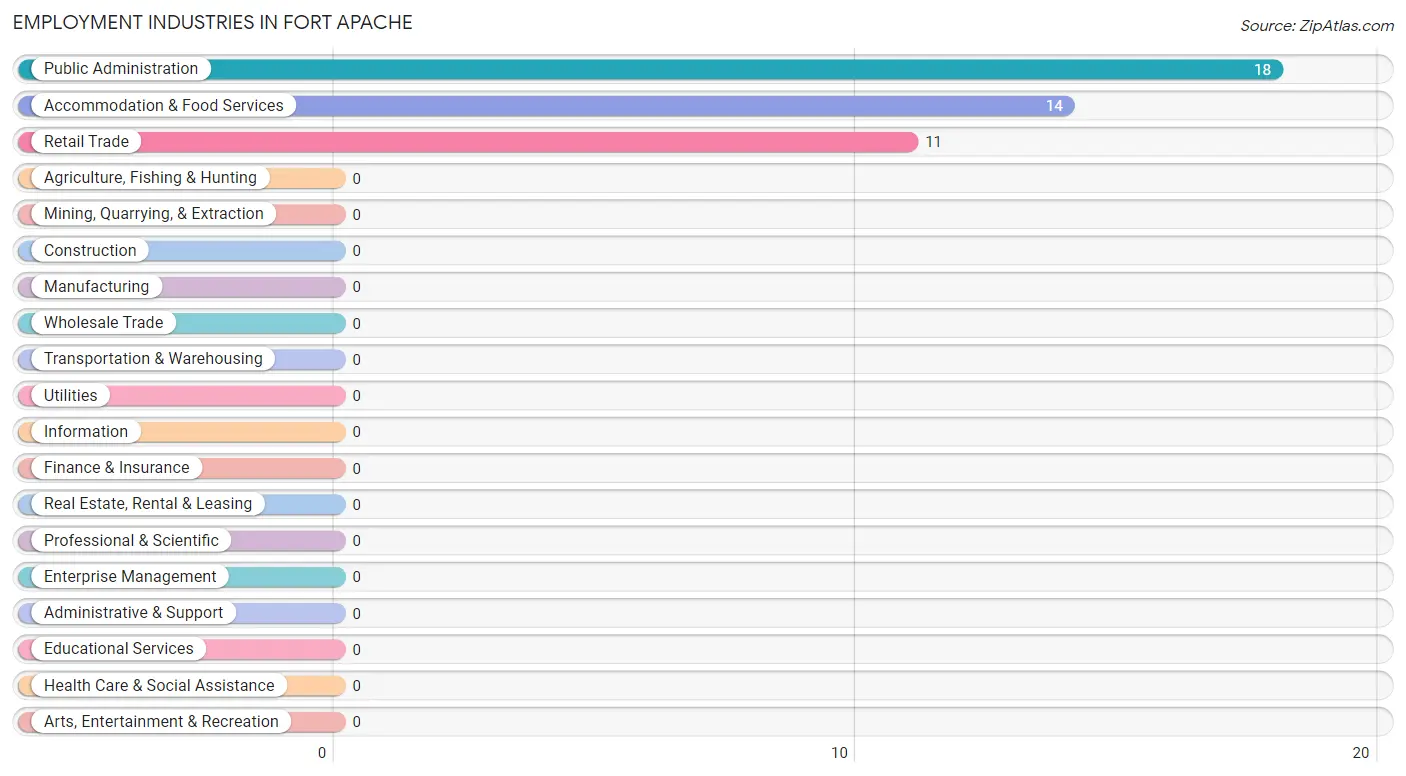
Employment Industries in Fort Apache
The major employment industries in Fort Apache include Public Administration (18 | 41.9%), Accommodation & Food Services (14 | 32.6%), and Retail Trade (11 | 25.6%).
Employment Industries by Sex in Fort Apache
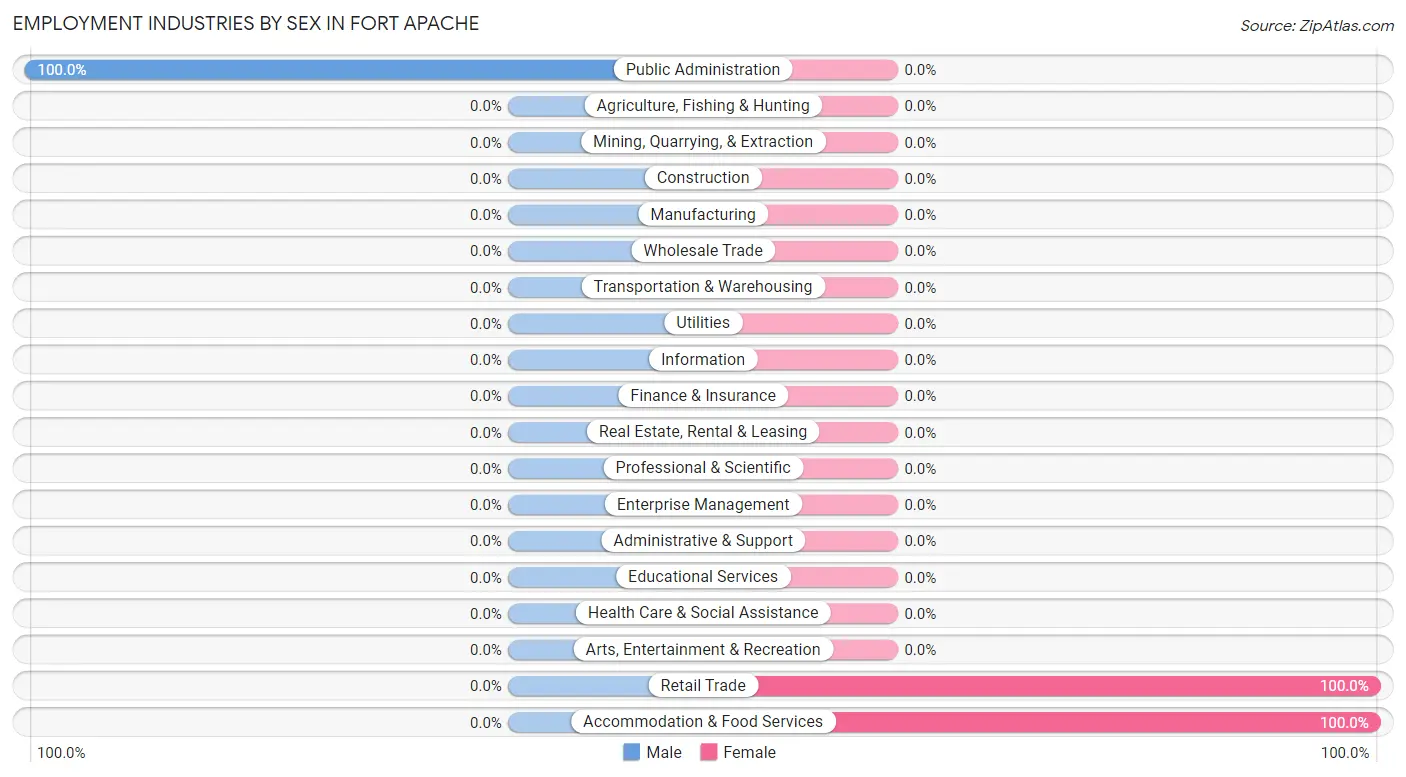
| Industry | Male | Female |
| Agriculture, Fishing & Hunting | 0 (0.0%) | 0 (0.0%) |
| Mining, Quarrying, & Extraction | 0 (0.0%) | 0 (0.0%) |
| Construction | 0 (0.0%) | 0 (0.0%) |
| Manufacturing | 0 (0.0%) | 0 (0.0%) |
| Wholesale Trade | 0 (0.0%) | 0 (0.0%) |
| Retail Trade | 0 (0.0%) | 11 (100.0%) |
| Transportation & Warehousing | 0 (0.0%) | 0 (0.0%) |
| Utilities | 0 (0.0%) | 0 (0.0%) |
| Information | 0 (0.0%) | 0 (0.0%) |
| Finance & Insurance | 0 (0.0%) | 0 (0.0%) |
| Real Estate, Rental & Leasing | 0 (0.0%) | 0 (0.0%) |
| Professional & Scientific | 0 (0.0%) | 0 (0.0%) |
| Enterprise Management | 0 (0.0%) | 0 (0.0%) |
| Administrative & Support | 0 (0.0%) | 0 (0.0%) |
| Educational Services | 0 (0.0%) | 0 (0.0%) |
| Health Care & Social Assistance | 0 (0.0%) | 0 (0.0%) |
| Arts, Entertainment & Recreation | 0 (0.0%) | 0 (0.0%) |
| Accommodation & Food Services | 0 (0.0%) | 14 (100.0%) |
| Public Administration | 18 (100.0%) | 0 (0.0%) |
| Total | 18 (41.9%) | 25 (58.1%) |
Education in Fort Apache
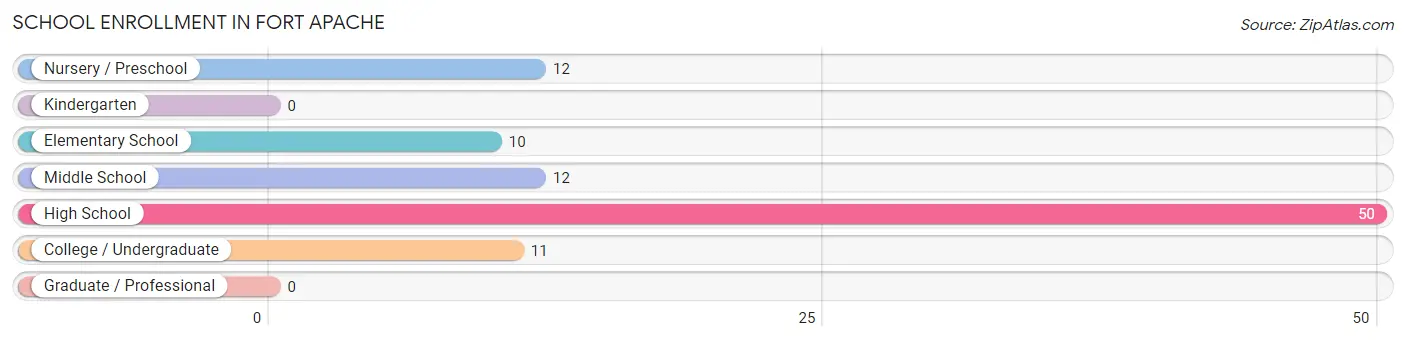
School Enrollment in Fort Apache
The most common levels of schooling among the 95 students in Fort Apache are high school (50 | 52.6%), nursery / preschool (12 | 12.6%), and middle school (12 | 12.6%).
| School Level | # Students | % Students |
| Nursery / Preschool | 12 | 12.6% |
| Kindergarten | 0 | 0.0% |
| Elementary School | 10 | 10.5% |
| Middle School | 12 | 12.6% |
| High School | 50 | 52.6% |
| College / Undergraduate | 11 | 11.6% |
| Graduate / Professional | 0 | 0.0% |
| Total | 95 | 100.0% |
School Enrollment by Age by Funding Source in Fort Apache
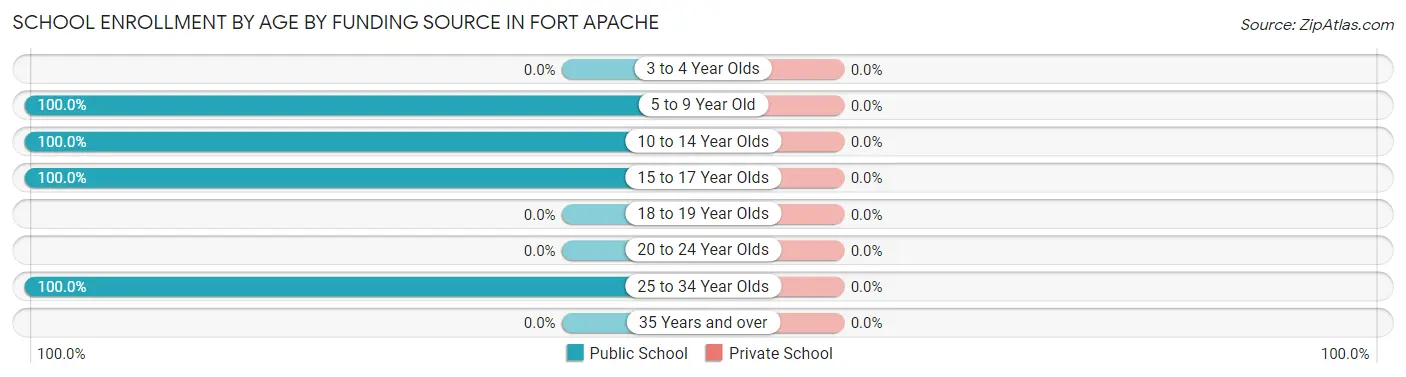
| Age Bracket | Public School | Private School |
| 3 to 4 Year Olds | 0 (0.0%) | 0 (0.0%) |
| 5 to 9 Year Old | 22 (100.0%) | 0 (0.0%) |
| 10 to 14 Year Olds | 24 (100.0%) | 0 (0.0%) |
| 15 to 17 Year Olds | 24 (100.0%) | 0 (0.0%) |
| 18 to 19 Year Olds | 0 (0.0%) | 0 (0.0%) |
| 20 to 24 Year Olds | 0 (0.0%) | 0 (0.0%) |
| 25 to 34 Year Olds | 25 (100.0%) | 0 (0.0%) |
| 35 Years and over | 0 (0.0%) | 0 (0.0%) |
| Total | 95 (100.0%) | 0 (0.0%) |
Educational Attainment by Field of Study in Fort Apache
, and liberal arts & history (7 | 100.0%) are the most common fields of study among 7 individuals in Fort Apache who have obtained a bachelor's degree or higher.
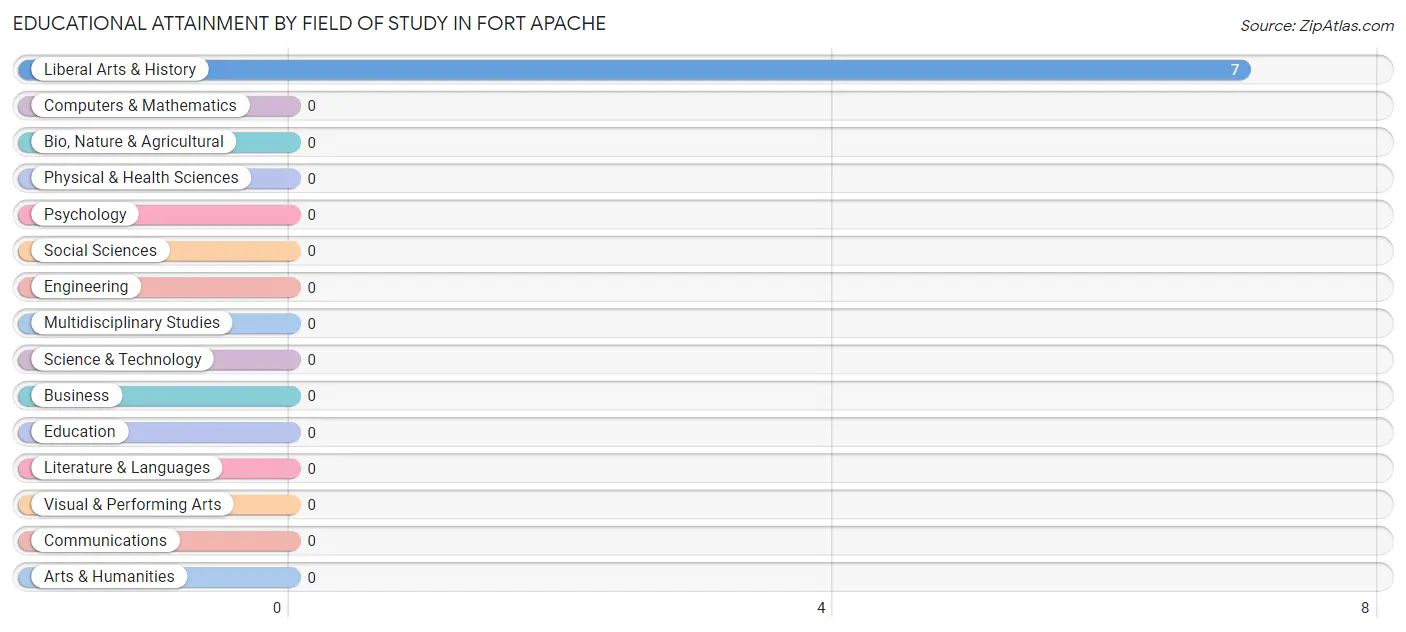
| Field of Study | # Graduates | % Graduates |
| Computers & Mathematics | 0 | 0.0% |
| Bio, Nature & Agricultural | 0 | 0.0% |
| Physical & Health Sciences | 0 | 0.0% |
| Psychology | 0 | 0.0% |
| Social Sciences | 0 | 0.0% |
| Engineering | 0 | 0.0% |
| Multidisciplinary Studies | 0 | 0.0% |
| Science & Technology | 0 | 0.0% |
| Business | 0 | 0.0% |
| Education | 0 | 0.0% |
| Literature & Languages | 0 | 0.0% |
| Liberal Arts & History | 7 | 100.0% |
| Visual & Performing Arts | 0 | 0.0% |
| Communications | 0 | 0.0% |
| Arts & Humanities | 0 | 0.0% |
| Total | 7 | 100.0% |
Transportation & Commute in Fort Apache
Vehicle Availability by Sex in Fort Apache
The most prevalent vehicle ownership categories in Fort Apache are males with 3 vehicles (18, accounting for 100.0%) and females with 3 vehicles (11, making up 72.0%).
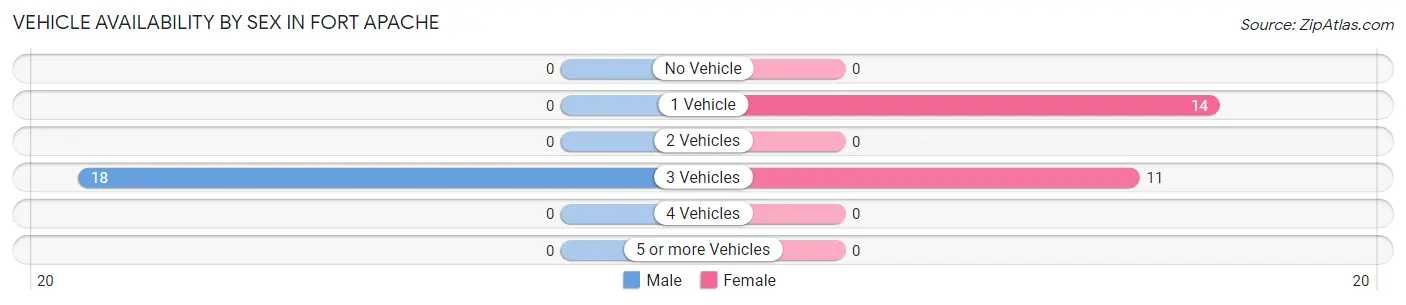
| Vehicles Available | Male | Female |
| No Vehicle | 0 (0.0%) | 0 (0.0%) |
| 1 Vehicle | 0 (0.0%) | 14 (56.0%) |
| 2 Vehicles | 0 (0.0%) | 0 (0.0%) |
| 3 Vehicles | 18 (100.0%) | 11 (44.0%) |
| 4 Vehicles | 0 (0.0%) | 0 (0.0%) |
| 5 or more Vehicles | 0 (0.0%) | 0 (0.0%) |
| Total | 18 (100.0%) | 25 (100.0%) |
Commute Time in Fort Apache
The most frequently occuring commute durations in Fort Apache are 30 to 34 minutes (25 commuters, 58.1%), 10 to 14 minutes (18 commuters, 41.9%), and less than 5 minutes (0 commuters, 0.0%).
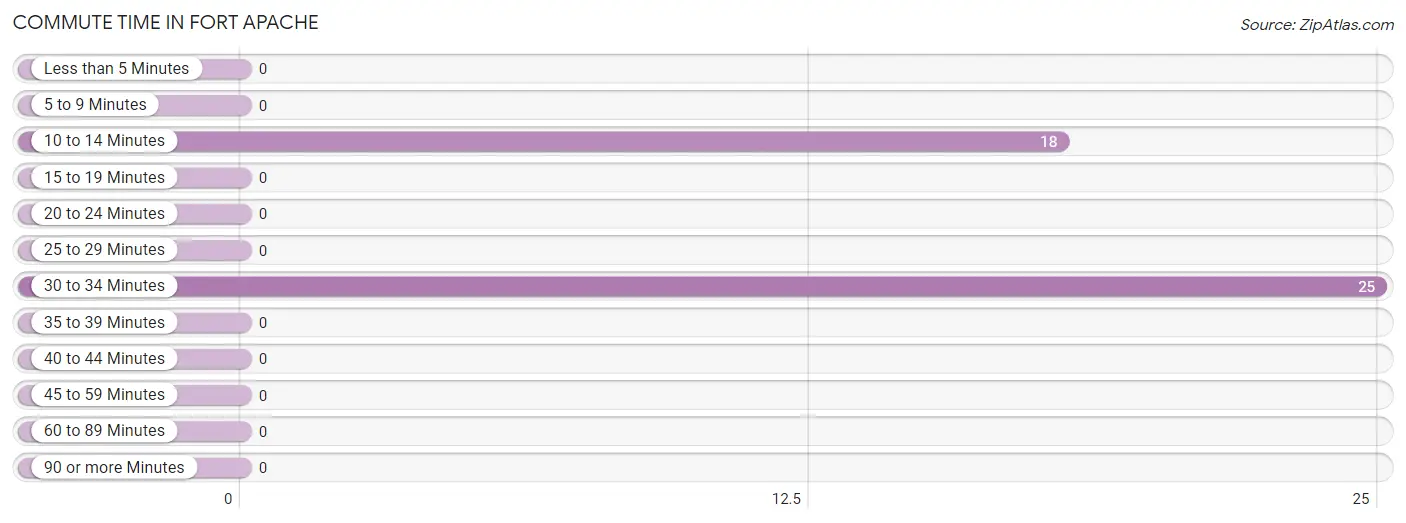
| Commute Time | # Commuters | % Commuters |
| Less than 5 Minutes | 0 | 0.0% |
| 5 to 9 Minutes | 0 | 0.0% |
| 10 to 14 Minutes | 18 | 41.9% |
| 15 to 19 Minutes | 0 | 0.0% |
| 20 to 24 Minutes | 0 | 0.0% |
| 25 to 29 Minutes | 0 | 0.0% |
| 30 to 34 Minutes | 25 | 58.1% |
| 35 to 39 Minutes | 0 | 0.0% |
| 40 to 44 Minutes | 0 | 0.0% |
| 45 to 59 Minutes | 0 | 0.0% |
| 60 to 89 Minutes | 0 | 0.0% |
| 90 or more Minutes | 0 | 0.0% |
Commute Time by Sex in Fort Apache
The most common commute times in Fort Apache are 10 to 14 minutes (18 commuters, 100.0%) for males and 30 to 34 minutes (25 commuters, 100.0%) for females.
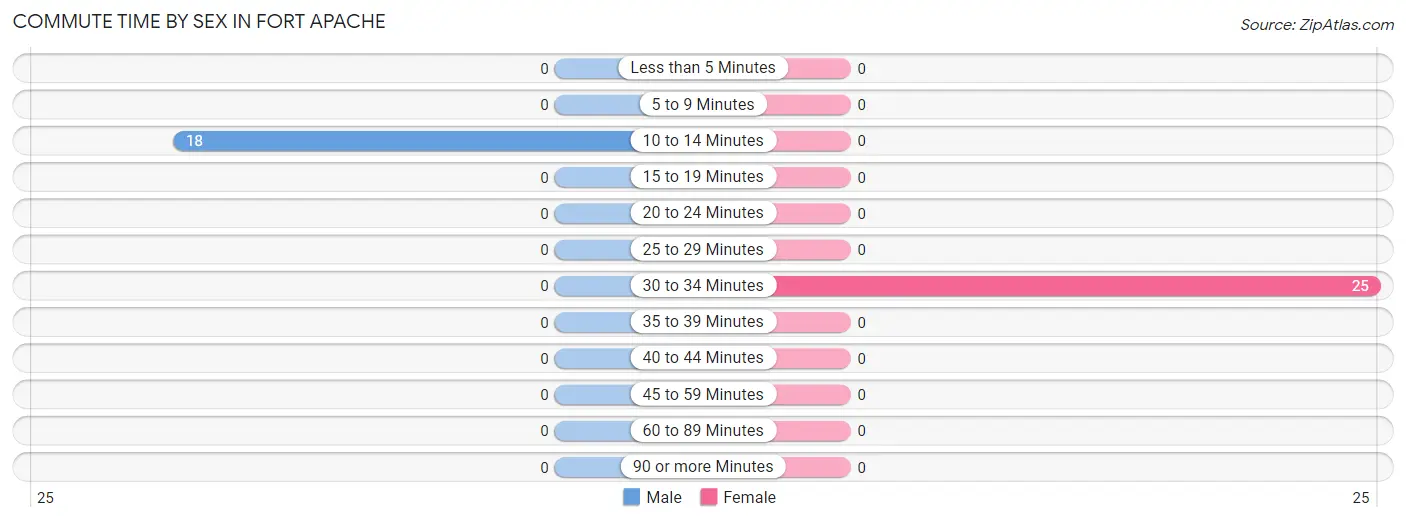
| Commute Time | Male | Female |
| Less than 5 Minutes | 0 (0.0%) | 0 (0.0%) |
| 5 to 9 Minutes | 0 (0.0%) | 0 (0.0%) |
| 10 to 14 Minutes | 18 (100.0%) | 0 (0.0%) |
| 15 to 19 Minutes | 0 (0.0%) | 0 (0.0%) |
| 20 to 24 Minutes | 0 (0.0%) | 0 (0.0%) |
| 25 to 29 Minutes | 0 (0.0%) | 0 (0.0%) |
| 30 to 34 Minutes | 0 (0.0%) | 25 (100.0%) |
| 35 to 39 Minutes | 0 (0.0%) | 0 (0.0%) |
| 40 to 44 Minutes | 0 (0.0%) | 0 (0.0%) |
| 45 to 59 Minutes | 0 (0.0%) | 0 (0.0%) |
| 60 to 89 Minutes | 0 (0.0%) | 0 (0.0%) |
| 90 or more Minutes | 0 (0.0%) | 0 (0.0%) |
Time of Departure to Work by Sex in Fort Apache
The most frequent times of departure to work in Fort Apache are 7:00 AM to 7:29 AM (18, 100.0%) for males and 12:00 PM to 3:59 PM (14, 56.0%) for females.
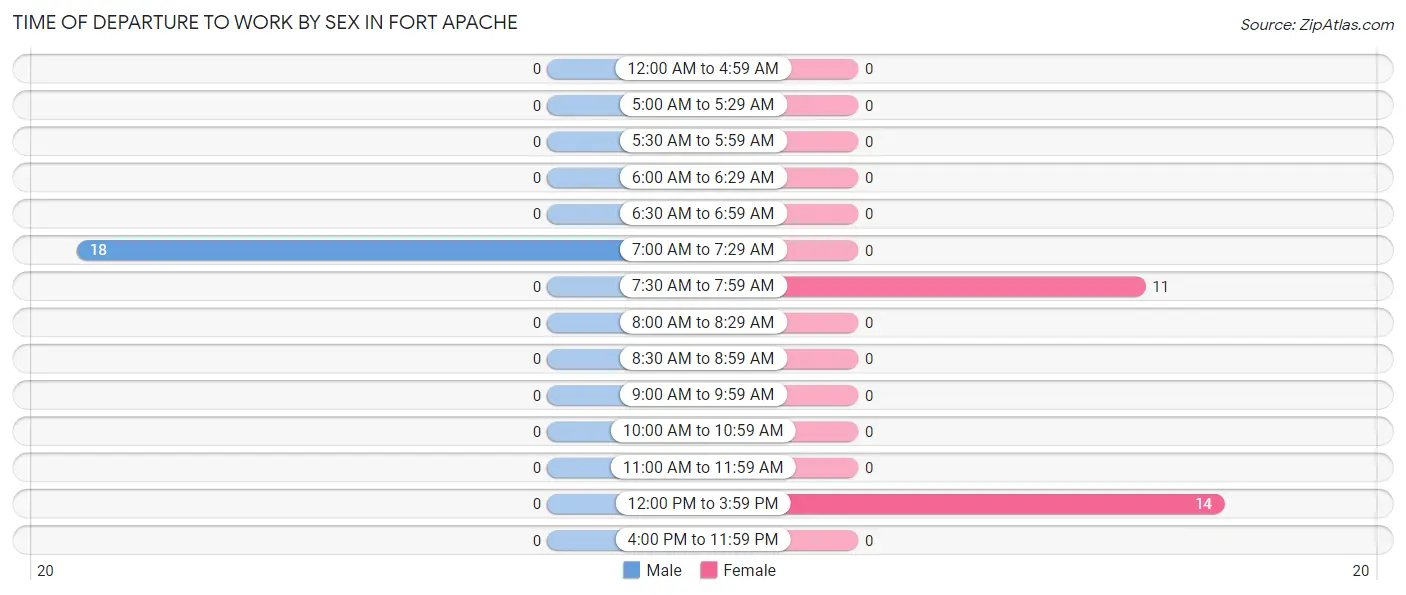
| Time of Departure | Male | Female |
| 12:00 AM to 4:59 AM | 0 (0.0%) | 0 (0.0%) |
| 5:00 AM to 5:29 AM | 0 (0.0%) | 0 (0.0%) |
| 5:30 AM to 5:59 AM | 0 (0.0%) | 0 (0.0%) |
| 6:00 AM to 6:29 AM | 0 (0.0%) | 0 (0.0%) |
| 6:30 AM to 6:59 AM | 0 (0.0%) | 0 (0.0%) |
| 7:00 AM to 7:29 AM | 18 (100.0%) | 0 (0.0%) |
| 7:30 AM to 7:59 AM | 0 (0.0%) | 11 (44.0%) |
| 8:00 AM to 8:29 AM | 0 (0.0%) | 0 (0.0%) |
| 8:30 AM to 8:59 AM | 0 (0.0%) | 0 (0.0%) |
| 9:00 AM to 9:59 AM | 0 (0.0%) | 0 (0.0%) |
| 10:00 AM to 10:59 AM | 0 (0.0%) | 0 (0.0%) |
| 11:00 AM to 11:59 AM | 0 (0.0%) | 0 (0.0%) |
| 12:00 PM to 3:59 PM | 0 (0.0%) | 14 (56.0%) |
| 4:00 PM to 11:59 PM | 0 (0.0%) | 0 (0.0%) |
| Total | 18 (100.0%) | 25 (100.0%) |
Housing Occupancy in Fort Apache
Occupancy by Ownership in Fort Apache
Of the total 61 dwellings in Fort Apache, owner-occupied units account for 29 (47.5%), while renter-occupied units make up 32 (52.5%).
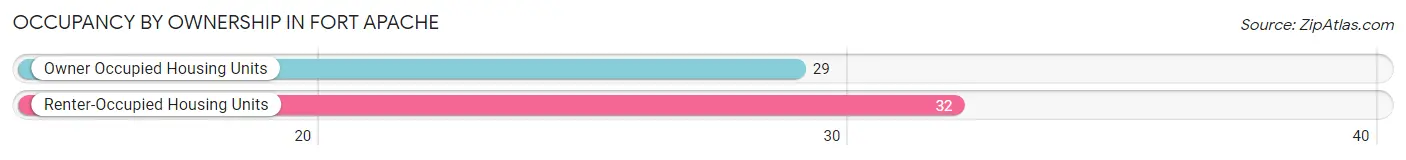
| Occupancy | # Housing Units | % Housing Units |
| Owner Occupied Housing Units | 29 | 47.5% |
| Renter-Occupied Housing Units | 32 | 52.5% |
| Total Occupied Housing Units | 61 | 100.0% |
Occupancy by Household Size in Fort Apache
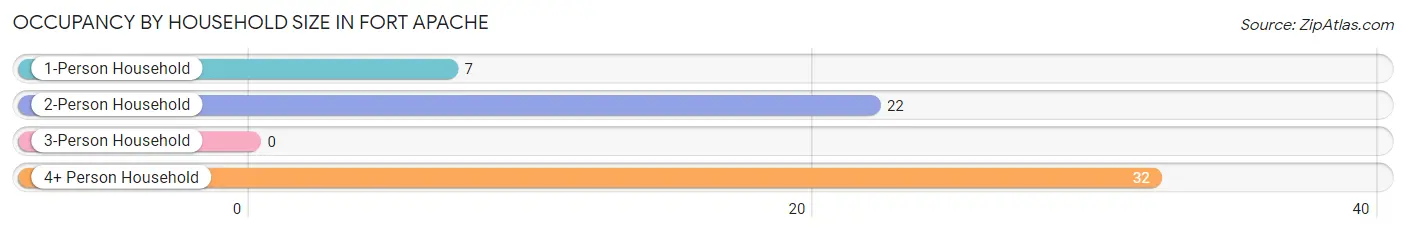
| Household Size | # Housing Units | % Housing Units |
| 1-Person Household | 7 | 11.5% |
| 2-Person Household | 22 | 36.1% |
| 3-Person Household | 0 | 0.0% |
| 4+ Person Household | 32 | 52.5% |
| Total Housing Units | 61 | 100.0% |
Occupancy by Ownership by Household Size in Fort Apache
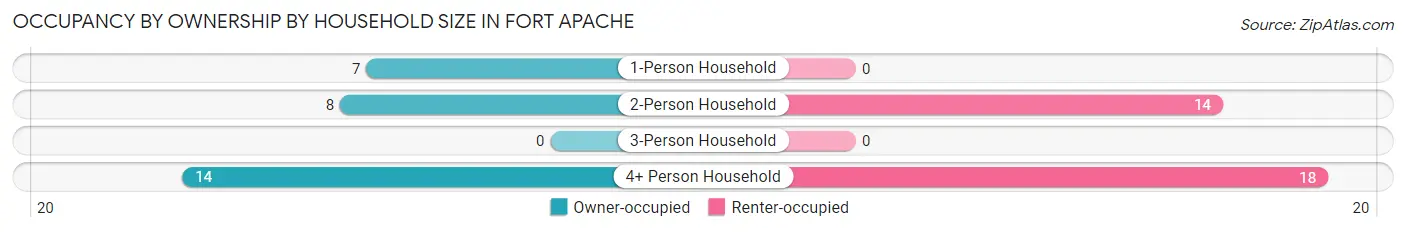
| Household Size | Owner-occupied | Renter-occupied |
| 1-Person Household | 7 (100.0%) | 0 (0.0%) |
| 2-Person Household | 8 (36.4%) | 14 (63.6%) |
| 3-Person Household | 0 (0.0%) | 0 (0.0%) |
| 4+ Person Household | 14 (43.8%) | 18 (56.2%) |
| Total Housing Units | 29 (47.5%) | 32 (52.5%) |
Occupancy by Educational Attainment in Fort Apache
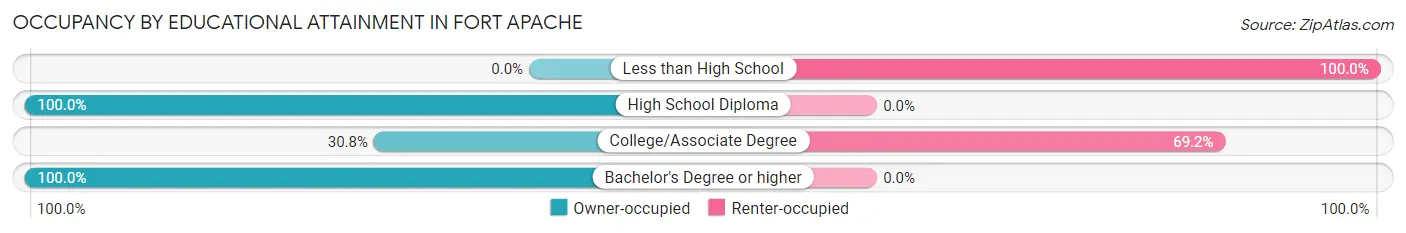
| Household Size | Owner-occupied | Renter-occupied |
| Less than High School | 0 (0.0%) | 14 (100.0%) |
| High School Diploma | 14 (100.0%) | 0 (0.0%) |
| College/Associate Degree | 8 (30.8%) | 18 (69.2%) |
| Bachelor's Degree or higher | 7 (100.0%) | 0 (0.0%) |
Occupancy by Age of Householder in Fort Apache
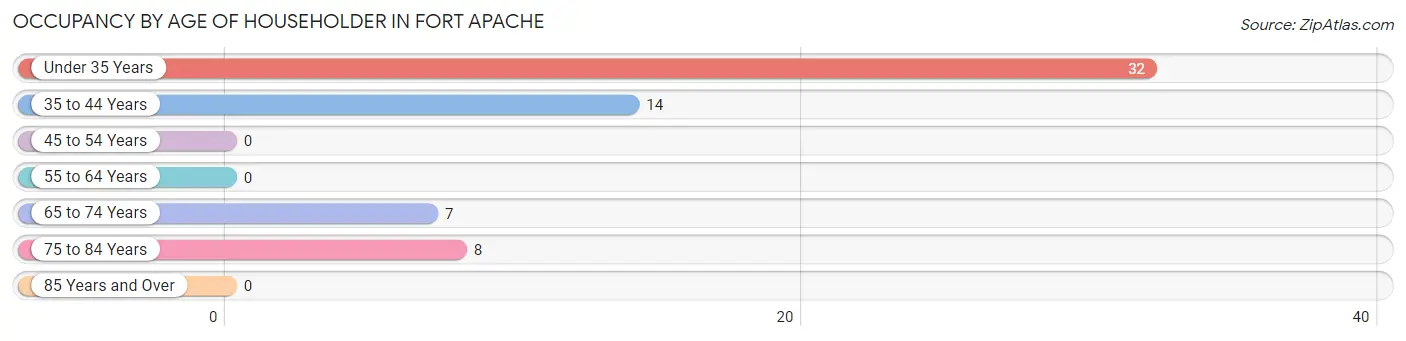
| Age Bracket | # Households | % Households |
| Under 35 Years | 32 | 52.5% |
| 35 to 44 Years | 14 | 23.0% |
| 45 to 54 Years | 0 | 0.0% |
| 55 to 64 Years | 0 | 0.0% |
| 65 to 74 Years | 7 | 11.5% |
| 75 to 84 Years | 8 | 13.1% |
| 85 Years and Over | 0 | 0.0% |
| Total | 61 | 100.0% |
Housing Finances in Fort Apache
Median Income by Occupancy in Fort Apache
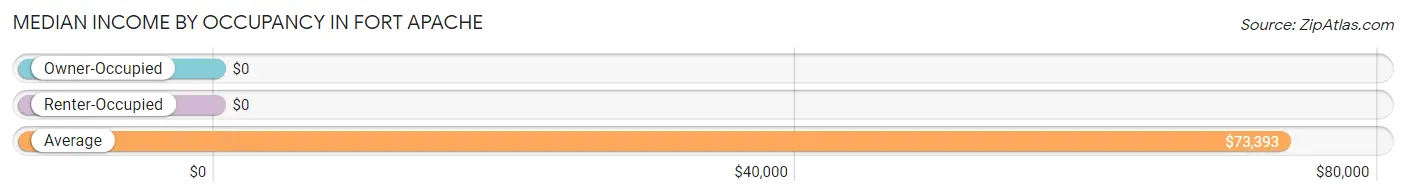
| Occupancy Type | # Households | Median Income |
| Owner-Occupied | 29 (47.5%) | $0 |
| Renter-Occupied | 32 (52.5%) | $0 |
| Average | 61 (100.0%) | $73,393 |
Occupancy by Householder Income Bracket in Fort Apache
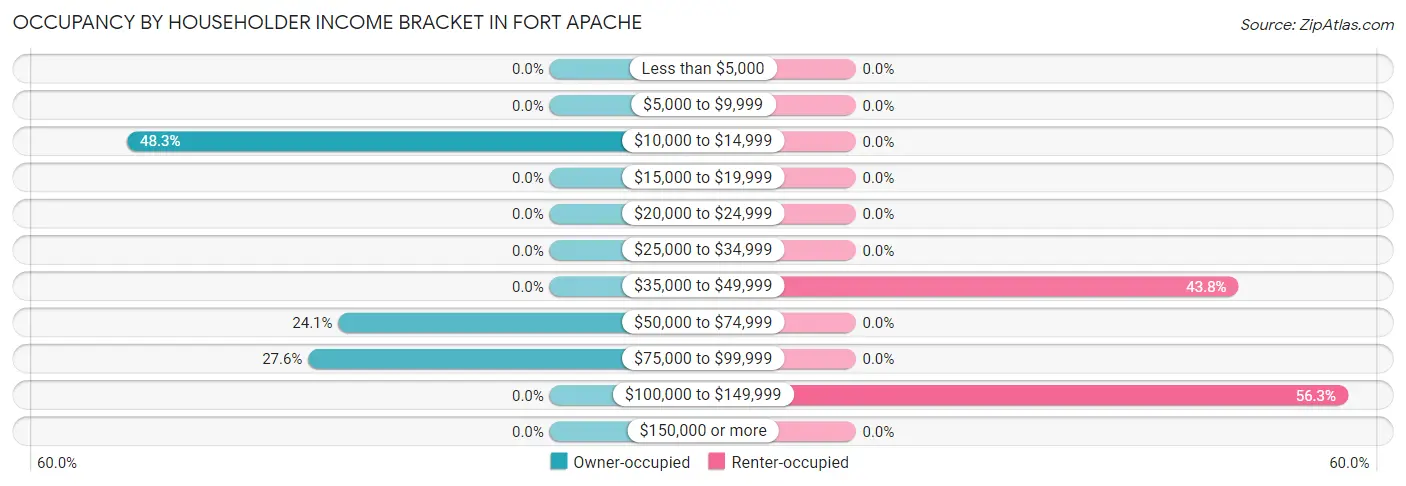
| Income Bracket | Owner-occupied | Renter-occupied |
| Less than $5,000 | 0 (0.0%) | 0 (0.0%) |
| $5,000 to $9,999 | 0 (0.0%) | 0 (0.0%) |
| $10,000 to $14,999 | 14 (48.3%) | 0 (0.0%) |
| $15,000 to $19,999 | 0 (0.0%) | 0 (0.0%) |
| $20,000 to $24,999 | 0 (0.0%) | 0 (0.0%) |
| $25,000 to $34,999 | 0 (0.0%) | 0 (0.0%) |
| $35,000 to $49,999 | 0 (0.0%) | 14 (43.8%) |
| $50,000 to $74,999 | 7 (24.1%) | 0 (0.0%) |
| $75,000 to $99,999 | 8 (27.6%) | 0 (0.0%) |
| $100,000 to $149,999 | 0 (0.0%) | 18 (56.2%) |
| $150,000 or more | 0 (0.0%) | 0 (0.0%) |
| Total | 29 (100.0%) | 32 (100.0%) |
Monthly Housing Cost Tiers in Fort Apache
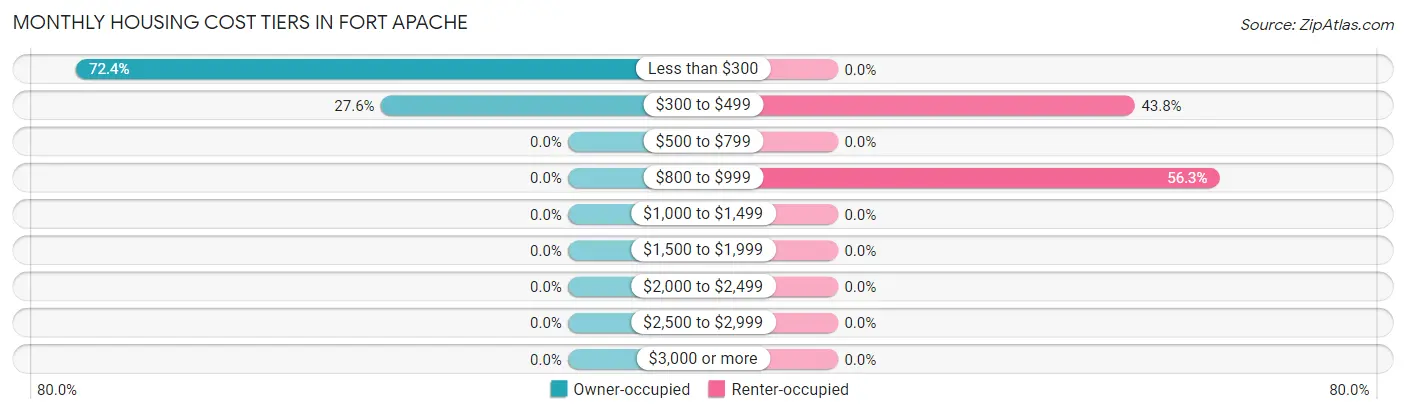
| Monthly Cost | Owner-occupied | Renter-occupied |
| Less than $300 | 21 (72.4%) | 0 (0.0%) |
| $300 to $499 | 8 (27.6%) | 14 (43.8%) |
| $500 to $799 | 0 (0.0%) | 0 (0.0%) |
| $800 to $999 | 0 (0.0%) | 18 (56.2%) |
| $1,000 to $1,499 | 0 (0.0%) | 0 (0.0%) |
| $1,500 to $1,999 | 0 (0.0%) | 0 (0.0%) |
| $2,000 to $2,499 | 0 (0.0%) | 0 (0.0%) |
| $2,500 to $2,999 | 0 (0.0%) | 0 (0.0%) |
| $3,000 or more | 0 (0.0%) | 0 (0.0%) |
| Total | 29 (100.0%) | 32 (100.0%) |
Physical Housing Characteristics in Fort Apache
Housing Structures in Fort Apache
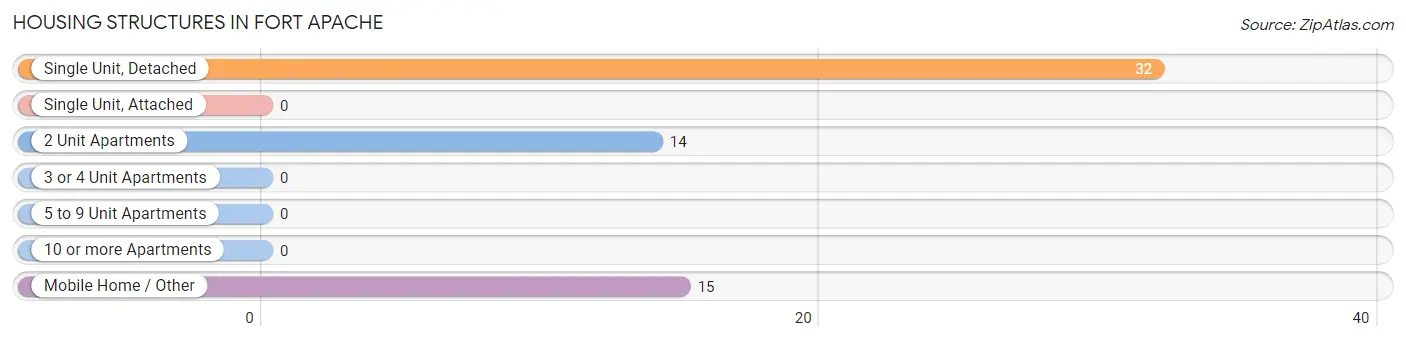
| Structure Type | # Housing Units | % Housing Units |
| Single Unit, Detached | 32 | 52.5% |
| Single Unit, Attached | 0 | 0.0% |
| 2 Unit Apartments | 14 | 23.0% |
| 3 or 4 Unit Apartments | 0 | 0.0% |
| 5 to 9 Unit Apartments | 0 | 0.0% |
| 10 or more Apartments | 0 | 0.0% |
| Mobile Home / Other | 15 | 24.6% |
| Total | 61 | 100.0% |
Housing Structures by Occupancy in Fort Apache
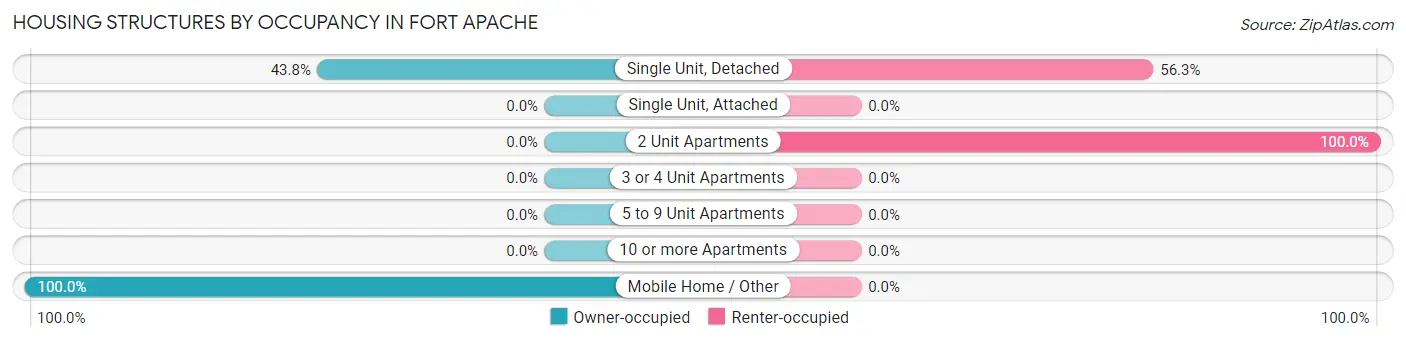
| Structure Type | Owner-occupied | Renter-occupied |
| Single Unit, Detached | 14 (43.8%) | 18 (56.2%) |
| Single Unit, Attached | 0 (0.0%) | 0 (0.0%) |
| 2 Unit Apartments | 0 (0.0%) | 14 (100.0%) |
| 3 or 4 Unit Apartments | 0 (0.0%) | 0 (0.0%) |
| 5 to 9 Unit Apartments | 0 (0.0%) | 0 (0.0%) |
| 10 or more Apartments | 0 (0.0%) | 0 (0.0%) |
| Mobile Home / Other | 15 (100.0%) | 0 (0.0%) |
| Total | 29 (47.5%) | 32 (52.5%) |
Housing Structures by Number of Rooms in Fort Apache
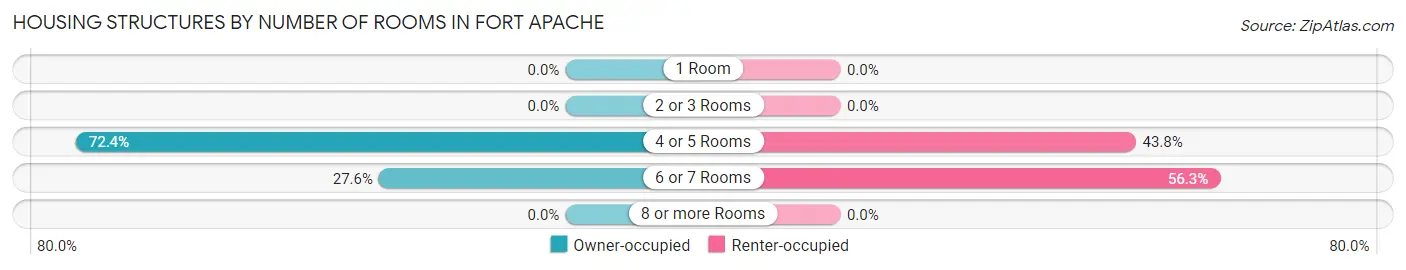
| Number of Rooms | Owner-occupied | Renter-occupied |
| 1 Room | 0 (0.0%) | 0 (0.0%) |
| 2 or 3 Rooms | 0 (0.0%) | 0 (0.0%) |
| 4 or 5 Rooms | 21 (72.4%) | 14 (43.8%) |
| 6 or 7 Rooms | 8 (27.6%) | 18 (56.2%) |
| 8 or more Rooms | 0 (0.0%) | 0 (0.0%) |
| Total | 29 (100.0%) | 32 (100.0%) |
Housing Structure by Heating Type in Fort Apache
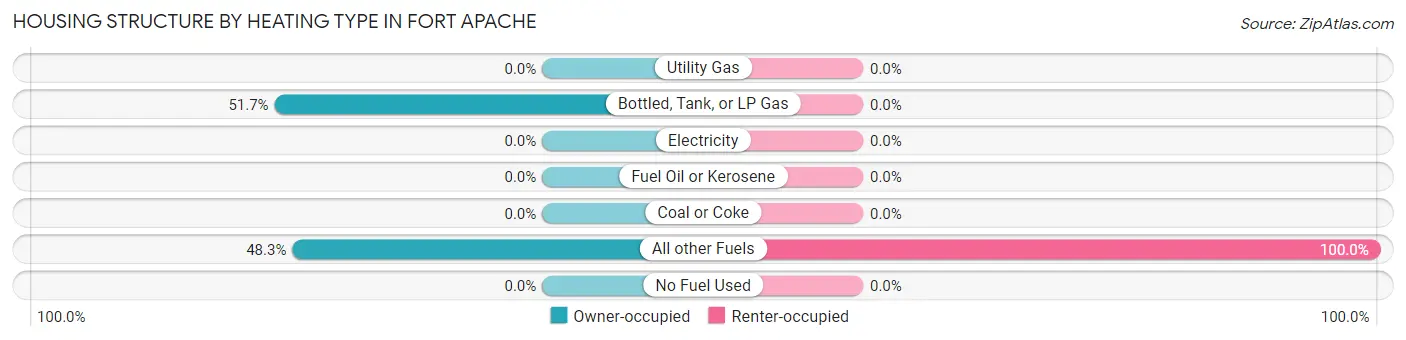
| Heating Type | Owner-occupied | Renter-occupied |
| Utility Gas | 0 (0.0%) | 0 (0.0%) |
| Bottled, Tank, or LP Gas | 15 (51.7%) | 0 (0.0%) |
| Electricity | 0 (0.0%) | 0 (0.0%) |
| Fuel Oil or Kerosene | 0 (0.0%) | 0 (0.0%) |
| Coal or Coke | 0 (0.0%) | 0 (0.0%) |
| All other Fuels | 14 (48.3%) | 32 (100.0%) |
| No Fuel Used | 0 (0.0%) | 0 (0.0%) |
| Total | 29 (100.0%) | 32 (100.0%) |
Household Vehicle Usage in Fort Apache
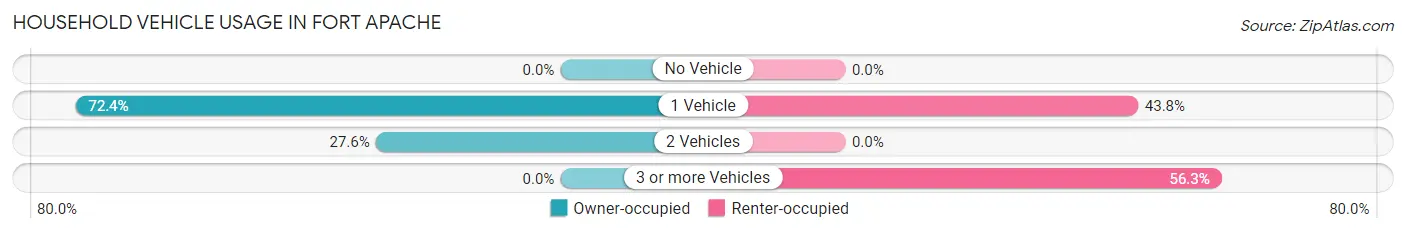
| Vehicles per Household | Owner-occupied | Renter-occupied |
| No Vehicle | 0 (0.0%) | 0 (0.0%) |
| 1 Vehicle | 21 (72.4%) | 14 (43.8%) |
| 2 Vehicles | 8 (27.6%) | 0 (0.0%) |
| 3 or more Vehicles | 0 (0.0%) | 18 (56.2%) |
| Total | 29 (100.0%) | 32 (100.0%) |
Real Estate & Mortgages in Fort Apache
Real Estate and Mortgage Overview in Fort Apache
| Characteristic | Without Mortgage | With Mortgage |
| Housing Units | 29 | 0 |
| Median Property Value | $59,400 | $0 |
| Median Household Income | - | - |
| Monthly Housing Costs | $185 | $0 |
| Real Estate Taxes | - | - |
Property Value by Mortgage Status in Fort Apache
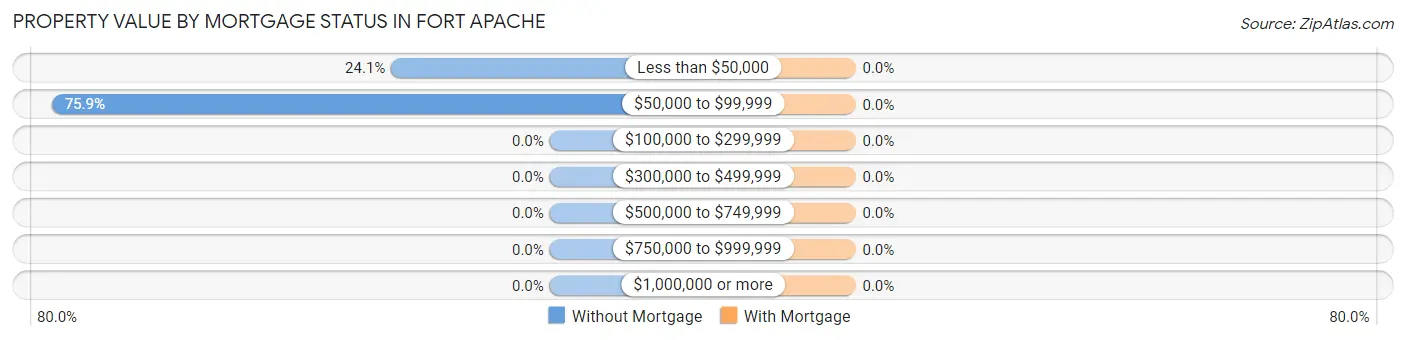
| Property Value | Without Mortgage | With Mortgage |
| Less than $50,000 | 7 (24.1%) | 0 (0.0%) |
| $50,000 to $99,999 | 22 (75.9%) | 0 (0.0%) |
| $100,000 to $299,999 | 0 (0.0%) | 0 (0.0%) |
| $300,000 to $499,999 | 0 (0.0%) | 0 (0.0%) |
| $500,000 to $749,999 | 0 (0.0%) | 0 (0.0%) |
| $750,000 to $999,999 | 0 (0.0%) | 0 (0.0%) |
| $1,000,000 or more | 0 (0.0%) | 0 (0.0%) |
| Total | 29 (100.0%) | 0 (0.0%) |
Household Income by Mortgage Status in Fort Apache
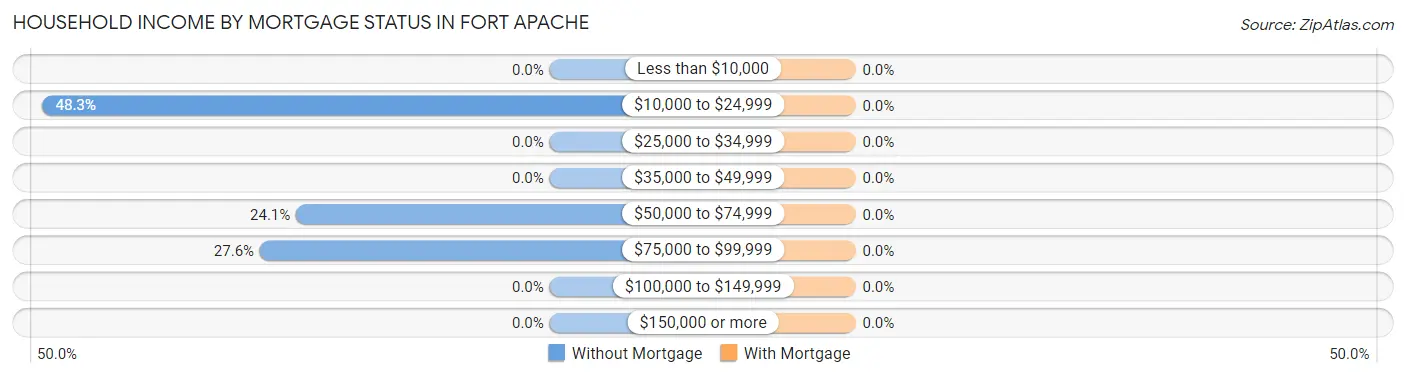
| Household Income | Without Mortgage | With Mortgage |
| Less than $10,000 | 0 (0.0%) | 0 (0.0%) |
| $10,000 to $24,999 | 14 (48.3%) | 0 (0.0%) |
| $25,000 to $34,999 | 0 (0.0%) | 0 (0.0%) |
| $35,000 to $49,999 | 0 (0.0%) | 0 (0.0%) |
| $50,000 to $74,999 | 7 (24.1%) | 0 (0.0%) |
| $75,000 to $99,999 | 8 (27.6%) | 0 (0.0%) |
| $100,000 to $149,999 | 0 (0.0%) | 0 (0.0%) |
| $150,000 or more | 0 (0.0%) | 0 (0.0%) |
| Total | 29 (100.0%) | 0 (0.0%) |
Property Value to Household Income Ratio in Fort Apache
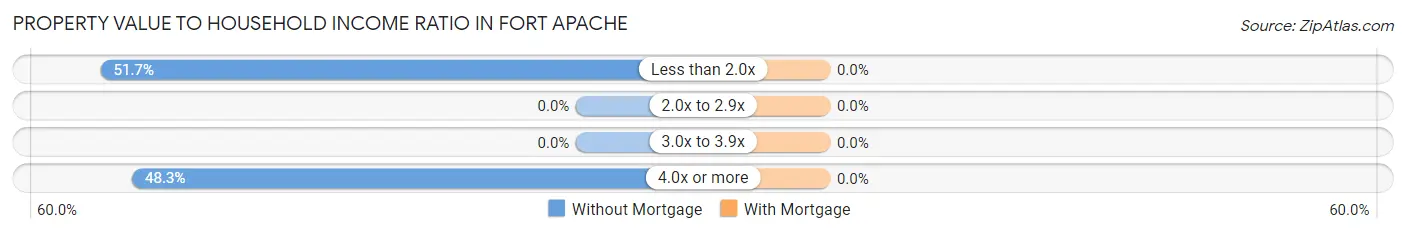
| Value-to-Income Ratio | Without Mortgage | With Mortgage |
| Less than 2.0x | 15 (51.7%) | 0 (0.0%) |
| 2.0x to 2.9x | 0 (0.0%) | 0 (0.0%) |
| 3.0x to 3.9x | 0 (0.0%) | 0 (0.0%) |
| 4.0x or more | 14 (48.3%) | 0 (0.0%) |
| Total | 29 (100.0%) | 0 (0.0%) |
Real Estate Taxes by Mortgage Status in Fort Apache
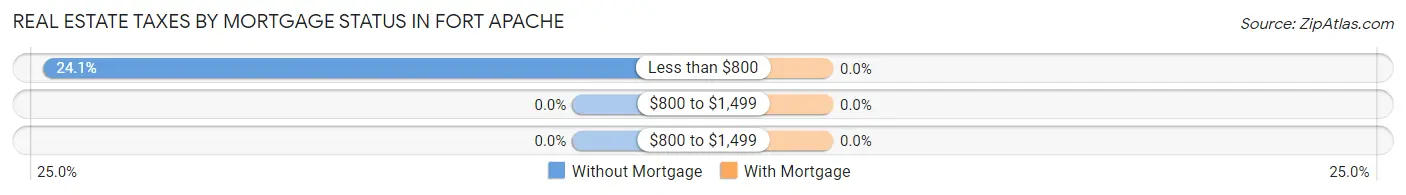
| Property Taxes | Without Mortgage | With Mortgage |
| Less than $800 | 7 (24.1%) | 0 (0.0%) |
| $800 to $1,499 | 0 (0.0%) | 0 (0.0%) |
| $800 to $1,499 | 0 (0.0%) | 0 (0.0%) |
| Total | 29 (100.0%) | 0 (0.0%) |
Health & Disability in Fort Apache
Health Insurance Coverage by Age in Fort Apache
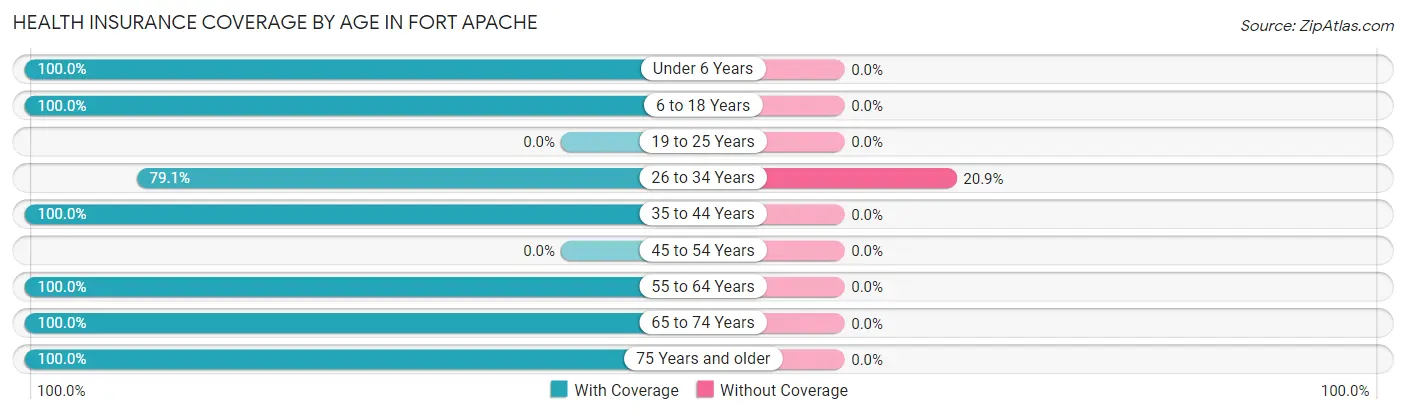
| Age Bracket | With Coverage | Without Coverage |
| Under 6 Years | 24 (100.0%) | 0 (0.0%) |
| 6 to 18 Years | 58 (100.0%) | 0 (0.0%) |
| 19 to 25 Years | 0 (0.0%) | 0 (0.0%) |
| 26 to 34 Years | 53 (79.1%) | 14 (20.9%) |
| 35 to 44 Years | 14 (100.0%) | 0 (0.0%) |
| 45 to 54 Years | 0 (0.0%) | 0 (0.0%) |
| 55 to 64 Years | 7 (100.0%) | 0 (0.0%) |
| 65 to 74 Years | 7 (100.0%) | 0 (0.0%) |
| 75 Years and older | 8 (100.0%) | 0 (0.0%) |
| Total | 171 (92.4%) | 14 (7.6%) |
Health Insurance Coverage by Citizenship Status in Fort Apache
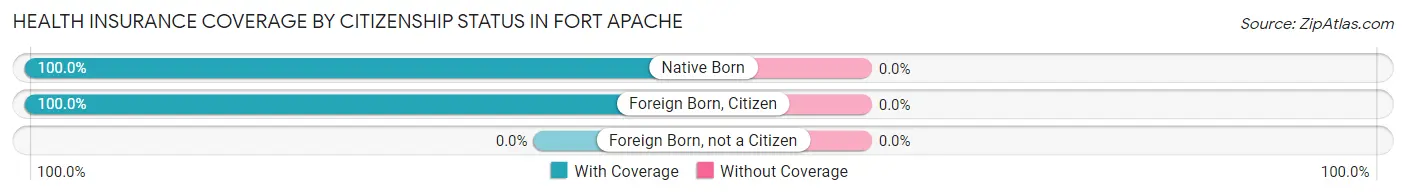
| Citizenship Status | With Coverage | Without Coverage |
| Native Born | 24 (100.0%) | 0 (0.0%) |
| Foreign Born, Citizen | 58 (100.0%) | 0 (0.0%) |
| Foreign Born, not a Citizen | 0 (0.0%) | 0 (0.0%) |
Health Insurance Coverage by Household Income in Fort Apache
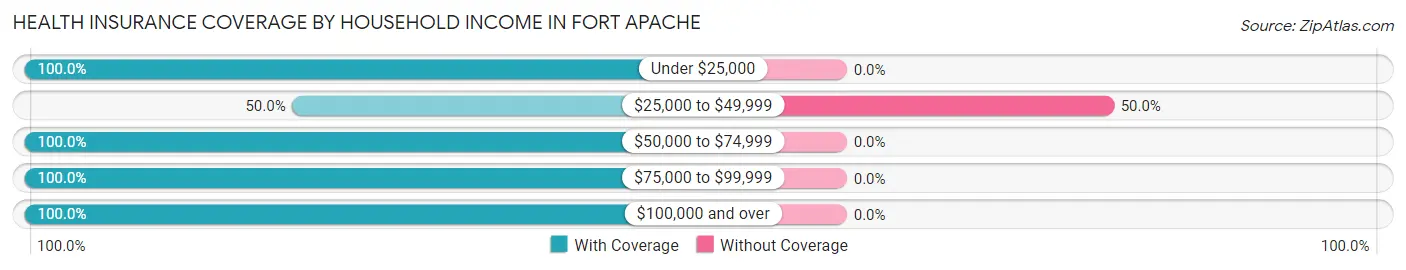
| Household Income | With Coverage | Without Coverage |
| Under $25,000 | 57 (100.0%) | 0 (0.0%) |
| $25,000 to $49,999 | 14 (50.0%) | 14 (50.0%) |
| $50,000 to $74,999 | 7 (100.0%) | 0 (0.0%) |
| $75,000 to $99,999 | 15 (100.0%) | 0 (0.0%) |
| $100,000 and over | 78 (100.0%) | 0 (0.0%) |
Public vs Private Health Insurance Coverage by Age in Fort Apache
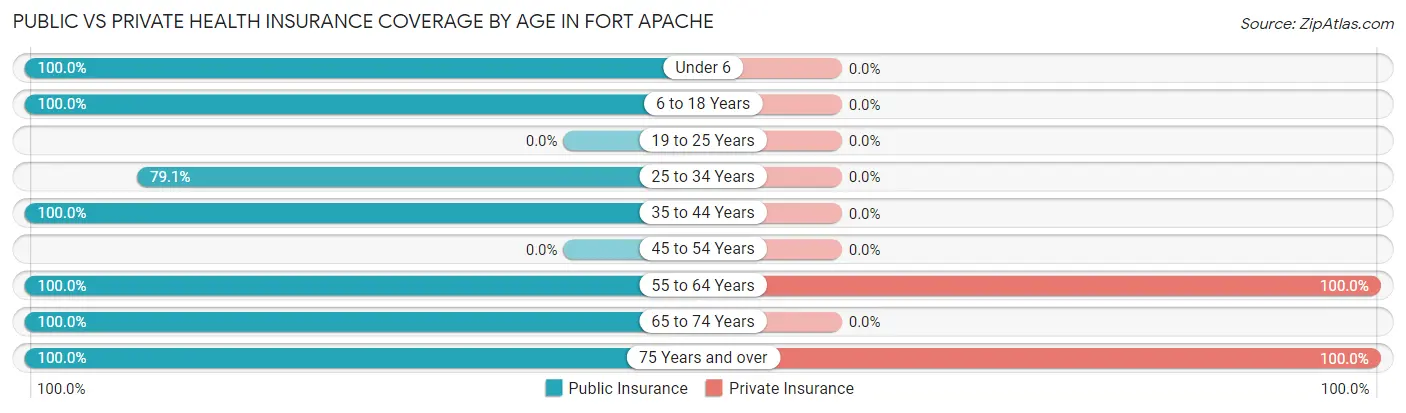
| Age Bracket | Public Insurance | Private Insurance |
| Under 6 | 24 (100.0%) | 0 (0.0%) |
| 6 to 18 Years | 58 (100.0%) | 0 (0.0%) |
| 19 to 25 Years | 0 (0.0%) | 0 (0.0%) |
| 25 to 34 Years | 53 (79.1%) | 0 (0.0%) |
| 35 to 44 Years | 14 (100.0%) | 0 (0.0%) |
| 45 to 54 Years | 0 (0.0%) | 0 (0.0%) |
| 55 to 64 Years | 7 (100.0%) | 7 (100.0%) |
| 65 to 74 Years | 7 (100.0%) | 0 (0.0%) |
| 75 Years and over | 8 (100.0%) | 8 (100.0%) |
| Total | 171 (92.4%) | 15 (8.1%) |
Disability Status by Sex by Age in Fort Apache
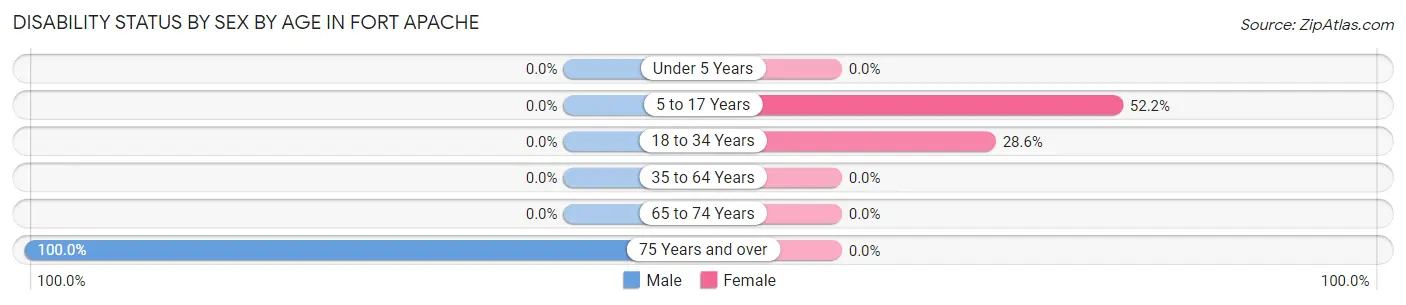
| Age Bracket | Male | Female |
| Under 5 Years | 0 (0.0%) | 0 (0.0%) |
| 5 to 17 Years | 0 (0.0%) | 12 (52.2%) |
| 18 to 34 Years | 0 (0.0%) | 14 (28.6%) |
| 35 to 64 Years | 0 (0.0%) | 0 (0.0%) |
| 65 to 74 Years | 0 (0.0%) | 0 (0.0%) |
| 75 Years and over | 8 (100.0%) | 0 (0.0%) |
Disability Class by Sex by Age in Fort Apache
Disability Class: Hearing Difficulty
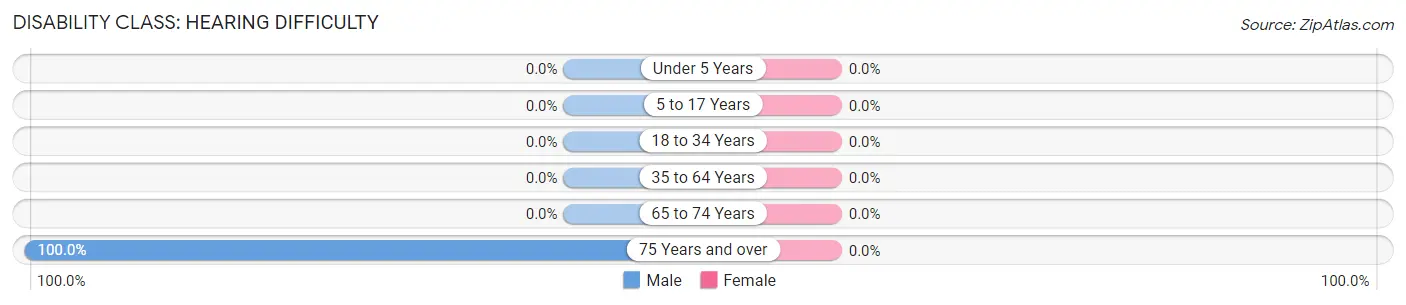
| Age Bracket | Male | Female |
| Under 5 Years | 0 (0.0%) | 0 (0.0%) |
| 5 to 17 Years | 0 (0.0%) | 0 (0.0%) |
| 18 to 34 Years | 0 (0.0%) | 0 (0.0%) |
| 35 to 64 Years | 0 (0.0%) | 0 (0.0%) |
| 65 to 74 Years | 0 (0.0%) | 0 (0.0%) |
| 75 Years and over | 8 (100.0%) | 0 (0.0%) |
Disability Class: Vision Difficulty
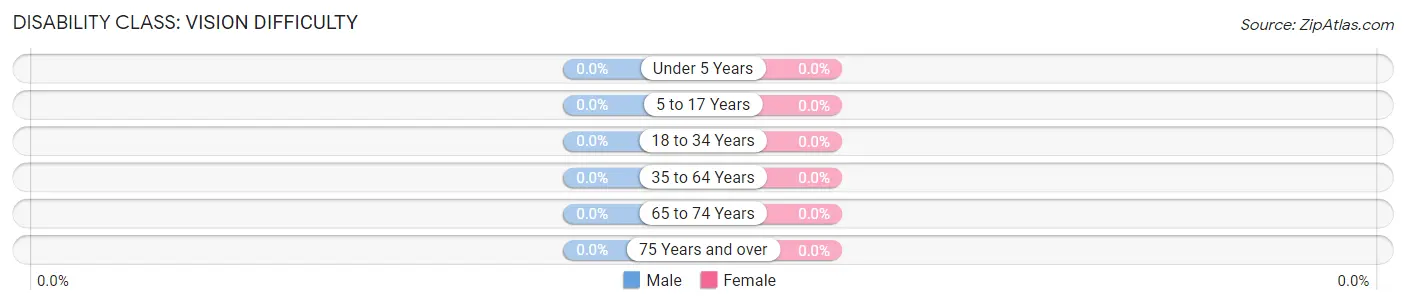
| Age Bracket | Male | Female |
| Under 5 Years | 0 (0.0%) | 0 (0.0%) |
| 5 to 17 Years | 0 (0.0%) | 0 (0.0%) |
| 18 to 34 Years | 0 (0.0%) | 0 (0.0%) |
| 35 to 64 Years | 0 (0.0%) | 0 (0.0%) |
| 65 to 74 Years | 0 (0.0%) | 0 (0.0%) |
| 75 Years and over | 0 (0.0%) | 0 (0.0%) |
Disability Class: Cognitive Difficulty
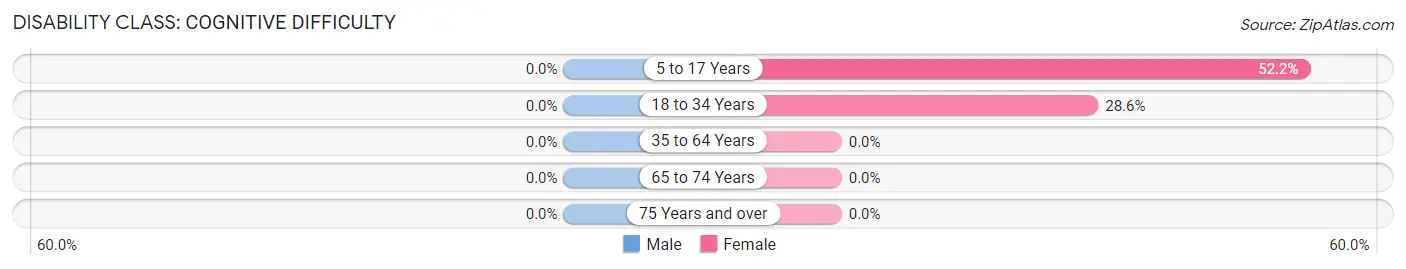
| Age Bracket | Male | Female |
| 5 to 17 Years | 0 (0.0%) | 12 (52.2%) |
| 18 to 34 Years | 0 (0.0%) | 14 (28.6%) |
| 35 to 64 Years | 0 (0.0%) | 0 (0.0%) |
| 65 to 74 Years | 0 (0.0%) | 0 (0.0%) |
| 75 Years and over | 0 (0.0%) | 0 (0.0%) |
Disability Class: Ambulatory Difficulty
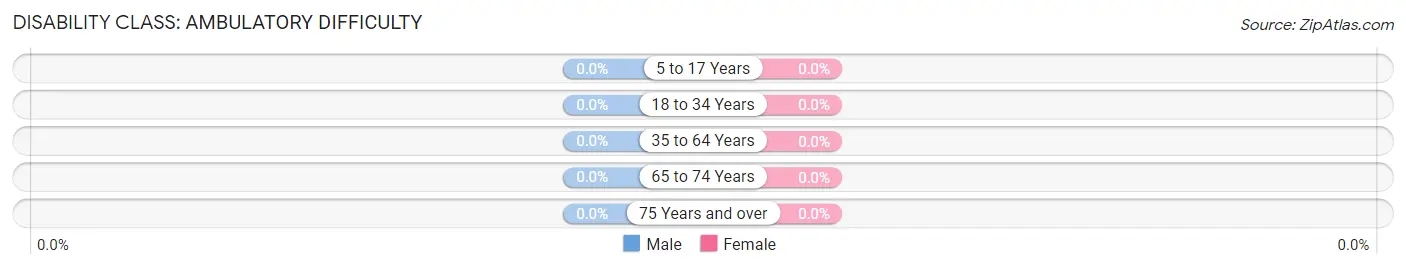
| Age Bracket | Male | Female |
| 5 to 17 Years | 0 (0.0%) | 0 (0.0%) |
| 18 to 34 Years | 0 (0.0%) | 0 (0.0%) |
| 35 to 64 Years | 0 (0.0%) | 0 (0.0%) |
| 65 to 74 Years | 0 (0.0%) | 0 (0.0%) |
| 75 Years and over | 0 (0.0%) | 0 (0.0%) |
Disability Class: Self-Care Difficulty
| Age Bracket | Male | Female |
| 5 to 17 Years | 0 (0.0%) | 0 (0.0%) |
| 18 to 34 Years | 0 (0.0%) | 0 (0.0%) |
| 35 to 64 Years | 0 (0.0%) | 0 (0.0%) |
| 65 to 74 Years | 0 (0.0%) | 0 (0.0%) |
| 75 Years and over | 0 (0.0%) | 0 (0.0%) |
Technology Access in Fort Apache
Computing Device Access in Fort Apache
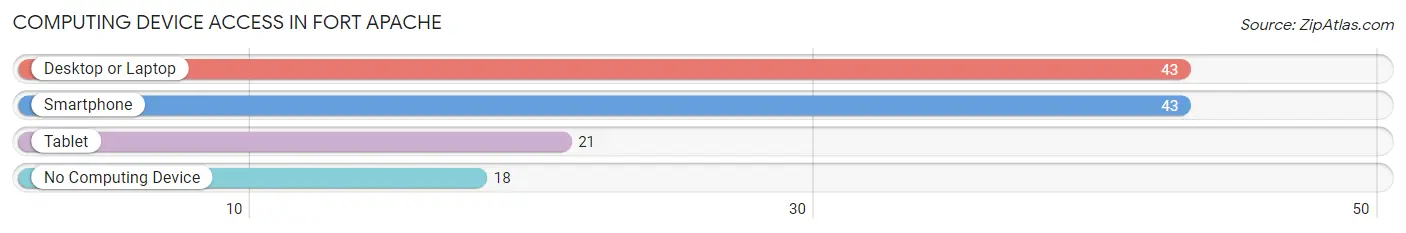
| Device Type | # Households | % Households |
| Desktop or Laptop | 43 | 70.5% |
| Smartphone | 43 | 70.5% |
| Tablet | 21 | 34.4% |
| No Computing Device | 18 | 29.5% |
| Total | 61 | 100.0% |
Internet Access in Fort Apache
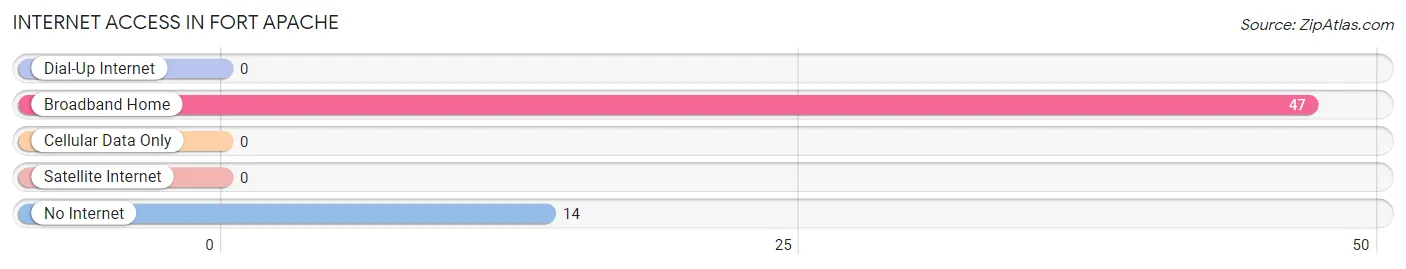
| Internet Type | # Households | % Households |
| Dial-Up Internet | 0 | 0.0% |
| Broadband Home | 47 | 77.0% |
| Cellular Data Only | 0 | 0.0% |
| Satellite Internet | 0 | 0.0% |
| No Internet | 14 | 23.0% |
| Total | 61 | 100.0% |
Fort Apache Summary
Fort Apache is a census-designated place (CDP) located in Navajo County, Arizona. It is located within the White Mountain Apache Indian Reservation, and is home to the White Mountain Apache Tribe. The population of Fort Apache was 1,523 at the 2010 census.
History
Fort Apache was established in 1870 as a United States Army post to protect settlers from Apache raids. The fort was named after the Apache tribe, and was originally located near the present-day town of Cibecue. In 1871, the fort was relocated to its current location, near the present-day town of Whiteriver. The fort was abandoned in 1922, and the land was returned to the White Mountain Apache Tribe.
Geography
Fort Apache is located at 34°45'17"N 109°45'45"W (34.754722, -109.762500). It is situated in the White Mountains of eastern Arizona, at an elevation of 6,400 feet (1,951 m). The CDP has a total area of 4.2 square miles (10.8 km2), all of which is land.
Economy
The economy of Fort Apache is largely based on tourism and the timber industry. The White Mountain Apache Tribe operates the Hon-Dah Resort Casino, which is located in the CDP. The resort features a casino, hotel, RV park, and conference center. The tribe also operates the Sunrise Ski Park, which is located nearby. The ski park offers skiing, snowboarding, and tubing.
The timber industry is also an important part of the local economy. The White Mountain Apache Tribe owns and manages the Apache-Sitgreaves National Forest, which covers 1.6 million acres (6,500 km2) of land in eastern Arizona. The forest is home to a variety of wildlife, including elk, deer, and black bear. The tribe also operates a sawmill and a wood products manufacturing facility.
Demographics
As of the 2010 census, there were 1,523 people, 517 households, and 393 families residing in the CDP. The population density was 363.2 people per square mile (140.5/km2). There were 590 housing units at an average density of 141.3 per square mile (54.5/km2). The racial makeup of the CDP was 92.2% Native American, 4.2% White, 0.3% Asian, 0.1% Pacific Islander, 0.7% from other races, and 2.5% from two or more races. Hispanic or Latino of any race were 3.2% of the population.
There were 517 households, out of which 41.2% had children under the age of 18 living with them, 37.2% were married couples living together, 28.2% had a female householder with no husband present, and 24.2% were non-families. 19.7% of all households were made up of individuals, and 5.3% had someone living alone who was 65 years of age or older. The average household size was 2.95 and the average family size was 3.41.
In the CDP, the population was spread out, with 33.2% under the age of 18, 10.2% from 18 to 24, 27.2% from 25 to 44, 22.2% from 45 to 64, and 7.2% who were 65 years of age or older. The median age was 30 years. For every 100 females, there were 97.2 males. For every 100 females age 18 and over, there were 94.2 males.
The median income for a household in the CDP was $25,000, and the median income for a family was $27,500. Males had a median income of $25,000 versus $20,000 for females. The per capita income for the CDP was $10,845. About 24.2% of families and 28.2% of the population were below the poverty line, including 33.2% of those under age 18 and 33.2% of those age 65 or over.
Common Questions
What is Per Capita Income in Fort Apache?
Per Capita income in Fort Apache is $19,730.
What is the Median Household income in Fort Apache?
Median Household Income in Fort Apache is $73,393.
What is Inequality or Gini Index in Fort Apache?
Inequality or Gini Index in Fort Apache is 0.32.
What is the Total Population of Fort Apache?
Total Population of Fort Apache is 185.
What is the Total Male Population of Fort Apache?
Total Male Population of Fort Apache is 106.
What is the Total Female Population of Fort Apache?
Total Female Population of Fort Apache is 79.
What is the Ratio of Males per 100 Females in Fort Apache?
There are 134.18 Males per 100 Females in Fort Apache.
What is the Ratio of Females per 100 Males in Fort Apache?
There are 74.53 Females per 100 Males in Fort Apache.
What is the Median Population Age in Fort Apache?
Median Population Age in Fort Apache is 26.8 Years.
What is the Average Family Size in Fort Apache
Average Family Size in Fort Apache is 3.1 People.
What is the Average Household Size in Fort Apache
Average Household Size in Fort Apache is 3.0 People.
How Large is the Labor Force in Fort Apache?
There are 43 People in the Labor Forcein in Fort Apache.
What is the Percentage of People in the Labor Force in Fort Apache?
37.1% of People are in the Labor Force in Fort Apache.