Mount Leonard, MO Map & Demographics
Mount Leonard Map
Mount Leonard Overview
$9,477
PER CAPITA INCOME
33.8%
WAGE / INCOME GAP [ % ]
66.2¢/ $1
WAGE / INCOME GAP [ $ ]
0.56
INEQUALITY / GINI INDEX
53
TOTAL POPULATION
12
MALE POPULATION
41
FEMALE POPULATION
29.27
MALES / 100 FEMALES
341.67
FEMALES / 100 MALES
52.8
MEDIAN AGE
3.6
AVG FAMILY SIZE
2.8
AVG HOUSEHOLD SIZE
7
LABOR FORCE [ PEOPLE ]
13.2%
PERCENT IN LABOR FORCE
Mount Leonard Area Codes
Income in Mount Leonard
Income Overview in Mount Leonard
| Characteristic | Number | Measure |
| Per Capita Income | 53 | $9,477 |
| Median Family Income | 13 | $0 |
| Mean Family Income | 13 | $22,123 |
| Median Household Income | 19 | $0 |
| Mean Household Income | 19 | $26,637 |
| Income Deficit | 13 | $0 |
| Wage / Income Gap (%) | 53 | 33.78% |
| Wage / Income Gap ($) | 53 | 66.22¢ per $1 |
| Gini / Inequality Index | 53 | 0.56 |
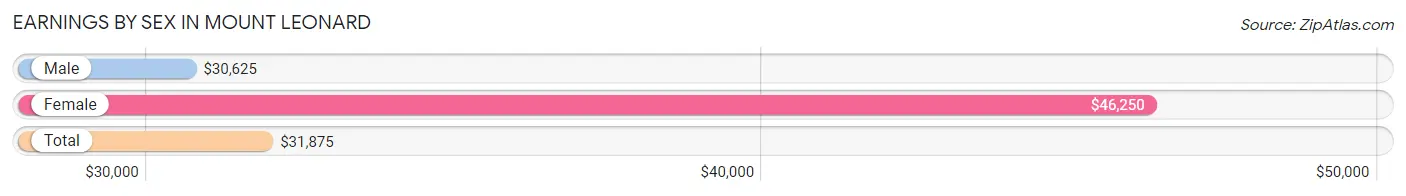
Earnings by Sex in Mount Leonard
Average Earnings in Mount Leonard are $31,875, $30,625 for men and $46,250 for women, a difference of 33.8%.
| Sex | Number | Average Earnings |
| Male | 5 (55.6%) | $30,625 |
| Female | 4 (44.4%) | $46,250 |
| Total | 9 (100.0%) | $31,875 |
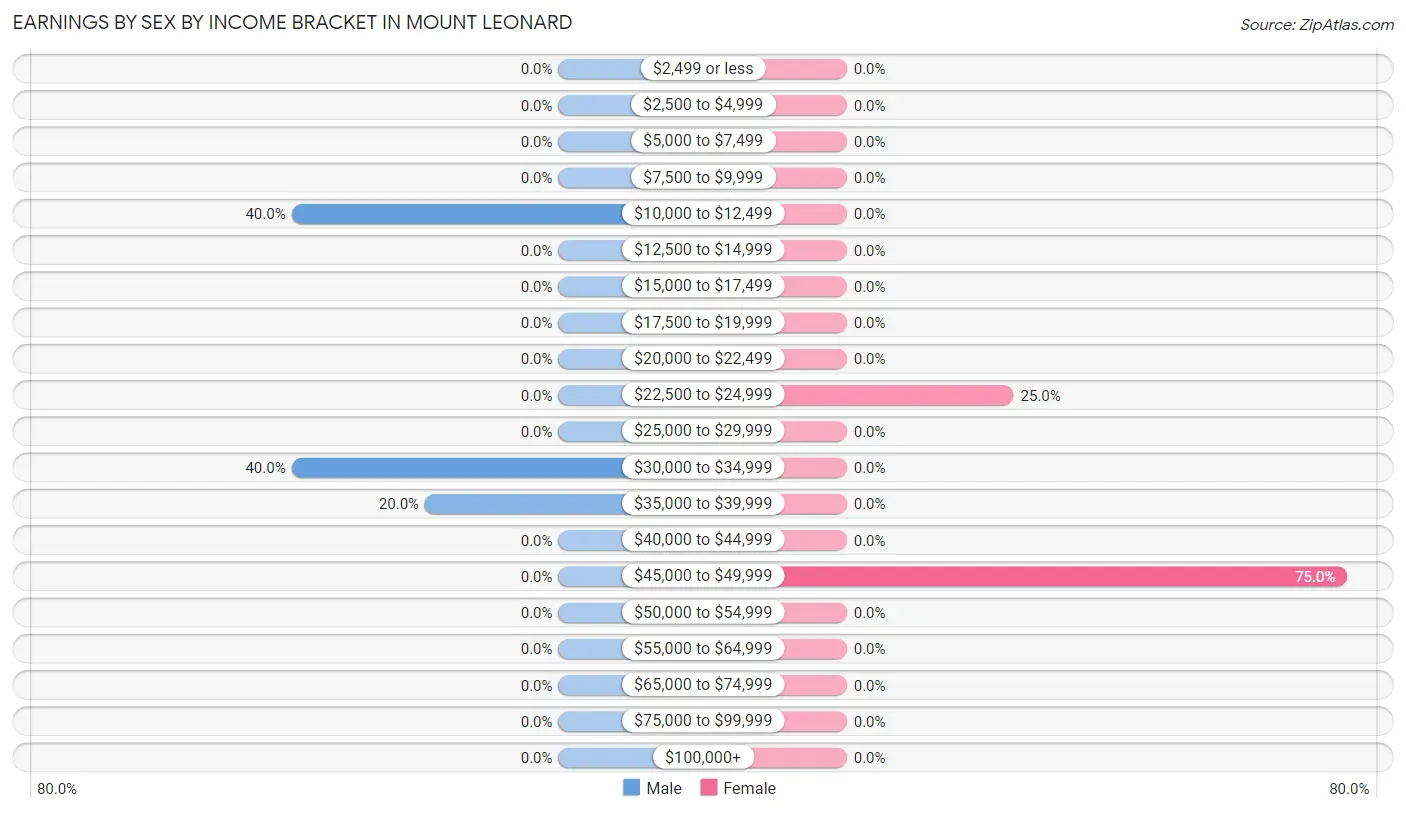
Earnings by Sex by Income Bracket in Mount Leonard
The most common earnings brackets in Mount Leonard are $10,000 to $12,499 for men (2 | 40.0%) and $45,000 to $49,999 for women (3 | 75.0%).
| Income | Male | Female |
| $2,499 or less | 0 (0.0%) | 0 (0.0%) |
| $2,500 to $4,999 | 0 (0.0%) | 0 (0.0%) |
| $5,000 to $7,499 | 0 (0.0%) | 0 (0.0%) |
| $7,500 to $9,999 | 0 (0.0%) | 0 (0.0%) |
| $10,000 to $12,499 | 2 (40.0%) | 0 (0.0%) |
| $12,500 to $14,999 | 0 (0.0%) | 0 (0.0%) |
| $15,000 to $17,499 | 0 (0.0%) | 0 (0.0%) |
| $17,500 to $19,999 | 0 (0.0%) | 0 (0.0%) |
| $20,000 to $22,499 | 0 (0.0%) | 0 (0.0%) |
| $22,500 to $24,999 | 0 (0.0%) | 1 (25.0%) |
| $25,000 to $29,999 | 0 (0.0%) | 0 (0.0%) |
| $30,000 to $34,999 | 2 (40.0%) | 0 (0.0%) |
| $35,000 to $39,999 | 1 (20.0%) | 0 (0.0%) |
| $40,000 to $44,999 | 0 (0.0%) | 0 (0.0%) |
| $45,000 to $49,999 | 0 (0.0%) | 3 (75.0%) |
| $50,000 to $54,999 | 0 (0.0%) | 0 (0.0%) |
| $55,000 to $64,999 | 0 (0.0%) | 0 (0.0%) |
| $65,000 to $74,999 | 0 (0.0%) | 0 (0.0%) |
| $75,000 to $99,999 | 0 (0.0%) | 0 (0.0%) |
| $100,000+ | 0 (0.0%) | 0 (0.0%) |
| Total | 5 (100.0%) | 4 (100.0%) |
Earnings by Sex by Educational Attainment in Mount Leonard
| Educational Attainment | Male Income | Female Income |
| Less than High School | - | - |
| High School Diploma | - | - |
| College or Associate's Degree | - | - |
| Bachelor's Degree | - | - |
| Graduate Degree | - | - |
| Total | $30,625 | $46,250 |
Family Income in Mount Leonard
Family Income Brackets in Mount Leonard
According to the Mount Leonard family income data, there are 6 families falling into the less than $10,000 income range, which is the most common income bracket and makes up 46.2% of all families.
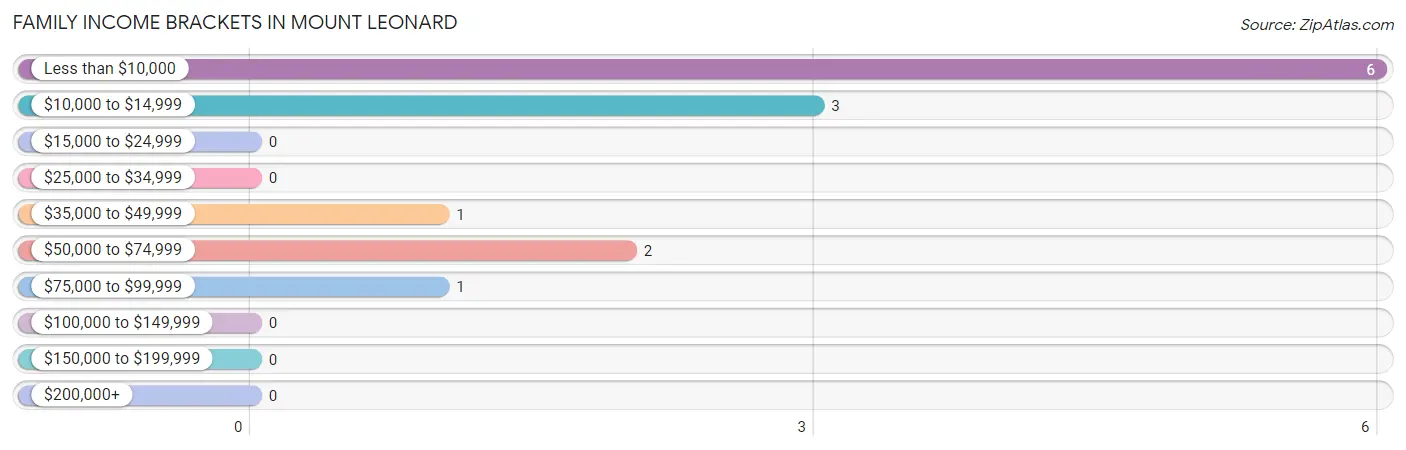
| Income Bracket | # Families | % Families |
| Less than $10,000 | 6 | 46.2% |
| $10,000 to $14,999 | 3 | 23.1% |
| $15,000 to $24,999 | 0 | 0.0% |
| $25,000 to $34,999 | 0 | 0.0% |
| $35,000 to $49,999 | 1 | 7.7% |
| $50,000 to $74,999 | 2 | 15.4% |
| $75,000 to $99,999 | 1 | 7.7% |
| $100,000 to $149,999 | 0 | 0.0% |
| $150,000 to $199,999 | 0 | 0.0% |
| $200,000+ | 0 | 0.0% |
Family Income by Famaliy Size in Mount Leonard
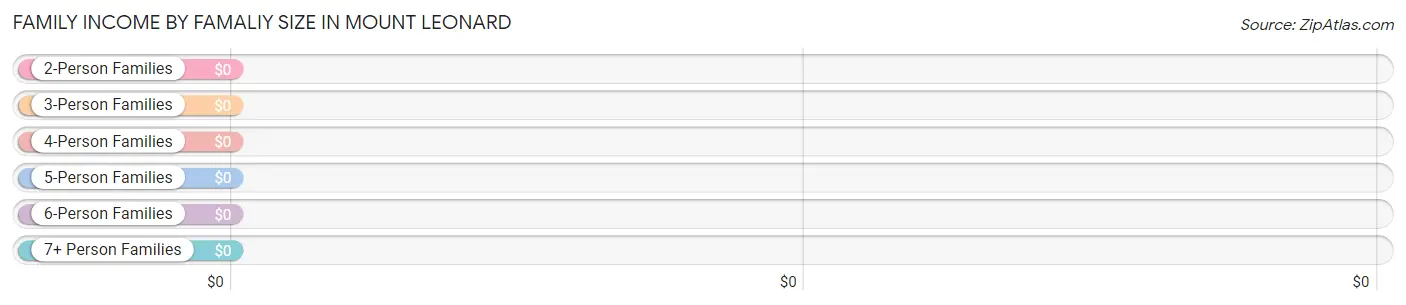
| Income Bracket | # Families | Median Income |
| 2-Person Families | 8 (61.5%) | $0 |
| 3-Person Families | 1 (7.7%) | $0 |
| 4-Person Families | 4 (30.8%) | $0 |
| 5-Person Families | 0 (0.0%) | $0 |
| 6-Person Families | 0 (0.0%) | $0 |
| 7+ Person Families | 0 (0.0%) | $0 |
| Total | 13 (100.0%) | $0 |
Family Income by Number of Earners in Mount Leonard
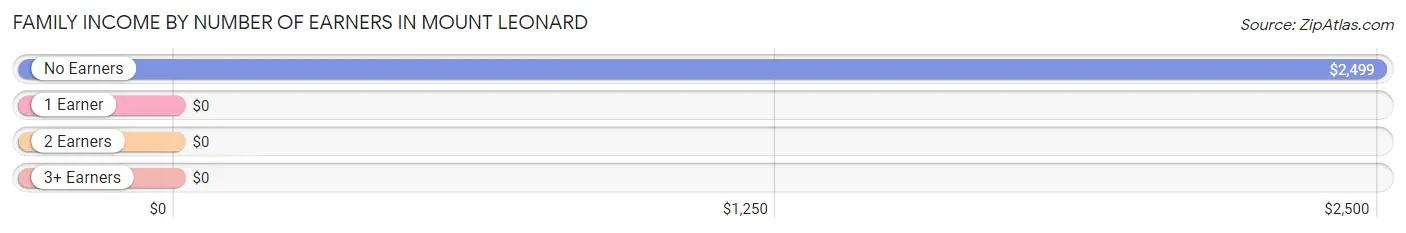
| Number of Earners | # Families | Median Income |
| No Earners | 10 (76.9%) | $2,499 |
| 1 Earner | 2 (15.4%) | $0 |
| 2 Earners | 1 (7.7%) | $0 |
| 3+ Earners | 0 (0.0%) | $0 |
| Total | 13 (100.0%) | $0 |
Household Income in Mount Leonard
Household Income Brackets in Mount Leonard
With 7 households falling in the category, the less than $10,000 income range is the most frequent in Mount Leonard, accounting for 36.8% of all households.
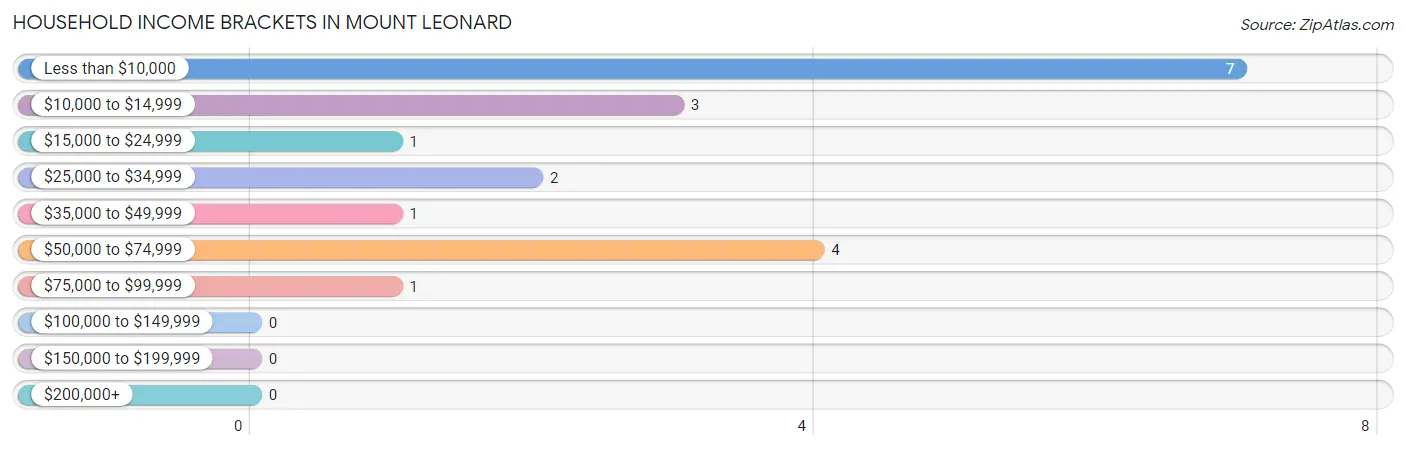
| Income Bracket | # Households | % Households |
| Less than $10,000 | 7 | 36.8% |
| $10,000 to $14,999 | 3 | 15.8% |
| $15,000 to $24,999 | 1 | 5.3% |
| $25,000 to $34,999 | 2 | 10.5% |
| $35,000 to $49,999 | 1 | 5.3% |
| $50,000 to $74,999 | 4 | 21.1% |
| $75,000 to $99,999 | 1 | 5.3% |
| $100,000 to $149,999 | 0 | 0.0% |
| $150,000 to $199,999 | 0 | 0.0% |
| $200,000+ | 0 | 0.0% |
Household Income by Householder Age in Mount Leonard
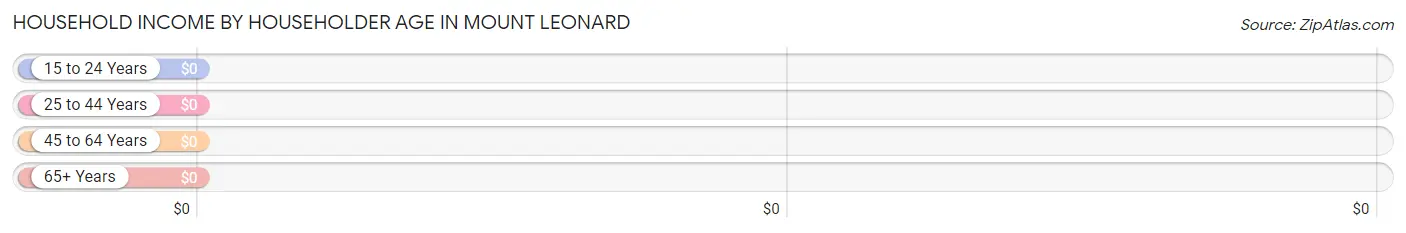
| Income Bracket | # Households | Median Income |
| 15 to 24 Years | 0 (0.0%) | $0 |
| 25 to 44 Years | 0 (0.0%) | $0 |
| 45 to 64 Years | 16 (84.2%) | $0 |
| 65+ Years | 3 (15.8%) | $0 |
| Total | 19 (100.0%) | $0 |
Poverty in Mount Leonard
Income Below Poverty by Sex and Age in Mount Leonard
With 33.3% poverty level for males and 82.9% for females among the residents of Mount Leonard, 65 to 74 year old males and 18 to 24 year old females are the most vulnerable to poverty, with 1 males (100.0%) and 25 females (100.0%) in their respective age groups living below the poverty level.
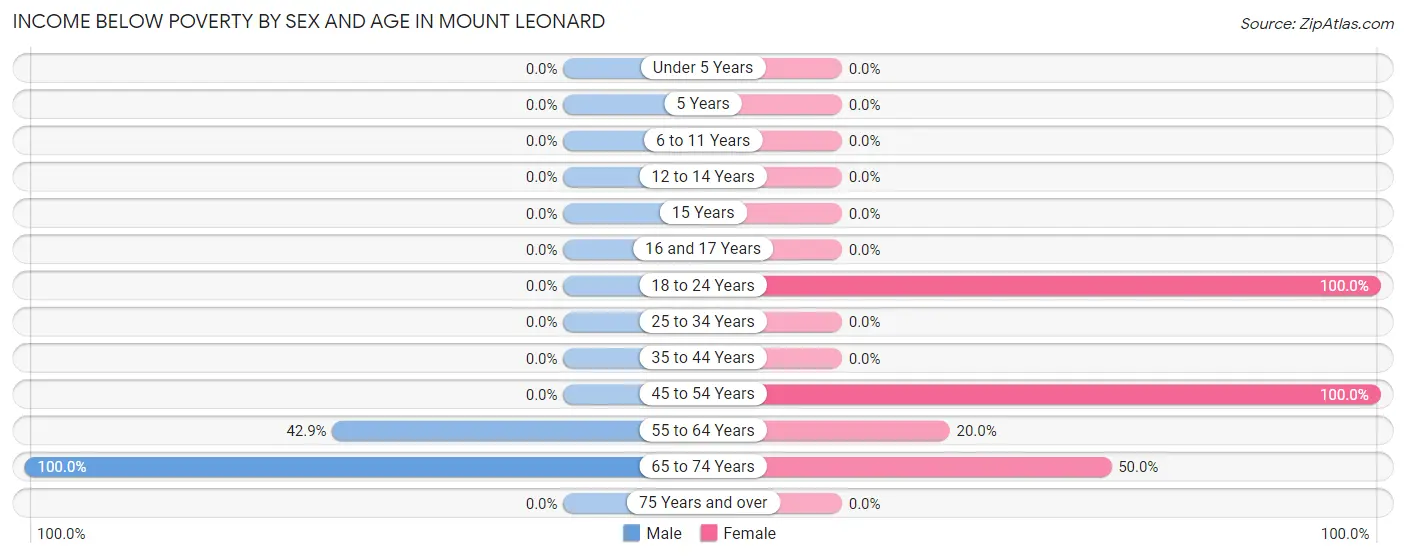
| Age Bracket | Male | Female |
| Under 5 Years | 0 (0.0%) | 0 (0.0%) |
| 5 Years | 0 (0.0%) | 0 (0.0%) |
| 6 to 11 Years | 0 (0.0%) | 0 (0.0%) |
| 12 to 14 Years | 0 (0.0%) | 0 (0.0%) |
| 15 Years | 0 (0.0%) | 0 (0.0%) |
| 16 and 17 Years | 0 (0.0%) | 0 (0.0%) |
| 18 to 24 Years | 0 (0.0%) | 25 (100.0%) |
| 25 to 34 Years | 0 (0.0%) | 0 (0.0%) |
| 35 to 44 Years | 0 (0.0%) | 0 (0.0%) |
| 45 to 54 Years | 0 (0.0%) | 6 (100.0%) |
| 55 to 64 Years | 3 (42.9%) | 1 (20.0%) |
| 65 to 74 Years | 1 (100.0%) | 2 (50.0%) |
| 75 Years and over | 0 (0.0%) | 0 (0.0%) |
| Total | 4 (33.3%) | 34 (82.9%) |
Income Above Poverty by Sex and Age in Mount Leonard
According to the poverty statistics in Mount Leonard, males aged 45 to 54 years and females aged 75 years and over are the age groups that are most secure financially, with 100.0% of males and 100.0% of females in these age groups living above the poverty line.
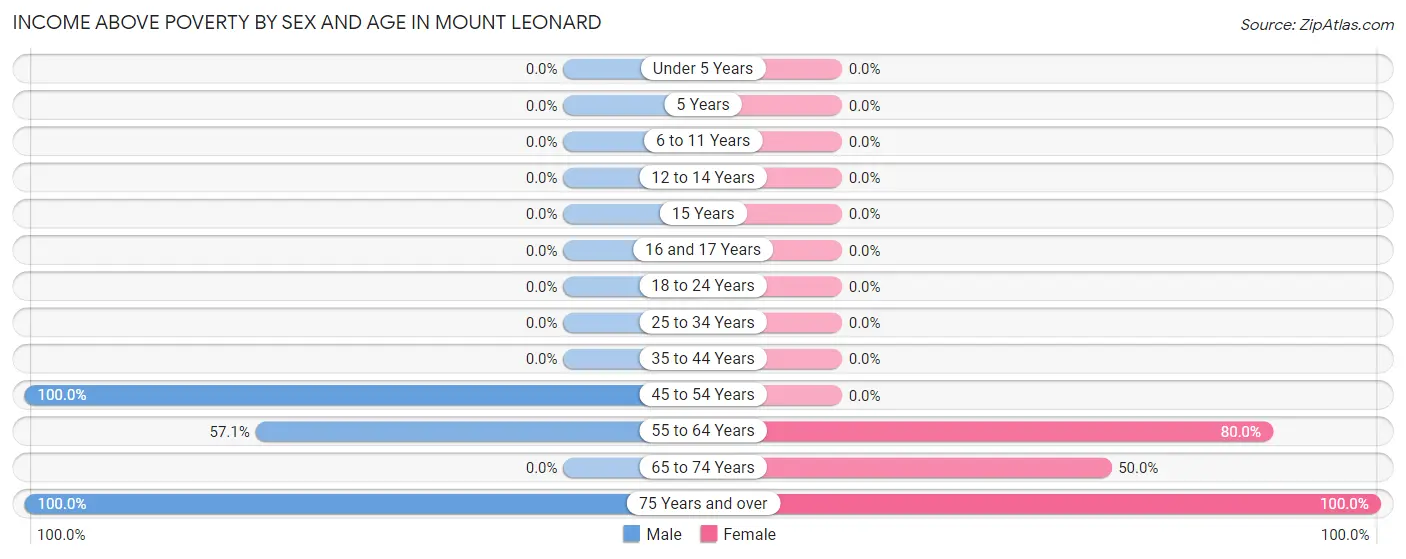
| Age Bracket | Male | Female |
| Under 5 Years | 0 (0.0%) | 0 (0.0%) |
| 5 Years | 0 (0.0%) | 0 (0.0%) |
| 6 to 11 Years | 0 (0.0%) | 0 (0.0%) |
| 12 to 14 Years | 0 (0.0%) | 0 (0.0%) |
| 15 Years | 0 (0.0%) | 0 (0.0%) |
| 16 and 17 Years | 0 (0.0%) | 0 (0.0%) |
| 18 to 24 Years | 0 (0.0%) | 0 (0.0%) |
| 25 to 34 Years | 0 (0.0%) | 0 (0.0%) |
| 35 to 44 Years | 0 (0.0%) | 0 (0.0%) |
| 45 to 54 Years | 3 (100.0%) | 0 (0.0%) |
| 55 to 64 Years | 4 (57.1%) | 4 (80.0%) |
| 65 to 74 Years | 0 (0.0%) | 2 (50.0%) |
| 75 Years and over | 1 (100.0%) | 1 (100.0%) |
| Total | 8 (66.7%) | 7 (17.1%) |
Income Below Poverty Among Married-Couple Families in Mount Leonard
The poverty statistics for married-couple families in Mount Leonard show that 55.6% or 5 of the total 9 families live below the poverty line. Families with no children have the highest poverty rate of 55.6%, comprising of 5 families. On the other hand, families with no children have the lowest poverty rate of 55.6%, which includes 5 families.
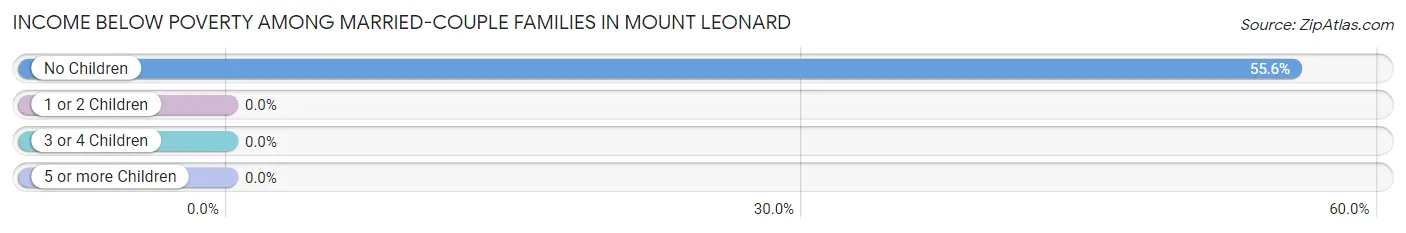
| Children | Above Poverty | Below Poverty |
| No Children | 4 (44.4%) | 5 (55.6%) |
| 1 or 2 Children | 0 (0.0%) | 0 (0.0%) |
| 3 or 4 Children | 0 (0.0%) | 0 (0.0%) |
| 5 or more Children | 0 (0.0%) | 0 (0.0%) |
| Total | 4 (44.4%) | 5 (55.6%) |
Income Below Poverty Among Single-Parent Households in Mount Leonard
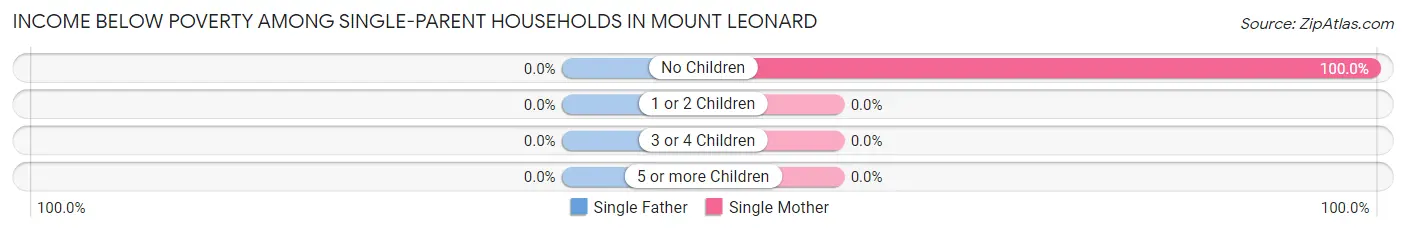
| Children | Single Father | Single Mother |
| No Children | 0 (0.0%) | 4 (100.0%) |
| 1 or 2 Children | 0 (0.0%) | 0 (0.0%) |
| 3 or 4 Children | 0 (0.0%) | 0 (0.0%) |
| 5 or more Children | 0 (0.0%) | 0 (0.0%) |
| Total | 0 (0.0%) | 4 (100.0%) |
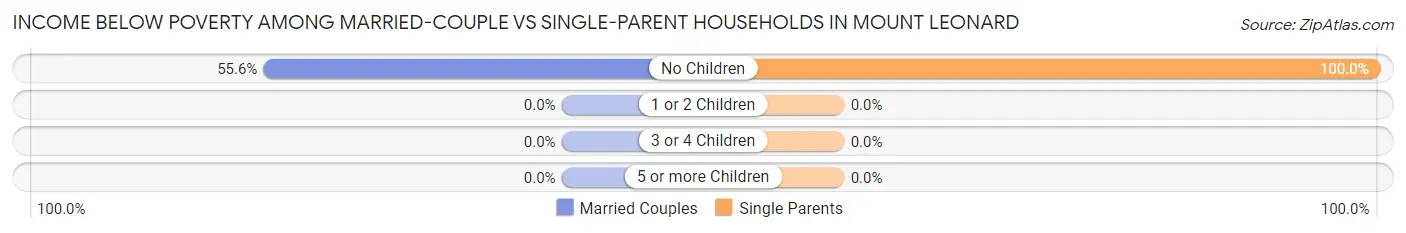
Income Below Poverty Among Married-Couple vs Single-Parent Households in Mount Leonard
The poverty data for Mount Leonard shows that 5 of the married-couple family households (55.6%) and 4 of the single-parent households (100.0%) are living below the poverty level. Within the married-couple family households, those with no children have the highest poverty rate, with 5 households (55.6%) falling below the poverty line. Among the single-parent households, those with no children have the highest poverty rate, with 4 household (100.0%) living below poverty.
| Children | Married-Couple Families | Single-Parent Households |
| No Children | 5 (55.6%) | 4 (100.0%) |
| 1 or 2 Children | 0 (0.0%) | 0 (0.0%) |
| 3 or 4 Children | 0 (0.0%) | 0 (0.0%) |
| 5 or more Children | 0 (0.0%) | 0 (0.0%) |
| Total | 5 (55.6%) | 4 (100.0%) |
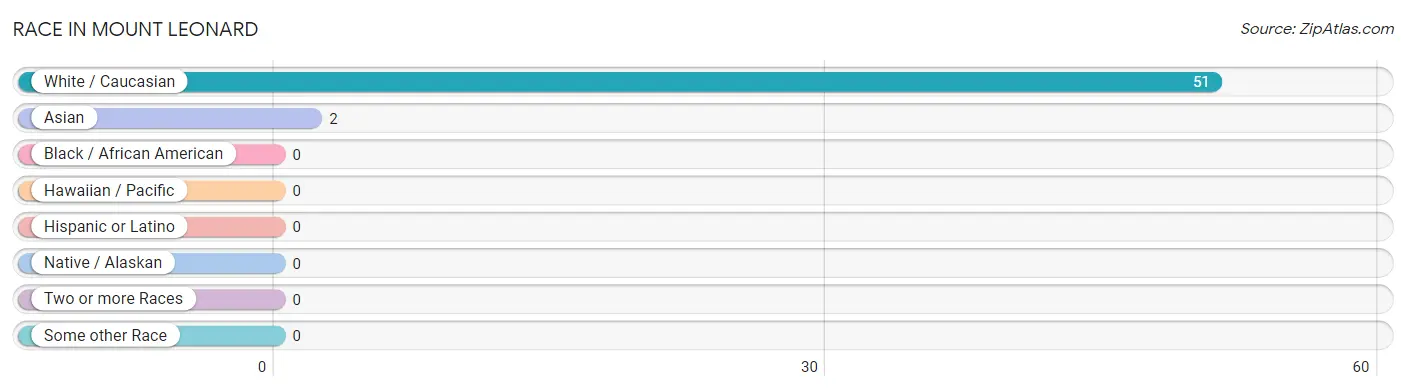
Race in Mount Leonard
The most populous races in Mount Leonard are White / Caucasian (51 | 96.2%), and Asian (2 | 3.8%).
| Race | # Population | % Population |
| Asian | 2 | 3.8% |
| Black / African American | 0 | 0.0% |
| Hawaiian / Pacific | 0 | 0.0% |
| Hispanic or Latino | 0 | 0.0% |
| Native / Alaskan | 0 | 0.0% |
| White / Caucasian | 51 | 96.2% |
| Two or more Races | 0 | 0.0% |
| Some other Race | 0 | 0.0% |
| Total | 53 | 100.0% |
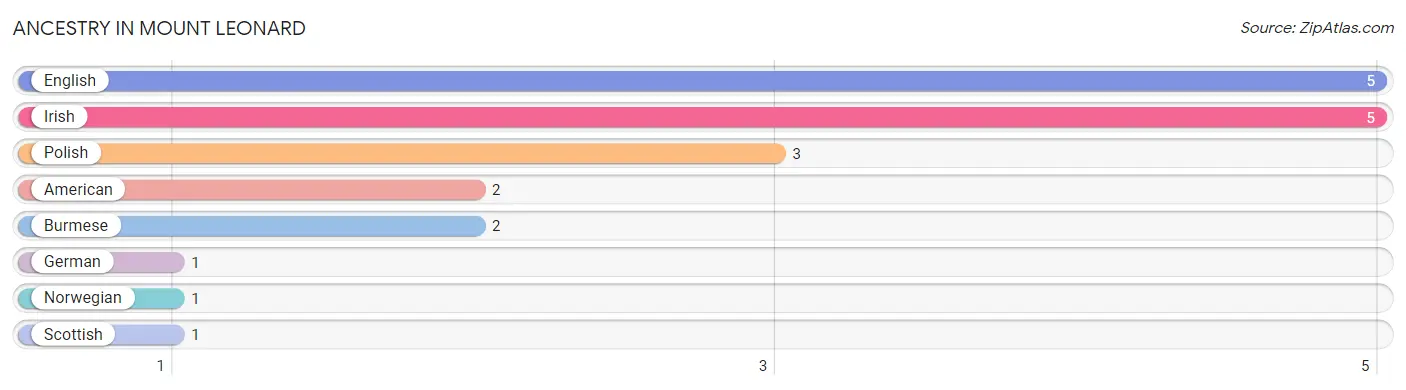
Ancestry in Mount Leonard
The most populous ancestries reported in Mount Leonard are English (5 | 9.4%), Irish (5 | 9.4%), Polish (3 | 5.7%), American (2 | 3.8%), and Burmese (2 | 3.8%), together accounting for 32.1% of all Mount Leonard residents.
| Ancestry | # Population | % Population |
| American | 2 | 3.8% |
| Burmese | 2 | 3.8% |
| English | 5 | 9.4% |
| German | 1 | 1.9% |
| Irish | 5 | 9.4% |
| Norwegian | 1 | 1.9% |
| Polish | 3 | 5.7% |
| Scottish | 1 | 1.9% | View All 8 Rows |
Immigrants in Mount Leonard
The most numerous immigrant groups reported in Mount Leonard came from Europe (3 | 5.7%), Northern Europe (3 | 5.7%), Asia (2 | 3.8%), Eastern Asia (2 | 3.8%), and England (2 | 3.8%), together accounting for 22.6% of all Mount Leonard residents.
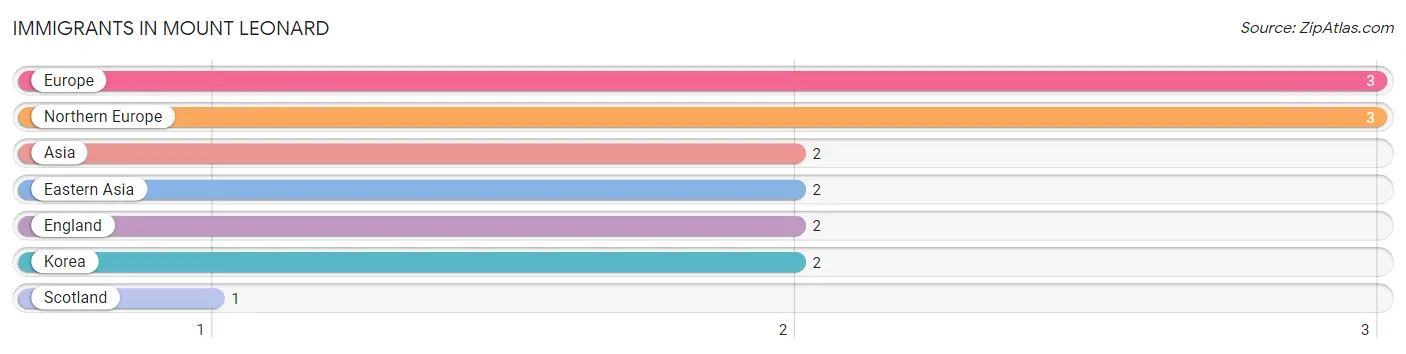
| Immigration Origin | # Population | % Population |
| Asia | 2 | 3.8% |
| Eastern Asia | 2 | 3.8% |
| England | 2 | 3.8% |
| Europe | 3 | 5.7% |
| Korea | 2 | 3.8% |
| Northern Europe | 3 | 5.7% |
| Scotland | 1 | 1.9% | View All 7 Rows |
Sex and Age in Mount Leonard
Sex and Age in Mount Leonard
The most populous age groups in Mount Leonard are 60 to 64 Years (7 | 58.3%) for men and 20 to 24 Years (13 | 31.7%) for women.
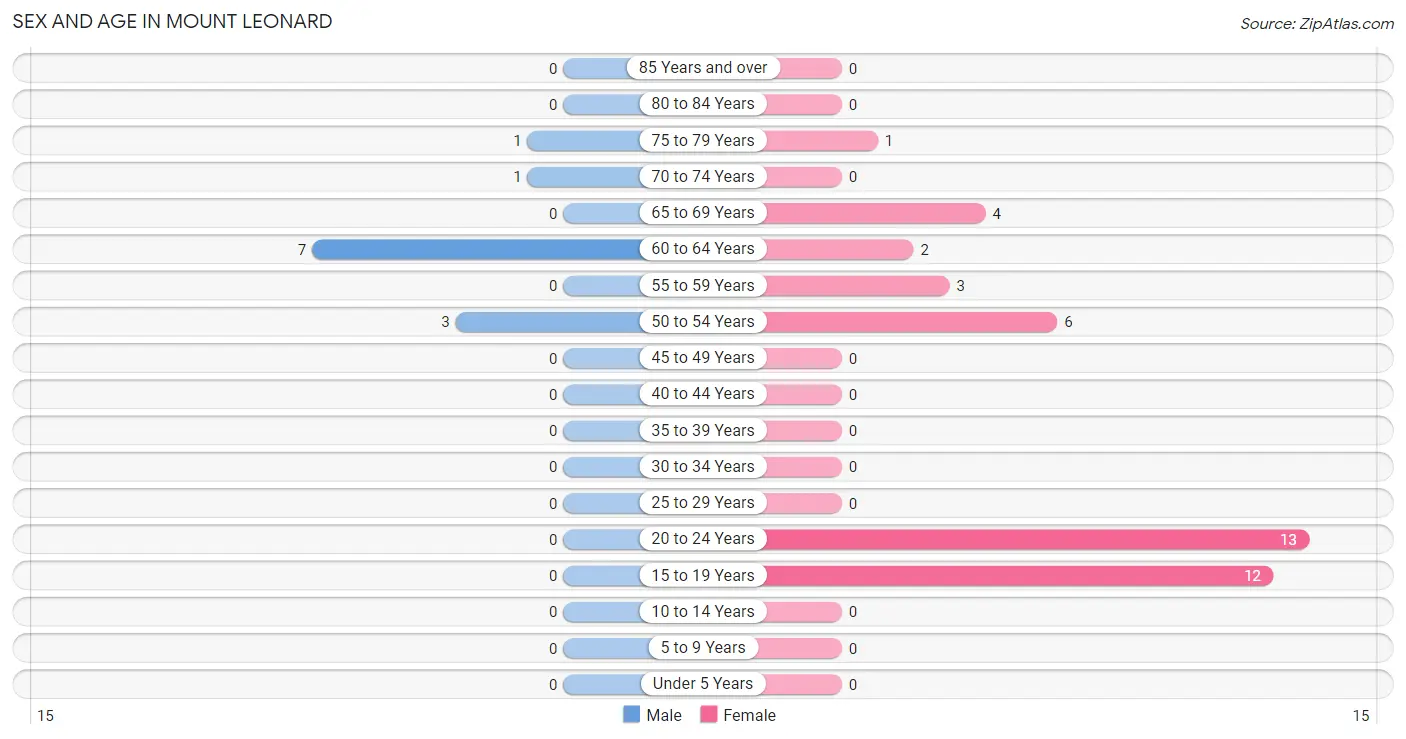
| Age Bracket | Male | Female |
| Under 5 Years | 0 (0.0%) | 0 (0.0%) |
| 5 to 9 Years | 0 (0.0%) | 0 (0.0%) |
| 10 to 14 Years | 0 (0.0%) | 0 (0.0%) |
| 15 to 19 Years | 0 (0.0%) | 12 (29.3%) |
| 20 to 24 Years | 0 (0.0%) | 13 (31.7%) |
| 25 to 29 Years | 0 (0.0%) | 0 (0.0%) |
| 30 to 34 Years | 0 (0.0%) | 0 (0.0%) |
| 35 to 39 Years | 0 (0.0%) | 0 (0.0%) |
| 40 to 44 Years | 0 (0.0%) | 0 (0.0%) |
| 45 to 49 Years | 0 (0.0%) | 0 (0.0%) |
| 50 to 54 Years | 3 (25.0%) | 6 (14.6%) |
| 55 to 59 Years | 0 (0.0%) | 3 (7.3%) |
| 60 to 64 Years | 7 (58.3%) | 2 (4.9%) |
| 65 to 69 Years | 0 (0.0%) | 4 (9.8%) |
| 70 to 74 Years | 1 (8.3%) | 0 (0.0%) |
| 75 to 79 Years | 1 (8.3%) | 1 (2.4%) |
| 80 to 84 Years | 0 (0.0%) | 0 (0.0%) |
| 85 Years and over | 0 (0.0%) | 0 (0.0%) |
| Total | 12 (100.0%) | 41 (100.0%) |
Families and Households in Mount Leonard
Median Family Size in Mount Leonard
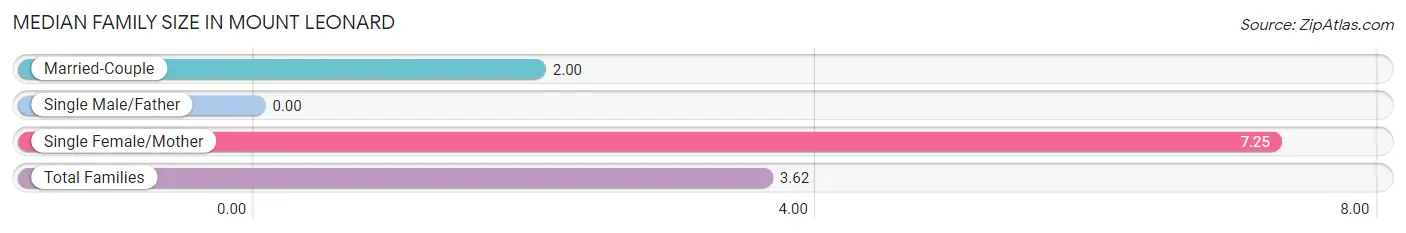
| Family Type | # Families | Family Size |
| Married-Couple | 9 (69.2%) | 2.00 |
| Single Male/Father | 0 (0.0%) | - |
| Single Female/Mother | 4 (30.8%) | 7.25 |
| Total Families | 13 (100.0%) | 3.62 |
Median Household Size in Mount Leonard
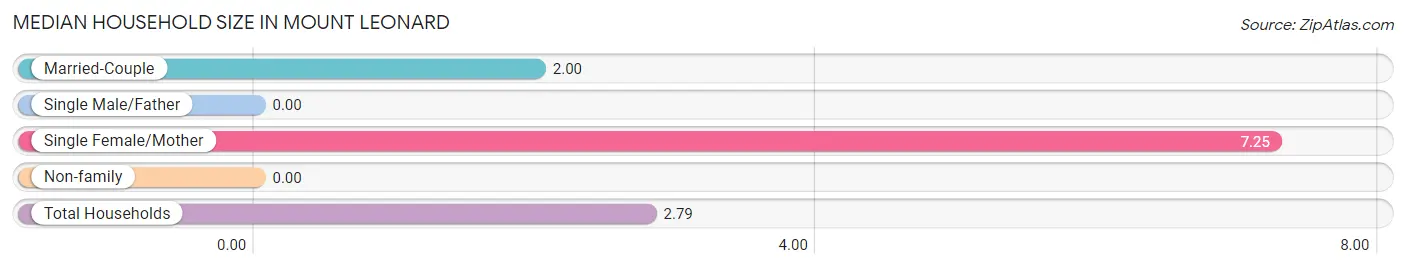
| Household Type | # Households | Household Size |
| Married-Couple | 9 (47.4%) | 2.00 |
| Single Male/Father | 0 (0.0%) | - |
| Single Female/Mother | 4 (21.0%) | 7.25 |
| Non-family | 6 (31.6%) | - |
| Total Households | 19 (100.0%) | 2.79 |
Household Size by Marriage Status in Mount Leonard
Out of a total of 19 households in Mount Leonard, 13 (68.4%) are family households, while 6 (31.6%) are nonfamily households. The most numerous type of family households are 2-person households, comprising 8, and the most common type of nonfamily households are 1-person households, comprising 6.
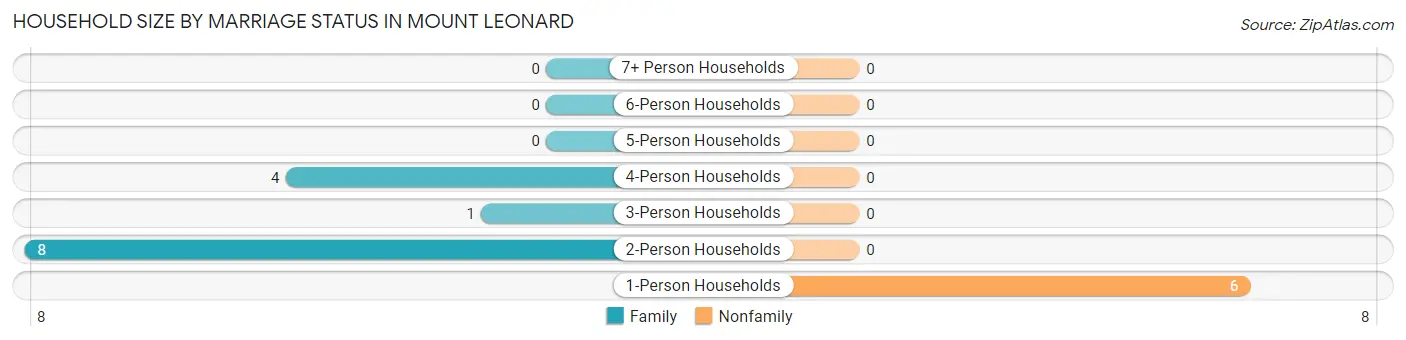
| Household Size | Family Households | Nonfamily Households |
| 1-Person Households | - | 6 (31.6%) |
| 2-Person Households | 8 (42.1%) | 0 (0.0%) |
| 3-Person Households | 1 (5.3%) | 0 (0.0%) |
| 4-Person Households | 4 (21.0%) | 0 (0.0%) |
| 5-Person Households | 0 (0.0%) | 0 (0.0%) |
| 6-Person Households | 0 (0.0%) | 0 (0.0%) |
| 7+ Person Households | 0 (0.0%) | 0 (0.0%) |
| Total | 13 (68.4%) | 6 (31.6%) |
Female Fertility in Mount Leonard
Fertility by Age in Mount Leonard
| Age Bracket | Women with Births | Births / 1,000 Women |
| 15 to 19 years | 0 (0.0%) | 0.0 |
| 20 to 34 years | 0 (0.0%) | 0.0 |
| 35 to 50 years | 0 (0.0%) | 0.0 |
| Total | 0 (0.0%) | 0.0 |
Fertility by Age by Marriage Status in Mount Leonard
| Age Bracket | Married | Unmarried |
| 15 to 19 years | 0 (0.0%) | 0 (0.0%) |
| 20 to 34 years | 0 (0.0%) | 0 (0.0%) |
| 35 to 50 years | 0 (0.0%) | 0 (0.0%) |
| Total | 0 (0.0%) | 0 (0.0%) |
Fertility by Education in Mount Leonard
| Educational Attainment | Women with Births | Births / 1,000 Women |
| Less than High School | 0 (0.0%) | 0.0 |
| High School Diploma | 0 (0.0%) | 0.0 |
| College or Associate's Degree | 0 (0.0%) | 0.0 |
| Bachelor's Degree | 0 (0.0%) | 0.0 |
| Graduate Degree | 0 (0.0%) | 0.0 |
| Total | 0 (0.0%) | 0.0 |
Fertility by Education by Marriage Status in Mount Leonard
| Educational Attainment | Married | Unmarried |
| Less than High School | 0 (0.0%) | 0 (0.0%) |
| High School Diploma | 0 (0.0%) | 0 (0.0%) |
| College or Associate's Degree | 0 (0.0%) | 0 (0.0%) |
| Bachelor's Degree | 0 (0.0%) | 0 (0.0%) |
| Graduate Degree | 0 (0.0%) | 0 (0.0%) |
| Total | 0 (0.0%) | 0 (0.0%) |
Employment Characteristics in Mount Leonard
Employment by Class of Employer in Mount Leonard
Among the 7 employed individuals in Mount Leonard, private company employees (3 | 42.9%), self-employed (not incorporated) (2 | 28.6%), and not-for-profit organizations (1 | 14.3%) make up the most common classes of employment.
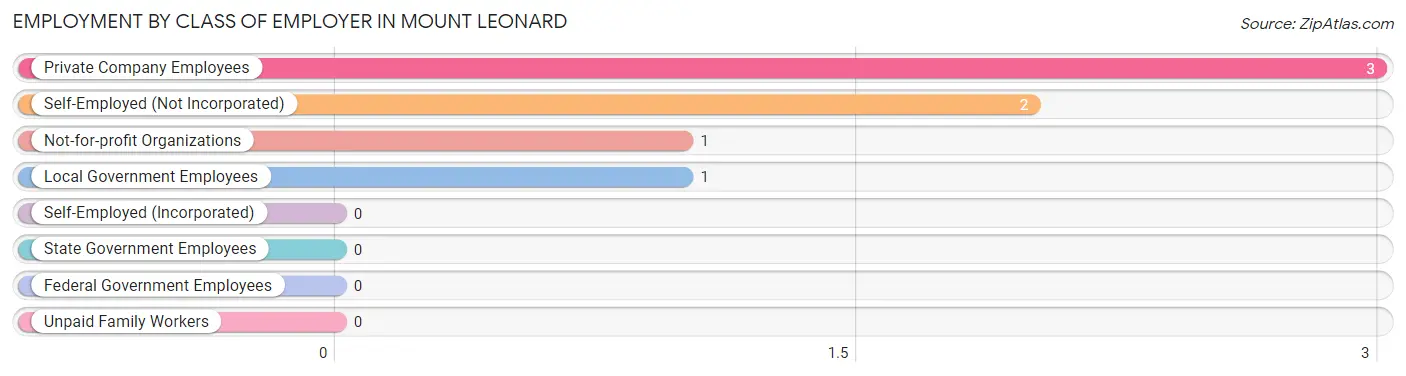
| Employer Class | # Employees | % Employees |
| Private Company Employees | 3 | 42.9% |
| Self-Employed (Incorporated) | 0 | 0.0% |
| Self-Employed (Not Incorporated) | 2 | 28.6% |
| Not-for-profit Organizations | 1 | 14.3% |
| Local Government Employees | 1 | 14.3% |
| State Government Employees | 0 | 0.0% |
| Federal Government Employees | 0 | 0.0% |
| Unpaid Family Workers | 0 | 0.0% |
| Total | 7 | 100.0% |
Employment Status by Age in Mount Leonard
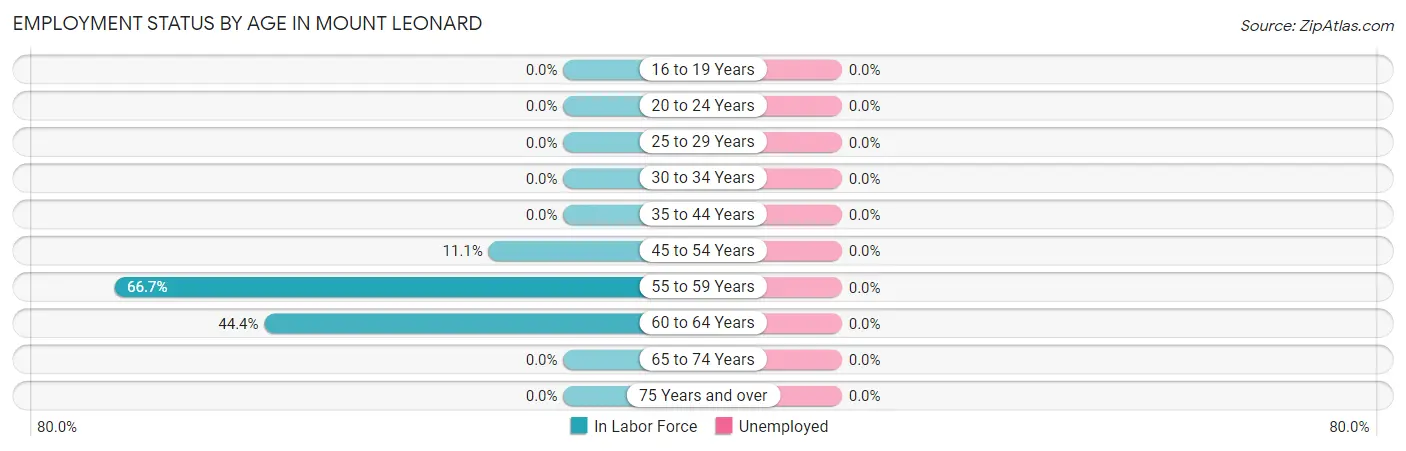
| Age Bracket | In Labor Force | Unemployed |
| 16 to 19 Years | 0 (0.0%) | 0 (0.0%) |
| 20 to 24 Years | 0 (0.0%) | 0 (0.0%) |
| 25 to 29 Years | 0 (0.0%) | 0 (0.0%) |
| 30 to 34 Years | 0 (0.0%) | 0 (0.0%) |
| 35 to 44 Years | 0 (0.0%) | 0 (0.0%) |
| 45 to 54 Years | 1 (11.1%) | 0 (0.0%) |
| 55 to 59 Years | 2 (66.7%) | 0 (0.0%) |
| 60 to 64 Years | 4 (44.4%) | 0 (0.0%) |
| 65 to 74 Years | 0 (0.0%) | 0 (0.0%) |
| 75 Years and over | 0 (0.0%) | 0 (0.0%) |
| Total | 7 (13.2%) | 0 (0.0%) |
Employment Status by Educational Attainment in Mount Leonard
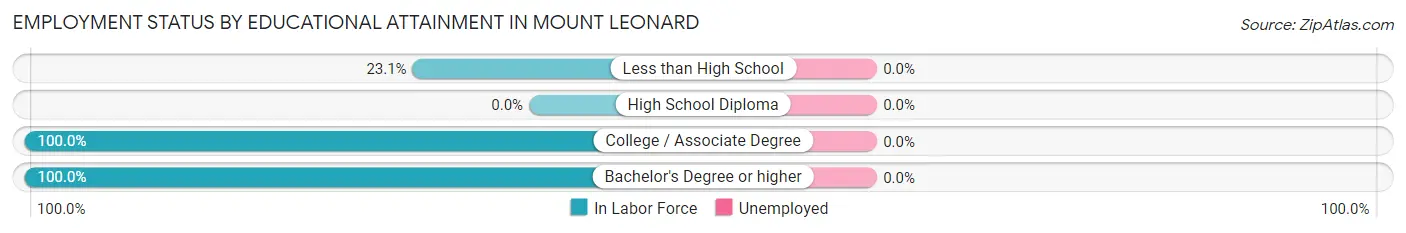
| Educational Attainment | In Labor Force | Unemployed |
| Less than High School | 3 (23.1%) | 0 (0.0%) |
| High School Diploma | 0 (0.0%) | 0 (0.0%) |
| College / Associate Degree | 2 (100.0%) | 0 (0.0%) |
| Bachelor's Degree or higher | 2 (100.0%) | 0 (0.0%) |
| Total | 7 (33.3%) | 0 (0.0%) |
Employment Occupations by Sex in Mount Leonard
Management, Business, Science and Arts Occupations
The most common Management, Business, Science and Arts occupations in Mount Leonard are Community & Social Service (2 | 28.6%), and Education, Arts & Media (2 | 28.6%).
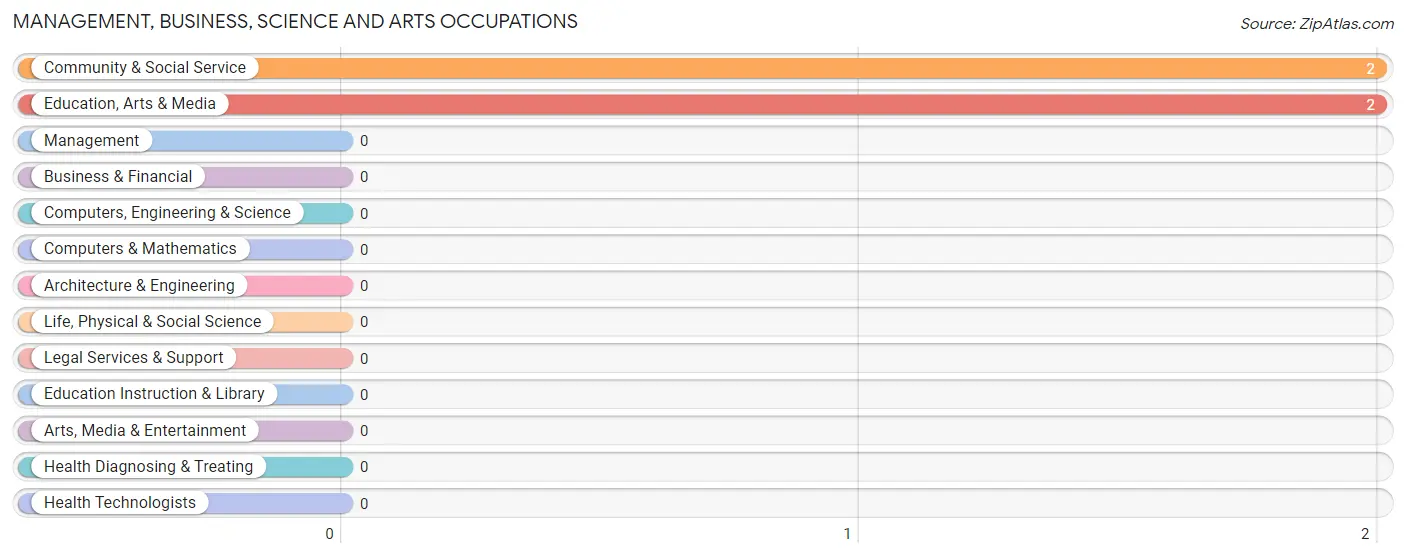
Management, Business, Science and Arts Occupations by Sex
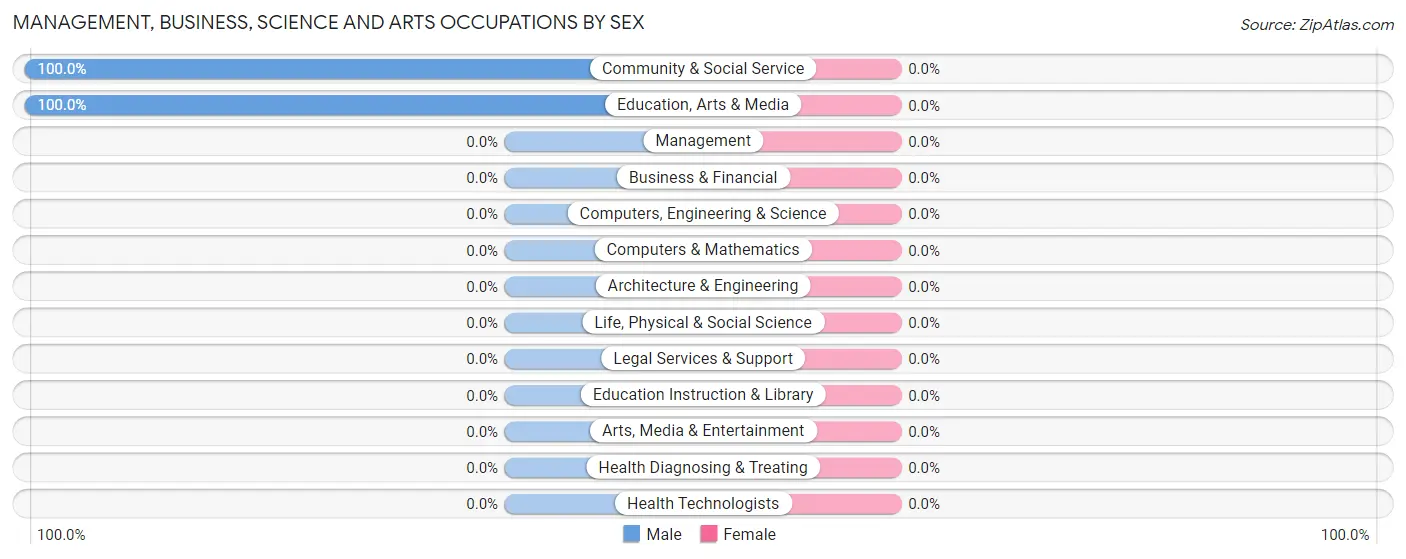
| Occupation | Male | Female |
| Management | 0 (0.0%) | 0 (0.0%) |
| Business & Financial | 0 (0.0%) | 0 (0.0%) |
| Computers, Engineering & Science | 0 (0.0%) | 0 (0.0%) |
| Computers & Mathematics | 0 (0.0%) | 0 (0.0%) |
| Architecture & Engineering | 0 (0.0%) | 0 (0.0%) |
| Life, Physical & Social Science | 0 (0.0%) | 0 (0.0%) |
| Community & Social Service | 2 (100.0%) | 0 (0.0%) |
| Education, Arts & Media | 2 (100.0%) | 0 (0.0%) |
| Legal Services & Support | 0 (0.0%) | 0 (0.0%) |
| Education Instruction & Library | 0 (0.0%) | 0 (0.0%) |
| Arts, Media & Entertainment | 0 (0.0%) | 0 (0.0%) |
| Health Diagnosing & Treating | 0 (0.0%) | 0 (0.0%) |
| Health Technologists | 0 (0.0%) | 0 (0.0%) |
| Total (Category) | 2 (100.0%) | 0 (0.0%) |
| Total (Overall) | 5 (71.4%) | 2 (28.6%) |
Services Occupations
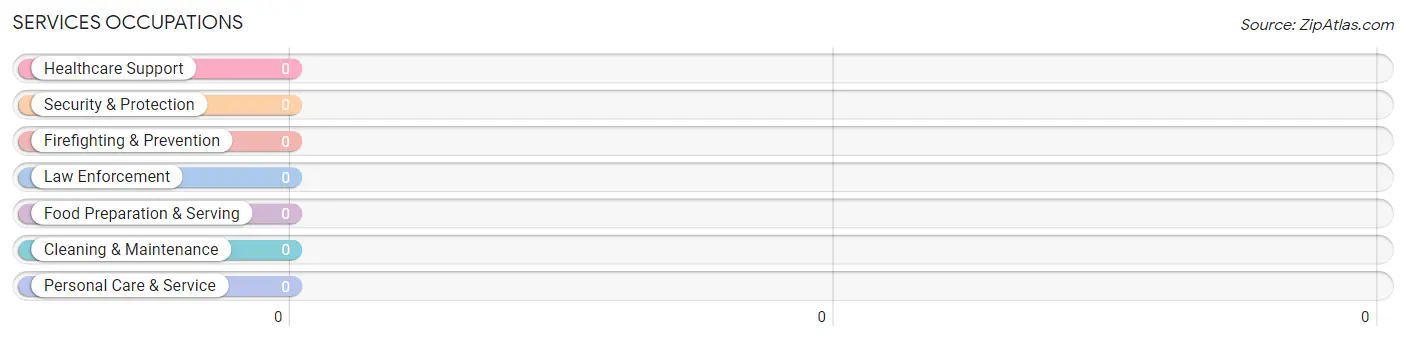
Services Occupations by Sex
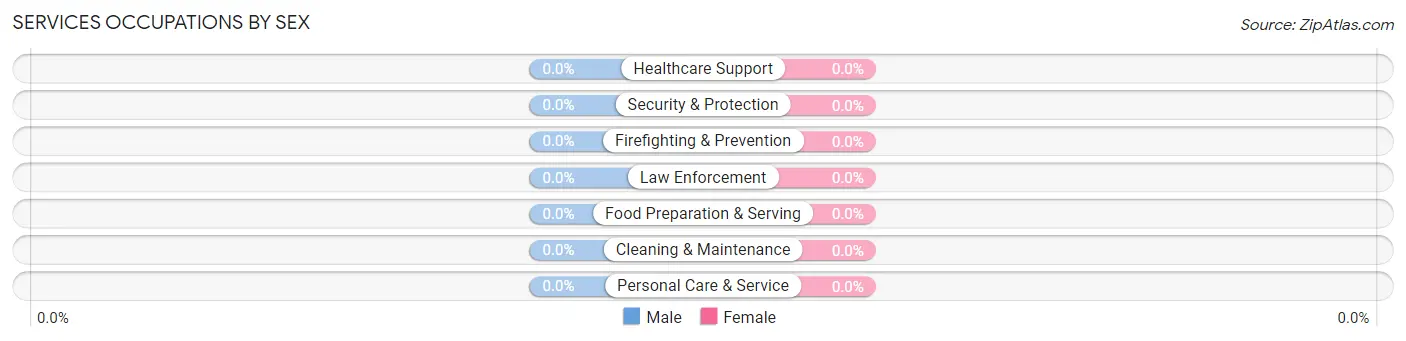
| Occupation | Male | Female |
| Healthcare Support | 0 (0.0%) | 0 (0.0%) |
| Security & Protection | 0 (0.0%) | 0 (0.0%) |
| Firefighting & Prevention | 0 (0.0%) | 0 (0.0%) |
| Law Enforcement | 0 (0.0%) | 0 (0.0%) |
| Food Preparation & Serving | 0 (0.0%) | 0 (0.0%) |
| Cleaning & Maintenance | 0 (0.0%) | 0 (0.0%) |
| Personal Care & Service | 0 (0.0%) | 0 (0.0%) |
| Total (Category) | 0 (0.0%) | 0 (0.0%) |
| Total (Overall) | 5 (71.4%) | 2 (28.6%) |
Sales and Office Occupations
The most common Sales and Office occupations in Mount Leonard are Sales & Related (1 | 14.3%), and Office & Administration (1 | 14.3%).
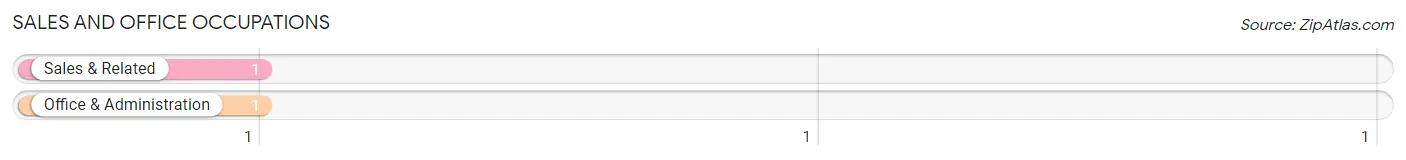
Sales and Office Occupations by Sex
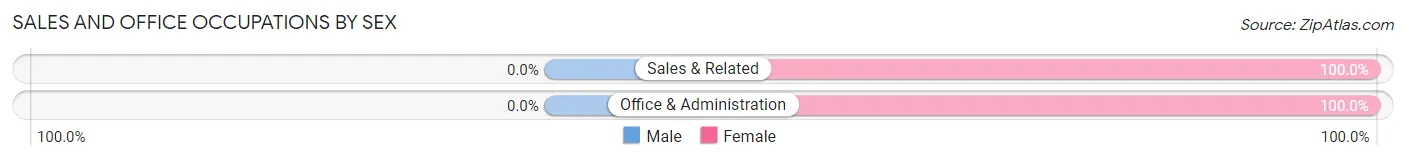
| Occupation | Male | Female |
| Sales & Related | 0 (0.0%) | 1 (100.0%) |
| Office & Administration | 0 (0.0%) | 1 (100.0%) |
| Total (Category) | 0 (0.0%) | 2 (100.0%) |
| Total (Overall) | 5 (71.4%) | 2 (28.6%) |
Natural Resources, Construction and Maintenance Occupations
The most common Natural Resources, Construction and Maintenance occupations in Mount Leonard are , and Construction & Extraction (1 | 14.3%).
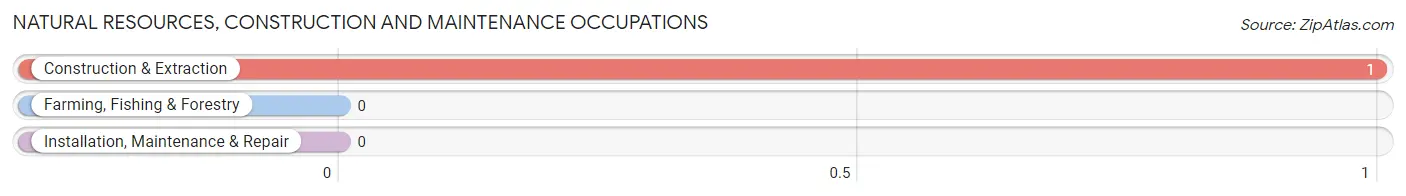
Natural Resources, Construction and Maintenance Occupations by Sex
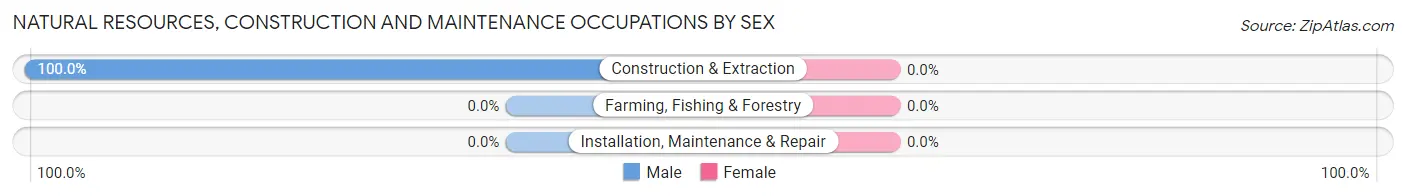
| Occupation | Male | Female |
| Farming, Fishing & Forestry | 0 (0.0%) | 0 (0.0%) |
| Construction & Extraction | 1 (100.0%) | 0 (0.0%) |
| Installation, Maintenance & Repair | 0 (0.0%) | 0 (0.0%) |
| Total (Category) | 1 (100.0%) | 0 (0.0%) |
| Total (Overall) | 5 (71.4%) | 2 (28.6%) |
Production, Transportation and Moving Occupations
The most common Production, Transportation and Moving occupations in Mount Leonard are , and Transportation (2 | 28.6%).
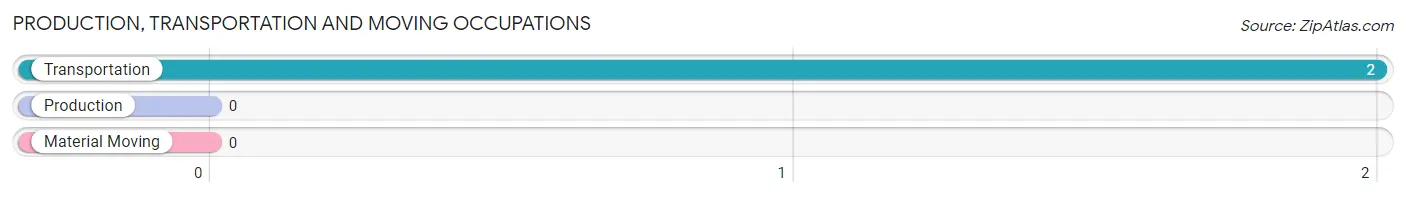
Production, Transportation and Moving Occupations by Sex
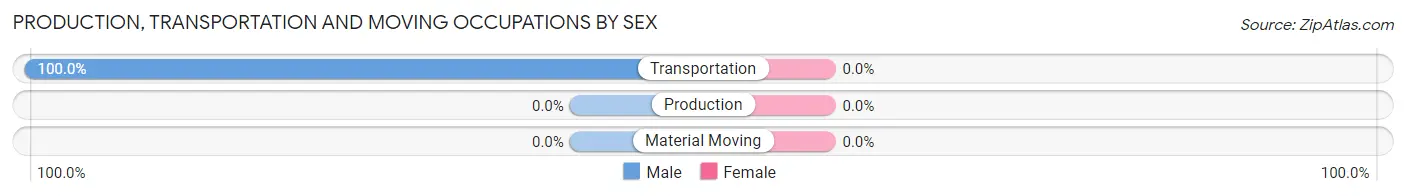
| Occupation | Male | Female |
| Production | 0 (0.0%) | 0 (0.0%) |
| Transportation | 2 (100.0%) | 0 (0.0%) |
| Material Moving | 0 (0.0%) | 0 (0.0%) |
| Total (Category) | 2 (100.0%) | 0 (0.0%) |
| Total (Overall) | 5 (71.4%) | 2 (28.6%) |
Employment Industries by Sex in Mount Leonard
Employment Industries in Mount Leonard
The major employment industries in Mount Leonard include Retail Trade (4 | 57.1%), and Construction (1 | 14.3%).
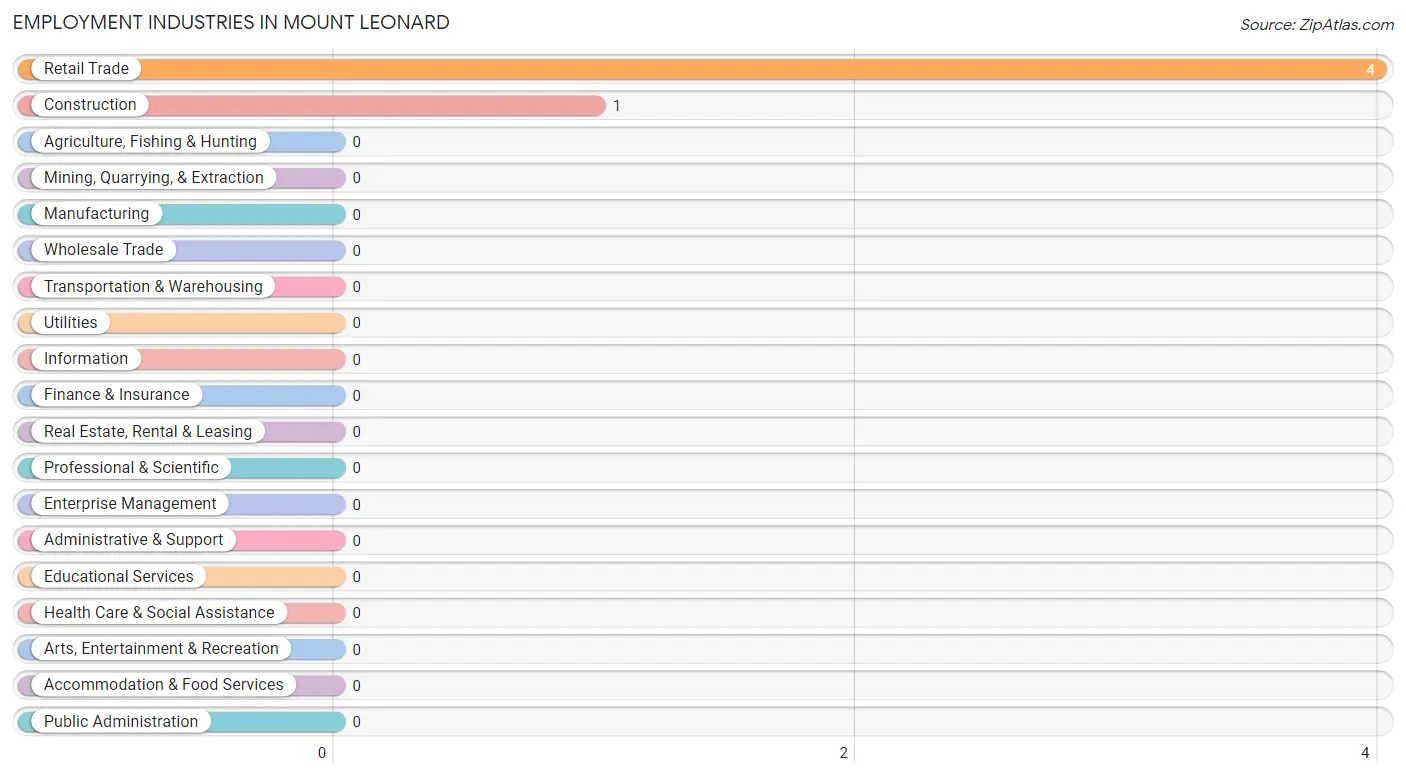
Employment Industries by Sex in Mount Leonard
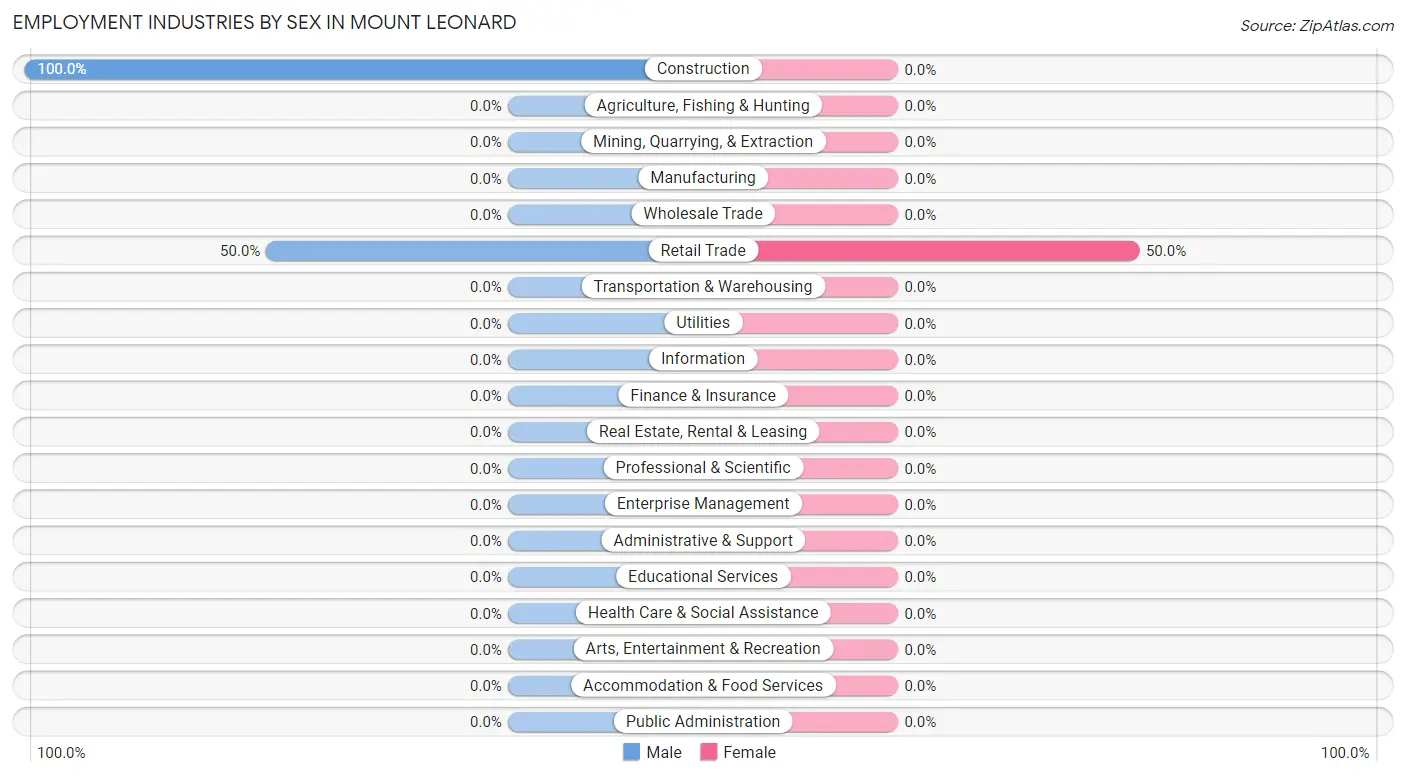
| Industry | Male | Female |
| Agriculture, Fishing & Hunting | 0 (0.0%) | 0 (0.0%) |
| Mining, Quarrying, & Extraction | 0 (0.0%) | 0 (0.0%) |
| Construction | 1 (100.0%) | 0 (0.0%) |
| Manufacturing | 0 (0.0%) | 0 (0.0%) |
| Wholesale Trade | 0 (0.0%) | 0 (0.0%) |
| Retail Trade | 2 (50.0%) | 2 (50.0%) |
| Transportation & Warehousing | 0 (0.0%) | 0 (0.0%) |
| Utilities | 0 (0.0%) | 0 (0.0%) |
| Information | 0 (0.0%) | 0 (0.0%) |
| Finance & Insurance | 0 (0.0%) | 0 (0.0%) |
| Real Estate, Rental & Leasing | 0 (0.0%) | 0 (0.0%) |
| Professional & Scientific | 0 (0.0%) | 0 (0.0%) |
| Enterprise Management | 0 (0.0%) | 0 (0.0%) |
| Administrative & Support | 0 (0.0%) | 0 (0.0%) |
| Educational Services | 0 (0.0%) | 0 (0.0%) |
| Health Care & Social Assistance | 0 (0.0%) | 0 (0.0%) |
| Arts, Entertainment & Recreation | 0 (0.0%) | 0 (0.0%) |
| Accommodation & Food Services | 0 (0.0%) | 0 (0.0%) |
| Public Administration | 0 (0.0%) | 0 (0.0%) |
| Total | 5 (71.4%) | 2 (28.6%) |
Education in Mount Leonard
School Enrollment in Mount Leonard
| School Level | # Students | % Students |
| Nursery / Preschool | 0 | 0.0% |
| Kindergarten | 0 | 0.0% |
| Elementary School | 0 | 0.0% |
| Middle School | 0 | 0.0% |
| High School | 0 | 0.0% |
| College / Undergraduate | 0 | 0.0% |
| Graduate / Professional | 0 | 0.0% |
| Total | 0 | 0.0% |
School Enrollment by Age by Funding Source in Mount Leonard
| Age Bracket | Public School | Private School |
| 3 to 4 Year Olds | 0 (0.0%) | 0 (0.0%) |
| 5 to 9 Year Old | 0 (0.0%) | 0 (0.0%) |
| 10 to 14 Year Olds | 0 (0.0%) | 0 (0.0%) |
| 15 to 17 Year Olds | 0 (0.0%) | 0 (0.0%) |
| 18 to 19 Year Olds | 0 (0.0%) | 0 (0.0%) |
| 20 to 24 Year Olds | 0 (0.0%) | 0 (0.0%) |
| 25 to 34 Year Olds | 0 (0.0%) | 0 (0.0%) |
| 35 Years and over | 0 (0.0%) | 0 (0.0%) |
| Total | 0 (0.0%) | 0 (0.0%) |
Educational Attainment by Field of Study in Mount Leonard
, and liberal arts & history (2 | 100.0%) are the most common fields of study among 2 individuals in Mount Leonard who have obtained a bachelor's degree or higher.
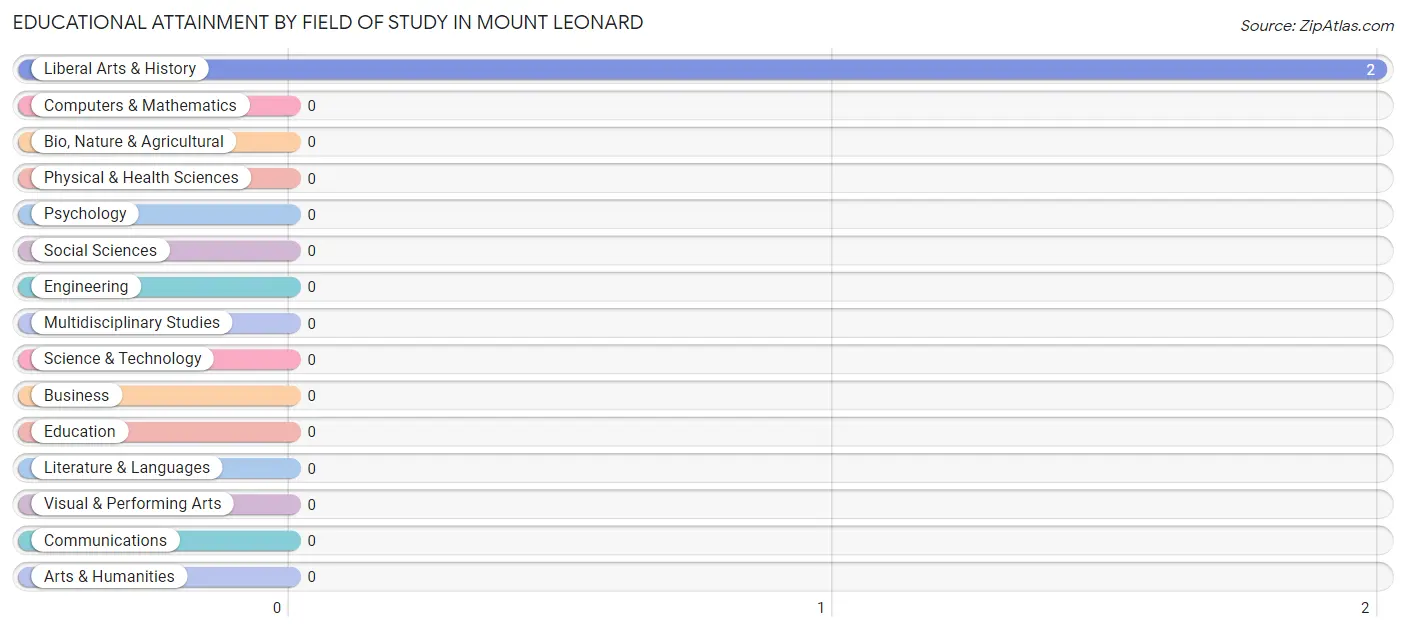
| Field of Study | # Graduates | % Graduates |
| Computers & Mathematics | 0 | 0.0% |
| Bio, Nature & Agricultural | 0 | 0.0% |
| Physical & Health Sciences | 0 | 0.0% |
| Psychology | 0 | 0.0% |
| Social Sciences | 0 | 0.0% |
| Engineering | 0 | 0.0% |
| Multidisciplinary Studies | 0 | 0.0% |
| Science & Technology | 0 | 0.0% |
| Business | 0 | 0.0% |
| Education | 0 | 0.0% |
| Literature & Languages | 0 | 0.0% |
| Liberal Arts & History | 2 | 100.0% |
| Visual & Performing Arts | 0 | 0.0% |
| Communications | 0 | 0.0% |
| Arts & Humanities | 0 | 0.0% |
| Total | 2 | 100.0% |
Transportation & Commute in Mount Leonard
Vehicle Availability by Sex in Mount Leonard
The most prevalent vehicle ownership categories in Mount Leonard are males with 1 vehicle (4, accounting for 80.0%) and females with 1 vehicle (1, making up 200.0%).
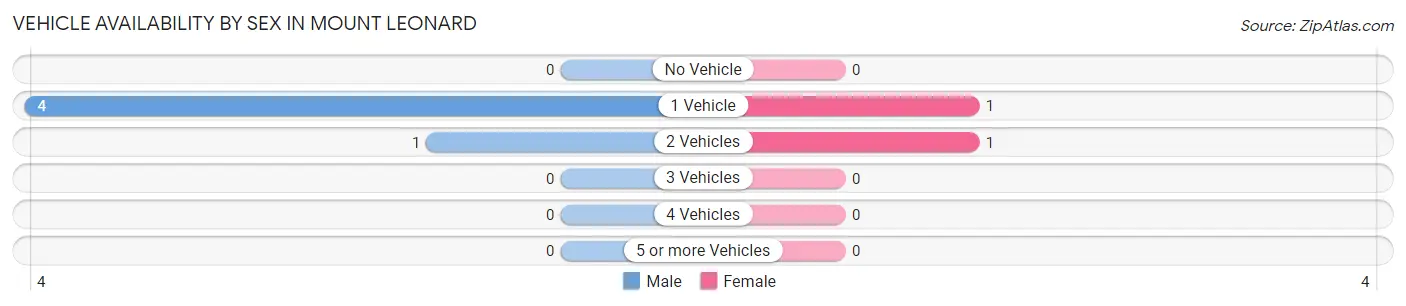
| Vehicles Available | Male | Female |
| No Vehicle | 0 (0.0%) | 0 (0.0%) |
| 1 Vehicle | 4 (80.0%) | 1 (50.0%) |
| 2 Vehicles | 1 (20.0%) | 1 (50.0%) |
| 3 Vehicles | 0 (0.0%) | 0 (0.0%) |
| 4 Vehicles | 0 (0.0%) | 0 (0.0%) |
| 5 or more Vehicles | 0 (0.0%) | 0 (0.0%) |
| Total | 5 (100.0%) | 2 (100.0%) |
Commute Time in Mount Leonard
The most frequently occuring commute durations in Mount Leonard are less than 5 minutes (2 commuters, 28.6%), 20 to 24 minutes (2 commuters, 28.6%), and 90 or more minutes (2 commuters, 28.6%).
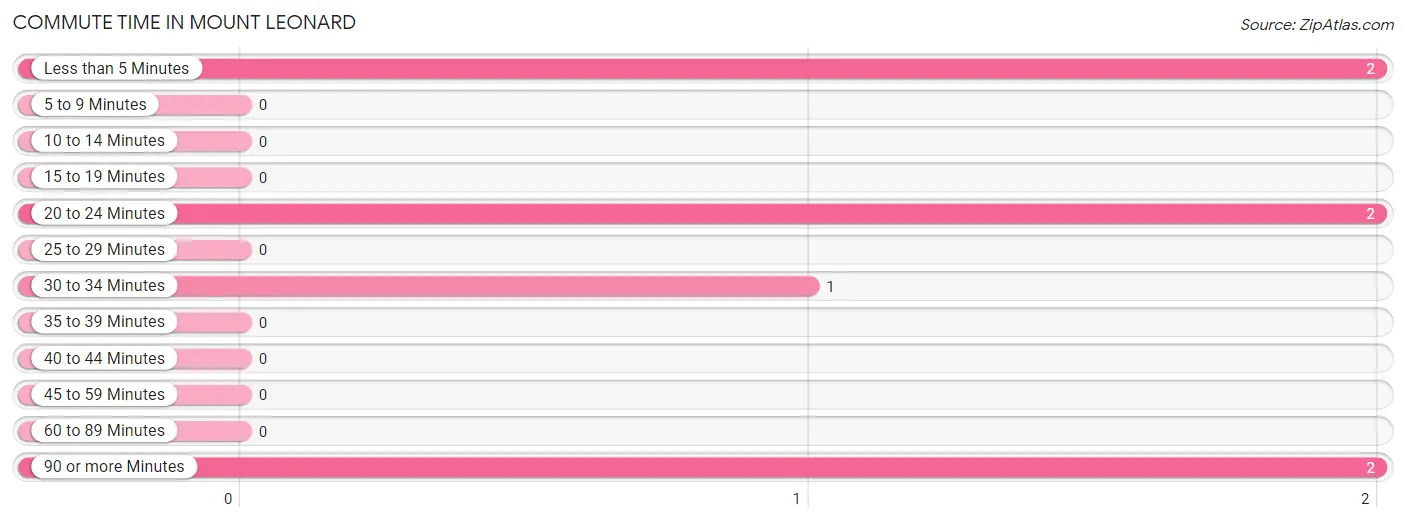
| Commute Time | # Commuters | % Commuters |
| Less than 5 Minutes | 2 | 28.6% |
| 5 to 9 Minutes | 0 | 0.0% |
| 10 to 14 Minutes | 0 | 0.0% |
| 15 to 19 Minutes | 0 | 0.0% |
| 20 to 24 Minutes | 2 | 28.6% |
| 25 to 29 Minutes | 0 | 0.0% |
| 30 to 34 Minutes | 1 | 14.3% |
| 35 to 39 Minutes | 0 | 0.0% |
| 40 to 44 Minutes | 0 | 0.0% |
| 45 to 59 Minutes | 0 | 0.0% |
| 60 to 89 Minutes | 0 | 0.0% |
| 90 or more Minutes | 2 | 28.6% |
Commute Time by Sex in Mount Leonard
The most common commute times in Mount Leonard are less than 5 minutes (2 commuters, 40.0%) for males and 20 to 24 minutes (1 commuters, 50.0%) for females.
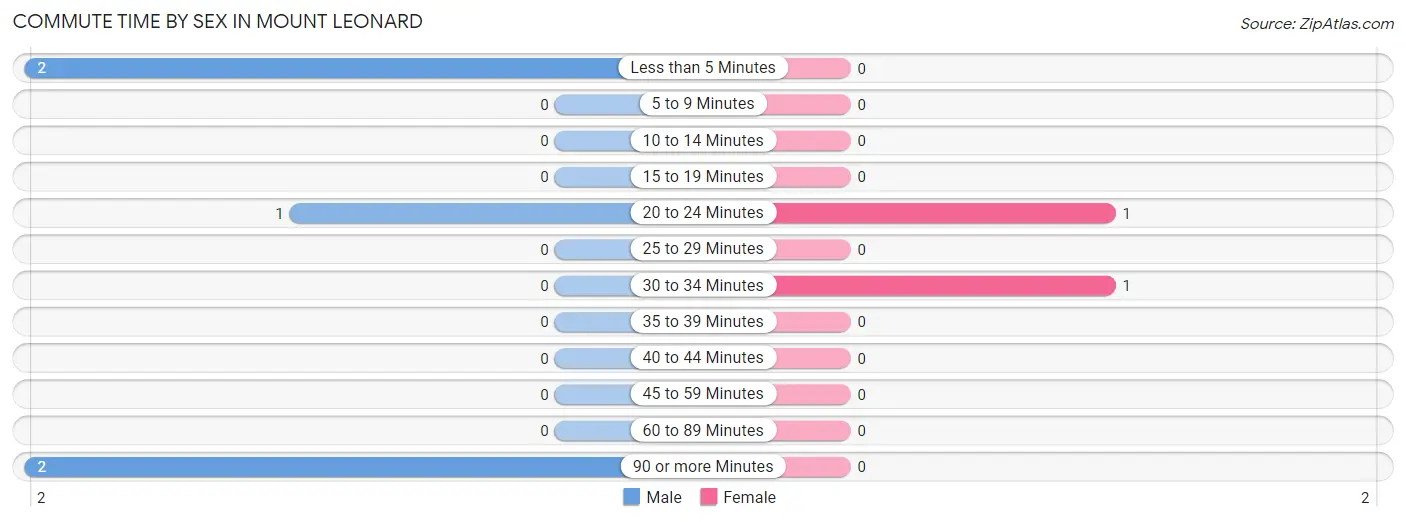
| Commute Time | Male | Female |
| Less than 5 Minutes | 2 (40.0%) | 0 (0.0%) |
| 5 to 9 Minutes | 0 (0.0%) | 0 (0.0%) |
| 10 to 14 Minutes | 0 (0.0%) | 0 (0.0%) |
| 15 to 19 Minutes | 0 (0.0%) | 0 (0.0%) |
| 20 to 24 Minutes | 1 (20.0%) | 1 (50.0%) |
| 25 to 29 Minutes | 0 (0.0%) | 0 (0.0%) |
| 30 to 34 Minutes | 0 (0.0%) | 1 (50.0%) |
| 35 to 39 Minutes | 0 (0.0%) | 0 (0.0%) |
| 40 to 44 Minutes | 0 (0.0%) | 0 (0.0%) |
| 45 to 59 Minutes | 0 (0.0%) | 0 (0.0%) |
| 60 to 89 Minutes | 0 (0.0%) | 0 (0.0%) |
| 90 or more Minutes | 2 (40.0%) | 0 (0.0%) |
Time of Departure to Work by Sex in Mount Leonard
The most frequent times of departure to work in Mount Leonard are 8:30 AM to 8:59 AM (4, 80.0%) for males and 5:30 AM to 5:59 AM (1, 50.0%) for females.
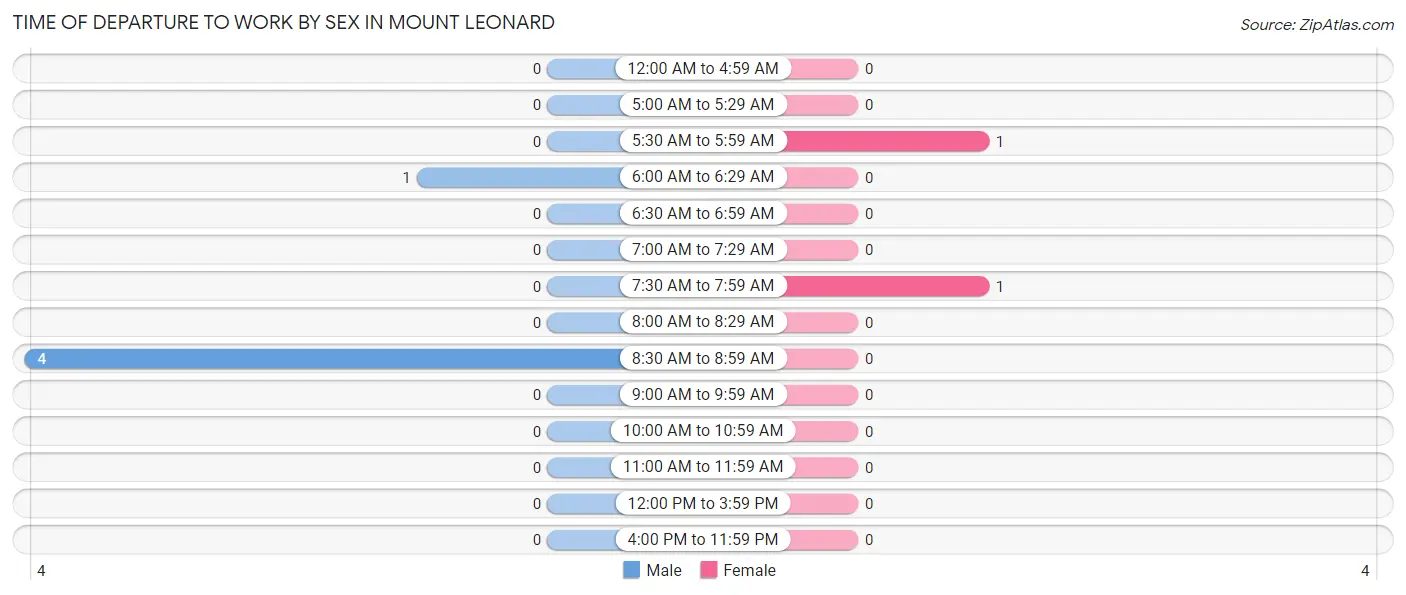
| Time of Departure | Male | Female |
| 12:00 AM to 4:59 AM | 0 (0.0%) | 0 (0.0%) |
| 5:00 AM to 5:29 AM | 0 (0.0%) | 0 (0.0%) |
| 5:30 AM to 5:59 AM | 0 (0.0%) | 1 (50.0%) |
| 6:00 AM to 6:29 AM | 1 (20.0%) | 0 (0.0%) |
| 6:30 AM to 6:59 AM | 0 (0.0%) | 0 (0.0%) |
| 7:00 AM to 7:29 AM | 0 (0.0%) | 0 (0.0%) |
| 7:30 AM to 7:59 AM | 0 (0.0%) | 1 (50.0%) |
| 8:00 AM to 8:29 AM | 0 (0.0%) | 0 (0.0%) |
| 8:30 AM to 8:59 AM | 4 (80.0%) | 0 (0.0%) |
| 9:00 AM to 9:59 AM | 0 (0.0%) | 0 (0.0%) |
| 10:00 AM to 10:59 AM | 0 (0.0%) | 0 (0.0%) |
| 11:00 AM to 11:59 AM | 0 (0.0%) | 0 (0.0%) |
| 12:00 PM to 3:59 PM | 0 (0.0%) | 0 (0.0%) |
| 4:00 PM to 11:59 PM | 0 (0.0%) | 0 (0.0%) |
| Total | 5 (100.0%) | 2 (100.0%) |
Housing Occupancy in Mount Leonard
Occupancy by Ownership in Mount Leonard
Of the total 19 dwellings in Mount Leonard, owner-occupied units account for 10 (52.6%), while renter-occupied units make up 9 (47.4%).
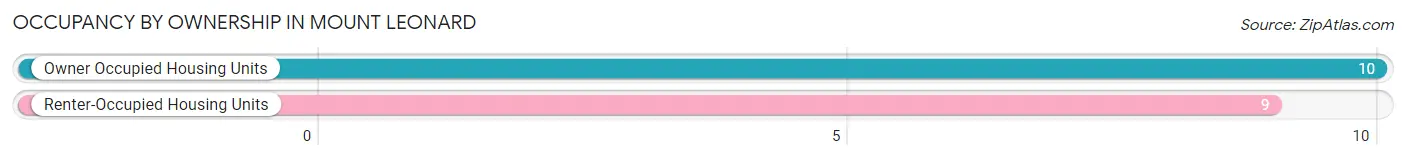
| Occupancy | # Housing Units | % Housing Units |
| Owner Occupied Housing Units | 10 | 52.6% |
| Renter-Occupied Housing Units | 9 | 47.4% |
| Total Occupied Housing Units | 19 | 100.0% |
Occupancy by Household Size in Mount Leonard
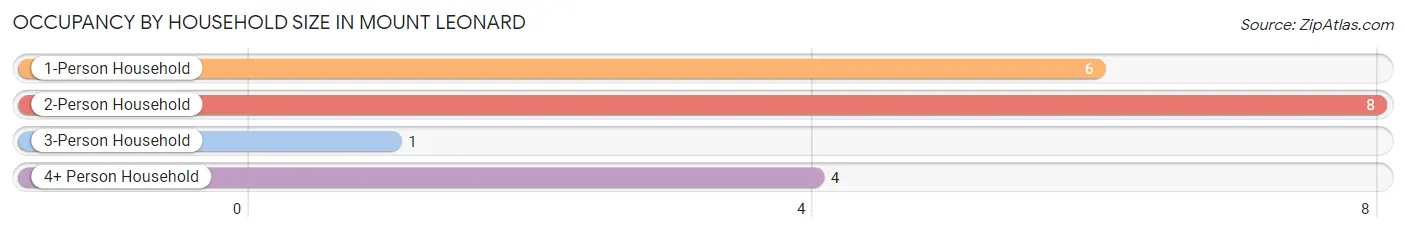
| Household Size | # Housing Units | % Housing Units |
| 1-Person Household | 6 | 31.6% |
| 2-Person Household | 8 | 42.1% |
| 3-Person Household | 1 | 5.3% |
| 4+ Person Household | 4 | 21.0% |
| Total Housing Units | 19 | 100.0% |
Occupancy by Ownership by Household Size in Mount Leonard
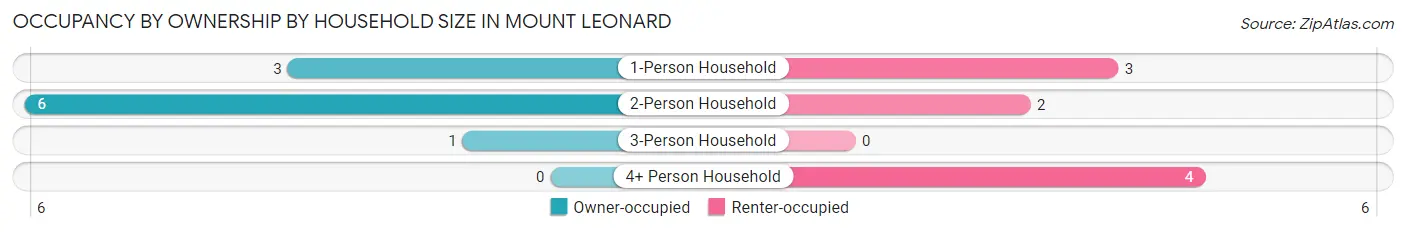
| Household Size | Owner-occupied | Renter-occupied |
| 1-Person Household | 3 (50.0%) | 3 (50.0%) |
| 2-Person Household | 6 (75.0%) | 2 (25.0%) |
| 3-Person Household | 1 (100.0%) | 0 (0.0%) |
| 4+ Person Household | 0 (0.0%) | 4 (100.0%) |
| Total Housing Units | 10 (52.6%) | 9 (47.4%) |
Occupancy by Educational Attainment in Mount Leonard
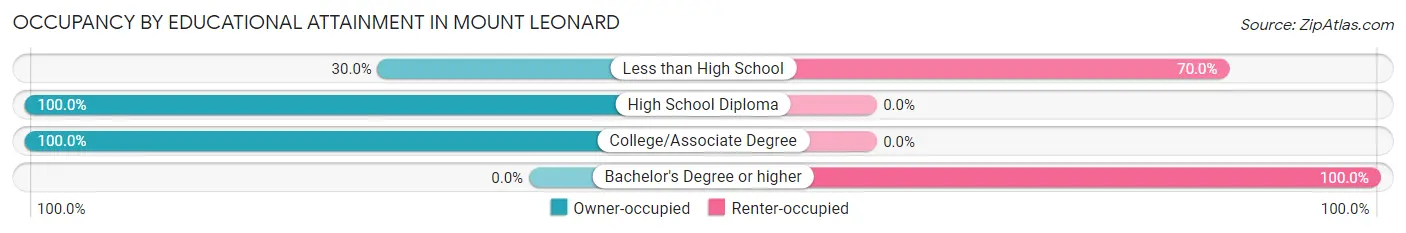
| Household Size | Owner-occupied | Renter-occupied |
| Less than High School | 3 (30.0%) | 7 (70.0%) |
| High School Diploma | 5 (100.0%) | 0 (0.0%) |
| College/Associate Degree | 2 (100.0%) | 0 (0.0%) |
| Bachelor's Degree or higher | 0 (0.0%) | 2 (100.0%) |
Occupancy by Age of Householder in Mount Leonard
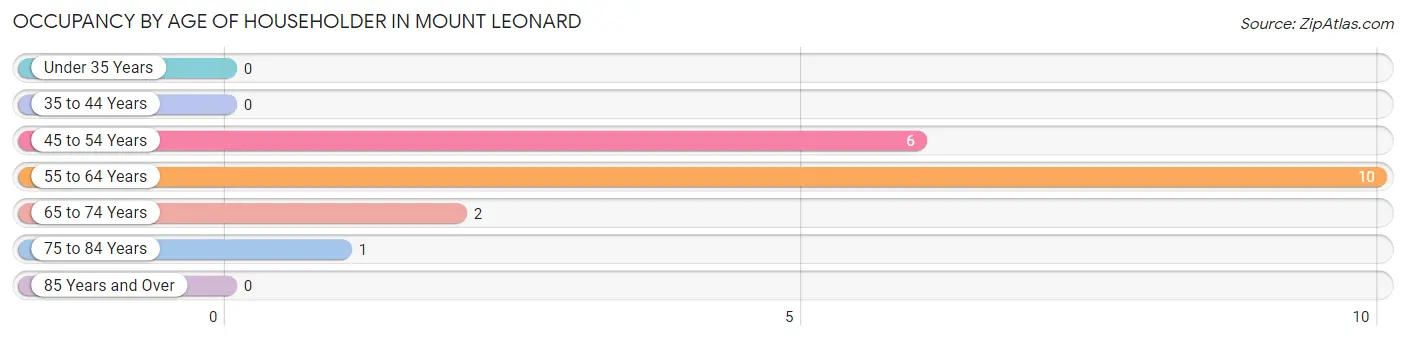
| Age Bracket | # Households | % Households |
| Under 35 Years | 0 | 0.0% |
| 35 to 44 Years | 0 | 0.0% |
| 45 to 54 Years | 6 | 31.6% |
| 55 to 64 Years | 10 | 52.6% |
| 65 to 74 Years | 2 | 10.5% |
| 75 to 84 Years | 1 | 5.3% |
| 85 Years and Over | 0 | 0.0% |
| Total | 19 | 100.0% |
Housing Finances in Mount Leonard
Median Income by Occupancy in Mount Leonard
| Occupancy Type | # Households | Median Income |
| Owner-Occupied | 10 (52.6%) | $0 |
| Renter-Occupied | 9 (47.4%) | $0 |
| Average | 19 (100.0%) | $0 |
Occupancy by Householder Income Bracket in Mount Leonard
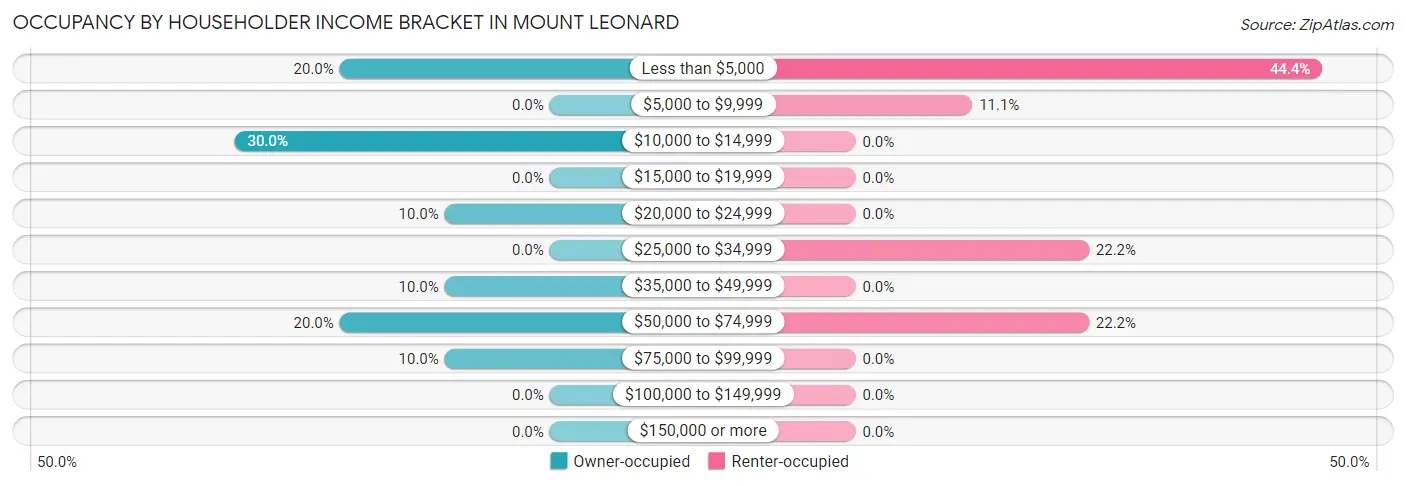
| Income Bracket | Owner-occupied | Renter-occupied |
| Less than $5,000 | 2 (20.0%) | 4 (44.4%) |
| $5,000 to $9,999 | 0 (0.0%) | 1 (11.1%) |
| $10,000 to $14,999 | 3 (30.0%) | 0 (0.0%) |
| $15,000 to $19,999 | 0 (0.0%) | 0 (0.0%) |
| $20,000 to $24,999 | 1 (10.0%) | 0 (0.0%) |
| $25,000 to $34,999 | 0 (0.0%) | 2 (22.2%) |
| $35,000 to $49,999 | 1 (10.0%) | 0 (0.0%) |
| $50,000 to $74,999 | 2 (20.0%) | 2 (22.2%) |
| $75,000 to $99,999 | 1 (10.0%) | 0 (0.0%) |
| $100,000 to $149,999 | 0 (0.0%) | 0 (0.0%) |
| $150,000 or more | 0 (0.0%) | 0 (0.0%) |
| Total | 10 (100.0%) | 9 (100.0%) |
Monthly Housing Cost Tiers in Mount Leonard
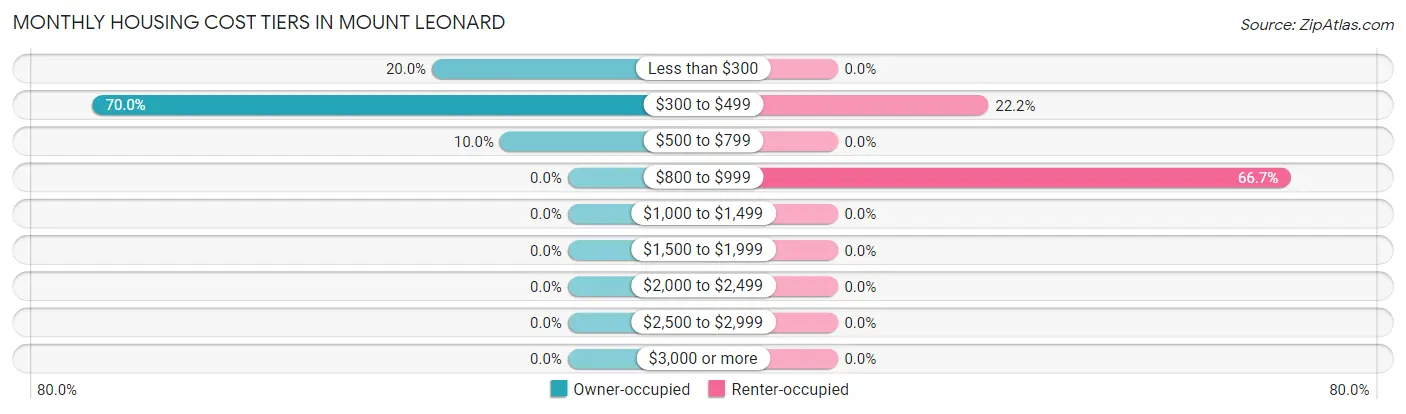
| Monthly Cost | Owner-occupied | Renter-occupied |
| Less than $300 | 2 (20.0%) | 0 (0.0%) |
| $300 to $499 | 7 (70.0%) | 2 (22.2%) |
| $500 to $799 | 1 (10.0%) | 0 (0.0%) |
| $800 to $999 | 0 (0.0%) | 6 (66.7%) |
| $1,000 to $1,499 | 0 (0.0%) | 0 (0.0%) |
| $1,500 to $1,999 | 0 (0.0%) | 0 (0.0%) |
| $2,000 to $2,499 | 0 (0.0%) | 0 (0.0%) |
| $2,500 to $2,999 | 0 (0.0%) | 0 (0.0%) |
| $3,000 or more | 0 (0.0%) | 0 (0.0%) |
| Total | 10 (100.0%) | 9 (100.0%) |
Physical Housing Characteristics in Mount Leonard
Housing Structures in Mount Leonard
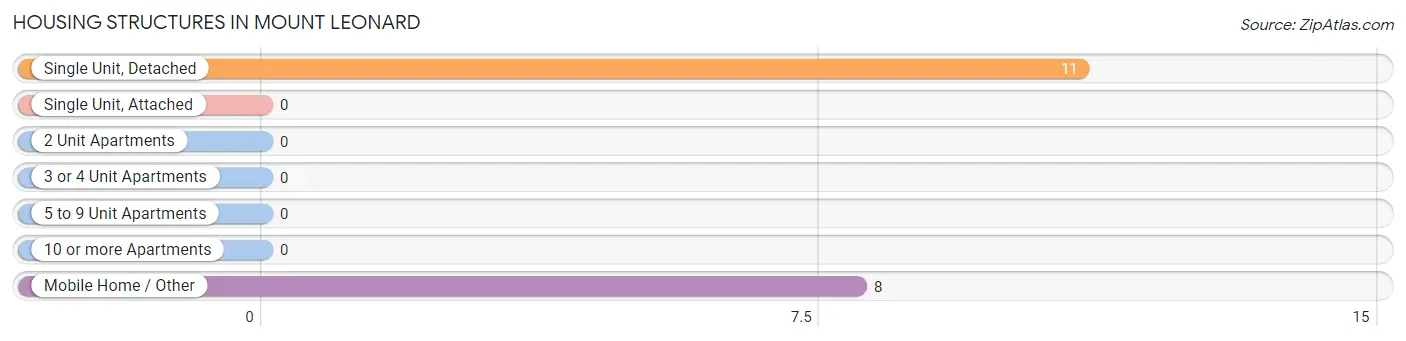
| Structure Type | # Housing Units | % Housing Units |
| Single Unit, Detached | 11 | 57.9% |
| Single Unit, Attached | 0 | 0.0% |
| 2 Unit Apartments | 0 | 0.0% |
| 3 or 4 Unit Apartments | 0 | 0.0% |
| 5 to 9 Unit Apartments | 0 | 0.0% |
| 10 or more Apartments | 0 | 0.0% |
| Mobile Home / Other | 8 | 42.1% |
| Total | 19 | 100.0% |
Housing Structures by Occupancy in Mount Leonard
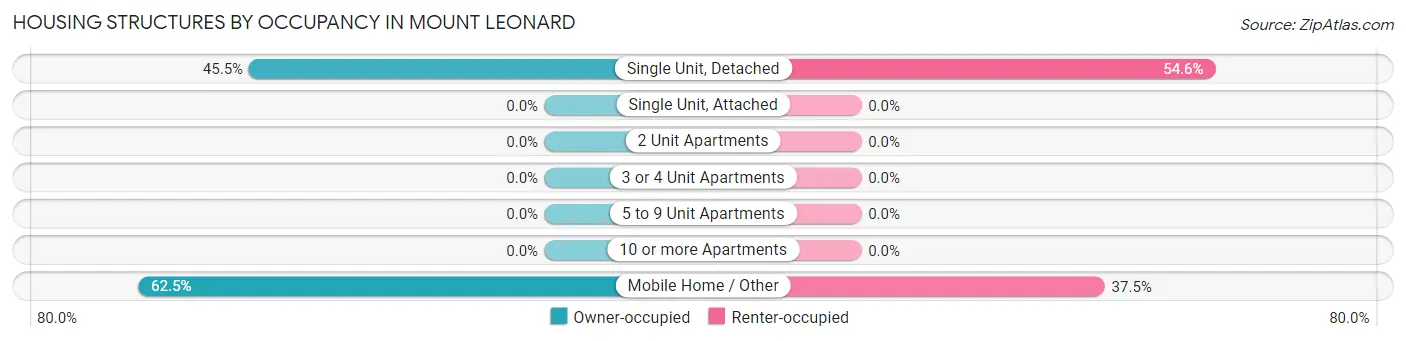
| Structure Type | Owner-occupied | Renter-occupied |
| Single Unit, Detached | 5 (45.5%) | 6 (54.5%) |
| Single Unit, Attached | 0 (0.0%) | 0 (0.0%) |
| 2 Unit Apartments | 0 (0.0%) | 0 (0.0%) |
| 3 or 4 Unit Apartments | 0 (0.0%) | 0 (0.0%) |
| 5 to 9 Unit Apartments | 0 (0.0%) | 0 (0.0%) |
| 10 or more Apartments | 0 (0.0%) | 0 (0.0%) |
| Mobile Home / Other | 5 (62.5%) | 3 (37.5%) |
| Total | 10 (52.6%) | 9 (47.4%) |
Housing Structures by Number of Rooms in Mount Leonard
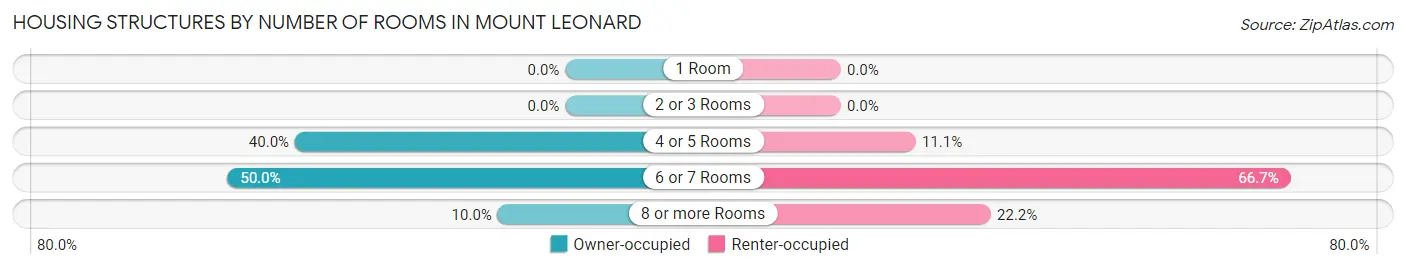
| Number of Rooms | Owner-occupied | Renter-occupied |
| 1 Room | 0 (0.0%) | 0 (0.0%) |
| 2 or 3 Rooms | 0 (0.0%) | 0 (0.0%) |
| 4 or 5 Rooms | 4 (40.0%) | 1 (11.1%) |
| 6 or 7 Rooms | 5 (50.0%) | 6 (66.7%) |
| 8 or more Rooms | 1 (10.0%) | 2 (22.2%) |
| Total | 10 (100.0%) | 9 (100.0%) |
Housing Structure by Heating Type in Mount Leonard
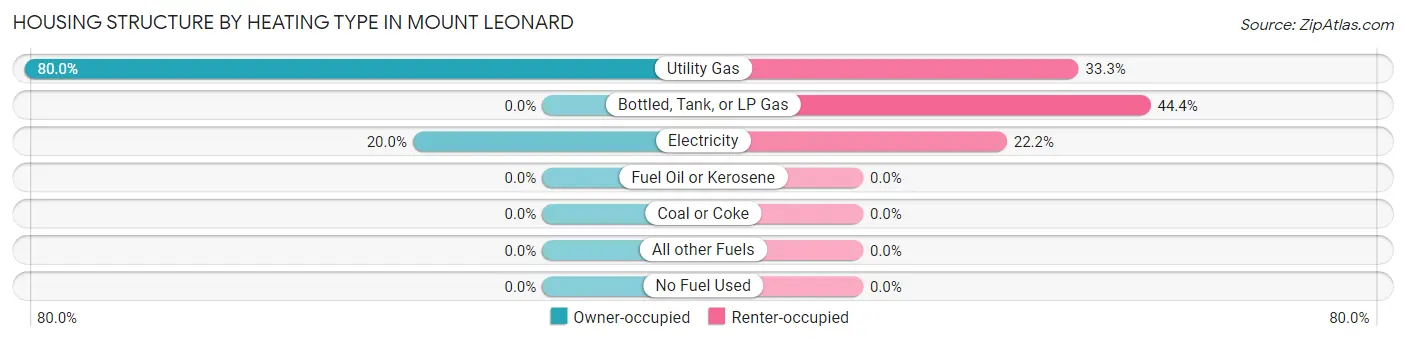
| Heating Type | Owner-occupied | Renter-occupied |
| Utility Gas | 8 (80.0%) | 3 (33.3%) |
| Bottled, Tank, or LP Gas | 0 (0.0%) | 4 (44.4%) |
| Electricity | 2 (20.0%) | 2 (22.2%) |
| Fuel Oil or Kerosene | 0 (0.0%) | 0 (0.0%) |
| Coal or Coke | 0 (0.0%) | 0 (0.0%) |
| All other Fuels | 0 (0.0%) | 0 (0.0%) |
| No Fuel Used | 0 (0.0%) | 0 (0.0%) |
| Total | 10 (100.0%) | 9 (100.0%) |
Household Vehicle Usage in Mount Leonard
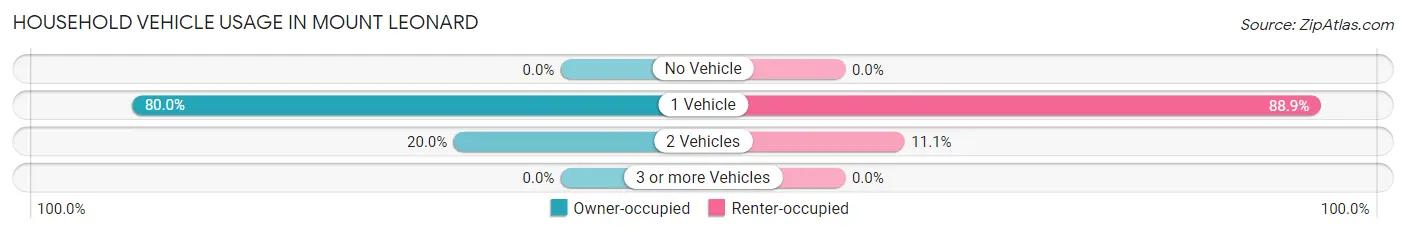
| Vehicles per Household | Owner-occupied | Renter-occupied |
| No Vehicle | 0 (0.0%) | 0 (0.0%) |
| 1 Vehicle | 8 (80.0%) | 8 (88.9%) |
| 2 Vehicles | 2 (20.0%) | 1 (11.1%) |
| 3 or more Vehicles | 0 (0.0%) | 0 (0.0%) |
| Total | 10 (100.0%) | 9 (100.0%) |
Real Estate & Mortgages in Mount Leonard
Real Estate and Mortgage Overview in Mount Leonard
| Characteristic | Without Mortgage | With Mortgage |
| Housing Units | 9 | 1 |
| Median Property Value | $9,999 | $0 |
| Median Household Income | - | - |
| Monthly Housing Costs | $375 | $0 |
| Real Estate Taxes | - | - |
Property Value by Mortgage Status in Mount Leonard
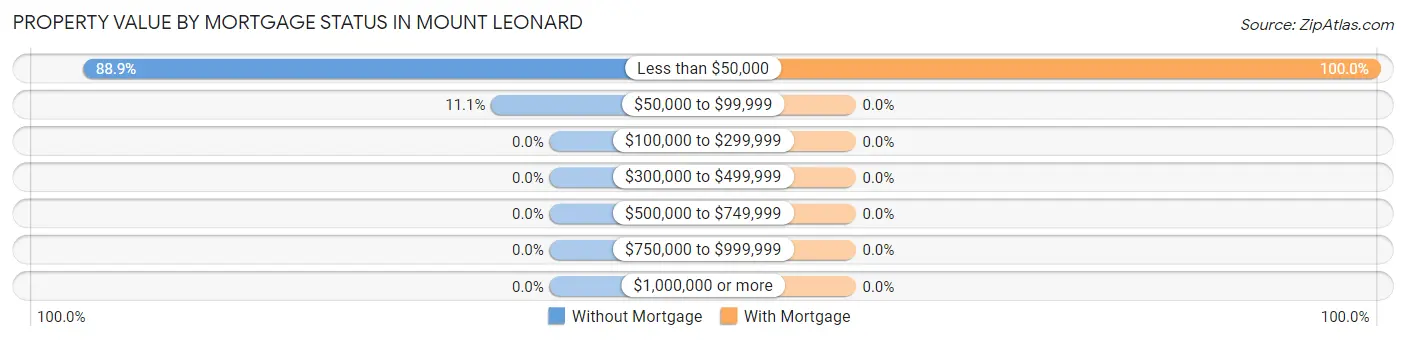
| Property Value | Without Mortgage | With Mortgage |
| Less than $50,000 | 8 (88.9%) | 1 (100.0%) |
| $50,000 to $99,999 | 1 (11.1%) | 0 (0.0%) |
| $100,000 to $299,999 | 0 (0.0%) | 0 (0.0%) |
| $300,000 to $499,999 | 0 (0.0%) | 0 (0.0%) |
| $500,000 to $749,999 | 0 (0.0%) | 0 (0.0%) |
| $750,000 to $999,999 | 0 (0.0%) | 0 (0.0%) |
| $1,000,000 or more | 0 (0.0%) | 0 (0.0%) |
| Total | 9 (100.0%) | 1 (100.0%) |
Household Income by Mortgage Status in Mount Leonard
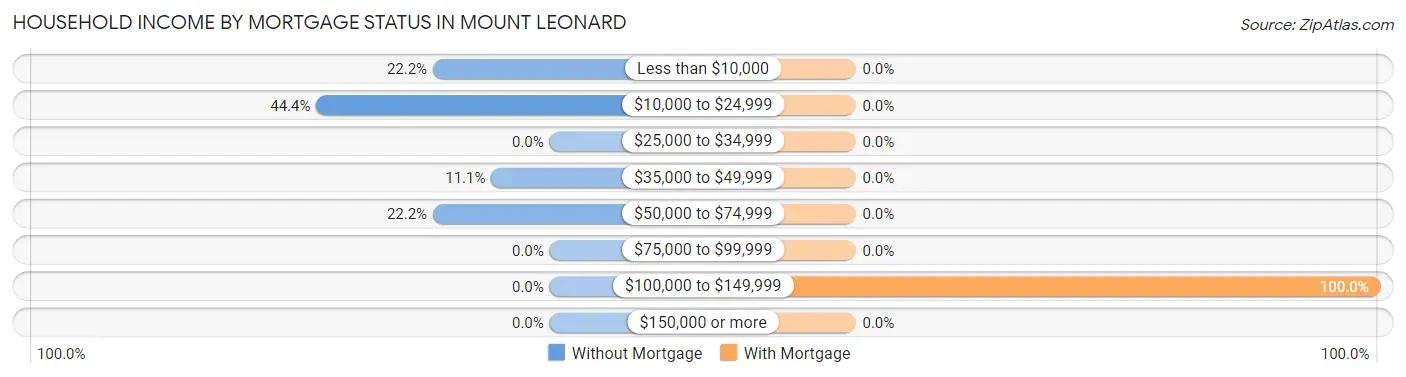
| Household Income | Without Mortgage | With Mortgage |
| Less than $10,000 | 2 (22.2%) | 0 (0.0%) |
| $10,000 to $24,999 | 4 (44.4%) | 0 (0.0%) |
| $25,000 to $34,999 | 0 (0.0%) | 0 (0.0%) |
| $35,000 to $49,999 | 1 (11.1%) | 0 (0.0%) |
| $50,000 to $74,999 | 2 (22.2%) | 0 (0.0%) |
| $75,000 to $99,999 | 0 (0.0%) | 0 (0.0%) |
| $100,000 to $149,999 | 0 (0.0%) | 1 (100.0%) |
| $150,000 or more | 0 (0.0%) | 0 (0.0%) |
| Total | 9 (100.0%) | 1 (100.0%) |
Property Value to Household Income Ratio in Mount Leonard
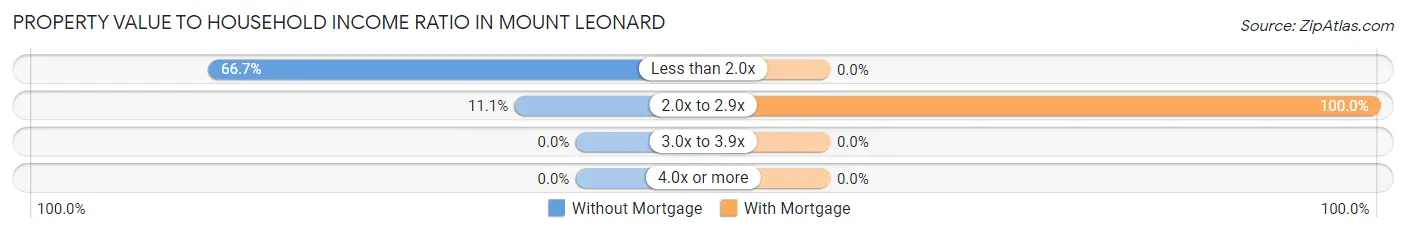
| Value-to-Income Ratio | Without Mortgage | With Mortgage |
| Less than 2.0x | 6 (66.7%) | 0 (0.0%) |
| 2.0x to 2.9x | 1 (11.1%) | 1 (100.0%) |
| 3.0x to 3.9x | 0 (0.0%) | 0 (0.0%) |
| 4.0x or more | 0 (0.0%) | 0 (0.0%) |
| Total | 9 (100.0%) | 1 (100.0%) |
Real Estate Taxes by Mortgage Status in Mount Leonard
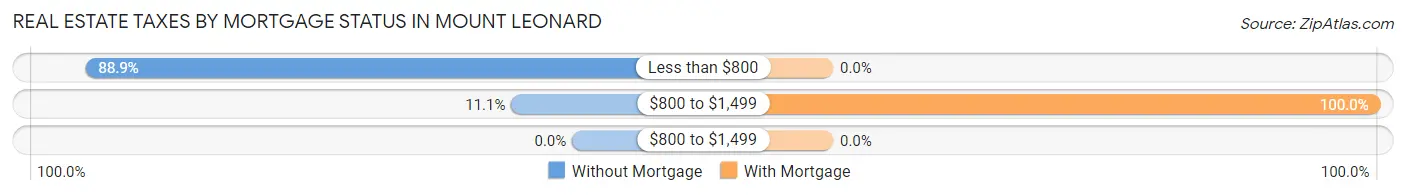
| Property Taxes | Without Mortgage | With Mortgage |
| Less than $800 | 8 (88.9%) | 0 (0.0%) |
| $800 to $1,499 | 1 (11.1%) | 1 (100.0%) |
| $800 to $1,499 | 0 (0.0%) | 0 (0.0%) |
| Total | 9 (100.0%) | 1 (100.0%) |
Health & Disability in Mount Leonard
Health Insurance Coverage by Age in Mount Leonard
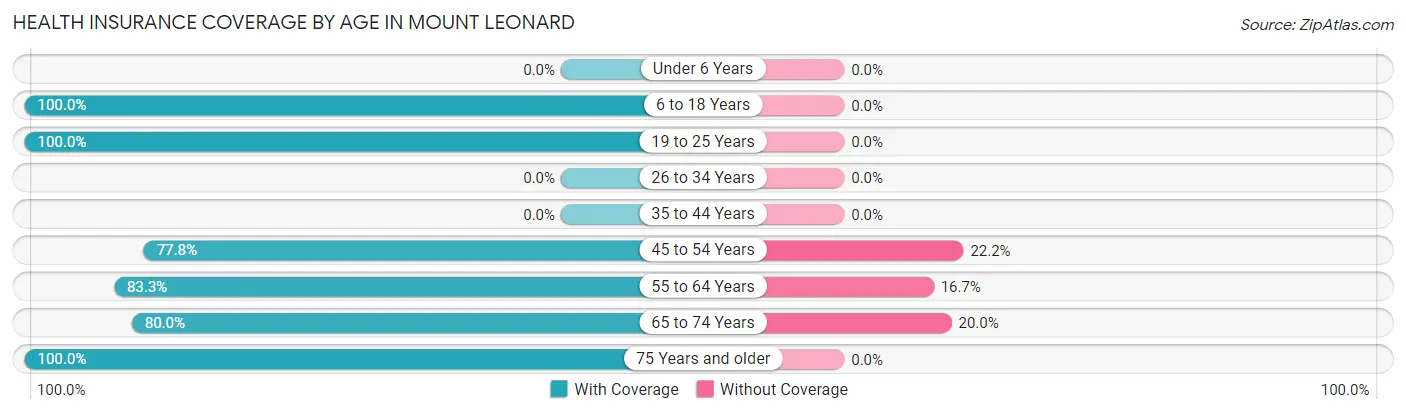
| Age Bracket | With Coverage | Without Coverage |
| Under 6 Years | 0 (0.0%) | 0 (0.0%) |
| 6 to 18 Years | 6 (100.0%) | 0 (0.0%) |
| 19 to 25 Years | 19 (100.0%) | 0 (0.0%) |
| 26 to 34 Years | 0 (0.0%) | 0 (0.0%) |
| 35 to 44 Years | 0 (0.0%) | 0 (0.0%) |
| 45 to 54 Years | 7 (77.8%) | 2 (22.2%) |
| 55 to 64 Years | 10 (83.3%) | 2 (16.7%) |
| 65 to 74 Years | 4 (80.0%) | 1 (20.0%) |
| 75 Years and older | 2 (100.0%) | 0 (0.0%) |
| Total | 48 (90.6%) | 5 (9.4%) |
Health Insurance Coverage by Citizenship Status in Mount Leonard
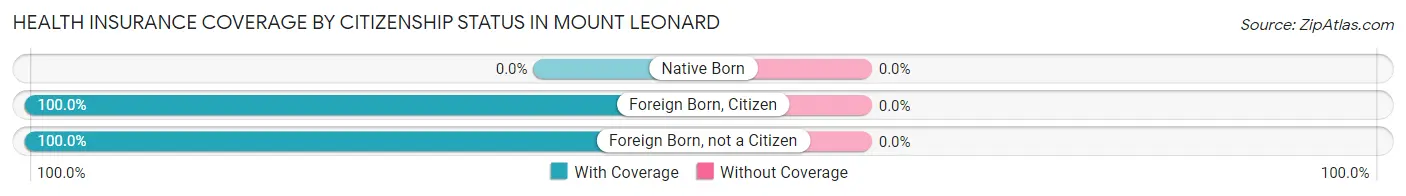
| Citizenship Status | With Coverage | Without Coverage |
| Native Born | 0 (0.0%) | 0 (0.0%) |
| Foreign Born, Citizen | 6 (100.0%) | 0 (0.0%) |
| Foreign Born, not a Citizen | 19 (100.0%) | 0 (0.0%) |
Health Insurance Coverage by Household Income in Mount Leonard
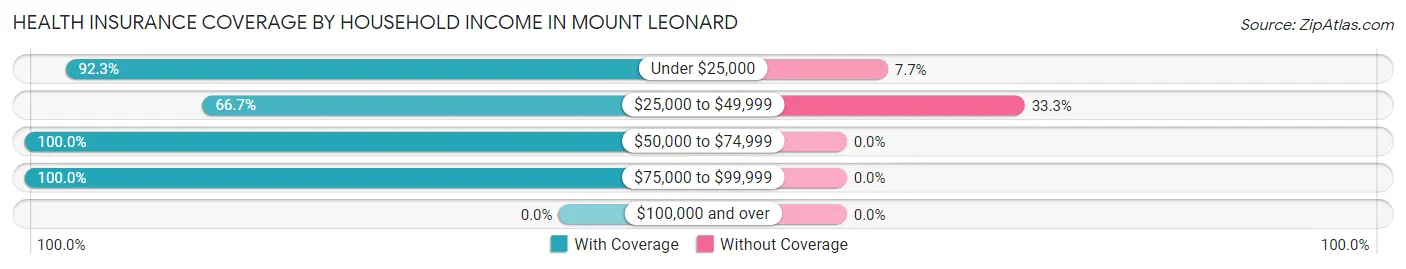
| Household Income | With Coverage | Without Coverage |
| Under $25,000 | 36 (92.3%) | 3 (7.7%) |
| $25,000 to $49,999 | 4 (66.7%) | 2 (33.3%) |
| $50,000 to $74,999 | 6 (100.0%) | 0 (0.0%) |
| $75,000 to $99,999 | 2 (100.0%) | 0 (0.0%) |
| $100,000 and over | 0 (0.0%) | 0 (0.0%) |
Public vs Private Health Insurance Coverage by Age in Mount Leonard
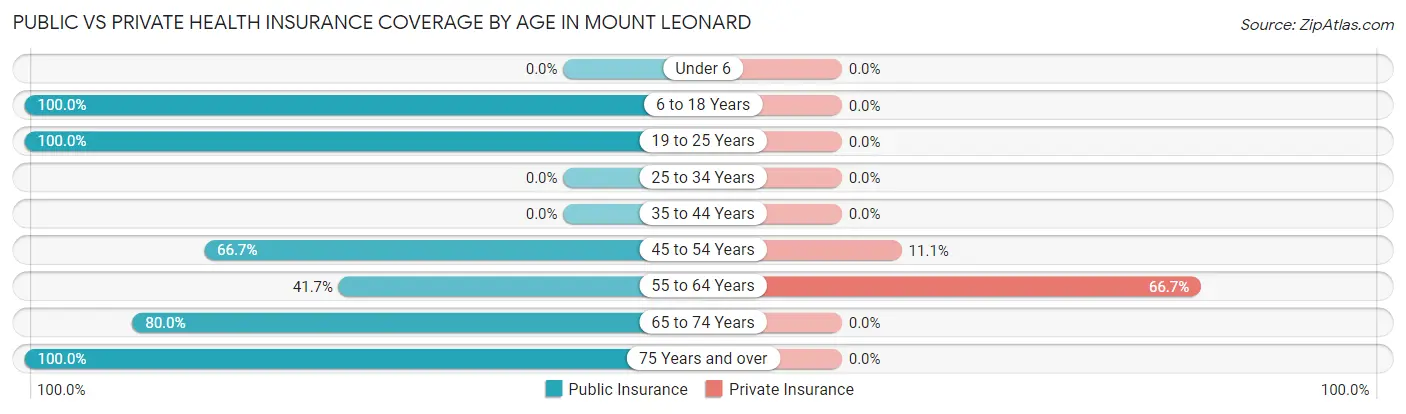
| Age Bracket | Public Insurance | Private Insurance |
| Under 6 | 0 (0.0%) | 0 (0.0%) |
| 6 to 18 Years | 6 (100.0%) | 0 (0.0%) |
| 19 to 25 Years | 19 (100.0%) | 0 (0.0%) |
| 25 to 34 Years | 0 (0.0%) | 0 (0.0%) |
| 35 to 44 Years | 0 (0.0%) | 0 (0.0%) |
| 45 to 54 Years | 6 (66.7%) | 1 (11.1%) |
| 55 to 64 Years | 5 (41.7%) | 8 (66.7%) |
| 65 to 74 Years | 4 (80.0%) | 0 (0.0%) |
| 75 Years and over | 2 (100.0%) | 0 (0.0%) |
| Total | 42 (79.2%) | 9 (17.0%) |
Disability Status by Sex by Age in Mount Leonard
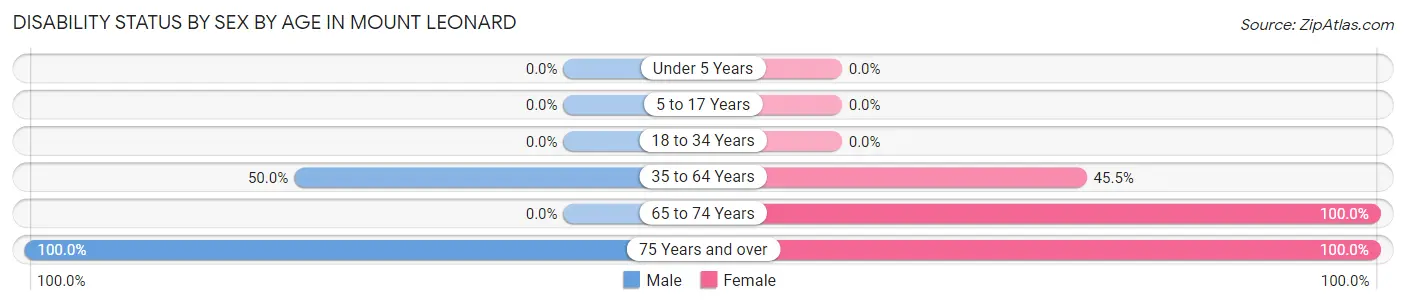
| Age Bracket | Male | Female |
| Under 5 Years | 0 (0.0%) | 0 (0.0%) |
| 5 to 17 Years | 0 (0.0%) | 0 (0.0%) |
| 18 to 34 Years | 0 (0.0%) | 0 (0.0%) |
| 35 to 64 Years | 5 (50.0%) | 5 (45.5%) |
| 65 to 74 Years | 0 (0.0%) | 4 (100.0%) |
| 75 Years and over | 1 (100.0%) | 1 (100.0%) |
Disability Class by Sex by Age in Mount Leonard
Disability Class: Hearing Difficulty

| Age Bracket | Male | Female |
| Under 5 Years | 0 (0.0%) | 0 (0.0%) |
| 5 to 17 Years | 0 (0.0%) | 0 (0.0%) |
| 18 to 34 Years | 0 (0.0%) | 0 (0.0%) |
| 35 to 64 Years | 0 (0.0%) | 4 (36.4%) |
| 65 to 74 Years | 0 (0.0%) | 0 (0.0%) |
| 75 Years and over | 0 (0.0%) | 0 (0.0%) |
Disability Class: Vision Difficulty
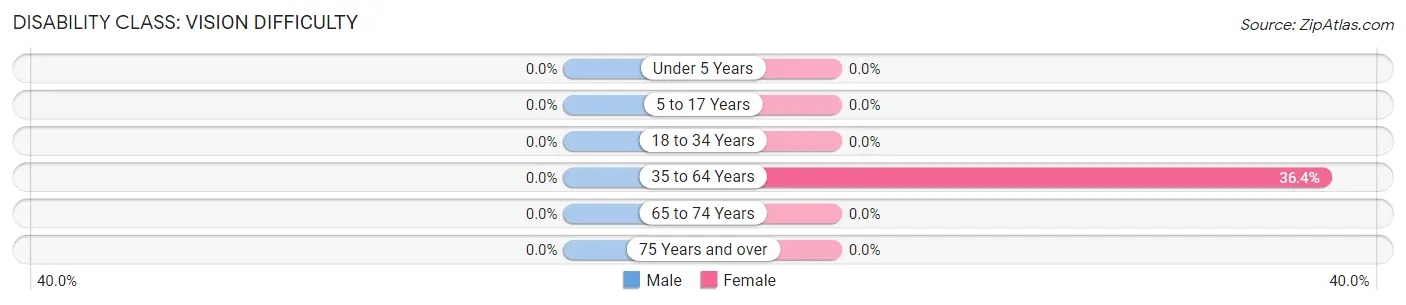
| Age Bracket | Male | Female |
| Under 5 Years | 0 (0.0%) | 0 (0.0%) |
| 5 to 17 Years | 0 (0.0%) | 0 (0.0%) |
| 18 to 34 Years | 0 (0.0%) | 0 (0.0%) |
| 35 to 64 Years | 0 (0.0%) | 4 (36.4%) |
| 65 to 74 Years | 0 (0.0%) | 0 (0.0%) |
| 75 Years and over | 0 (0.0%) | 0 (0.0%) |
Disability Class: Cognitive Difficulty
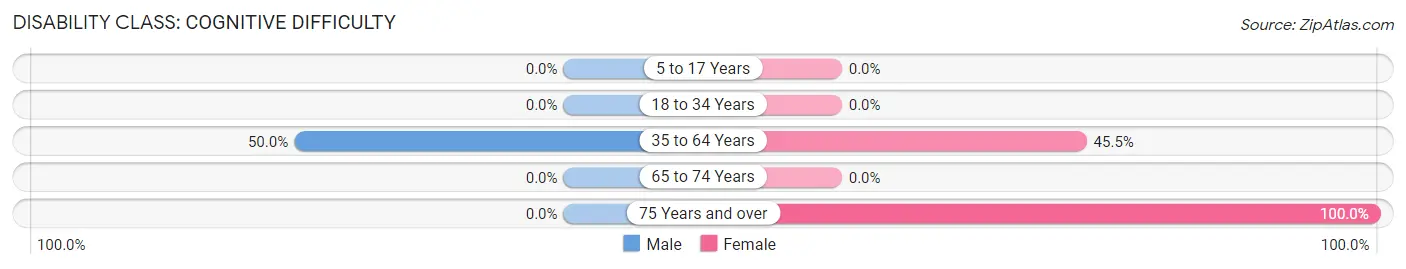
| Age Bracket | Male | Female |
| 5 to 17 Years | 0 (0.0%) | 0 (0.0%) |
| 18 to 34 Years | 0 (0.0%) | 0 (0.0%) |
| 35 to 64 Years | 5 (50.0%) | 5 (45.5%) |
| 65 to 74 Years | 0 (0.0%) | 0 (0.0%) |
| 75 Years and over | 0 (0.0%) | 1 (100.0%) |
Disability Class: Ambulatory Difficulty
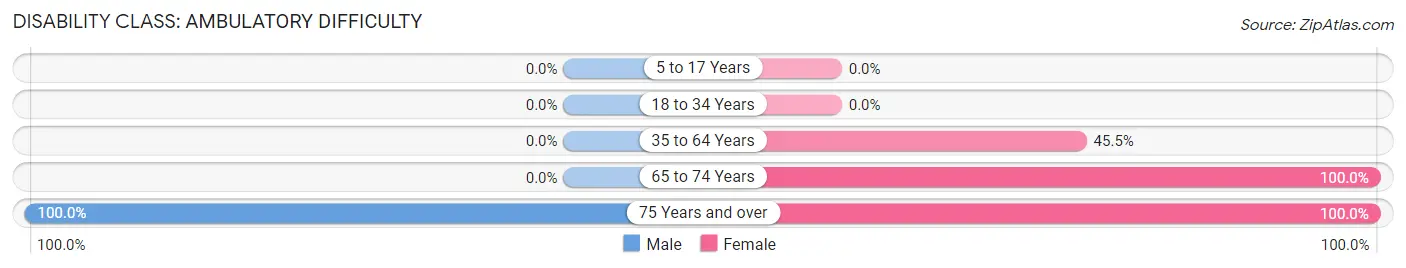
| Age Bracket | Male | Female |
| 5 to 17 Years | 0 (0.0%) | 0 (0.0%) |
| 18 to 34 Years | 0 (0.0%) | 0 (0.0%) |
| 35 to 64 Years | 0 (0.0%) | 5 (45.5%) |
| 65 to 74 Years | 0 (0.0%) | 4 (100.0%) |
| 75 Years and over | 1 (100.0%) | 1 (100.0%) |
Disability Class: Self-Care Difficulty
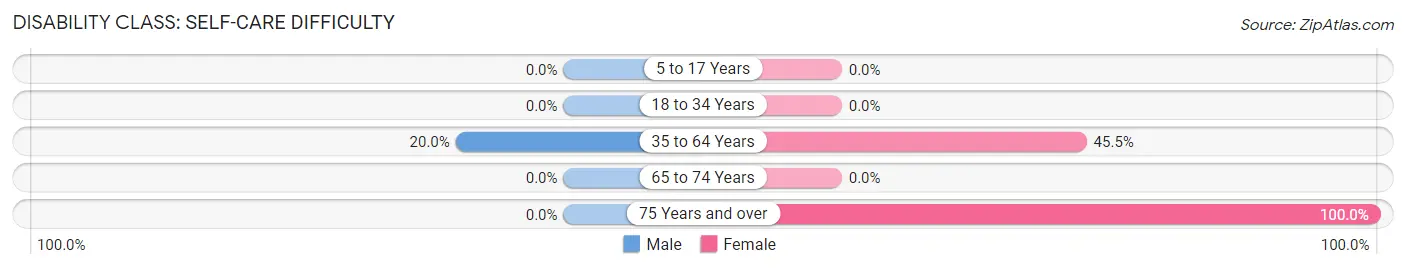
| Age Bracket | Male | Female |
| 5 to 17 Years | 0 (0.0%) | 0 (0.0%) |
| 18 to 34 Years | 0 (0.0%) | 0 (0.0%) |
| 35 to 64 Years | 2 (20.0%) | 5 (45.5%) |
| 65 to 74 Years | 0 (0.0%) | 0 (0.0%) |
| 75 Years and over | 0 (0.0%) | 1 (100.0%) |
Technology Access in Mount Leonard
Computing Device Access in Mount Leonard
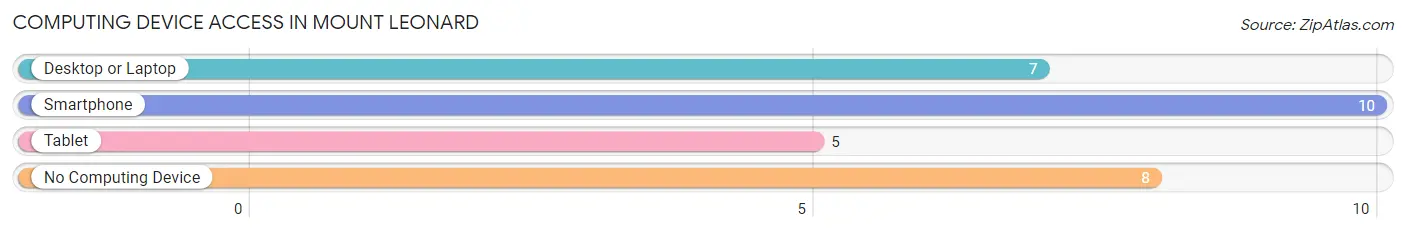
| Device Type | # Households | % Households |
| Desktop or Laptop | 7 | 36.8% |
| Smartphone | 10 | 52.6% |
| Tablet | 5 | 26.3% |
| No Computing Device | 8 | 42.1% |
| Total | 19 | 100.0% |
Internet Access in Mount Leonard
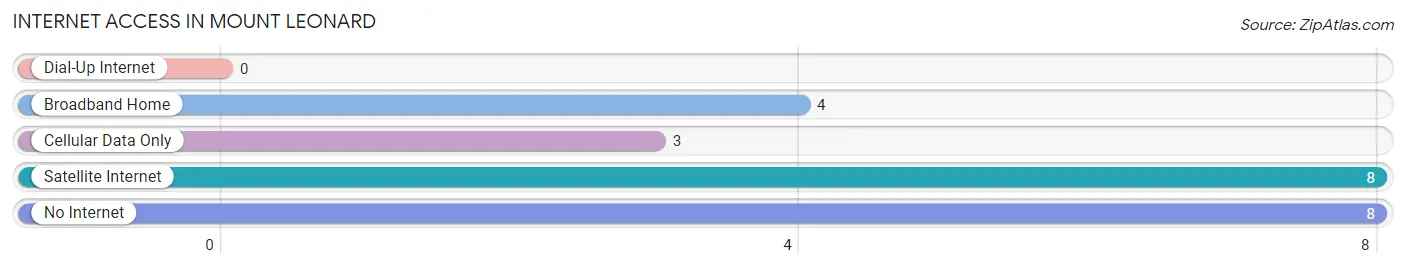
| Internet Type | # Households | % Households |
| Dial-Up Internet | 0 | 0.0% |
| Broadband Home | 4 | 21.0% |
| Cellular Data Only | 3 | 15.8% |
| Satellite Internet | 8 | 42.1% |
| No Internet | 8 | 42.1% |
| Total | 19 | 100.0% |
Mount Leonard Summary
Leonard, Missouri is a small town located in the Ozark Mountains of southwestern Missouri. It is situated in the foothills of the Ozarks, approximately 20 miles south of Springfield, Missouri. The town was founded in 1883 and named after Leonard B. Smith, a local farmer and businessman. The population of Leonard was estimated to be around 500 people in 2000.
Geography
Leonard is located in the Ozark Mountains of southwestern Missouri. It is situated in the foothills of the Ozarks, approximately 20 miles south of Springfield, Missouri. The town is located in Christian County, and is bordered by the towns of Ozark, Nixa, and Sparta. The town is situated on a plateau, with an elevation of around 1,000 feet. The town is surrounded by rolling hills and forests, and is home to a variety of wildlife.
Economy
The economy of Leonard is largely based on agriculture and tourism. The town is home to several small businesses, including a grocery store, a hardware store, and a few restaurants. The town is also home to a number of farms, which produce a variety of crops, including corn, soybeans, and wheat. The town is also home to a number of tourist attractions, including a historic covered bridge, a museum, and a number of hiking trails.
Demographics
The population of Leonard was estimated to be around 500 people in 2000. The town is predominantly white, with a small African American population. The median household income in Leonard is around $30,000, and the median home value is around $90,000. The town is served by the Ozark School District, which includes two elementary schools, a middle school, and a high school.
History
Leonard was founded in 1883 and named after Leonard B. Smith, a local farmer and businessman. The town was originally a small farming community, and the economy was largely based on agriculture. In the early 1900s, the town began to grow, and a number of businesses were established. The town was also home to a number of tourist attractions, including a historic covered bridge, a museum, and a number of hiking trails. In the late 20th century, the town began to decline, and the population began to decline as well. However, in recent years, the town has seen a resurgence, and the population has begun to grow again.
Conclusion
Leonard, Missouri is a small town located in the Ozark Mountains of southwestern Missouri. It is situated in the foothills of the Ozarks, approximately 20 miles south of Springfield, Missouri. The town was founded in 1883 and named after Leonard B. Smith, a local farmer and businessman. The population of Leonard was estimated to be around 500 people in 2000. The economy of Leonard is largely based on agriculture and tourism, and the town is home to several small businesses, including a grocery store, a hardware store, and a few restaurants. The town is predominantly white, with a small African American population. The median household income in Leonard is around $30,000, and the median home value is around $90,000. The town is served by the Ozark School District, which includes two elementary schools, a middle school, and a high school. Leonard has seen a resurgence in recent years, and the population has begun to grow again.
Common Questions
What is Per Capita Income in Mount Leonard?
Per Capita income in Mount Leonard is $9,477.
What is Income or Wage Gap in Mount Leonard?
Income or Wage Gap in Mount Leonard is 33.8%.
Women in Mount Leonard earn 66.2 cents for every dollar earned by a man.
What is Inequality or Gini Index in Mount Leonard?
Inequality or Gini Index in Mount Leonard is 0.56.
What is the Total Population of Mount Leonard?
Total Population of Mount Leonard is 53.
What is the Total Male Population of Mount Leonard?
Total Male Population of Mount Leonard is 12.
What is the Total Female Population of Mount Leonard?
Total Female Population of Mount Leonard is 41.
What is the Ratio of Males per 100 Females in Mount Leonard?
There are 29.27 Males per 100 Females in Mount Leonard.
What is the Ratio of Females per 100 Males in Mount Leonard?
There are 341.67 Females per 100 Males in Mount Leonard.
What is the Median Population Age in Mount Leonard?
Median Population Age in Mount Leonard is 52.8 Years.
What is the Average Family Size in Mount Leonard
Average Family Size in Mount Leonard is 3.6 People.
What is the Average Household Size in Mount Leonard
Average Household Size in Mount Leonard is 2.8 People.
How Large is the Labor Force in Mount Leonard?
There are 7 People in the Labor Forcein in Mount Leonard.
What is the Percentage of People in the Labor Force in Mount Leonard?
13.2% of People are in the Labor Force in Mount Leonard.