Maskell, NE Map & Demographics
Maskell Map
Maskell Overview
$24,197
PER CAPITA INCOME
$56,875
AVG FAMILY INCOME
$54,375
AVG HOUSEHOLD INCOME
0.22
INEQUALITY / GINI INDEX
62
TOTAL POPULATION
33
MALE POPULATION
29
FEMALE POPULATION
113.79
MALES / 100 FEMALES
87.88
FEMALES / 100 MALES
53.0
MEDIAN AGE
3.1
AVG FAMILY SIZE
2.5
AVG HOUSEHOLD SIZE
23
LABOR FORCE [ PEOPLE ]
40.4%
PERCENT IN LABOR FORCE
4.3%
UNEMPLOYMENT RATE
Maskell Zip Codes
Maskell Area Codes
Income in Maskell
Income Overview in Maskell
Per Capita Income in Maskell is $24,197, while median incomes of families and households are $56,875 and $54,375 respectively.
| Characteristic | Number | Measure |
| Per Capita Income | 62 | $24,197 |
| Median Family Income | 17 | $56,875 |
| Mean Family Income | 17 | $62,841 |
| Median Household Income | 25 | $54,375 |
| Mean Household Income | 25 | $56,272 |
| Income Deficit | 17 | $0 |
| Wage / Income Gap (%) | 62 | 0.00% |
| Wage / Income Gap ($) | 62 | 100.00¢ per $1 |
| Gini / Inequality Index | 62 | 0.22 |
Earnings by Sex in Maskell
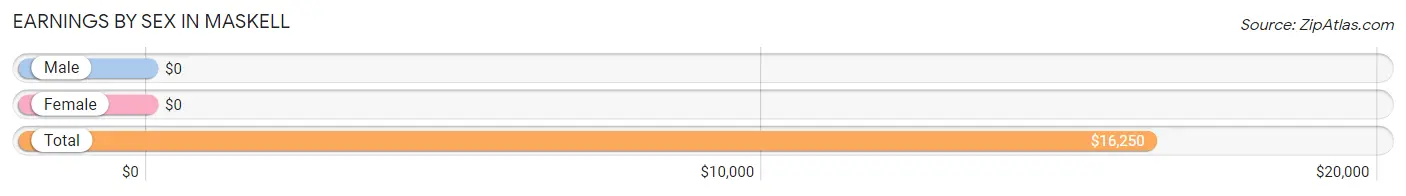
| Sex | Number | Average Earnings |
| Male | 22 (61.1%) | $0 |
| Female | 14 (38.9%) | $0 |
| Total | 36 (100.0%) | $16,250 |
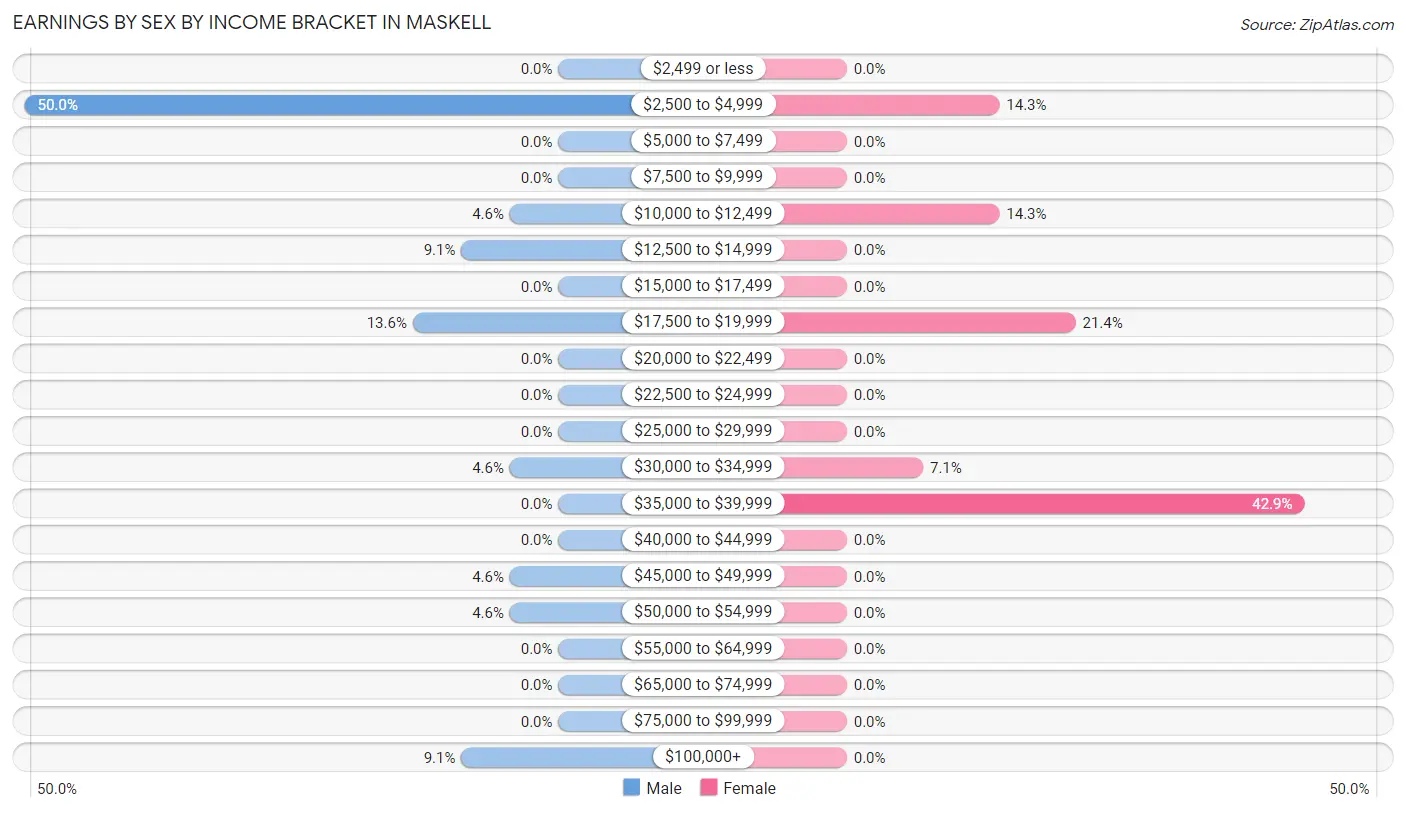
Earnings by Sex by Income Bracket in Maskell
The most common earnings brackets in Maskell are $2,500 to $4,999 for men (11 | 50.0%) and $35,000 to $39,999 for women (6 | 42.9%).
| Income | Male | Female |
| $2,499 or less | 0 (0.0%) | 0 (0.0%) |
| $2,500 to $4,999 | 11 (50.0%) | 2 (14.3%) |
| $5,000 to $7,499 | 0 (0.0%) | 0 (0.0%) |
| $7,500 to $9,999 | 0 (0.0%) | 0 (0.0%) |
| $10,000 to $12,499 | 1 (4.5%) | 2 (14.3%) |
| $12,500 to $14,999 | 2 (9.1%) | 0 (0.0%) |
| $15,000 to $17,499 | 0 (0.0%) | 0 (0.0%) |
| $17,500 to $19,999 | 3 (13.6%) | 3 (21.4%) |
| $20,000 to $22,499 | 0 (0.0%) | 0 (0.0%) |
| $22,500 to $24,999 | 0 (0.0%) | 0 (0.0%) |
| $25,000 to $29,999 | 0 (0.0%) | 0 (0.0%) |
| $30,000 to $34,999 | 1 (4.5%) | 1 (7.1%) |
| $35,000 to $39,999 | 0 (0.0%) | 6 (42.9%) |
| $40,000 to $44,999 | 0 (0.0%) | 0 (0.0%) |
| $45,000 to $49,999 | 1 (4.5%) | 0 (0.0%) |
| $50,000 to $54,999 | 1 (4.5%) | 0 (0.0%) |
| $55,000 to $64,999 | 0 (0.0%) | 0 (0.0%) |
| $65,000 to $74,999 | 0 (0.0%) | 0 (0.0%) |
| $75,000 to $99,999 | 0 (0.0%) | 0 (0.0%) |
| $100,000+ | 2 (9.1%) | 0 (0.0%) |
| Total | 22 (100.0%) | 14 (100.0%) |
Earnings by Sex by Educational Attainment in Maskell
| Educational Attainment | Male Income | Female Income |
| Less than High School | - | - |
| High School Diploma | - | - |
| College or Associate's Degree | - | - |
| Bachelor's Degree | - | - |
| Graduate Degree | - | - |
| Total | - | - |
Family Income in Maskell
Family Income Brackets in Maskell
According to the Maskell family income data, there are 7 families falling into the $75,000 to $99,999 income range, which is the most common income bracket and makes up 41.2% of all families.
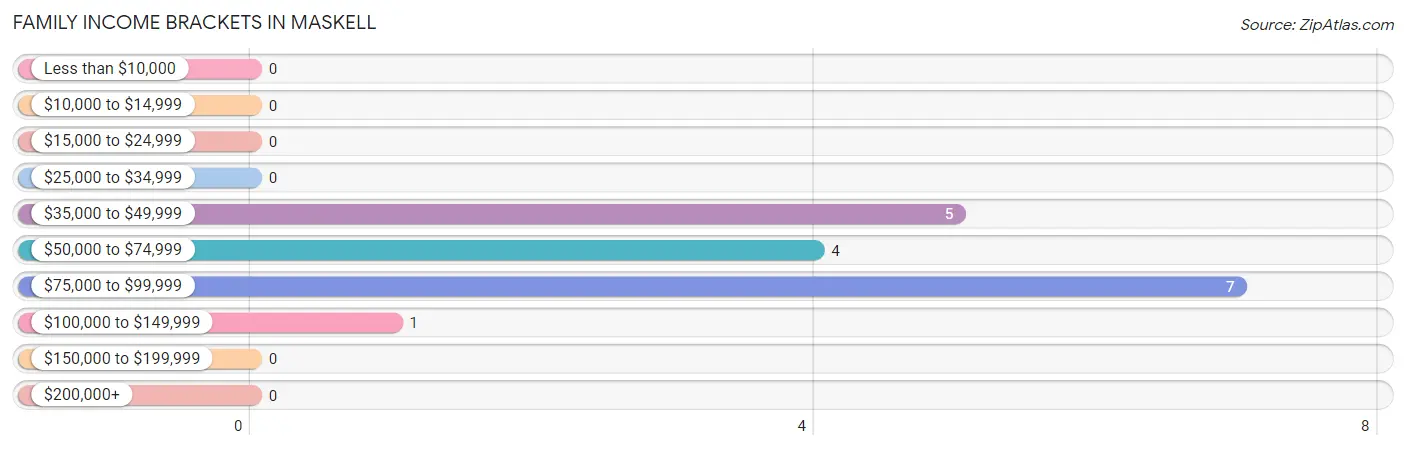
| Income Bracket | # Families | % Families |
| Less than $10,000 | 0 | 0.0% |
| $10,000 to $14,999 | 0 | 0.0% |
| $15,000 to $24,999 | 0 | 0.0% |
| $25,000 to $34,999 | 0 | 0.0% |
| $35,000 to $49,999 | 5 | 29.4% |
| $50,000 to $74,999 | 4 | 23.5% |
| $75,000 to $99,999 | 7 | 41.2% |
| $100,000 to $149,999 | 1 | 5.9% |
| $150,000 to $199,999 | 0 | 0.0% |
| $200,000+ | 0 | 0.0% |
Family Income by Famaliy Size in Maskell
2-person families (11 | 64.7%) account for the highest median family income in Maskell with $54,375 per family, while 2-person families (11 | 64.7%) have the highest median income of $27,188 per family member.
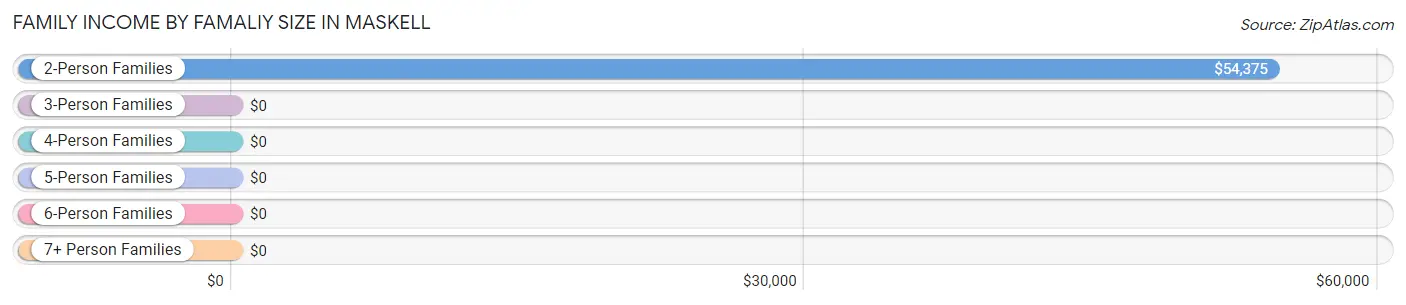
| Income Bracket | # Families | Median Income |
| 2-Person Families | 11 (64.7%) | $54,375 |
| 3-Person Families | 5 (29.4%) | $0 |
| 4-Person Families | 1 (5.9%) | $0 |
| 5-Person Families | 0 (0.0%) | $0 |
| 6-Person Families | 0 (0.0%) | $0 |
| 7+ Person Families | 0 (0.0%) | $0 |
| Total | 17 (100.0%) | $56,875 |
Family Income by Number of Earners in Maskell
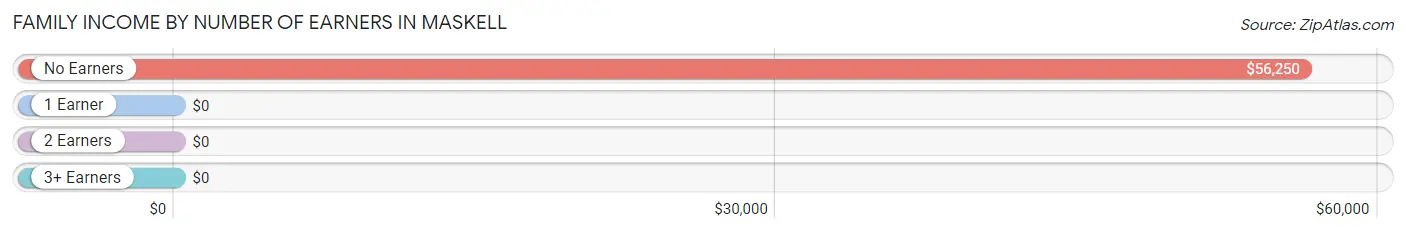
| Number of Earners | # Families | Median Income |
| No Earners | 6 (35.3%) | $56,250 |
| 1 Earner | 0 (0.0%) | $0 |
| 2 Earners | 7 (41.2%) | $0 |
| 3+ Earners | 4 (23.5%) | $0 |
| Total | 17 (100.0%) | $56,875 |
Household Income in Maskell
Household Income Brackets in Maskell
With 8 households falling in the category, the $35,000 to $49,999 income range is the most frequent in Maskell, accounting for 32.0% of all households.
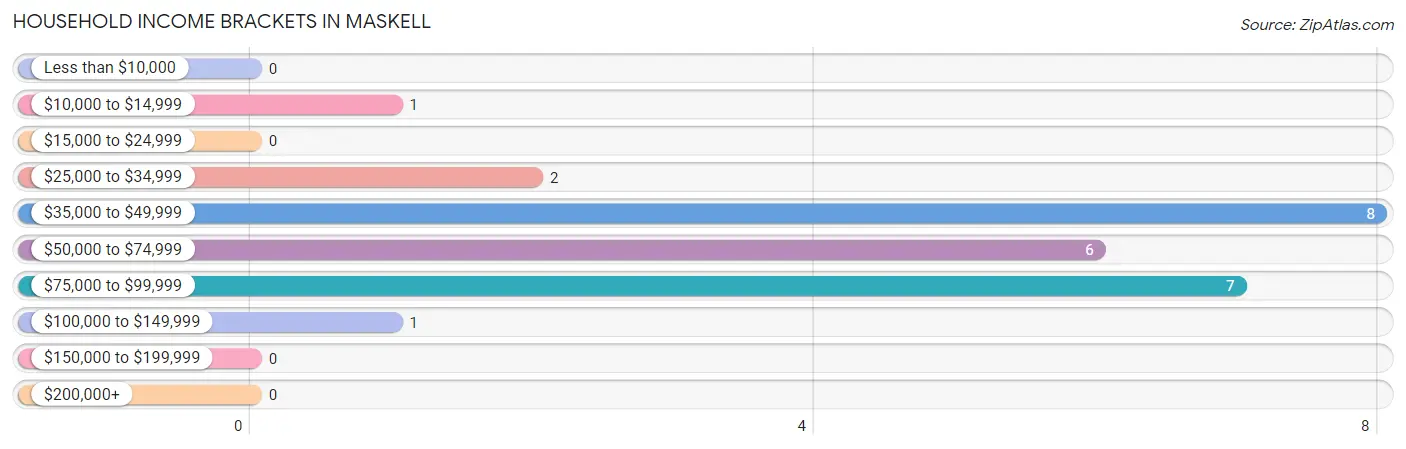
| Income Bracket | # Households | % Households |
| Less than $10,000 | 0 | 0.0% |
| $10,000 to $14,999 | 1 | 4.0% |
| $15,000 to $24,999 | 0 | 0.0% |
| $25,000 to $34,999 | 2 | 8.0% |
| $35,000 to $49,999 | 8 | 32.0% |
| $50,000 to $74,999 | 6 | 24.0% |
| $75,000 to $99,999 | 7 | 28.0% |
| $100,000 to $149,999 | 1 | 4.0% |
| $150,000 to $199,999 | 0 | 0.0% |
| $200,000+ | 0 | 0.0% |
Household Income by Householder Age in Maskell
The median household income in Maskell is $54,375, with the highest median household income of $75,938 found in the 45 to 64 years age bracket for the primary householder. A total of 9 households (36.0%) fall into this category.
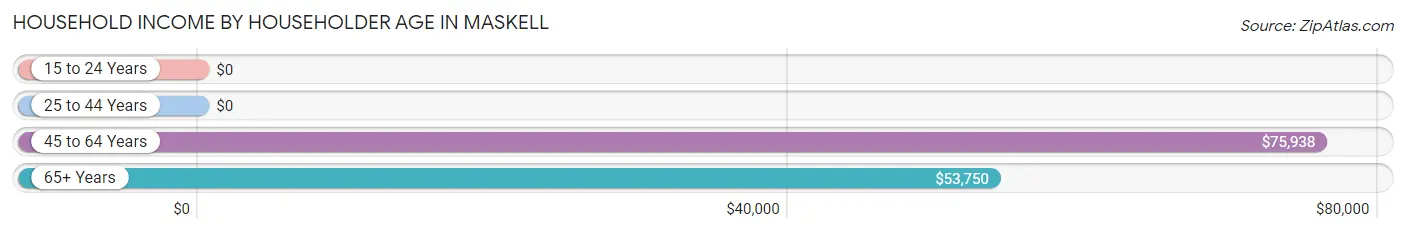
| Income Bracket | # Households | Median Income |
| 15 to 24 Years | 0 (0.0%) | $0 |
| 25 to 44 Years | 2 (8.0%) | $0 |
| 45 to 64 Years | 9 (36.0%) | $75,938 |
| 65+ Years | 14 (56.0%) | $53,750 |
| Total | 25 (100.0%) | $54,375 |
Poverty in Maskell
Income Below Poverty by Sex and Age in Maskell
With 3.0% poverty level for males and 3.6% for females among the residents of Maskell, 55 to 64 year old males and 25 to 34 year old females are the most vulnerable to poverty, with 1 males (25.0%) and 1 females (100.0%) in their respective age groups living below the poverty level.
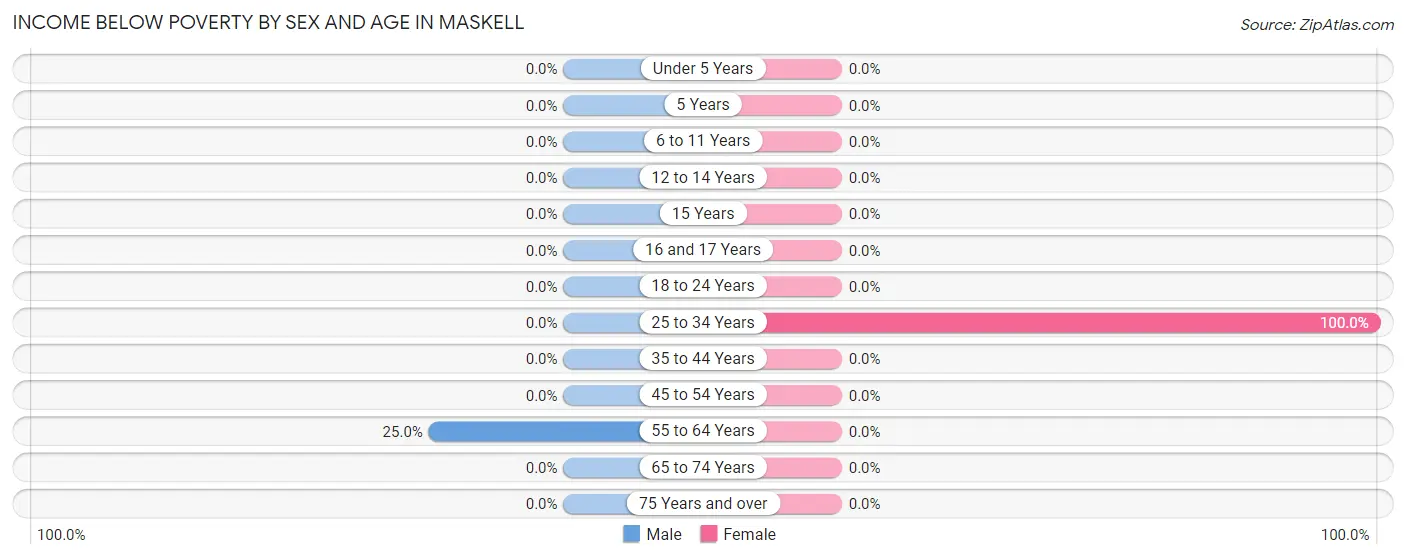
| Age Bracket | Male | Female |
| Under 5 Years | 0 (0.0%) | 0 (0.0%) |
| 5 Years | 0 (0.0%) | 0 (0.0%) |
| 6 to 11 Years | 0 (0.0%) | 0 (0.0%) |
| 12 to 14 Years | 0 (0.0%) | 0 (0.0%) |
| 15 Years | 0 (0.0%) | 0 (0.0%) |
| 16 and 17 Years | 0 (0.0%) | 0 (0.0%) |
| 18 to 24 Years | 0 (0.0%) | 0 (0.0%) |
| 25 to 34 Years | 0 (0.0%) | 1 (100.0%) |
| 35 to 44 Years | 0 (0.0%) | 0 (0.0%) |
| 45 to 54 Years | 0 (0.0%) | 0 (0.0%) |
| 55 to 64 Years | 1 (25.0%) | 0 (0.0%) |
| 65 to 74 Years | 0 (0.0%) | 0 (0.0%) |
| 75 Years and over | 0 (0.0%) | 0 (0.0%) |
| Total | 1 (3.0%) | 1 (3.6%) |
Income Above Poverty by Sex and Age in Maskell
According to the poverty statistics in Maskell, males aged 6 to 11 years and females aged 6 to 11 years are the age groups that are most secure financially, with 100.0% of males and 100.0% of females in these age groups living above the poverty line.
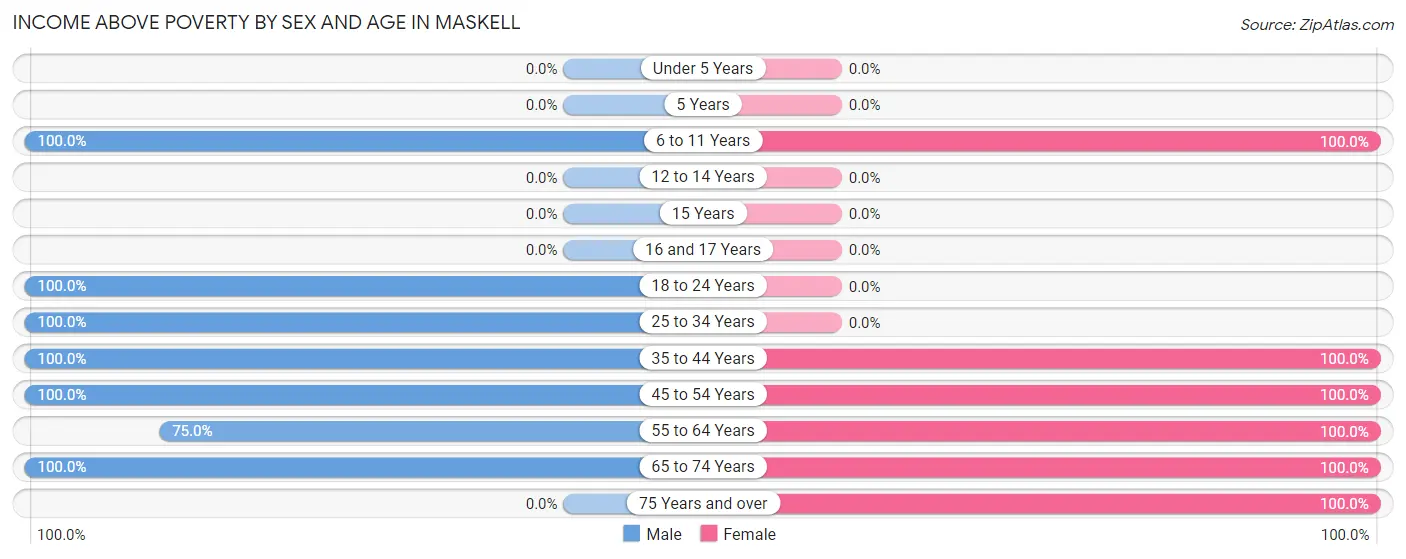
| Age Bracket | Male | Female |
| Under 5 Years | 0 (0.0%) | 0 (0.0%) |
| 5 Years | 0 (0.0%) | 0 (0.0%) |
| 6 to 11 Years | 2 (100.0%) | 2 (100.0%) |
| 12 to 14 Years | 0 (0.0%) | 0 (0.0%) |
| 15 Years | 0 (0.0%) | 0 (0.0%) |
| 16 and 17 Years | 0 (0.0%) | 0 (0.0%) |
| 18 to 24 Years | 11 (100.0%) | 0 (0.0%) |
| 25 to 34 Years | 3 (100.0%) | 0 (0.0%) |
| 35 to 44 Years | 1 (100.0%) | 1 (100.0%) |
| 45 to 54 Years | 2 (100.0%) | 7 (100.0%) |
| 55 to 64 Years | 3 (75.0%) | 7 (100.0%) |
| 65 to 74 Years | 10 (100.0%) | 8 (100.0%) |
| 75 Years and over | 0 (0.0%) | 2 (100.0%) |
| Total | 32 (97.0%) | 27 (96.4%) |
Income Below Poverty Among Married-Couple Families in Maskell
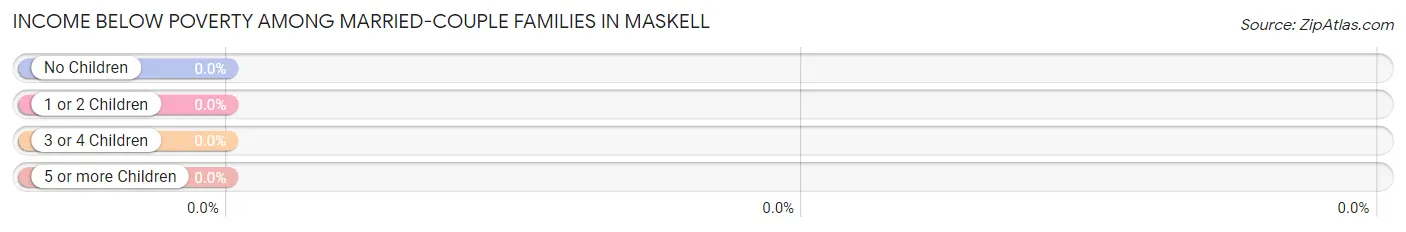
| Children | Above Poverty | Below Poverty |
| No Children | 14 (100.0%) | 0 (0.0%) |
| 1 or 2 Children | 1 (100.0%) | 0 (0.0%) |
| 3 or 4 Children | 0 (0.0%) | 0 (0.0%) |
| 5 or more Children | 0 (0.0%) | 0 (0.0%) |
| Total | 15 (100.0%) | 0 (0.0%) |
Income Below Poverty Among Single-Parent Households in Maskell
| Children | Single Father | Single Mother |
| No Children | 0 (0.0%) | 0 (0.0%) |
| 1 or 2 Children | 0 (0.0%) | 0 (0.0%) |
| 3 or 4 Children | 0 (0.0%) | 0 (0.0%) |
| 5 or more Children | 0 (0.0%) | 0 (0.0%) |
| Total | 0 (0.0%) | 0 (0.0%) |
Income Below Poverty Among Married-Couple vs Single-Parent Households in Maskell
| Children | Married-Couple Families | Single-Parent Households |
| No Children | 0 (0.0%) | 0 (0.0%) |
| 1 or 2 Children | 0 (0.0%) | 0 (0.0%) |
| 3 or 4 Children | 0 (0.0%) | 0 (0.0%) |
| 5 or more Children | 0 (0.0%) | 0 (0.0%) |
| Total | 0 (0.0%) | 0 (0.0%) |
Race in Maskell
The most populous races in Maskell are , and White / Caucasian (62 | 100.0%).
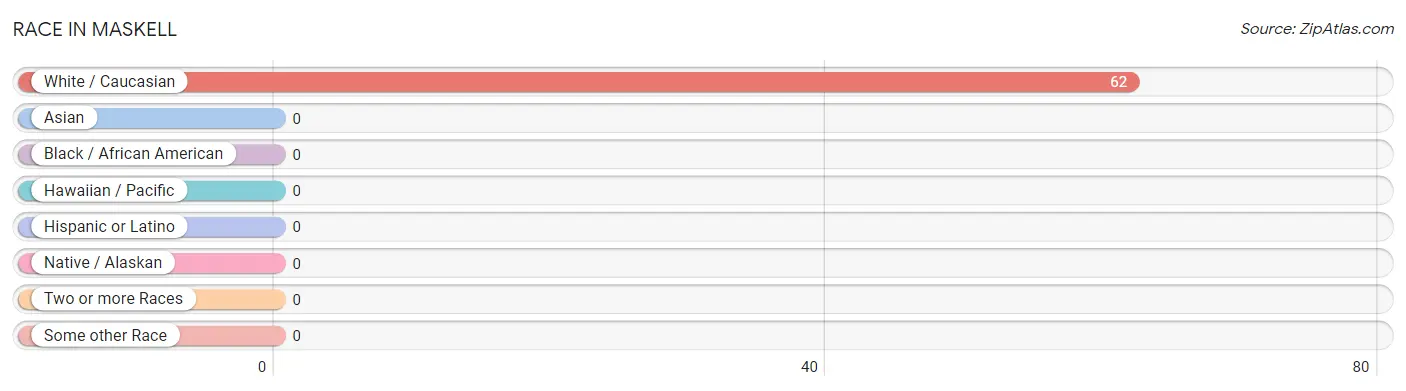
| Race | # Population | % Population |
| Asian | 0 | 0.0% |
| Black / African American | 0 | 0.0% |
| Hawaiian / Pacific | 0 | 0.0% |
| Hispanic or Latino | 0 | 0.0% |
| Native / Alaskan | 0 | 0.0% |
| White / Caucasian | 62 | 100.0% |
| Two or more Races | 0 | 0.0% |
| Some other Race | 0 | 0.0% |
| Total | 62 | 100.0% |
Ancestry in Maskell
The most populous ancestries reported in Maskell are German (21 | 33.9%), Irish (17 | 27.4%), Italian (13 | 21.0%), Norwegian (11 | 17.7%), and Swedish (6 | 9.7%), together accounting for 109.7% of all Maskell residents.
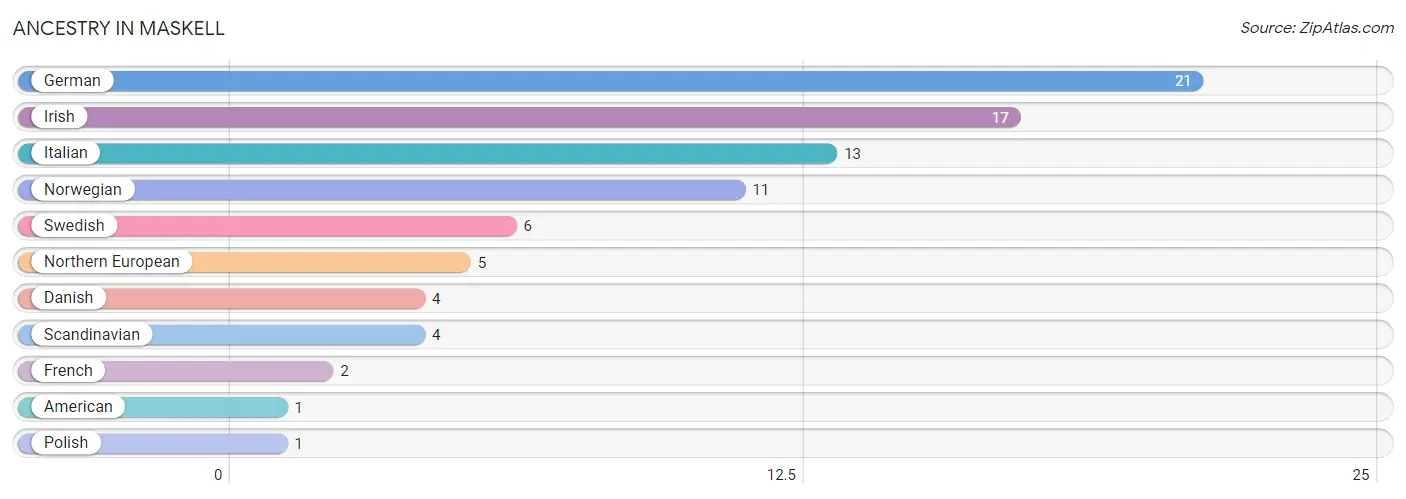
| Ancestry | # Population | % Population |
| American | 1 | 1.6% |
| Danish | 4 | 6.5% |
| French | 2 | 3.2% |
| German | 21 | 33.9% |
| Irish | 17 | 27.4% |
| Italian | 13 | 21.0% |
| Northern European | 5 | 8.1% |
| Norwegian | 11 | 17.7% |
| Polish | 1 | 1.6% |
| Scandinavian | 4 | 6.5% |
| Swedish | 6 | 9.7% | View All 11 Rows |
Immigrants in Maskell
The most numerous immigrant groups reported in Maskell came from Europe (1 | 1.6%), Germany (1 | 1.6%), and Western Europe (1 | 1.6%), together accounting for 4.8% of all Maskell residents.
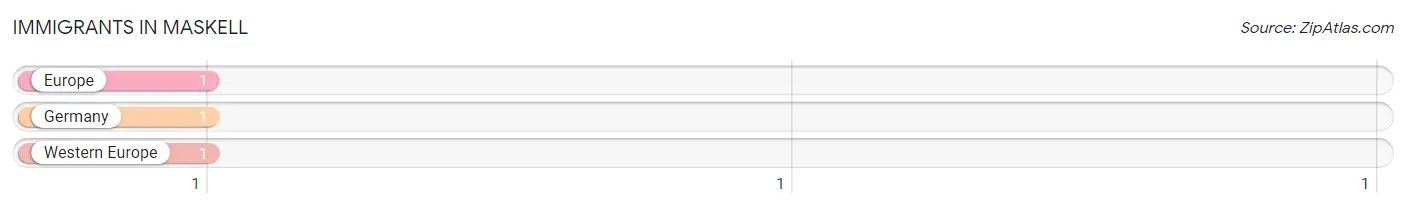
| Immigration Origin | # Population | % Population |
| Europe | 1 | 1.6% |
| Germany | 1 | 1.6% |
| Western Europe | 1 | 1.6% | View All 3 Rows |
Sex and Age in Maskell
Sex and Age in Maskell
The most populous age groups in Maskell are 15 to 19 Years (11 | 33.3%) for men and 55 to 59 Years (6 | 20.7%) for women.
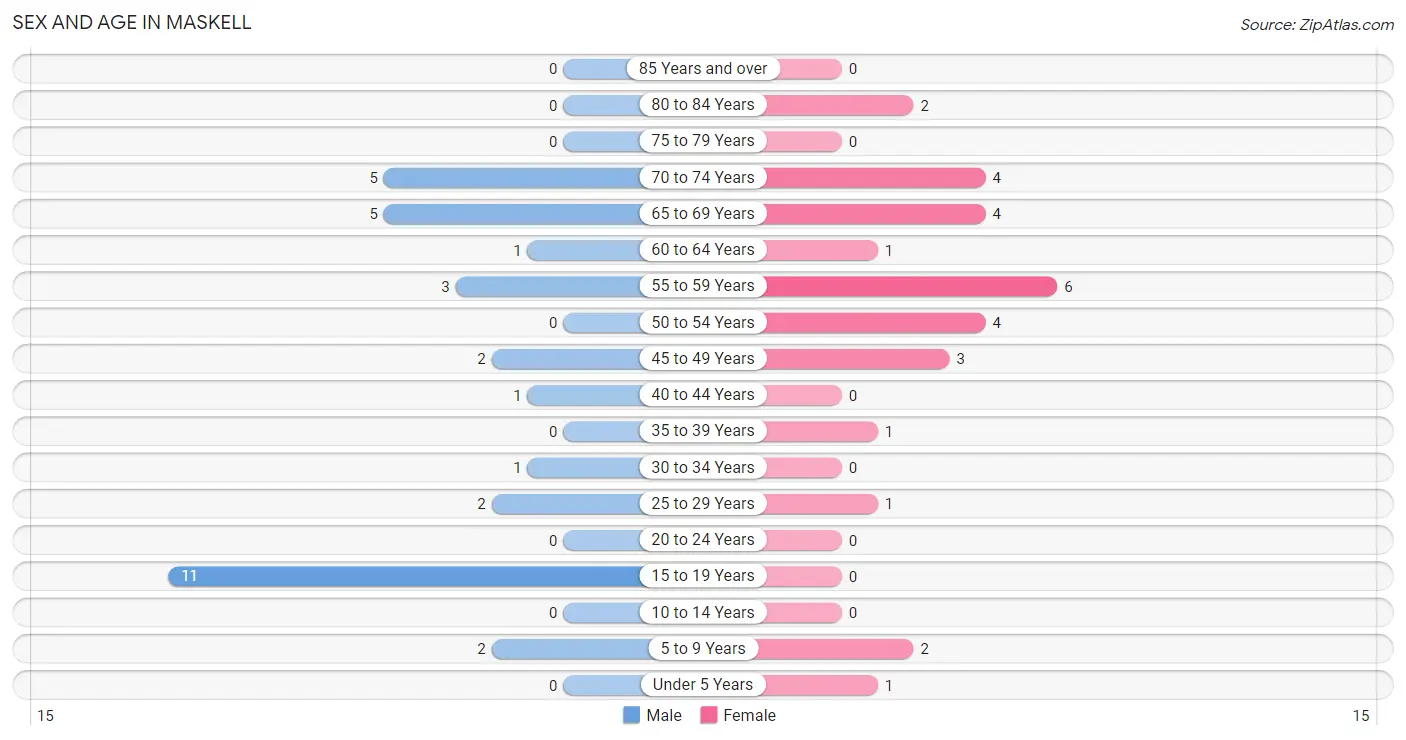
| Age Bracket | Male | Female |
| Under 5 Years | 0 (0.0%) | 1 (3.5%) |
| 5 to 9 Years | 2 (6.1%) | 2 (6.9%) |
| 10 to 14 Years | 0 (0.0%) | 0 (0.0%) |
| 15 to 19 Years | 11 (33.3%) | 0 (0.0%) |
| 20 to 24 Years | 0 (0.0%) | 0 (0.0%) |
| 25 to 29 Years | 2 (6.1%) | 1 (3.5%) |
| 30 to 34 Years | 1 (3.0%) | 0 (0.0%) |
| 35 to 39 Years | 0 (0.0%) | 1 (3.5%) |
| 40 to 44 Years | 1 (3.0%) | 0 (0.0%) |
| 45 to 49 Years | 2 (6.1%) | 3 (10.3%) |
| 50 to 54 Years | 0 (0.0%) | 4 (13.8%) |
| 55 to 59 Years | 3 (9.1%) | 6 (20.7%) |
| 60 to 64 Years | 1 (3.0%) | 1 (3.5%) |
| 65 to 69 Years | 5 (15.1%) | 4 (13.8%) |
| 70 to 74 Years | 5 (15.1%) | 4 (13.8%) |
| 75 to 79 Years | 0 (0.0%) | 0 (0.0%) |
| 80 to 84 Years | 0 (0.0%) | 2 (6.9%) |
| 85 Years and over | 0 (0.0%) | 0 (0.0%) |
| Total | 33 (100.0%) | 29 (100.0%) |
Families and Households in Maskell
Median Family Size in Maskell
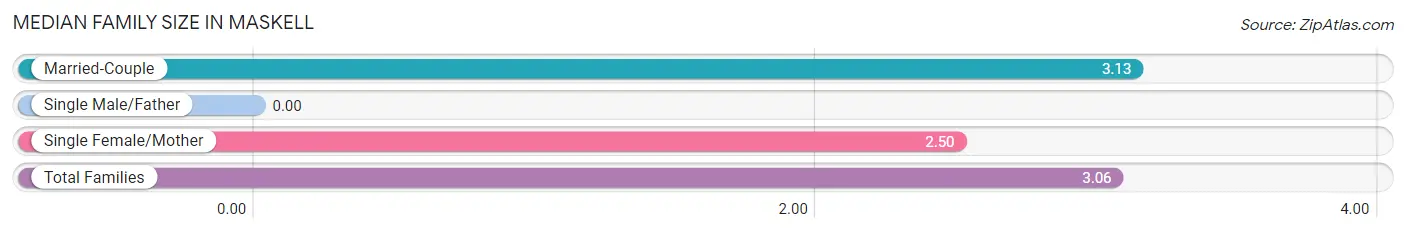
| Family Type | # Families | Family Size |
| Married-Couple | 15 (88.2%) | 3.13 |
| Single Male/Father | 0 (0.0%) | - |
| Single Female/Mother | 2 (11.8%) | 2.50 |
| Total Families | 17 (100.0%) | 3.06 |
Median Household Size in Maskell
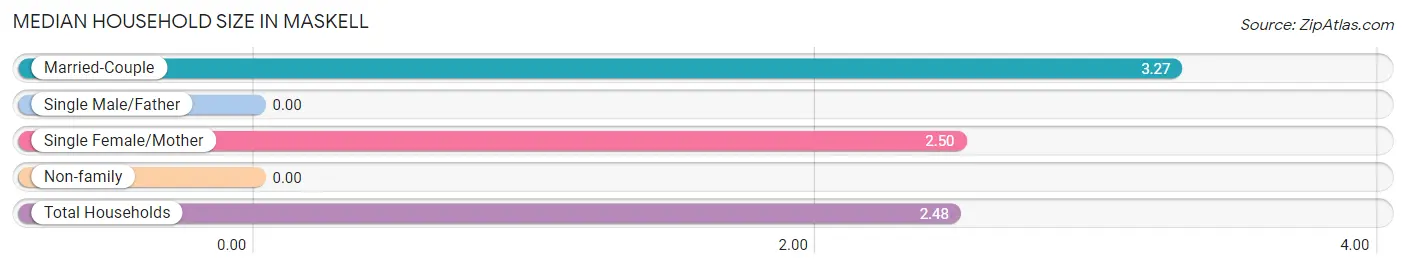
| Household Type | # Households | Household Size |
| Married-Couple | 15 (60.0%) | 3.27 |
| Single Male/Father | 0 (0.0%) | - |
| Single Female/Mother | 2 (8.0%) | 2.50 |
| Non-family | 8 (32.0%) | - |
| Total Households | 25 (100.0%) | 2.48 |
Household Size by Marriage Status in Maskell
Out of a total of 25 households in Maskell, 17 (68.0%) are family households, while 8 (32.0%) are nonfamily households. The most numerous type of family households are 2-person households, comprising 11, and the most common type of nonfamily households are 1-person households, comprising 8.
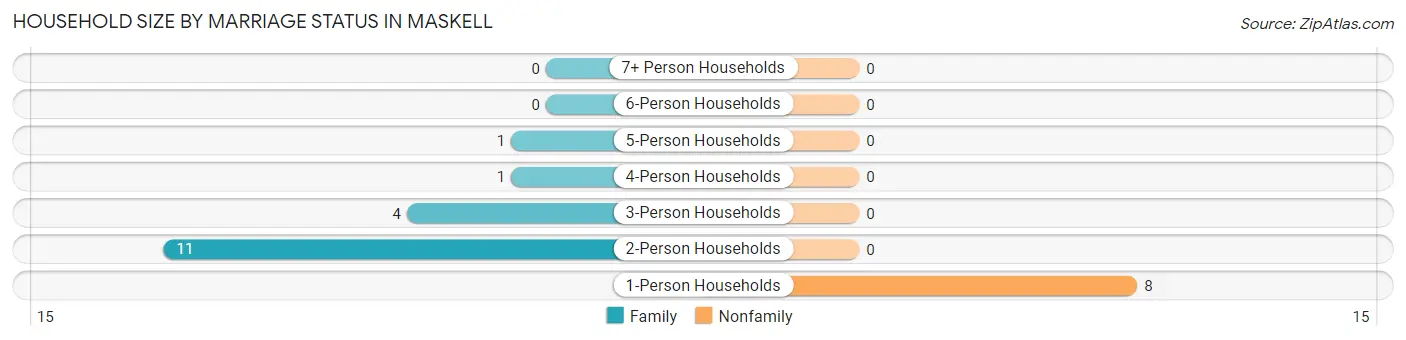
| Household Size | Family Households | Nonfamily Households |
| 1-Person Households | - | 8 (32.0%) |
| 2-Person Households | 11 (44.0%) | 0 (0.0%) |
| 3-Person Households | 4 (16.0%) | 0 (0.0%) |
| 4-Person Households | 1 (4.0%) | 0 (0.0%) |
| 5-Person Households | 1 (4.0%) | 0 (0.0%) |
| 6-Person Households | 0 (0.0%) | 0 (0.0%) |
| 7+ Person Households | 0 (0.0%) | 0 (0.0%) |
| Total | 17 (68.0%) | 8 (32.0%) |
Female Fertility in Maskell
Fertility by Age in Maskell
| Age Bracket | Women with Births | Births / 1,000 Women |
| 15 to 19 years | 0 (0.0%) | 0.0 |
| 20 to 34 years | 0 (0.0%) | 0.0 |
| 35 to 50 years | 0 (0.0%) | 0.0 |
| Total | 0 (0.0%) | 0.0 |
Fertility by Age by Marriage Status in Maskell
| Age Bracket | Married | Unmarried |
| 15 to 19 years | 0 (0.0%) | 0 (0.0%) |
| 20 to 34 years | 0 (0.0%) | 0 (0.0%) |
| 35 to 50 years | 0 (0.0%) | 0 (0.0%) |
| Total | 0 (0.0%) | 0 (0.0%) |
Fertility by Education in Maskell
| Educational Attainment | Women with Births | Births / 1,000 Women |
| Less than High School | 0 (0.0%) | 0.0 |
| High School Diploma | 0 (0.0%) | 0.0 |
| College or Associate's Degree | 0 (0.0%) | 0.0 |
| Bachelor's Degree | 0 (0.0%) | 0.0 |
| Graduate Degree | 0 (0.0%) | 0.0 |
| Total | 0 (0.0%) | 0.0 |
Fertility by Education by Marriage Status in Maskell
| Educational Attainment | Married | Unmarried |
| Less than High School | 0 (0.0%) | 0 (0.0%) |
| High School Diploma | 0 (0.0%) | 0 (0.0%) |
| College or Associate's Degree | 0 (0.0%) | 0 (0.0%) |
| Bachelor's Degree | 0 (0.0%) | 0 (0.0%) |
| Graduate Degree | 0 (0.0%) | 0 (0.0%) |
| Total | 0 (0.0%) | 0 (0.0%) |
Employment Characteristics in Maskell
Employment by Class of Employer in Maskell
Among the 22 employed individuals in Maskell, private company employees (14 | 63.6%), self-employed (not incorporated) (3 | 13.6%), and not-for-profit organizations (2 | 9.1%) make up the most common classes of employment.
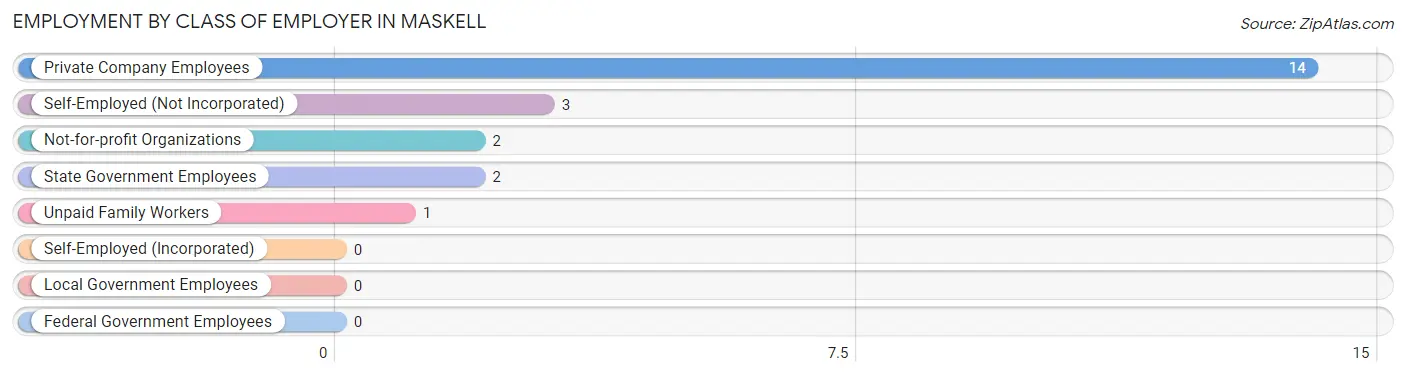
| Employer Class | # Employees | % Employees |
| Private Company Employees | 14 | 63.6% |
| Self-Employed (Incorporated) | 0 | 0.0% |
| Self-Employed (Not Incorporated) | 3 | 13.6% |
| Not-for-profit Organizations | 2 | 9.1% |
| Local Government Employees | 0 | 0.0% |
| State Government Employees | 2 | 9.1% |
| Federal Government Employees | 0 | 0.0% |
| Unpaid Family Workers | 1 | 4.5% |
| Total | 22 | 100.0% |
Employment Status by Age in Maskell
According to the labor force statistics for Maskell, out of the total population over 16 years of age (57), 40.4% or 23 individuals are in the labor force, with 4.3% or 1 of them unemployed. The age group with the highest labor force participation rate is 30 to 34 years, with 100.0% or 1 individuals in the labor force. Within the labor force, the 45 to 54 years age range has the highest percentage of unemployed individuals, with 11.1% or 1 of them being unemployed.
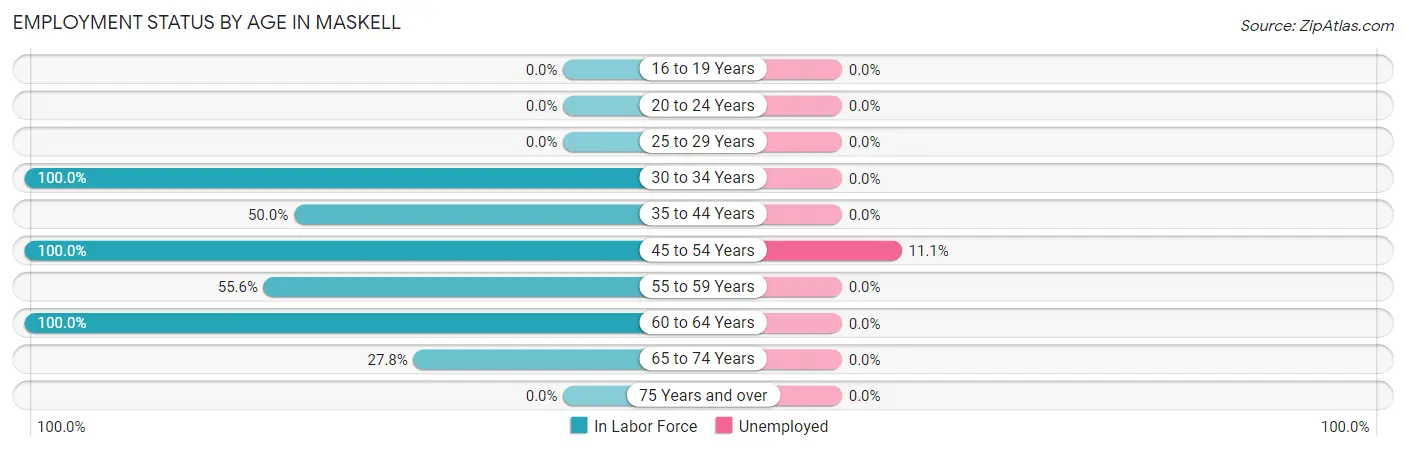
| Age Bracket | In Labor Force | Unemployed |
| 16 to 19 Years | 0 (0.0%) | 0 (0.0%) |
| 20 to 24 Years | 0 (0.0%) | 0 (0.0%) |
| 25 to 29 Years | 0 (0.0%) | 0 (0.0%) |
| 30 to 34 Years | 1 (100.0%) | 0 (0.0%) |
| 35 to 44 Years | 1 (50.0%) | 0 (0.0%) |
| 45 to 54 Years | 9 (100.0%) | 1 (11.1%) |
| 55 to 59 Years | 5 (55.6%) | 0 (0.0%) |
| 60 to 64 Years | 2 (100.0%) | 0 (0.0%) |
| 65 to 74 Years | 5 (27.8%) | 0 (0.0%) |
| 75 Years and over | 0 (0.0%) | 0 (0.0%) |
| Total | 23 (40.4%) | 1 (4.3%) |
Employment Status by Educational Attainment in Maskell
According to labor force statistics for Maskell, 69.2% of individuals (18) out of the total population between 25 and 64 years of age (26) are in the labor force, with 5.6% or 1 of them being unemployed. The group with the highest labor force participation rate are those with the educational attainment of bachelor's degree or higher, with 100.0% or 1 individuals in the labor force. Within the labor force, individuals with college / associate degree education have the highest percentage of unemployment, with 8.3% or 1 of them being unemployed.
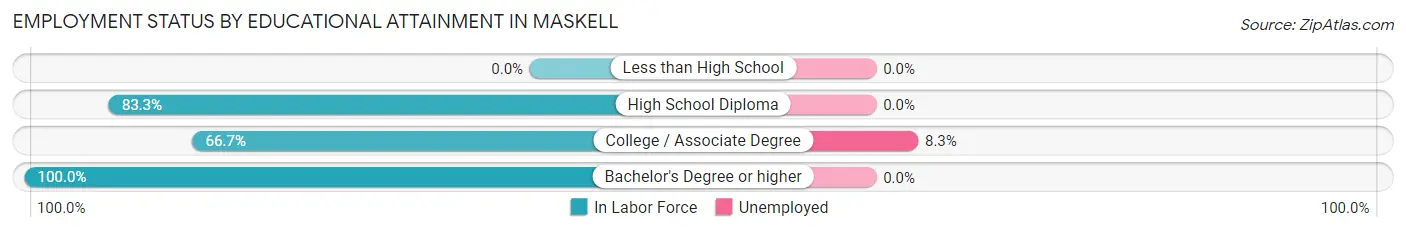
| Educational Attainment | In Labor Force | Unemployed |
| Less than High School | 0 (0.0%) | 0 (0.0%) |
| High School Diploma | 5 (83.3%) | 0 (0.0%) |
| College / Associate Degree | 12 (66.7%) | 1 (8.3%) |
| Bachelor's Degree or higher | 1 (100.0%) | 0 (0.0%) |
| Total | 18 (69.2%) | 1 (5.6%) |
Employment Occupations by Sex in Maskell
Management, Business, Science and Arts Occupations
The most common Management, Business, Science and Arts occupations in Maskell are , and Management (4 | 18.2%).
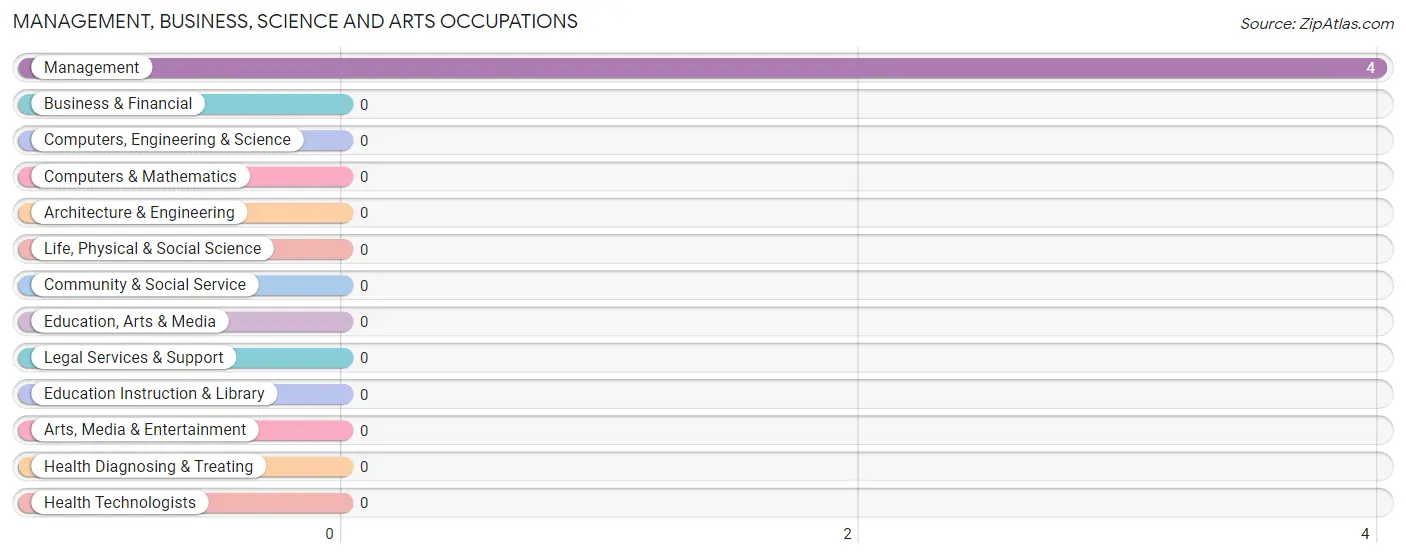
Management, Business, Science and Arts Occupations by Sex
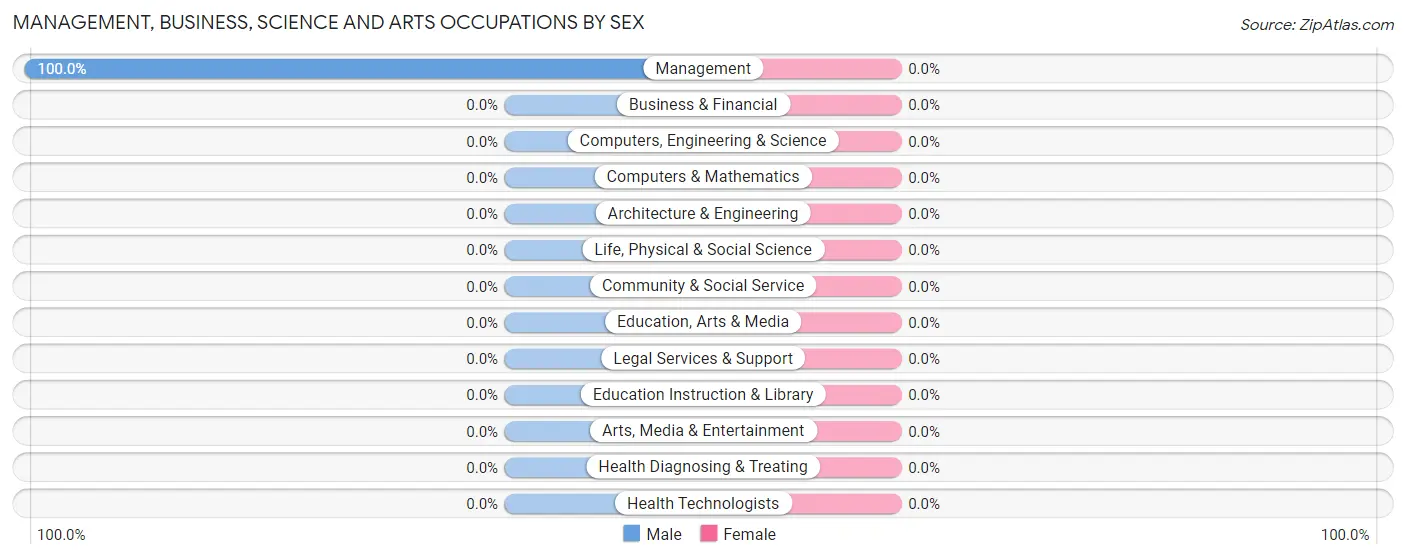
| Occupation | Male | Female |
| Management | 4 (100.0%) | 0 (0.0%) |
| Business & Financial | 0 (0.0%) | 0 (0.0%) |
| Computers, Engineering & Science | 0 (0.0%) | 0 (0.0%) |
| Computers & Mathematics | 0 (0.0%) | 0 (0.0%) |
| Architecture & Engineering | 0 (0.0%) | 0 (0.0%) |
| Life, Physical & Social Science | 0 (0.0%) | 0 (0.0%) |
| Community & Social Service | 0 (0.0%) | 0 (0.0%) |
| Education, Arts & Media | 0 (0.0%) | 0 (0.0%) |
| Legal Services & Support | 0 (0.0%) | 0 (0.0%) |
| Education Instruction & Library | 0 (0.0%) | 0 (0.0%) |
| Arts, Media & Entertainment | 0 (0.0%) | 0 (0.0%) |
| Health Diagnosing & Treating | 0 (0.0%) | 0 (0.0%) |
| Health Technologists | 0 (0.0%) | 0 (0.0%) |
| Total (Category) | 4 (100.0%) | 0 (0.0%) |
| Total (Overall) | 10 (45.5%) | 12 (54.5%) |
Services Occupations
The most common Services occupations in Maskell are , and Cleaning & Maintenance (3 | 13.6%).
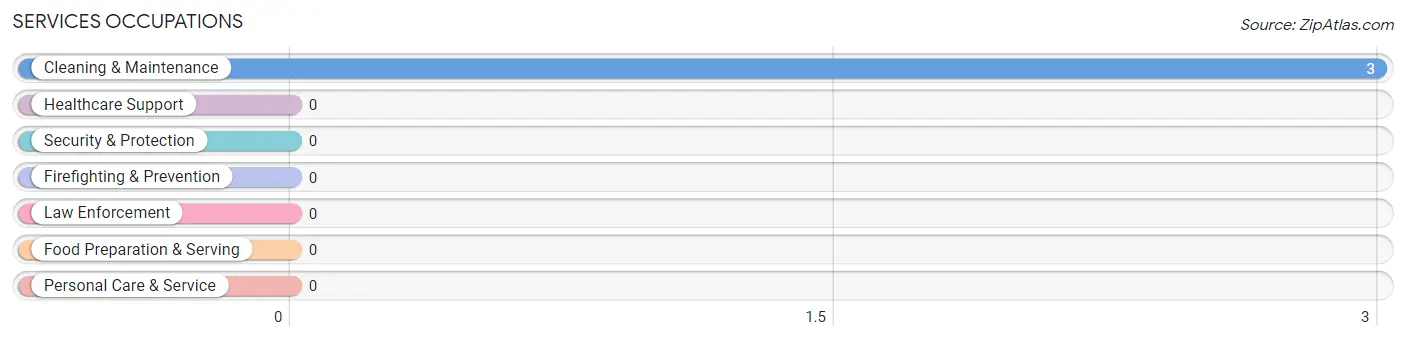
Services Occupations by Sex
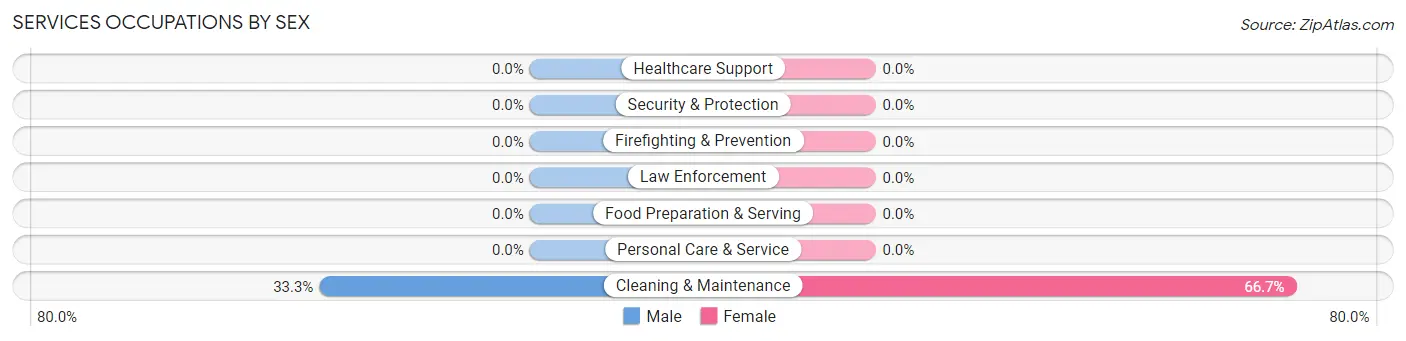
| Occupation | Male | Female |
| Healthcare Support | 0 (0.0%) | 0 (0.0%) |
| Security & Protection | 0 (0.0%) | 0 (0.0%) |
| Firefighting & Prevention | 0 (0.0%) | 0 (0.0%) |
| Law Enforcement | 0 (0.0%) | 0 (0.0%) |
| Food Preparation & Serving | 0 (0.0%) | 0 (0.0%) |
| Cleaning & Maintenance | 1 (33.3%) | 2 (66.7%) |
| Personal Care & Service | 0 (0.0%) | 0 (0.0%) |
| Total (Category) | 1 (33.3%) | 2 (66.7%) |
| Total (Overall) | 10 (45.5%) | 12 (54.5%) |
Sales and Office Occupations
The most common Sales and Office occupations in Maskell are Office & Administration (10 | 45.5%), and Sales & Related (3 | 13.6%).
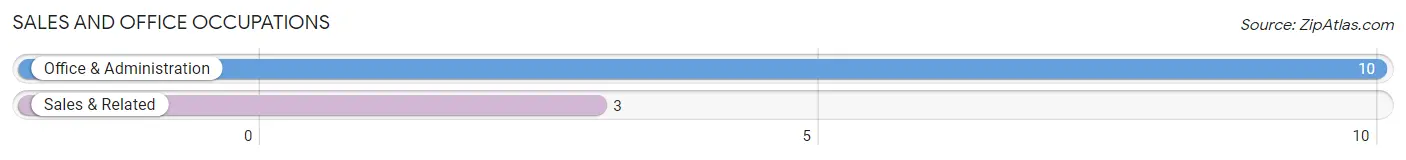
Sales and Office Occupations by Sex
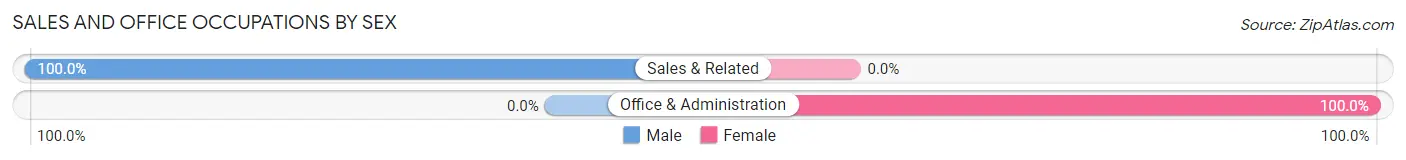
| Occupation | Male | Female |
| Sales & Related | 3 (100.0%) | 0 (0.0%) |
| Office & Administration | 0 (0.0%) | 10 (100.0%) |
| Total (Category) | 3 (23.1%) | 10 (76.9%) |
| Total (Overall) | 10 (45.5%) | 12 (54.5%) |
Natural Resources, Construction and Maintenance Occupations
The most common Natural Resources, Construction and Maintenance occupations in Maskell are , and Farming, Fishing & Forestry (1 | 4.5%).
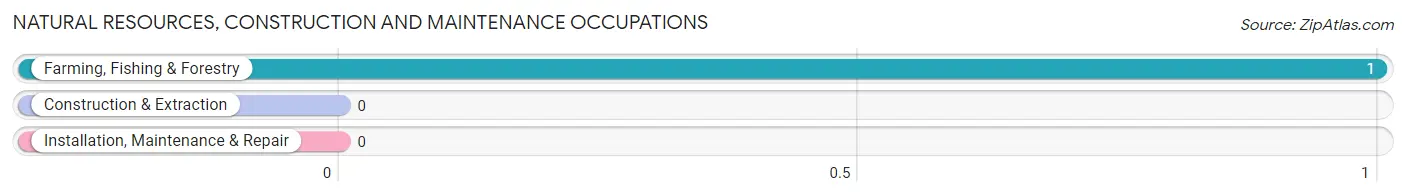
Natural Resources, Construction and Maintenance Occupations by Sex
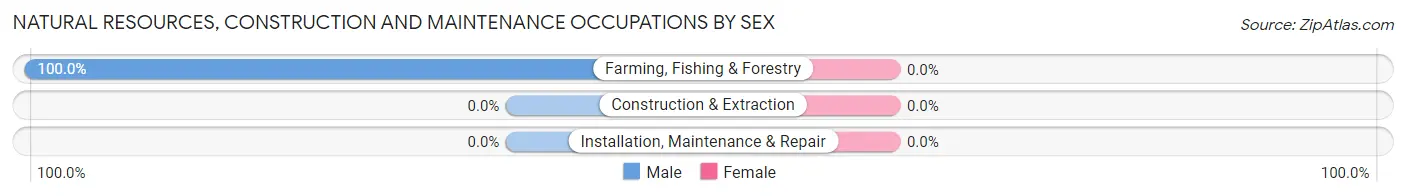
| Occupation | Male | Female |
| Farming, Fishing & Forestry | 1 (100.0%) | 0 (0.0%) |
| Construction & Extraction | 0 (0.0%) | 0 (0.0%) |
| Installation, Maintenance & Repair | 0 (0.0%) | 0 (0.0%) |
| Total (Category) | 1 (100.0%) | 0 (0.0%) |
| Total (Overall) | 10 (45.5%) | 12 (54.5%) |
Production, Transportation and Moving Occupations
The most common Production, Transportation and Moving occupations in Maskell are , and Transportation (1 | 4.5%).
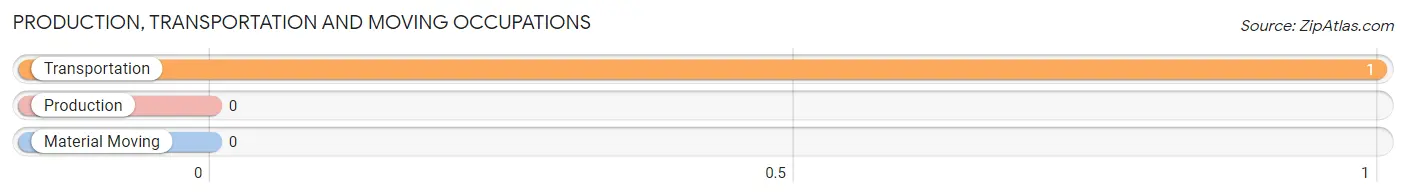
Production, Transportation and Moving Occupations by Sex
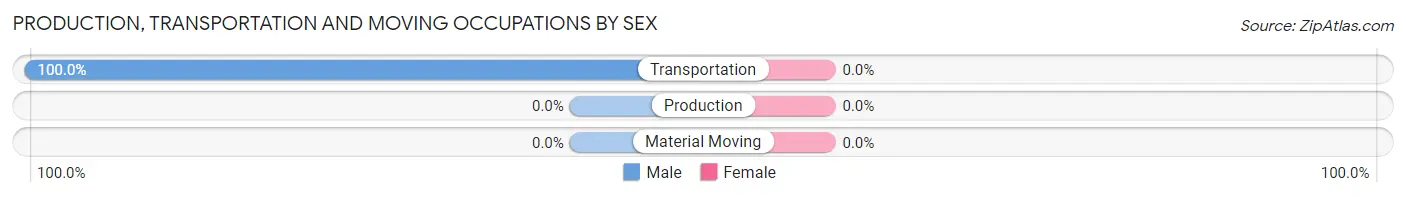
| Occupation | Male | Female |
| Production | 0 (0.0%) | 0 (0.0%) |
| Transportation | 1 (100.0%) | 0 (0.0%) |
| Material Moving | 0 (0.0%) | 0 (0.0%) |
| Total (Category) | 1 (100.0%) | 0 (0.0%) |
| Total (Overall) | 10 (45.5%) | 12 (54.5%) |
Employment Industries by Sex in Maskell
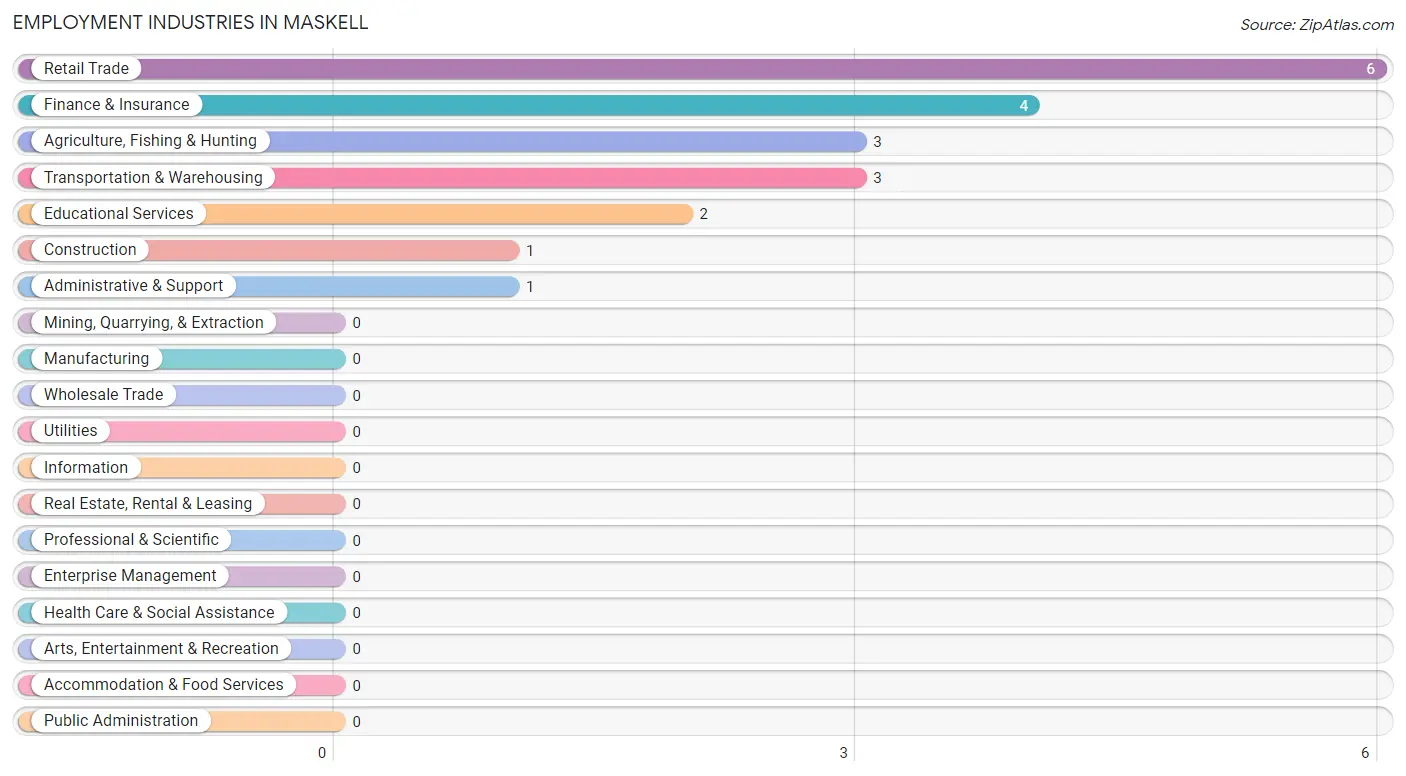
Employment Industries in Maskell
The major employment industries in Maskell include Retail Trade (6 | 27.3%), Finance & Insurance (4 | 18.2%), Agriculture, Fishing & Hunting (3 | 13.6%), Transportation & Warehousing (3 | 13.6%), and Educational Services (2 | 9.1%).
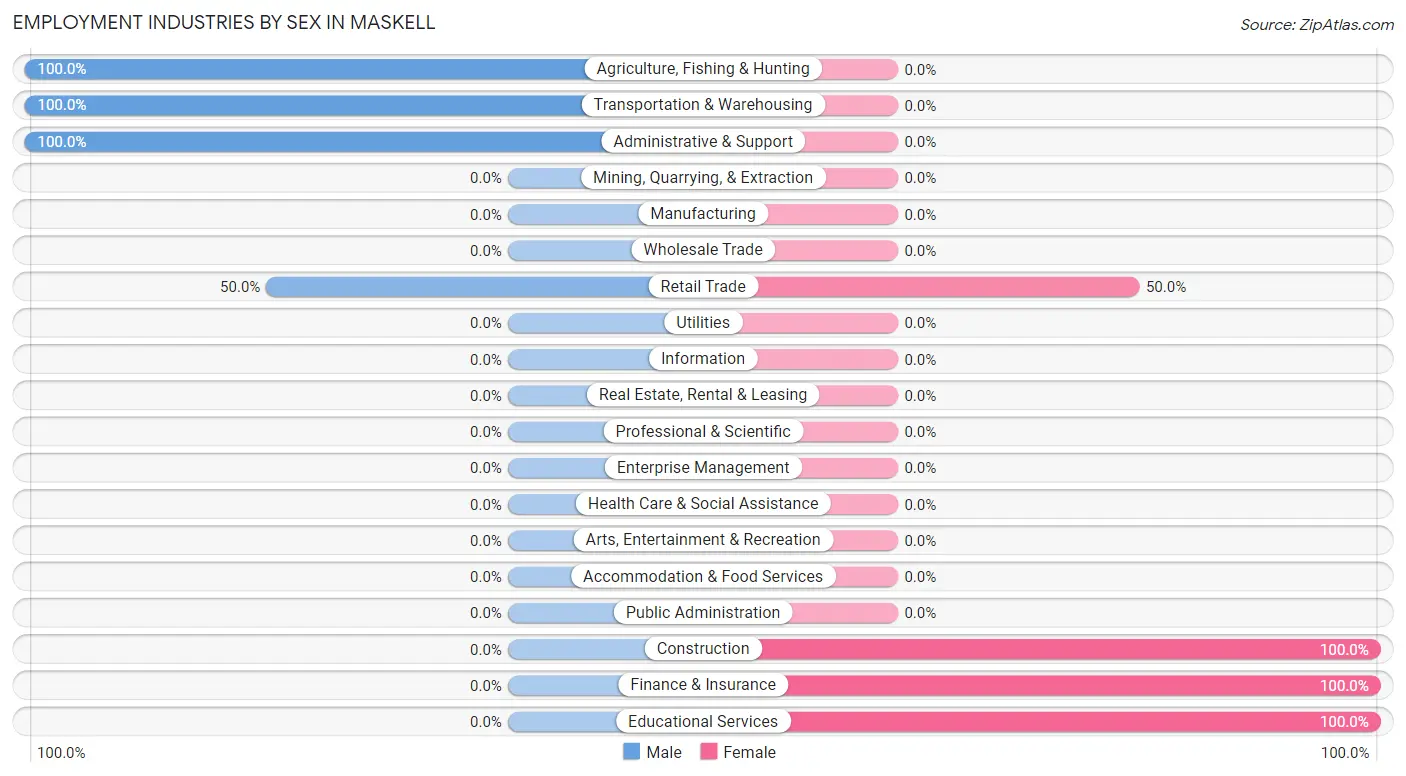
Employment Industries by Sex in Maskell
The Maskell industries that see more men than women are Agriculture, Fishing & Hunting (100.0%), Transportation & Warehousing (100.0%), and Administrative & Support (100.0%), whereas the industries that tend to have a higher number of women are Construction (100.0%), Finance & Insurance (100.0%), and Educational Services (100.0%).
| Industry | Male | Female |
| Agriculture, Fishing & Hunting | 3 (100.0%) | 0 (0.0%) |
| Mining, Quarrying, & Extraction | 0 (0.0%) | 0 (0.0%) |
| Construction | 0 (0.0%) | 1 (100.0%) |
| Manufacturing | 0 (0.0%) | 0 (0.0%) |
| Wholesale Trade | 0 (0.0%) | 0 (0.0%) |
| Retail Trade | 3 (50.0%) | 3 (50.0%) |
| Transportation & Warehousing | 3 (100.0%) | 0 (0.0%) |
| Utilities | 0 (0.0%) | 0 (0.0%) |
| Information | 0 (0.0%) | 0 (0.0%) |
| Finance & Insurance | 0 (0.0%) | 4 (100.0%) |
| Real Estate, Rental & Leasing | 0 (0.0%) | 0 (0.0%) |
| Professional & Scientific | 0 (0.0%) | 0 (0.0%) |
| Enterprise Management | 0 (0.0%) | 0 (0.0%) |
| Administrative & Support | 1 (100.0%) | 0 (0.0%) |
| Educational Services | 0 (0.0%) | 2 (100.0%) |
| Health Care & Social Assistance | 0 (0.0%) | 0 (0.0%) |
| Arts, Entertainment & Recreation | 0 (0.0%) | 0 (0.0%) |
| Accommodation & Food Services | 0 (0.0%) | 0 (0.0%) |
| Public Administration | 0 (0.0%) | 0 (0.0%) |
| Total | 10 (45.5%) | 12 (54.5%) |
Education in Maskell
School Enrollment in Maskell
The most common levels of schooling among the 16 students in Maskell are college / undergraduate (11 | 68.8%), elementary school (4 | 25.0%), and nursery / preschool (1 | 6.2%).
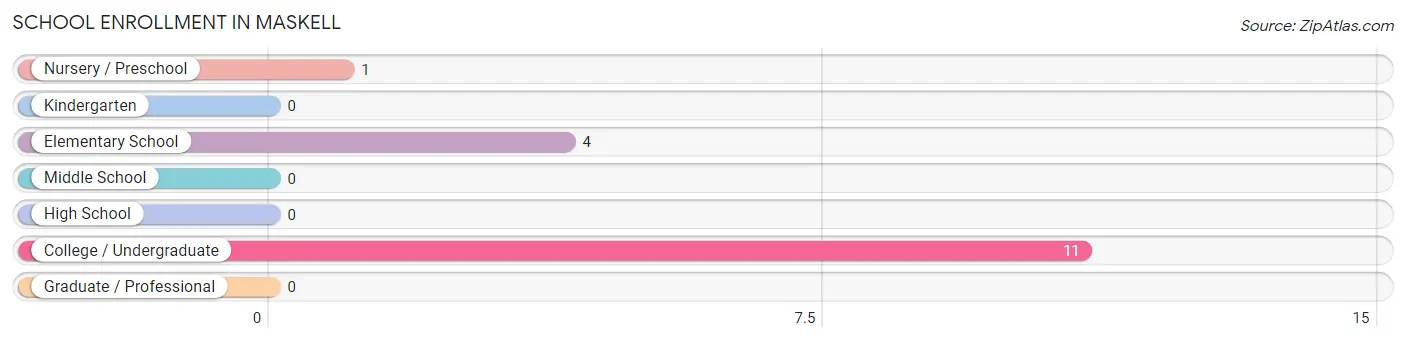
| School Level | # Students | % Students |
| Nursery / Preschool | 1 | 6.2% |
| Kindergarten | 0 | 0.0% |
| Elementary School | 4 | 25.0% |
| Middle School | 0 | 0.0% |
| High School | 0 | 0.0% |
| College / Undergraduate | 11 | 68.8% |
| Graduate / Professional | 0 | 0.0% |
| Total | 16 | 100.0% |
School Enrollment by Age by Funding Source in Maskell
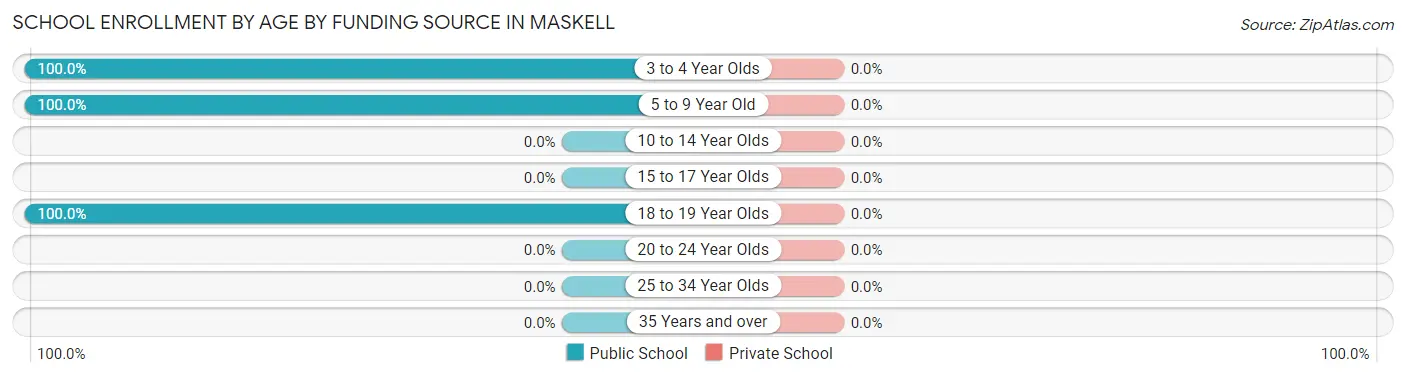
| Age Bracket | Public School | Private School |
| 3 to 4 Year Olds | 1 (100.0%) | 0 (0.0%) |
| 5 to 9 Year Old | 4 (100.0%) | 0 (0.0%) |
| 10 to 14 Year Olds | 0 (0.0%) | 0 (0.0%) |
| 15 to 17 Year Olds | 0 (0.0%) | 0 (0.0%) |
| 18 to 19 Year Olds | 11 (100.0%) | 0 (0.0%) |
| 20 to 24 Year Olds | 0 (0.0%) | 0 (0.0%) |
| 25 to 34 Year Olds | 0 (0.0%) | 0 (0.0%) |
| 35 Years and over | 0 (0.0%) | 0 (0.0%) |
| Total | 16 (100.0%) | 0 (0.0%) |
Educational Attainment by Field of Study in Maskell
, and liberal arts & history (1 | 100.0%) are the most common fields of study among 1 individuals in Maskell who have obtained a bachelor's degree or higher.
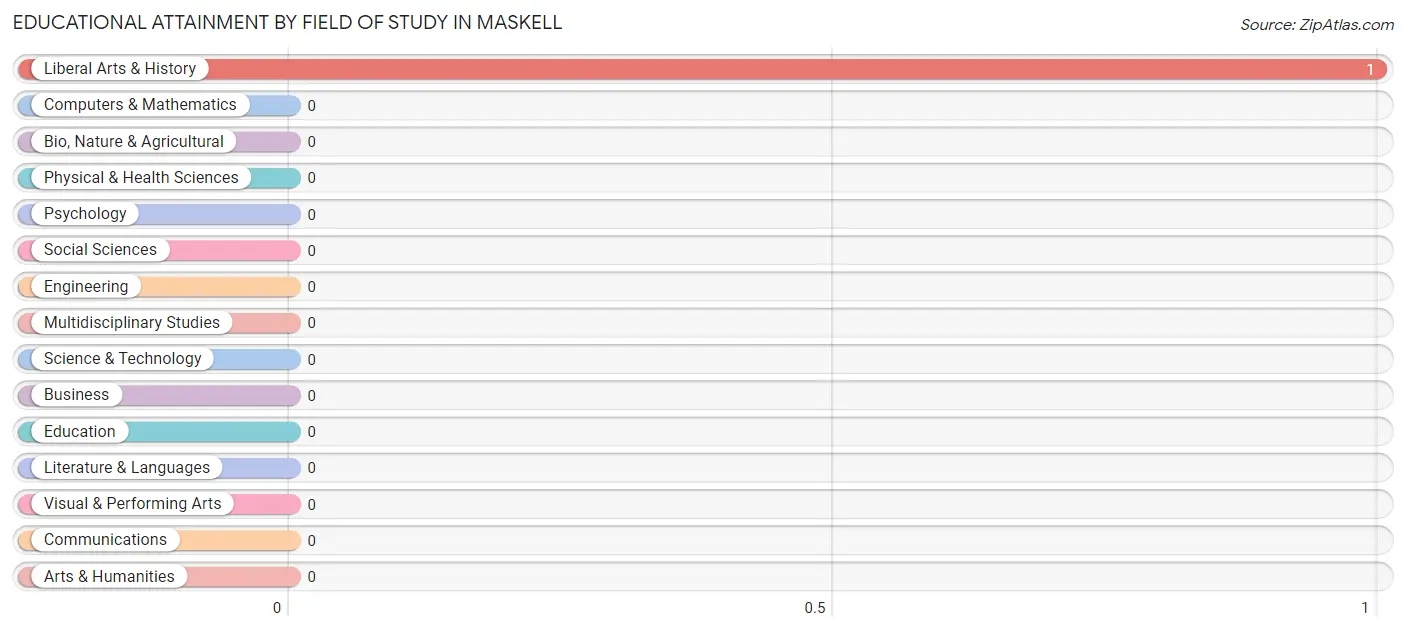
| Field of Study | # Graduates | % Graduates |
| Computers & Mathematics | 0 | 0.0% |
| Bio, Nature & Agricultural | 0 | 0.0% |
| Physical & Health Sciences | 0 | 0.0% |
| Psychology | 0 | 0.0% |
| Social Sciences | 0 | 0.0% |
| Engineering | 0 | 0.0% |
| Multidisciplinary Studies | 0 | 0.0% |
| Science & Technology | 0 | 0.0% |
| Business | 0 | 0.0% |
| Education | 0 | 0.0% |
| Literature & Languages | 0 | 0.0% |
| Liberal Arts & History | 1 | 100.0% |
| Visual & Performing Arts | 0 | 0.0% |
| Communications | 0 | 0.0% |
| Arts & Humanities | 0 | 0.0% |
| Total | 1 | 100.0% |
Transportation & Commute in Maskell
Vehicle Availability by Sex in Maskell
The most prevalent vehicle ownership categories in Maskell are males with 1 vehicle (3, accounting for 30.0%) and females with 1 vehicle (3, making up 25.0%).
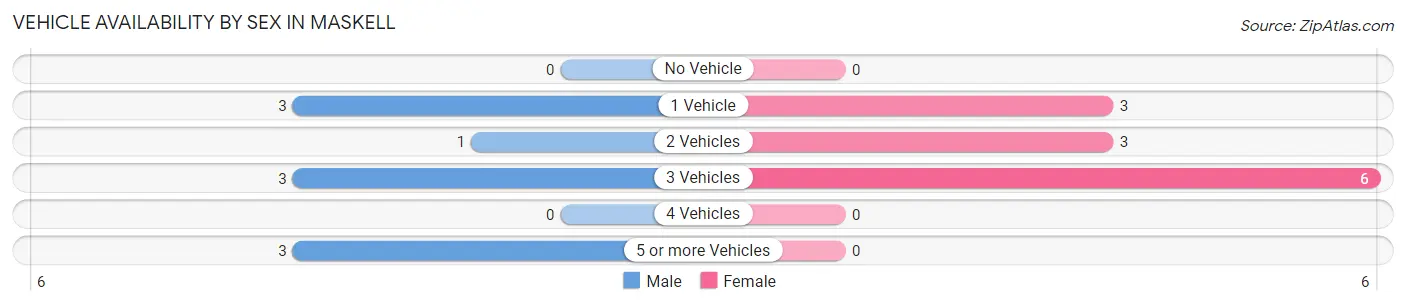
| Vehicles Available | Male | Female |
| No Vehicle | 0 (0.0%) | 0 (0.0%) |
| 1 Vehicle | 3 (30.0%) | 3 (25.0%) |
| 2 Vehicles | 1 (10.0%) | 3 (25.0%) |
| 3 Vehicles | 3 (30.0%) | 6 (50.0%) |
| 4 Vehicles | 0 (0.0%) | 0 (0.0%) |
| 5 or more Vehicles | 3 (30.0%) | 0 (0.0%) |
| Total | 10 (100.0%) | 12 (100.0%) |
Commute Time in Maskell
The most frequently occuring commute durations in Maskell are 15 to 19 minutes (6 commuters, 50.0%), 10 to 14 minutes (2 commuters, 16.7%), and 30 to 34 minutes (2 commuters, 16.7%).
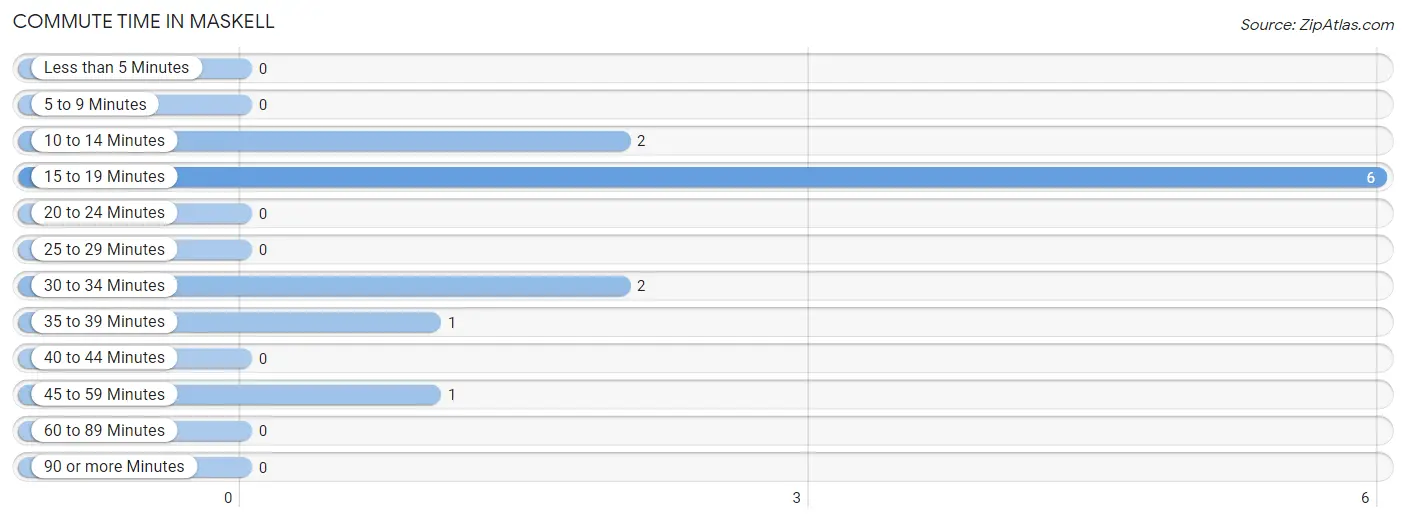
| Commute Time | # Commuters | % Commuters |
| Less than 5 Minutes | 0 | 0.0% |
| 5 to 9 Minutes | 0 | 0.0% |
| 10 to 14 Minutes | 2 | 16.7% |
| 15 to 19 Minutes | 6 | 50.0% |
| 20 to 24 Minutes | 0 | 0.0% |
| 25 to 29 Minutes | 0 | 0.0% |
| 30 to 34 Minutes | 2 | 16.7% |
| 35 to 39 Minutes | 1 | 8.3% |
| 40 to 44 Minutes | 0 | 0.0% |
| 45 to 59 Minutes | 1 | 8.3% |
| 60 to 89 Minutes | 0 | 0.0% |
| 90 or more Minutes | 0 | 0.0% |
Commute Time by Sex in Maskell
The most common commute times in Maskell are 15 to 19 minutes (3 commuters, 42.9%) for males and 15 to 19 minutes (3 commuters, 60.0%) for females.
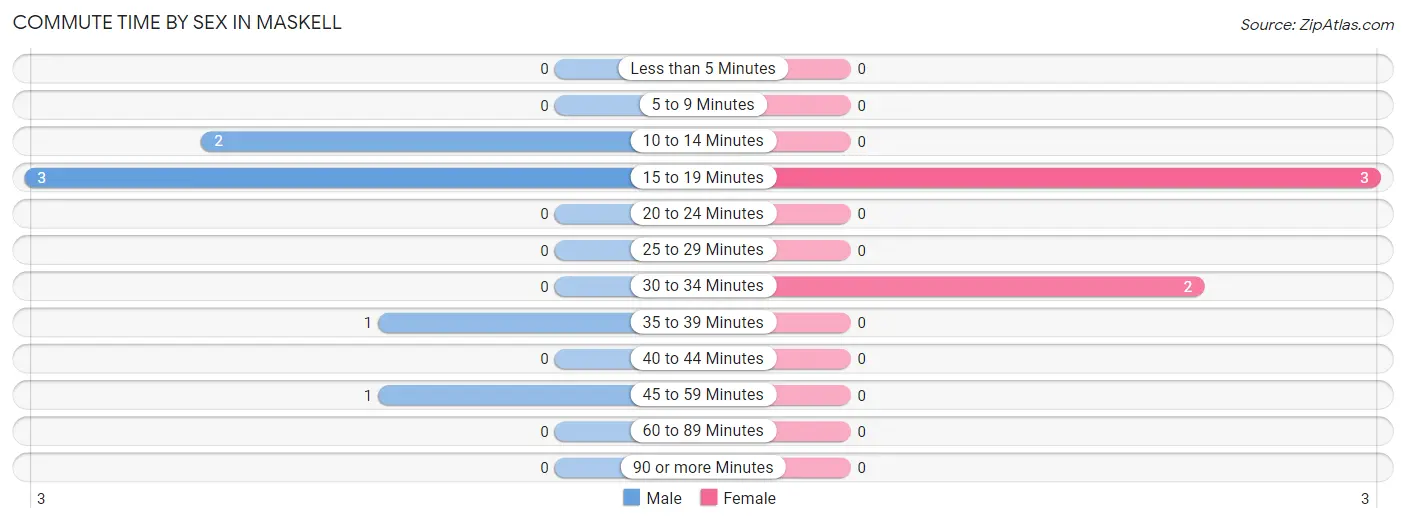
| Commute Time | Male | Female |
| Less than 5 Minutes | 0 (0.0%) | 0 (0.0%) |
| 5 to 9 Minutes | 0 (0.0%) | 0 (0.0%) |
| 10 to 14 Minutes | 2 (28.6%) | 0 (0.0%) |
| 15 to 19 Minutes | 3 (42.9%) | 3 (60.0%) |
| 20 to 24 Minutes | 0 (0.0%) | 0 (0.0%) |
| 25 to 29 Minutes | 0 (0.0%) | 0 (0.0%) |
| 30 to 34 Minutes | 0 (0.0%) | 2 (40.0%) |
| 35 to 39 Minutes | 1 (14.3%) | 0 (0.0%) |
| 40 to 44 Minutes | 0 (0.0%) | 0 (0.0%) |
| 45 to 59 Minutes | 1 (14.3%) | 0 (0.0%) |
| 60 to 89 Minutes | 0 (0.0%) | 0 (0.0%) |
| 90 or more Minutes | 0 (0.0%) | 0 (0.0%) |
Time of Departure to Work by Sex in Maskell
The most frequent times of departure to work in Maskell are 12:00 AM to 4:59 AM (3, 42.9%) for males and 7:30 AM to 7:59 AM (2, 40.0%) for females.
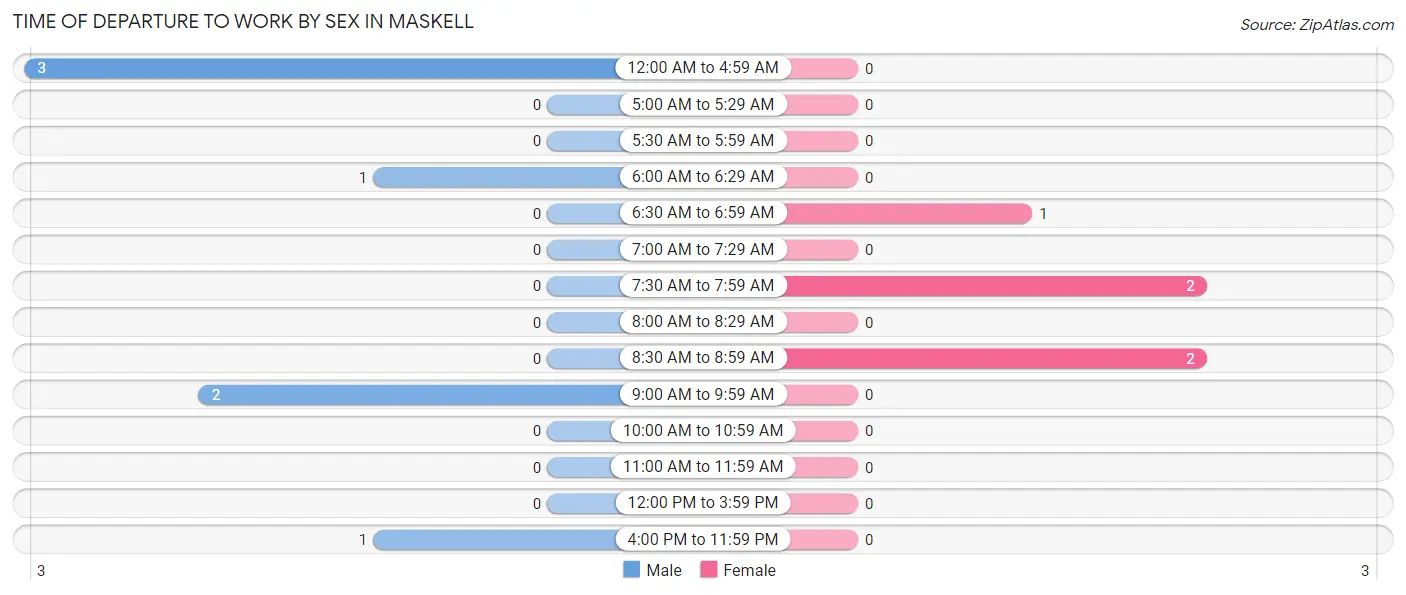
| Time of Departure | Male | Female |
| 12:00 AM to 4:59 AM | 3 (42.9%) | 0 (0.0%) |
| 5:00 AM to 5:29 AM | 0 (0.0%) | 0 (0.0%) |
| 5:30 AM to 5:59 AM | 0 (0.0%) | 0 (0.0%) |
| 6:00 AM to 6:29 AM | 1 (14.3%) | 0 (0.0%) |
| 6:30 AM to 6:59 AM | 0 (0.0%) | 1 (20.0%) |
| 7:00 AM to 7:29 AM | 0 (0.0%) | 0 (0.0%) |
| 7:30 AM to 7:59 AM | 0 (0.0%) | 2 (40.0%) |
| 8:00 AM to 8:29 AM | 0 (0.0%) | 0 (0.0%) |
| 8:30 AM to 8:59 AM | 0 (0.0%) | 2 (40.0%) |
| 9:00 AM to 9:59 AM | 2 (28.6%) | 0 (0.0%) |
| 10:00 AM to 10:59 AM | 0 (0.0%) | 0 (0.0%) |
| 11:00 AM to 11:59 AM | 0 (0.0%) | 0 (0.0%) |
| 12:00 PM to 3:59 PM | 0 (0.0%) | 0 (0.0%) |
| 4:00 PM to 11:59 PM | 1 (14.3%) | 0 (0.0%) |
| Total | 7 (100.0%) | 5 (100.0%) |
Housing Occupancy in Maskell
Occupancy by Ownership in Maskell
Of the total 25 dwellings in Maskell, owner-occupied units account for 21 (84.0%), while renter-occupied units make up 4 (16.0%).
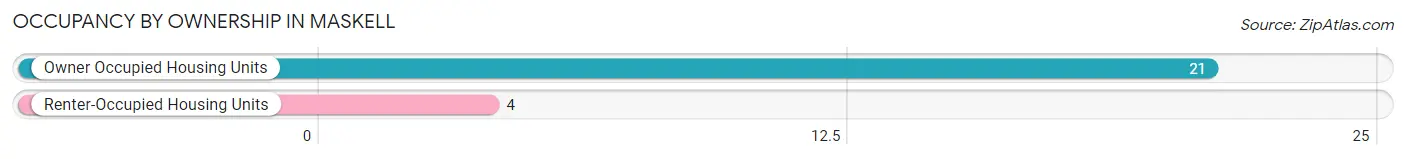
| Occupancy | # Housing Units | % Housing Units |
| Owner Occupied Housing Units | 21 | 84.0% |
| Renter-Occupied Housing Units | 4 | 16.0% |
| Total Occupied Housing Units | 25 | 100.0% |
Occupancy by Household Size in Maskell
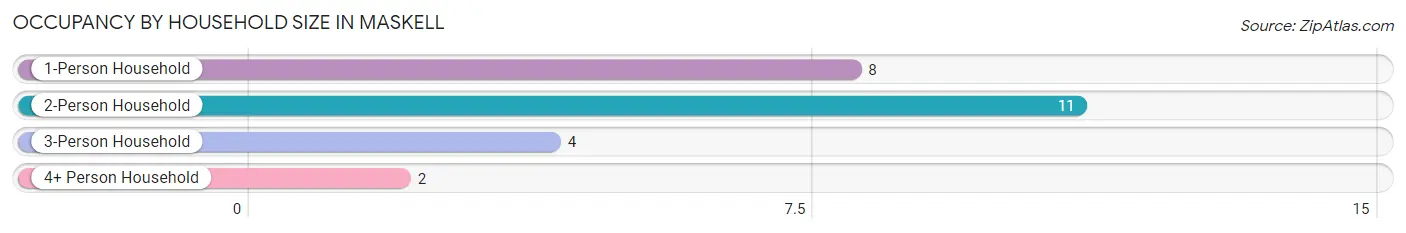
| Household Size | # Housing Units | % Housing Units |
| 1-Person Household | 8 | 32.0% |
| 2-Person Household | 11 | 44.0% |
| 3-Person Household | 4 | 16.0% |
| 4+ Person Household | 2 | 8.0% |
| Total Housing Units | 25 | 100.0% |
Occupancy by Ownership by Household Size in Maskell
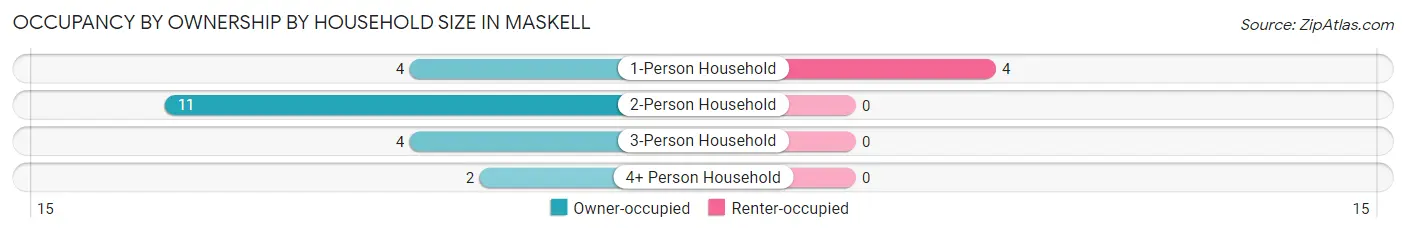
| Household Size | Owner-occupied | Renter-occupied |
| 1-Person Household | 4 (50.0%) | 4 (50.0%) |
| 2-Person Household | 11 (100.0%) | 0 (0.0%) |
| 3-Person Household | 4 (100.0%) | 0 (0.0%) |
| 4+ Person Household | 2 (100.0%) | 0 (0.0%) |
| Total Housing Units | 21 (84.0%) | 4 (16.0%) |
Occupancy by Educational Attainment in Maskell
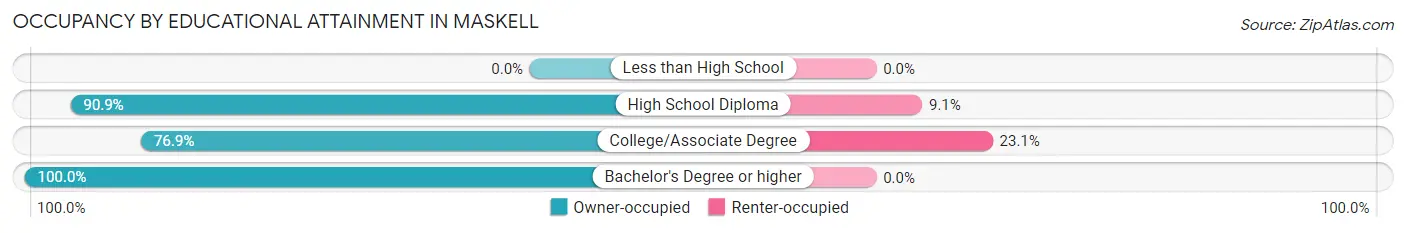
| Household Size | Owner-occupied | Renter-occupied |
| Less than High School | 0 (0.0%) | 0 (0.0%) |
| High School Diploma | 10 (90.9%) | 1 (9.1%) |
| College/Associate Degree | 10 (76.9%) | 3 (23.1%) |
| Bachelor's Degree or higher | 1 (100.0%) | 0 (0.0%) |
Occupancy by Age of Householder in Maskell
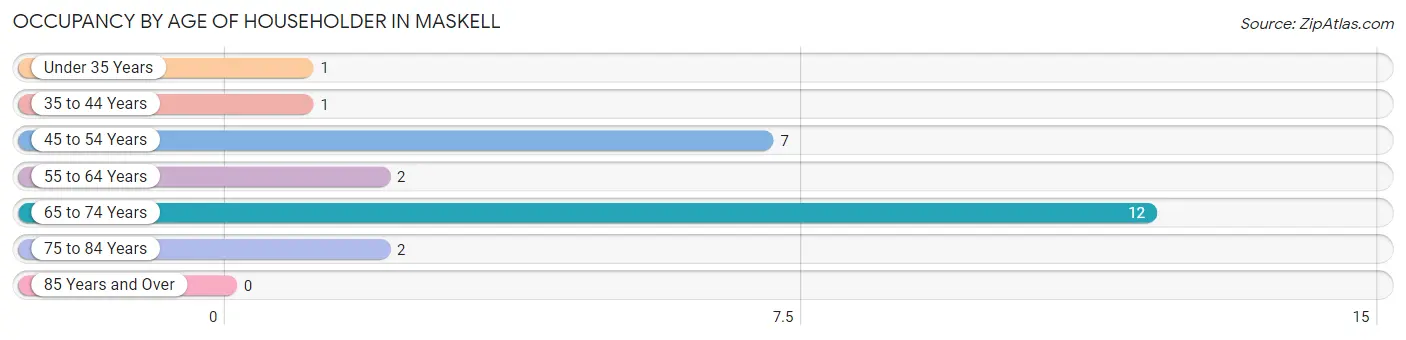
| Age Bracket | # Households | % Households |
| Under 35 Years | 1 | 4.0% |
| 35 to 44 Years | 1 | 4.0% |
| 45 to 54 Years | 7 | 28.0% |
| 55 to 64 Years | 2 | 8.0% |
| 65 to 74 Years | 12 | 48.0% |
| 75 to 84 Years | 2 | 8.0% |
| 85 Years and Over | 0 | 0.0% |
| Total | 25 | 100.0% |
Housing Finances in Maskell
Median Income by Occupancy in Maskell
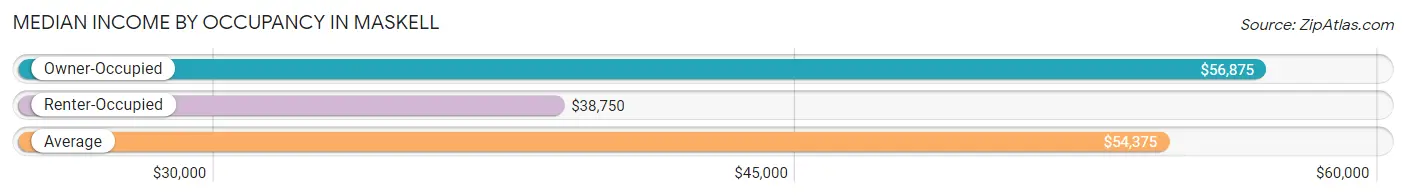
| Occupancy Type | # Households | Median Income |
| Owner-Occupied | 21 (84.0%) | $56,875 |
| Renter-Occupied | 4 (16.0%) | $38,750 |
| Average | 25 (100.0%) | $54,375 |
Occupancy by Householder Income Bracket in Maskell
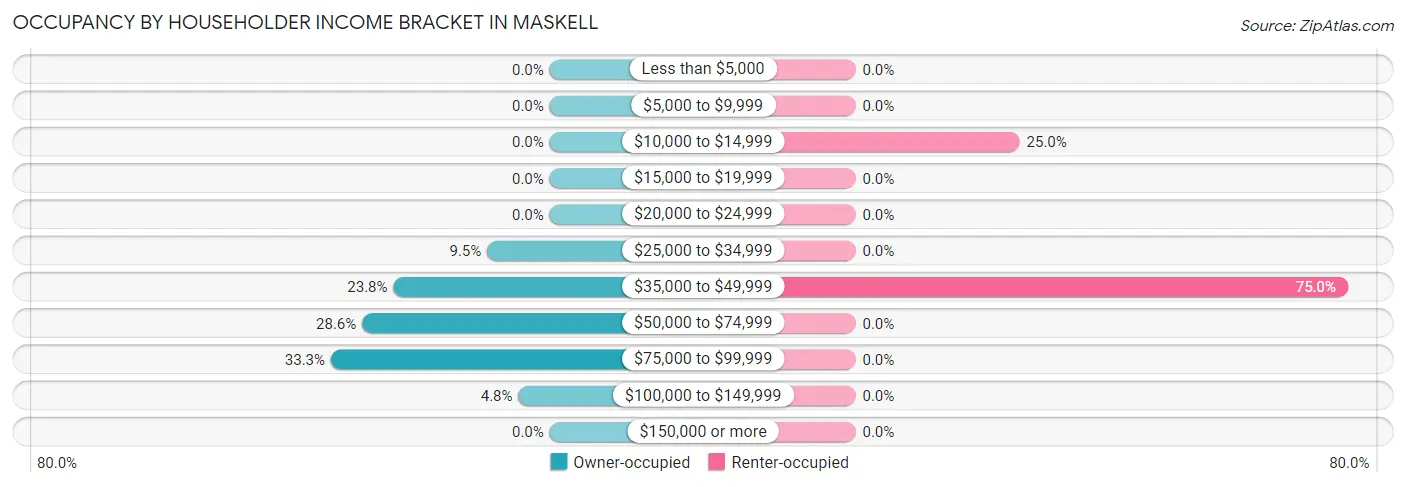
| Income Bracket | Owner-occupied | Renter-occupied |
| Less than $5,000 | 0 (0.0%) | 0 (0.0%) |
| $5,000 to $9,999 | 0 (0.0%) | 0 (0.0%) |
| $10,000 to $14,999 | 0 (0.0%) | 1 (25.0%) |
| $15,000 to $19,999 | 0 (0.0%) | 0 (0.0%) |
| $20,000 to $24,999 | 0 (0.0%) | 0 (0.0%) |
| $25,000 to $34,999 | 2 (9.5%) | 0 (0.0%) |
| $35,000 to $49,999 | 5 (23.8%) | 3 (75.0%) |
| $50,000 to $74,999 | 6 (28.6%) | 0 (0.0%) |
| $75,000 to $99,999 | 7 (33.3%) | 0 (0.0%) |
| $100,000 to $149,999 | 1 (4.8%) | 0 (0.0%) |
| $150,000 or more | 0 (0.0%) | 0 (0.0%) |
| Total | 21 (100.0%) | 4 (100.0%) |
Monthly Housing Cost Tiers in Maskell
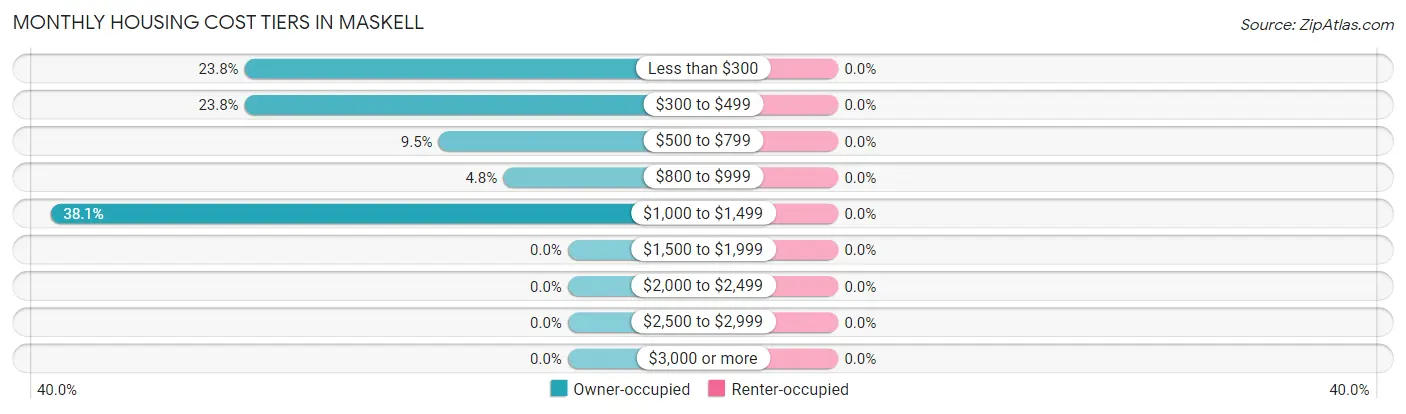
| Monthly Cost | Owner-occupied | Renter-occupied |
| Less than $300 | 5 (23.8%) | 0 (0.0%) |
| $300 to $499 | 5 (23.8%) | 0 (0.0%) |
| $500 to $799 | 2 (9.5%) | 0 (0.0%) |
| $800 to $999 | 1 (4.8%) | 0 (0.0%) |
| $1,000 to $1,499 | 8 (38.1%) | 0 (0.0%) |
| $1,500 to $1,999 | 0 (0.0%) | 0 (0.0%) |
| $2,000 to $2,499 | 0 (0.0%) | 0 (0.0%) |
| $2,500 to $2,999 | 0 (0.0%) | 0 (0.0%) |
| $3,000 or more | 0 (0.0%) | 0 (0.0%) |
| Total | 21 (100.0%) | 4 (100.0%) |
Physical Housing Characteristics in Maskell
Housing Structures in Maskell
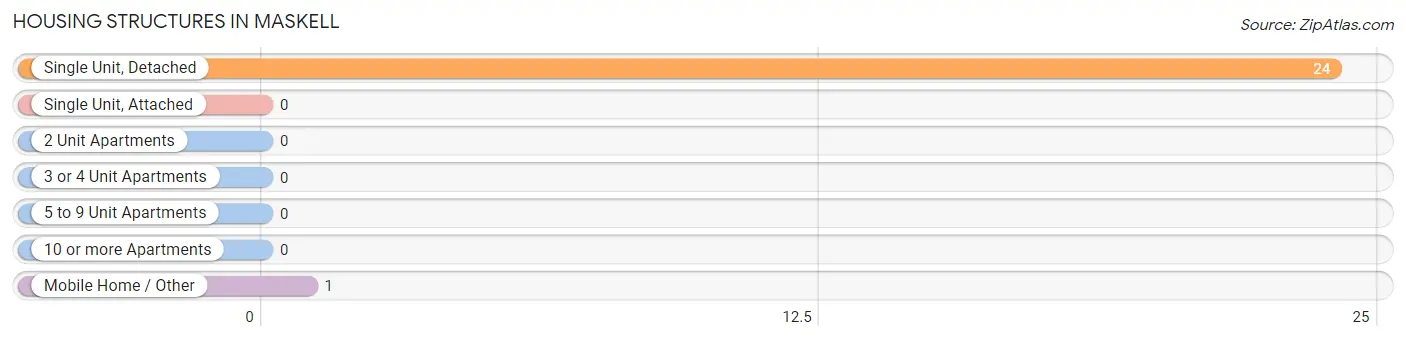
| Structure Type | # Housing Units | % Housing Units |
| Single Unit, Detached | 24 | 96.0% |
| Single Unit, Attached | 0 | 0.0% |
| 2 Unit Apartments | 0 | 0.0% |
| 3 or 4 Unit Apartments | 0 | 0.0% |
| 5 to 9 Unit Apartments | 0 | 0.0% |
| 10 or more Apartments | 0 | 0.0% |
| Mobile Home / Other | 1 | 4.0% |
| Total | 25 | 100.0% |
Housing Structures by Occupancy in Maskell

| Structure Type | Owner-occupied | Renter-occupied |
| Single Unit, Detached | 20 (83.3%) | 4 (16.7%) |
| Single Unit, Attached | 0 (0.0%) | 0 (0.0%) |
| 2 Unit Apartments | 0 (0.0%) | 0 (0.0%) |
| 3 or 4 Unit Apartments | 0 (0.0%) | 0 (0.0%) |
| 5 to 9 Unit Apartments | 0 (0.0%) | 0 (0.0%) |
| 10 or more Apartments | 0 (0.0%) | 0 (0.0%) |
| Mobile Home / Other | 1 (100.0%) | 0 (0.0%) |
| Total | 21 (84.0%) | 4 (16.0%) |
Housing Structures by Number of Rooms in Maskell
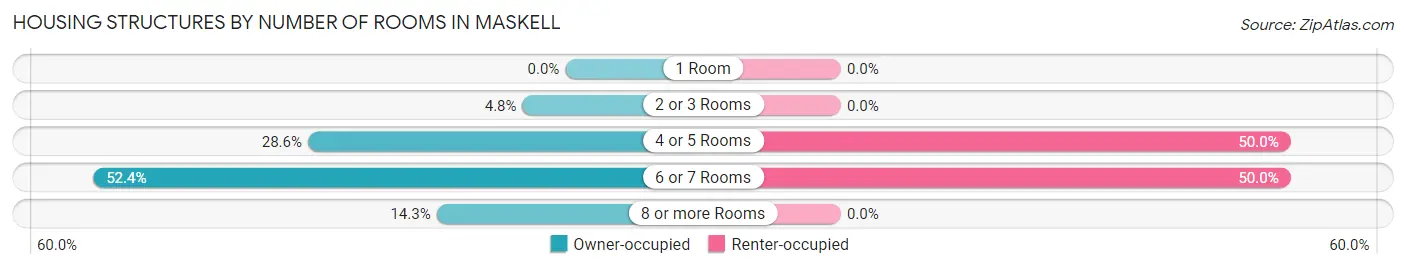
| Number of Rooms | Owner-occupied | Renter-occupied |
| 1 Room | 0 (0.0%) | 0 (0.0%) |
| 2 or 3 Rooms | 1 (4.8%) | 0 (0.0%) |
| 4 or 5 Rooms | 6 (28.6%) | 2 (50.0%) |
| 6 or 7 Rooms | 11 (52.4%) | 2 (50.0%) |
| 8 or more Rooms | 3 (14.3%) | 0 (0.0%) |
| Total | 21 (100.0%) | 4 (100.0%) |
Housing Structure by Heating Type in Maskell
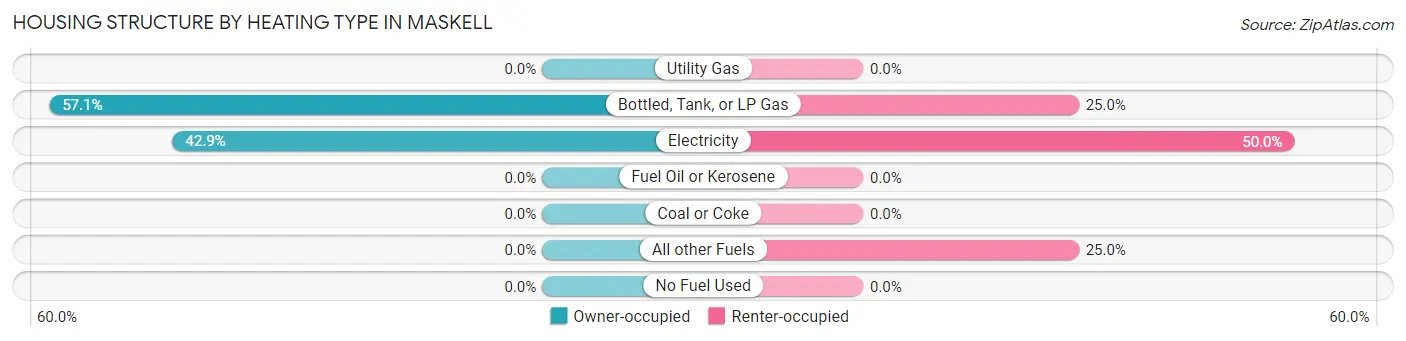
| Heating Type | Owner-occupied | Renter-occupied |
| Utility Gas | 0 (0.0%) | 0 (0.0%) |
| Bottled, Tank, or LP Gas | 12 (57.1%) | 1 (25.0%) |
| Electricity | 9 (42.9%) | 2 (50.0%) |
| Fuel Oil or Kerosene | 0 (0.0%) | 0 (0.0%) |
| Coal or Coke | 0 (0.0%) | 0 (0.0%) |
| All other Fuels | 0 (0.0%) | 1 (25.0%) |
| No Fuel Used | 0 (0.0%) | 0 (0.0%) |
| Total | 21 (100.0%) | 4 (100.0%) |
Household Vehicle Usage in Maskell
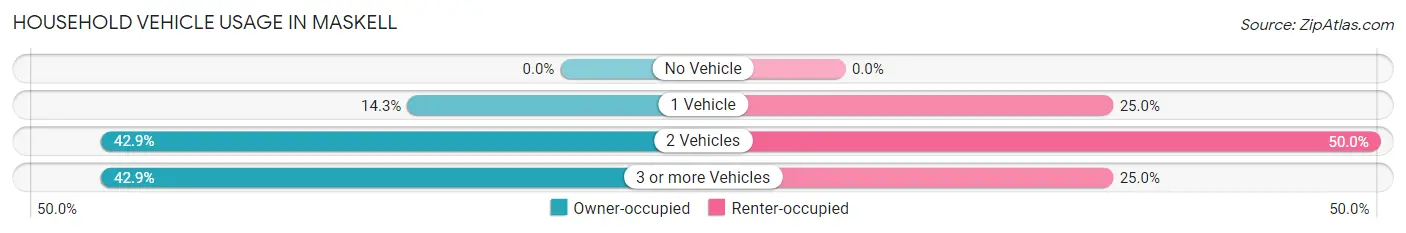
| Vehicles per Household | Owner-occupied | Renter-occupied |
| No Vehicle | 0 (0.0%) | 0 (0.0%) |
| 1 Vehicle | 3 (14.3%) | 1 (25.0%) |
| 2 Vehicles | 9 (42.9%) | 2 (50.0%) |
| 3 or more Vehicles | 9 (42.9%) | 1 (25.0%) |
| Total | 21 (100.0%) | 4 (100.0%) |
Real Estate & Mortgages in Maskell
Real Estate and Mortgage Overview in Maskell
| Characteristic | Without Mortgage | With Mortgage |
| Housing Units | 15 | 6 |
| Median Property Value | $97,500 | $0 |
| Median Household Income | $54,375 | $0 |
| Monthly Housing Costs | $417 | $0 |
| Real Estate Taxes | $820 | $1 |
Property Value by Mortgage Status in Maskell
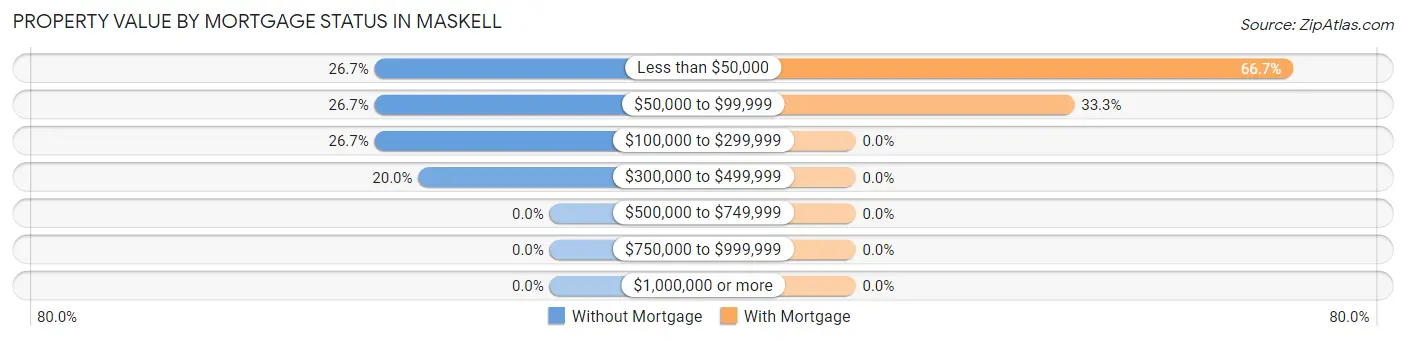
| Property Value | Without Mortgage | With Mortgage |
| Less than $50,000 | 4 (26.7%) | 4 (66.7%) |
| $50,000 to $99,999 | 4 (26.7%) | 2 (33.3%) |
| $100,000 to $299,999 | 4 (26.7%) | 0 (0.0%) |
| $300,000 to $499,999 | 3 (20.0%) | 0 (0.0%) |
| $500,000 to $749,999 | 0 (0.0%) | 0 (0.0%) |
| $750,000 to $999,999 | 0 (0.0%) | 0 (0.0%) |
| $1,000,000 or more | 0 (0.0%) | 0 (0.0%) |
| Total | 15 (100.0%) | 6 (100.0%) |
Household Income by Mortgage Status in Maskell
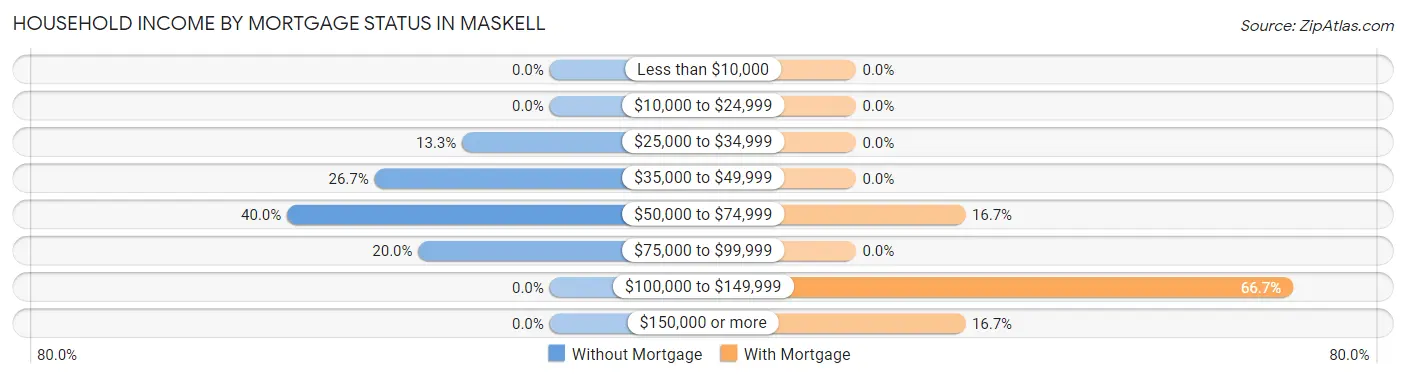
| Household Income | Without Mortgage | With Mortgage |
| Less than $10,000 | 0 (0.0%) | 0 (0.0%) |
| $10,000 to $24,999 | 0 (0.0%) | 0 (0.0%) |
| $25,000 to $34,999 | 2 (13.3%) | 0 (0.0%) |
| $35,000 to $49,999 | 4 (26.7%) | 0 (0.0%) |
| $50,000 to $74,999 | 6 (40.0%) | 1 (16.7%) |
| $75,000 to $99,999 | 3 (20.0%) | 0 (0.0%) |
| $100,000 to $149,999 | 0 (0.0%) | 4 (66.7%) |
| $150,000 or more | 0 (0.0%) | 1 (16.7%) |
| Total | 15 (100.0%) | 6 (100.0%) |
Property Value to Household Income Ratio in Maskell
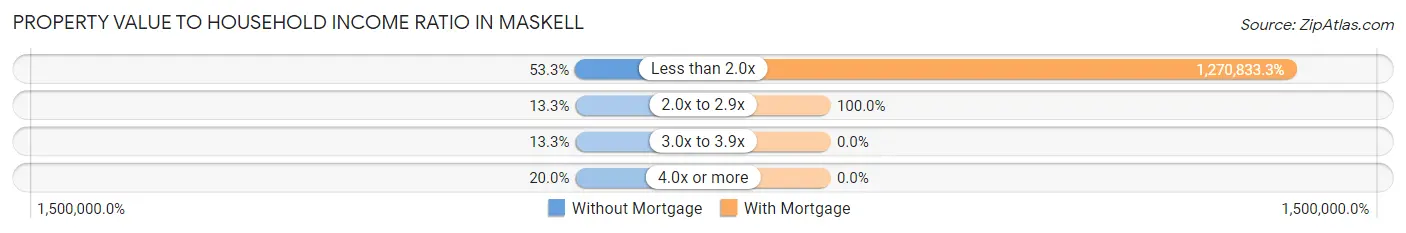
| Value-to-Income Ratio | Without Mortgage | With Mortgage |
| Less than 2.0x | 8 (53.3%) | 76,250 (1,270,833.3%) |
| 2.0x to 2.9x | 2 (13.3%) | 6 (100.0%) |
| 3.0x to 3.9x | 2 (13.3%) | 0 (0.0%) |
| 4.0x or more | 3 (20.0%) | 0 (0.0%) |
| Total | 15 (100.0%) | 6 (100.0%) |
Real Estate Taxes by Mortgage Status in Maskell
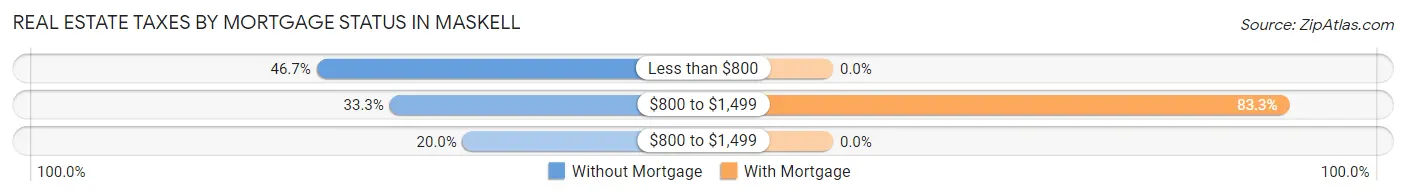
| Property Taxes | Without Mortgage | With Mortgage |
| Less than $800 | 7 (46.7%) | 0 (0.0%) |
| $800 to $1,499 | 5 (33.3%) | 5 (83.3%) |
| $800 to $1,499 | 3 (20.0%) | 0 (0.0%) |
| Total | 15 (100.0%) | 6 (100.0%) |
Health & Disability in Maskell
Health Insurance Coverage by Age in Maskell
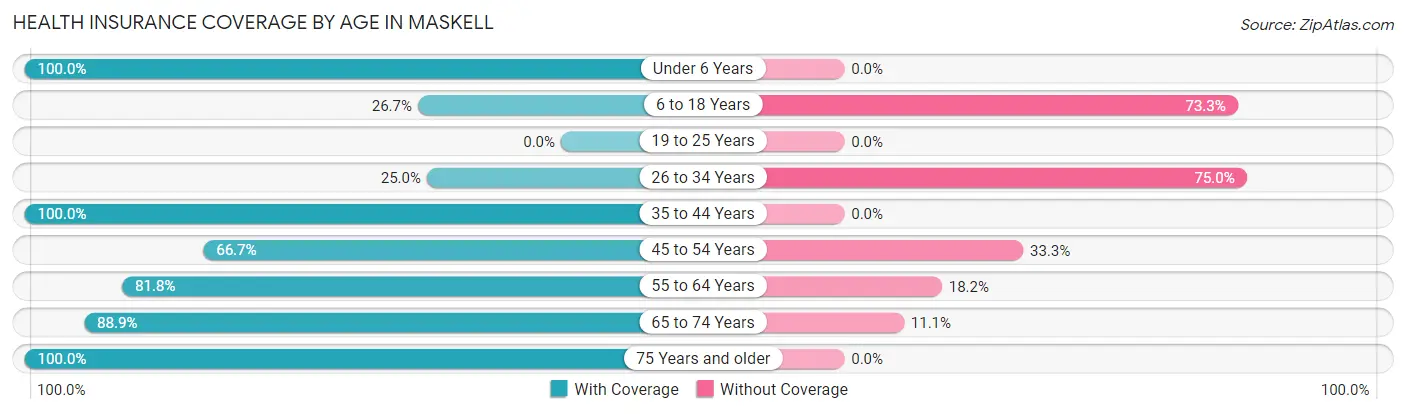
| Age Bracket | With Coverage | Without Coverage |
| Under 6 Years | 1 (100.0%) | 0 (0.0%) |
| 6 to 18 Years | 4 (26.7%) | 11 (73.3%) |
| 19 to 25 Years | 0 (0.0%) | 0 (0.0%) |
| 26 to 34 Years | 1 (25.0%) | 3 (75.0%) |
| 35 to 44 Years | 2 (100.0%) | 0 (0.0%) |
| 45 to 54 Years | 6 (66.7%) | 3 (33.3%) |
| 55 to 64 Years | 9 (81.8%) | 2 (18.2%) |
| 65 to 74 Years | 16 (88.9%) | 2 (11.1%) |
| 75 Years and older | 2 (100.0%) | 0 (0.0%) |
| Total | 41 (66.1%) | 21 (33.9%) |
Health Insurance Coverage by Citizenship Status in Maskell
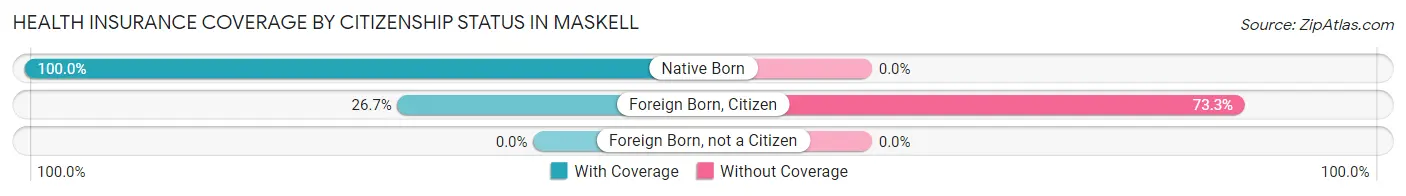
| Citizenship Status | With Coverage | Without Coverage |
| Native Born | 1 (100.0%) | 0 (0.0%) |
| Foreign Born, Citizen | 4 (26.7%) | 11 (73.3%) |
| Foreign Born, not a Citizen | 0 (0.0%) | 0 (0.0%) |
Health Insurance Coverage by Household Income in Maskell
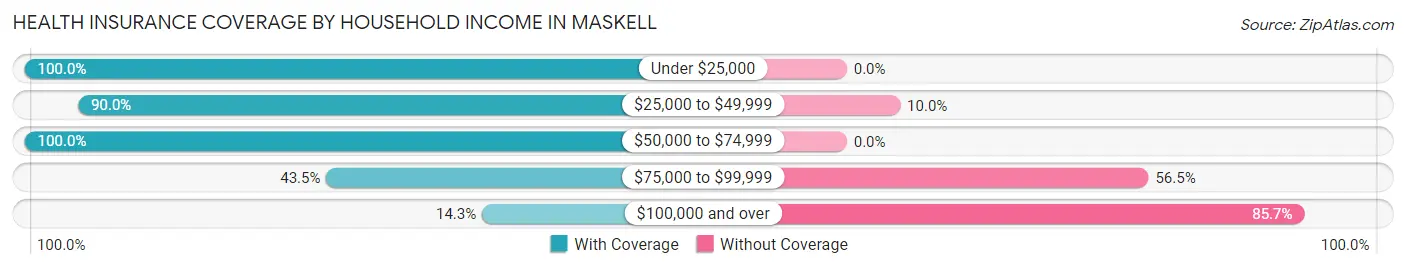
| Household Income | With Coverage | Without Coverage |
| Under $25,000 | 1 (100.0%) | 0 (0.0%) |
| $25,000 to $49,999 | 18 (90.0%) | 2 (10.0%) |
| $50,000 to $74,999 | 11 (100.0%) | 0 (0.0%) |
| $75,000 to $99,999 | 10 (43.5%) | 13 (56.5%) |
| $100,000 and over | 1 (14.3%) | 6 (85.7%) |
Public vs Private Health Insurance Coverage by Age in Maskell
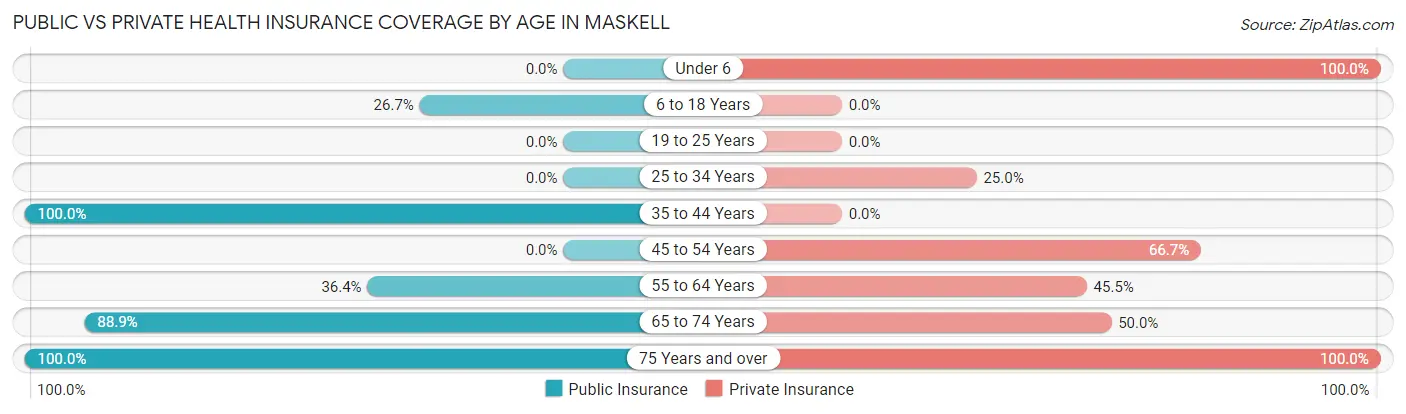
| Age Bracket | Public Insurance | Private Insurance |
| Under 6 | 0 (0.0%) | 1 (100.0%) |
| 6 to 18 Years | 4 (26.7%) | 0 (0.0%) |
| 19 to 25 Years | 0 (0.0%) | 0 (0.0%) |
| 25 to 34 Years | 0 (0.0%) | 1 (25.0%) |
| 35 to 44 Years | 2 (100.0%) | 0 (0.0%) |
| 45 to 54 Years | 0 (0.0%) | 6 (66.7%) |
| 55 to 64 Years | 4 (36.4%) | 5 (45.5%) |
| 65 to 74 Years | 16 (88.9%) | 9 (50.0%) |
| 75 Years and over | 2 (100.0%) | 2 (100.0%) |
| Total | 28 (45.2%) | 24 (38.7%) |
Disability Status by Sex by Age in Maskell
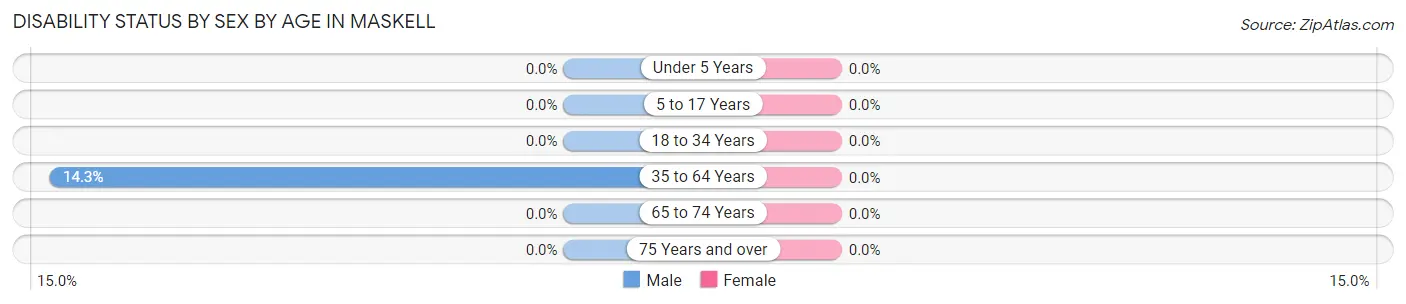
| Age Bracket | Male | Female |
| Under 5 Years | 0 (0.0%) | 0 (0.0%) |
| 5 to 17 Years | 0 (0.0%) | 0 (0.0%) |
| 18 to 34 Years | 0 (0.0%) | 0 (0.0%) |
| 35 to 64 Years | 1 (14.3%) | 0 (0.0%) |
| 65 to 74 Years | 0 (0.0%) | 0 (0.0%) |
| 75 Years and over | 0 (0.0%) | 0 (0.0%) |
Disability Class by Sex by Age in Maskell
Disability Class: Hearing Difficulty

| Age Bracket | Male | Female |
| Under 5 Years | 0 (0.0%) | 0 (0.0%) |
| 5 to 17 Years | 0 (0.0%) | 0 (0.0%) |
| 18 to 34 Years | 0 (0.0%) | 0 (0.0%) |
| 35 to 64 Years | 1 (14.3%) | 0 (0.0%) |
| 65 to 74 Years | 0 (0.0%) | 0 (0.0%) |
| 75 Years and over | 0 (0.0%) | 0 (0.0%) |
Disability Class: Vision Difficulty
| Age Bracket | Male | Female |
| Under 5 Years | 0 (0.0%) | 0 (0.0%) |
| 5 to 17 Years | 0 (0.0%) | 0 (0.0%) |
| 18 to 34 Years | 0 (0.0%) | 0 (0.0%) |
| 35 to 64 Years | 0 (0.0%) | 0 (0.0%) |
| 65 to 74 Years | 0 (0.0%) | 0 (0.0%) |
| 75 Years and over | 0 (0.0%) | 0 (0.0%) |
Disability Class: Cognitive Difficulty
| Age Bracket | Male | Female |
| 5 to 17 Years | 0 (0.0%) | 0 (0.0%) |
| 18 to 34 Years | 0 (0.0%) | 0 (0.0%) |
| 35 to 64 Years | 0 (0.0%) | 0 (0.0%) |
| 65 to 74 Years | 0 (0.0%) | 0 (0.0%) |
| 75 Years and over | 0 (0.0%) | 0 (0.0%) |
Disability Class: Ambulatory Difficulty
| Age Bracket | Male | Female |
| 5 to 17 Years | 0 (0.0%) | 0 (0.0%) |
| 18 to 34 Years | 0 (0.0%) | 0 (0.0%) |
| 35 to 64 Years | 0 (0.0%) | 0 (0.0%) |
| 65 to 74 Years | 0 (0.0%) | 0 (0.0%) |
| 75 Years and over | 0 (0.0%) | 0 (0.0%) |
Disability Class: Self-Care Difficulty
| Age Bracket | Male | Female |
| 5 to 17 Years | 0 (0.0%) | 0 (0.0%) |
| 18 to 34 Years | 0 (0.0%) | 0 (0.0%) |
| 35 to 64 Years | 0 (0.0%) | 0 (0.0%) |
| 65 to 74 Years | 0 (0.0%) | 0 (0.0%) |
| 75 Years and over | 0 (0.0%) | 0 (0.0%) |
Technology Access in Maskell
Computing Device Access in Maskell
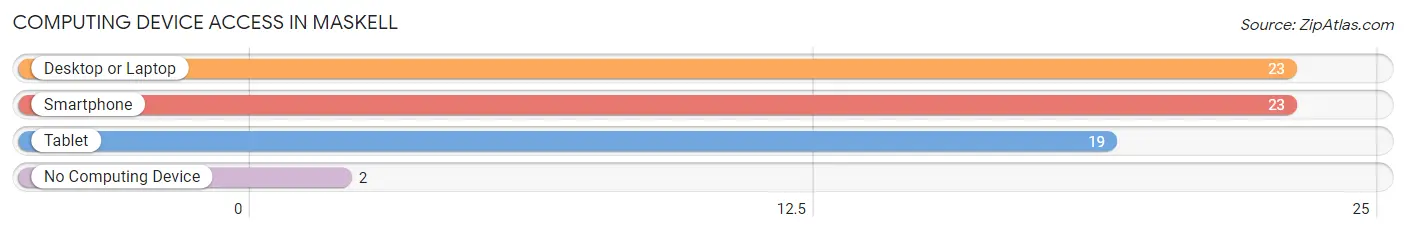
| Device Type | # Households | % Households |
| Desktop or Laptop | 23 | 92.0% |
| Smartphone | 23 | 92.0% |
| Tablet | 19 | 76.0% |
| No Computing Device | 2 | 8.0% |
| Total | 25 | 100.0% |
Internet Access in Maskell
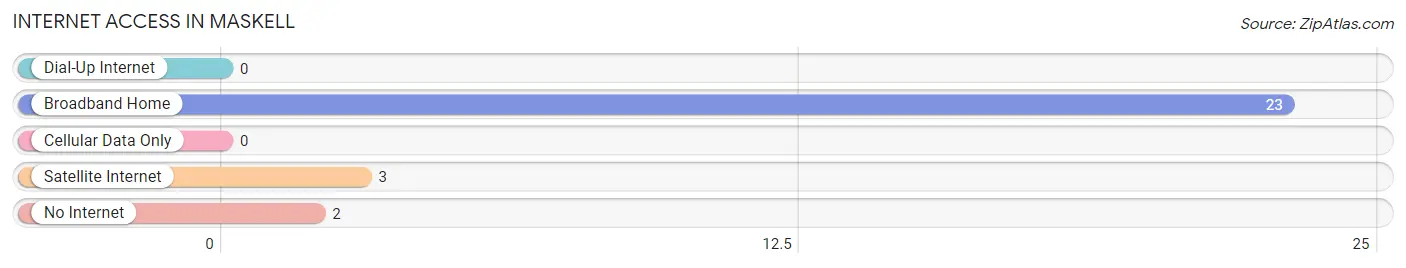
| Internet Type | # Households | % Households |
| Dial-Up Internet | 0 | 0.0% |
| Broadband Home | 23 | 92.0% |
| Cellular Data Only | 0 | 0.0% |
| Satellite Internet | 3 | 12.0% |
| No Internet | 2 | 8.0% |
| Total | 25 | 100.0% |
Maskell Summary
Maskell is a small unincorporated community located in Dixon County, Nebraska. It is situated in the northeastern corner of the state, approximately 10 miles south of the South Dakota border. The population of Maskell was estimated to be around 200 people in 2020.
History
Maskell was founded in 1883 by a group of settlers from Iowa. The town was named after a local rancher, John Maskell, who had a large ranch in the area. The town was originally a farming community, but it soon became a center for the cattle industry. In the early 1900s, Maskell was a bustling town with a population of over 500 people. It had a post office, a bank, a hotel, a general store, and several other businesses.
In the 1920s, the Great Depression hit Maskell hard. Many of the businesses closed and the population dwindled. The town was able to survive, however, and by the 1950s it had recovered and was once again a thriving community.
Geography
Maskell is located in the northeastern corner of Nebraska, approximately 10 miles south of the South Dakota border. The town is situated in the Missouri River Valley, which is a major agricultural region. The area is known for its rolling hills and fertile soil.
The climate in Maskell is typical of the Great Plains region. Summers are hot and humid, while winters are cold and dry. The average annual temperature is around 50 degrees Fahrenheit.
Economy
The economy of Maskell is largely based on agriculture. The town is home to several large farms, which produce a variety of crops including corn, soybeans, and wheat. The town also has a few small businesses, including a gas station, a grocery store, and a few restaurants.
Demographics
The population of Maskell was estimated to be around 200 people in 2020. The town is predominantly white, with a small Hispanic population. The median household income is around $50,000, and the median home value is around $100,000.
Conclusion
Maskell is a small unincorporated community located in Dixon County, Nebraska. It was founded in 1883 and has a population of around 200 people. The town is largely based on agriculture, and the economy is supported by several large farms. The town is predominantly white, with a small Hispanic population. The median household income is around $50,000, and the median home value is around $100,000.
Common Questions
What is Per Capita Income in Maskell?
Per Capita income in Maskell is $24,197.
What is the Median Family Income in Maskell?
Median Family Income in Maskell is $56,875.
What is the Median Household income in Maskell?
Median Household Income in Maskell is $54,375.
What is Inequality or Gini Index in Maskell?
Inequality or Gini Index in Maskell is 0.22.
What is the Total Population of Maskell?
Total Population of Maskell is 62.
What is the Total Male Population of Maskell?
Total Male Population of Maskell is 33.
What is the Total Female Population of Maskell?
Total Female Population of Maskell is 29.
What is the Ratio of Males per 100 Females in Maskell?
There are 113.79 Males per 100 Females in Maskell.
What is the Ratio of Females per 100 Males in Maskell?
There are 87.88 Females per 100 Males in Maskell.
What is the Median Population Age in Maskell?
Median Population Age in Maskell is 53.0 Years.
What is the Average Family Size in Maskell
Average Family Size in Maskell is 3.1 People.
What is the Average Household Size in Maskell
Average Household Size in Maskell is 2.5 People.
How Large is the Labor Force in Maskell?
There are 23 People in the Labor Forcein in Maskell.
What is the Percentage of People in the Labor Force in Maskell?
40.4% of People are in the Labor Force in Maskell.
What is the Unemployment Rate in Maskell?
Unemployment Rate in Maskell is 4.3%.