Harmon, ND Map & Demographics
Harmon Map
Harmon Overview
$37,132
PER CAPITA INCOME
$95,962
AVG HOUSEHOLD INCOME
69.8%
WAGE / INCOME GAP [ % ]
30.2¢/ $1
WAGE / INCOME GAP [ $ ]
0.25
INEQUALITY / GINI INDEX
235
TOTAL POPULATION
121
MALE POPULATION
114
FEMALE POPULATION
106.14
MALES / 100 FEMALES
94.21
FEMALES / 100 MALES
33.0
MEDIAN AGE
3.2
AVG FAMILY SIZE
2.9
AVG HOUSEHOLD SIZE
111
LABOR FORCE [ PEOPLE ]
73.0%
PERCENT IN LABOR FORCE
Income in Harmon
Income Overview in Harmon
| Characteristic | Number | Measure |
| Per Capita Income | 235 | $37,132 |
| Median Family Income | 70 | $0 |
| Mean Family Income | 70 | $127,351 |
| Median Household Income | 80 | $95,962 |
| Mean Household Income | 80 | $117,116 |
| Income Deficit | 70 | $0 |
| Wage / Income Gap (%) | 235 | 69.83% |
| Wage / Income Gap ($) | 235 | 30.17¢ per $1 |
| Gini / Inequality Index | 235 | 0.25 |
Earnings by Sex in Harmon
Average Earnings in Harmon are $46,750, $121,458 for men and $36,648 for women, a difference of 69.8%.
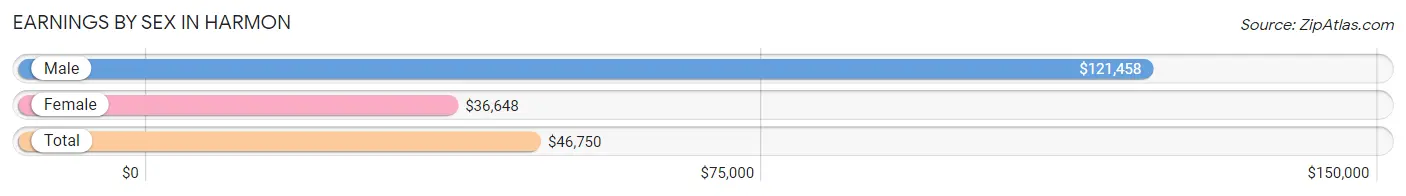
| Sex | Number | Average Earnings |
| Male | 49 (42.2%) | $121,458 |
| Female | 67 (57.8%) | $36,648 |
| Total | 116 (100.0%) | $46,750 |
Earnings by Sex by Income Bracket in Harmon
The most common earnings brackets in Harmon are $100,000+ for men (28 | 57.1%) and $35,000 to $39,999 for women (22 | 32.8%).
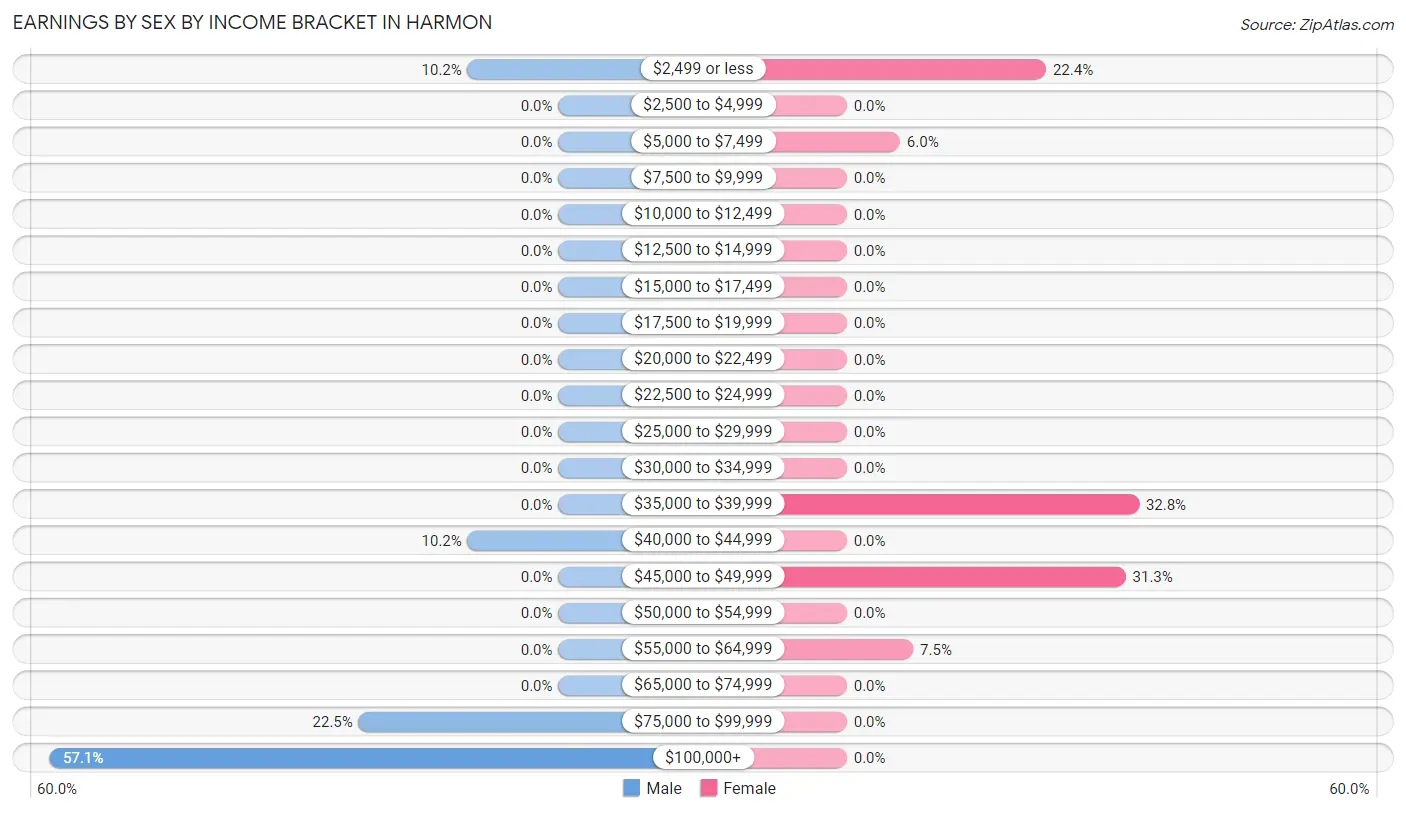
| Income | Male | Female |
| $2,499 or less | 5 (10.2%) | 15 (22.4%) |
| $2,500 to $4,999 | 0 (0.0%) | 0 (0.0%) |
| $5,000 to $7,499 | 0 (0.0%) | 4 (6.0%) |
| $7,500 to $9,999 | 0 (0.0%) | 0 (0.0%) |
| $10,000 to $12,499 | 0 (0.0%) | 0 (0.0%) |
| $12,500 to $14,999 | 0 (0.0%) | 0 (0.0%) |
| $15,000 to $17,499 | 0 (0.0%) | 0 (0.0%) |
| $17,500 to $19,999 | 0 (0.0%) | 0 (0.0%) |
| $20,000 to $22,499 | 0 (0.0%) | 0 (0.0%) |
| $22,500 to $24,999 | 0 (0.0%) | 0 (0.0%) |
| $25,000 to $29,999 | 0 (0.0%) | 0 (0.0%) |
| $30,000 to $34,999 | 0 (0.0%) | 0 (0.0%) |
| $35,000 to $39,999 | 0 (0.0%) | 22 (32.8%) |
| $40,000 to $44,999 | 5 (10.2%) | 0 (0.0%) |
| $45,000 to $49,999 | 0 (0.0%) | 21 (31.3%) |
| $50,000 to $54,999 | 0 (0.0%) | 0 (0.0%) |
| $55,000 to $64,999 | 0 (0.0%) | 5 (7.5%) |
| $65,000 to $74,999 | 0 (0.0%) | 0 (0.0%) |
| $75,000 to $99,999 | 11 (22.5%) | 0 (0.0%) |
| $100,000+ | 28 (57.1%) | 0 (0.0%) |
| Total | 49 (100.0%) | 67 (100.0%) |
Earnings by Sex by Educational Attainment in Harmon
Average earnings in Harmon are $126,250 for men and $36,648 for women, a difference of 71.0%. Men with an educational attainment of college or associate's degree enjoy the highest average annual earnings of $120,833, while those with college or associate's degree education earn the least with $120,833. Women with an educational attainment of college or associate's degree earn the most with the average annual earnings of $36,080, while those with college or associate's degree education have the smallest earnings of $36,080.
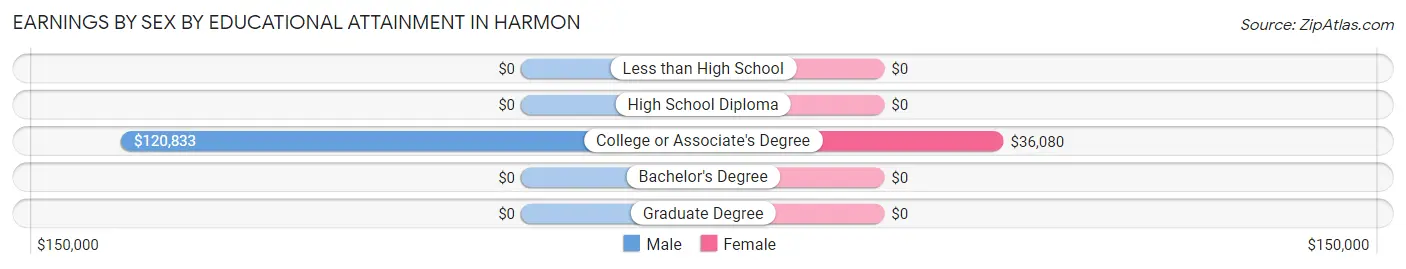
| Educational Attainment | Male Income | Female Income |
| Less than High School | - | - |
| High School Diploma | - | - |
| College or Associate's Degree | $120,833 | $36,080 |
| Bachelor's Degree | - | - |
| Graduate Degree | - | - |
| Total | $126,250 | $36,648 |
Family Income in Harmon
Family Income Brackets in Harmon
According to the Harmon family income data, there are 38 families falling into the $75,000 to $99,999 income range, which is the most common income bracket and makes up 54.3% of all families.
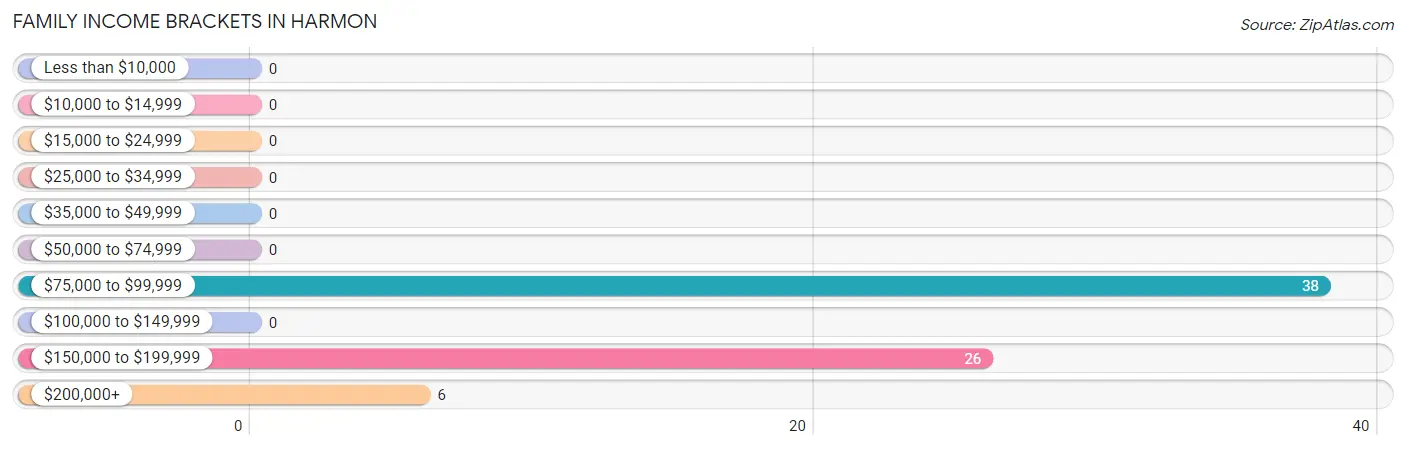
| Income Bracket | # Families | % Families |
| Less than $10,000 | 0 | 0.0% |
| $10,000 to $14,999 | 0 | 0.0% |
| $15,000 to $24,999 | 0 | 0.0% |
| $25,000 to $34,999 | 0 | 0.0% |
| $35,000 to $49,999 | 0 | 0.0% |
| $50,000 to $74,999 | 0 | 0.0% |
| $75,000 to $99,999 | 38 | 54.3% |
| $100,000 to $149,999 | 0 | 0.0% |
| $150,000 to $199,999 | 26 | 37.1% |
| $200,000+ | 6 | 8.6% |
Family Income by Famaliy Size in Harmon
4-person families (32 | 45.7%) account for the highest median family income in Harmon with $170,833 per family, while 4-person families (32 | 45.7%) have the highest median income of $42,708 per family member.
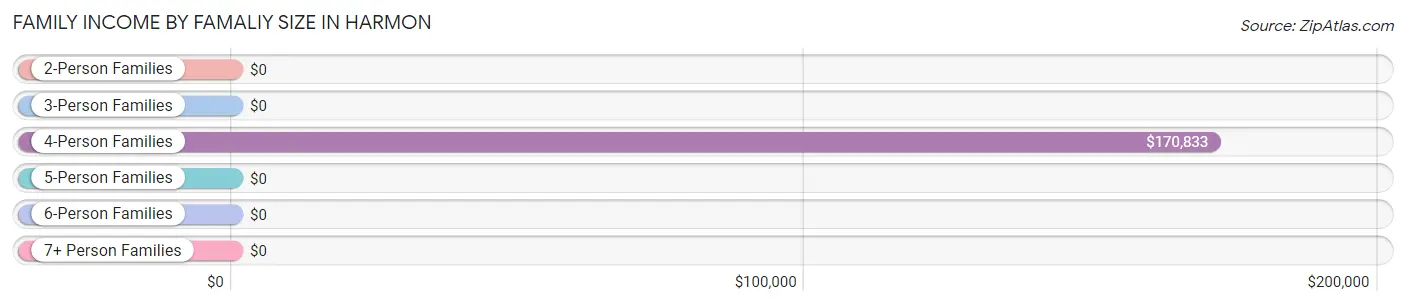
| Income Bracket | # Families | Median Income |
| 2-Person Families | 25 (35.7%) | $0 |
| 3-Person Families | 2 (2.9%) | $0 |
| 4-Person Families | 32 (45.7%) | $170,833 |
| 5-Person Families | 11 (15.7%) | $0 |
| 6-Person Families | 0 (0.0%) | $0 |
| 7+ Person Families | 0 (0.0%) | $0 |
| Total | 70 (100.0%) | $0 |
Family Income by Number of Earners in Harmon
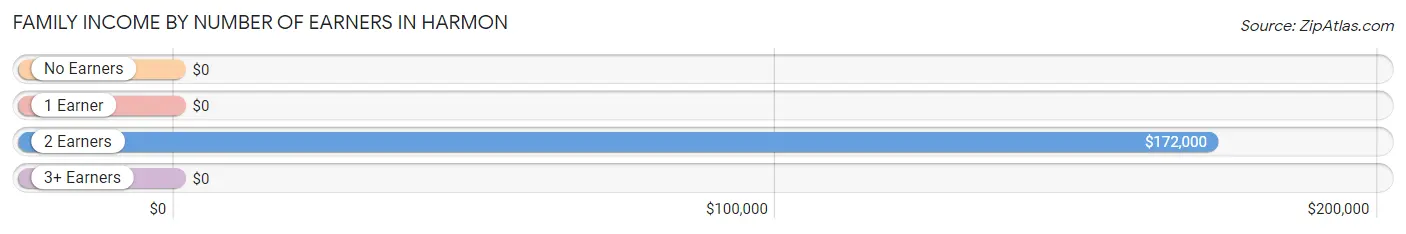
| Number of Earners | # Families | Median Income |
| No Earners | 0 (0.0%) | $0 |
| 1 Earner | 36 (51.4%) | $0 |
| 2 Earners | 28 (40.0%) | $172,000 |
| 3+ Earners | 6 (8.6%) | $0 |
| Total | 70 (100.0%) | $0 |
Household Income in Harmon
Household Income Brackets in Harmon
With 38 households falling in the category, the $75,000 to $99,999 income range is the most frequent in Harmon, accounting for 47.5% of all households.
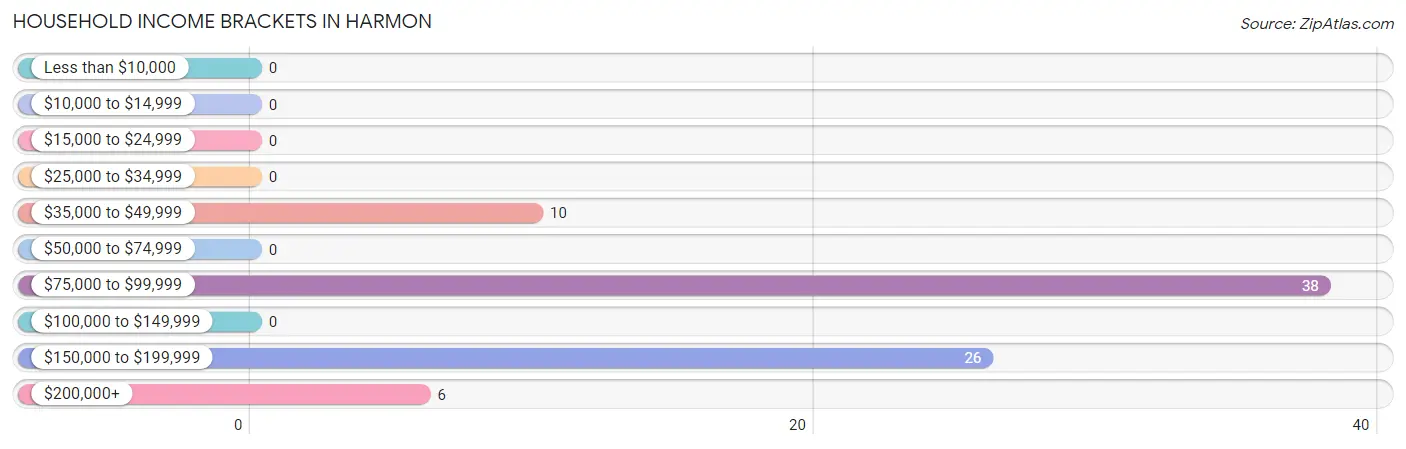
| Income Bracket | # Households | % Households |
| Less than $10,000 | 0 | 0.0% |
| $10,000 to $14,999 | 0 | 0.0% |
| $15,000 to $24,999 | 0 | 0.0% |
| $25,000 to $34,999 | 0 | 0.0% |
| $35,000 to $49,999 | 10 | 12.5% |
| $50,000 to $74,999 | 0 | 0.0% |
| $75,000 to $99,999 | 38 | 47.5% |
| $100,000 to $149,999 | 0 | 0.0% |
| $150,000 to $199,999 | 26 | 32.5% |
| $200,000+ | 6 | 7.5% |
Household Income by Householder Age in Harmon
The median household income in Harmon is $95,962, with the highest median household income of $171,750 found in the 25 to 44 years age bracket for the primary householder. A total of 43 households (53.7%) fall into this category.
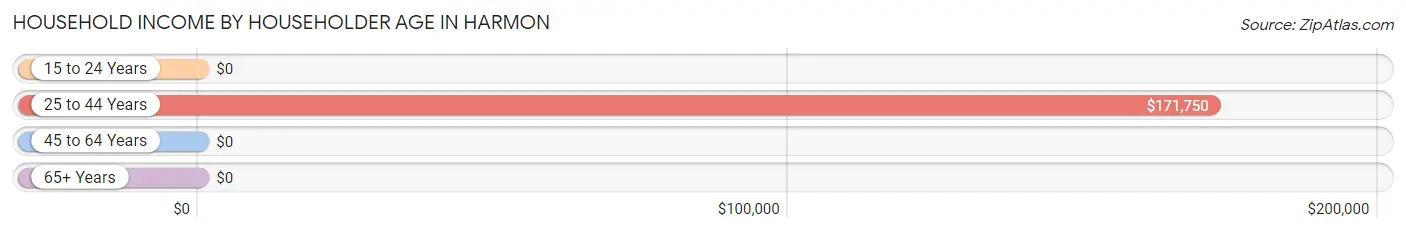
| Income Bracket | # Households | Median Income |
| 15 to 24 Years | 0 (0.0%) | $0 |
| 25 to 44 Years | 43 (53.7%) | $171,750 |
| 45 to 64 Years | 10 (12.5%) | $0 |
| 65+ Years | 27 (33.8%) | $0 |
| Total | 80 (100.0%) | $95,962 |
Poverty in Harmon
Income Below Poverty by Sex and Age in Harmon
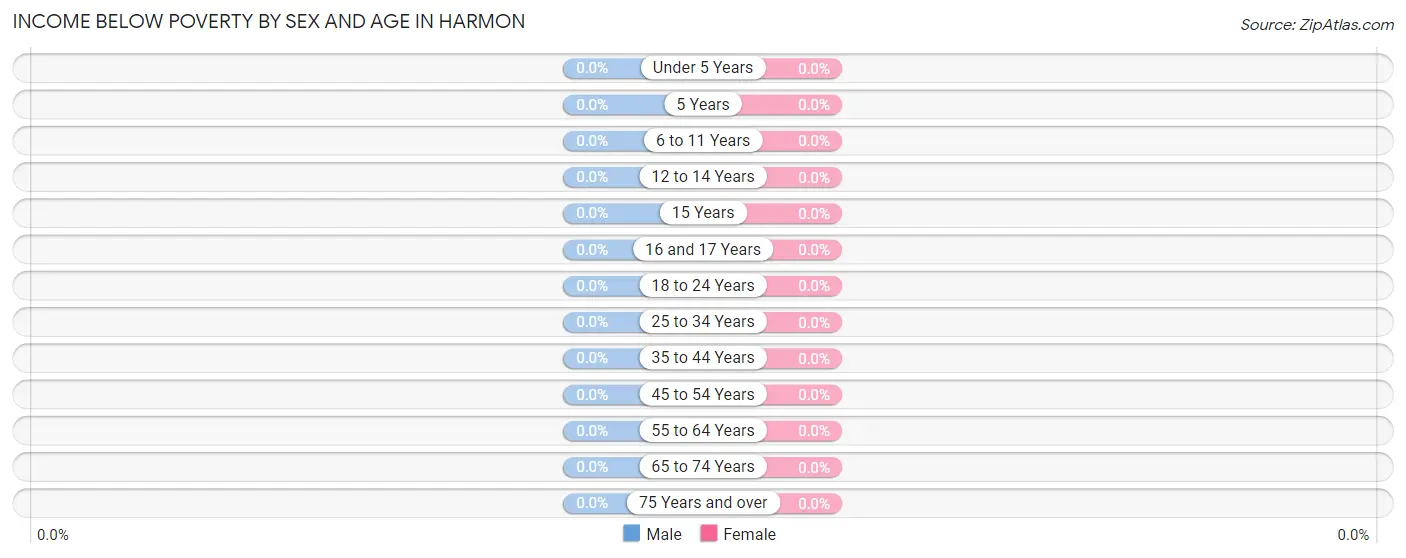
| Age Bracket | Male | Female |
| Under 5 Years | 0 (0.0%) | 0 (0.0%) |
| 5 Years | 0 (0.0%) | 0 (0.0%) |
| 6 to 11 Years | 0 (0.0%) | 0 (0.0%) |
| 12 to 14 Years | 0 (0.0%) | 0 (0.0%) |
| 15 Years | 0 (0.0%) | 0 (0.0%) |
| 16 and 17 Years | 0 (0.0%) | 0 (0.0%) |
| 18 to 24 Years | 0 (0.0%) | 0 (0.0%) |
| 25 to 34 Years | 0 (0.0%) | 0 (0.0%) |
| 35 to 44 Years | 0 (0.0%) | 0 (0.0%) |
| 45 to 54 Years | 0 (0.0%) | 0 (0.0%) |
| 55 to 64 Years | 0 (0.0%) | 0 (0.0%) |
| 65 to 74 Years | 0 (0.0%) | 0 (0.0%) |
| 75 Years and over | 0 (0.0%) | 0 (0.0%) |
| Total | 0 (0.0%) | 0 (0.0%) |
Income Above Poverty by Sex and Age in Harmon
According to the poverty statistics in Harmon, males aged under 5 years and females aged under 5 years are the age groups that are most secure financially, with 100.0% of males and 100.0% of females in these age groups living above the poverty line.
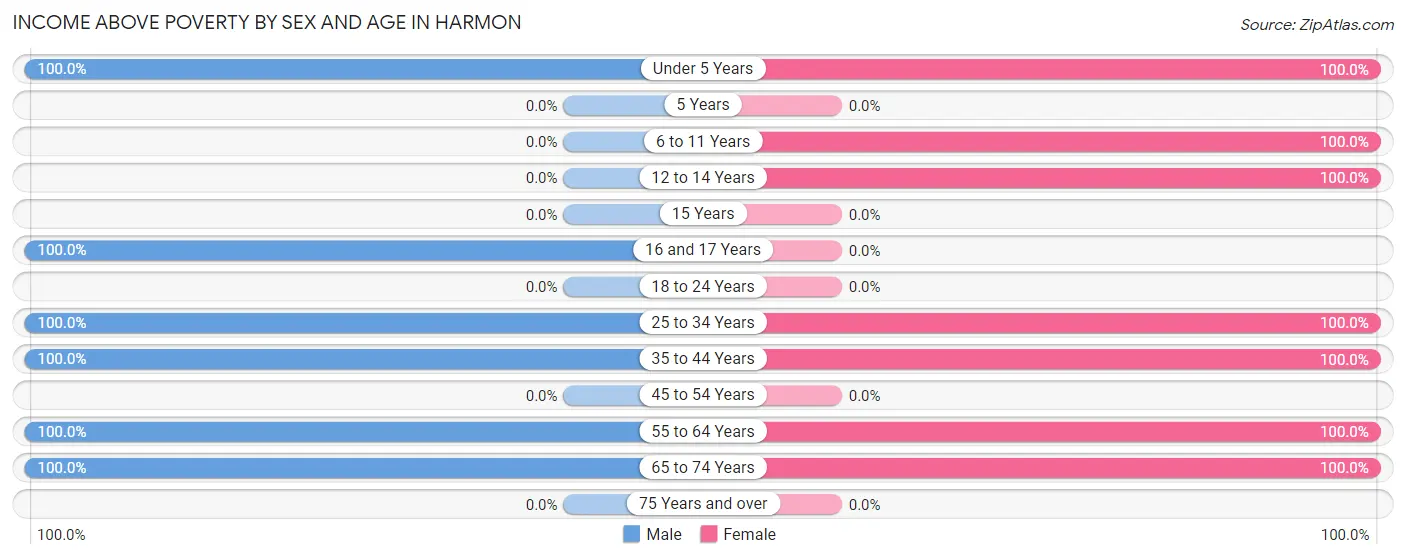
| Age Bracket | Male | Female |
| Under 5 Years | 47 (100.0%) | 10 (100.0%) |
| 5 Years | 0 (0.0%) | 0 (0.0%) |
| 6 to 11 Years | 0 (0.0%) | 20 (100.0%) |
| 12 to 14 Years | 0 (0.0%) | 6 (100.0%) |
| 15 Years | 0 (0.0%) | 0 (0.0%) |
| 16 and 17 Years | 5 (100.0%) | 0 (0.0%) |
| 18 to 24 Years | 0 (0.0%) | 0 (0.0%) |
| 25 to 34 Years | 13 (100.0%) | 30 (100.0%) |
| 35 to 44 Years | 26 (100.0%) | 14 (100.0%) |
| 45 to 54 Years | 0 (0.0%) | 0 (0.0%) |
| 55 to 64 Years | 5 (100.0%) | 10 (100.0%) |
| 65 to 74 Years | 25 (100.0%) | 24 (100.0%) |
| 75 Years and over | 0 (0.0%) | 0 (0.0%) |
| Total | 121 (100.0%) | 114 (100.0%) |
Income Below Poverty Among Married-Couple Families in Harmon
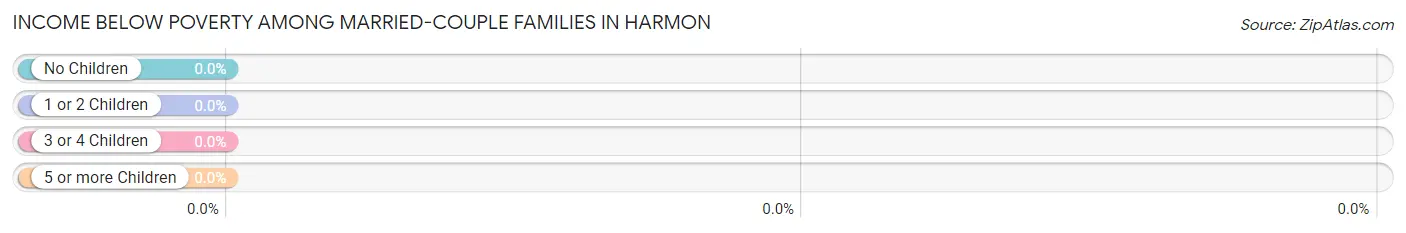
| Children | Above Poverty | Below Poverty |
| No Children | 27 (100.0%) | 0 (0.0%) |
| 1 or 2 Children | 32 (100.0%) | 0 (0.0%) |
| 3 or 4 Children | 11 (100.0%) | 0 (0.0%) |
| 5 or more Children | 0 (0.0%) | 0 (0.0%) |
| Total | 70 (100.0%) | 0 (0.0%) |
Income Below Poverty Among Single-Parent Households in Harmon
| Children | Single Father | Single Mother |
| No Children | 0 (0.0%) | 0 (0.0%) |
| 1 or 2 Children | 0 (0.0%) | 0 (0.0%) |
| 3 or 4 Children | 0 (0.0%) | 0 (0.0%) |
| 5 or more Children | 0 (0.0%) | 0 (0.0%) |
| Total | 0 (0.0%) | 0 (0.0%) |
Income Below Poverty Among Married-Couple vs Single-Parent Households in Harmon
| Children | Married-Couple Families | Single-Parent Households |
| No Children | 0 (0.0%) | 0 (0.0%) |
| 1 or 2 Children | 0 (0.0%) | 0 (0.0%) |
| 3 or 4 Children | 0 (0.0%) | 0 (0.0%) |
| 5 or more Children | 0 (0.0%) | 0 (0.0%) |
| Total | 0 (0.0%) | 0 (0.0%) |
Race in Harmon
The most populous races in Harmon are , and White / Caucasian (235 | 100.0%).
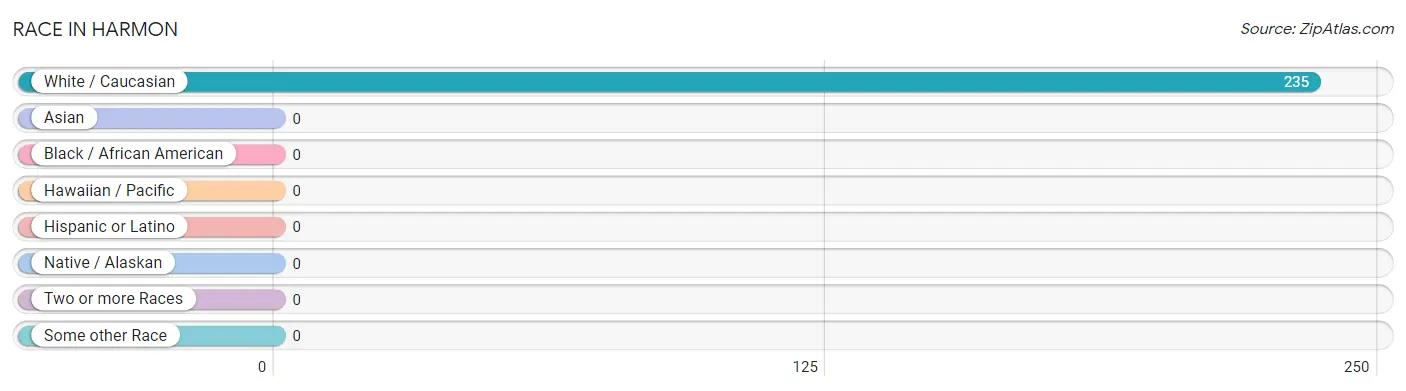
| Race | # Population | % Population |
| Asian | 0 | 0.0% |
| Black / African American | 0 | 0.0% |
| Hawaiian / Pacific | 0 | 0.0% |
| Hispanic or Latino | 0 | 0.0% |
| Native / Alaskan | 0 | 0.0% |
| White / Caucasian | 235 | 100.0% |
| Two or more Races | 0 | 0.0% |
| Some other Race | 0 | 0.0% |
| Total | 235 | 100.0% |
Ancestry in Harmon
The most populous ancestries reported in Harmon are German (54 | 23.0%), Luxembourger (25 | 10.6%), and Norwegian (15 | 6.4%), together accounting for 40.0% of all Harmon residents.
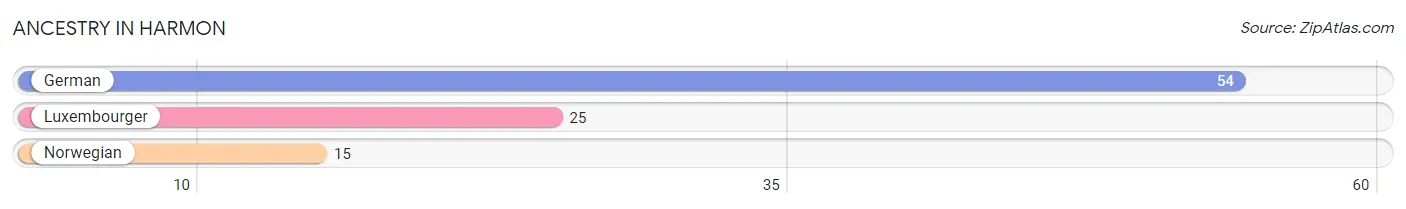
| Ancestry | # Population | % Population |
| German | 54 | 23.0% |
| Luxembourger | 25 | 10.6% |
| Norwegian | 15 | 6.4% | View All 3 Rows |
Immigrants in Harmon

| Immigration Origin | # Population | % Population | View All 0 Rows |
Sex and Age in Harmon
Sex and Age in Harmon
The most populous age groups in Harmon are Under 5 Years (47 | 38.8%) for men and 30 to 34 Years (26 | 22.8%) for women.
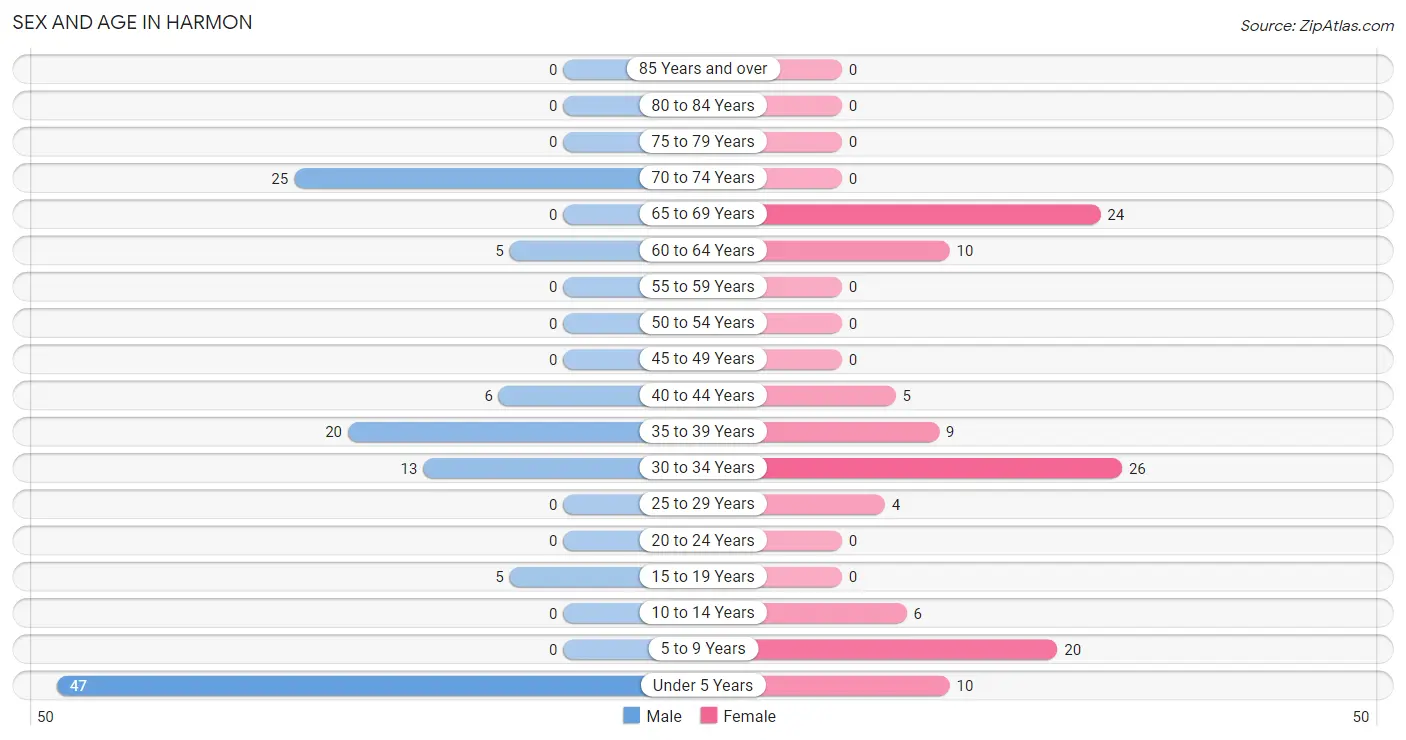
| Age Bracket | Male | Female |
| Under 5 Years | 47 (38.8%) | 10 (8.8%) |
| 5 to 9 Years | 0 (0.0%) | 20 (17.5%) |
| 10 to 14 Years | 0 (0.0%) | 6 (5.3%) |
| 15 to 19 Years | 5 (4.1%) | 0 (0.0%) |
| 20 to 24 Years | 0 (0.0%) | 0 (0.0%) |
| 25 to 29 Years | 0 (0.0%) | 4 (3.5%) |
| 30 to 34 Years | 13 (10.7%) | 26 (22.8%) |
| 35 to 39 Years | 20 (16.5%) | 9 (7.9%) |
| 40 to 44 Years | 6 (5.0%) | 5 (4.4%) |
| 45 to 49 Years | 0 (0.0%) | 0 (0.0%) |
| 50 to 54 Years | 0 (0.0%) | 0 (0.0%) |
| 55 to 59 Years | 0 (0.0%) | 0 (0.0%) |
| 60 to 64 Years | 5 (4.1%) | 10 (8.8%) |
| 65 to 69 Years | 0 (0.0%) | 24 (21.0%) |
| 70 to 74 Years | 25 (20.7%) | 0 (0.0%) |
| 75 to 79 Years | 0 (0.0%) | 0 (0.0%) |
| 80 to 84 Years | 0 (0.0%) | 0 (0.0%) |
| 85 Years and over | 0 (0.0%) | 0 (0.0%) |
| Total | 121 (100.0%) | 114 (100.0%) |
Families and Households in Harmon
Median Family Size in Harmon
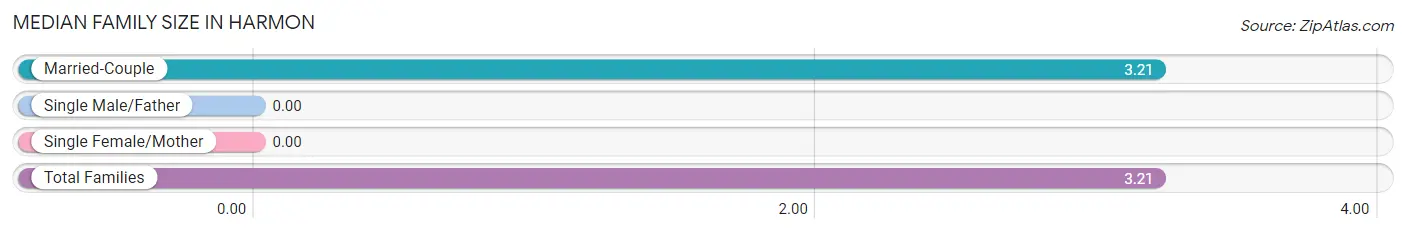
| Family Type | # Families | Family Size |
| Married-Couple | 70 (100.0%) | 3.21 |
| Single Male/Father | 0 (0.0%) | - |
| Single Female/Mother | 0 (0.0%) | - |
| Total Families | 70 (100.0%) | 3.21 |
Median Household Size in Harmon
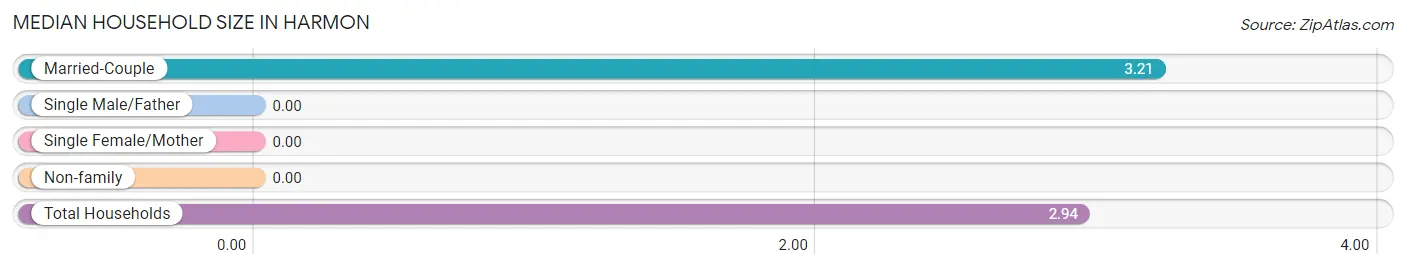
| Household Type | # Households | Household Size |
| Married-Couple | 70 (87.5%) | 3.21 |
| Single Male/Father | 0 (0.0%) | - |
| Single Female/Mother | 0 (0.0%) | - |
| Non-family | 10 (12.5%) | - |
| Total Households | 80 (100.0%) | 2.94 |
Household Size by Marriage Status in Harmon
Out of a total of 80 households in Harmon, 70 (87.5%) are family households, while 10 (12.5%) are nonfamily households. The most numerous type of family households are 4-person households, comprising 32, and the most common type of nonfamily households are 1-person households, comprising 10.
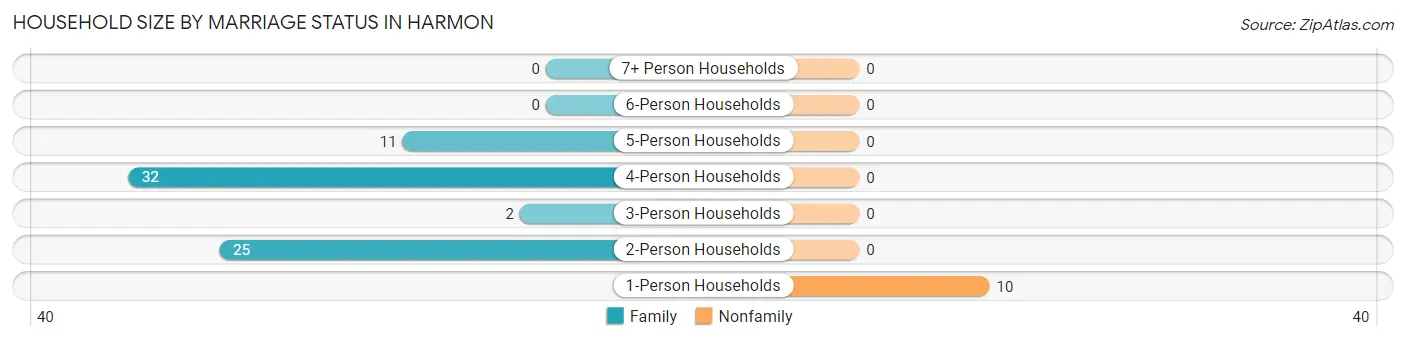
| Household Size | Family Households | Nonfamily Households |
| 1-Person Households | - | 10 (12.5%) |
| 2-Person Households | 25 (31.2%) | 0 (0.0%) |
| 3-Person Households | 2 (2.5%) | 0 (0.0%) |
| 4-Person Households | 32 (40.0%) | 0 (0.0%) |
| 5-Person Households | 11 (13.8%) | 0 (0.0%) |
| 6-Person Households | 0 (0.0%) | 0 (0.0%) |
| 7+ Person Households | 0 (0.0%) | 0 (0.0%) |
| Total | 70 (87.5%) | 10 (12.5%) |
Female Fertility in Harmon
Fertility by Age in Harmon
| Age Bracket | Women with Births | Births / 1,000 Women |
| 15 to 19 years | 0 (0.0%) | 0.0 |
| 20 to 34 years | 0 (0.0%) | 0.0 |
| 35 to 50 years | 0 (0.0%) | 0.0 |
| Total | 0 (0.0%) | 0.0 |
Fertility by Age by Marriage Status in Harmon
| Age Bracket | Married | Unmarried |
| 15 to 19 years | 0 (0.0%) | 0 (0.0%) |
| 20 to 34 years | 0 (0.0%) | 0 (0.0%) |
| 35 to 50 years | 0 (0.0%) | 0 (0.0%) |
| Total | 0 (0.0%) | 0 (0.0%) |
Fertility by Education in Harmon
| Educational Attainment | Women with Births | Births / 1,000 Women |
| Less than High School | 0 (0.0%) | 0.0 |
| High School Diploma | 0 (0.0%) | 0.0 |
| College or Associate's Degree | 0 (0.0%) | 0.0 |
| Bachelor's Degree | 0 (0.0%) | 0.0 |
| Graduate Degree | 0 (0.0%) | 0.0 |
| Total | 0 (0.0%) | 0.0 |
Fertility by Education by Marriage Status in Harmon
| Educational Attainment | Married | Unmarried |
| Less than High School | 0 (0.0%) | 0 (0.0%) |
| High School Diploma | 0 (0.0%) | 0 (0.0%) |
| College or Associate's Degree | 0 (0.0%) | 0 (0.0%) |
| Bachelor's Degree | 0 (0.0%) | 0 (0.0%) |
| Graduate Degree | 0 (0.0%) | 0 (0.0%) |
| Total | 0 (0.0%) | 0 (0.0%) |
Employment Characteristics in Harmon
Employment by Class of Employer in Harmon
Among the 111 employed individuals in Harmon, private company employees (83 | 74.8%), and self-employed (not incorporated) (28 | 25.2%) make up the most common classes of employment.
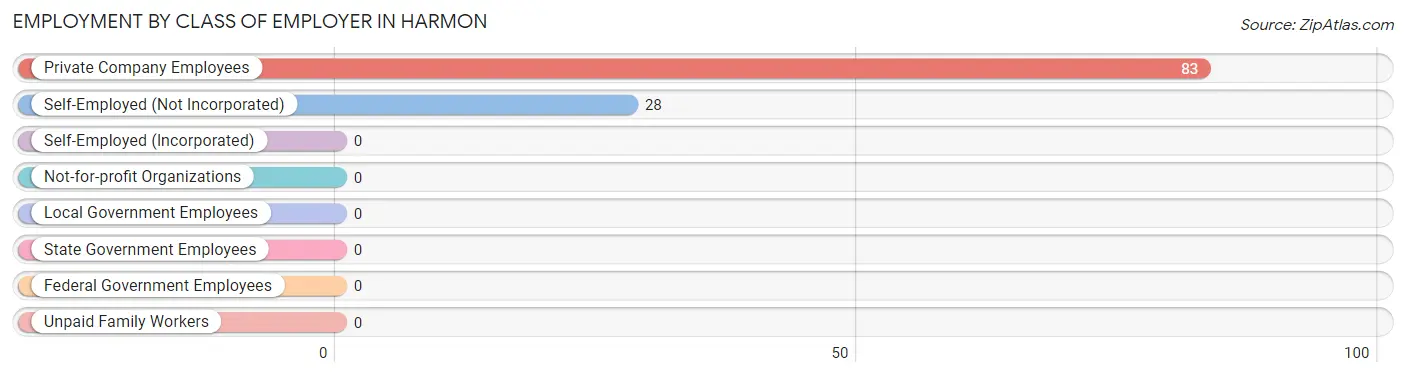
| Employer Class | # Employees | % Employees |
| Private Company Employees | 83 | 74.8% |
| Self-Employed (Incorporated) | 0 | 0.0% |
| Self-Employed (Not Incorporated) | 28 | 25.2% |
| Not-for-profit Organizations | 0 | 0.0% |
| Local Government Employees | 0 | 0.0% |
| State Government Employees | 0 | 0.0% |
| Federal Government Employees | 0 | 0.0% |
| Unpaid Family Workers | 0 | 0.0% |
| Total | 111 | 100.0% |
Employment Status by Age in Harmon
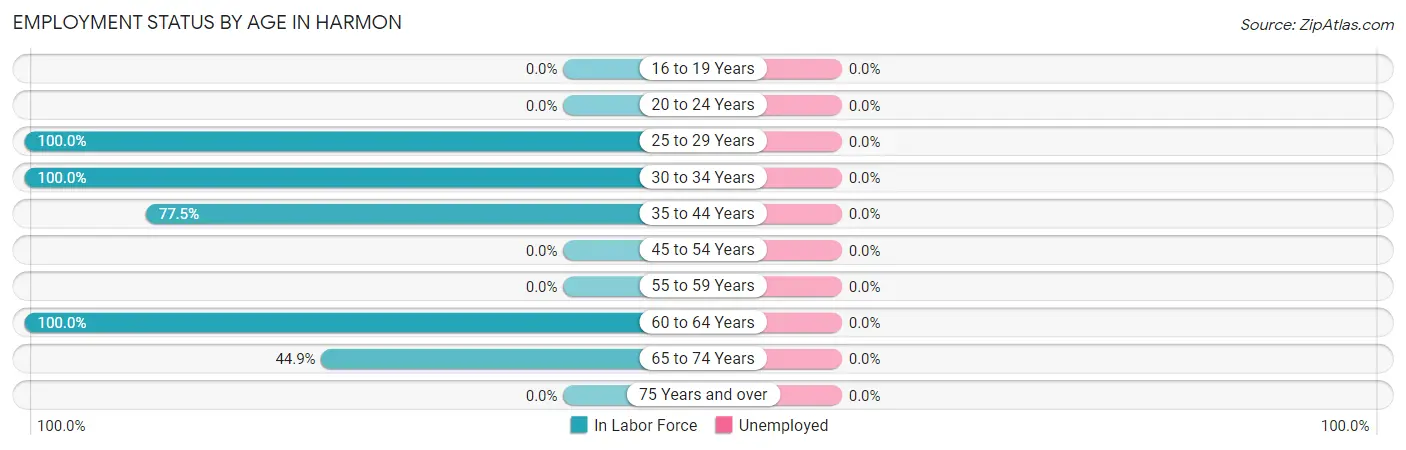
| Age Bracket | In Labor Force | Unemployed |
| 16 to 19 Years | 0 (0.0%) | 0 (0.0%) |
| 20 to 24 Years | 0 (0.0%) | 0 (0.0%) |
| 25 to 29 Years | 4 (100.0%) | 0 (0.0%) |
| 30 to 34 Years | 39 (100.0%) | 0 (0.0%) |
| 35 to 44 Years | 31 (77.5%) | 0 (0.0%) |
| 45 to 54 Years | 0 (0.0%) | 0 (0.0%) |
| 55 to 59 Years | 0 (0.0%) | 0 (0.0%) |
| 60 to 64 Years | 15 (100.0%) | 0 (0.0%) |
| 65 to 74 Years | 22 (44.9%) | 0 (0.0%) |
| 75 Years and over | 0 (0.0%) | 0 (0.0%) |
| Total | 111 (73.0%) | 0 (0.0%) |
Employment Status by Educational Attainment in Harmon
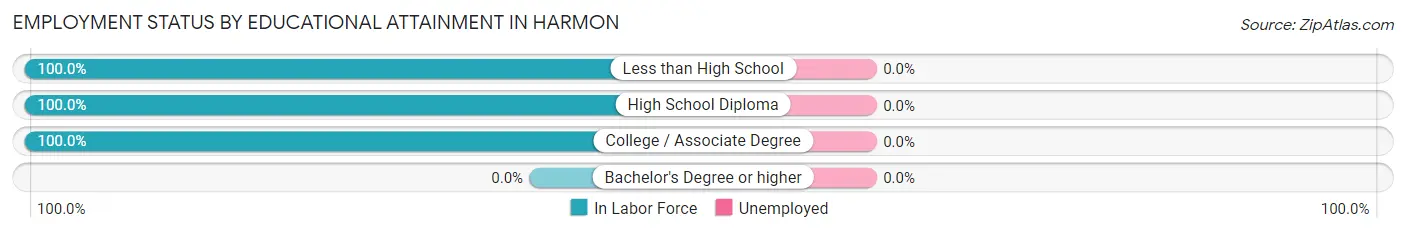
| Educational Attainment | In Labor Force | Unemployed |
| Less than High School | 13 (100.0%) | 0 (0.0%) |
| High School Diploma | 15 (100.0%) | 0 (0.0%) |
| College / Associate Degree | 61 (100.0%) | 0 (0.0%) |
| Bachelor's Degree or higher | 0 (0.0%) | 0 (0.0%) |
| Total | 89 (90.8%) | 0 (0.0%) |
Employment Occupations by Sex in Harmon
Management, Business, Science and Arts Occupations
The most common Management, Business, Science and Arts occupations in Harmon are Community & Social Service (15 | 13.5%), Arts, Media & Entertainment (15 | 13.5%), and Business & Financial (5 | 4.5%).
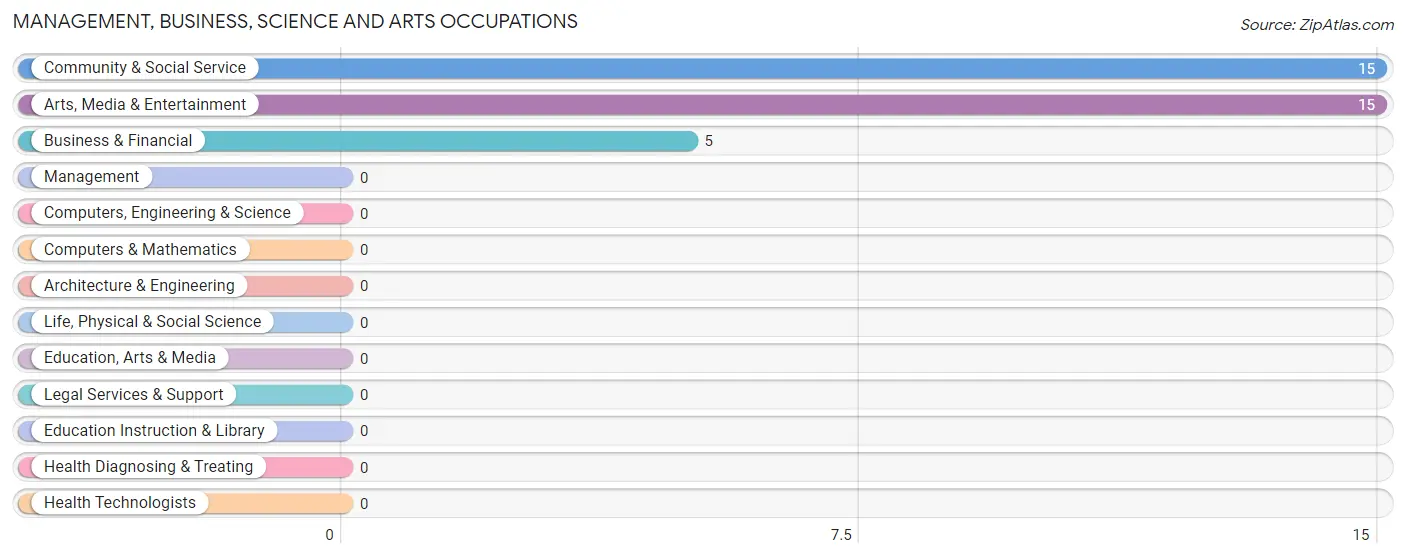
Management, Business, Science and Arts Occupations by Sex
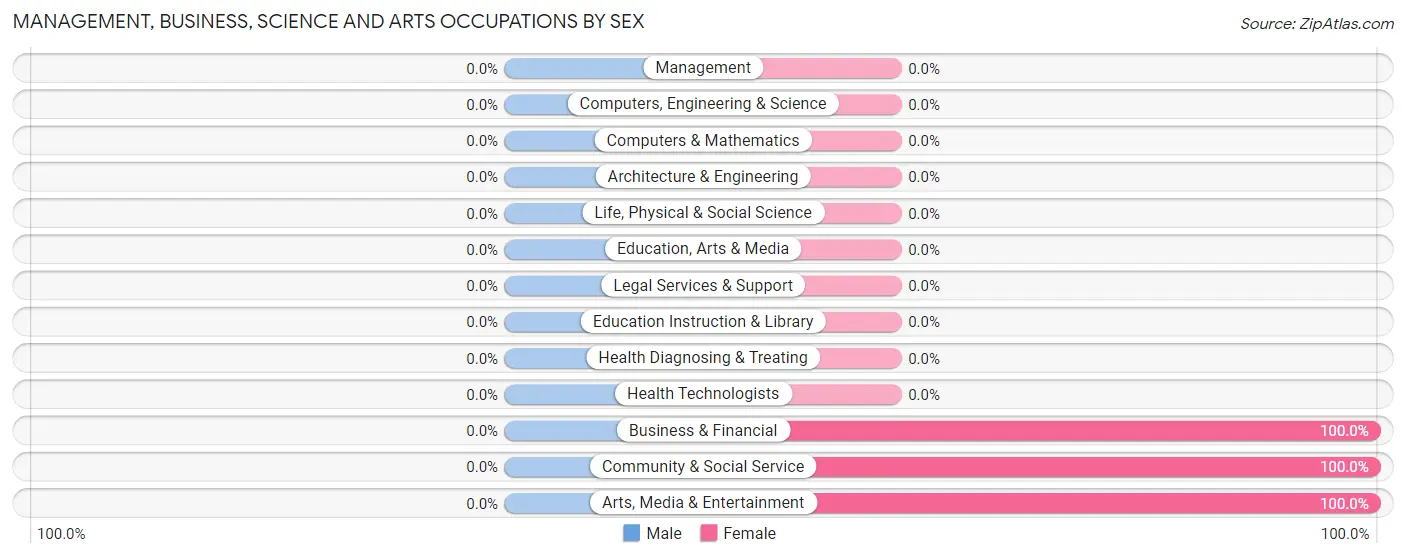
| Occupation | Male | Female |
| Management | 0 (0.0%) | 0 (0.0%) |
| Business & Financial | 0 (0.0%) | 5 (100.0%) |
| Computers, Engineering & Science | 0 (0.0%) | 0 (0.0%) |
| Computers & Mathematics | 0 (0.0%) | 0 (0.0%) |
| Architecture & Engineering | 0 (0.0%) | 0 (0.0%) |
| Life, Physical & Social Science | 0 (0.0%) | 0 (0.0%) |
| Community & Social Service | 0 (0.0%) | 15 (100.0%) |
| Education, Arts & Media | 0 (0.0%) | 0 (0.0%) |
| Legal Services & Support | 0 (0.0%) | 0 (0.0%) |
| Education Instruction & Library | 0 (0.0%) | 0 (0.0%) |
| Arts, Media & Entertainment | 0 (0.0%) | 15 (100.0%) |
| Health Diagnosing & Treating | 0 (0.0%) | 0 (0.0%) |
| Health Technologists | 0 (0.0%) | 0 (0.0%) |
| Total (Category) | 0 (0.0%) | 20 (100.0%) |
| Total (Overall) | 44 (39.6%) | 67 (60.4%) |
Services Occupations
Services Occupations by Sex
| Occupation | Male | Female |
| Healthcare Support | 0 (0.0%) | 0 (0.0%) |
| Security & Protection | 0 (0.0%) | 0 (0.0%) |
| Firefighting & Prevention | 0 (0.0%) | 0 (0.0%) |
| Law Enforcement | 0 (0.0%) | 0 (0.0%) |
| Food Preparation & Serving | 0 (0.0%) | 0 (0.0%) |
| Cleaning & Maintenance | 0 (0.0%) | 0 (0.0%) |
| Personal Care & Service | 0 (0.0%) | 0 (0.0%) |
| Total (Category) | 0 (0.0%) | 0 (0.0%) |
| Total (Overall) | 44 (39.6%) | 67 (60.4%) |
Sales and Office Occupations
The most common Sales and Office occupations in Harmon are Office & Administration (47 | 42.3%), and Sales & Related (13 | 11.7%).
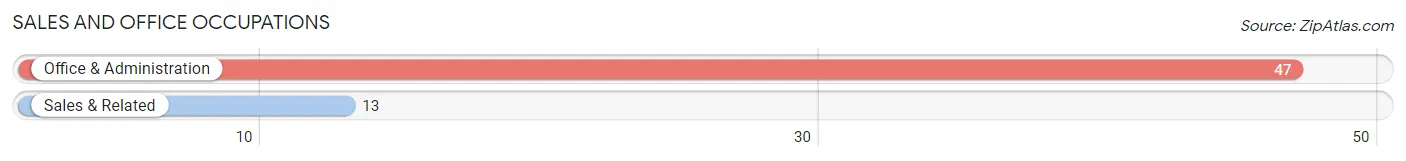
Sales and Office Occupations by Sex
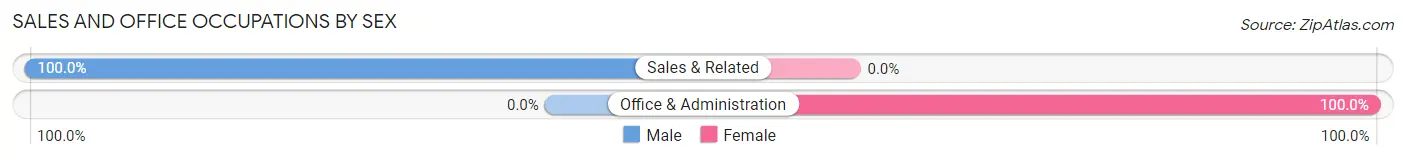
| Occupation | Male | Female |
| Sales & Related | 13 (100.0%) | 0 (0.0%) |
| Office & Administration | 0 (0.0%) | 47 (100.0%) |
| Total (Category) | 13 (21.7%) | 47 (78.3%) |
| Total (Overall) | 44 (39.6%) | 67 (60.4%) |
Natural Resources, Construction and Maintenance Occupations
The most common Natural Resources, Construction and Maintenance occupations in Harmon are Construction & Extraction (11 | 9.9%), and Installation, Maintenance & Repair (11 | 9.9%).
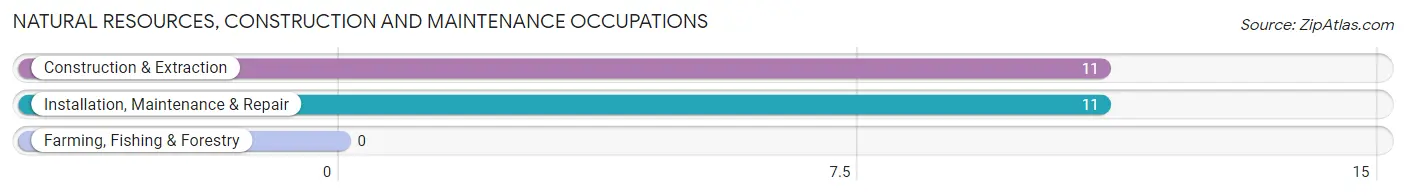
Natural Resources, Construction and Maintenance Occupations by Sex
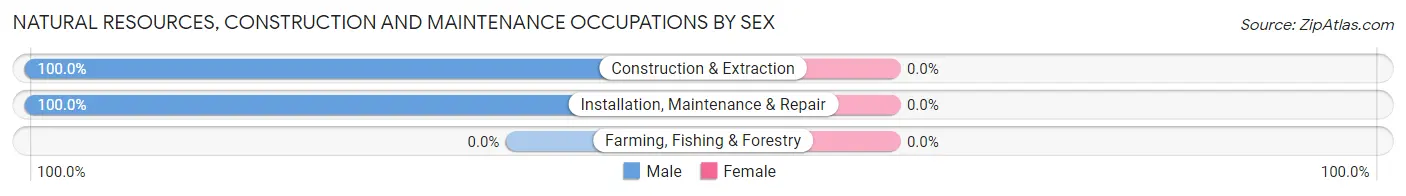
| Occupation | Male | Female |
| Farming, Fishing & Forestry | 0 (0.0%) | 0 (0.0%) |
| Construction & Extraction | 11 (100.0%) | 0 (0.0%) |
| Installation, Maintenance & Repair | 11 (100.0%) | 0 (0.0%) |
| Total (Category) | 22 (100.0%) | 0 (0.0%) |
| Total (Overall) | 44 (39.6%) | 67 (60.4%) |
Production, Transportation and Moving Occupations
The most common Production, Transportation and Moving occupations in Harmon are , and Production (9 | 8.1%).
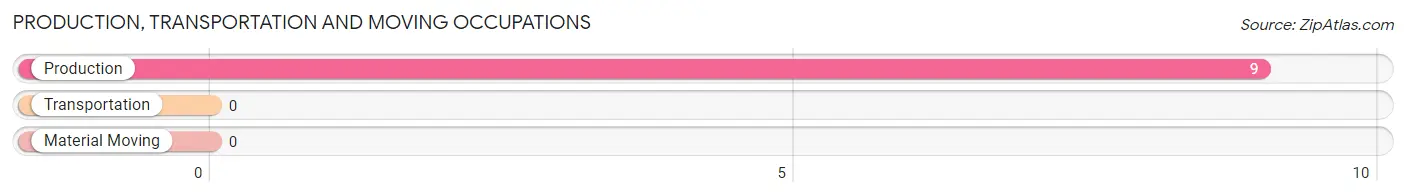
Production, Transportation and Moving Occupations by Sex
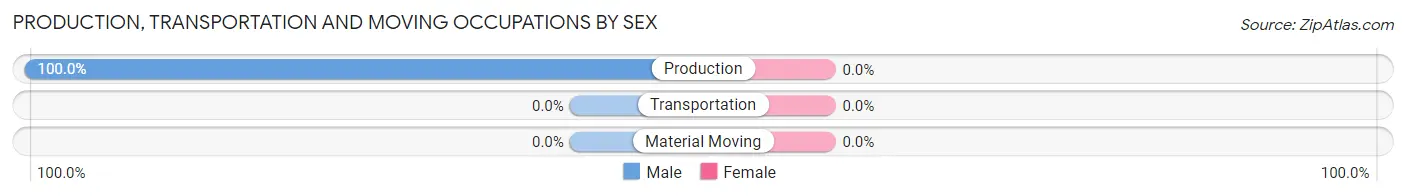
| Occupation | Male | Female |
| Production | 9 (100.0%) | 0 (0.0%) |
| Transportation | 0 (0.0%) | 0 (0.0%) |
| Material Moving | 0 (0.0%) | 0 (0.0%) |
| Total (Category) | 9 (100.0%) | 0 (0.0%) |
| Total (Overall) | 44 (39.6%) | 67 (60.4%) |
Employment Industries by Sex in Harmon
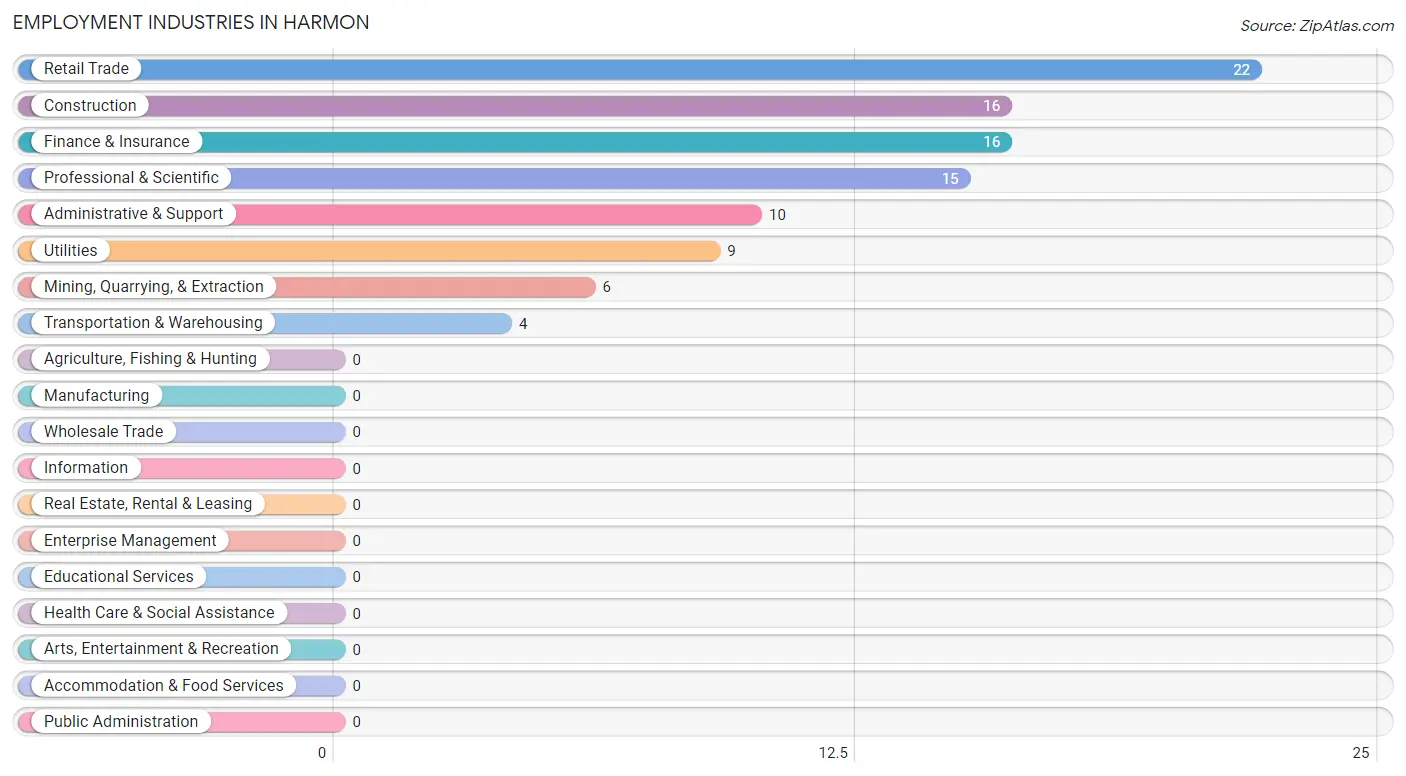
Employment Industries in Harmon
The major employment industries in Harmon include Retail Trade (22 | 19.8%), Construction (16 | 14.4%), Finance & Insurance (16 | 14.4%), Professional & Scientific (15 | 13.5%), and Administrative & Support (10 | 9.0%).
Employment Industries by Sex in Harmon
The Harmon industries that see more men than women are Mining, Quarrying, & Extraction (100.0%), Construction (100.0%), and Utilities (100.0%), whereas the industries that tend to have a higher number of women are Retail Trade (100.0%), Transportation & Warehousing (100.0%), and Finance & Insurance (100.0%).
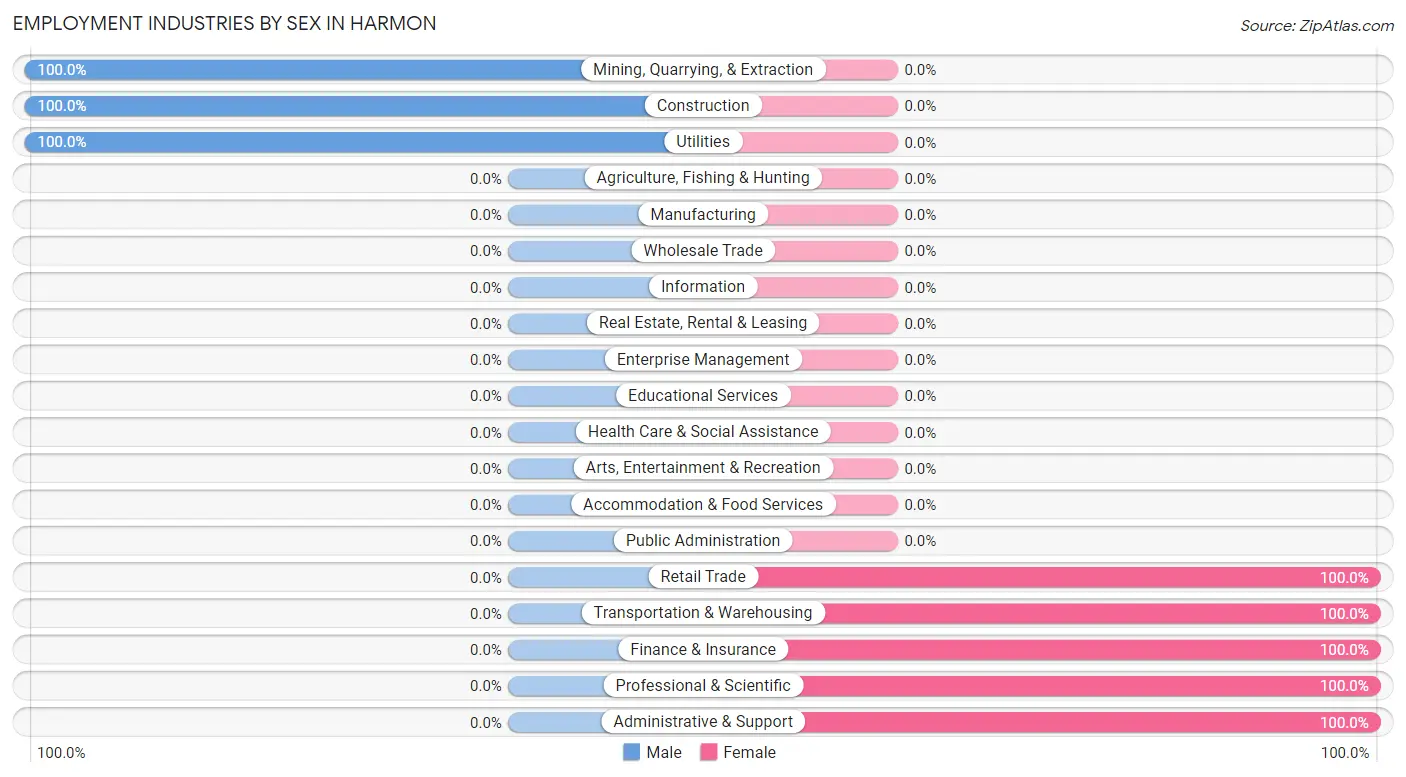
| Industry | Male | Female |
| Agriculture, Fishing & Hunting | 0 (0.0%) | 0 (0.0%) |
| Mining, Quarrying, & Extraction | 6 (100.0%) | 0 (0.0%) |
| Construction | 16 (100.0%) | 0 (0.0%) |
| Manufacturing | 0 (0.0%) | 0 (0.0%) |
| Wholesale Trade | 0 (0.0%) | 0 (0.0%) |
| Retail Trade | 0 (0.0%) | 22 (100.0%) |
| Transportation & Warehousing | 0 (0.0%) | 4 (100.0%) |
| Utilities | 9 (100.0%) | 0 (0.0%) |
| Information | 0 (0.0%) | 0 (0.0%) |
| Finance & Insurance | 0 (0.0%) | 16 (100.0%) |
| Real Estate, Rental & Leasing | 0 (0.0%) | 0 (0.0%) |
| Professional & Scientific | 0 (0.0%) | 15 (100.0%) |
| Enterprise Management | 0 (0.0%) | 0 (0.0%) |
| Administrative & Support | 0 (0.0%) | 10 (100.0%) |
| Educational Services | 0 (0.0%) | 0 (0.0%) |
| Health Care & Social Assistance | 0 (0.0%) | 0 (0.0%) |
| Arts, Entertainment & Recreation | 0 (0.0%) | 0 (0.0%) |
| Accommodation & Food Services | 0 (0.0%) | 0 (0.0%) |
| Public Administration | 0 (0.0%) | 0 (0.0%) |
| Total | 44 (39.6%) | 67 (60.4%) |
Education in Harmon
School Enrollment in Harmon
The most common levels of schooling among the 31 students in Harmon are kindergarten (20 | 64.5%), middle school (6 | 19.4%), and high school (5 | 16.1%).
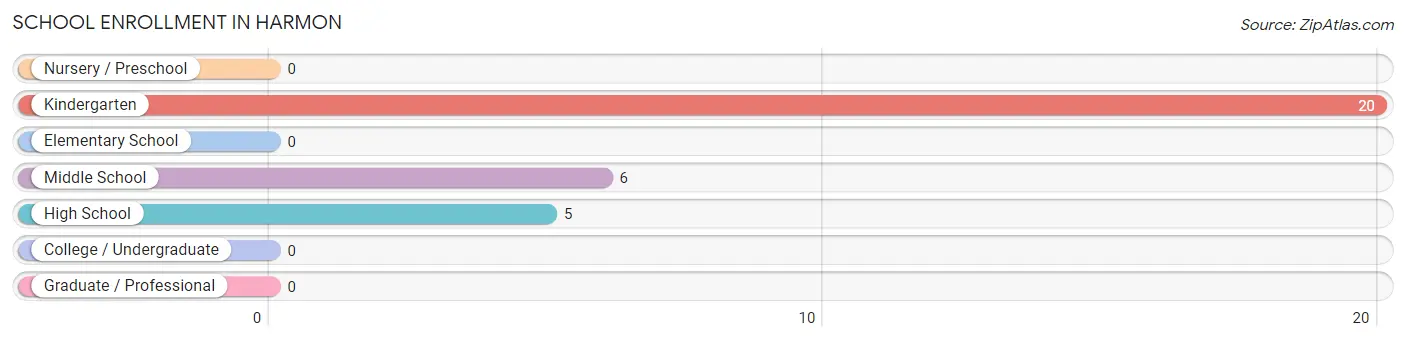
| School Level | # Students | % Students |
| Nursery / Preschool | 0 | 0.0% |
| Kindergarten | 20 | 64.5% |
| Elementary School | 0 | 0.0% |
| Middle School | 6 | 19.4% |
| High School | 5 | 16.1% |
| College / Undergraduate | 0 | 0.0% |
| Graduate / Professional | 0 | 0.0% |
| Total | 31 | 100.0% |
School Enrollment by Age by Funding Source in Harmon
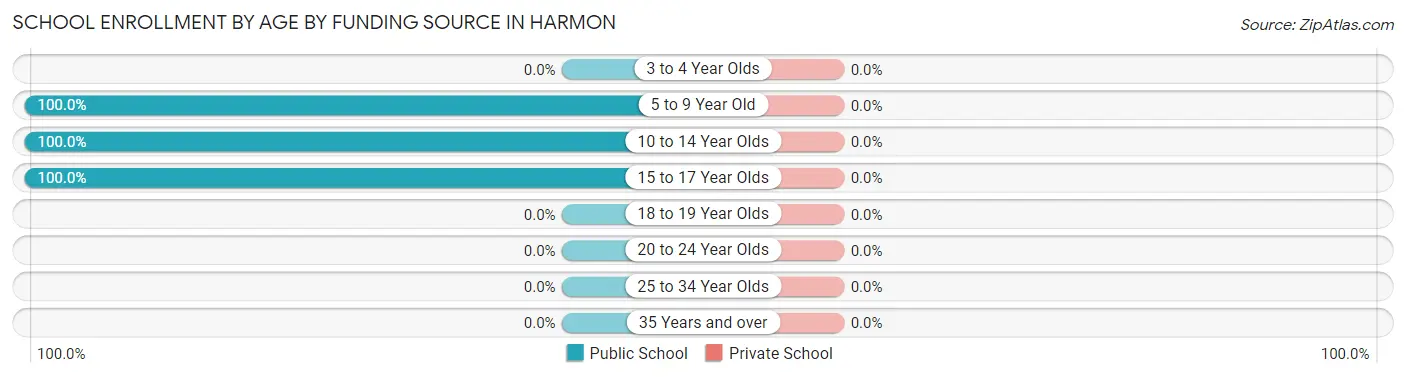
| Age Bracket | Public School | Private School |
| 3 to 4 Year Olds | 0 (0.0%) | 0 (0.0%) |
| 5 to 9 Year Old | 20 (100.0%) | 0 (0.0%) |
| 10 to 14 Year Olds | 6 (100.0%) | 0 (0.0%) |
| 15 to 17 Year Olds | 5 (100.0%) | 0 (0.0%) |
| 18 to 19 Year Olds | 0 (0.0%) | 0 (0.0%) |
| 20 to 24 Year Olds | 0 (0.0%) | 0 (0.0%) |
| 25 to 34 Year Olds | 0 (0.0%) | 0 (0.0%) |
| 35 Years and over | 0 (0.0%) | 0 (0.0%) |
| Total | 31 (100.0%) | 0 (0.0%) |
Educational Attainment by Field of Study in Harmon
, and liberal arts & history (9 | 100.0%) are the most common fields of study among 9 individuals in Harmon who have obtained a bachelor's degree or higher.
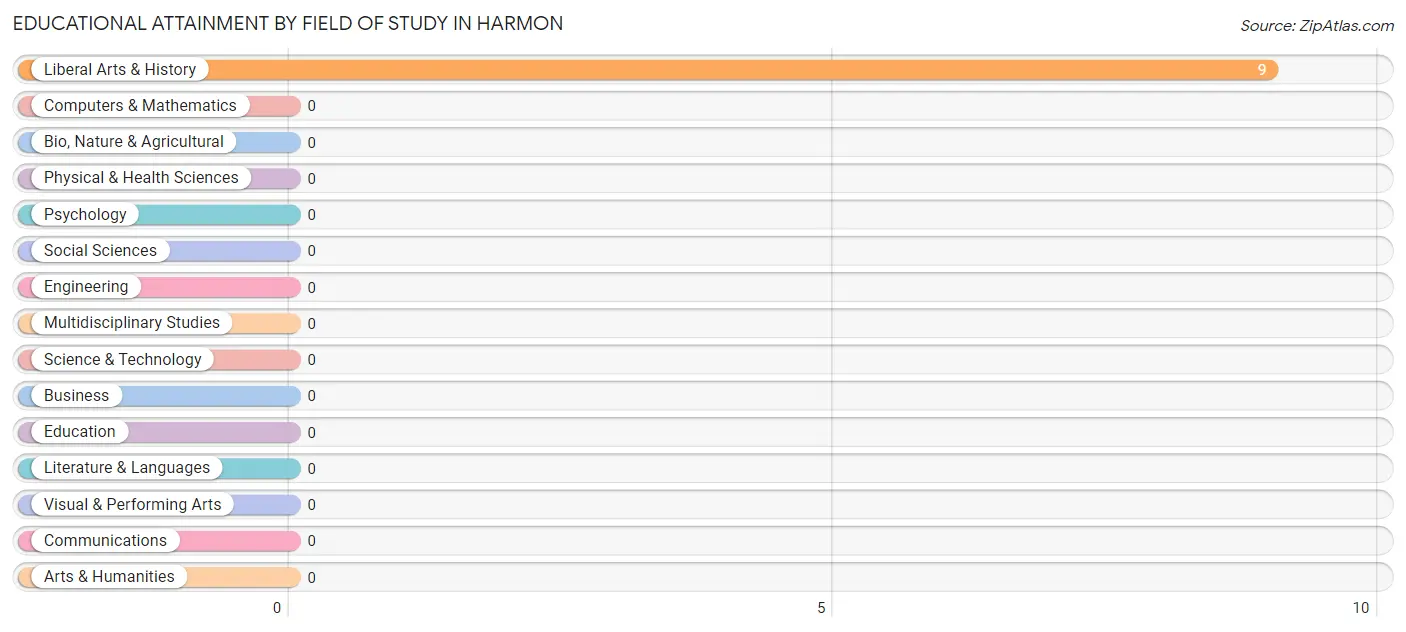
| Field of Study | # Graduates | % Graduates |
| Computers & Mathematics | 0 | 0.0% |
| Bio, Nature & Agricultural | 0 | 0.0% |
| Physical & Health Sciences | 0 | 0.0% |
| Psychology | 0 | 0.0% |
| Social Sciences | 0 | 0.0% |
| Engineering | 0 | 0.0% |
| Multidisciplinary Studies | 0 | 0.0% |
| Science & Technology | 0 | 0.0% |
| Business | 0 | 0.0% |
| Education | 0 | 0.0% |
| Literature & Languages | 0 | 0.0% |
| Liberal Arts & History | 9 | 100.0% |
| Visual & Performing Arts | 0 | 0.0% |
| Communications | 0 | 0.0% |
| Arts & Humanities | 0 | 0.0% |
| Total | 9 | 100.0% |
Transportation & Commute in Harmon
Vehicle Availability by Sex in Harmon
The most prevalent vehicle ownership categories in Harmon are males with 3 vehicles (38, accounting for 86.4%) and females with 3 vehicles (30, making up 56.7%).
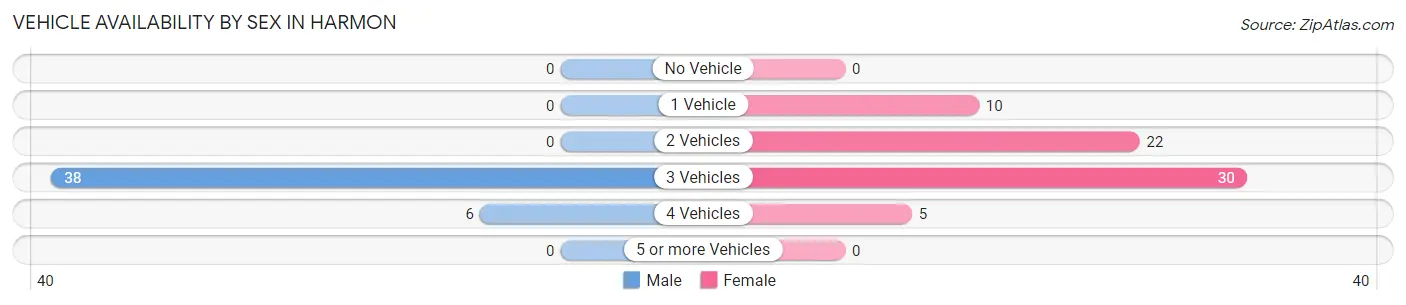
| Vehicles Available | Male | Female |
| No Vehicle | 0 (0.0%) | 0 (0.0%) |
| 1 Vehicle | 0 (0.0%) | 10 (14.9%) |
| 2 Vehicles | 0 (0.0%) | 22 (32.8%) |
| 3 Vehicles | 38 (86.4%) | 30 (44.8%) |
| 4 Vehicles | 6 (13.6%) | 5 (7.5%) |
| 5 or more Vehicles | 0 (0.0%) | 0 (0.0%) |
| Total | 44 (100.0%) | 67 (100.0%) |
Commute Time in Harmon
The most frequently occuring commute durations in Harmon are 30 to 34 minutes (58 commuters, 52.2%), 20 to 24 minutes (47 commuters, 42.3%), and 40 to 44 minutes (6 commuters, 5.4%).
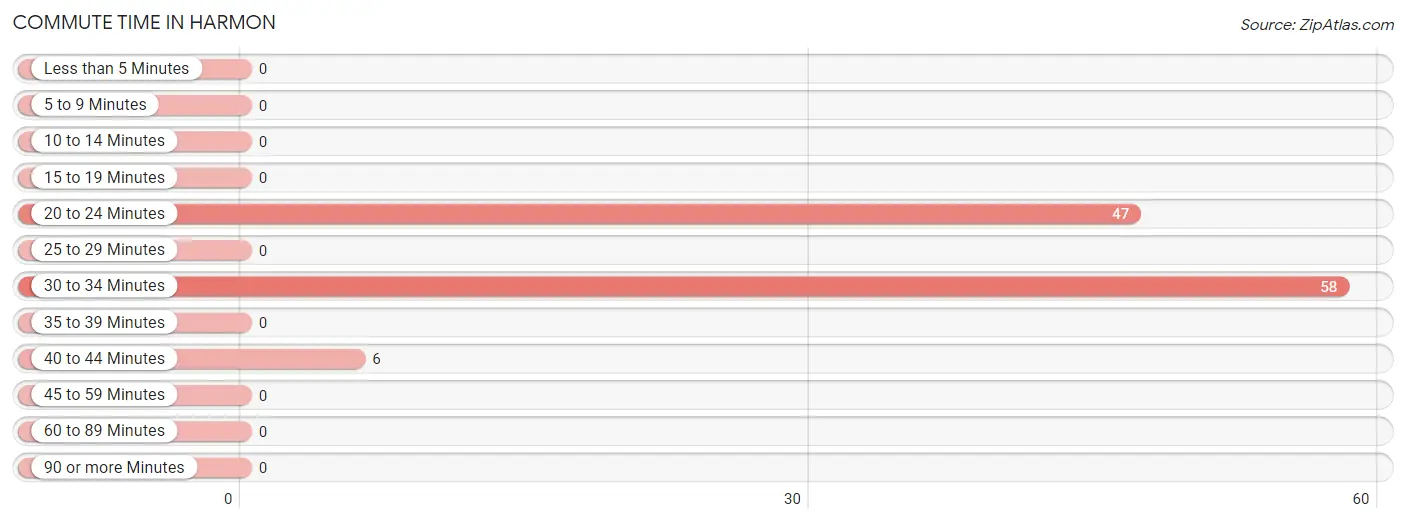
| Commute Time | # Commuters | % Commuters |
| Less than 5 Minutes | 0 | 0.0% |
| 5 to 9 Minutes | 0 | 0.0% |
| 10 to 14 Minutes | 0 | 0.0% |
| 15 to 19 Minutes | 0 | 0.0% |
| 20 to 24 Minutes | 47 | 42.3% |
| 25 to 29 Minutes | 0 | 0.0% |
| 30 to 34 Minutes | 58 | 52.2% |
| 35 to 39 Minutes | 0 | 0.0% |
| 40 to 44 Minutes | 6 | 5.4% |
| 45 to 59 Minutes | 0 | 0.0% |
| 60 to 89 Minutes | 0 | 0.0% |
| 90 or more Minutes | 0 | 0.0% |
Commute Time by Sex in Harmon
The most common commute times in Harmon are 20 to 24 minutes (27 commuters, 61.4%) for males and 30 to 34 minutes (47 commuters, 70.2%) for females.
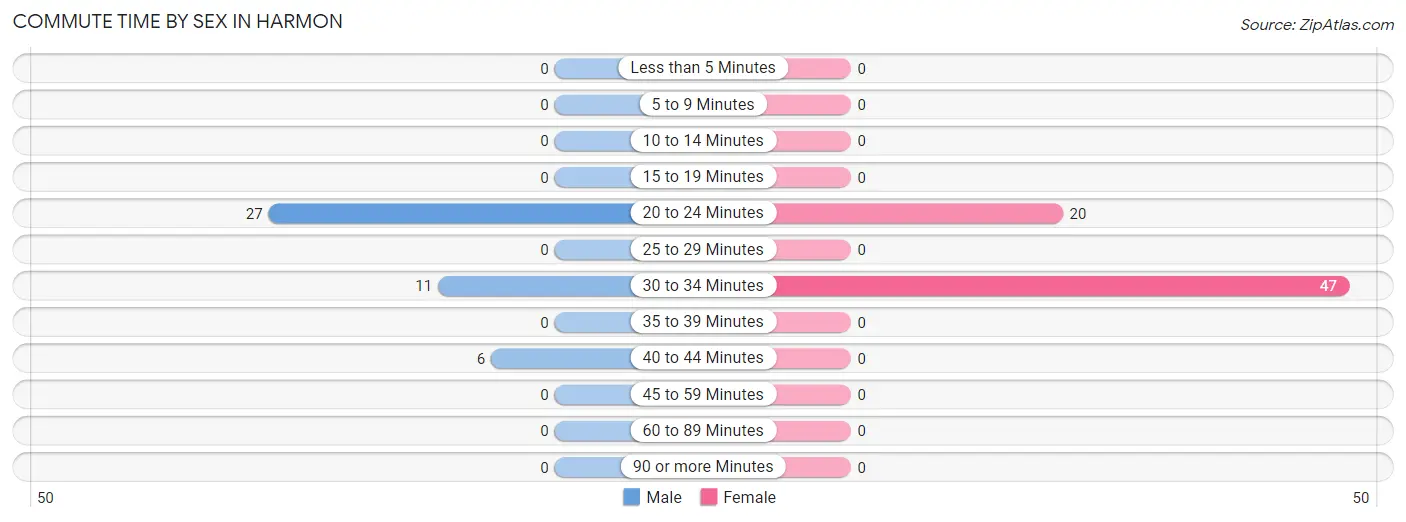
| Commute Time | Male | Female |
| Less than 5 Minutes | 0 (0.0%) | 0 (0.0%) |
| 5 to 9 Minutes | 0 (0.0%) | 0 (0.0%) |
| 10 to 14 Minutes | 0 (0.0%) | 0 (0.0%) |
| 15 to 19 Minutes | 0 (0.0%) | 0 (0.0%) |
| 20 to 24 Minutes | 27 (61.4%) | 20 (29.8%) |
| 25 to 29 Minutes | 0 (0.0%) | 0 (0.0%) |
| 30 to 34 Minutes | 11 (25.0%) | 47 (70.2%) |
| 35 to 39 Minutes | 0 (0.0%) | 0 (0.0%) |
| 40 to 44 Minutes | 6 (13.6%) | 0 (0.0%) |
| 45 to 59 Minutes | 0 (0.0%) | 0 (0.0%) |
| 60 to 89 Minutes | 0 (0.0%) | 0 (0.0%) |
| 90 or more Minutes | 0 (0.0%) | 0 (0.0%) |
Time of Departure to Work by Sex in Harmon
The most frequent times of departure to work in Harmon are 7:00 AM to 7:29 AM (22, 50.0%) for males and 8:00 AM to 8:29 AM (33, 49.2%) for females.
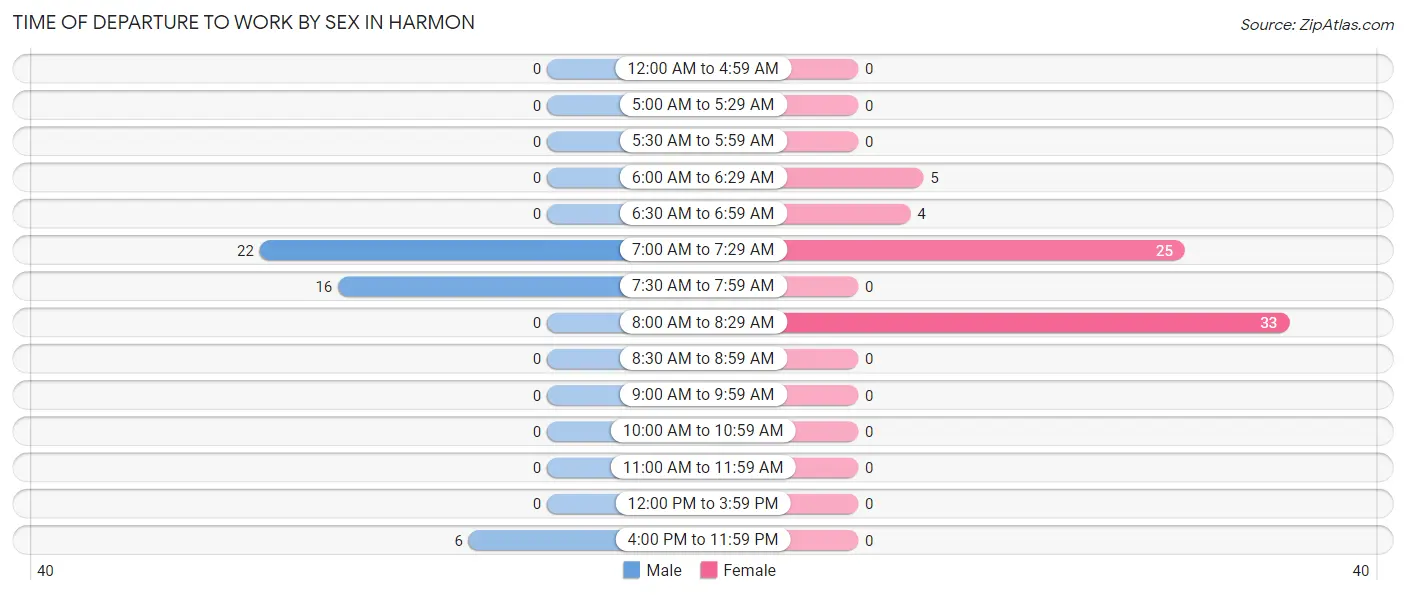
| Time of Departure | Male | Female |
| 12:00 AM to 4:59 AM | 0 (0.0%) | 0 (0.0%) |
| 5:00 AM to 5:29 AM | 0 (0.0%) | 0 (0.0%) |
| 5:30 AM to 5:59 AM | 0 (0.0%) | 0 (0.0%) |
| 6:00 AM to 6:29 AM | 0 (0.0%) | 5 (7.5%) |
| 6:30 AM to 6:59 AM | 0 (0.0%) | 4 (6.0%) |
| 7:00 AM to 7:29 AM | 22 (50.0%) | 25 (37.3%) |
| 7:30 AM to 7:59 AM | 16 (36.4%) | 0 (0.0%) |
| 8:00 AM to 8:29 AM | 0 (0.0%) | 33 (49.2%) |
| 8:30 AM to 8:59 AM | 0 (0.0%) | 0 (0.0%) |
| 9:00 AM to 9:59 AM | 0 (0.0%) | 0 (0.0%) |
| 10:00 AM to 10:59 AM | 0 (0.0%) | 0 (0.0%) |
| 11:00 AM to 11:59 AM | 0 (0.0%) | 0 (0.0%) |
| 12:00 PM to 3:59 PM | 0 (0.0%) | 0 (0.0%) |
| 4:00 PM to 11:59 PM | 6 (13.6%) | 0 (0.0%) |
| Total | 44 (100.0%) | 67 (100.0%) |
Housing Occupancy in Harmon
Occupancy by Ownership in Harmon
Of the total 80 dwellings in Harmon, owner-occupied units account for 80 (100.0%), while renter-occupied units make up 0 (0.0%).
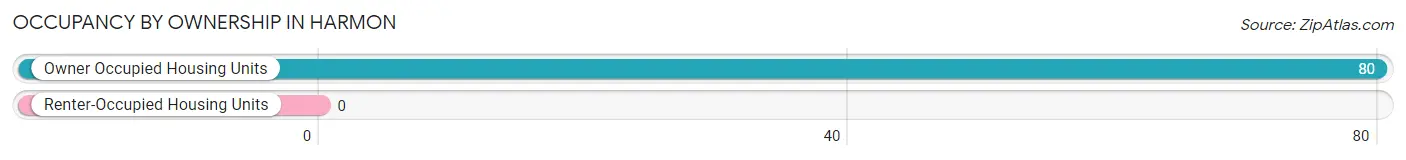
| Occupancy | # Housing Units | % Housing Units |
| Owner Occupied Housing Units | 80 | 100.0% |
| Renter-Occupied Housing Units | 0 | 0.0% |
| Total Occupied Housing Units | 80 | 100.0% |
Occupancy by Household Size in Harmon
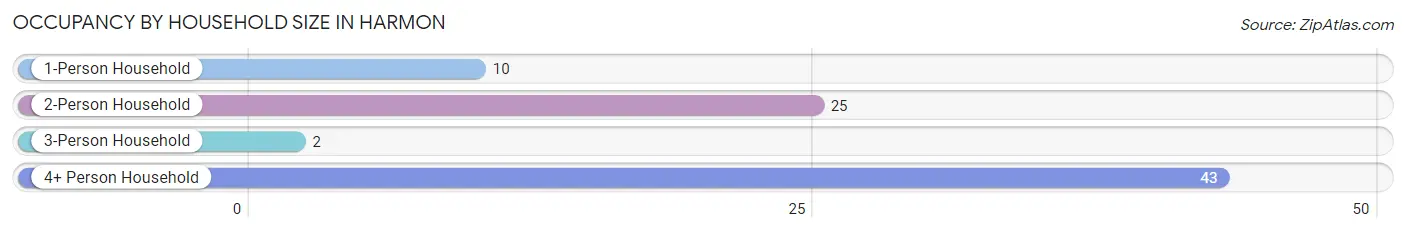
| Household Size | # Housing Units | % Housing Units |
| 1-Person Household | 10 | 12.5% |
| 2-Person Household | 25 | 31.2% |
| 3-Person Household | 2 | 2.5% |
| 4+ Person Household | 43 | 53.7% |
| Total Housing Units | 80 | 100.0% |
Occupancy by Ownership by Household Size in Harmon
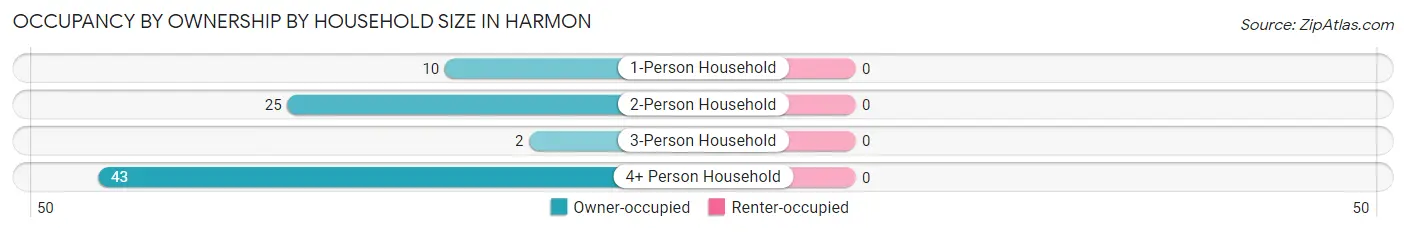
| Household Size | Owner-occupied | Renter-occupied |
| 1-Person Household | 10 (100.0%) | 0 (0.0%) |
| 2-Person Household | 25 (100.0%) | 0 (0.0%) |
| 3-Person Household | 2 (100.0%) | 0 (0.0%) |
| 4+ Person Household | 43 (100.0%) | 0 (0.0%) |
| Total Housing Units | 80 (100.0%) | 0 (0.0%) |
Occupancy by Educational Attainment in Harmon
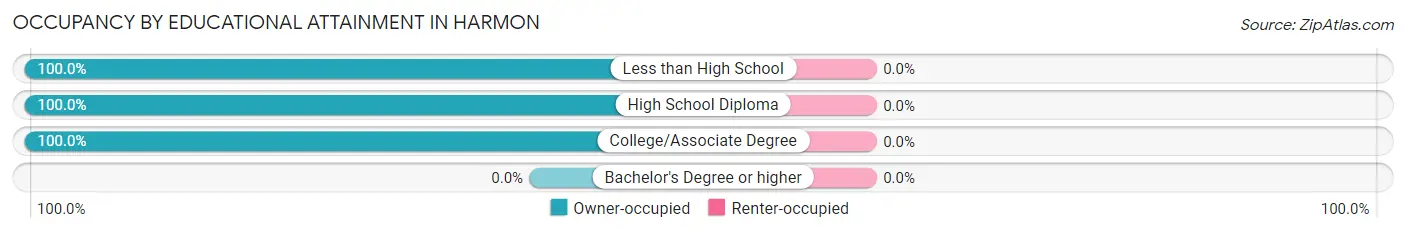
| Household Size | Owner-occupied | Renter-occupied |
| Less than High School | 25 (100.0%) | 0 (0.0%) |
| High School Diploma | 10 (100.0%) | 0 (0.0%) |
| College/Associate Degree | 45 (100.0%) | 0 (0.0%) |
| Bachelor's Degree or higher | 0 (0.0%) | 0 (0.0%) |
Occupancy by Age of Householder in Harmon
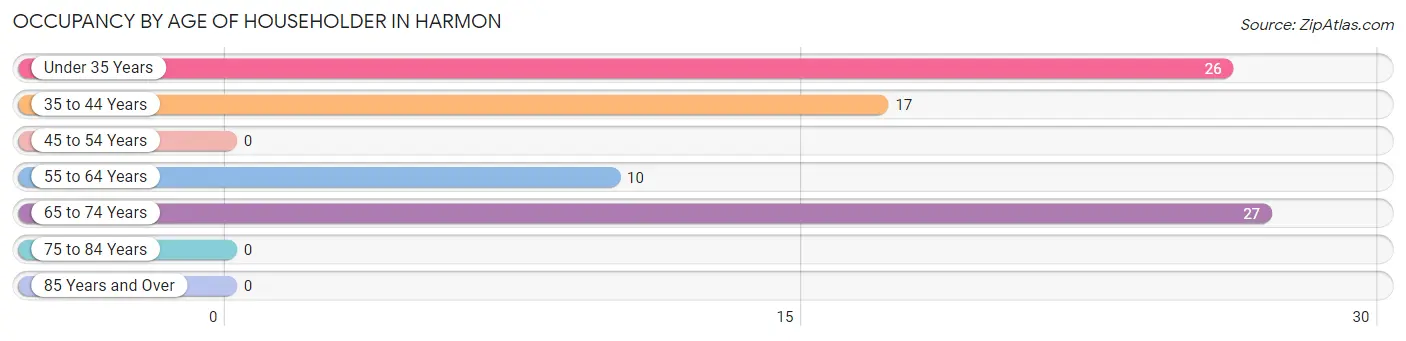
| Age Bracket | # Households | % Households |
| Under 35 Years | 26 | 32.5% |
| 35 to 44 Years | 17 | 21.2% |
| 45 to 54 Years | 0 | 0.0% |
| 55 to 64 Years | 10 | 12.5% |
| 65 to 74 Years | 27 | 33.8% |
| 75 to 84 Years | 0 | 0.0% |
| 85 Years and Over | 0 | 0.0% |
| Total | 80 | 100.0% |
Housing Finances in Harmon
Median Income by Occupancy in Harmon
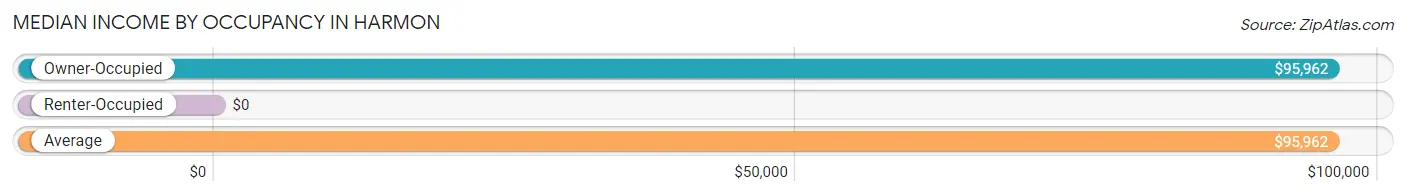
| Occupancy Type | # Households | Median Income |
| Owner-Occupied | 80 (100.0%) | $95,962 |
| Renter-Occupied | 0 (0.0%) | $0 |
| Average | 80 (100.0%) | $95,962 |
Occupancy by Householder Income Bracket in Harmon
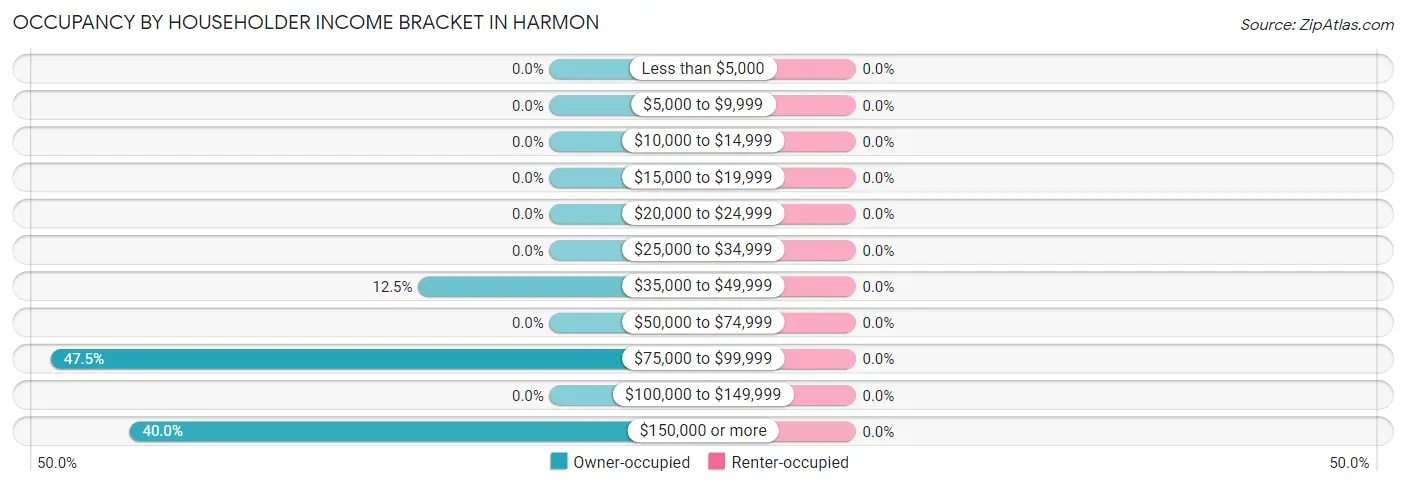
| Income Bracket | Owner-occupied | Renter-occupied |
| Less than $5,000 | 0 (0.0%) | 0 (0.0%) |
| $5,000 to $9,999 | 0 (0.0%) | 0 (0.0%) |
| $10,000 to $14,999 | 0 (0.0%) | 0 (0.0%) |
| $15,000 to $19,999 | 0 (0.0%) | 0 (0.0%) |
| $20,000 to $24,999 | 0 (0.0%) | 0 (0.0%) |
| $25,000 to $34,999 | 0 (0.0%) | 0 (0.0%) |
| $35,000 to $49,999 | 10 (12.5%) | 0 (0.0%) |
| $50,000 to $74,999 | 0 (0.0%) | 0 (0.0%) |
| $75,000 to $99,999 | 38 (47.5%) | 0 (0.0%) |
| $100,000 to $149,999 | 0 (0.0%) | 0 (0.0%) |
| $150,000 or more | 32 (40.0%) | 0 (0.0%) |
| Total | 80 (100.0%) | 0 (0.0%) |
Monthly Housing Cost Tiers in Harmon
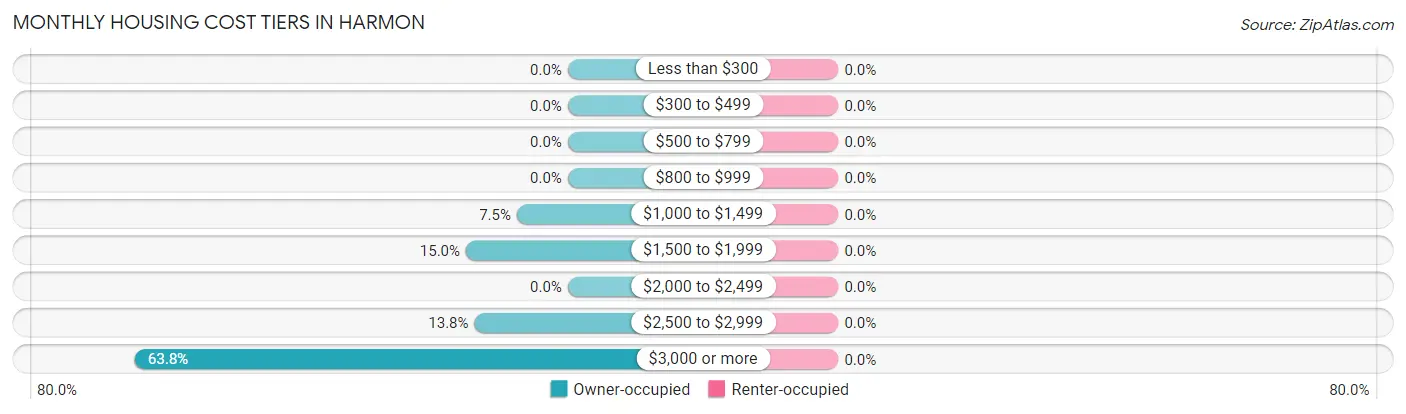
| Monthly Cost | Owner-occupied | Renter-occupied |
| Less than $300 | 0 (0.0%) | 0 (0.0%) |
| $300 to $499 | 0 (0.0%) | 0 (0.0%) |
| $500 to $799 | 0 (0.0%) | 0 (0.0%) |
| $800 to $999 | 0 (0.0%) | 0 (0.0%) |
| $1,000 to $1,499 | 6 (7.5%) | 0 (0.0%) |
| $1,500 to $1,999 | 12 (15.0%) | 0 (0.0%) |
| $2,000 to $2,499 | 0 (0.0%) | 0 (0.0%) |
| $2,500 to $2,999 | 11 (13.8%) | 0 (0.0%) |
| $3,000 or more | 51 (63.7%) | 0 (0.0%) |
| Total | 80 (100.0%) | 0 (0.0%) |
Physical Housing Characteristics in Harmon
Housing Structures in Harmon
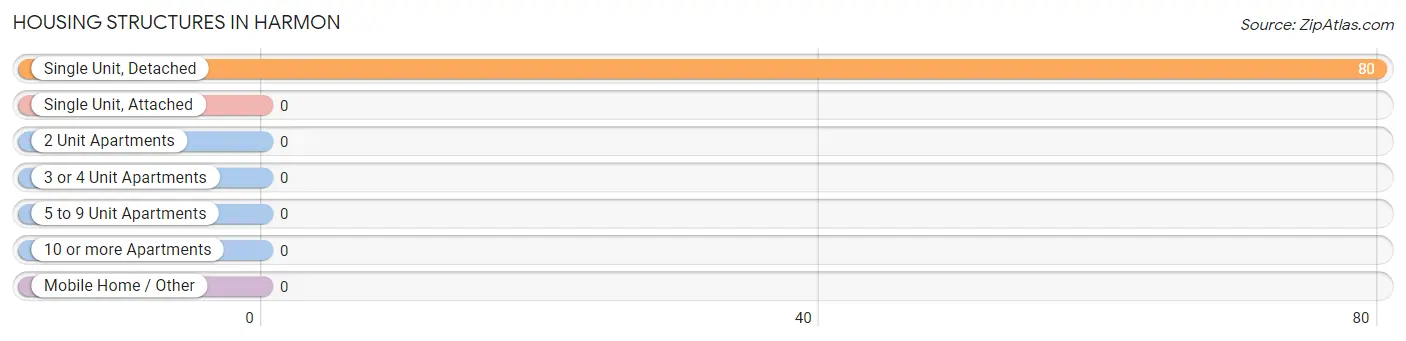
| Structure Type | # Housing Units | % Housing Units |
| Single Unit, Detached | 80 | 100.0% |
| Single Unit, Attached | 0 | 0.0% |
| 2 Unit Apartments | 0 | 0.0% |
| 3 or 4 Unit Apartments | 0 | 0.0% |
| 5 to 9 Unit Apartments | 0 | 0.0% |
| 10 or more Apartments | 0 | 0.0% |
| Mobile Home / Other | 0 | 0.0% |
| Total | 80 | 100.0% |
Housing Structures by Occupancy in Harmon
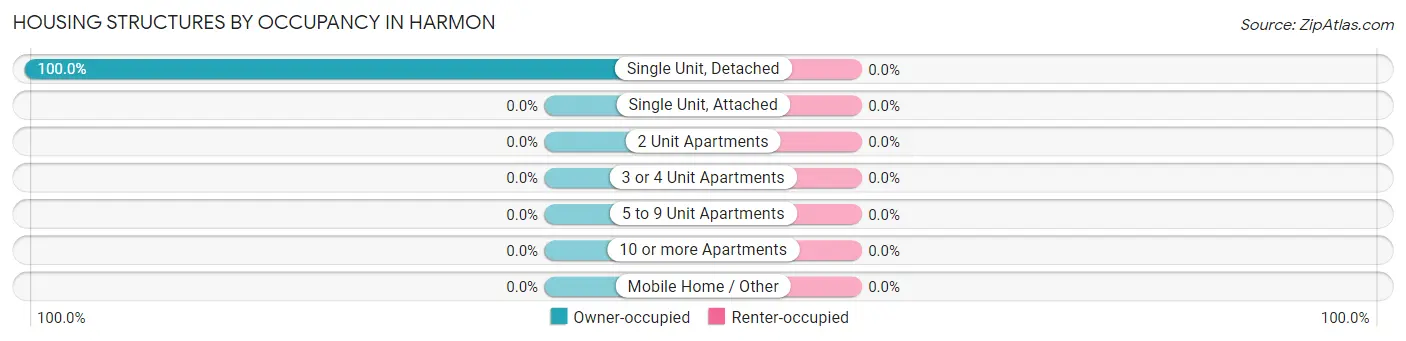
| Structure Type | Owner-occupied | Renter-occupied |
| Single Unit, Detached | 80 (100.0%) | 0 (0.0%) |
| Single Unit, Attached | 0 (0.0%) | 0 (0.0%) |
| 2 Unit Apartments | 0 (0.0%) | 0 (0.0%) |
| 3 or 4 Unit Apartments | 0 (0.0%) | 0 (0.0%) |
| 5 to 9 Unit Apartments | 0 (0.0%) | 0 (0.0%) |
| 10 or more Apartments | 0 (0.0%) | 0 (0.0%) |
| Mobile Home / Other | 0 (0.0%) | 0 (0.0%) |
| Total | 80 (100.0%) | 0 (0.0%) |
Housing Structures by Number of Rooms in Harmon
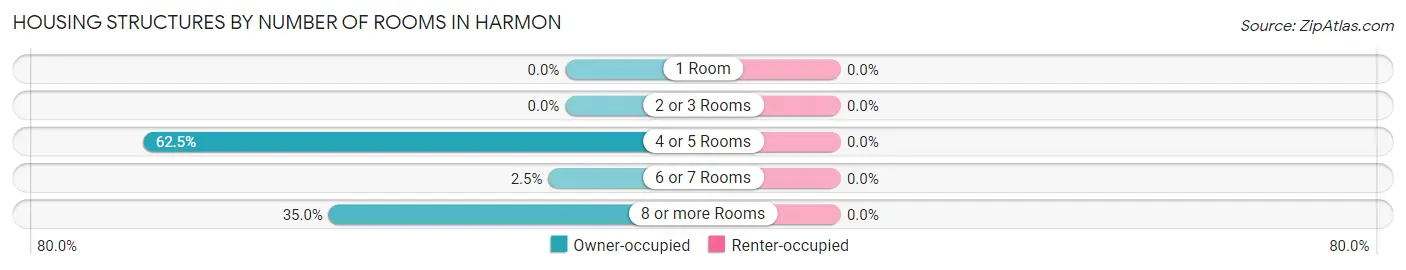
| Number of Rooms | Owner-occupied | Renter-occupied |
| 1 Room | 0 (0.0%) | 0 (0.0%) |
| 2 or 3 Rooms | 0 (0.0%) | 0 (0.0%) |
| 4 or 5 Rooms | 50 (62.5%) | 0 (0.0%) |
| 6 or 7 Rooms | 2 (2.5%) | 0 (0.0%) |
| 8 or more Rooms | 28 (35.0%) | 0 (0.0%) |
| Total | 80 (100.0%) | 0 (0.0%) |
Housing Structure by Heating Type in Harmon
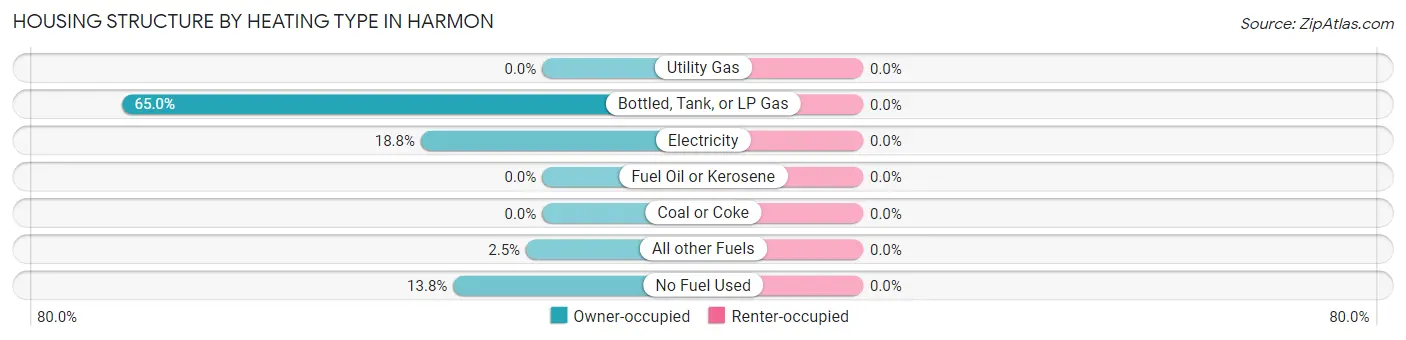
| Heating Type | Owner-occupied | Renter-occupied |
| Utility Gas | 0 (0.0%) | 0 (0.0%) |
| Bottled, Tank, or LP Gas | 52 (65.0%) | 0 (0.0%) |
| Electricity | 15 (18.8%) | 0 (0.0%) |
| Fuel Oil or Kerosene | 0 (0.0%) | 0 (0.0%) |
| Coal or Coke | 0 (0.0%) | 0 (0.0%) |
| All other Fuels | 2 (2.5%) | 0 (0.0%) |
| No Fuel Used | 11 (13.8%) | 0 (0.0%) |
| Total | 80 (100.0%) | 0 (0.0%) |
Household Vehicle Usage in Harmon
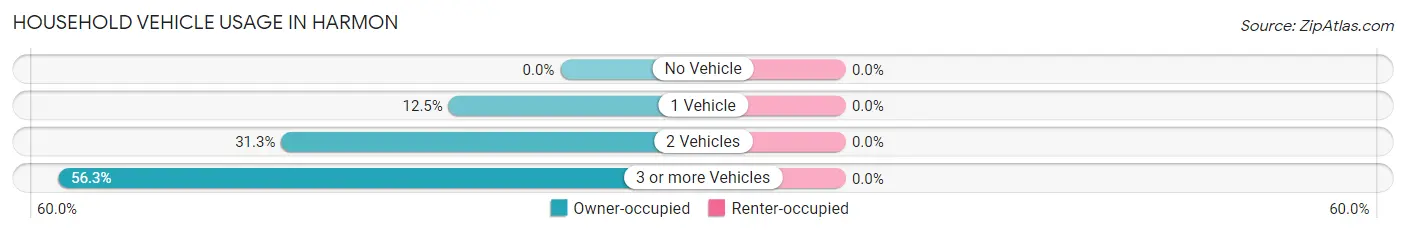
| Vehicles per Household | Owner-occupied | Renter-occupied |
| No Vehicle | 0 (0.0%) | 0 (0.0%) |
| 1 Vehicle | 10 (12.5%) | 0 (0.0%) |
| 2 Vehicles | 25 (31.2%) | 0 (0.0%) |
| 3 or more Vehicles | 45 (56.2%) | 0 (0.0%) |
| Total | 80 (100.0%) | 0 (0.0%) |
Real Estate & Mortgages in Harmon
Real Estate and Mortgage Overview in Harmon
| Characteristic | Without Mortgage | With Mortgage |
| Housing Units | 0 | 80 |
| Median Property Value | - | - |
| Median Household Income | - | - |
| Monthly Housing Costs | - | - |
| Real Estate Taxes | - | - |
Property Value by Mortgage Status in Harmon
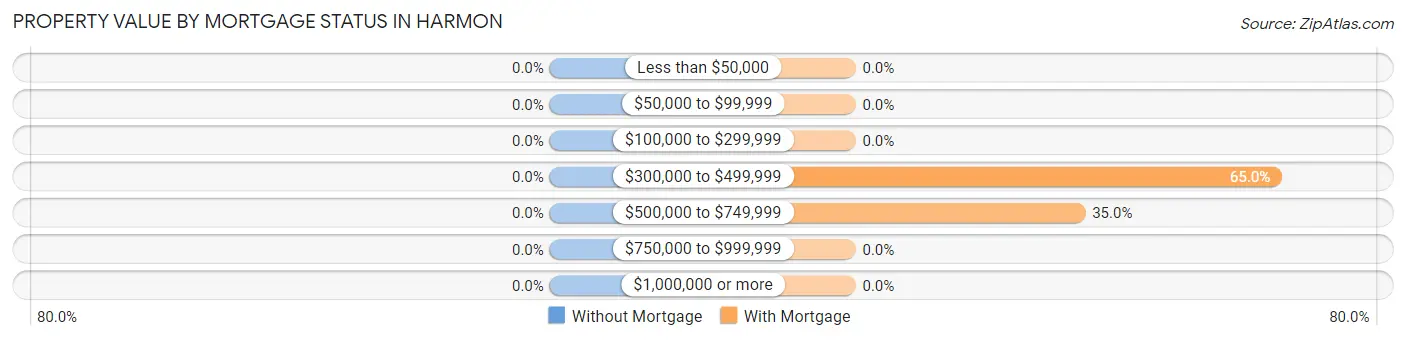
| Property Value | Without Mortgage | With Mortgage |
| Less than $50,000 | 0 (0.0%) | 0 (0.0%) |
| $50,000 to $99,999 | 0 (0.0%) | 0 (0.0%) |
| $100,000 to $299,999 | 0 (0.0%) | 0 (0.0%) |
| $300,000 to $499,999 | 0 (0.0%) | 52 (65.0%) |
| $500,000 to $749,999 | 0 (0.0%) | 28 (35.0%) |
| $750,000 to $999,999 | 0 (0.0%) | 0 (0.0%) |
| $1,000,000 or more | 0 (0.0%) | 0 (0.0%) |
| Total | 0 (0.0%) | 80 (100.0%) |
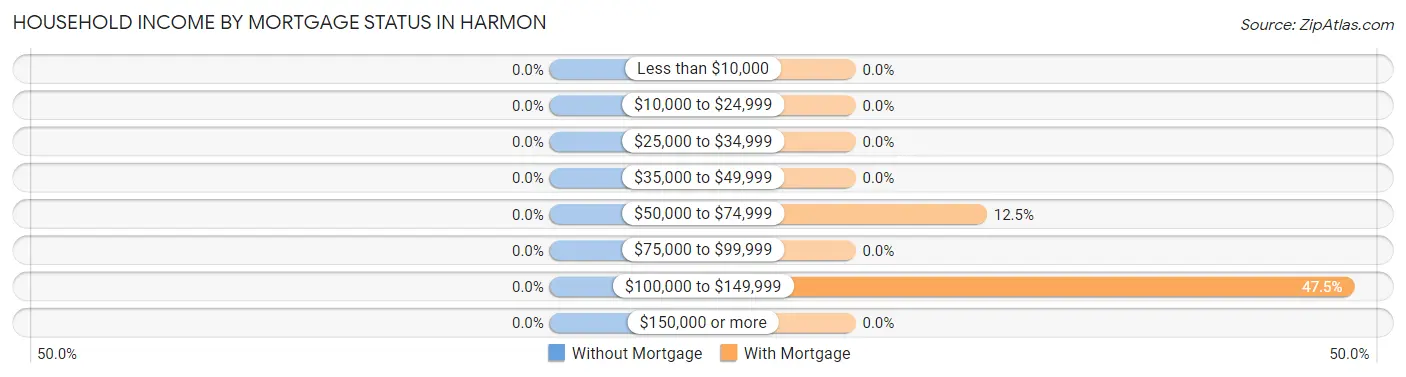
Household Income by Mortgage Status in Harmon
| Household Income | Without Mortgage | With Mortgage |
| Less than $10,000 | 0 (0.0%) | 0 (0.0%) |
| $10,000 to $24,999 | 0 (0.0%) | 0 (0.0%) |
| $25,000 to $34,999 | 0 (0.0%) | 0 (0.0%) |
| $35,000 to $49,999 | 0 (0.0%) | 0 (0.0%) |
| $50,000 to $74,999 | 0 (0.0%) | 10 (12.5%) |
| $75,000 to $99,999 | 0 (0.0%) | 0 (0.0%) |
| $100,000 to $149,999 | 0 (0.0%) | 38 (47.5%) |
| $150,000 or more | 0 (0.0%) | 0 (0.0%) |
| Total | 0 (0.0%) | 80 (100.0%) |
Property Value to Household Income Ratio in Harmon
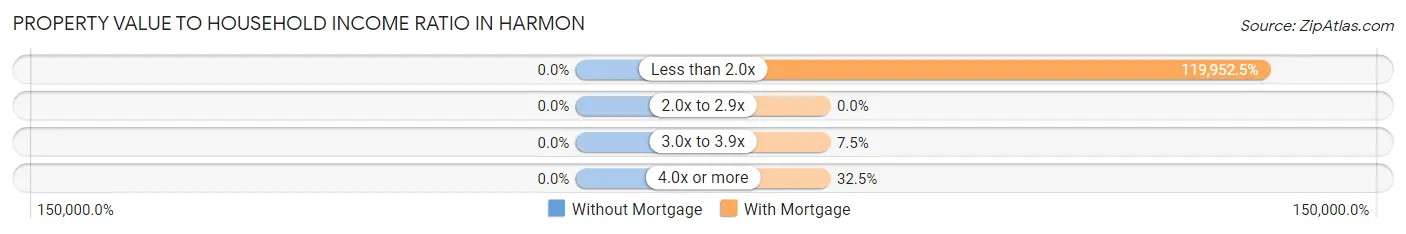
| Value-to-Income Ratio | Without Mortgage | With Mortgage |
| Less than 2.0x | 0 (0.0%) | 95,962 (119,952.5%) |
| 2.0x to 2.9x | 0 (0.0%) | 0 (0.0%) |
| 3.0x to 3.9x | 0 (0.0%) | 6 (7.5%) |
| 4.0x or more | 0 (0.0%) | 26 (32.5%) |
| Total | 0 (0.0%) | 80 (100.0%) |
Real Estate Taxes by Mortgage Status in Harmon
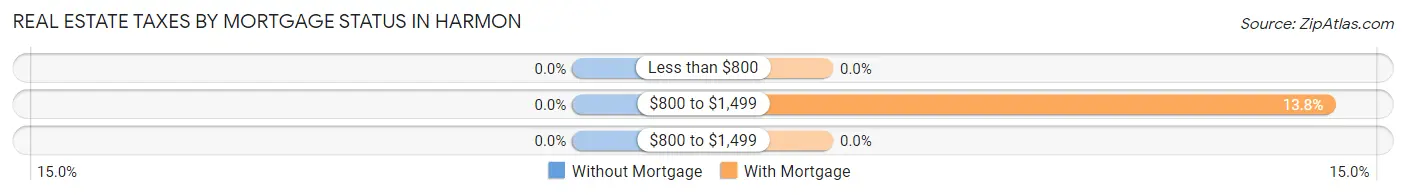
| Property Taxes | Without Mortgage | With Mortgage |
| Less than $800 | 0 (0.0%) | 0 (0.0%) |
| $800 to $1,499 | 0 (0.0%) | 11 (13.8%) |
| $800 to $1,499 | 0 (0.0%) | 0 (0.0%) |
| Total | 0 (0.0%) | 80 (100.0%) |
Health & Disability in Harmon
Health Insurance Coverage by Age in Harmon
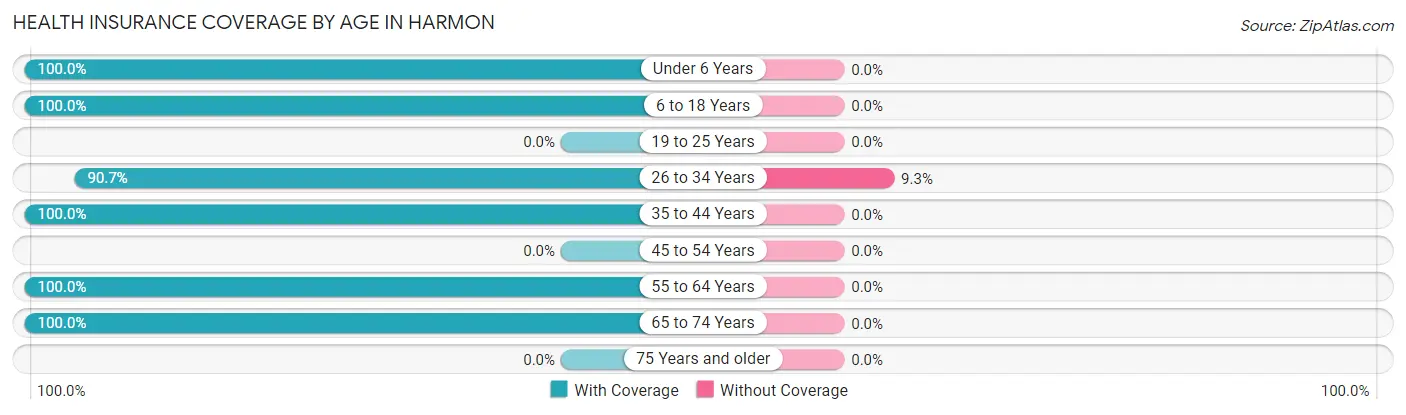
| Age Bracket | With Coverage | Without Coverage |
| Under 6 Years | 57 (100.0%) | 0 (0.0%) |
| 6 to 18 Years | 31 (100.0%) | 0 (0.0%) |
| 19 to 25 Years | 0 (0.0%) | 0 (0.0%) |
| 26 to 34 Years | 39 (90.7%) | 4 (9.3%) |
| 35 to 44 Years | 40 (100.0%) | 0 (0.0%) |
| 45 to 54 Years | 0 (0.0%) | 0 (0.0%) |
| 55 to 64 Years | 15 (100.0%) | 0 (0.0%) |
| 65 to 74 Years | 49 (100.0%) | 0 (0.0%) |
| 75 Years and older | 0 (0.0%) | 0 (0.0%) |
| Total | 231 (98.3%) | 4 (1.7%) |
Health Insurance Coverage by Citizenship Status in Harmon
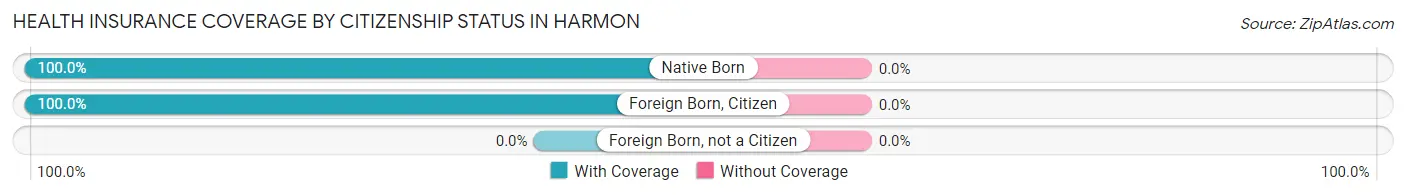
| Citizenship Status | With Coverage | Without Coverage |
| Native Born | 57 (100.0%) | 0 (0.0%) |
| Foreign Born, Citizen | 31 (100.0%) | 0 (0.0%) |
| Foreign Born, not a Citizen | 0 (0.0%) | 0 (0.0%) |
Health Insurance Coverage by Household Income in Harmon
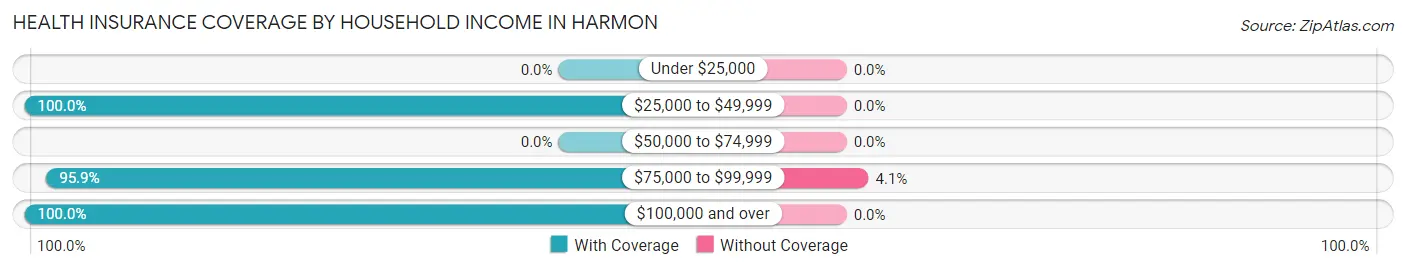
| Household Income | With Coverage | Without Coverage |
| Under $25,000 | 0 (0.0%) | 0 (0.0%) |
| $25,000 to $49,999 | 10 (100.0%) | 0 (0.0%) |
| $50,000 to $74,999 | 0 (0.0%) | 0 (0.0%) |
| $75,000 to $99,999 | 94 (95.9%) | 4 (4.1%) |
| $100,000 and over | 127 (100.0%) | 0 (0.0%) |
Public vs Private Health Insurance Coverage by Age in Harmon
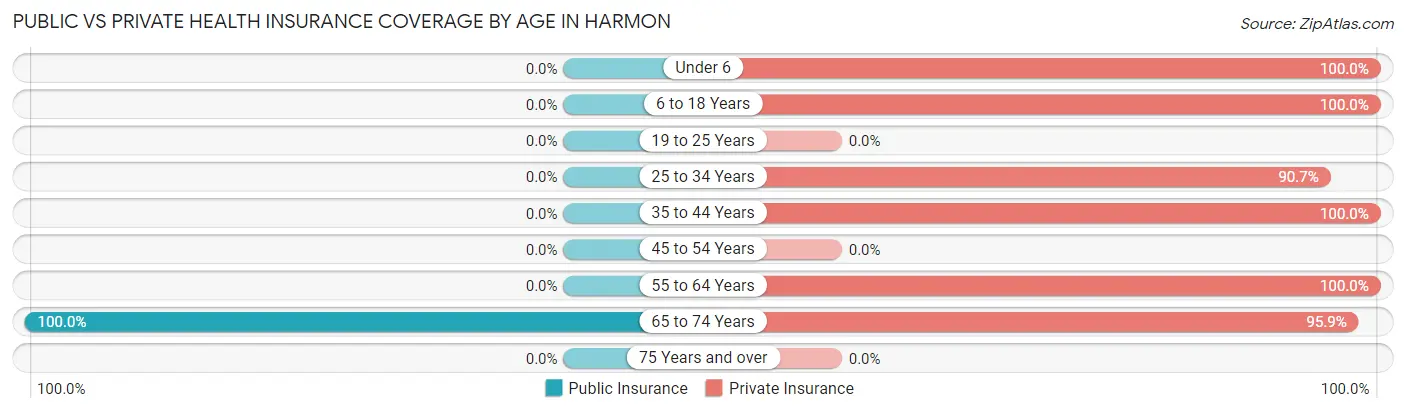
| Age Bracket | Public Insurance | Private Insurance |
| Under 6 | 0 (0.0%) | 57 (100.0%) |
| 6 to 18 Years | 0 (0.0%) | 31 (100.0%) |
| 19 to 25 Years | 0 (0.0%) | 0 (0.0%) |
| 25 to 34 Years | 0 (0.0%) | 39 (90.7%) |
| 35 to 44 Years | 0 (0.0%) | 40 (100.0%) |
| 45 to 54 Years | 0 (0.0%) | 0 (0.0%) |
| 55 to 64 Years | 0 (0.0%) | 15 (100.0%) |
| 65 to 74 Years | 49 (100.0%) | 47 (95.9%) |
| 75 Years and over | 0 (0.0%) | 0 (0.0%) |
| Total | 49 (20.8%) | 229 (97.5%) |
Disability Status by Sex by Age in Harmon
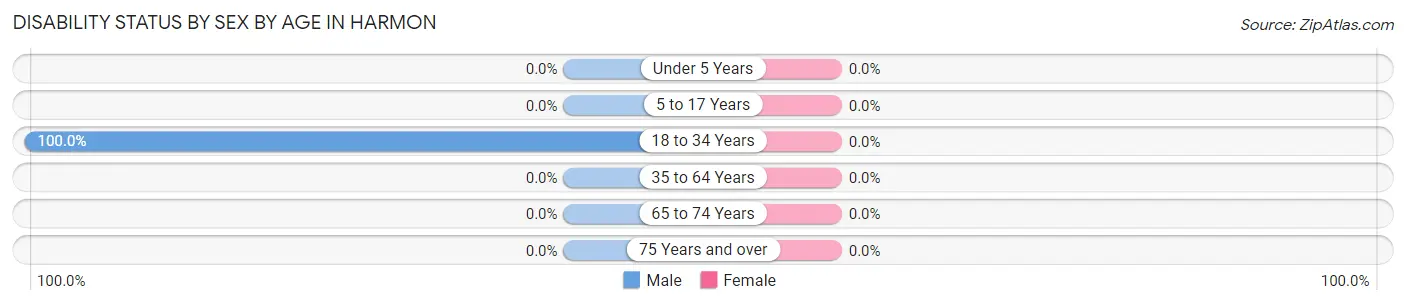
| Age Bracket | Male | Female |
| Under 5 Years | 0 (0.0%) | 0 (0.0%) |
| 5 to 17 Years | 0 (0.0%) | 0 (0.0%) |
| 18 to 34 Years | 13 (100.0%) | 0 (0.0%) |
| 35 to 64 Years | 0 (0.0%) | 0 (0.0%) |
| 65 to 74 Years | 0 (0.0%) | 0 (0.0%) |
| 75 Years and over | 0 (0.0%) | 0 (0.0%) |
Disability Class by Sex by Age in Harmon
Disability Class: Hearing Difficulty
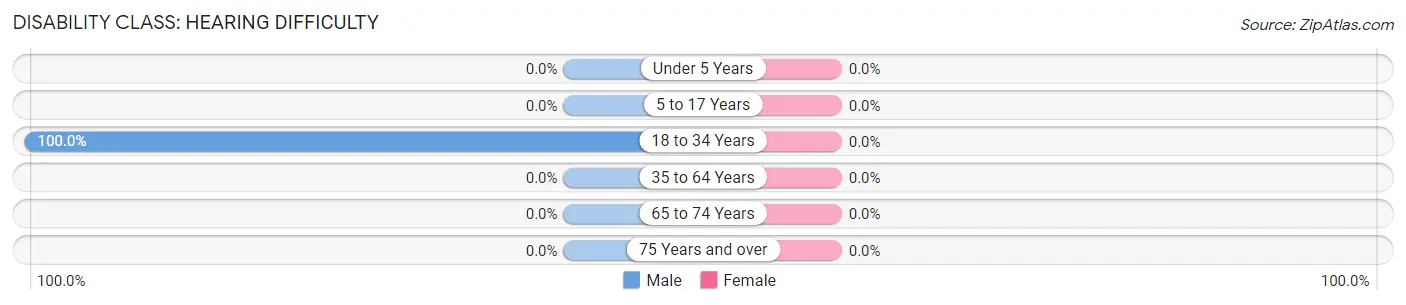
| Age Bracket | Male | Female |
| Under 5 Years | 0 (0.0%) | 0 (0.0%) |
| 5 to 17 Years | 0 (0.0%) | 0 (0.0%) |
| 18 to 34 Years | 13 (100.0%) | 0 (0.0%) |
| 35 to 64 Years | 0 (0.0%) | 0 (0.0%) |
| 65 to 74 Years | 0 (0.0%) | 0 (0.0%) |
| 75 Years and over | 0 (0.0%) | 0 (0.0%) |
Disability Class: Vision Difficulty
| Age Bracket | Male | Female |
| Under 5 Years | 0 (0.0%) | 0 (0.0%) |
| 5 to 17 Years | 0 (0.0%) | 0 (0.0%) |
| 18 to 34 Years | 0 (0.0%) | 0 (0.0%) |
| 35 to 64 Years | 0 (0.0%) | 0 (0.0%) |
| 65 to 74 Years | 0 (0.0%) | 0 (0.0%) |
| 75 Years and over | 0 (0.0%) | 0 (0.0%) |
Disability Class: Cognitive Difficulty
| Age Bracket | Male | Female |
| 5 to 17 Years | 0 (0.0%) | 0 (0.0%) |
| 18 to 34 Years | 0 (0.0%) | 0 (0.0%) |
| 35 to 64 Years | 0 (0.0%) | 0 (0.0%) |
| 65 to 74 Years | 0 (0.0%) | 0 (0.0%) |
| 75 Years and over | 0 (0.0%) | 0 (0.0%) |
Disability Class: Ambulatory Difficulty
| Age Bracket | Male | Female |
| 5 to 17 Years | 0 (0.0%) | 0 (0.0%) |
| 18 to 34 Years | 0 (0.0%) | 0 (0.0%) |
| 35 to 64 Years | 0 (0.0%) | 0 (0.0%) |
| 65 to 74 Years | 0 (0.0%) | 0 (0.0%) |
| 75 Years and over | 0 (0.0%) | 0 (0.0%) |
Disability Class: Self-Care Difficulty
| Age Bracket | Male | Female |
| 5 to 17 Years | 0 (0.0%) | 0 (0.0%) |
| 18 to 34 Years | 0 (0.0%) | 0 (0.0%) |
| 35 to 64 Years | 0 (0.0%) | 0 (0.0%) |
| 65 to 74 Years | 0 (0.0%) | 0 (0.0%) |
| 75 Years and over | 0 (0.0%) | 0 (0.0%) |
Technology Access in Harmon
Computing Device Access in Harmon
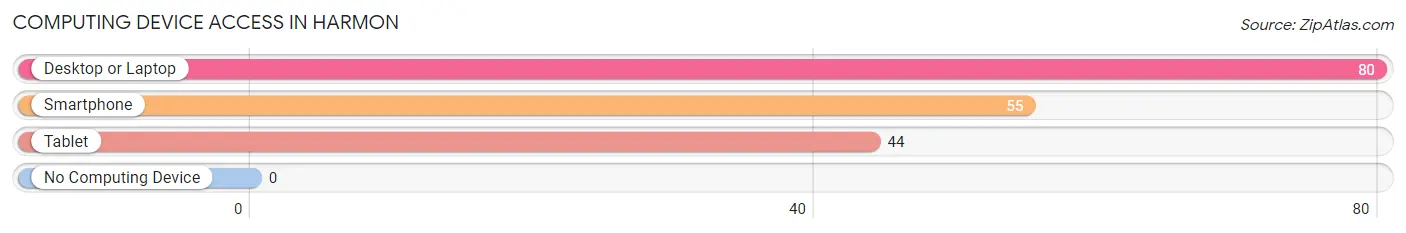
| Device Type | # Households | % Households |
| Desktop or Laptop | 80 | 100.0% |
| Smartphone | 55 | 68.8% |
| Tablet | 44 | 55.0% |
| No Computing Device | 0 | 0.0% |
| Total | 80 | 100.0% |
Internet Access in Harmon
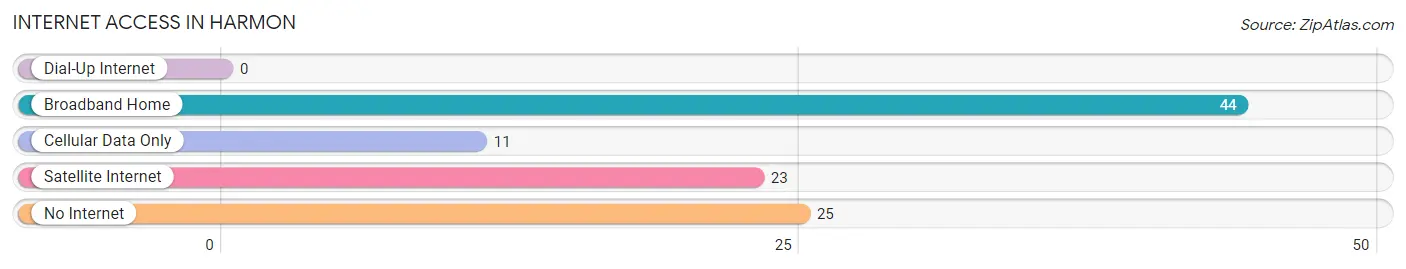
| Internet Type | # Households | % Households |
| Dial-Up Internet | 0 | 0.0% |
| Broadband Home | 44 | 55.0% |
| Cellular Data Only | 11 | 13.8% |
| Satellite Internet | 23 | 28.7% |
| No Internet | 25 | 31.2% |
| Total | 80 | 100.0% |
Harmon Summary
The small town of Harmon, North Dakota is located in the southwestern corner of the state, in the heart of the Great Plains. It is situated in the county of Hettinger, and is surrounded by the cities of Mott, New England, and Regent. Harmon has a population of just over 200 people, and is a rural community with a strong agricultural base.
Geographically, Harmon is located in the Great Plains region of North Dakota. The town is situated on the edge of the Missouri Plateau, and is surrounded by rolling hills and prairies. The area is known for its wide open spaces and beautiful scenery. The climate in Harmon is typical of the Great Plains, with hot summers and cold winters. The average temperature in the summer is around 80 degrees Fahrenheit, and in the winter it can drop to below zero.
The economy of Harmon is largely based on agriculture. The town is home to several farms, and the surrounding area is used for growing wheat, corn, and other crops. The town also has a few small businesses, including a grocery store, a hardware store, and a few restaurants.
The demographics of Harmon are largely homogeneous. The majority of the population is white, with a small percentage of Native Americans and African Americans. The median household income in Harmon is around $35,000, and the median age is around 40 years old.
Harmon is a small town with a rich history. The town was founded in 1883, and was named after the Harmon family, who were among the first settlers in the area. The town has seen its share of struggles over the years, including a devastating tornado in the early 1900s. Despite these hardships, Harmon has remained a close-knit community, and its residents are proud of their town’s history and heritage.
Harmon is a small town with a big heart. The town is home to a tight-knit community of people who are proud of their town and its history. The town is surrounded by beautiful scenery, and its residents enjoy the peaceful atmosphere and the close-knit community. Harmon is a great place to live, work, and raise a family.
Common Questions
What is Per Capita Income in Harmon?
Per Capita income in Harmon is $37,132.
What is the Median Household income in Harmon?
Median Household Income in Harmon is $95,962.
What is Income or Wage Gap in Harmon?
Income or Wage Gap in Harmon is 69.8%.
Women in Harmon earn 30.2 cents for every dollar earned by a man.
What is Inequality or Gini Index in Harmon?
Inequality or Gini Index in Harmon is 0.25.
What is the Total Population of Harmon?
Total Population of Harmon is 235.
What is the Total Male Population of Harmon?
Total Male Population of Harmon is 121.
What is the Total Female Population of Harmon?
Total Female Population of Harmon is 114.
What is the Ratio of Males per 100 Females in Harmon?
There are 106.14 Males per 100 Females in Harmon.
What is the Ratio of Females per 100 Males in Harmon?
There are 94.21 Females per 100 Males in Harmon.
What is the Median Population Age in Harmon?
Median Population Age in Harmon is 33.0 Years.
What is the Average Family Size in Harmon
Average Family Size in Harmon is 3.2 People.
What is the Average Household Size in Harmon
Average Household Size in Harmon is 2.9 People.
How Large is the Labor Force in Harmon?
There are 111 People in the Labor Forcein in Harmon.
What is the Percentage of People in the Labor Force in Harmon?
73.0% of People are in the Labor Force in Harmon.