Foxworth, MS Map & Demographics
Foxworth Map
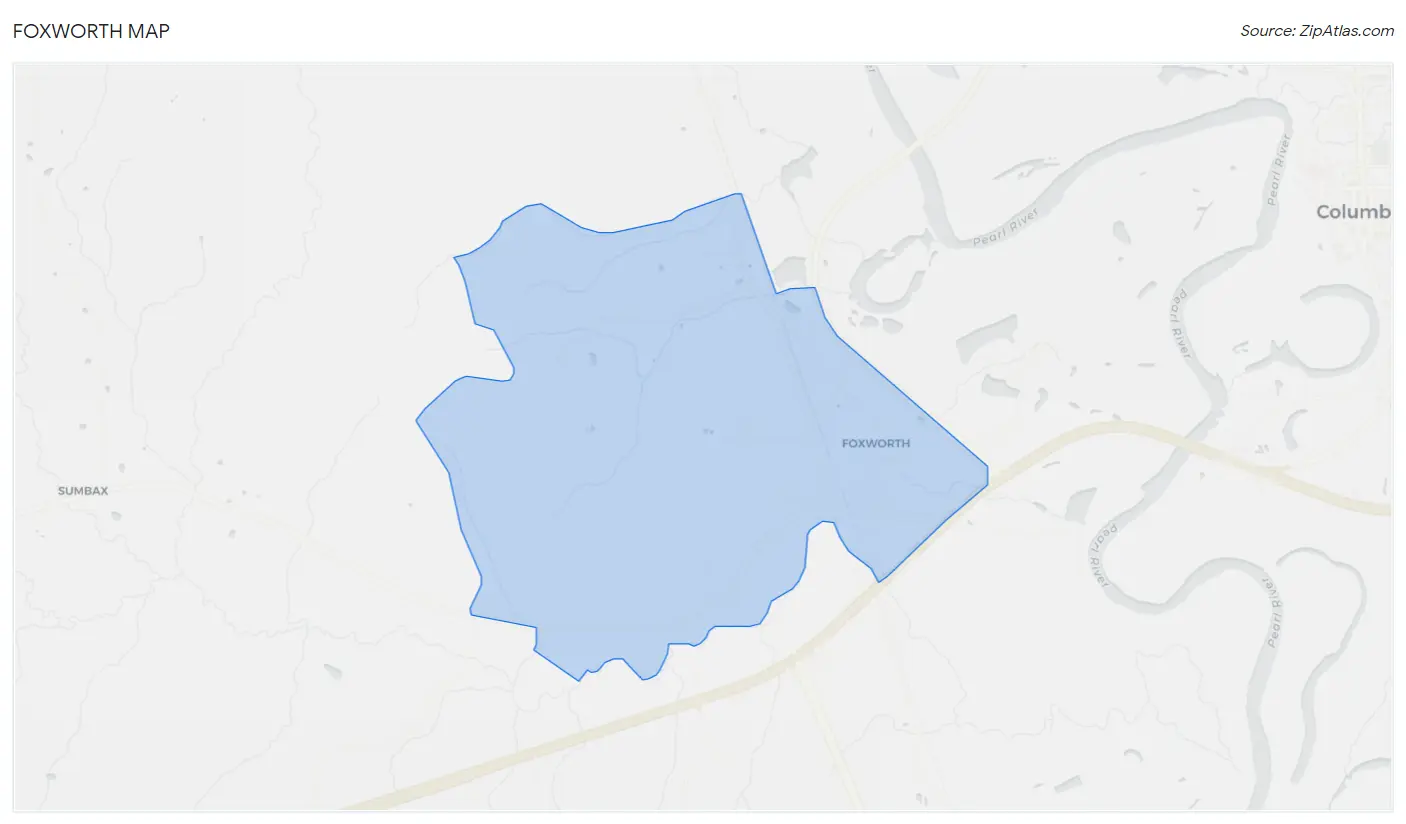
Foxworth Overview
$9,201
PER CAPITA INCOME
$20,288
AVG FAMILY INCOME
$21,154
AVG HOUSEHOLD INCOME
0.41
INEQUALITY / GINI INDEX
606
TOTAL POPULATION
268
MALE POPULATION
338
FEMALE POPULATION
79.29
MALES / 100 FEMALES
126.12
FEMALES / 100 MALES
30.0
MEDIAN AGE
4.0
AVG FAMILY SIZE
3.2
AVG HOUSEHOLD SIZE
164
LABOR FORCE [ PEOPLE ]
39.6%
PERCENT IN LABOR FORCE
20.7%
UNEMPLOYMENT RATE
Foxworth Zip Codes
Foxworth Area Codes
Income in Foxworth
Income Overview in Foxworth
Per Capita Income in Foxworth is $9,201, while median incomes of families and households are $20,288 and $21,154 respectively.
| Characteristic | Number | Measure |
| Per Capita Income | 606 | $9,201 |
| Median Family Income | 127 | $20,288 |
| Mean Family Income | 127 | $23,882 |
| Median Household Income | 190 | $21,154 |
| Mean Household Income | 190 | $24,488 |
| Income Deficit | 127 | $0 |
| Wage / Income Gap (%) | 606 | 0.00% |
| Wage / Income Gap ($) | 606 | 100.00¢ per $1 |
| Gini / Inequality Index | 606 | 0.41 |
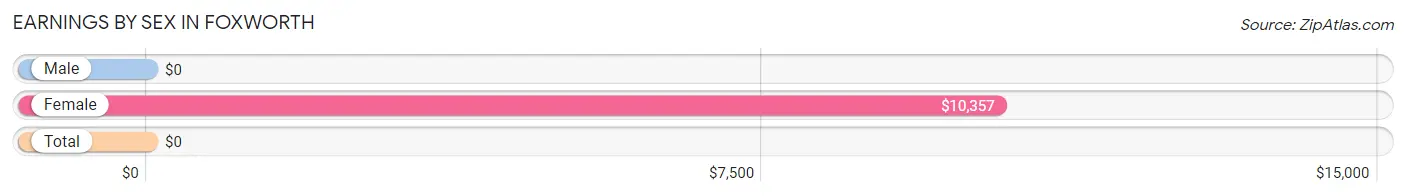
Earnings by Sex in Foxworth
| Sex | Number | Average Earnings |
| Male | 85 (47.5%) | $0 |
| Female | 94 (52.5%) | $10,357 |
| Total | 179 (100.0%) | $0 |
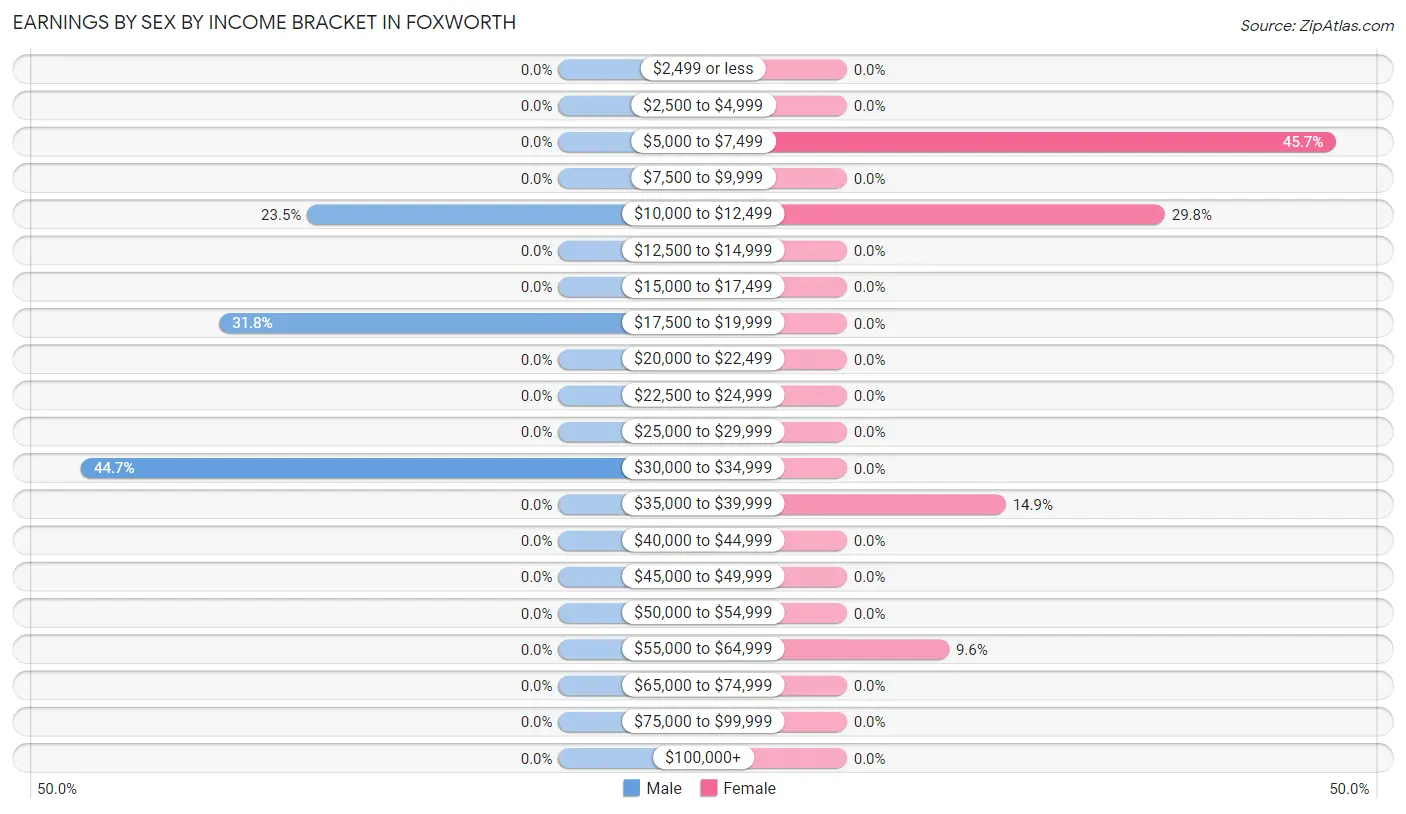
Earnings by Sex by Income Bracket in Foxworth
The most common earnings brackets in Foxworth are $30,000 to $34,999 for men (38 | 44.7%) and $5,000 to $7,499 for women (43 | 45.7%).
| Income | Male | Female |
| $2,499 or less | 0 (0.0%) | 0 (0.0%) |
| $2,500 to $4,999 | 0 (0.0%) | 0 (0.0%) |
| $5,000 to $7,499 | 0 (0.0%) | 43 (45.7%) |
| $7,500 to $9,999 | 0 (0.0%) | 0 (0.0%) |
| $10,000 to $12,499 | 20 (23.5%) | 28 (29.8%) |
| $12,500 to $14,999 | 0 (0.0%) | 0 (0.0%) |
| $15,000 to $17,499 | 0 (0.0%) | 0 (0.0%) |
| $17,500 to $19,999 | 27 (31.8%) | 0 (0.0%) |
| $20,000 to $22,499 | 0 (0.0%) | 0 (0.0%) |
| $22,500 to $24,999 | 0 (0.0%) | 0 (0.0%) |
| $25,000 to $29,999 | 0 (0.0%) | 0 (0.0%) |
| $30,000 to $34,999 | 38 (44.7%) | 0 (0.0%) |
| $35,000 to $39,999 | 0 (0.0%) | 14 (14.9%) |
| $40,000 to $44,999 | 0 (0.0%) | 0 (0.0%) |
| $45,000 to $49,999 | 0 (0.0%) | 0 (0.0%) |
| $50,000 to $54,999 | 0 (0.0%) | 0 (0.0%) |
| $55,000 to $64,999 | 0 (0.0%) | 9 (9.6%) |
| $65,000 to $74,999 | 0 (0.0%) | 0 (0.0%) |
| $75,000 to $99,999 | 0 (0.0%) | 0 (0.0%) |
| $100,000+ | 0 (0.0%) | 0 (0.0%) |
| Total | 85 (100.0%) | 94 (100.0%) |
Earnings by Sex by Educational Attainment in Foxworth
| Educational Attainment | Male Income | Female Income |
| Less than High School | - | - |
| High School Diploma | - | - |
| College or Associate's Degree | - | - |
| Bachelor's Degree | - | - |
| Graduate Degree | - | - |
| Total | - | - |
Family Income in Foxworth
Family Income Brackets in Foxworth
According to the Foxworth family income data, there are 40 families falling into the $15,000 to $24,999 income range, which is the most common income bracket and makes up 31.5% of all families.
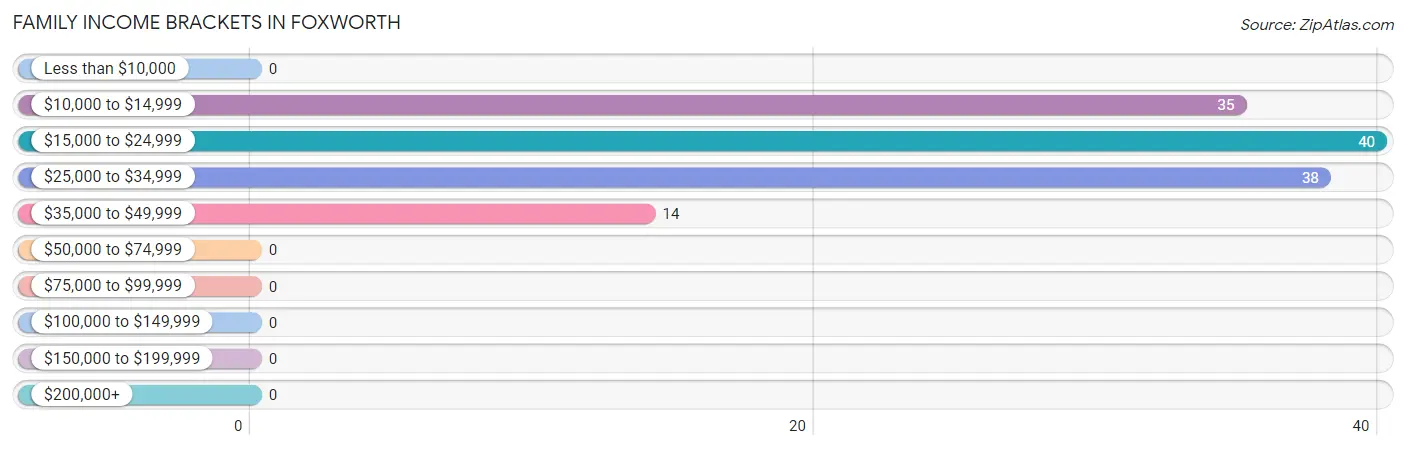
| Income Bracket | # Families | % Families |
| Less than $10,000 | 0 | 0.0% |
| $10,000 to $14,999 | 35 | 27.6% |
| $15,000 to $24,999 | 40 | 31.5% |
| $25,000 to $34,999 | 38 | 29.9% |
| $35,000 to $49,999 | 14 | 11.0% |
| $50,000 to $74,999 | 0 | 0.0% |
| $75,000 to $99,999 | 0 | 0.0% |
| $100,000 to $149,999 | 0 | 0.0% |
| $150,000 to $199,999 | 0 | 0.0% |
| $200,000+ | 0 | 0.0% |
Family Income by Famaliy Size in Foxworth
2-person families (70 | 55.1%) account for the highest median family income in Foxworth with $32,361 per family, while 2-person families (70 | 55.1%) have the highest median income of $16,180 per family member.
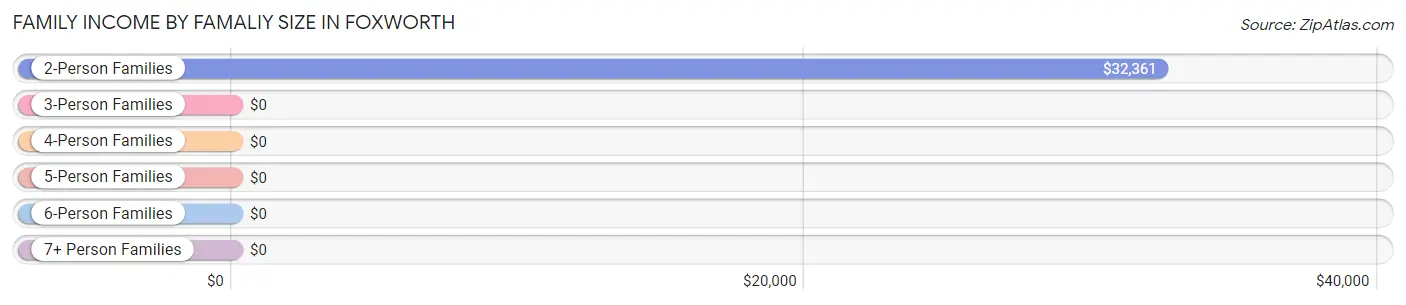
| Income Bracket | # Families | Median Income |
| 2-Person Families | 70 (55.1%) | $32,361 |
| 3-Person Families | 17 (13.4%) | $0 |
| 4-Person Families | 13 (10.2%) | $0 |
| 5-Person Families | 0 (0.0%) | $0 |
| 6-Person Families | 0 (0.0%) | $0 |
| 7+ Person Families | 27 (21.3%) | $0 |
| Total | 127 (100.0%) | $20,288 |
Family Income by Number of Earners in Foxworth
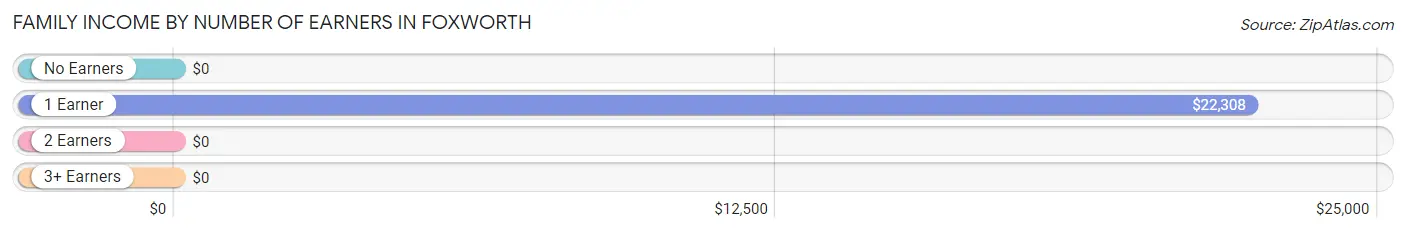
| Number of Earners | # Families | Median Income |
| No Earners | 35 (27.6%) | $0 |
| 1 Earner | 78 (61.4%) | $22,308 |
| 2 Earners | 14 (11.0%) | $0 |
| 3+ Earners | 0 (0.0%) | $0 |
| Total | 127 (100.0%) | $20,288 |
Household Income in Foxworth
Household Income Brackets in Foxworth
With 65 households falling in the category, the $25,000 to $34,999 income range is the most frequent in Foxworth, accounting for 34.2% of all households.
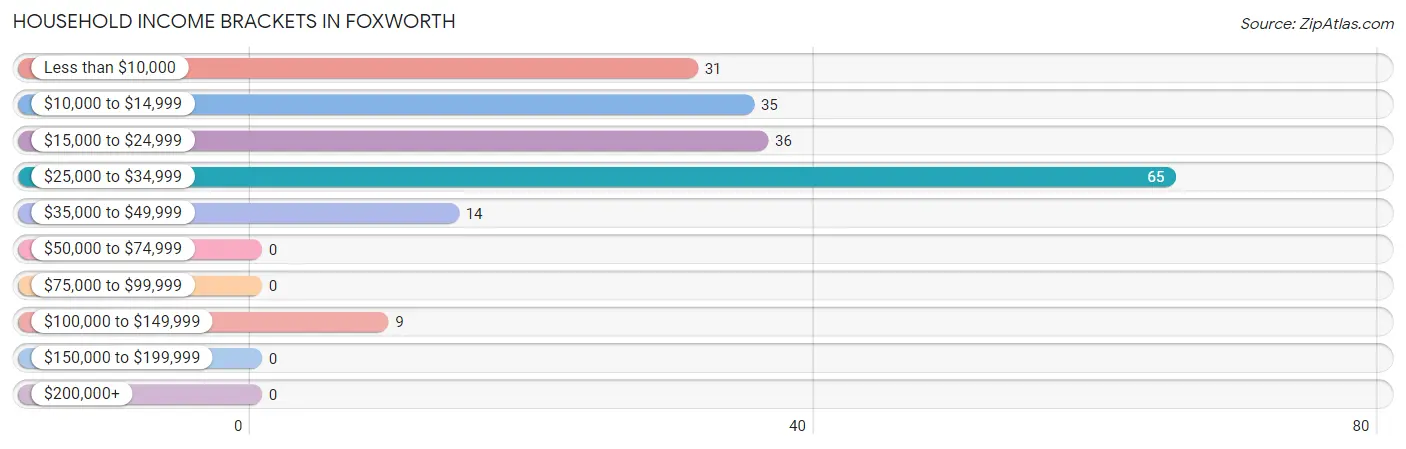
| Income Bracket | # Households | % Households |
| Less than $10,000 | 31 | 16.3% |
| $10,000 to $14,999 | 35 | 18.4% |
| $15,000 to $24,999 | 36 | 18.9% |
| $25,000 to $34,999 | 65 | 34.2% |
| $35,000 to $49,999 | 14 | 7.4% |
| $50,000 to $74,999 | 0 | 0.0% |
| $75,000 to $99,999 | 0 | 0.0% |
| $100,000 to $149,999 | 9 | 4.7% |
| $150,000 to $199,999 | 0 | 0.0% |
| $200,000+ | 0 | 0.0% |
Household Income by Householder Age in Foxworth
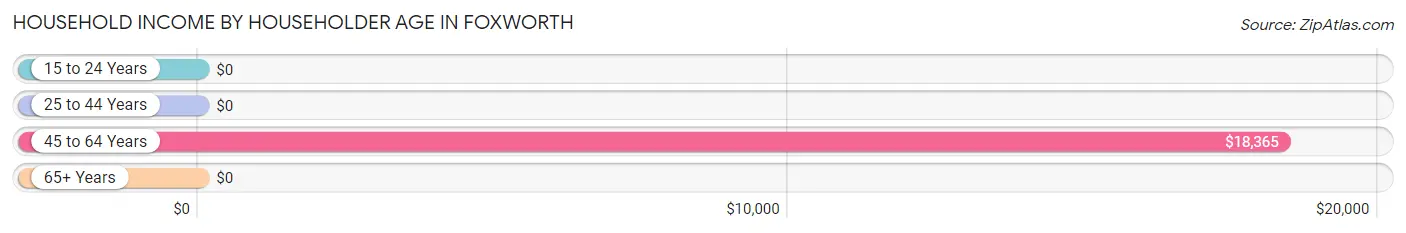
The median household income in Foxworth is $21,154, with the highest median household income of $18,365 found in the 45 to 64 years age bracket for the primary householder. A total of 125 households (65.8%) fall into this category.
| Income Bracket | # Households | Median Income |
| 15 to 24 Years | 0 (0.0%) | $0 |
| 25 to 44 Years | 27 (14.2%) | $0 |
| 45 to 64 Years | 125 (65.8%) | $18,365 |
| 65+ Years | 38 (20.0%) | $0 |
| Total | 190 (100.0%) | $21,154 |
Poverty in Foxworth
Income Below Poverty by Sex and Age in Foxworth
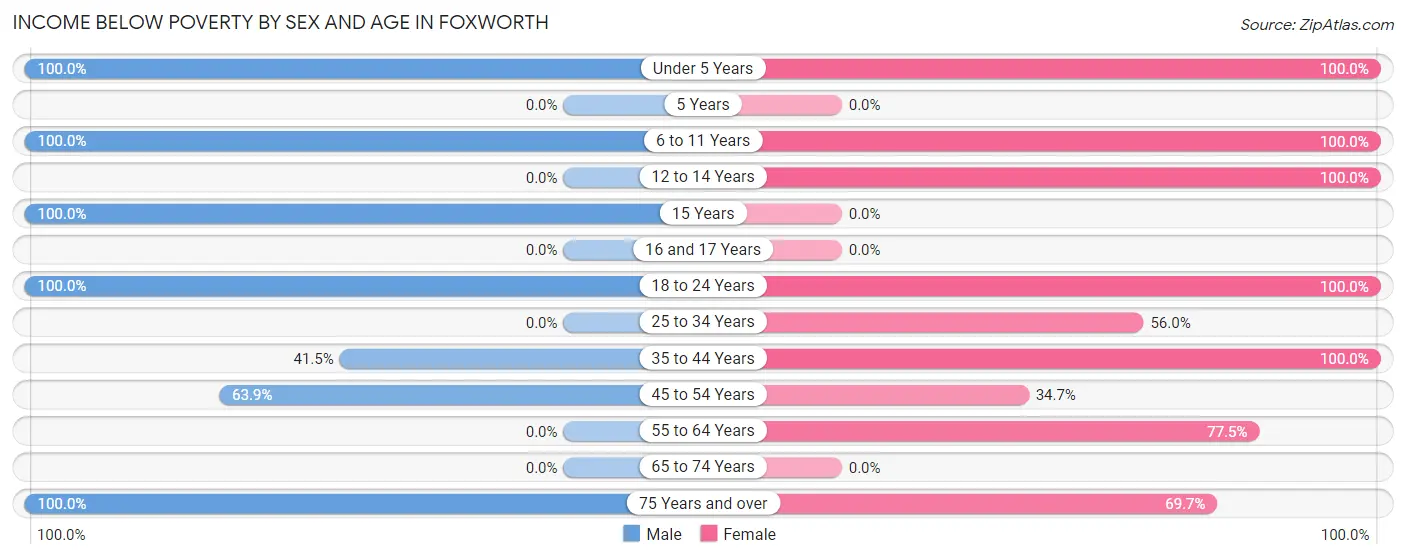
With 69.8% poverty level for males and 72.5% for females among the residents of Foxworth, under 5 year old males and under 5 year old females are the most vulnerable to poverty, with 68 males (100.0%) and 39 females (100.0%) in their respective age groups living below the poverty level.
| Age Bracket | Male | Female |
| Under 5 Years | 68 (100.0%) | 39 (100.0%) |
| 5 Years | 0 (0.0%) | 0 (0.0%) |
| 6 to 11 Years | 16 (100.0%) | 21 (100.0%) |
| 12 to 14 Years | 0 (0.0%) | 21 (100.0%) |
| 15 Years | 27 (100.0%) | 0 (0.0%) |
| 16 and 17 Years | 0 (0.0%) | 0 (0.0%) |
| 18 to 24 Years | 18 (100.0%) | 44 (100.0%) |
| 25 to 34 Years | 0 (0.0%) | 28 (56.0%) |
| 35 to 44 Years | 27 (41.5%) | 21 (100.0%) |
| 45 to 54 Years | 23 (63.9%) | 17 (34.7%) |
| 55 to 64 Years | 0 (0.0%) | 31 (77.5%) |
| 65 to 74 Years | 0 (0.0%) | 0 (0.0%) |
| 75 Years and over | 8 (100.0%) | 23 (69.7%) |
| Total | 187 (69.8%) | 245 (72.5%) |
Income Above Poverty by Sex and Age in Foxworth
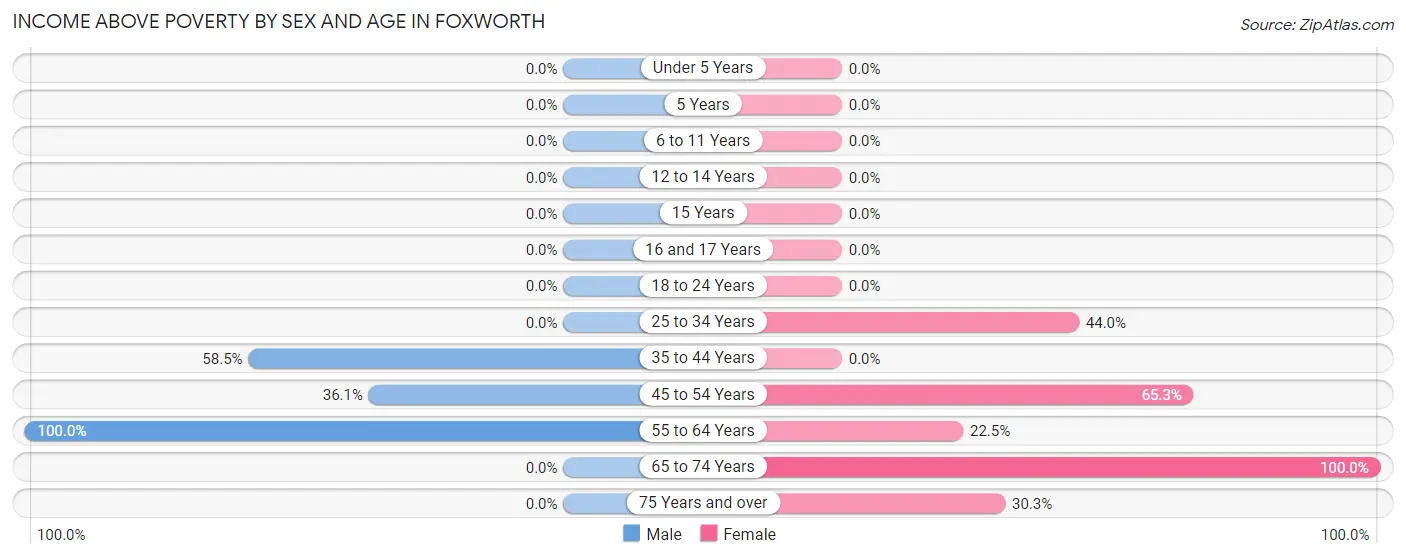
According to the poverty statistics in Foxworth, males aged 55 to 64 years and females aged 65 to 74 years are the age groups that are most secure financially, with 100.0% of males and 100.0% of females in these age groups living above the poverty line.
| Age Bracket | Male | Female |
| Under 5 Years | 0 (0.0%) | 0 (0.0%) |
| 5 Years | 0 (0.0%) | 0 (0.0%) |
| 6 to 11 Years | 0 (0.0%) | 0 (0.0%) |
| 12 to 14 Years | 0 (0.0%) | 0 (0.0%) |
| 15 Years | 0 (0.0%) | 0 (0.0%) |
| 16 and 17 Years | 0 (0.0%) | 0 (0.0%) |
| 18 to 24 Years | 0 (0.0%) | 0 (0.0%) |
| 25 to 34 Years | 0 (0.0%) | 22 (44.0%) |
| 35 to 44 Years | 38 (58.5%) | 0 (0.0%) |
| 45 to 54 Years | 13 (36.1%) | 32 (65.3%) |
| 55 to 64 Years | 30 (100.0%) | 9 (22.5%) |
| 65 to 74 Years | 0 (0.0%) | 20 (100.0%) |
| 75 Years and over | 0 (0.0%) | 10 (30.3%) |
| Total | 81 (30.2%) | 93 (27.5%) |
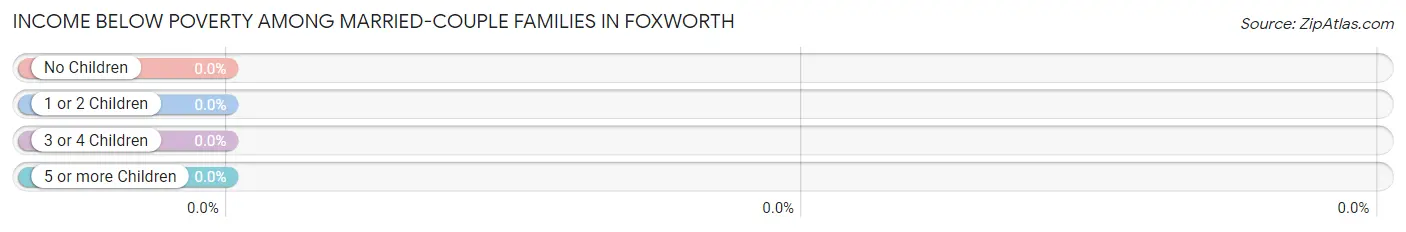
Income Below Poverty Among Married-Couple Families in Foxworth
| Children | Above Poverty | Below Poverty |
| No Children | 18 (100.0%) | 0 (0.0%) |
| 1 or 2 Children | 0 (0.0%) | 0 (0.0%) |
| 3 or 4 Children | 0 (0.0%) | 0 (0.0%) |
| 5 or more Children | 0 (0.0%) | 0 (0.0%) |
| Total | 18 (100.0%) | 0 (0.0%) |
Income Below Poverty Among Single-Parent Households in Foxworth
According to the poverty data in Foxworth, 100.0% or 27 single-father households and 58.5% or 48 single-mother households are living below the poverty line. Among single-father households, those with 5 or more children have the highest poverty rate, with 27 households (100.0%) experiencing poverty. Likewise, among single-mother households, those with 1 or 2 children have the highest poverty rate, with 30 households (100.0%) falling below the poverty line.
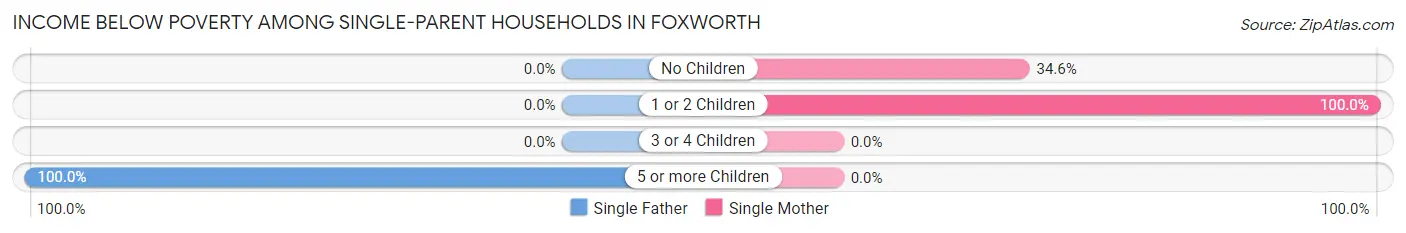
| Children | Single Father | Single Mother |
| No Children | 0 (0.0%) | 18 (34.6%) |
| 1 or 2 Children | 0 (0.0%) | 30 (100.0%) |
| 3 or 4 Children | 0 (0.0%) | 0 (0.0%) |
| 5 or more Children | 27 (100.0%) | 0 (0.0%) |
| Total | 27 (100.0%) | 48 (58.5%) |
Income Below Poverty Among Married-Couple vs Single-Parent Households in Foxworth
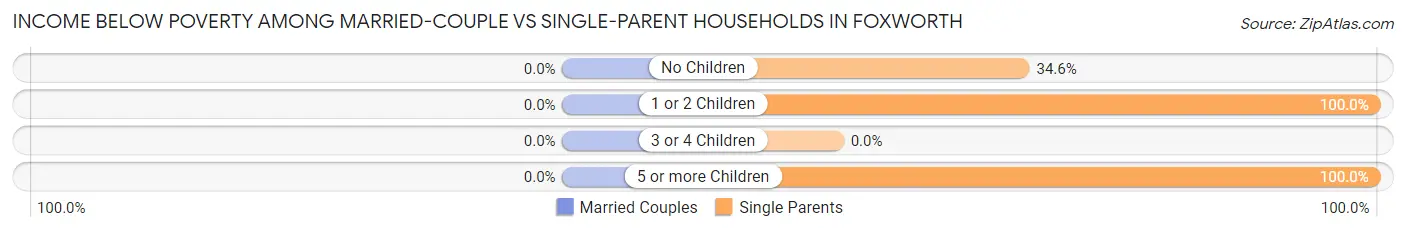
| Children | Married-Couple Families | Single-Parent Households |
| No Children | 0 (0.0%) | 18 (34.6%) |
| 1 or 2 Children | 0 (0.0%) | 30 (100.0%) |
| 3 or 4 Children | 0 (0.0%) | 0 (0.0%) |
| 5 or more Children | 0 (0.0%) | 27 (100.0%) |
| Total | 0 (0.0%) | 75 (68.8%) |
Race in Foxworth
The most populous races in Foxworth are White / Caucasian (334 | 55.1%), Black / African American (191 | 31.5%), and Two or more Races (81 | 13.4%).
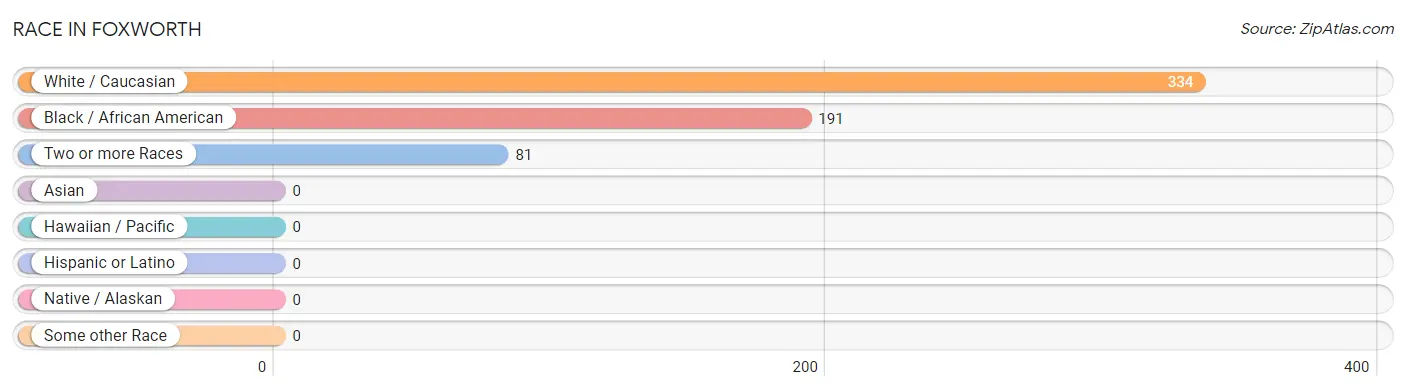
| Race | # Population | % Population |
| Asian | 0 | 0.0% |
| Black / African American | 191 | 31.5% |
| Hawaiian / Pacific | 0 | 0.0% |
| Hispanic or Latino | 0 | 0.0% |
| Native / Alaskan | 0 | 0.0% |
| White / Caucasian | 334 | 55.1% |
| Two or more Races | 81 | 13.4% |
| Some other Race | 0 | 0.0% |
| Total | 606 | 100.0% |
Ancestry in Foxworth
The most populous ancestries reported in Foxworth are Irish (208 | 34.3%), German (197 | 32.5%), French (43 | 7.1%), and American (40 | 6.6%), together accounting for 80.5% of all Foxworth residents.
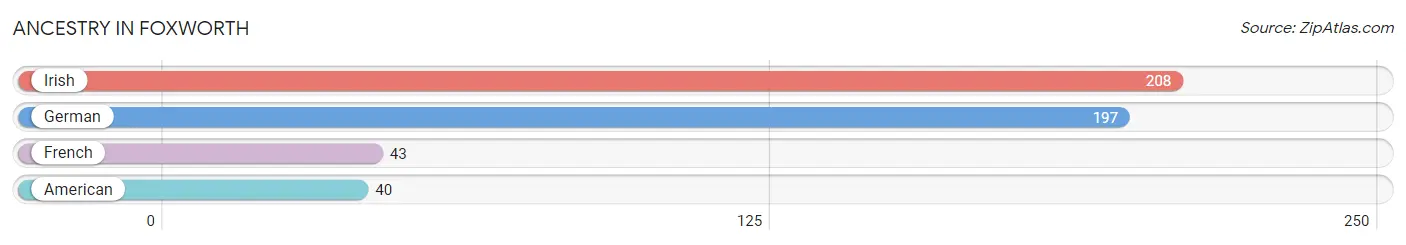
| Ancestry | # Population | % Population |
| American | 40 | 6.6% |
| French | 43 | 7.1% |
| German | 197 | 32.5% |
| Irish | 208 | 34.3% | View All 4 Rows |
Immigrants in Foxworth

| Immigration Origin | # Population | % Population | View All 0 Rows |
Sex and Age in Foxworth
Sex and Age in Foxworth
The most populous age groups in Foxworth are Under 5 Years (68 | 25.4%) for men and 25 to 29 Years (50 | 14.8%) for women.
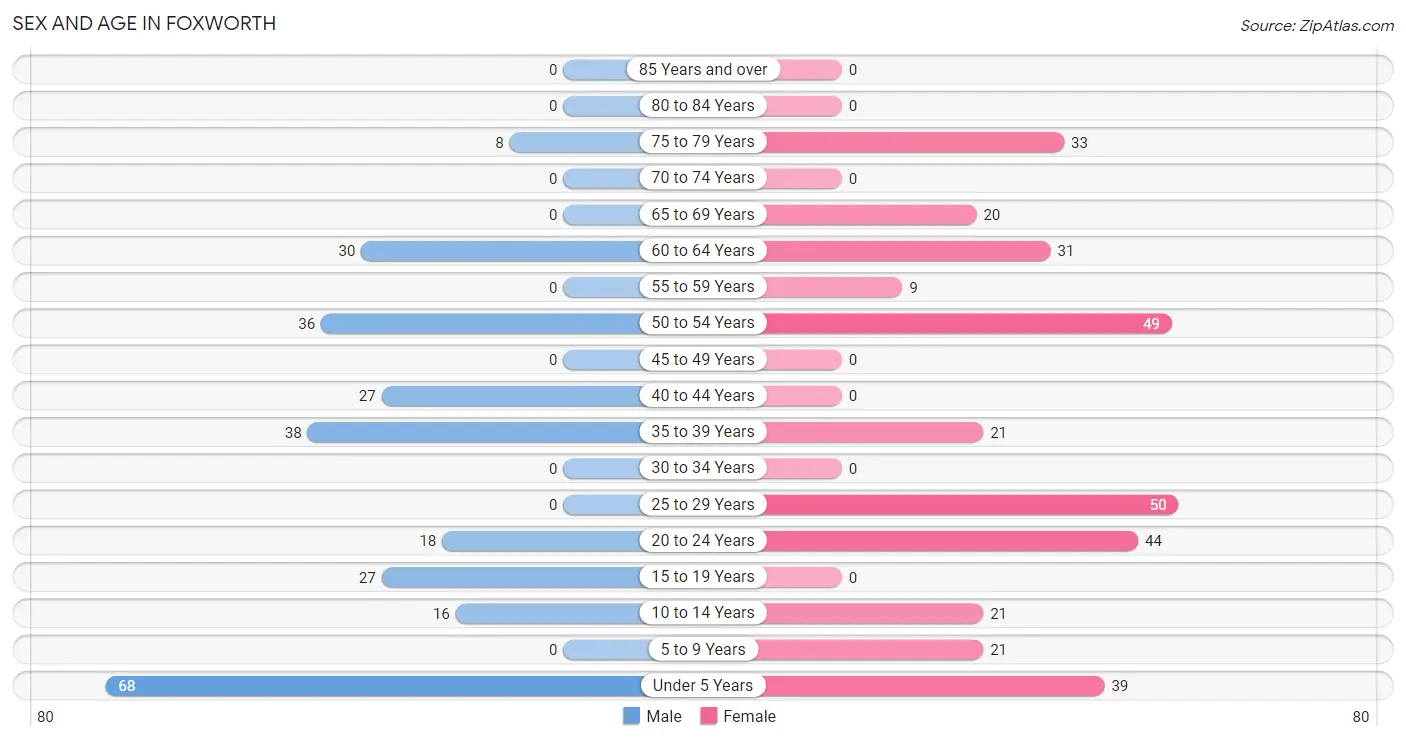
| Age Bracket | Male | Female |
| Under 5 Years | 68 (25.4%) | 39 (11.5%) |
| 5 to 9 Years | 0 (0.0%) | 21 (6.2%) |
| 10 to 14 Years | 16 (6.0%) | 21 (6.2%) |
| 15 to 19 Years | 27 (10.1%) | 0 (0.0%) |
| 20 to 24 Years | 18 (6.7%) | 44 (13.0%) |
| 25 to 29 Years | 0 (0.0%) | 50 (14.8%) |
| 30 to 34 Years | 0 (0.0%) | 0 (0.0%) |
| 35 to 39 Years | 38 (14.2%) | 21 (6.2%) |
| 40 to 44 Years | 27 (10.1%) | 0 (0.0%) |
| 45 to 49 Years | 0 (0.0%) | 0 (0.0%) |
| 50 to 54 Years | 36 (13.4%) | 49 (14.5%) |
| 55 to 59 Years | 0 (0.0%) | 9 (2.7%) |
| 60 to 64 Years | 30 (11.2%) | 31 (9.2%) |
| 65 to 69 Years | 0 (0.0%) | 20 (5.9%) |
| 70 to 74 Years | 0 (0.0%) | 0 (0.0%) |
| 75 to 79 Years | 8 (3.0%) | 33 (9.8%) |
| 80 to 84 Years | 0 (0.0%) | 0 (0.0%) |
| 85 Years and over | 0 (0.0%) | 0 (0.0%) |
| Total | 268 (100.0%) | 338 (100.0%) |
Families and Households in Foxworth
Median Family Size in Foxworth
The median family size in Foxworth is 4.03 persons per family, with single male/father families (27 | 21.3%) accounting for the largest median family size of 6 persons per family. On the other hand, married-couple families (18 | 14.2%) represent the smallest median family size with 3.11 persons per family.
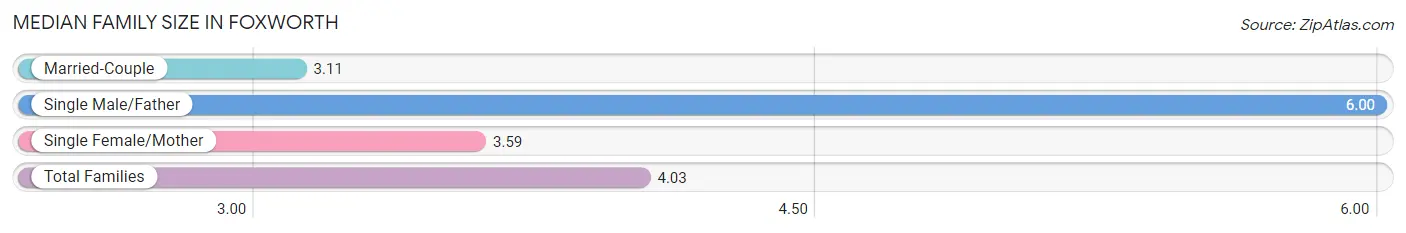
| Family Type | # Families | Family Size |
| Married-Couple | 18 (14.2%) | 3.11 |
| Single Male/Father | 27 (21.3%) | 6.00 |
| Single Female/Mother | 82 (64.6%) | 3.59 |
| Total Families | 127 (100.0%) | 4.03 |
Median Household Size in Foxworth
The median household size in Foxworth is 3.19 persons per household, with single male/father households (27 | 14.2%) accounting for the largest median household size of 6.78 persons per household. non-family households (63 | 33.2%) represent the smallest median household size with 1.16 persons per household.
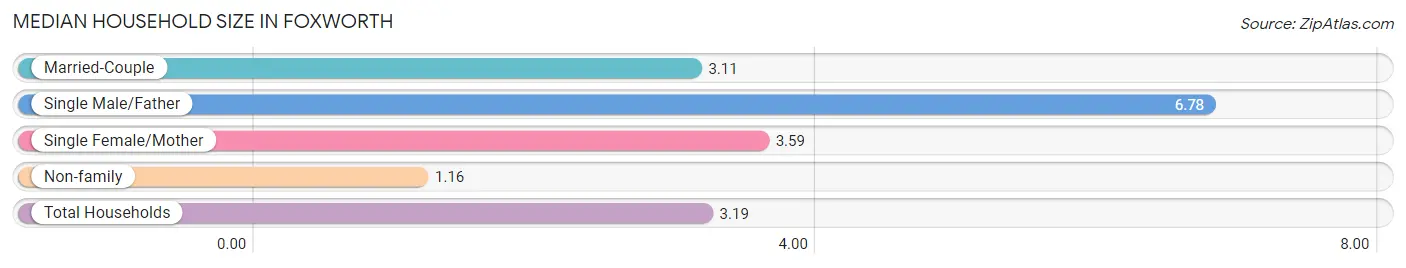
| Household Type | # Households | Household Size |
| Married-Couple | 18 (9.5%) | 3.11 |
| Single Male/Father | 27 (14.2%) | 6.78 |
| Single Female/Mother | 82 (43.2%) | 3.59 |
| Non-family | 63 (33.2%) | 1.16 |
| Total Households | 190 (100.0%) | 3.19 |
Household Size by Marriage Status in Foxworth
Out of a total of 190 households in Foxworth, 127 (66.8%) are family households, while 63 (33.2%) are nonfamily households. The most numerous type of family households are 2-person households, comprising 70, and the most common type of nonfamily households are 1-person households, comprising 54.
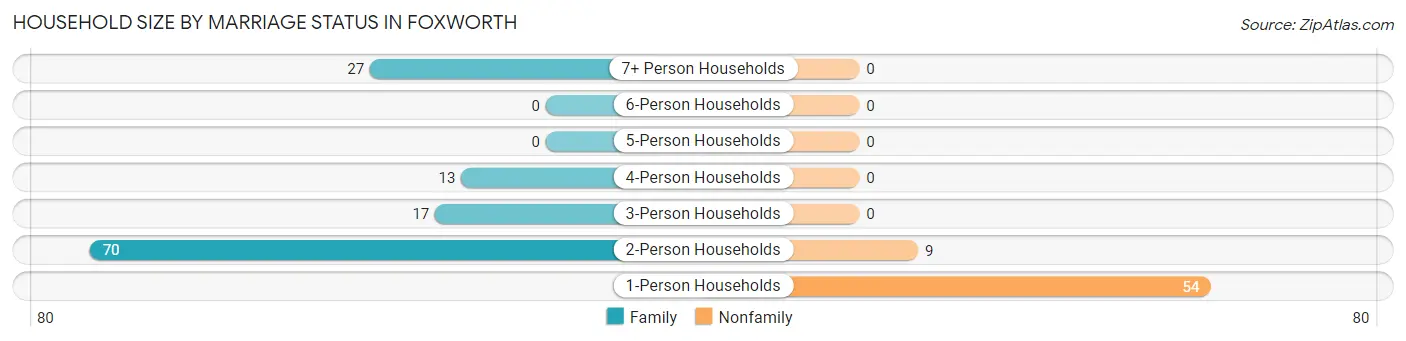
| Household Size | Family Households | Nonfamily Households |
| 1-Person Households | - | 54 (28.4%) |
| 2-Person Households | 70 (36.8%) | 9 (4.7%) |
| 3-Person Households | 17 (8.9%) | 0 (0.0%) |
| 4-Person Households | 13 (6.8%) | 0 (0.0%) |
| 5-Person Households | 0 (0.0%) | 0 (0.0%) |
| 6-Person Households | 0 (0.0%) | 0 (0.0%) |
| 7+ Person Households | 27 (14.2%) | 0 (0.0%) |
| Total | 127 (66.8%) | 63 (33.2%) |
Female Fertility in Foxworth
Fertility by Age in Foxworth
| Age Bracket | Women with Births | Births / 1,000 Women |
| 15 to 19 years | 0 (0.0%) | 0.0 |
| 20 to 34 years | 0 (0.0%) | 0.0 |
| 35 to 50 years | 0 (0.0%) | 0.0 |
| Total | 0 (0.0%) | 0.0 |
Fertility by Age by Marriage Status in Foxworth
| Age Bracket | Married | Unmarried |
| 15 to 19 years | 0 (0.0%) | 0 (0.0%) |
| 20 to 34 years | 0 (0.0%) | 0 (0.0%) |
| 35 to 50 years | 0 (0.0%) | 0 (0.0%) |
| Total | 0 (0.0%) | 0 (0.0%) |
Fertility by Education in Foxworth
| Educational Attainment | Women with Births | Births / 1,000 Women |
| Less than High School | 0 (0.0%) | 0.0 |
| High School Diploma | 0 (0.0%) | 0.0 |
| College or Associate's Degree | 0 (0.0%) | 0.0 |
| Bachelor's Degree | 0 (0.0%) | 0.0 |
| Graduate Degree | 0 (0.0%) | 0.0 |
| Total | 0 (0.0%) | 0.0 |
Fertility by Education by Marriage Status in Foxworth
| Educational Attainment | Married | Unmarried |
| Less than High School | 0 (0.0%) | 0 (0.0%) |
| High School Diploma | 0 (0.0%) | 0 (0.0%) |
| College or Associate's Degree | 0 (0.0%) | 0 (0.0%) |
| Bachelor's Degree | 0 (0.0%) | 0 (0.0%) |
| Graduate Degree | 0 (0.0%) | 0 (0.0%) |
| Total | 0 (0.0%) | 0 (0.0%) |
Employment Characteristics in Foxworth
Employment by Class of Employer in Foxworth
Among the 130 employed individuals in Foxworth, private company employees (110 | 84.6%), and not-for-profit organizations (20 | 15.4%) make up the most common classes of employment.
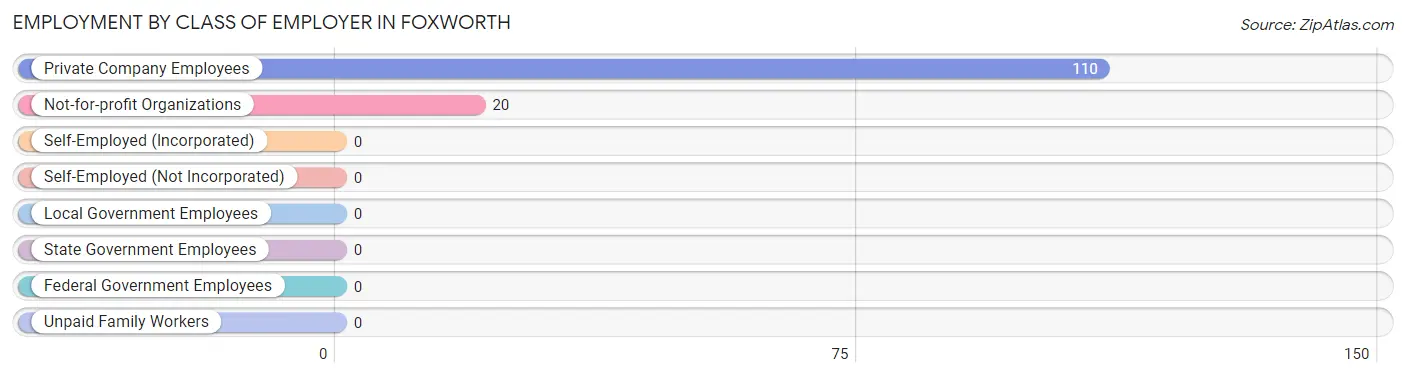
| Employer Class | # Employees | % Employees |
| Private Company Employees | 110 | 84.6% |
| Self-Employed (Incorporated) | 0 | 0.0% |
| Self-Employed (Not Incorporated) | 0 | 0.0% |
| Not-for-profit Organizations | 20 | 15.4% |
| Local Government Employees | 0 | 0.0% |
| State Government Employees | 0 | 0.0% |
| Federal Government Employees | 0 | 0.0% |
| Unpaid Family Workers | 0 | 0.0% |
| Total | 130 | 100.0% |
Employment Status by Age in Foxworth
According to the labor force statistics for Foxworth, out of the total population over 16 years of age (414), 39.6% or 164 individuals are in the labor force, with 20.7% or 34 of them unemployed. The age group with the highest labor force participation rate is 35 to 44 years, with 100.0% or 86 individuals in the labor force. Within the labor force, the 60 to 64 years age range has the highest percentage of unemployed individuals, with 39.4% or 13 of them being unemployed.
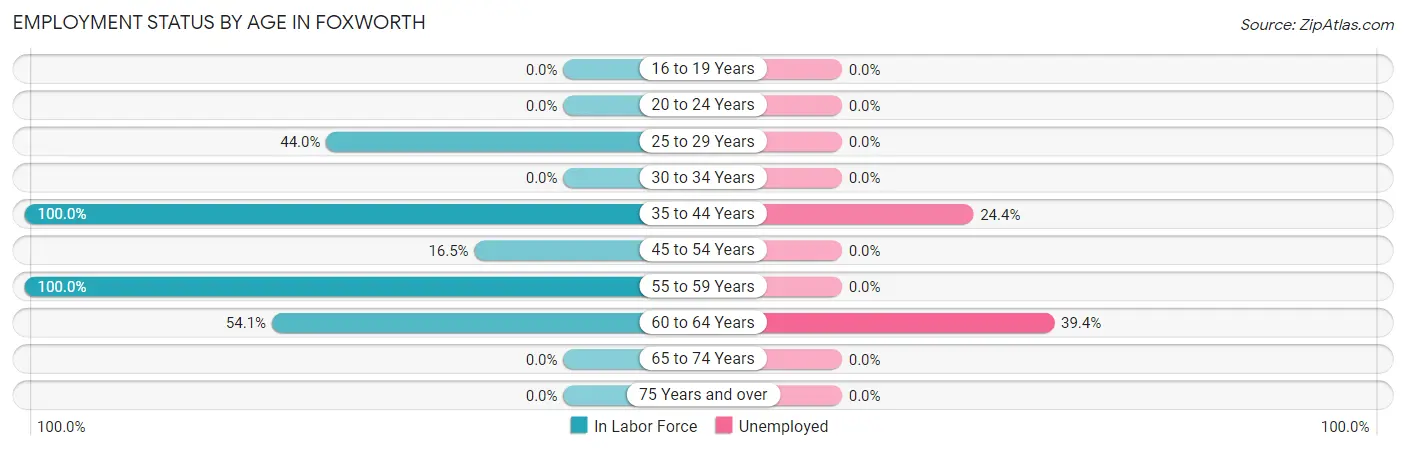
| Age Bracket | In Labor Force | Unemployed |
| 16 to 19 Years | 0 (0.0%) | 0 (0.0%) |
| 20 to 24 Years | 0 (0.0%) | 0 (0.0%) |
| 25 to 29 Years | 22 (44.0%) | 0 (0.0%) |
| 30 to 34 Years | 0 (0.0%) | 0 (0.0%) |
| 35 to 44 Years | 86 (100.0%) | 21 (24.4%) |
| 45 to 54 Years | 14 (16.5%) | 0 (0.0%) |
| 55 to 59 Years | 9 (100.0%) | 0 (0.0%) |
| 60 to 64 Years | 33 (54.1%) | 13 (39.4%) |
| 65 to 74 Years | 0 (0.0%) | 0 (0.0%) |
| 75 Years and over | 0 (0.0%) | 0 (0.0%) |
| Total | 164 (39.6%) | 34 (20.7%) |
Employment Status by Educational Attainment in Foxworth
According to labor force statistics for Foxworth, 56.4% of individuals (164) out of the total population between 25 and 64 years of age (291) are in the labor force, with 20.7% or 34 of them being unemployed. The group with the highest labor force participation rate are those with the educational attainment of less than high school, with 72.3% or 47 individuals in the labor force. Within the labor force, individuals with college / associate degree education have the highest percentage of unemployment, with 43.0% or 34 of them being unemployed.
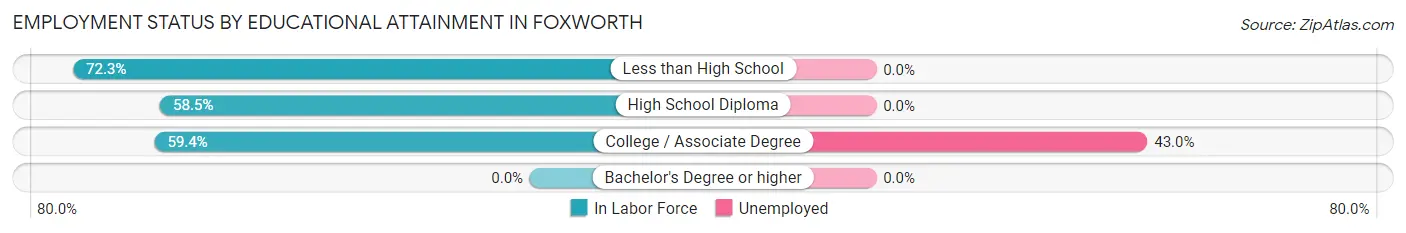
| Educational Attainment | In Labor Force | Unemployed |
| Less than High School | 47 (72.3%) | 0 (0.0%) |
| High School Diploma | 38 (58.5%) | 0 (0.0%) |
| College / Associate Degree | 79 (59.4%) | 57 (43.0%) |
| Bachelor's Degree or higher | 0 (0.0%) | 0 (0.0%) |
| Total | 164 (56.4%) | 60 (20.7%) |
Employment Occupations by Sex in Foxworth
Management, Business, Science and Arts Occupations
Management, Business, Science and Arts Occupations by Sex
| Occupation | Male | Female |
| Management | 0 (0.0%) | 0 (0.0%) |
| Business & Financial | 0 (0.0%) | 0 (0.0%) |
| Computers, Engineering & Science | 0 (0.0%) | 0 (0.0%) |
| Computers & Mathematics | 0 (0.0%) | 0 (0.0%) |
| Architecture & Engineering | 0 (0.0%) | 0 (0.0%) |
| Life, Physical & Social Science | 0 (0.0%) | 0 (0.0%) |
| Community & Social Service | 0 (0.0%) | 0 (0.0%) |
| Education, Arts & Media | 0 (0.0%) | 0 (0.0%) |
| Legal Services & Support | 0 (0.0%) | 0 (0.0%) |
| Education Instruction & Library | 0 (0.0%) | 0 (0.0%) |
| Arts, Media & Entertainment | 0 (0.0%) | 0 (0.0%) |
| Health Diagnosing & Treating | 0 (0.0%) | 0 (0.0%) |
| Health Technologists | 0 (0.0%) | 0 (0.0%) |
| Total (Category) | 0 (0.0%) | 0 (0.0%) |
| Total (Overall) | 85 (65.4%) | 45 (34.6%) |
Services Occupations
The most common Services occupations in Foxworth are , and Cleaning & Maintenance (20 | 15.4%).
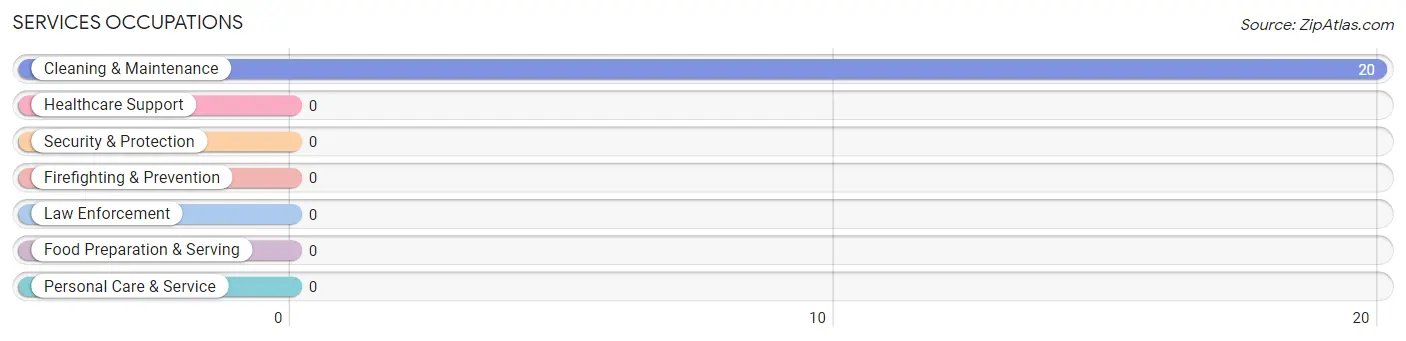
Services Occupations by Sex
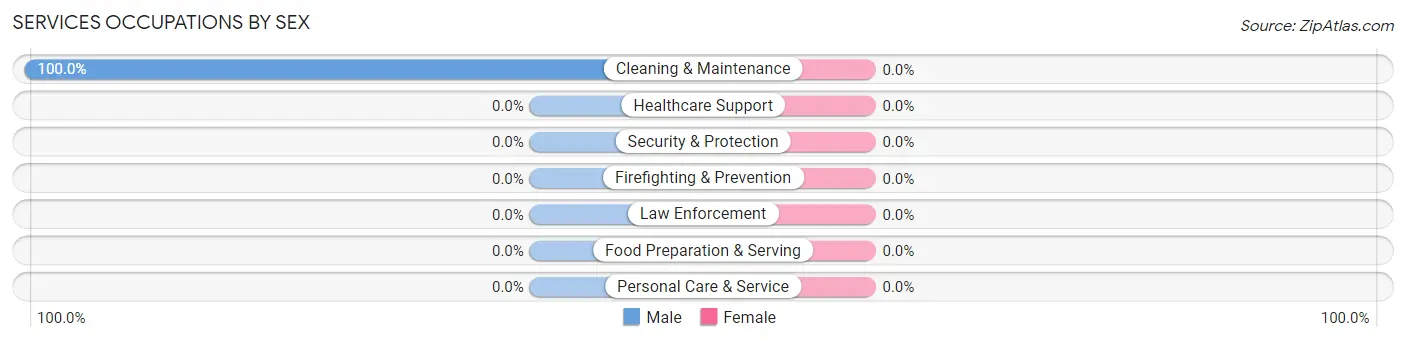
| Occupation | Male | Female |
| Healthcare Support | 0 (0.0%) | 0 (0.0%) |
| Security & Protection | 0 (0.0%) | 0 (0.0%) |
| Firefighting & Prevention | 0 (0.0%) | 0 (0.0%) |
| Law Enforcement | 0 (0.0%) | 0 (0.0%) |
| Food Preparation & Serving | 0 (0.0%) | 0 (0.0%) |
| Cleaning & Maintenance | 20 (100.0%) | 0 (0.0%) |
| Personal Care & Service | 0 (0.0%) | 0 (0.0%) |
| Total (Category) | 20 (100.0%) | 0 (0.0%) |
| Total (Overall) | 85 (65.4%) | 45 (34.6%) |
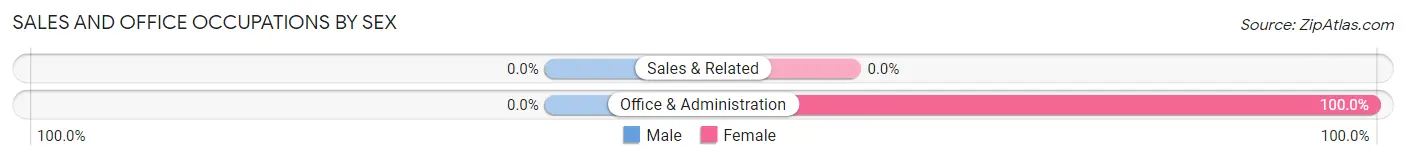
Sales and Office Occupations
The most common Sales and Office occupations in Foxworth are , and Office & Administration (45 | 34.6%).
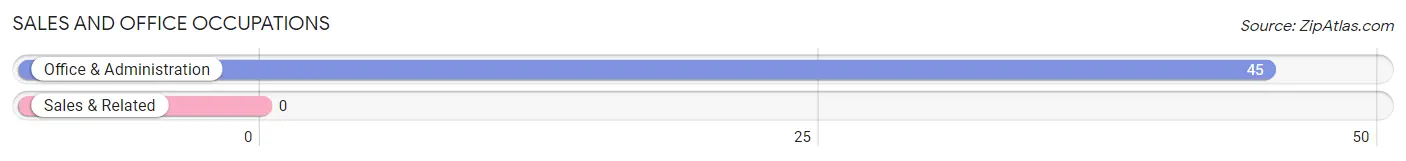
Sales and Office Occupations by Sex
| Occupation | Male | Female |
| Sales & Related | 0 (0.0%) | 0 (0.0%) |
| Office & Administration | 0 (0.0%) | 45 (100.0%) |
| Total (Category) | 0 (0.0%) | 45 (100.0%) |
| Total (Overall) | 85 (65.4%) | 45 (34.6%) |
Natural Resources, Construction and Maintenance Occupations
The most common Natural Resources, Construction and Maintenance occupations in Foxworth are , and Construction & Extraction (65 | 50.0%).
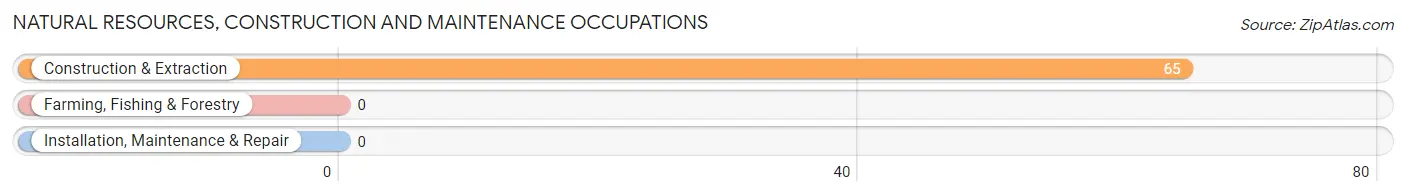
Natural Resources, Construction and Maintenance Occupations by Sex
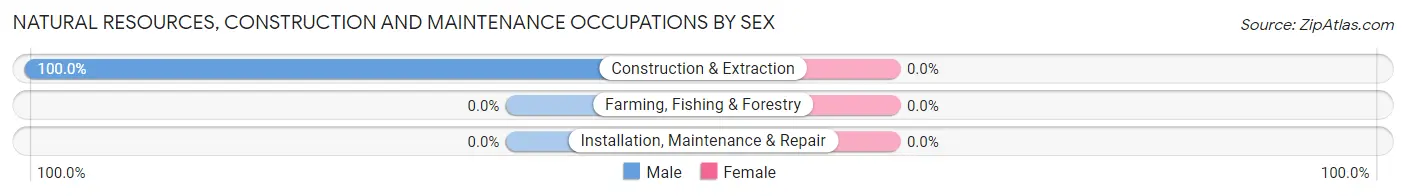
| Occupation | Male | Female |
| Farming, Fishing & Forestry | 0 (0.0%) | 0 (0.0%) |
| Construction & Extraction | 65 (100.0%) | 0 (0.0%) |
| Installation, Maintenance & Repair | 0 (0.0%) | 0 (0.0%) |
| Total (Category) | 65 (100.0%) | 0 (0.0%) |
| Total (Overall) | 85 (65.4%) | 45 (34.6%) |
Production, Transportation and Moving Occupations
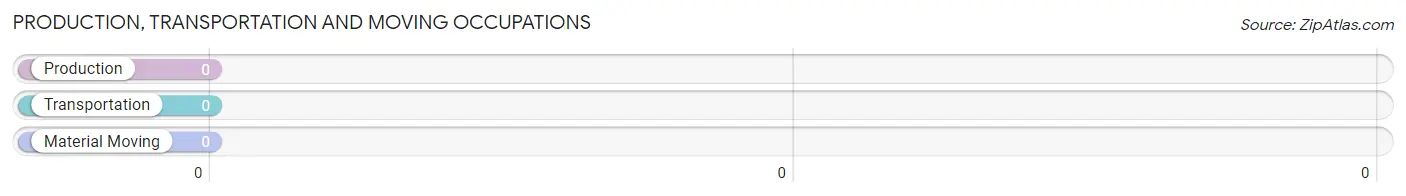
Production, Transportation and Moving Occupations by Sex
| Occupation | Male | Female |
| Production | 0 (0.0%) | 0 (0.0%) |
| Transportation | 0 (0.0%) | 0 (0.0%) |
| Material Moving | 0 (0.0%) | 0 (0.0%) |
| Total (Category) | 0 (0.0%) | 0 (0.0%) |
| Total (Overall) | 85 (65.4%) | 45 (34.6%) |
Employment Industries by Sex in Foxworth
Employment Industries in Foxworth
The major employment industries in Foxworth include Construction (74 | 56.9%), and Administrative & Support (36 | 27.7%).
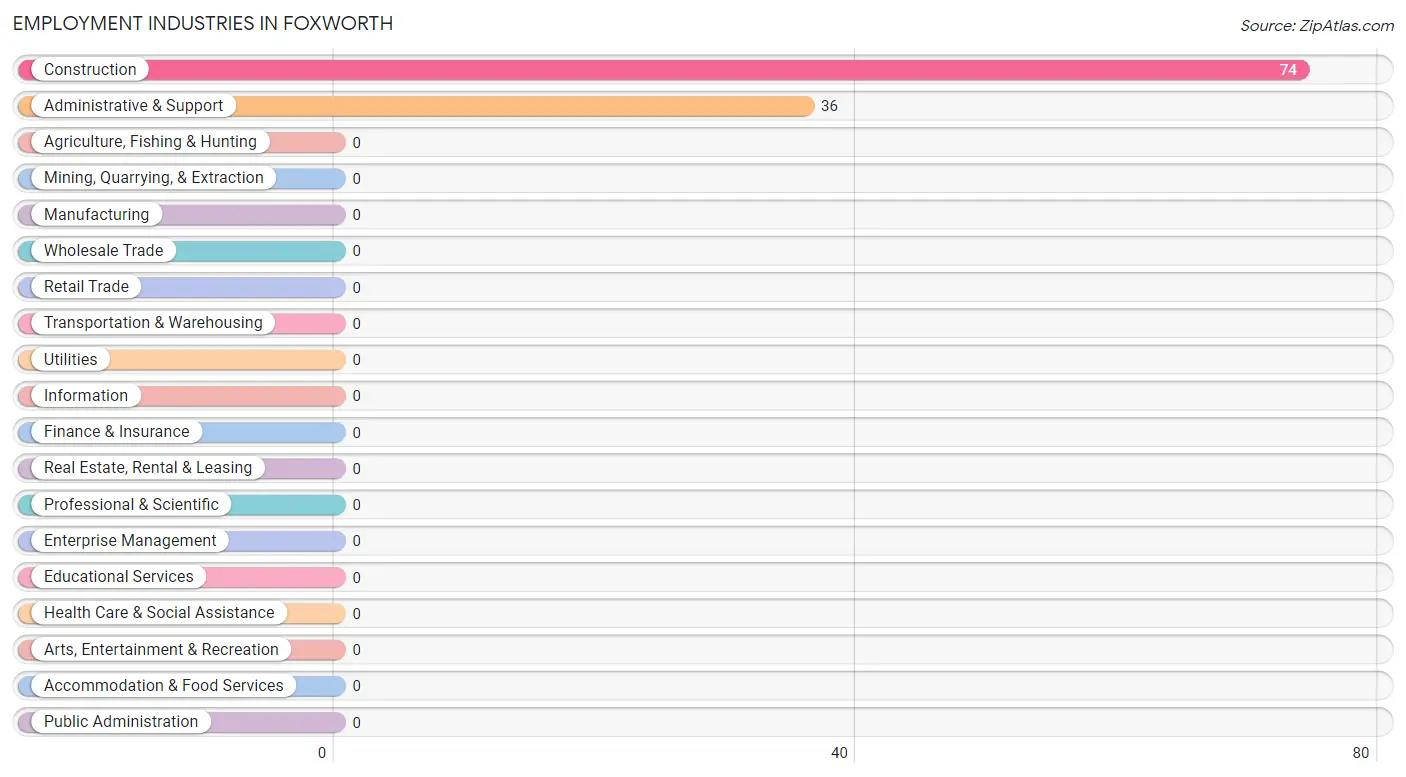
Employment Industries by Sex in Foxworth
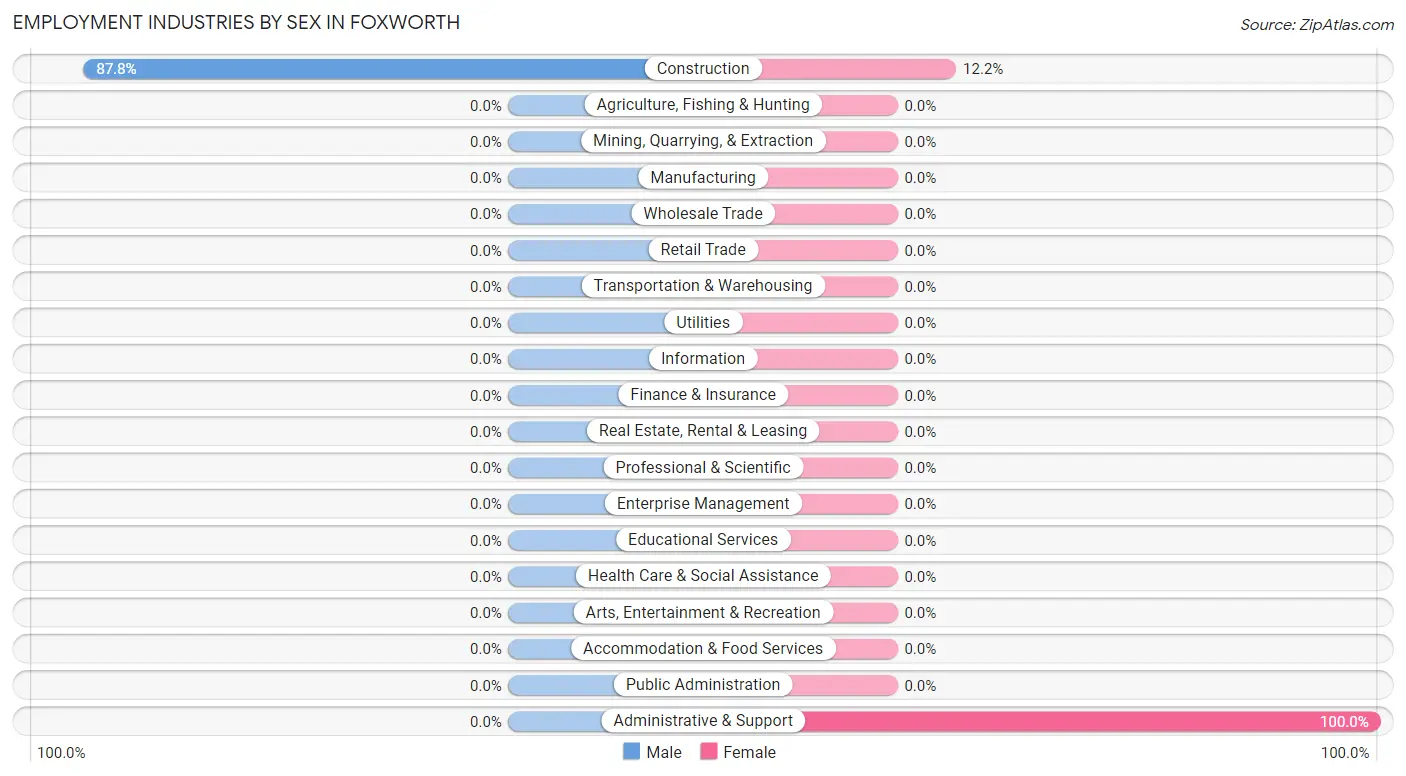
| Industry | Male | Female |
| Agriculture, Fishing & Hunting | 0 (0.0%) | 0 (0.0%) |
| Mining, Quarrying, & Extraction | 0 (0.0%) | 0 (0.0%) |
| Construction | 65 (87.8%) | 9 (12.2%) |
| Manufacturing | 0 (0.0%) | 0 (0.0%) |
| Wholesale Trade | 0 (0.0%) | 0 (0.0%) |
| Retail Trade | 0 (0.0%) | 0 (0.0%) |
| Transportation & Warehousing | 0 (0.0%) | 0 (0.0%) |
| Utilities | 0 (0.0%) | 0 (0.0%) |
| Information | 0 (0.0%) | 0 (0.0%) |
| Finance & Insurance | 0 (0.0%) | 0 (0.0%) |
| Real Estate, Rental & Leasing | 0 (0.0%) | 0 (0.0%) |
| Professional & Scientific | 0 (0.0%) | 0 (0.0%) |
| Enterprise Management | 0 (0.0%) | 0 (0.0%) |
| Administrative & Support | 0 (0.0%) | 36 (100.0%) |
| Educational Services | 0 (0.0%) | 0 (0.0%) |
| Health Care & Social Assistance | 0 (0.0%) | 0 (0.0%) |
| Arts, Entertainment & Recreation | 0 (0.0%) | 0 (0.0%) |
| Accommodation & Food Services | 0 (0.0%) | 0 (0.0%) |
| Public Administration | 0 (0.0%) | 0 (0.0%) |
| Total | 85 (65.4%) | 45 (34.6%) |
Education in Foxworth
School Enrollment in Foxworth
The most common levels of schooling among the 153 students in Foxworth are nursery / preschool (40 | 26.1%), middle school (37 | 24.2%), and graduate / professional (28 | 18.3%).
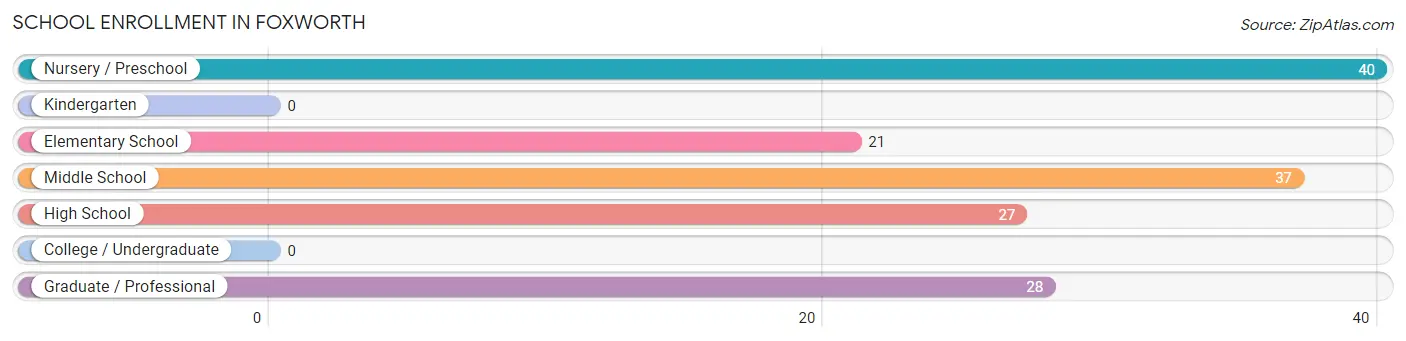
| School Level | # Students | % Students |
| Nursery / Preschool | 40 | 26.1% |
| Kindergarten | 0 | 0.0% |
| Elementary School | 21 | 13.7% |
| Middle School | 37 | 24.2% |
| High School | 27 | 17.6% |
| College / Undergraduate | 0 | 0.0% |
| Graduate / Professional | 28 | 18.3% |
| Total | 153 | 100.0% |
School Enrollment by Age by Funding Source in Foxworth
Out of a total of 153 students who are enrolled in schools in Foxworth, 28 (18.3%) attend a private institution, while the remaining 125 (81.7%) are enrolled in public schools. The age group of 25 to 34 year olds has the highest likelihood of being enrolled in private schools, with 28 (100.0% in the age bracket) enrolled. Conversely, the age group of 3 to 4 year olds has the lowest likelihood of being enrolled in a private school, with 40 (100.0% in the age bracket) attending a public institution.
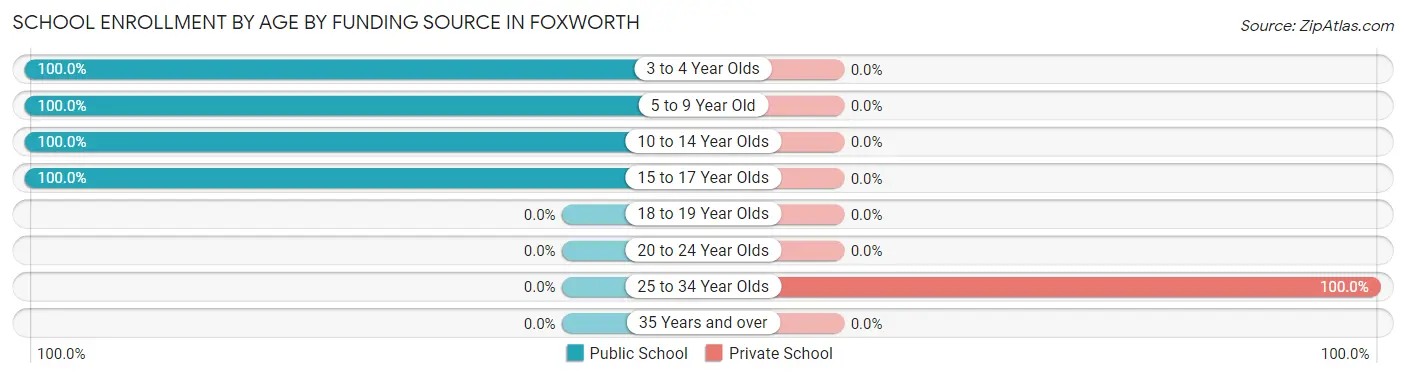
| Age Bracket | Public School | Private School |
| 3 to 4 Year Olds | 40 (100.0%) | 0 (0.0%) |
| 5 to 9 Year Old | 21 (100.0%) | 0 (0.0%) |
| 10 to 14 Year Olds | 37 (100.0%) | 0 (0.0%) |
| 15 to 17 Year Olds | 27 (100.0%) | 0 (0.0%) |
| 18 to 19 Year Olds | 0 (0.0%) | 0 (0.0%) |
| 20 to 24 Year Olds | 0 (0.0%) | 0 (0.0%) |
| 25 to 34 Year Olds | 0 (0.0%) | 28 (100.0%) |
| 35 Years and over | 0 (0.0%) | 0 (0.0%) |
| Total | 125 (81.7%) | 28 (18.3%) |
Educational Attainment by Field of Study in Foxworth
, and liberal arts & history (28 | 100.0%) are the most common fields of study among 28 individuals in Foxworth who have obtained a bachelor's degree or higher.
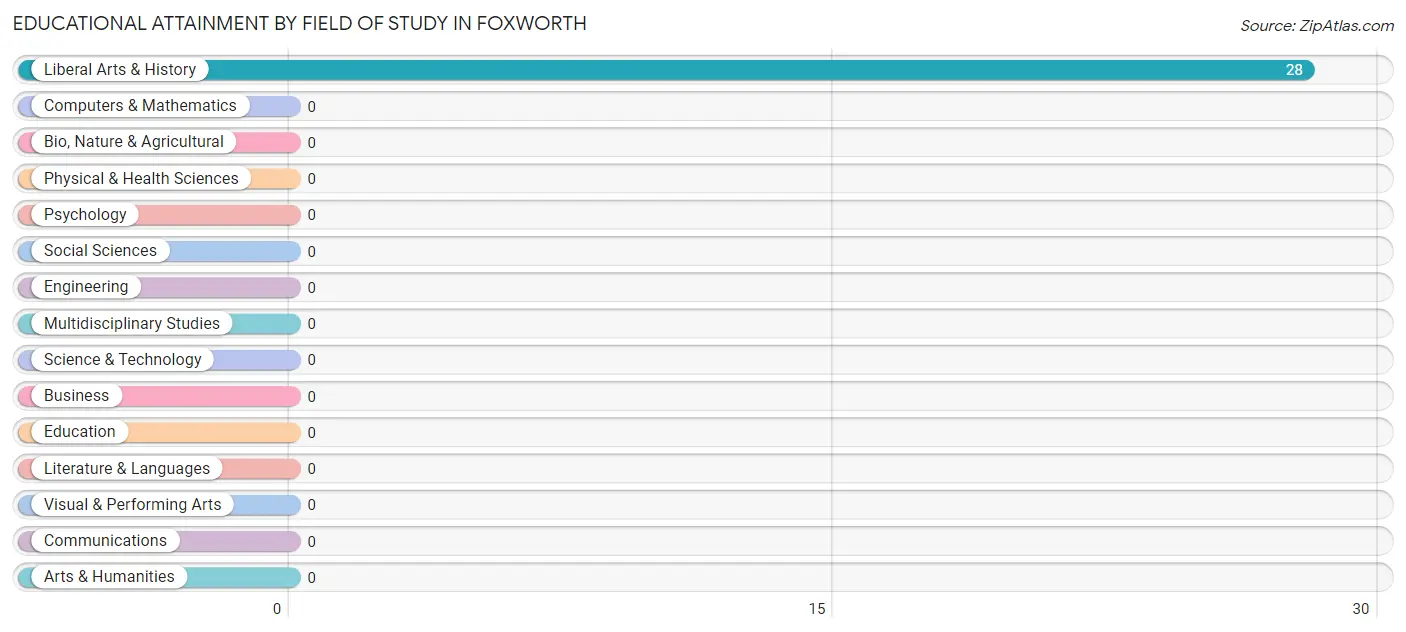
| Field of Study | # Graduates | % Graduates |
| Computers & Mathematics | 0 | 0.0% |
| Bio, Nature & Agricultural | 0 | 0.0% |
| Physical & Health Sciences | 0 | 0.0% |
| Psychology | 0 | 0.0% |
| Social Sciences | 0 | 0.0% |
| Engineering | 0 | 0.0% |
| Multidisciplinary Studies | 0 | 0.0% |
| Science & Technology | 0 | 0.0% |
| Business | 0 | 0.0% |
| Education | 0 | 0.0% |
| Literature & Languages | 0 | 0.0% |
| Liberal Arts & History | 28 | 100.0% |
| Visual & Performing Arts | 0 | 0.0% |
| Communications | 0 | 0.0% |
| Arts & Humanities | 0 | 0.0% |
| Total | 28 | 100.0% |
Transportation & Commute in Foxworth
Vehicle Availability by Sex in Foxworth
The most prevalent vehicle ownership categories in Foxworth are males with 3 vehicles (38, accounting for 44.7%) and females with 3 vehicles (0, making up 84.4%).
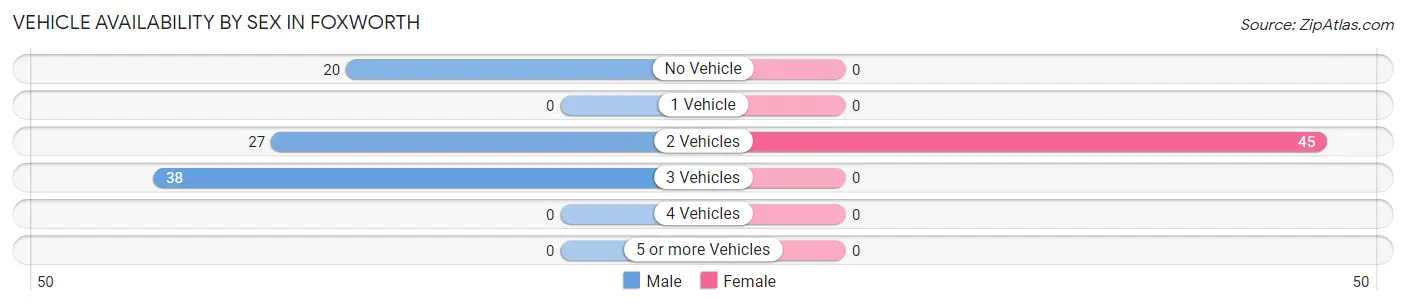
| Vehicles Available | Male | Female |
| No Vehicle | 20 (23.5%) | 0 (0.0%) |
| 1 Vehicle | 0 (0.0%) | 0 (0.0%) |
| 2 Vehicles | 27 (31.8%) | 45 (100.0%) |
| 3 Vehicles | 38 (44.7%) | 0 (0.0%) |
| 4 Vehicles | 0 (0.0%) | 0 (0.0%) |
| 5 or more Vehicles | 0 (0.0%) | 0 (0.0%) |
| Total | 85 (100.0%) | 45 (100.0%) |
Commute Time in Foxworth
The most frequently occuring commute durations in Foxworth are 90 or more minutes (38 commuters, 32.8%), 15 to 19 minutes (27 commuters, 23.3%), and 60 to 89 minutes (22 commuters, 19.0%).
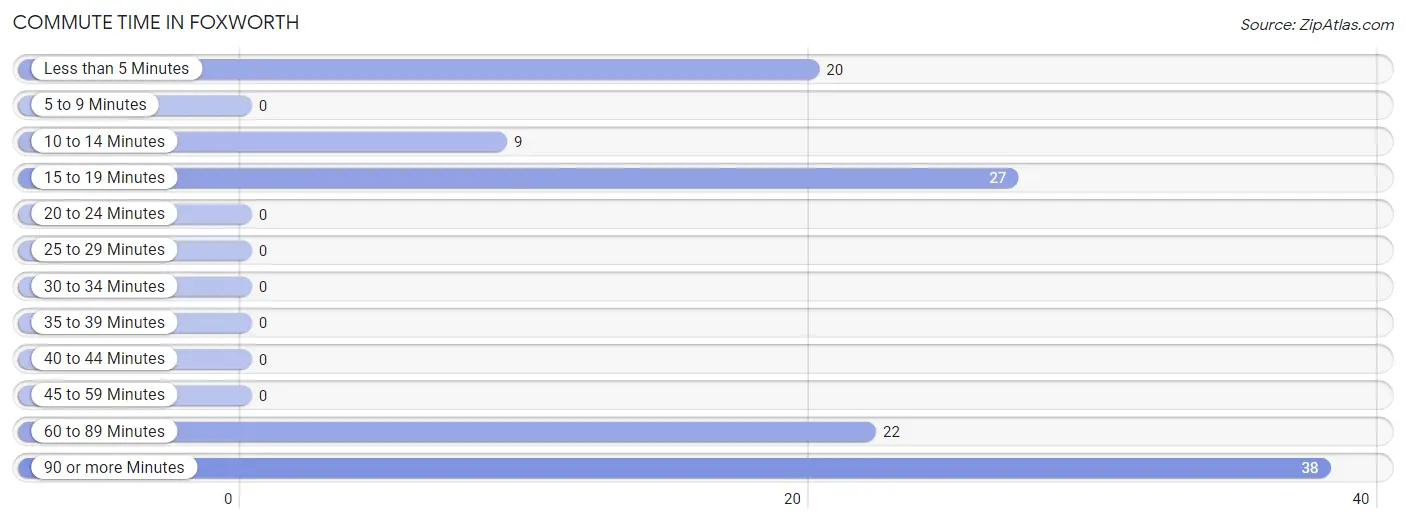
| Commute Time | # Commuters | % Commuters |
| Less than 5 Minutes | 20 | 17.2% |
| 5 to 9 Minutes | 0 | 0.0% |
| 10 to 14 Minutes | 9 | 7.8% |
| 15 to 19 Minutes | 27 | 23.3% |
| 20 to 24 Minutes | 0 | 0.0% |
| 25 to 29 Minutes | 0 | 0.0% |
| 30 to 34 Minutes | 0 | 0.0% |
| 35 to 39 Minutes | 0 | 0.0% |
| 40 to 44 Minutes | 0 | 0.0% |
| 45 to 59 Minutes | 0 | 0.0% |
| 60 to 89 Minutes | 22 | 19.0% |
| 90 or more Minutes | 38 | 32.8% |
Commute Time by Sex in Foxworth
The most common commute times in Foxworth are 90 or more minutes (38 commuters, 44.7%) for males and 60 to 89 minutes (22 commuters, 71.0%) for females.
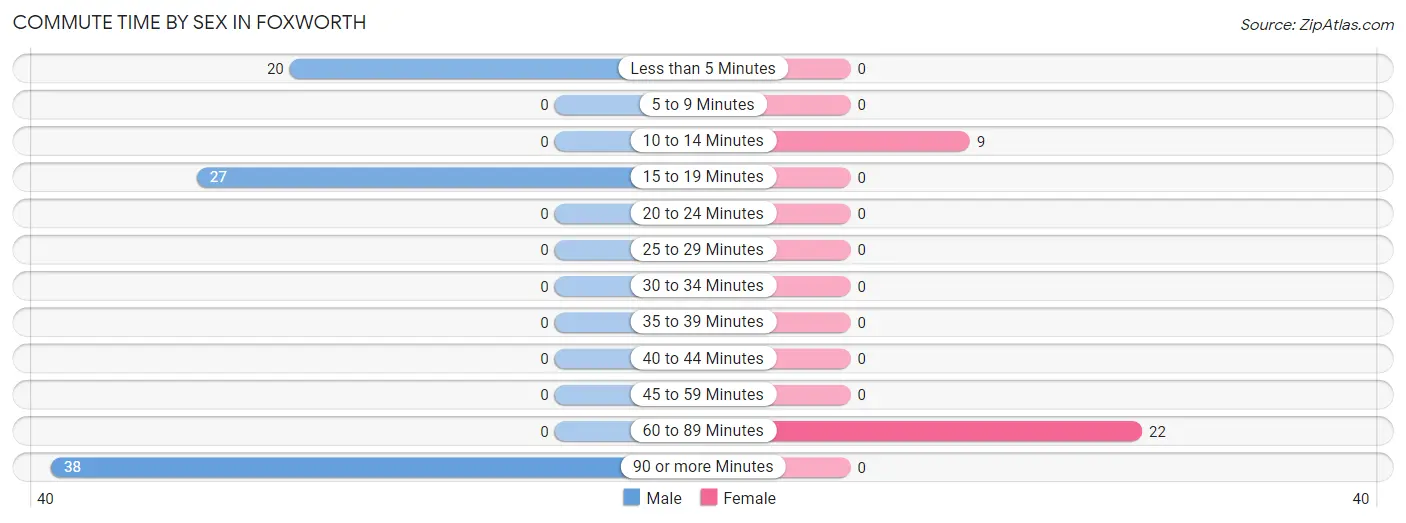
| Commute Time | Male | Female |
| Less than 5 Minutes | 20 (23.5%) | 0 (0.0%) |
| 5 to 9 Minutes | 0 (0.0%) | 0 (0.0%) |
| 10 to 14 Minutes | 0 (0.0%) | 9 (29.0%) |
| 15 to 19 Minutes | 27 (31.8%) | 0 (0.0%) |
| 20 to 24 Minutes | 0 (0.0%) | 0 (0.0%) |
| 25 to 29 Minutes | 0 (0.0%) | 0 (0.0%) |
| 30 to 34 Minutes | 0 (0.0%) | 0 (0.0%) |
| 35 to 39 Minutes | 0 (0.0%) | 0 (0.0%) |
| 40 to 44 Minutes | 0 (0.0%) | 0 (0.0%) |
| 45 to 59 Minutes | 0 (0.0%) | 0 (0.0%) |
| 60 to 89 Minutes | 0 (0.0%) | 22 (71.0%) |
| 90 or more Minutes | 38 (44.7%) | 0 (0.0%) |
Time of Departure to Work by Sex in Foxworth
The most frequent times of departure to work in Foxworth are 12:00 PM to 3:59 PM (38, 44.7%) for males and 6:00 AM to 6:29 AM (22, 71.0%) for females.
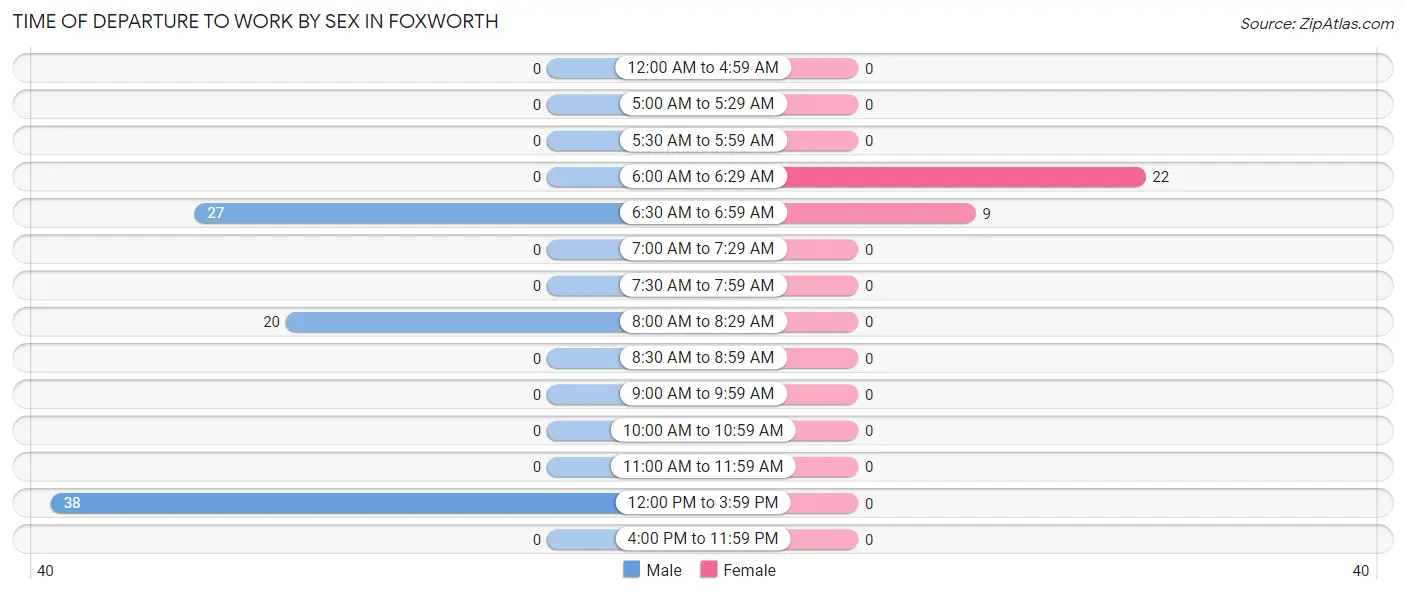
| Time of Departure | Male | Female |
| 12:00 AM to 4:59 AM | 0 (0.0%) | 0 (0.0%) |
| 5:00 AM to 5:29 AM | 0 (0.0%) | 0 (0.0%) |
| 5:30 AM to 5:59 AM | 0 (0.0%) | 0 (0.0%) |
| 6:00 AM to 6:29 AM | 0 (0.0%) | 22 (71.0%) |
| 6:30 AM to 6:59 AM | 27 (31.8%) | 9 (29.0%) |
| 7:00 AM to 7:29 AM | 0 (0.0%) | 0 (0.0%) |
| 7:30 AM to 7:59 AM | 0 (0.0%) | 0 (0.0%) |
| 8:00 AM to 8:29 AM | 20 (23.5%) | 0 (0.0%) |
| 8:30 AM to 8:59 AM | 0 (0.0%) | 0 (0.0%) |
| 9:00 AM to 9:59 AM | 0 (0.0%) | 0 (0.0%) |
| 10:00 AM to 10:59 AM | 0 (0.0%) | 0 (0.0%) |
| 11:00 AM to 11:59 AM | 0 (0.0%) | 0 (0.0%) |
| 12:00 PM to 3:59 PM | 38 (44.7%) | 0 (0.0%) |
| 4:00 PM to 11:59 PM | 0 (0.0%) | 0 (0.0%) |
| Total | 85 (100.0%) | 31 (100.0%) |
Housing Occupancy in Foxworth
Occupancy by Ownership in Foxworth
Of the total 190 dwellings in Foxworth, owner-occupied units account for 134 (70.5%), while renter-occupied units make up 56 (29.5%).
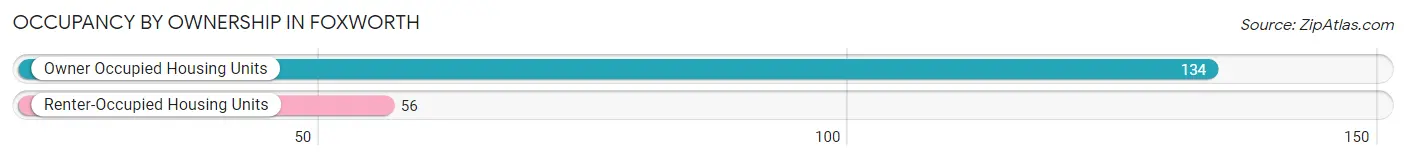
| Occupancy | # Housing Units | % Housing Units |
| Owner Occupied Housing Units | 134 | 70.5% |
| Renter-Occupied Housing Units | 56 | 29.5% |
| Total Occupied Housing Units | 190 | 100.0% |
Occupancy by Household Size in Foxworth
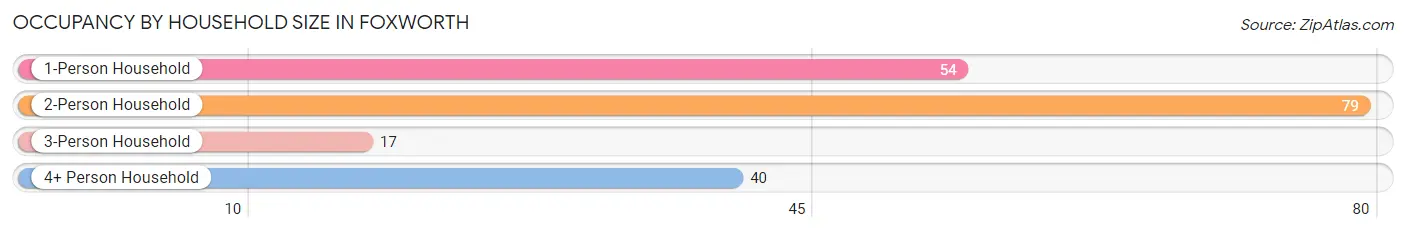
| Household Size | # Housing Units | % Housing Units |
| 1-Person Household | 54 | 28.4% |
| 2-Person Household | 79 | 41.6% |
| 3-Person Household | 17 | 8.9% |
| 4+ Person Household | 40 | 21.0% |
| Total Housing Units | 190 | 100.0% |
Occupancy by Ownership by Household Size in Foxworth
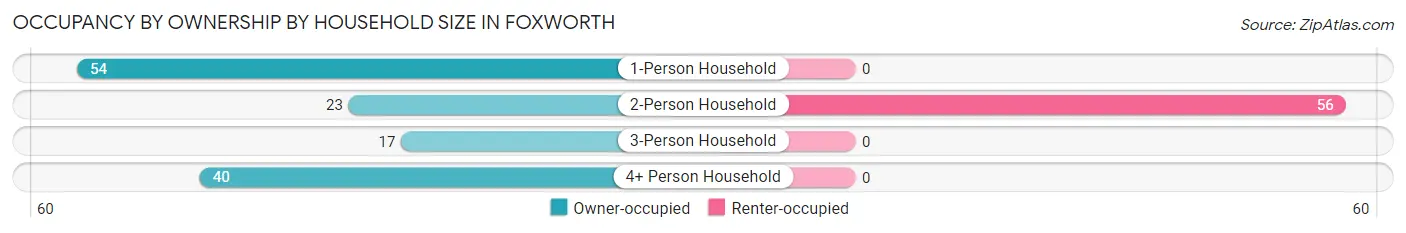
| Household Size | Owner-occupied | Renter-occupied |
| 1-Person Household | 54 (100.0%) | 0 (0.0%) |
| 2-Person Household | 23 (29.1%) | 56 (70.9%) |
| 3-Person Household | 17 (100.0%) | 0 (0.0%) |
| 4+ Person Household | 40 (100.0%) | 0 (0.0%) |
| Total Housing Units | 134 (70.5%) | 56 (29.5%) |
Occupancy by Educational Attainment in Foxworth
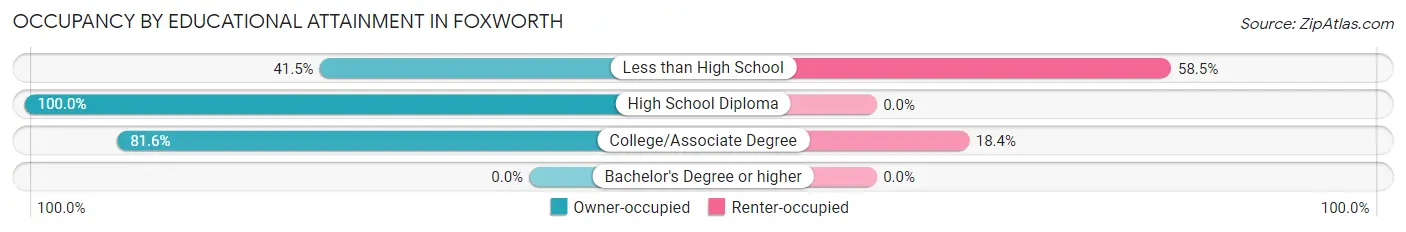
| Household Size | Owner-occupied | Renter-occupied |
| Less than High School | 27 (41.5%) | 38 (58.5%) |
| High School Diploma | 27 (100.0%) | 0 (0.0%) |
| College/Associate Degree | 80 (81.6%) | 18 (18.4%) |
| Bachelor's Degree or higher | 0 (0.0%) | 0 (0.0%) |
Occupancy by Age of Householder in Foxworth
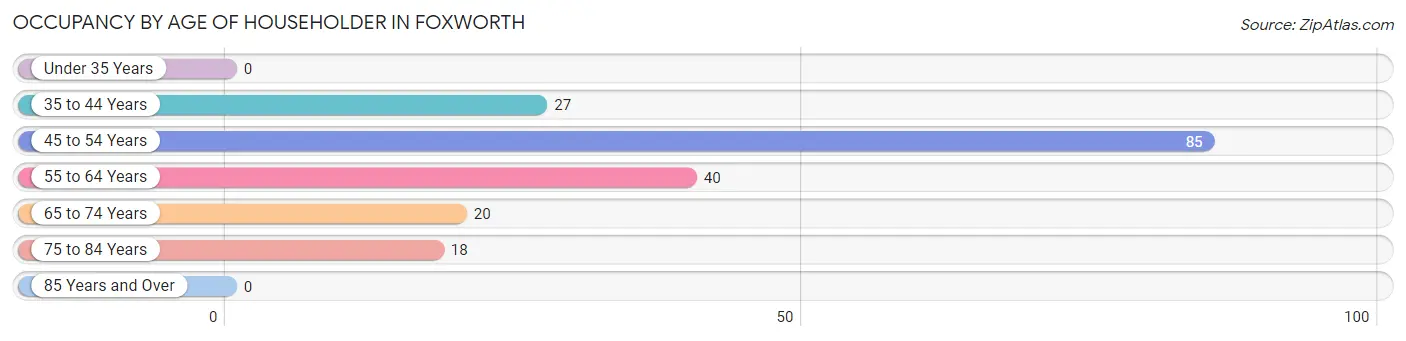
| Age Bracket | # Households | % Households |
| Under 35 Years | 0 | 0.0% |
| 35 to 44 Years | 27 | 14.2% |
| 45 to 54 Years | 85 | 44.7% |
| 55 to 64 Years | 40 | 21.0% |
| 65 to 74 Years | 20 | 10.5% |
| 75 to 84 Years | 18 | 9.5% |
| 85 Years and Over | 0 | 0.0% |
| Total | 190 | 100.0% |
Housing Finances in Foxworth
Median Income by Occupancy in Foxworth
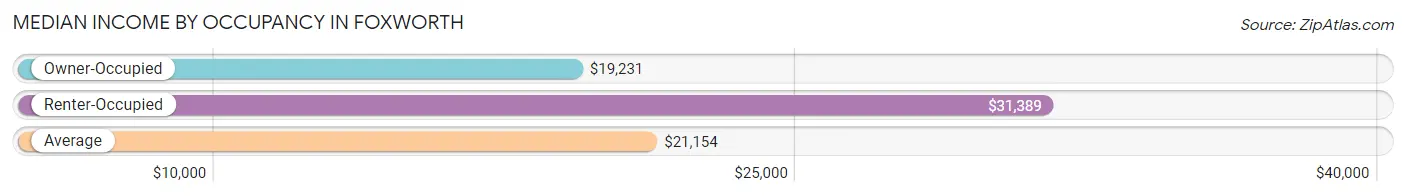
| Occupancy Type | # Households | Median Income |
| Owner-Occupied | 134 (70.5%) | $19,231 |
| Renter-Occupied | 56 (29.5%) | $31,389 |
| Average | 190 (100.0%) | $21,154 |
Occupancy by Householder Income Bracket in Foxworth
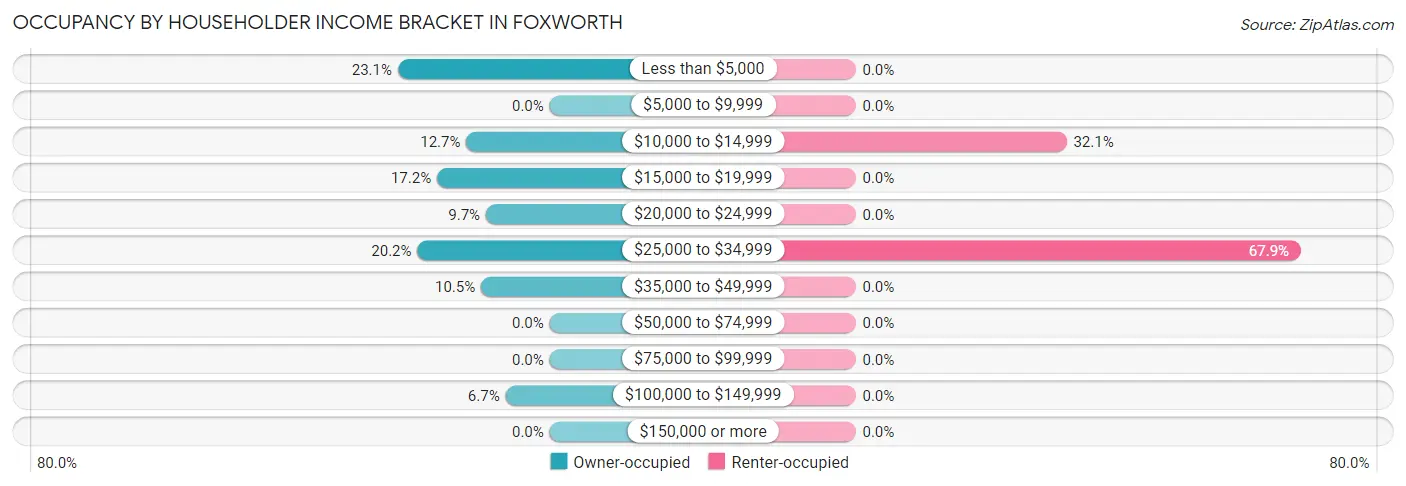
| Income Bracket | Owner-occupied | Renter-occupied |
| Less than $5,000 | 31 (23.1%) | 0 (0.0%) |
| $5,000 to $9,999 | 0 (0.0%) | 0 (0.0%) |
| $10,000 to $14,999 | 17 (12.7%) | 18 (32.1%) |
| $15,000 to $19,999 | 23 (17.2%) | 0 (0.0%) |
| $20,000 to $24,999 | 13 (9.7%) | 0 (0.0%) |
| $25,000 to $34,999 | 27 (20.2%) | 38 (67.9%) |
| $35,000 to $49,999 | 14 (10.4%) | 0 (0.0%) |
| $50,000 to $74,999 | 0 (0.0%) | 0 (0.0%) |
| $75,000 to $99,999 | 0 (0.0%) | 0 (0.0%) |
| $100,000 to $149,999 | 9 (6.7%) | 0 (0.0%) |
| $150,000 or more | 0 (0.0%) | 0 (0.0%) |
| Total | 134 (100.0%) | 56 (100.0%) |
Monthly Housing Cost Tiers in Foxworth
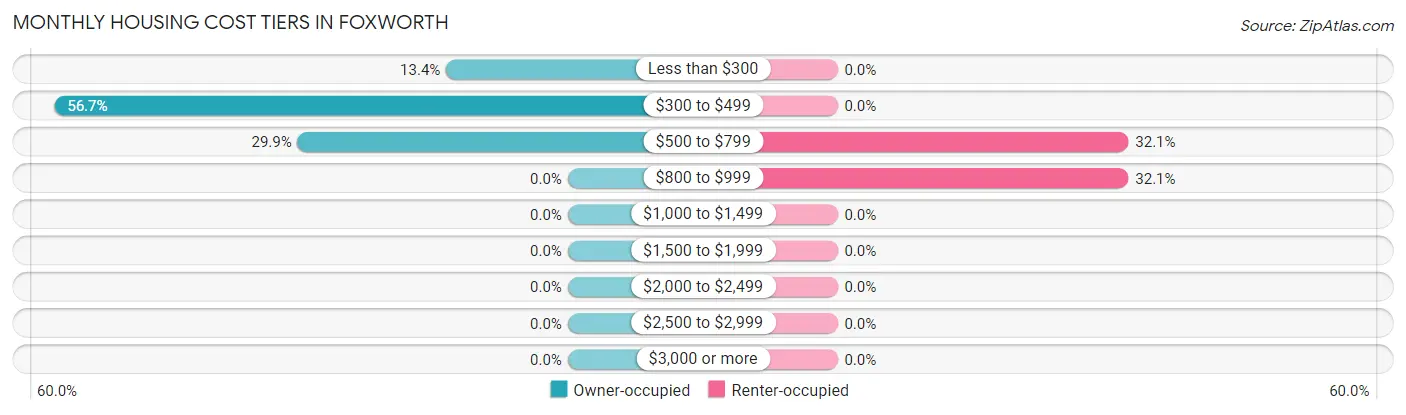
| Monthly Cost | Owner-occupied | Renter-occupied |
| Less than $300 | 18 (13.4%) | 0 (0.0%) |
| $300 to $499 | 76 (56.7%) | 0 (0.0%) |
| $500 to $799 | 40 (29.8%) | 18 (32.1%) |
| $800 to $999 | 0 (0.0%) | 18 (32.1%) |
| $1,000 to $1,499 | 0 (0.0%) | 0 (0.0%) |
| $1,500 to $1,999 | 0 (0.0%) | 0 (0.0%) |
| $2,000 to $2,499 | 0 (0.0%) | 0 (0.0%) |
| $2,500 to $2,999 | 0 (0.0%) | 0 (0.0%) |
| $3,000 or more | 0 (0.0%) | 0 (0.0%) |
| Total | 134 (100.0%) | 56 (100.0%) |
Physical Housing Characteristics in Foxworth
Housing Structures in Foxworth
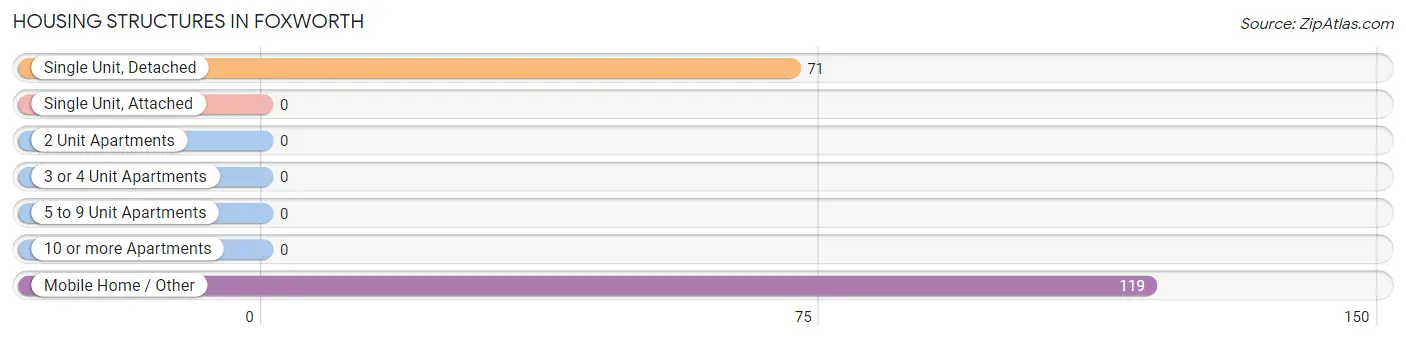
| Structure Type | # Housing Units | % Housing Units |
| Single Unit, Detached | 71 | 37.4% |
| Single Unit, Attached | 0 | 0.0% |
| 2 Unit Apartments | 0 | 0.0% |
| 3 or 4 Unit Apartments | 0 | 0.0% |
| 5 to 9 Unit Apartments | 0 | 0.0% |
| 10 or more Apartments | 0 | 0.0% |
| Mobile Home / Other | 119 | 62.6% |
| Total | 190 | 100.0% |
Housing Structures by Occupancy in Foxworth
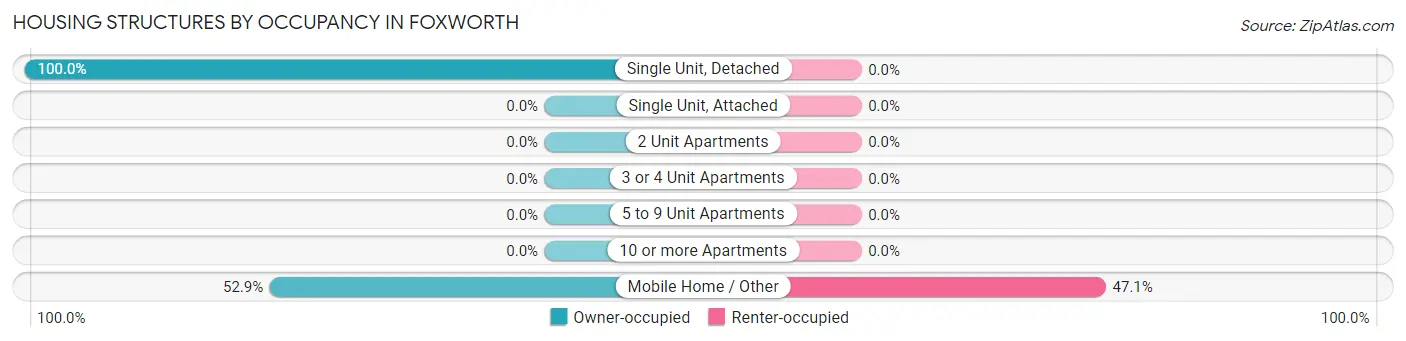
| Structure Type | Owner-occupied | Renter-occupied |
| Single Unit, Detached | 71 (100.0%) | 0 (0.0%) |
| Single Unit, Attached | 0 (0.0%) | 0 (0.0%) |
| 2 Unit Apartments | 0 (0.0%) | 0 (0.0%) |
| 3 or 4 Unit Apartments | 0 (0.0%) | 0 (0.0%) |
| 5 to 9 Unit Apartments | 0 (0.0%) | 0 (0.0%) |
| 10 or more Apartments | 0 (0.0%) | 0 (0.0%) |
| Mobile Home / Other | 63 (52.9%) | 56 (47.1%) |
| Total | 134 (70.5%) | 56 (29.5%) |
Housing Structures by Number of Rooms in Foxworth
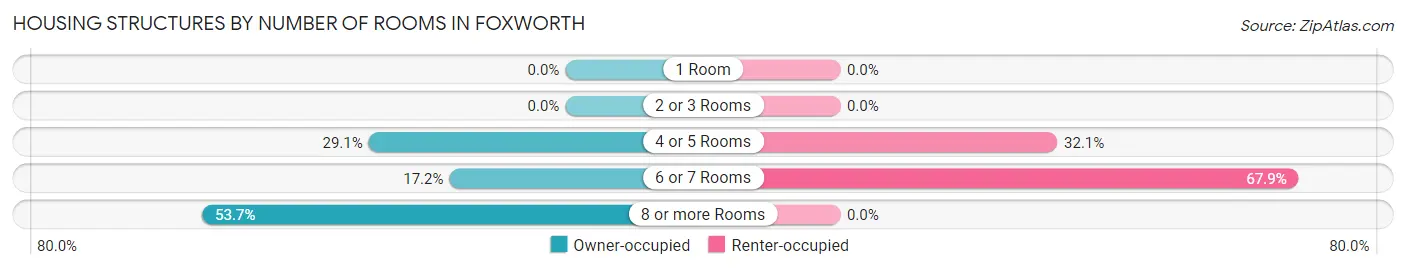
| Number of Rooms | Owner-occupied | Renter-occupied |
| 1 Room | 0 (0.0%) | 0 (0.0%) |
| 2 or 3 Rooms | 0 (0.0%) | 0 (0.0%) |
| 4 or 5 Rooms | 39 (29.1%) | 18 (32.1%) |
| 6 or 7 Rooms | 23 (17.2%) | 38 (67.9%) |
| 8 or more Rooms | 72 (53.7%) | 0 (0.0%) |
| Total | 134 (100.0%) | 56 (100.0%) |
Housing Structure by Heating Type in Foxworth
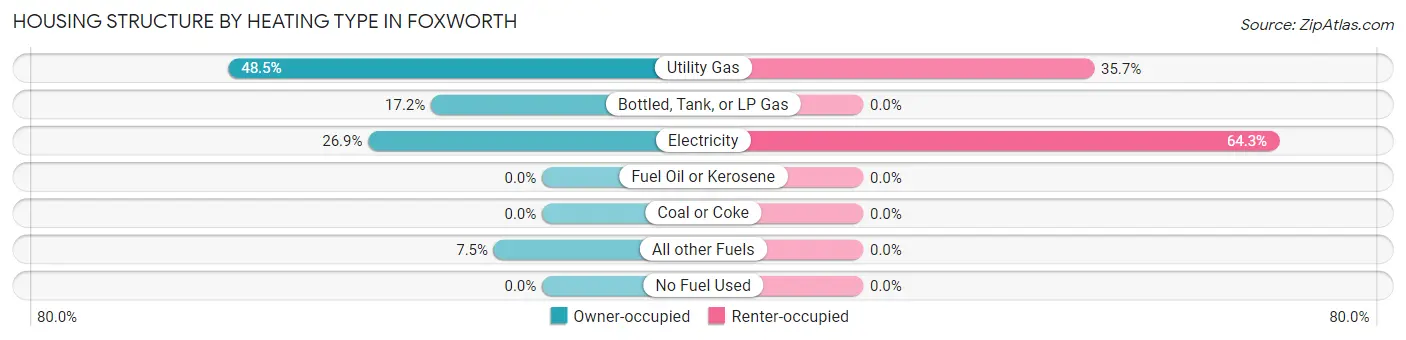
| Heating Type | Owner-occupied | Renter-occupied |
| Utility Gas | 65 (48.5%) | 20 (35.7%) |
| Bottled, Tank, or LP Gas | 23 (17.2%) | 0 (0.0%) |
| Electricity | 36 (26.9%) | 36 (64.3%) |
| Fuel Oil or Kerosene | 0 (0.0%) | 0 (0.0%) |
| Coal or Coke | 0 (0.0%) | 0 (0.0%) |
| All other Fuels | 10 (7.5%) | 0 (0.0%) |
| No Fuel Used | 0 (0.0%) | 0 (0.0%) |
| Total | 134 (100.0%) | 56 (100.0%) |
Household Vehicle Usage in Foxworth
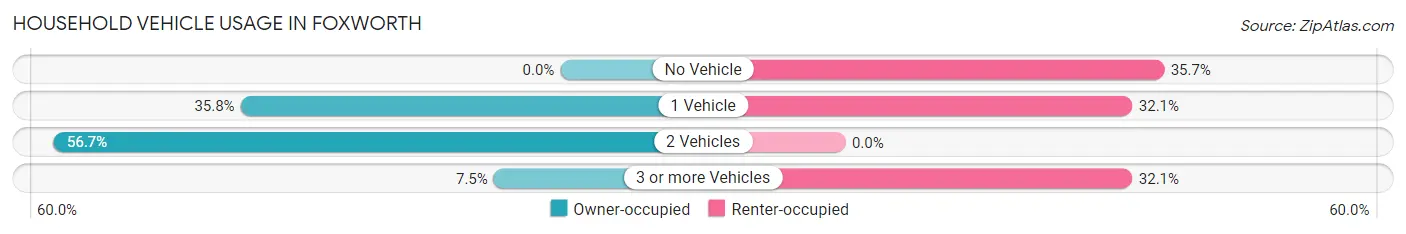
| Vehicles per Household | Owner-occupied | Renter-occupied |
| No Vehicle | 0 (0.0%) | 20 (35.7%) |
| 1 Vehicle | 48 (35.8%) | 18 (32.1%) |
| 2 Vehicles | 76 (56.7%) | 0 (0.0%) |
| 3 or more Vehicles | 10 (7.5%) | 18 (32.1%) |
| Total | 134 (100.0%) | 56 (100.0%) |
Real Estate & Mortgages in Foxworth
Real Estate and Mortgage Overview in Foxworth
| Characteristic | Without Mortgage | With Mortgage |
| Housing Units | 134 | 0 |
| Median Property Value | $43,700 | $0 |
| Median Household Income | $19,231 | $0 |
| Monthly Housing Costs | $400 | $0 |
| Real Estate Taxes | $325 | $0 |
Property Value by Mortgage Status in Foxworth
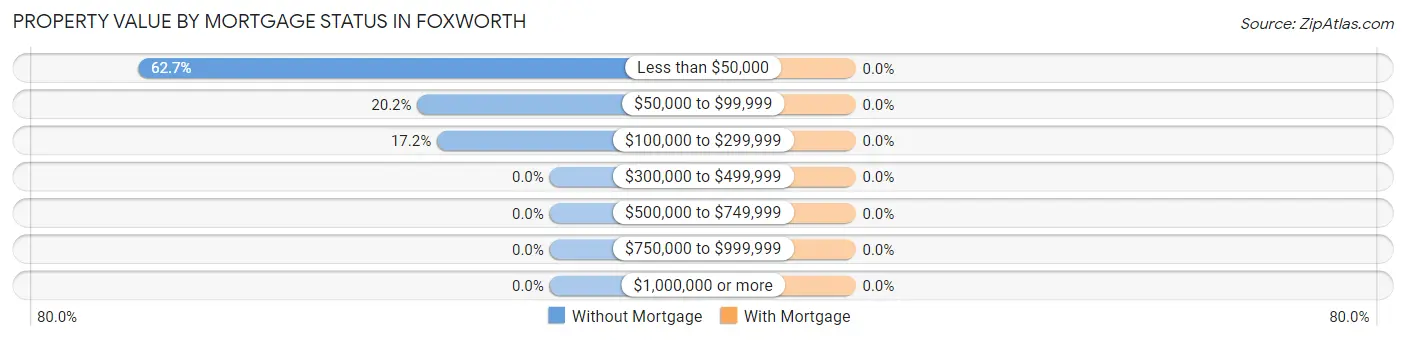
| Property Value | Without Mortgage | With Mortgage |
| Less than $50,000 | 84 (62.7%) | 0 (0.0%) |
| $50,000 to $99,999 | 27 (20.2%) | 0 (0.0%) |
| $100,000 to $299,999 | 23 (17.2%) | 0 (0.0%) |
| $300,000 to $499,999 | 0 (0.0%) | 0 (0.0%) |
| $500,000 to $749,999 | 0 (0.0%) | 0 (0.0%) |
| $750,000 to $999,999 | 0 (0.0%) | 0 (0.0%) |
| $1,000,000 or more | 0 (0.0%) | 0 (0.0%) |
| Total | 134 (100.0%) | 0 (0.0%) |
Household Income by Mortgage Status in Foxworth
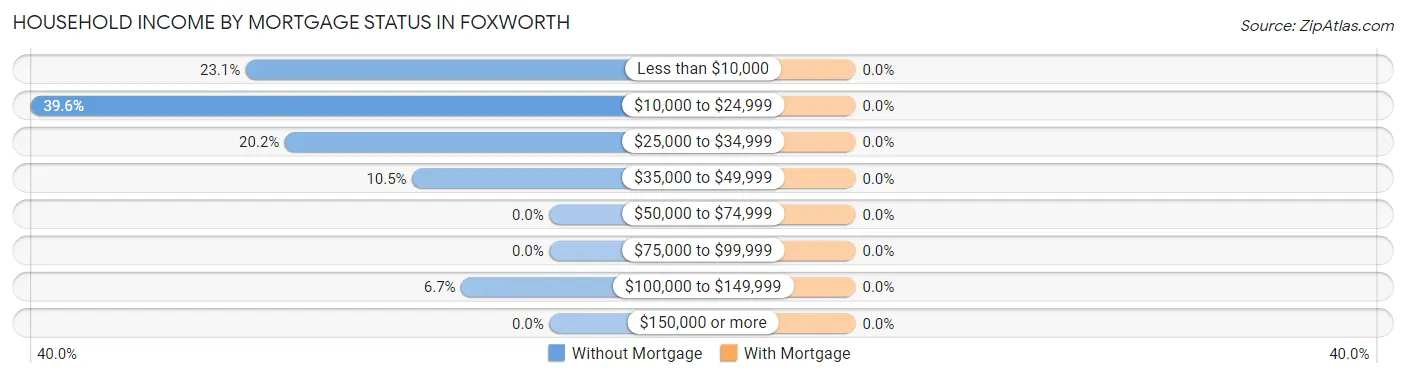
| Household Income | Without Mortgage | With Mortgage |
| Less than $10,000 | 31 (23.1%) | 0 (0.0%) |
| $10,000 to $24,999 | 53 (39.6%) | 0 (0.0%) |
| $25,000 to $34,999 | 27 (20.2%) | 0 (0.0%) |
| $35,000 to $49,999 | 14 (10.4%) | 0 (0.0%) |
| $50,000 to $74,999 | 0 (0.0%) | 0 (0.0%) |
| $75,000 to $99,999 | 0 (0.0%) | 0 (0.0%) |
| $100,000 to $149,999 | 9 (6.7%) | 0 (0.0%) |
| $150,000 or more | 0 (0.0%) | 0 (0.0%) |
| Total | 134 (100.0%) | 0 (0.0%) |
Property Value to Household Income Ratio in Foxworth
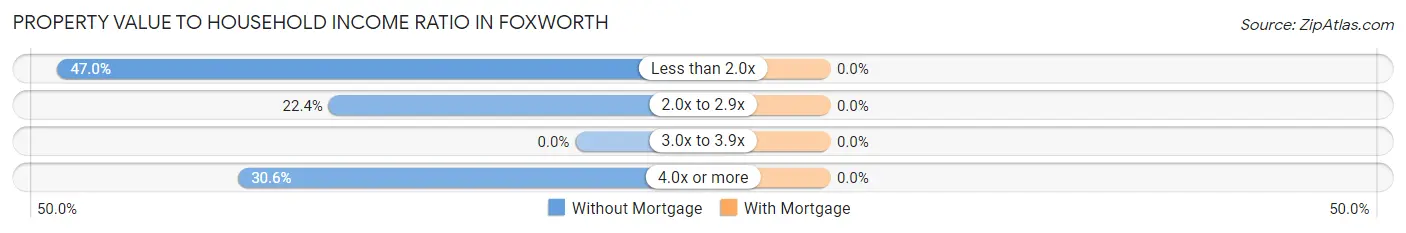
| Value-to-Income Ratio | Without Mortgage | With Mortgage |
| Less than 2.0x | 63 (47.0%) | 0 (0.0%) |
| 2.0x to 2.9x | 30 (22.4%) | 0 (0.0%) |
| 3.0x to 3.9x | 0 (0.0%) | 0 (0.0%) |
| 4.0x or more | 41 (30.6%) | 0 (0.0%) |
| Total | 134 (100.0%) | 0 (0.0%) |
Real Estate Taxes by Mortgage Status in Foxworth
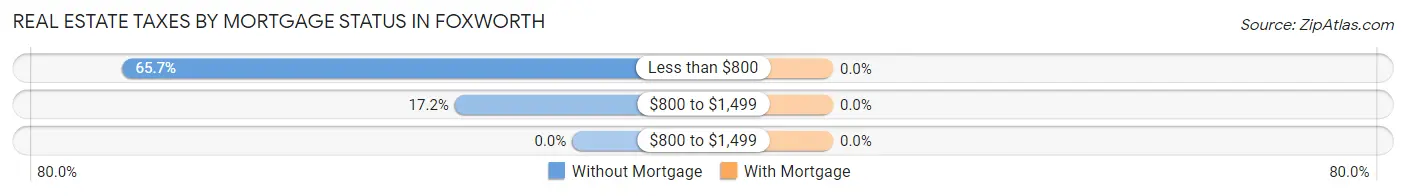
| Property Taxes | Without Mortgage | With Mortgage |
| Less than $800 | 88 (65.7%) | 0 (0.0%) |
| $800 to $1,499 | 23 (17.2%) | 0 (0.0%) |
| $800 to $1,499 | 0 (0.0%) | 0 (0.0%) |
| Total | 134 (100.0%) | 0 (0.0%) |
Health & Disability in Foxworth
Health Insurance Coverage by Age in Foxworth
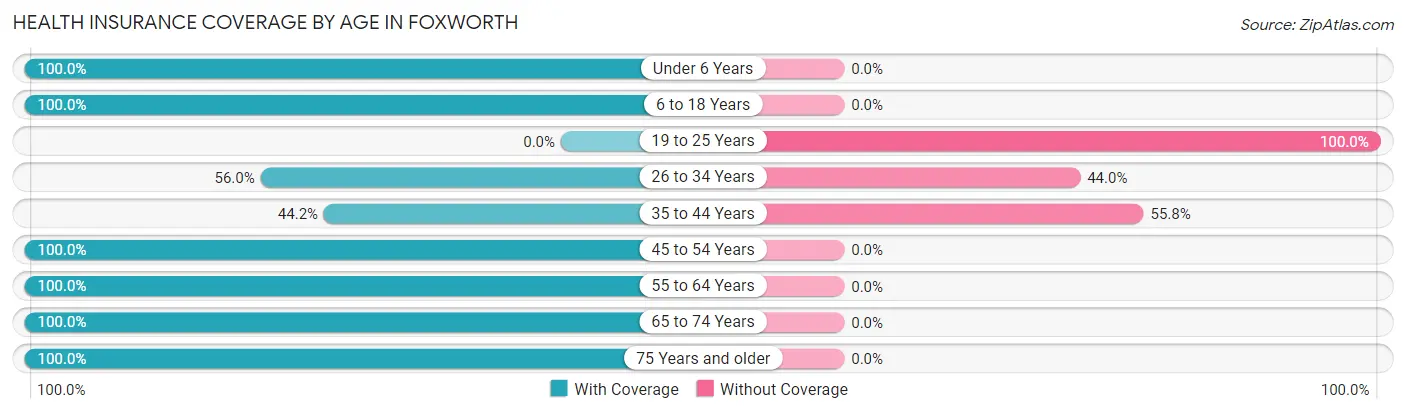
| Age Bracket | With Coverage | Without Coverage |
| Under 6 Years | 107 (100.0%) | 0 (0.0%) |
| 6 to 18 Years | 85 (100.0%) | 0 (0.0%) |
| 19 to 25 Years | 0 (0.0%) | 62 (100.0%) |
| 26 to 34 Years | 28 (56.0%) | 22 (44.0%) |
| 35 to 44 Years | 38 (44.2%) | 48 (55.8%) |
| 45 to 54 Years | 85 (100.0%) | 0 (0.0%) |
| 55 to 64 Years | 70 (100.0%) | 0 (0.0%) |
| 65 to 74 Years | 20 (100.0%) | 0 (0.0%) |
| 75 Years and older | 41 (100.0%) | 0 (0.0%) |
| Total | 474 (78.2%) | 132 (21.8%) |
Health Insurance Coverage by Citizenship Status in Foxworth
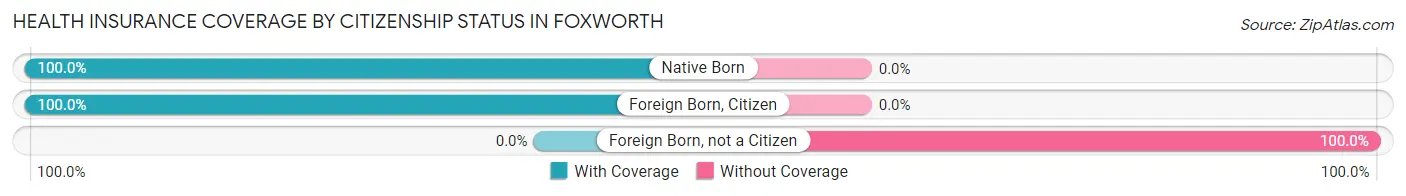
| Citizenship Status | With Coverage | Without Coverage |
| Native Born | 107 (100.0%) | 0 (0.0%) |
| Foreign Born, Citizen | 85 (100.0%) | 0 (0.0%) |
| Foreign Born, not a Citizen | 0 (0.0%) | 62 (100.0%) |
Health Insurance Coverage by Household Income in Foxworth
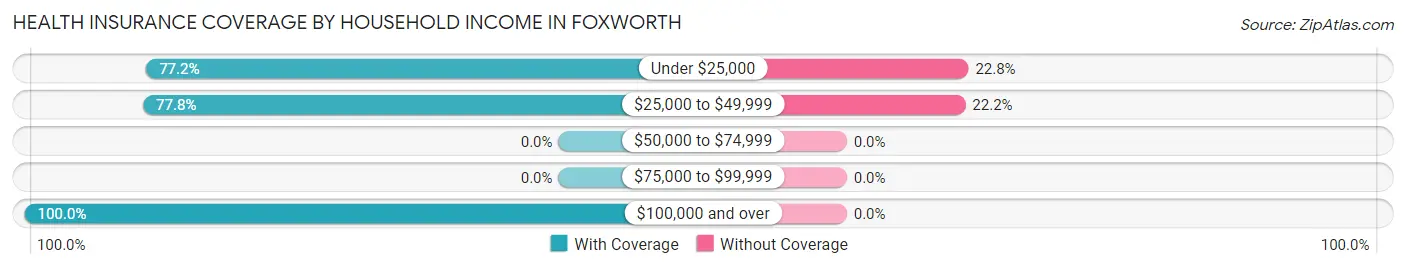
| Household Income | With Coverage | Without Coverage |
| Under $25,000 | 210 (77.2%) | 62 (22.8%) |
| $25,000 to $49,999 | 245 (77.8%) | 70 (22.2%) |
| $50,000 to $74,999 | 0 (0.0%) | 0 (0.0%) |
| $75,000 to $99,999 | 0 (0.0%) | 0 (0.0%) |
| $100,000 and over | 19 (100.0%) | 0 (0.0%) |
Public vs Private Health Insurance Coverage by Age in Foxworth
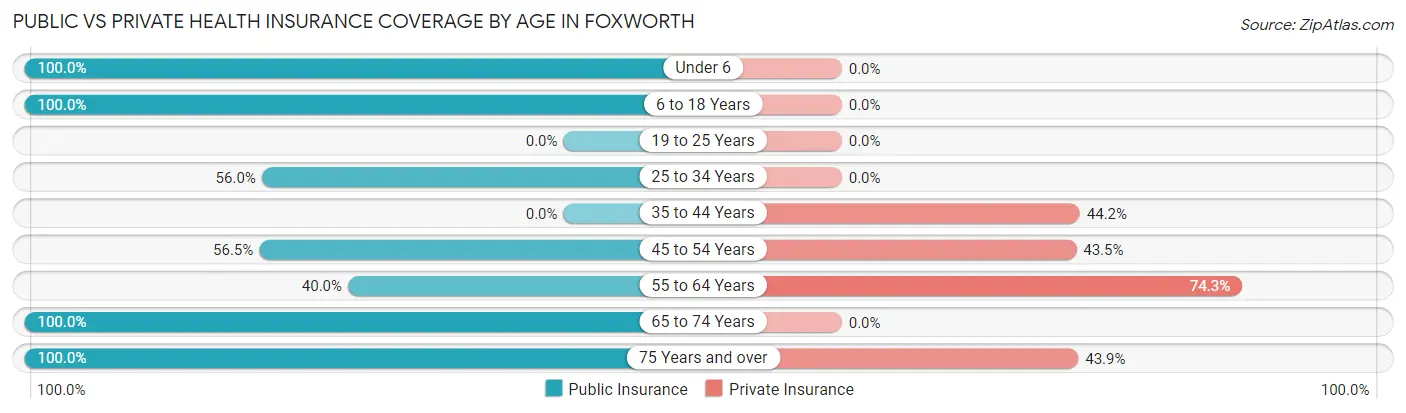
| Age Bracket | Public Insurance | Private Insurance |
| Under 6 | 107 (100.0%) | 0 (0.0%) |
| 6 to 18 Years | 85 (100.0%) | 0 (0.0%) |
| 19 to 25 Years | 0 (0.0%) | 0 (0.0%) |
| 25 to 34 Years | 28 (56.0%) | 0 (0.0%) |
| 35 to 44 Years | 0 (0.0%) | 38 (44.2%) |
| 45 to 54 Years | 48 (56.5%) | 37 (43.5%) |
| 55 to 64 Years | 28 (40.0%) | 52 (74.3%) |
| 65 to 74 Years | 20 (100.0%) | 0 (0.0%) |
| 75 Years and over | 41 (100.0%) | 18 (43.9%) |
| Total | 357 (58.9%) | 145 (23.9%) |
Disability Status by Sex by Age in Foxworth
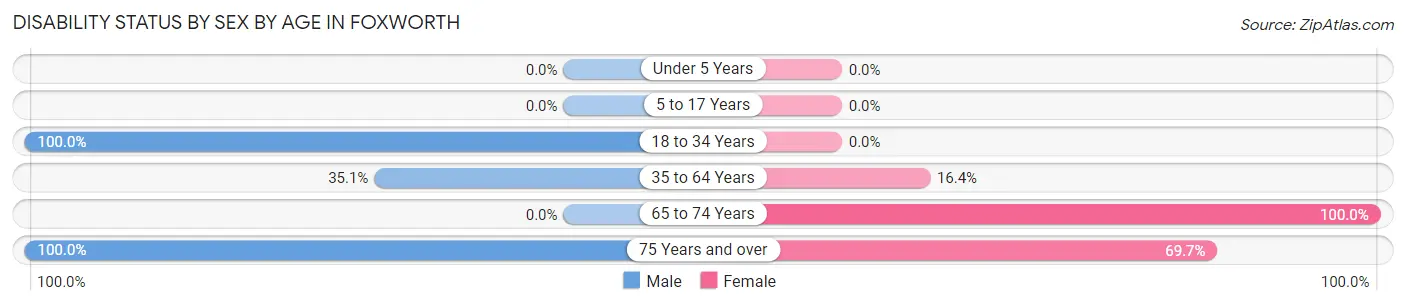
| Age Bracket | Male | Female |
| Under 5 Years | 0 (0.0%) | 0 (0.0%) |
| 5 to 17 Years | 0 (0.0%) | 0 (0.0%) |
| 18 to 34 Years | 18 (100.0%) | 0 (0.0%) |
| 35 to 64 Years | 46 (35.1%) | 18 (16.4%) |
| 65 to 74 Years | 0 (0.0%) | 20 (100.0%) |
| 75 Years and over | 8 (100.0%) | 23 (69.7%) |
Disability Class by Sex by Age in Foxworth
Disability Class: Hearing Difficulty
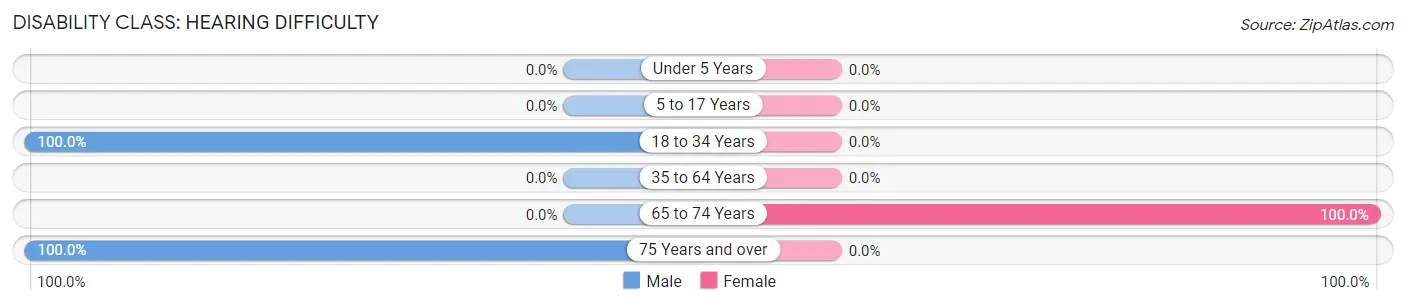
| Age Bracket | Male | Female |
| Under 5 Years | 0 (0.0%) | 0 (0.0%) |
| 5 to 17 Years | 0 (0.0%) | 0 (0.0%) |
| 18 to 34 Years | 18 (100.0%) | 0 (0.0%) |
| 35 to 64 Years | 0 (0.0%) | 0 (0.0%) |
| 65 to 74 Years | 0 (0.0%) | 20 (100.0%) |
| 75 Years and over | 8 (100.0%) | 0 (0.0%) |
Disability Class: Vision Difficulty
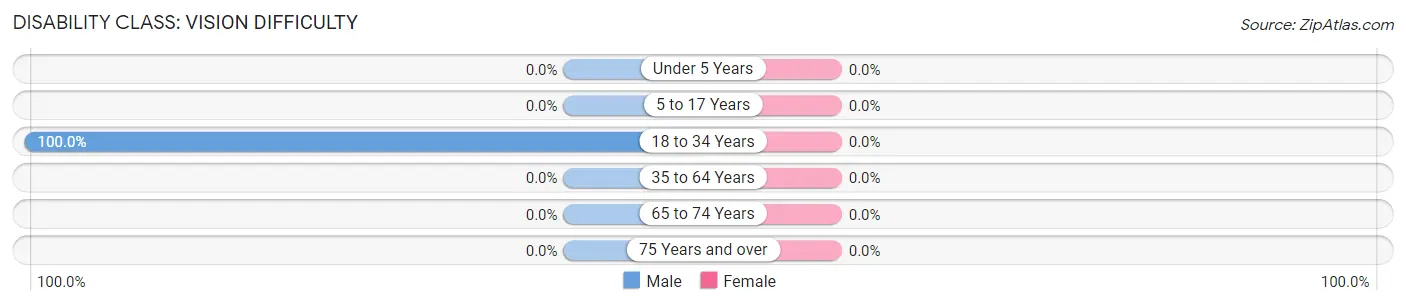
| Age Bracket | Male | Female |
| Under 5 Years | 0 (0.0%) | 0 (0.0%) |
| 5 to 17 Years | 0 (0.0%) | 0 (0.0%) |
| 18 to 34 Years | 18 (100.0%) | 0 (0.0%) |
| 35 to 64 Years | 0 (0.0%) | 0 (0.0%) |
| 65 to 74 Years | 0 (0.0%) | 0 (0.0%) |
| 75 Years and over | 0 (0.0%) | 0 (0.0%) |
Disability Class: Cognitive Difficulty
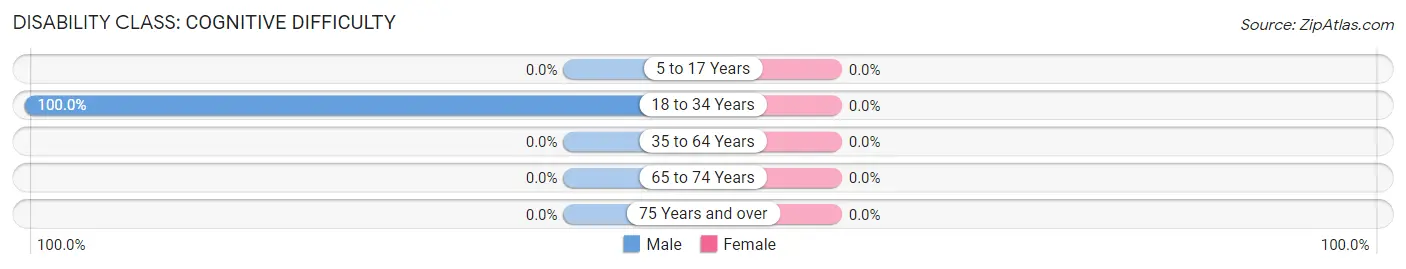
| Age Bracket | Male | Female |
| 5 to 17 Years | 0 (0.0%) | 0 (0.0%) |
| 18 to 34 Years | 18 (100.0%) | 0 (0.0%) |
| 35 to 64 Years | 0 (0.0%) | 0 (0.0%) |
| 65 to 74 Years | 0 (0.0%) | 0 (0.0%) |
| 75 Years and over | 0 (0.0%) | 0 (0.0%) |
Disability Class: Ambulatory Difficulty
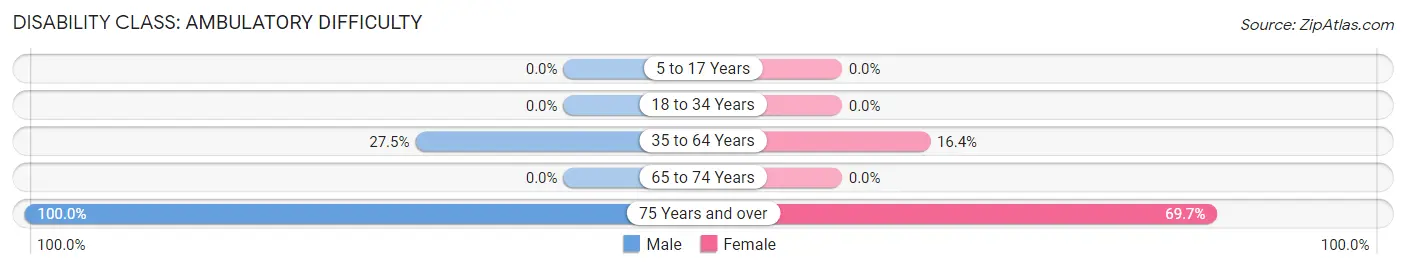
| Age Bracket | Male | Female |
| 5 to 17 Years | 0 (0.0%) | 0 (0.0%) |
| 18 to 34 Years | 0 (0.0%) | 0 (0.0%) |
| 35 to 64 Years | 36 (27.5%) | 18 (16.4%) |
| 65 to 74 Years | 0 (0.0%) | 0 (0.0%) |
| 75 Years and over | 8 (100.0%) | 23 (69.7%) |
Disability Class: Self-Care Difficulty
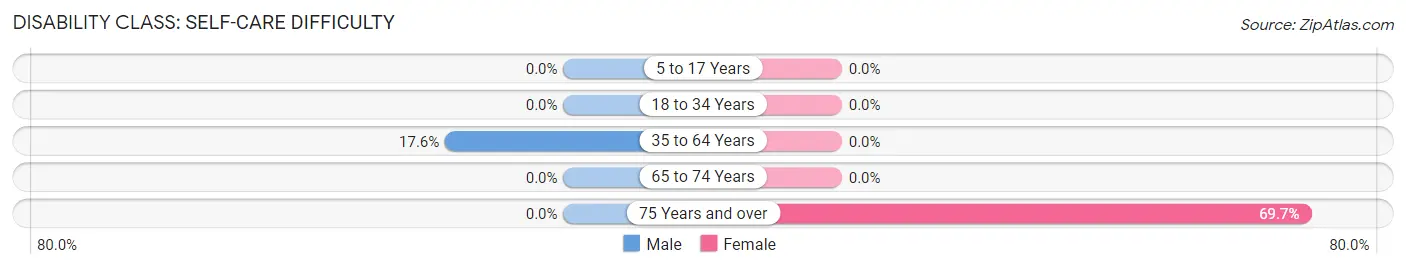
| Age Bracket | Male | Female |
| 5 to 17 Years | 0 (0.0%) | 0 (0.0%) |
| 18 to 34 Years | 0 (0.0%) | 0 (0.0%) |
| 35 to 64 Years | 23 (17.6%) | 0 (0.0%) |
| 65 to 74 Years | 0 (0.0%) | 0 (0.0%) |
| 75 Years and over | 0 (0.0%) | 23 (69.7%) |
Technology Access in Foxworth
Computing Device Access in Foxworth
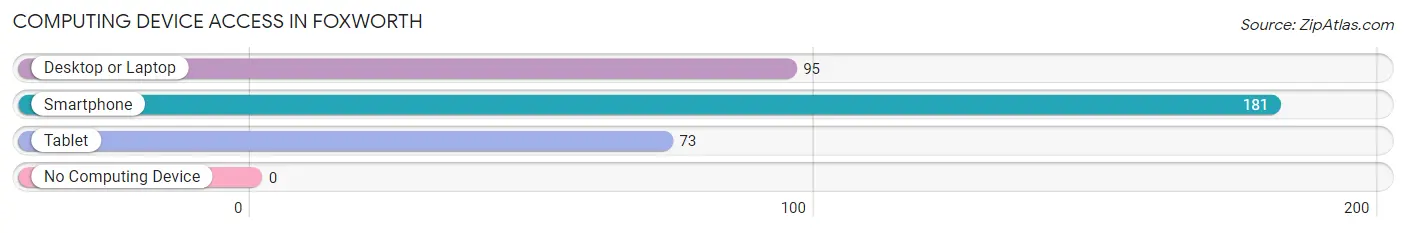
| Device Type | # Households | % Households |
| Desktop or Laptop | 95 | 50.0% |
| Smartphone | 181 | 95.3% |
| Tablet | 73 | 38.4% |
| No Computing Device | 0 | 0.0% |
| Total | 190 | 100.0% |
Internet Access in Foxworth
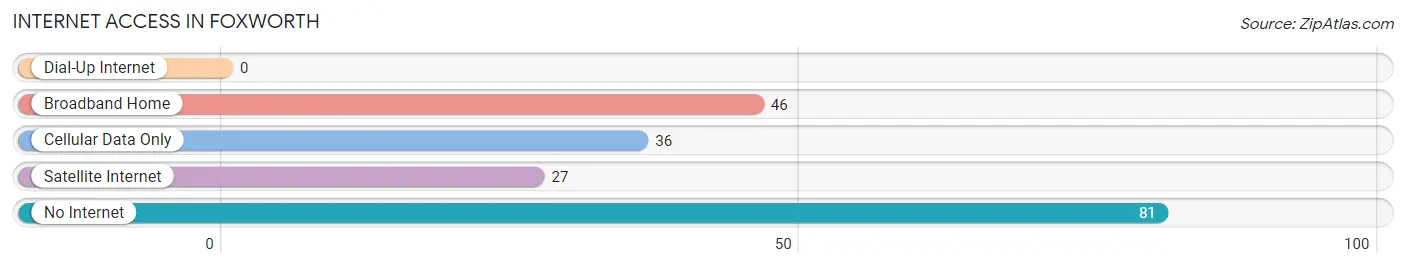
| Internet Type | # Households | % Households |
| Dial-Up Internet | 0 | 0.0% |
| Broadband Home | 46 | 24.2% |
| Cellular Data Only | 36 | 19.0% |
| Satellite Internet | 27 | 14.2% |
| No Internet | 81 | 42.6% |
| Total | 190 | 100.0% |
Foxworth Summary
Foxworth is a small town located in Marion County, Mississippi. It is situated in the southeastern part of the state, approximately 20 miles from the state capital of Jackson. The town has a population of approximately 1,000 people and is part of the Hattiesburg-Laurel Metropolitan Statistical Area.
History
Foxworth was founded in 1883 by the Foxworth family, who were among the first settlers in the area. The town was named after the family, and the Foxworth family still owns much of the land in the area. The town was originally a farming community, and the Foxworth family owned a large cotton plantation. The town was incorporated in 1887 and has remained relatively small since then.
Geography
Foxworth is located in the southeastern part of Mississippi, approximately 20 miles from the state capital of Jackson. The town is situated in Marion County, and is part of the Hattiesburg-Laurel Metropolitan Statistical Area. The town is located in a rural area, and is surrounded by forests and farmland. The town is located near the Leaf River, which provides a source of recreation for the town's residents.
Economy
The economy of Foxworth is largely based on agriculture. The town is home to several farms, and the Foxworth family still owns a large cotton plantation in the area. The town also has a few small businesses, including a grocery store, a hardware store, and a few restaurants. The town is also home to a few manufacturing plants, which provide jobs for the town's residents.
Demographics
As of the 2010 census, the population of Foxworth was 1,000 people. The town is predominantly white, with approximately 90% of the population being white. The remaining 10% of the population is made up of African Americans, Hispanics, and other ethnicities. The median household income in Foxworth is $30,000, and the median age is 37 years old.
Conclusion
Foxworth is a small town located in Marion County, Mississippi. It is situated in the southeastern part of the state, approximately 20 miles from the state capital of Jackson. The town has a population of approximately 1,000 people and is part of the Hattiesburg-Laurel Metropolitan Statistical Area. The economy of Foxworth is largely based on agriculture, and the town is home to several farms and manufacturing plants. The town is predominantly white, with approximately 90% of the population being white. The median household income in Foxworth is $30,000, and the median age is 37 years old.
Common Questions
What is Per Capita Income in Foxworth?
Per Capita income in Foxworth is $9,201.
What is the Median Family Income in Foxworth?
Median Family Income in Foxworth is $20,288.
What is the Median Household income in Foxworth?
Median Household Income in Foxworth is $21,154.
What is Inequality or Gini Index in Foxworth?
Inequality or Gini Index in Foxworth is 0.41.
What is the Total Population of Foxworth?
Total Population of Foxworth is 606.
What is the Total Male Population of Foxworth?
Total Male Population of Foxworth is 268.
What is the Total Female Population of Foxworth?
Total Female Population of Foxworth is 338.
What is the Ratio of Males per 100 Females in Foxworth?
There are 79.29 Males per 100 Females in Foxworth.
What is the Ratio of Females per 100 Males in Foxworth?
There are 126.12 Females per 100 Males in Foxworth.
What is the Median Population Age in Foxworth?
Median Population Age in Foxworth is 30.0 Years.
What is the Average Family Size in Foxworth
Average Family Size in Foxworth is 4.0 People.
What is the Average Household Size in Foxworth
Average Household Size in Foxworth is 3.2 People.
How Large is the Labor Force in Foxworth?
There are 164 People in the Labor Forcein in Foxworth.
What is the Percentage of People in the Labor Force in Foxworth?
39.6% of People are in the Labor Force in Foxworth.
What is the Unemployment Rate in Foxworth?
Unemployment Rate in Foxworth is 20.7%.