Sutton Alpine, AK Map & Demographics
Sutton Alpine Map
Sutton Alpine Overview
$29,078
PER CAPITA INCOME
$92,083
AVG FAMILY INCOME
$71,058
AVG HOUSEHOLD INCOME
40.5%
WAGE / INCOME GAP [ % ]
59.5¢/ $1
WAGE / INCOME GAP [ $ ]
0.41
INEQUALITY / GINI INDEX
1,323
TOTAL POPULATION
892
MALE POPULATION
431
FEMALE POPULATION
206.96
MALES / 100 FEMALES
48.32
FEMALES / 100 MALES
40.5
MEDIAN AGE
3.1
AVG FAMILY SIZE
2.4
AVG HOUSEHOLD SIZE
416
LABOR FORCE [ PEOPLE ]
36.3%
PERCENT IN LABOR FORCE
13.2%
UNEMPLOYMENT RATE
Income in Sutton Alpine
Income Overview in Sutton Alpine
Per Capita Income in Sutton Alpine is $29,078, while median incomes of families and households are $92,083 and $71,058 respectively.
| Characteristic | Number | Measure |
| Per Capita Income | 1,323 | $29,078 |
| Median Family Income | 221 | $92,083 |
| Mean Family Income | 221 | $122,224 |
| Median Household Income | 368 | $71,058 |
| Mean Household Income | 368 | $98,753 |
| Income Deficit | 221 | $0 |
| Wage / Income Gap (%) | 1,323 | 40.52% |
| Wage / Income Gap ($) | 1,323 | 59.48¢ per $1 |
| Gini / Inequality Index | 1,323 | 0.41 |
Earnings by Sex in Sutton Alpine
Average Earnings in Sutton Alpine are $30,000, $23,750 for men and $39,931 for women, a difference of 40.5%.
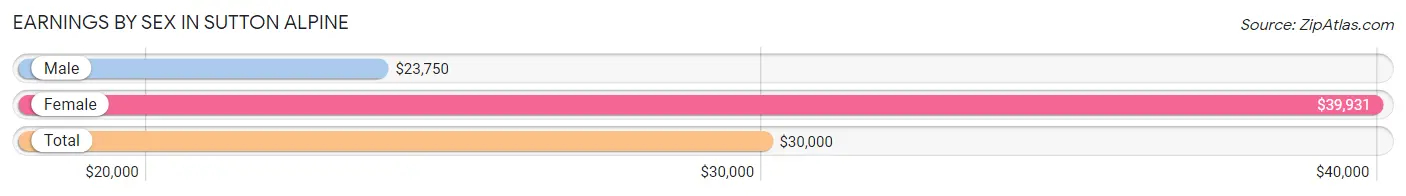
| Sex | Number | Average Earnings |
| Male | 451 (72.0%) | $23,750 |
| Female | 175 (28.0%) | $39,931 |
| Total | 626 (100.0%) | $30,000 |
Earnings by Sex by Income Bracket in Sutton Alpine
The most common earnings brackets in Sutton Alpine are $2,499 or less for men (99 | 22.0%) and $35,000 to $39,999 for women (26 | 14.9%).
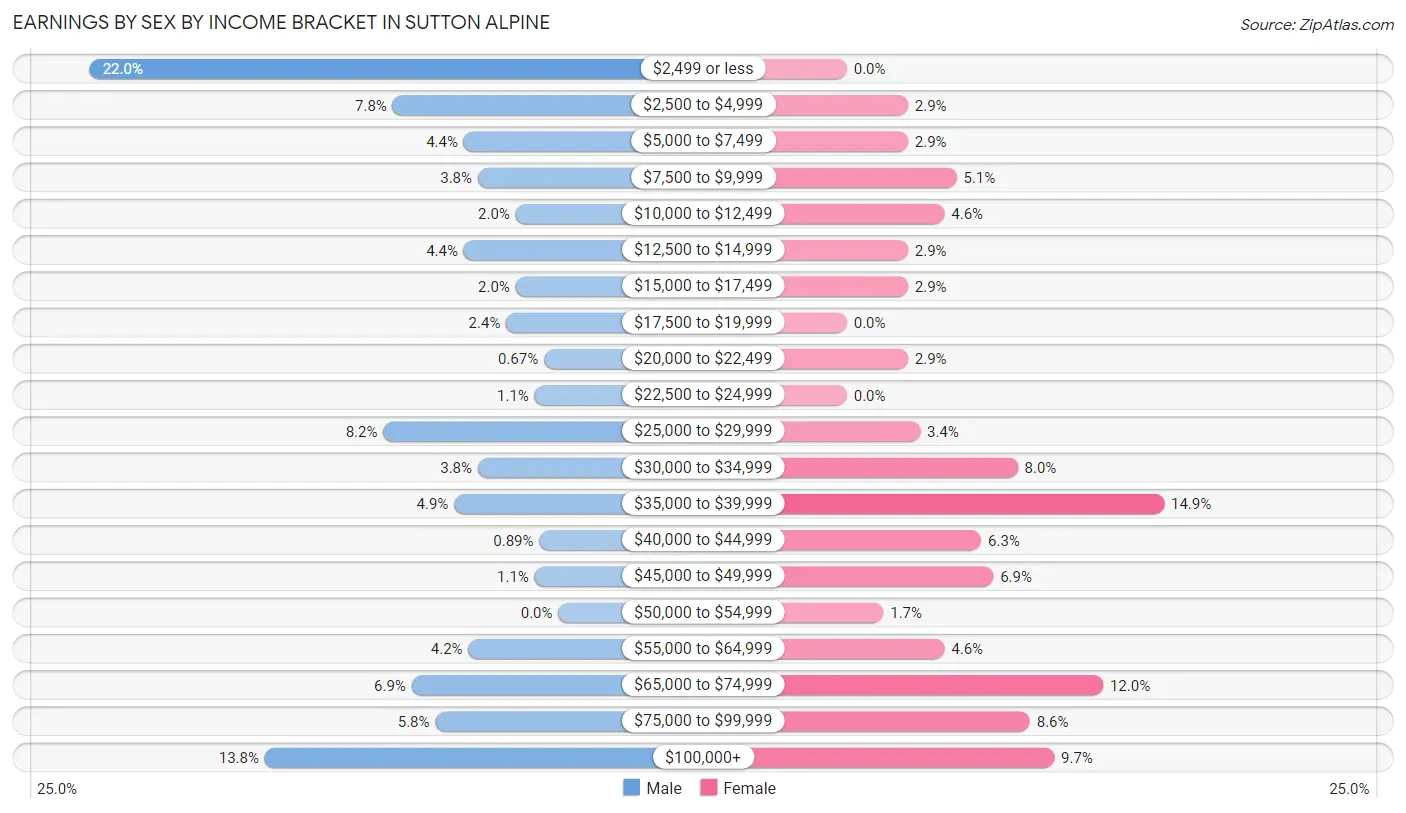
| Income | Male | Female |
| $2,499 or less | 99 (22.0%) | 0 (0.0%) |
| $2,500 to $4,999 | 35 (7.8%) | 5 (2.9%) |
| $5,000 to $7,499 | 20 (4.4%) | 5 (2.9%) |
| $7,500 to $9,999 | 17 (3.8%) | 9 (5.1%) |
| $10,000 to $12,499 | 9 (2.0%) | 8 (4.6%) |
| $12,500 to $14,999 | 20 (4.4%) | 5 (2.9%) |
| $15,000 to $17,499 | 9 (2.0%) | 5 (2.9%) |
| $17,500 to $19,999 | 11 (2.4%) | 0 (0.0%) |
| $20,000 to $22,499 | 3 (0.7%) | 5 (2.9%) |
| $22,500 to $24,999 | 5 (1.1%) | 0 (0.0%) |
| $25,000 to $29,999 | 37 (8.2%) | 6 (3.4%) |
| $30,000 to $34,999 | 17 (3.8%) | 14 (8.0%) |
| $35,000 to $39,999 | 22 (4.9%) | 26 (14.9%) |
| $40,000 to $44,999 | 4 (0.9%) | 11 (6.3%) |
| $45,000 to $49,999 | 5 (1.1%) | 12 (6.9%) |
| $50,000 to $54,999 | 0 (0.0%) | 3 (1.7%) |
| $55,000 to $64,999 | 19 (4.2%) | 8 (4.6%) |
| $65,000 to $74,999 | 31 (6.9%) | 21 (12.0%) |
| $75,000 to $99,999 | 26 (5.8%) | 15 (8.6%) |
| $100,000+ | 62 (13.8%) | 17 (9.7%) |
| Total | 451 (100.0%) | 175 (100.0%) |
Earnings by Sex by Educational Attainment in Sutton Alpine
Average earnings in Sutton Alpine are $30,938 for men and $42,045 for women, a difference of 26.4%. Men with an educational attainment of graduate degree enjoy the highest average annual earnings of $65,000, while those with college or associate's degree education earn the least with $61,875. Women with an educational attainment of graduate degree earn the most with the average annual earnings of $115,938, while those with high school diploma education have the smallest earnings of $36,875.
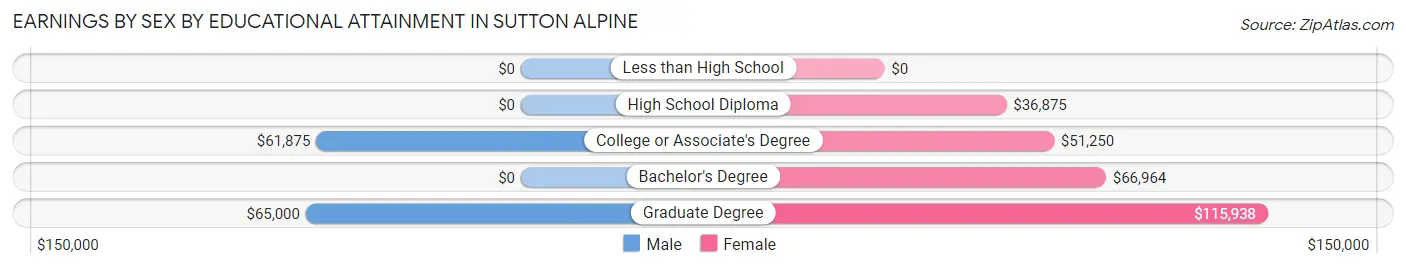
| Educational Attainment | Male Income | Female Income |
| Less than High School | - | - |
| High School Diploma | - | - |
| College or Associate's Degree | $61,875 | $51,250 |
| Bachelor's Degree | - | - |
| Graduate Degree | $65,000 | $115,938 |
| Total | $30,938 | $42,045 |
Family Income in Sutton Alpine
Family Income Brackets in Sutton Alpine
According to the Sutton Alpine family income data, there are 54 families falling into the $50,000 to $74,999 income range, which is the most common income bracket and makes up 24.4% of all families.
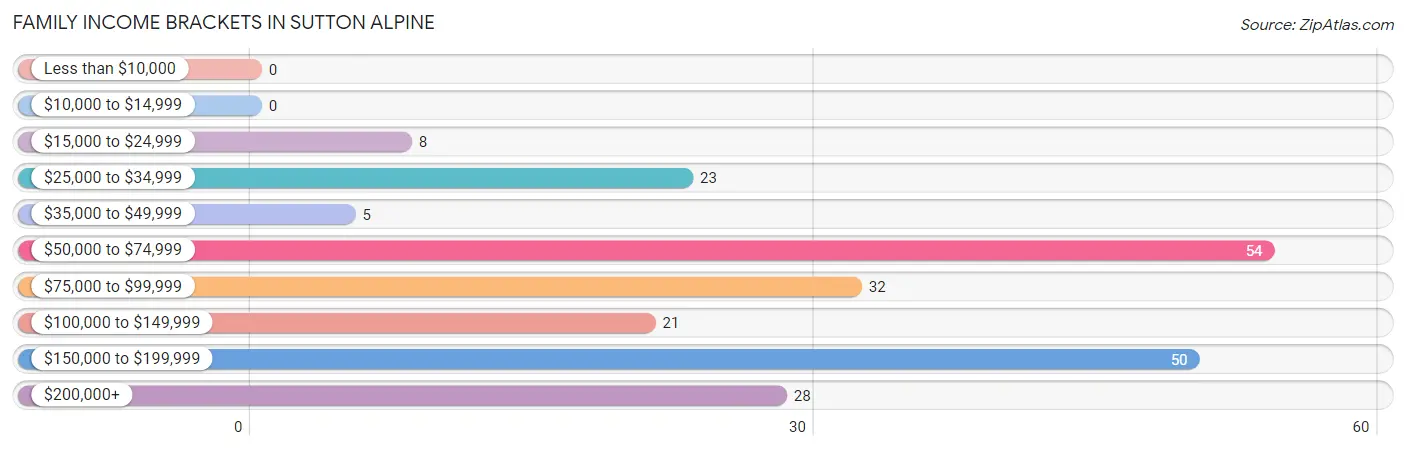
| Income Bracket | # Families | % Families |
| Less than $10,000 | 0 | 0.0% |
| $10,000 to $14,999 | 0 | 0.0% |
| $15,000 to $24,999 | 8 | 3.6% |
| $25,000 to $34,999 | 23 | 10.4% |
| $35,000 to $49,999 | 5 | 2.3% |
| $50,000 to $74,999 | 54 | 24.4% |
| $75,000 to $99,999 | 32 | 14.5% |
| $100,000 to $149,999 | 21 | 9.5% |
| $150,000 to $199,999 | 50 | 22.6% |
| $200,000+ | 28 | 12.7% |
Family Income by Famaliy Size in Sutton Alpine
5-person families (10 | 4.5%) account for the highest median family income in Sutton Alpine with $196,000 per family, while 2-person families (118 | 53.4%) have the highest median income of $48,125 per family member.
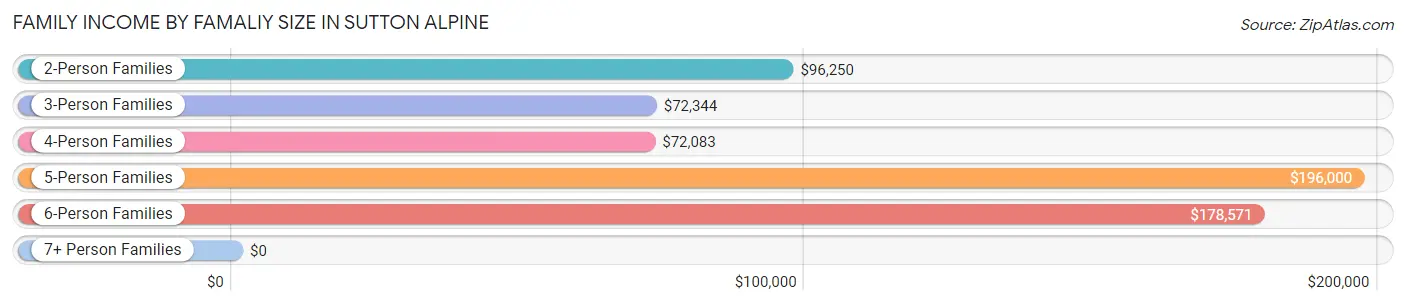
| Income Bracket | # Families | Median Income |
| 2-Person Families | 118 (53.4%) | $96,250 |
| 3-Person Families | 37 (16.7%) | $72,344 |
| 4-Person Families | 33 (14.9%) | $72,083 |
| 5-Person Families | 10 (4.5%) | $196,000 |
| 6-Person Families | 14 (6.3%) | $178,571 |
| 7+ Person Families | 9 (4.1%) | $0 |
| Total | 221 (100.0%) | $92,083 |
Family Income by Number of Earners in Sutton Alpine
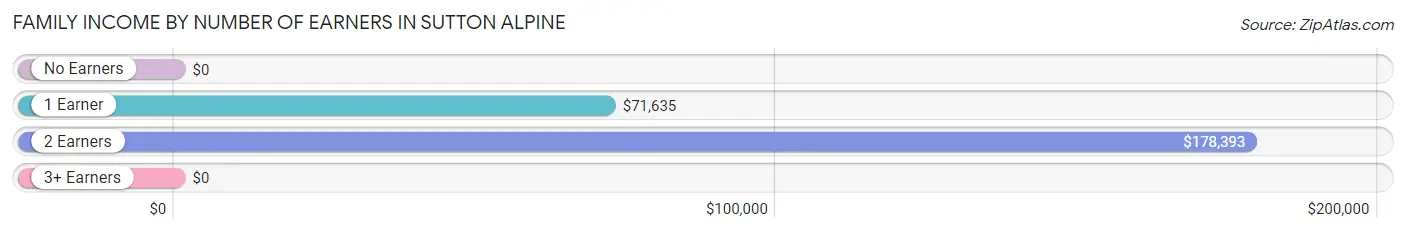
| Number of Earners | # Families | Median Income |
| No Earners | 29 (13.1%) | $0 |
| 1 Earner | 93 (42.1%) | $71,635 |
| 2 Earners | 85 (38.5%) | $178,393 |
| 3+ Earners | 14 (6.3%) | $0 |
| Total | 221 (100.0%) | $92,083 |
Household Income in Sutton Alpine
Household Income Brackets in Sutton Alpine
With 102 households falling in the category, the $50,000 to $74,999 income range is the most frequent in Sutton Alpine, accounting for 27.7% of all households.
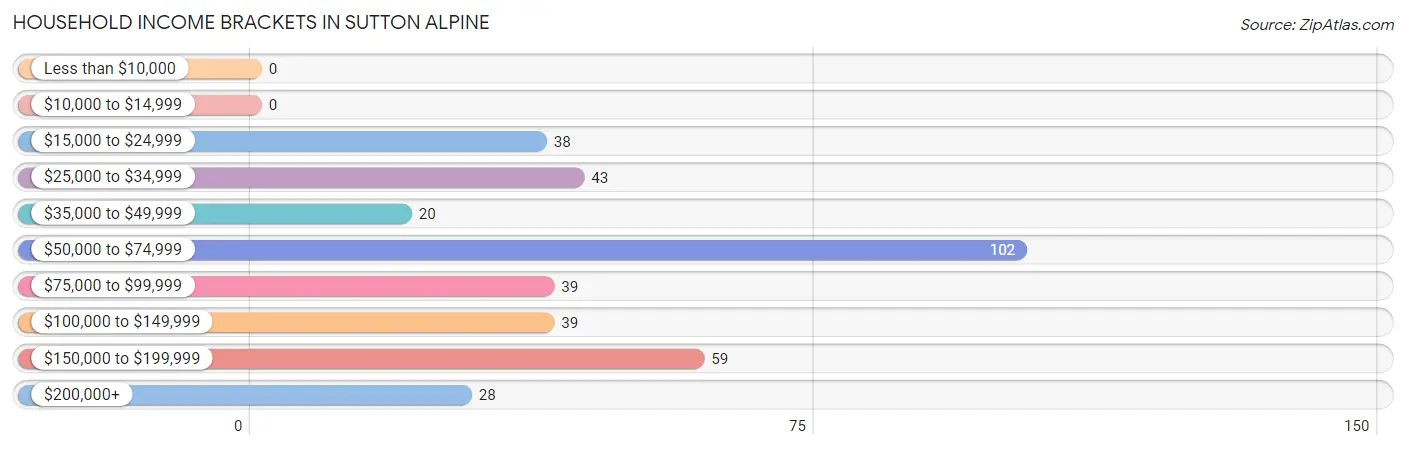
| Income Bracket | # Households | % Households |
| Less than $10,000 | 0 | 0.0% |
| $10,000 to $14,999 | 0 | 0.0% |
| $15,000 to $24,999 | 38 | 10.3% |
| $25,000 to $34,999 | 43 | 11.7% |
| $35,000 to $49,999 | 20 | 5.4% |
| $50,000 to $74,999 | 102 | 27.7% |
| $75,000 to $99,999 | 39 | 10.6% |
| $100,000 to $149,999 | 39 | 10.6% |
| $150,000 to $199,999 | 59 | 16.0% |
| $200,000+ | 28 | 7.6% |
Household Income by Householder Age in Sutton Alpine
The median household income in Sutton Alpine is $71,058, with the highest median household income of $90,556 found in the 45 to 64 years age bracket for the primary householder. A total of 152 households (41.3%) fall into this category. Meanwhile, the 15 to 24 years age bracket for the primary householder has the lowest median household income of $0, with 18 households (4.9%) in this group.
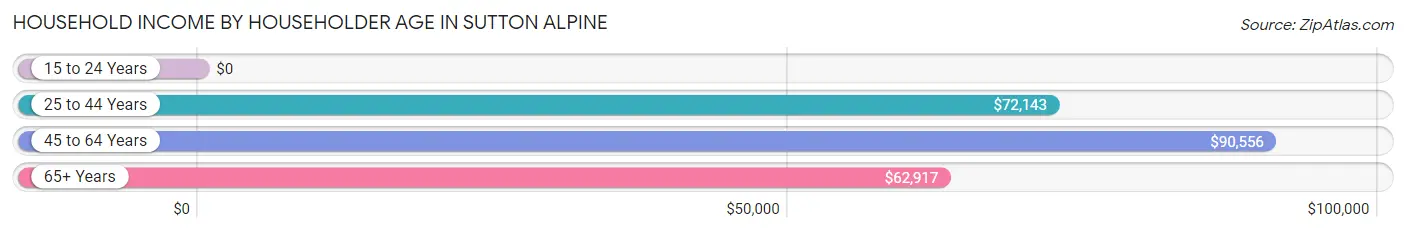
| Income Bracket | # Households | Median Income |
| 15 to 24 Years | 18 (4.9%) | $0 |
| 25 to 44 Years | 90 (24.5%) | $72,143 |
| 45 to 64 Years | 152 (41.3%) | $90,556 |
| 65+ Years | 108 (29.3%) | $62,917 |
| Total | 368 (100.0%) | $71,058 |
Poverty in Sutton Alpine
Income Below Poverty by Sex and Age in Sutton Alpine
With 5.3% poverty level for males and 7.3% for females among the residents of Sutton Alpine, under 5 year old males and 12 to 14 year old females are the most vulnerable to poverty, with 5 males (45.5%) and 12 females (80.0%) in their respective age groups living below the poverty level.
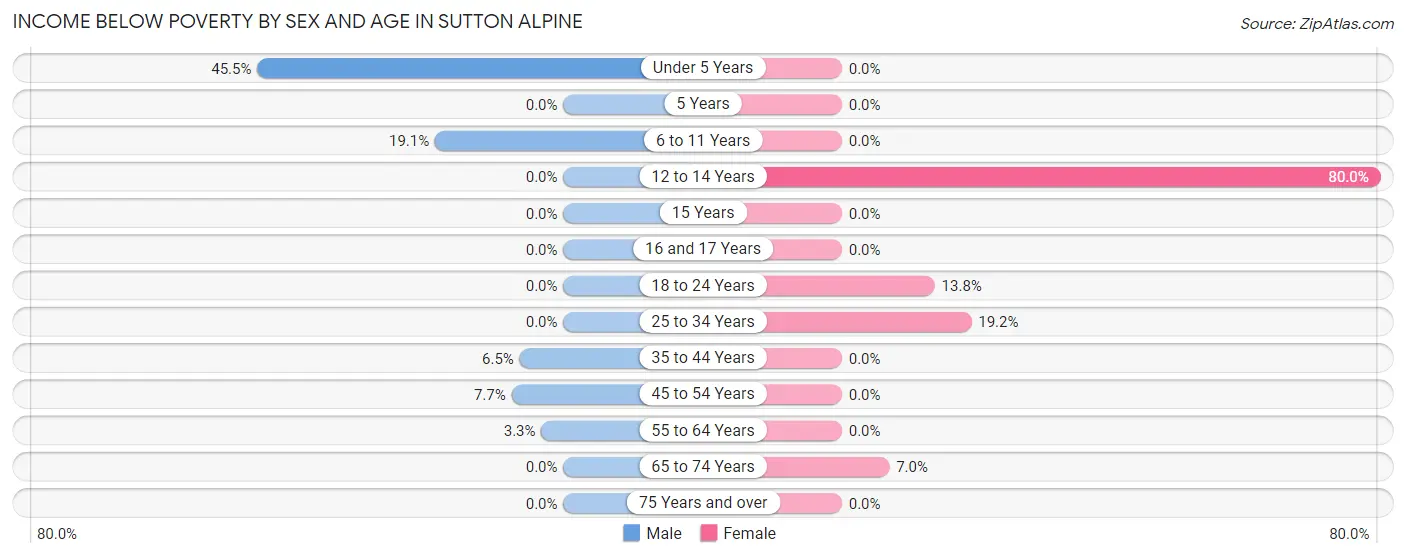
| Age Bracket | Male | Female |
| Under 5 Years | 5 (45.5%) | 0 (0.0%) |
| 5 Years | 0 (0.0%) | 0 (0.0%) |
| 6 to 11 Years | 8 (19.1%) | 0 (0.0%) |
| 12 to 14 Years | 0 (0.0%) | 12 (80.0%) |
| 15 Years | 0 (0.0%) | 0 (0.0%) |
| 16 and 17 Years | 0 (0.0%) | 0 (0.0%) |
| 18 to 24 Years | 0 (0.0%) | 4 (13.8%) |
| 25 to 34 Years | 0 (0.0%) | 10 (19.2%) |
| 35 to 44 Years | 5 (6.5%) | 0 (0.0%) |
| 45 to 54 Years | 3 (7.7%) | 0 (0.0%) |
| 55 to 64 Years | 3 (3.3%) | 0 (0.0%) |
| 65 to 74 Years | 0 (0.0%) | 5 (7.0%) |
| 75 Years and over | 0 (0.0%) | 0 (0.0%) |
| Total | 24 (5.3%) | 31 (7.3%) |
Income Above Poverty by Sex and Age in Sutton Alpine
According to the poverty statistics in Sutton Alpine, males aged 12 to 14 years and females aged under 5 years are the age groups that are most secure financially, with 100.0% of males and 100.0% of females in these age groups living above the poverty line.
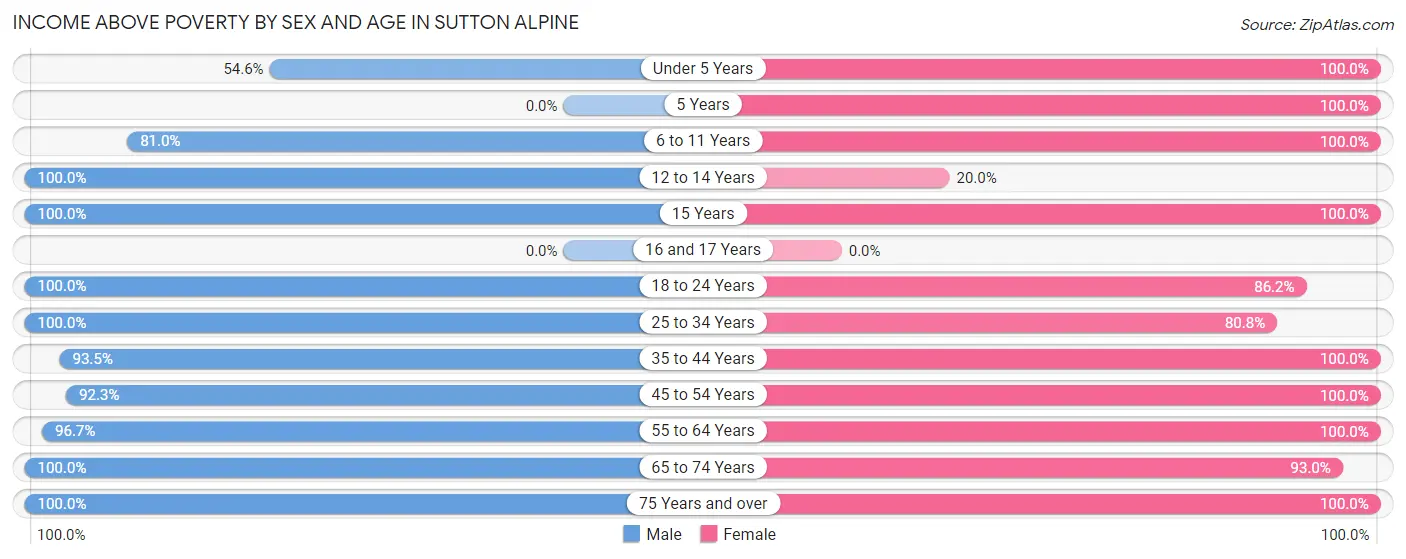
| Age Bracket | Male | Female |
| Under 5 Years | 6 (54.5%) | 20 (100.0%) |
| 5 Years | 0 (0.0%) | 7 (100.0%) |
| 6 to 11 Years | 34 (80.9%) | 33 (100.0%) |
| 12 to 14 Years | 17 (100.0%) | 3 (20.0%) |
| 15 Years | 18 (100.0%) | 5 (100.0%) |
| 16 and 17 Years | 0 (0.0%) | 0 (0.0%) |
| 18 to 24 Years | 30 (100.0%) | 25 (86.2%) |
| 25 to 34 Years | 43 (100.0%) | 42 (80.8%) |
| 35 to 44 Years | 72 (93.5%) | 33 (100.0%) |
| 45 to 54 Years | 36 (92.3%) | 50 (100.0%) |
| 55 to 64 Years | 89 (96.7%) | 83 (100.0%) |
| 65 to 74 Years | 63 (100.0%) | 66 (93.0%) |
| 75 Years and over | 21 (100.0%) | 24 (100.0%) |
| Total | 429 (94.7%) | 391 (92.6%) |
Income Below Poverty Among Married-Couple Families in Sutton Alpine
The poverty statistics for married-couple families in Sutton Alpine show that 3.1% or 5 of the total 162 families live below the poverty line. Families with 5 or more children have the highest poverty rate of 100.0%, comprising of 5 families. On the other hand, families with no children have the lowest poverty rate of 0.0%, which includes 0 families.
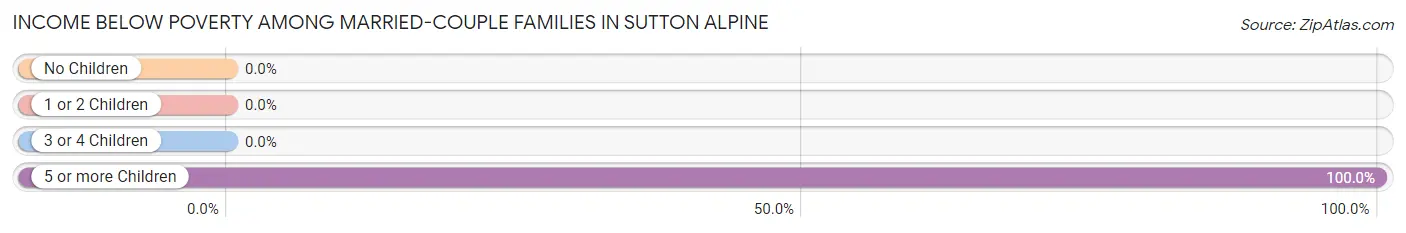
| Children | Above Poverty | Below Poverty |
| No Children | 126 (100.0%) | 0 (0.0%) |
| 1 or 2 Children | 17 (100.0%) | 0 (0.0%) |
| 3 or 4 Children | 14 (100.0%) | 0 (0.0%) |
| 5 or more Children | 0 (0.0%) | 5 (100.0%) |
| Total | 157 (96.9%) | 5 (3.1%) |
Income Below Poverty Among Single-Parent Households in Sutton Alpine
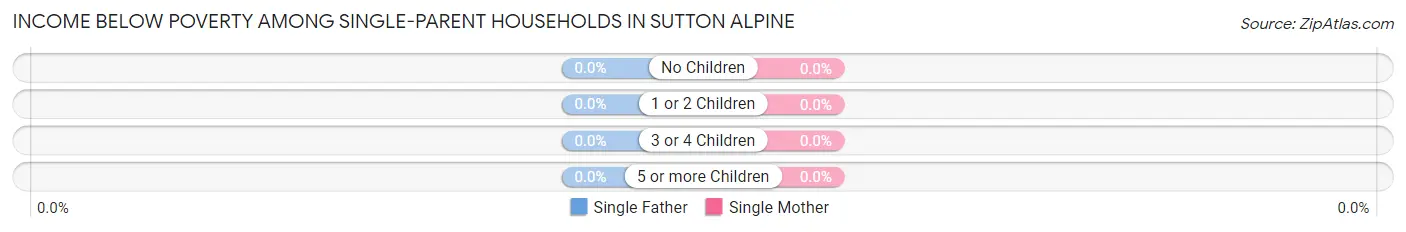
| Children | Single Father | Single Mother |
| No Children | 0 (0.0%) | 0 (0.0%) |
| 1 or 2 Children | 0 (0.0%) | 0 (0.0%) |
| 3 or 4 Children | 0 (0.0%) | 0 (0.0%) |
| 5 or more Children | 0 (0.0%) | 0 (0.0%) |
| Total | 0 (0.0%) | 0 (0.0%) |
Income Below Poverty Among Married-Couple vs Single-Parent Households in Sutton Alpine
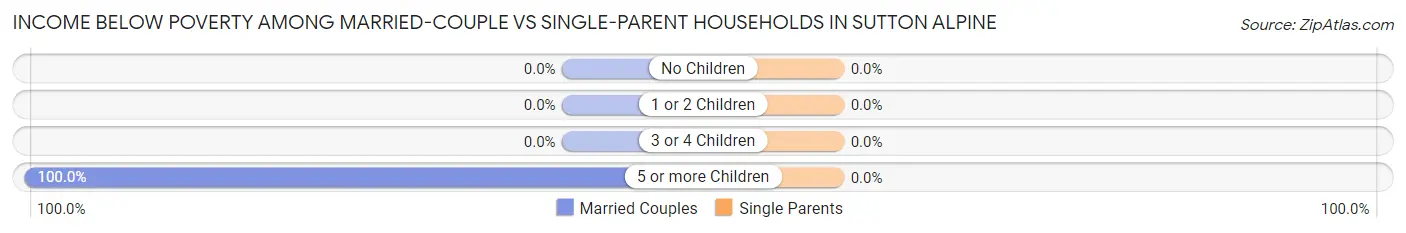
| Children | Married-Couple Families | Single-Parent Households |
| No Children | 0 (0.0%) | 0 (0.0%) |
| 1 or 2 Children | 0 (0.0%) | 0 (0.0%) |
| 3 or 4 Children | 0 (0.0%) | 0 (0.0%) |
| 5 or more Children | 5 (100.0%) | 0 (0.0%) |
| Total | 5 (3.1%) | 0 (0.0%) |
Race in Sutton Alpine
The most populous races in Sutton Alpine are White / Caucasian (860 | 65.0%), Native / Alaskan (289 | 21.8%), and Two or more Races (92 | 7.0%).
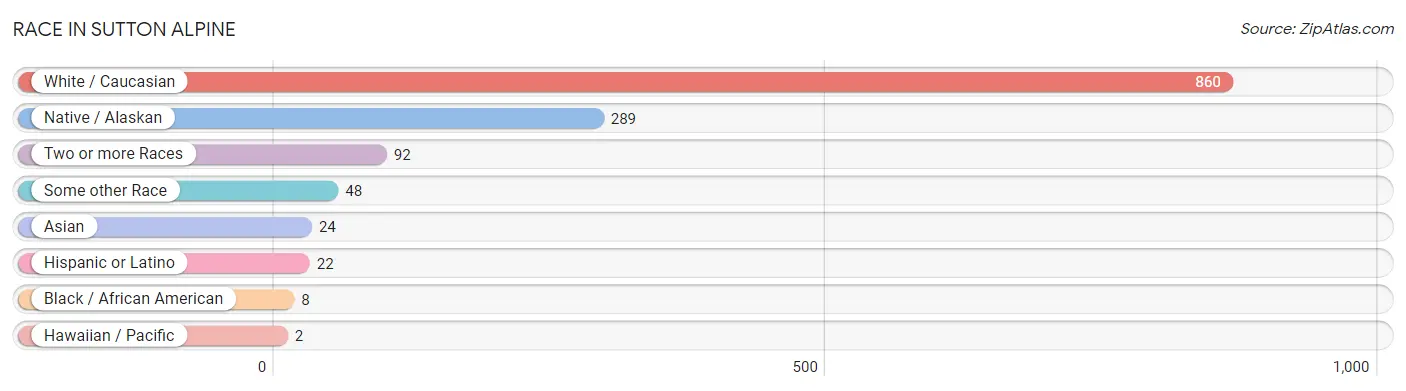
| Race | # Population | % Population |
| Asian | 24 | 1.8% |
| Black / African American | 8 | 0.6% |
| Hawaiian / Pacific | 2 | 0.2% |
| Hispanic or Latino | 22 | 1.7% |
| Native / Alaskan | 289 | 21.8% |
| White / Caucasian | 860 | 65.0% |
| Two or more Races | 92 | 7.0% |
| Some other Race | 48 | 3.6% |
| Total | 1,323 | 100.0% |
Ancestry in Sutton Alpine
The most populous ancestries reported in Sutton Alpine are Irish (200 | 15.1%), German (196 | 14.8%), Yup'ik (142 | 10.7%), Norwegian (90 | 6.8%), and Inupiat (62 | 4.7%), together accounting for 52.2% of all Sutton Alpine residents.
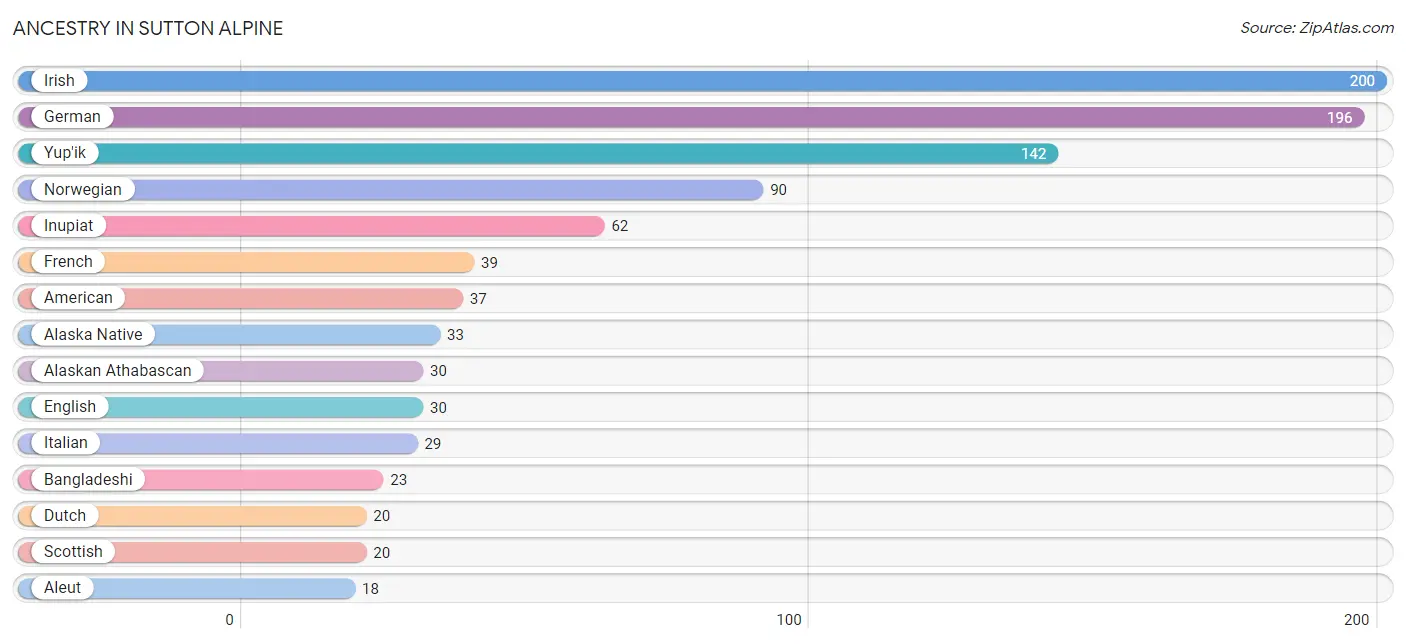
| Ancestry | # Population | % Population |
| Alaska Native | 33 | 2.5% |
| Alaskan Athabascan | 30 | 2.3% |
| Aleut | 18 | 1.4% |
| American | 37 | 2.8% |
| Arab | 6 | 0.4% |
| Bangladeshi | 23 | 1.7% |
| Basque | 3 | 0.2% |
| Belgian | 8 | 0.6% |
| Blackfeet | 6 | 0.4% |
| British | 11 | 0.8% |
| Cherokee | 4 | 0.3% |
| Chippewa | 3 | 0.2% |
| Crow | 15 | 1.1% |
| Cuban | 4 | 0.3% |
| Czechoslovakian | 4 | 0.3% |
| Danish | 4 | 0.3% |
| Dutch | 20 | 1.5% |
| Egyptian | 6 | 0.4% |
| English | 30 | 2.3% |
| European | 6 | 0.4% |
| Finnish | 3 | 0.2% |
| French | 39 | 2.9% |
| German | 196 | 14.8% |
| Greek | 11 | 0.8% |
| Inupiat | 62 | 4.7% |
| Irish | 200 | 15.1% |
| Italian | 29 | 2.2% |
| Latvian | 3 | 0.2% |
| Mexican | 18 | 1.4% |
| Northern European | 12 | 0.9% |
| Norwegian | 90 | 6.8% |
| Paiute | 5 | 0.4% |
| Polish | 7 | 0.5% |
| Russian | 9 | 0.7% |
| Samoan | 2 | 0.2% |
| Scotch-Irish | 14 | 1.1% |
| Scottish | 20 | 1.5% |
| Sri Lankan | 1 | 0.1% |
| Swedish | 16 | 1.2% |
| Tlingit-Haida | 9 | 0.7% |
| Tsimshian | 4 | 0.3% |
| Ukrainian | 5 | 0.4% |
| Welsh | 4 | 0.3% |
| Yup'ik | 142 | 10.7% | View All 44 Rows |
Immigrants in Sutton Alpine
The most numerous immigrant groups reported in Sutton Alpine came from Asia (22 | 1.7%), South Eastern Asia (22 | 1.7%), Philippines (15 | 1.1%), Laos (6 | 0.4%), and Central America (4 | 0.3%), together accounting for 5.2% of all Sutton Alpine residents.
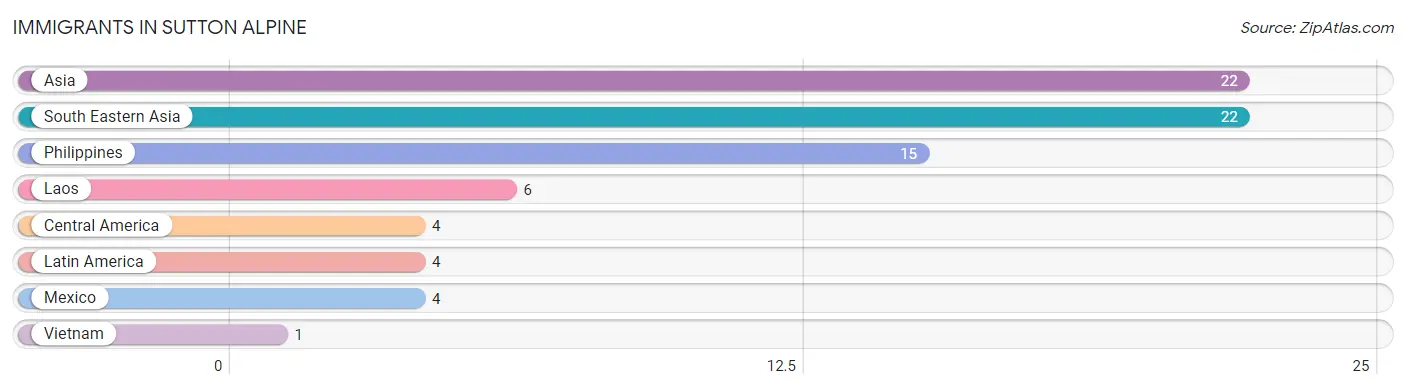
| Immigration Origin | # Population | % Population |
| Asia | 22 | 1.7% |
| Central America | 4 | 0.3% |
| Laos | 6 | 0.4% |
| Latin America | 4 | 0.3% |
| Mexico | 4 | 0.3% |
| Philippines | 15 | 1.1% |
| South Eastern Asia | 22 | 1.7% |
| Vietnam | 1 | 0.1% | View All 8 Rows |
Sex and Age in Sutton Alpine
Sex and Age in Sutton Alpine
The most populous age groups in Sutton Alpine are 20 to 24 Years (113 | 12.7%) for men and 60 to 64 Years (45 | 10.4%) for women.
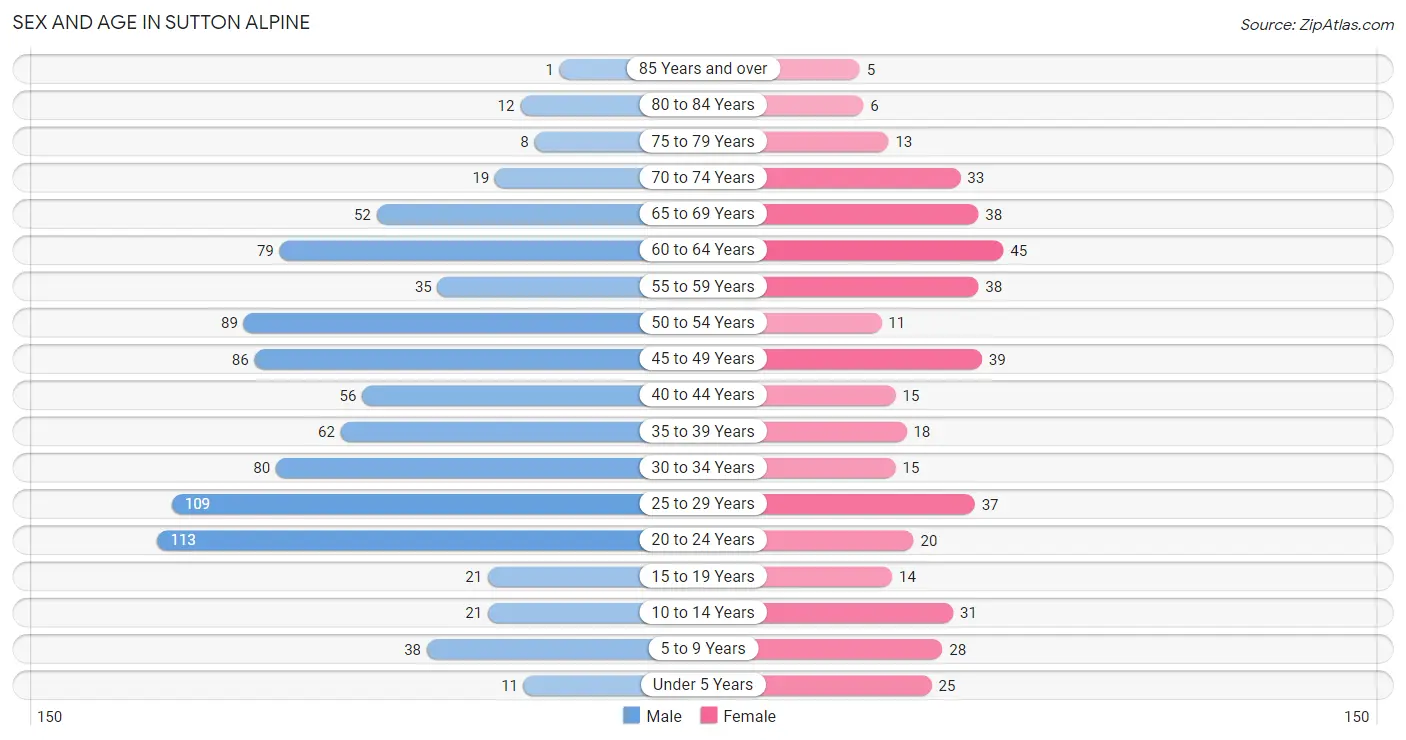
| Age Bracket | Male | Female |
| Under 5 Years | 11 (1.2%) | 25 (5.8%) |
| 5 to 9 Years | 38 (4.3%) | 28 (6.5%) |
| 10 to 14 Years | 21 (2.4%) | 31 (7.2%) |
| 15 to 19 Years | 21 (2.4%) | 14 (3.3%) |
| 20 to 24 Years | 113 (12.7%) | 20 (4.6%) |
| 25 to 29 Years | 109 (12.2%) | 37 (8.6%) |
| 30 to 34 Years | 80 (9.0%) | 15 (3.5%) |
| 35 to 39 Years | 62 (7.0%) | 18 (4.2%) |
| 40 to 44 Years | 56 (6.3%) | 15 (3.5%) |
| 45 to 49 Years | 86 (9.6%) | 39 (9.0%) |
| 50 to 54 Years | 89 (10.0%) | 11 (2.5%) |
| 55 to 59 Years | 35 (3.9%) | 38 (8.8%) |
| 60 to 64 Years | 79 (8.9%) | 45 (10.4%) |
| 65 to 69 Years | 52 (5.8%) | 38 (8.8%) |
| 70 to 74 Years | 19 (2.1%) | 33 (7.7%) |
| 75 to 79 Years | 8 (0.9%) | 13 (3.0%) |
| 80 to 84 Years | 12 (1.3%) | 6 (1.4%) |
| 85 Years and over | 1 (0.1%) | 5 (1.2%) |
| Total | 892 (100.0%) | 431 (100.0%) |
Families and Households in Sutton Alpine
Median Family Size in Sutton Alpine
The median family size in Sutton Alpine is 3.10 persons per family, with single female/mother families (24 | 10.9%) accounting for the largest median family size of 4.33 persons per family. On the other hand, married-couple families (162 | 73.3%) represent the smallest median family size with 2.78 persons per family.
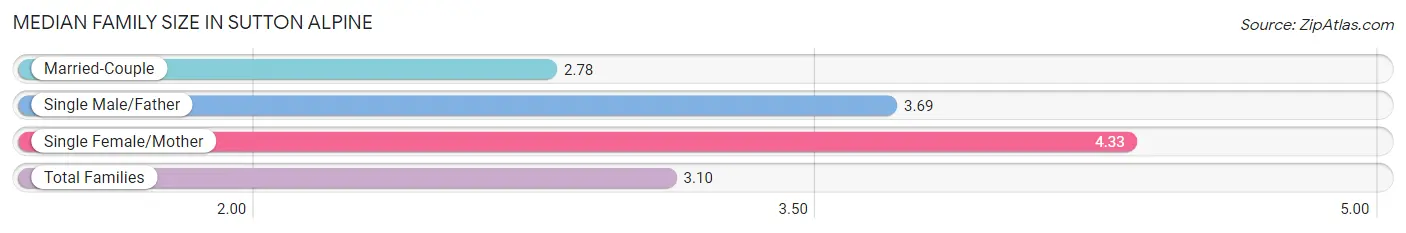
| Family Type | # Families | Family Size |
| Married-Couple | 162 (73.3%) | 2.78 |
| Single Male/Father | 35 (15.8%) | 3.69 |
| Single Female/Mother | 24 (10.9%) | 4.33 |
| Total Families | 221 (100.0%) | 3.10 |
Median Household Size in Sutton Alpine
The median household size in Sutton Alpine is 2.40 persons per household, with single female/mother households (24 | 6.5%) accounting for the largest median household size of 4.33 persons per household. non-family households (147 | 40.0%) represent the smallest median household size with 1.24 persons per household.
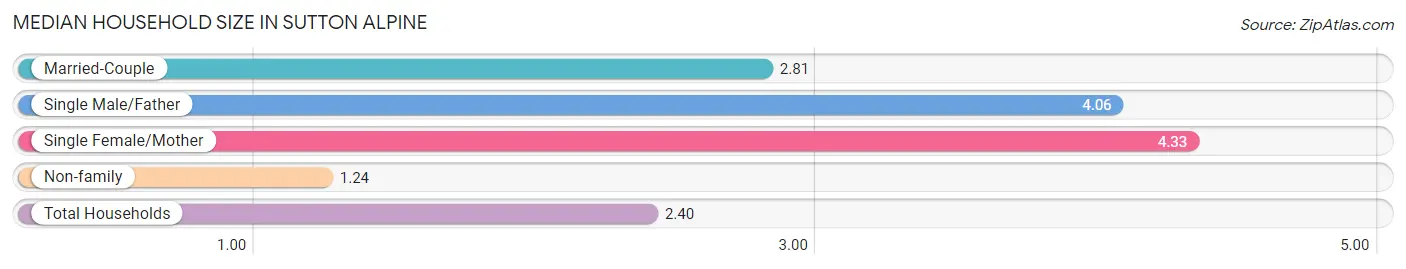
| Household Type | # Households | Household Size |
| Married-Couple | 162 (44.0%) | 2.81 |
| Single Male/Father | 35 (9.5%) | 4.06 |
| Single Female/Mother | 24 (6.5%) | 4.33 |
| Non-family | 147 (40.0%) | 1.24 |
| Total Households | 368 (100.0%) | 2.40 |
Household Size by Marriage Status in Sutton Alpine
Out of a total of 368 households in Sutton Alpine, 221 (60.1%) are family households, while 147 (40.0%) are nonfamily households. The most numerous type of family households are 2-person households, comprising 118, and the most common type of nonfamily households are 1-person households, comprising 106.
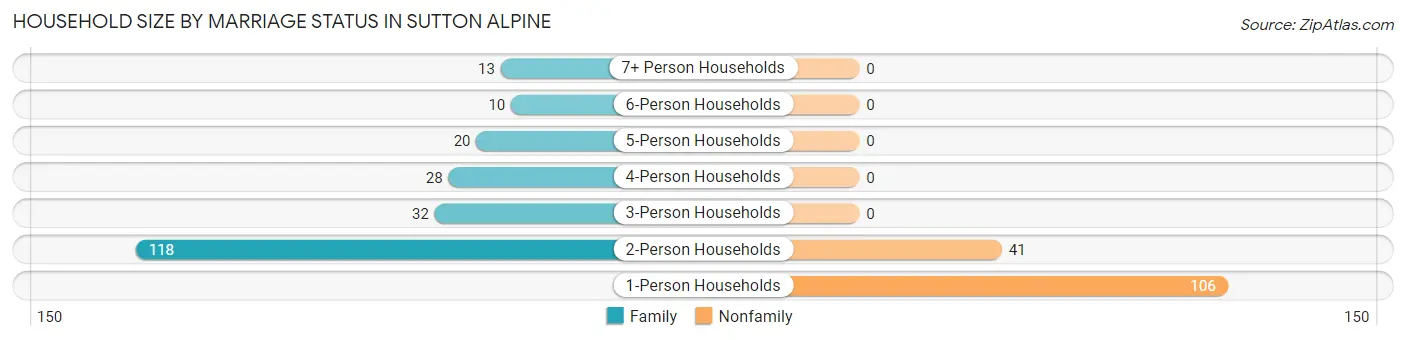
| Household Size | Family Households | Nonfamily Households |
| 1-Person Households | - | 106 (28.8%) |
| 2-Person Households | 118 (32.1%) | 41 (11.1%) |
| 3-Person Households | 32 (8.7%) | 0 (0.0%) |
| 4-Person Households | 28 (7.6%) | 0 (0.0%) |
| 5-Person Households | 20 (5.4%) | 0 (0.0%) |
| 6-Person Households | 10 (2.7%) | 0 (0.0%) |
| 7+ Person Households | 13 (3.5%) | 0 (0.0%) |
| Total | 221 (60.1%) | 147 (40.0%) |
Female Fertility in Sutton Alpine
Fertility by Age in Sutton Alpine
Average fertility rate in Sutton Alpine is 49.0 births per 1,000 women. Women in the age bracket of 20 to 34 years have the highest fertility rate with 111.0 births per 1,000 women. Women in the age bracket of 20 to 34 years acount for 100.0% of all women with births.
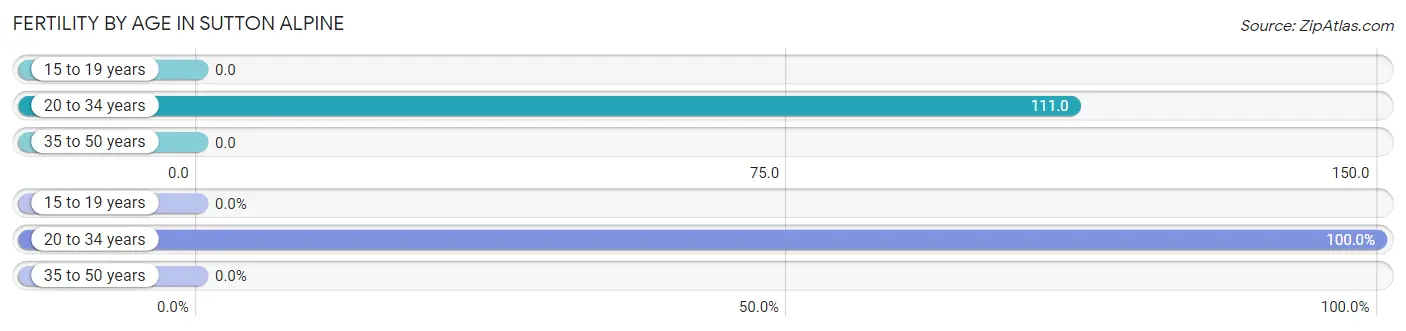
| Age Bracket | Women with Births | Births / 1,000 Women |
| 15 to 19 years | 0 (0.0%) | 0.0 |
| 20 to 34 years | 8 (100.0%) | 111.0 |
| 35 to 50 years | 0 (0.0%) | 0.0 |
| Total | 8 (100.0%) | 49.0 |
Fertility by Age by Marriage Status in Sutton Alpine
62.5% of women with births (8) in Sutton Alpine are married. The highest percentage of unmarried women with births falls into 20 to 34 years age bracket with 37.5% of them unmarried at the time of birth, while the lowest percentage of unmarried women with births belong to 20 to 34 years age bracket with 37.5% of them unmarried.

| Age Bracket | Married | Unmarried |
| 15 to 19 years | 0 (0.0%) | 0 (0.0%) |
| 20 to 34 years | 5 (62.5%) | 3 (37.5%) |
| 35 to 50 years | 0 (0.0%) | 0 (0.0%) |
| Total | 5 (62.5%) | 3 (37.5%) |
Fertility by Education in Sutton Alpine
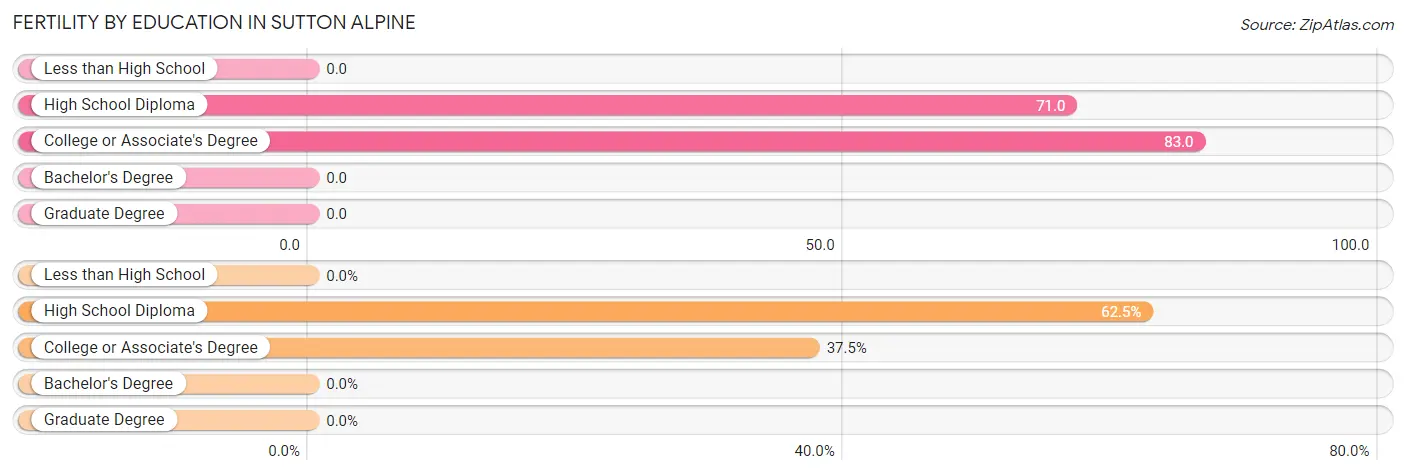
| Educational Attainment | Women with Births | Births / 1,000 Women |
| Less than High School | 0 (0.0%) | 0.0 |
| High School Diploma | 5 (62.5%) | 71.0 |
| College or Associate's Degree | 3 (37.5%) | 83.0 |
| Bachelor's Degree | 0 (0.0%) | 0.0 |
| Graduate Degree | 0 (0.0%) | 0.0 |
| Total | 8 (100.0%) | 49.0 |
Fertility by Education by Marriage Status in Sutton Alpine
37.5% of women with births in Sutton Alpine are unmarried. Women with the educational attainment of high school diploma are most likely to be married with 100.0% of them married at childbirth, while women with the educational attainment of college or associate's degree are least likely to be married with 100.0% of them unmarried at childbirth.
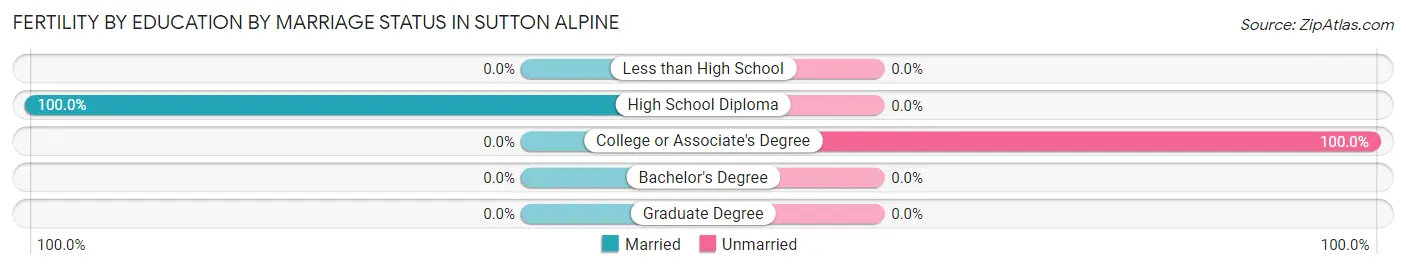
| Educational Attainment | Married | Unmarried |
| Less than High School | 0 (0.0%) | 0 (0.0%) |
| High School Diploma | 5 (100.0%) | 0 (0.0%) |
| College or Associate's Degree | 0 (0.0%) | 3 (100.0%) |
| Bachelor's Degree | 0 (0.0%) | 0 (0.0%) |
| Graduate Degree | 0 (0.0%) | 0 (0.0%) |
| Total | 5 (62.5%) | 3 (37.5%) |
Employment Characteristics in Sutton Alpine
Employment by Class of Employer in Sutton Alpine
Among the 353 employed individuals in Sutton Alpine, private company employees (166 | 47.0%), local government employees (41 | 11.6%), and self-employed (not incorporated) (37 | 10.5%) make up the most common classes of employment.
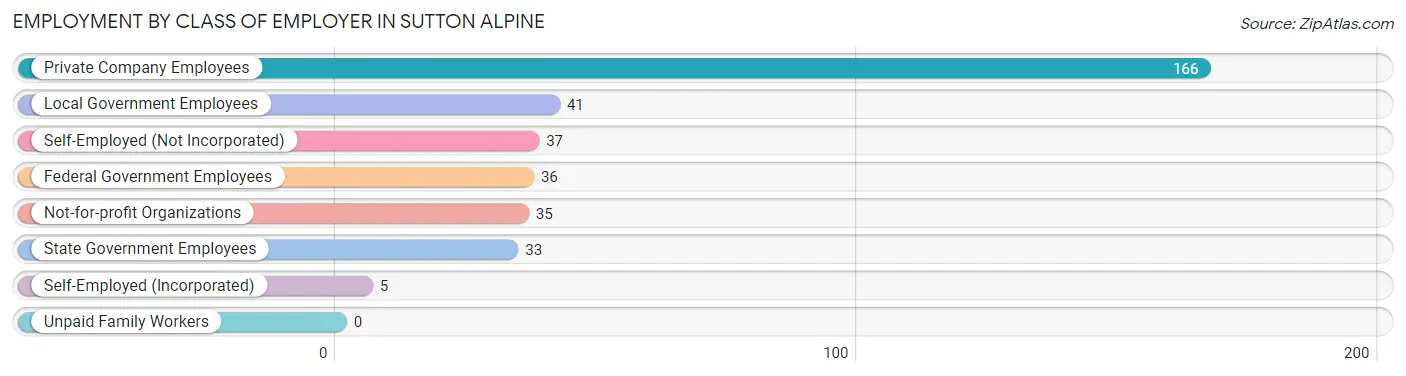
| Employer Class | # Employees | % Employees |
| Private Company Employees | 166 | 47.0% |
| Self-Employed (Incorporated) | 5 | 1.4% |
| Self-Employed (Not Incorporated) | 37 | 10.5% |
| Not-for-profit Organizations | 35 | 9.9% |
| Local Government Employees | 41 | 11.6% |
| State Government Employees | 33 | 9.3% |
| Federal Government Employees | 36 | 10.2% |
| Unpaid Family Workers | 0 | 0.0% |
| Total | 353 | 100.0% |
Employment Status by Age in Sutton Alpine
According to the labor force statistics for Sutton Alpine, out of the total population over 16 years of age (1,146), 36.3% or 416 individuals are in the labor force, with 13.2% or 55 of them unemployed. The age group with the highest labor force participation rate is 35 to 44 years, with 64.9% or 98 individuals in the labor force. Within the labor force, the 30 to 34 years age range has the highest percentage of unemployed individuals, with 36.0% or 9 of them being unemployed.
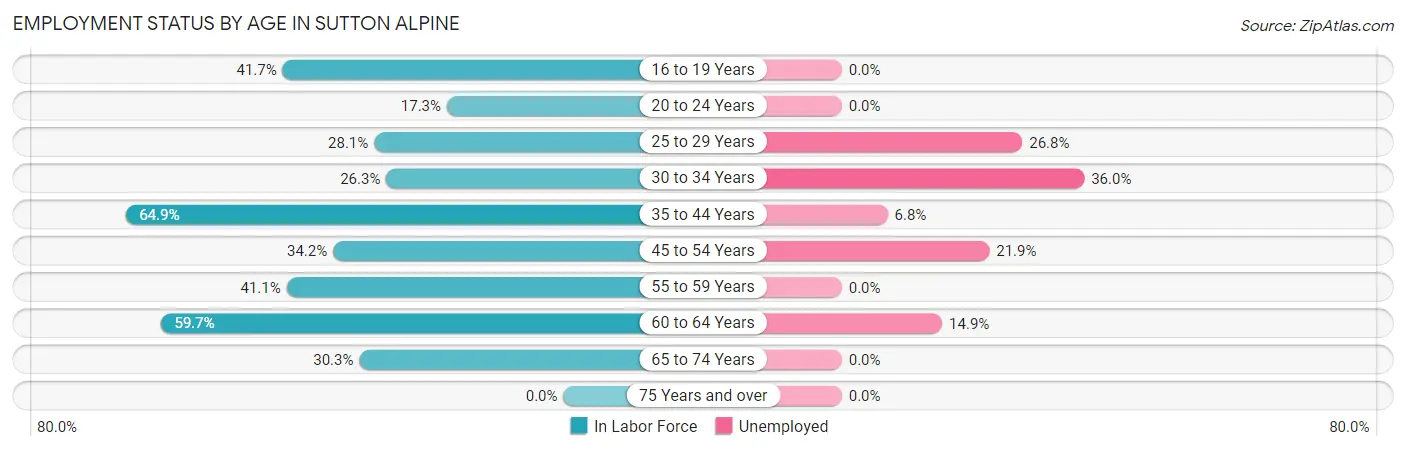
| Age Bracket | In Labor Force | Unemployed |
| 16 to 19 Years | 5 (41.7%) | 0 (0.0%) |
| 20 to 24 Years | 23 (17.3%) | 0 (0.0%) |
| 25 to 29 Years | 41 (28.1%) | 11 (26.8%) |
| 30 to 34 Years | 25 (26.3%) | 9 (36.0%) |
| 35 to 44 Years | 98 (64.9%) | 7 (6.8%) |
| 45 to 54 Years | 77 (34.2%) | 17 (21.9%) |
| 55 to 59 Years | 30 (41.1%) | 0 (0.0%) |
| 60 to 64 Years | 74 (59.7%) | 11 (14.9%) |
| 65 to 74 Years | 43 (30.3%) | 0 (0.0%) |
| 75 Years and over | 0 (0.0%) | 0 (0.0%) |
| Total | 416 (36.3%) | 55 (13.2%) |
Employment Status by Educational Attainment in Sutton Alpine
According to labor force statistics for Sutton Alpine, 42.4% of individuals (345) out of the total population between 25 and 64 years of age (814) are in the labor force, with 16.0% or 55 of them being unemployed. The group with the highest labor force participation rate are those with the educational attainment of bachelor's degree or higher, with 77.4% or 72 individuals in the labor force. Within the labor force, individuals with less than high school education have the highest percentage of unemployment, with 36.8% or 7 of them being unemployed.
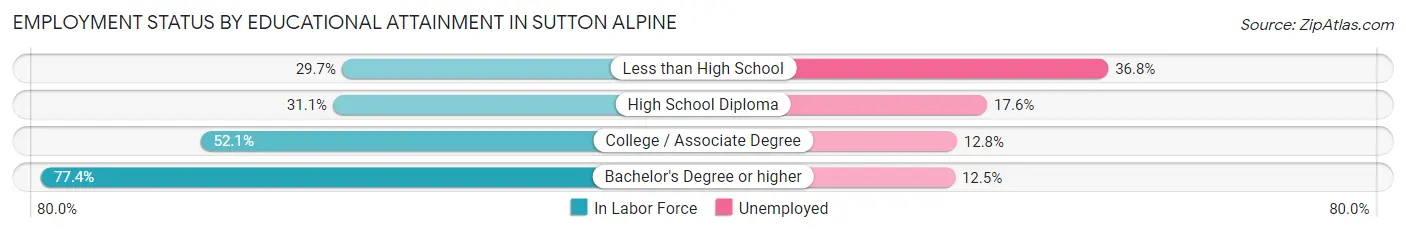
| Educational Attainment | In Labor Force | Unemployed |
| Less than High School | 19 (29.7%) | 24 (36.8%) |
| High School Diploma | 131 (31.1%) | 74 (17.6%) |
| College / Associate Degree | 123 (52.1%) | 30 (12.8%) |
| Bachelor's Degree or higher | 72 (77.4%) | 12 (12.5%) |
| Total | 345 (42.4%) | 130 (16.0%) |
Employment Occupations by Sex in Sutton Alpine
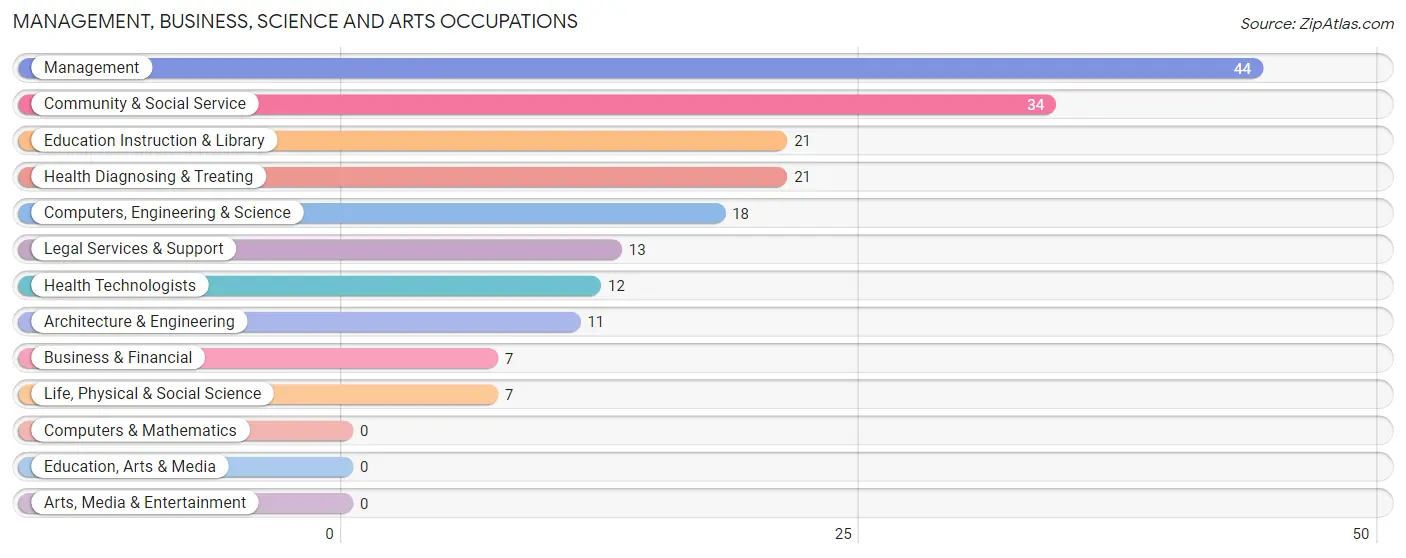
Management, Business, Science and Arts Occupations
The most common Management, Business, Science and Arts occupations in Sutton Alpine are Management (44 | 12.6%), Community & Social Service (34 | 9.7%), Education Instruction & Library (21 | 6.0%), Health Diagnosing & Treating (21 | 6.0%), and Computers, Engineering & Science (18 | 5.2%).
Management, Business, Science and Arts Occupations by Sex
Within the Management, Business, Science and Arts occupations in Sutton Alpine, the most male-oriented occupations are Architecture & Engineering (100.0%), Management (70.5%), and Computers, Engineering & Science (61.1%), while the most female-oriented occupations are Business & Financial (100.0%), Life, Physical & Social Science (100.0%), and Legal Services & Support (100.0%).
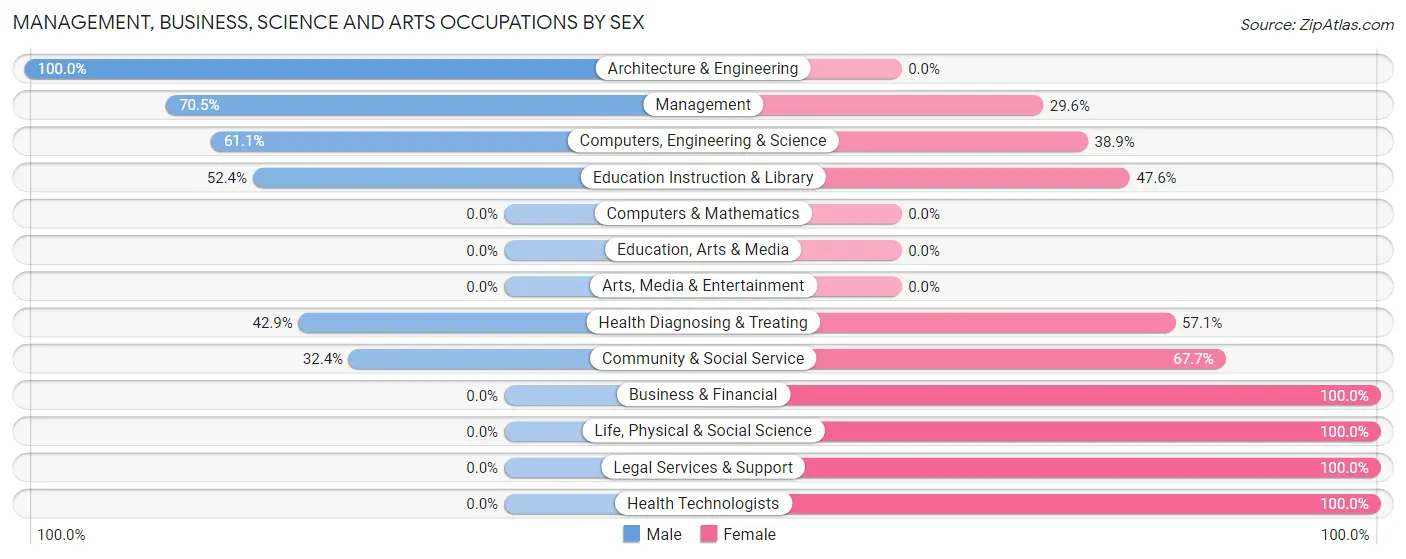
| Occupation | Male | Female |
| Management | 31 (70.5%) | 13 (29.5%) |
| Business & Financial | 0 (0.0%) | 7 (100.0%) |
| Computers, Engineering & Science | 11 (61.1%) | 7 (38.9%) |
| Computers & Mathematics | 0 (0.0%) | 0 (0.0%) |
| Architecture & Engineering | 11 (100.0%) | 0 (0.0%) |
| Life, Physical & Social Science | 0 (0.0%) | 7 (100.0%) |
| Community & Social Service | 11 (32.4%) | 23 (67.6%) |
| Education, Arts & Media | 0 (0.0%) | 0 (0.0%) |
| Legal Services & Support | 0 (0.0%) | 13 (100.0%) |
| Education Instruction & Library | 11 (52.4%) | 10 (47.6%) |
| Arts, Media & Entertainment | 0 (0.0%) | 0 (0.0%) |
| Health Diagnosing & Treating | 9 (42.9%) | 12 (57.1%) |
| Health Technologists | 0 (0.0%) | 12 (100.0%) |
| Total (Category) | 62 (50.0%) | 62 (50.0%) |
| Total (Overall) | 190 (54.4%) | 159 (45.6%) |
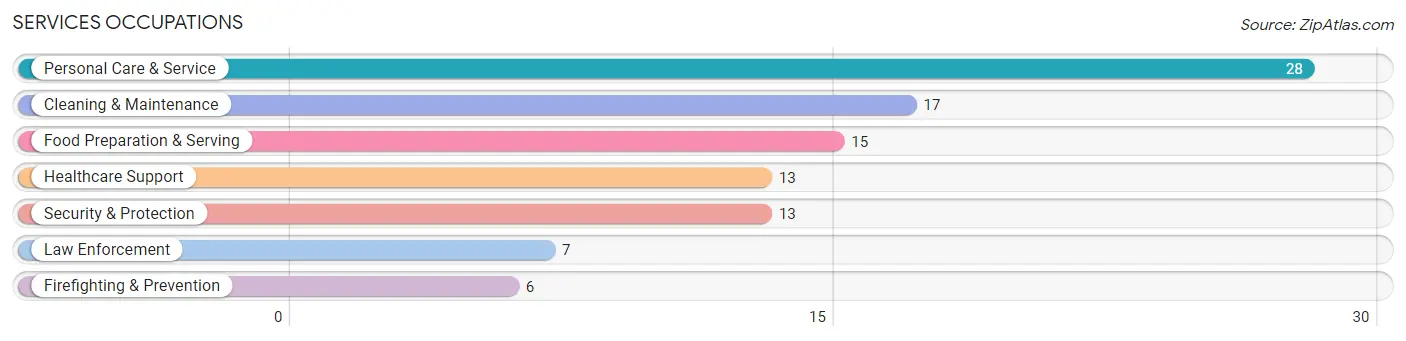
Services Occupations
The most common Services occupations in Sutton Alpine are Personal Care & Service (28 | 8.0%), Cleaning & Maintenance (17 | 4.9%), Food Preparation & Serving (15 | 4.3%), Healthcare Support (13 | 3.7%), and Security & Protection (13 | 3.7%).
Services Occupations by Sex
Within the Services occupations in Sutton Alpine, the most male-oriented occupations are Law Enforcement (100.0%), Food Preparation & Serving (66.7%), and Security & Protection (53.8%), while the most female-oriented occupations are Firefighting & Prevention (100.0%), Personal Care & Service (100.0%), and Healthcare Support (76.9%).
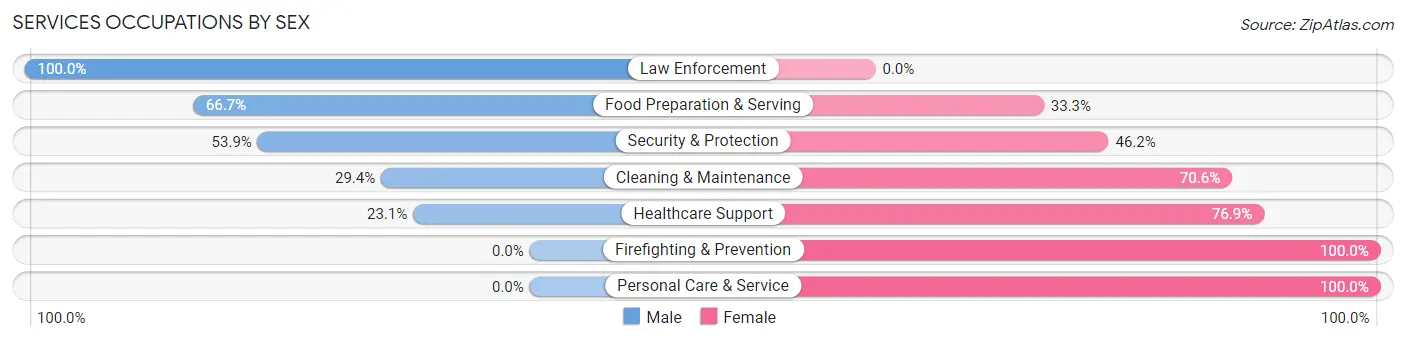
| Occupation | Male | Female |
| Healthcare Support | 3 (23.1%) | 10 (76.9%) |
| Security & Protection | 7 (53.8%) | 6 (46.2%) |
| Firefighting & Prevention | 0 (0.0%) | 6 (100.0%) |
| Law Enforcement | 7 (100.0%) | 0 (0.0%) |
| Food Preparation & Serving | 10 (66.7%) | 5 (33.3%) |
| Cleaning & Maintenance | 5 (29.4%) | 12 (70.6%) |
| Personal Care & Service | 0 (0.0%) | 28 (100.0%) |
| Total (Category) | 25 (29.1%) | 61 (70.9%) |
| Total (Overall) | 190 (54.4%) | 159 (45.6%) |
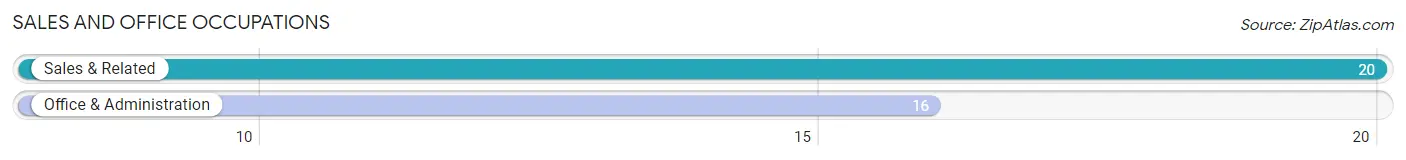
Sales and Office Occupations
The most common Sales and Office occupations in Sutton Alpine are Sales & Related (20 | 5.7%), and Office & Administration (16 | 4.6%).
Sales and Office Occupations by Sex
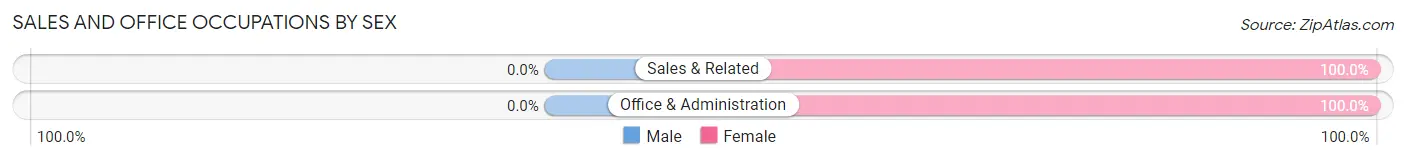
| Occupation | Male | Female |
| Sales & Related | 0 (0.0%) | 20 (100.0%) |
| Office & Administration | 0 (0.0%) | 16 (100.0%) |
| Total (Category) | 0 (0.0%) | 36 (100.0%) |
| Total (Overall) | 190 (54.4%) | 159 (45.6%) |
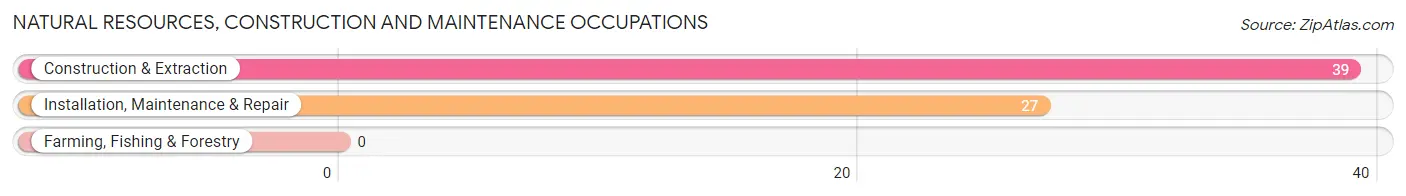
Natural Resources, Construction and Maintenance Occupations
The most common Natural Resources, Construction and Maintenance occupations in Sutton Alpine are Construction & Extraction (39 | 11.2%), and Installation, Maintenance & Repair (27 | 7.7%).
Natural Resources, Construction and Maintenance Occupations by Sex
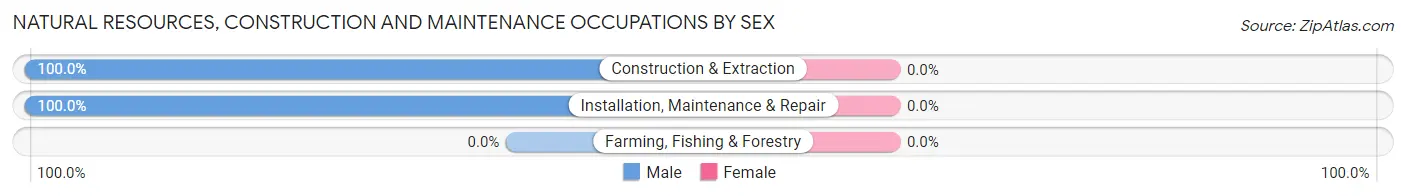
| Occupation | Male | Female |
| Farming, Fishing & Forestry | 0 (0.0%) | 0 (0.0%) |
| Construction & Extraction | 39 (100.0%) | 0 (0.0%) |
| Installation, Maintenance & Repair | 27 (100.0%) | 0 (0.0%) |
| Total (Category) | 66 (100.0%) | 0 (0.0%) |
| Total (Overall) | 190 (54.4%) | 159 (45.6%) |
Production, Transportation and Moving Occupations
The most common Production, Transportation and Moving occupations in Sutton Alpine are , and Transportation (37 | 10.6%).
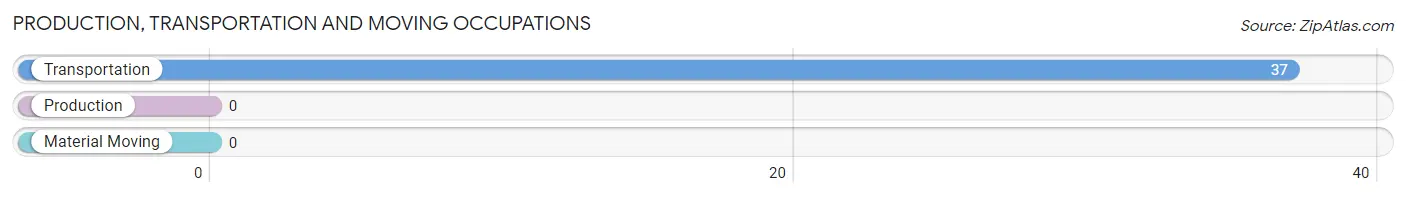
Production, Transportation and Moving Occupations by Sex
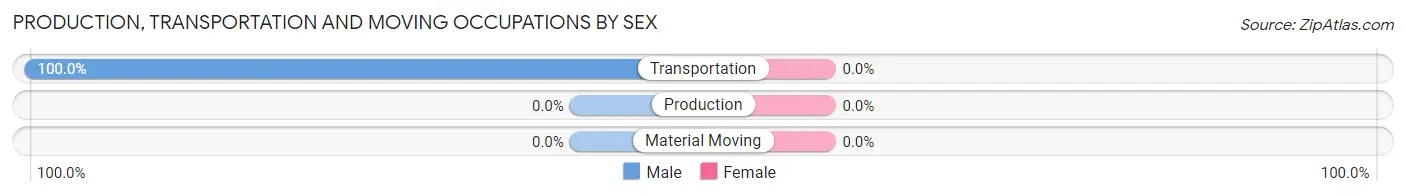
| Occupation | Male | Female |
| Production | 0 (0.0%) | 0 (0.0%) |
| Transportation | 37 (100.0%) | 0 (0.0%) |
| Material Moving | 0 (0.0%) | 0 (0.0%) |
| Total (Category) | 37 (100.0%) | 0 (0.0%) |
| Total (Overall) | 190 (54.4%) | 159 (45.6%) |
Employment Industries by Sex in Sutton Alpine
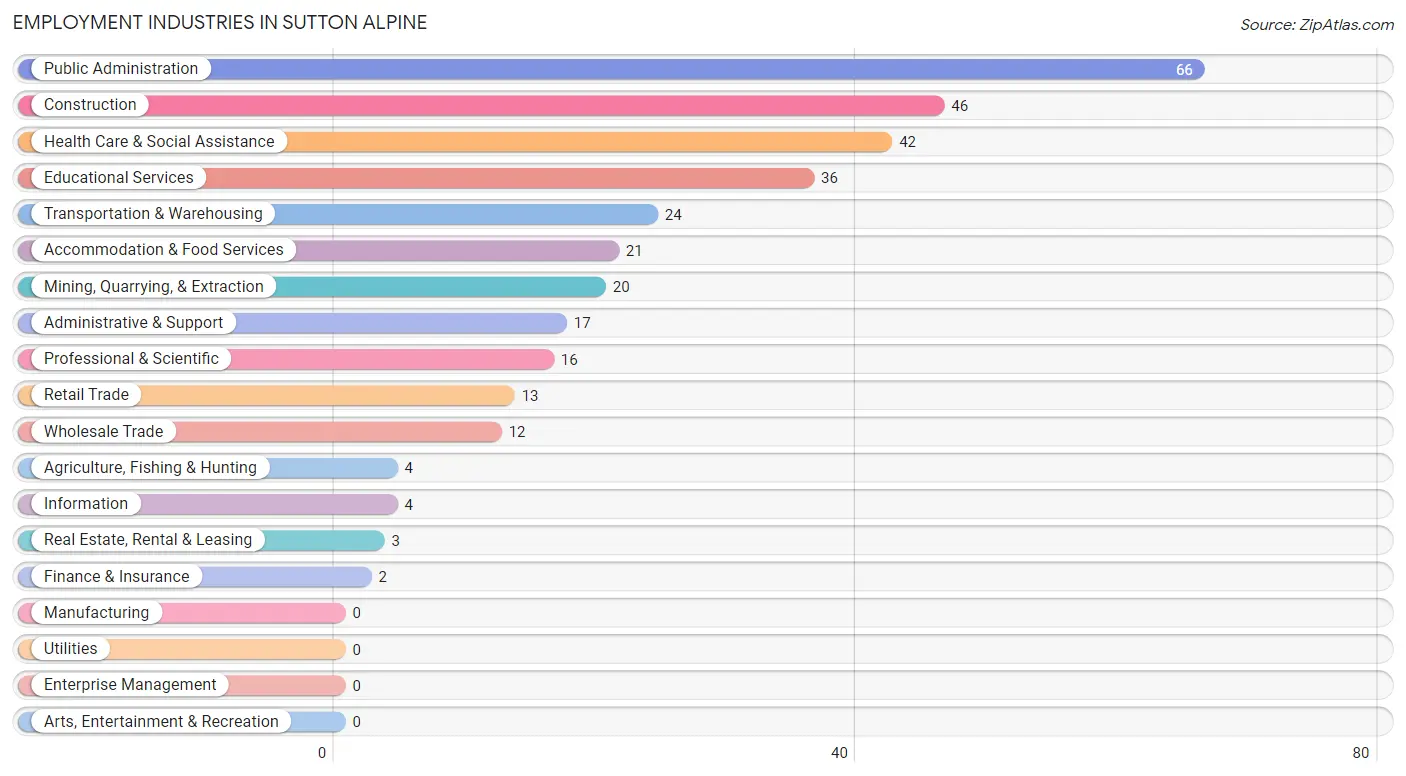
Employment Industries in Sutton Alpine
The major employment industries in Sutton Alpine include Public Administration (66 | 18.9%), Construction (46 | 13.2%), Health Care & Social Assistance (42 | 12.0%), Educational Services (36 | 10.3%), and Transportation & Warehousing (24 | 6.9%).
Employment Industries by Sex in Sutton Alpine
The Sutton Alpine industries that see more men than women are Agriculture, Fishing & Hunting (100.0%), Wholesale Trade (100.0%), and Information (100.0%), whereas the industries that tend to have a higher number of women are Finance & Insurance (100.0%), Educational Services (69.4%), and Professional & Scientific (68.8%).
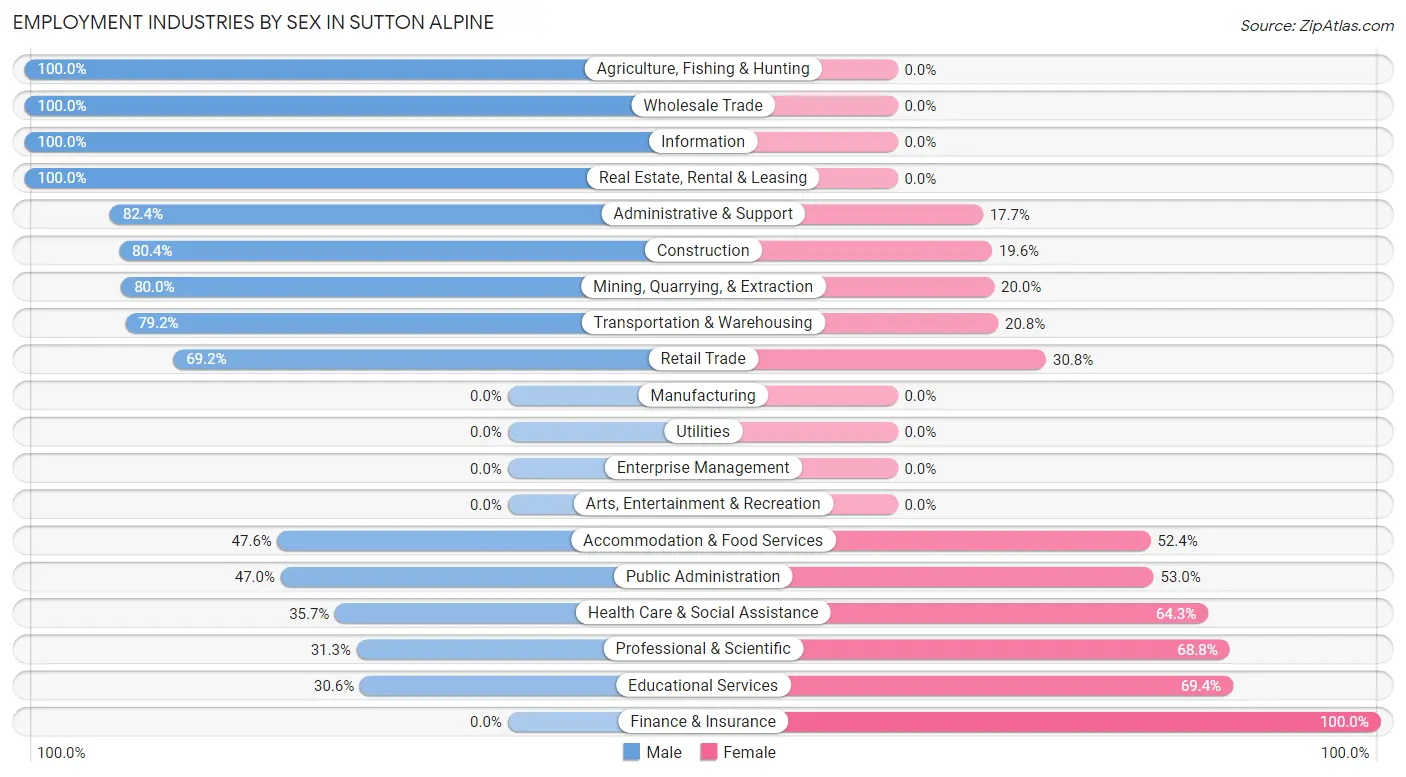
| Industry | Male | Female |
| Agriculture, Fishing & Hunting | 4 (100.0%) | 0 (0.0%) |
| Mining, Quarrying, & Extraction | 16 (80.0%) | 4 (20.0%) |
| Construction | 37 (80.4%) | 9 (19.6%) |
| Manufacturing | 0 (0.0%) | 0 (0.0%) |
| Wholesale Trade | 12 (100.0%) | 0 (0.0%) |
| Retail Trade | 9 (69.2%) | 4 (30.8%) |
| Transportation & Warehousing | 19 (79.2%) | 5 (20.8%) |
| Utilities | 0 (0.0%) | 0 (0.0%) |
| Information | 4 (100.0%) | 0 (0.0%) |
| Finance & Insurance | 0 (0.0%) | 2 (100.0%) |
| Real Estate, Rental & Leasing | 3 (100.0%) | 0 (0.0%) |
| Professional & Scientific | 5 (31.2%) | 11 (68.8%) |
| Enterprise Management | 0 (0.0%) | 0 (0.0%) |
| Administrative & Support | 14 (82.4%) | 3 (17.6%) |
| Educational Services | 11 (30.6%) | 25 (69.4%) |
| Health Care & Social Assistance | 15 (35.7%) | 27 (64.3%) |
| Arts, Entertainment & Recreation | 0 (0.0%) | 0 (0.0%) |
| Accommodation & Food Services | 10 (47.6%) | 11 (52.4%) |
| Public Administration | 31 (47.0%) | 35 (53.0%) |
| Total | 190 (54.4%) | 159 (45.6%) |
Education in Sutton Alpine
School Enrollment in Sutton Alpine
The most common levels of schooling among the 186 students in Sutton Alpine are elementary school (55 | 29.6%), middle school (44 | 23.7%), and college / undergraduate (38 | 20.4%).
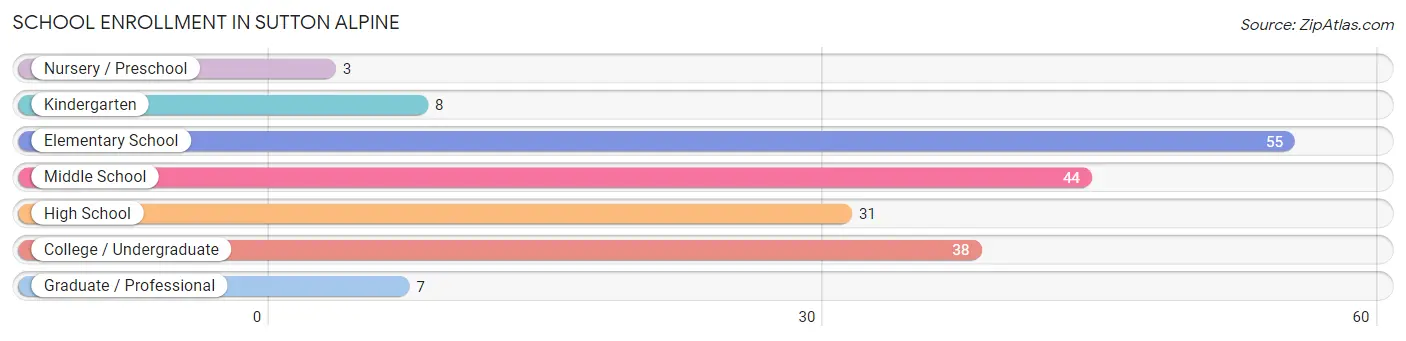
| School Level | # Students | % Students |
| Nursery / Preschool | 3 | 1.6% |
| Kindergarten | 8 | 4.3% |
| Elementary School | 55 | 29.6% |
| Middle School | 44 | 23.7% |
| High School | 31 | 16.7% |
| College / Undergraduate | 38 | 20.4% |
| Graduate / Professional | 7 | 3.8% |
| Total | 186 | 100.0% |
School Enrollment by Age by Funding Source in Sutton Alpine
Out of a total of 186 students who are enrolled in schools in Sutton Alpine, 17 (9.1%) attend a private institution, while the remaining 169 (90.9%) are enrolled in public schools. The age group of 15 to 17 year olds has the highest likelihood of being enrolled in private schools, with 4 (17.4% in the age bracket) enrolled. Conversely, the age group of 18 to 19 year olds has the lowest likelihood of being enrolled in a private school, with 3 (100.0% in the age bracket) attending a public institution.
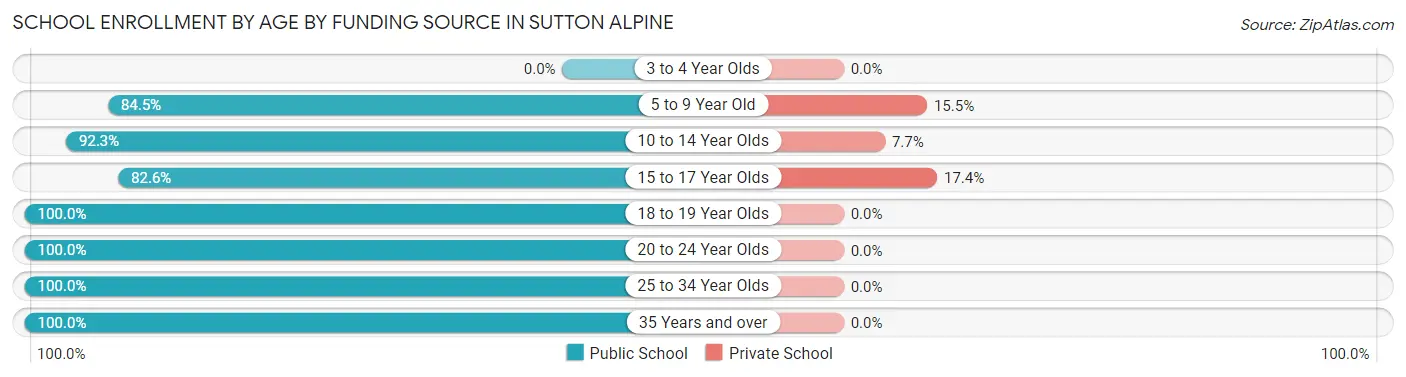
| Age Bracket | Public School | Private School |
| 3 to 4 Year Olds | 0 (0.0%) | 0 (0.0%) |
| 5 to 9 Year Old | 49 (84.5%) | 9 (15.5%) |
| 10 to 14 Year Olds | 48 (92.3%) | 4 (7.7%) |
| 15 to 17 Year Olds | 19 (82.6%) | 4 (17.4%) |
| 18 to 19 Year Olds | 3 (100.0%) | 0 (0.0%) |
| 20 to 24 Year Olds | 14 (100.0%) | 0 (0.0%) |
| 25 to 34 Year Olds | 12 (100.0%) | 0 (0.0%) |
| 35 Years and over | 24 (100.0%) | 0 (0.0%) |
| Total | 169 (90.9%) | 17 (9.1%) |
Educational Attainment by Field of Study in Sutton Alpine
Social sciences (20 | 16.8%), psychology (16 | 13.5%), computers & mathematics (14 | 11.8%), business (14 | 11.8%), and education (14 | 11.8%) are the most common fields of study among 119 individuals in Sutton Alpine who have obtained a bachelor's degree or higher.
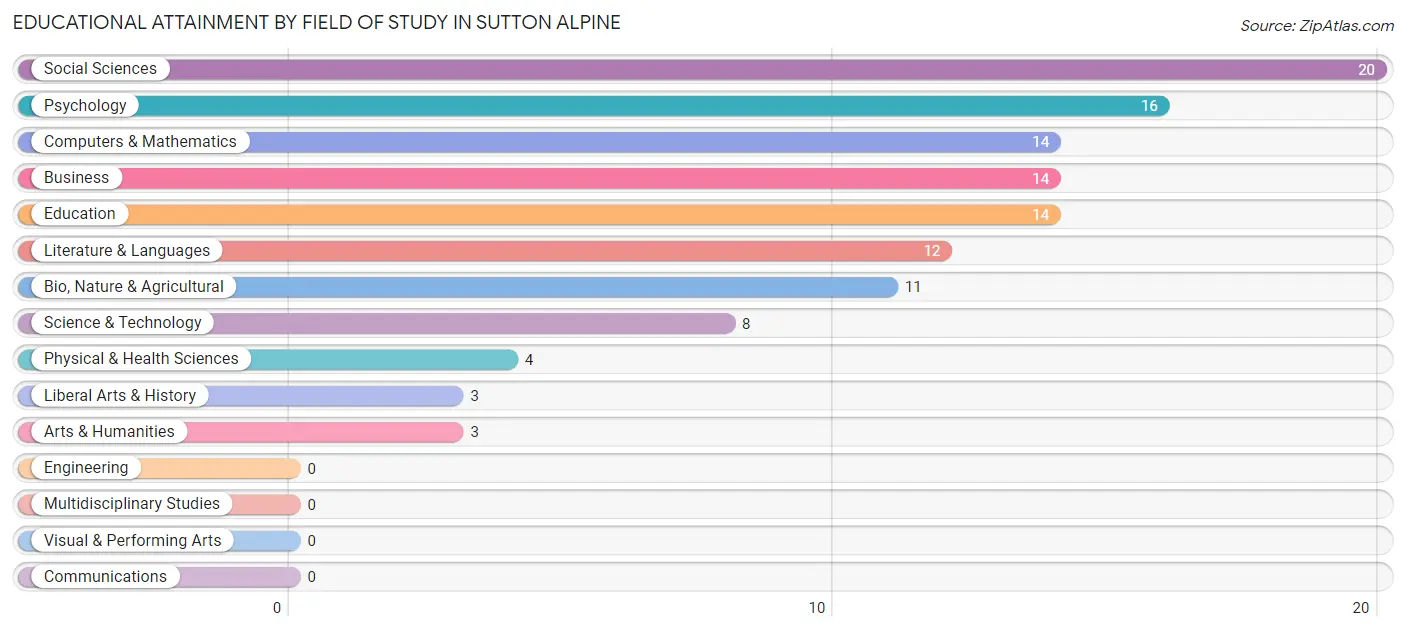
| Field of Study | # Graduates | % Graduates |
| Computers & Mathematics | 14 | 11.8% |
| Bio, Nature & Agricultural | 11 | 9.2% |
| Physical & Health Sciences | 4 | 3.4% |
| Psychology | 16 | 13.5% |
| Social Sciences | 20 | 16.8% |
| Engineering | 0 | 0.0% |
| Multidisciplinary Studies | 0 | 0.0% |
| Science & Technology | 8 | 6.7% |
| Business | 14 | 11.8% |
| Education | 14 | 11.8% |
| Literature & Languages | 12 | 10.1% |
| Liberal Arts & History | 3 | 2.5% |
| Visual & Performing Arts | 0 | 0.0% |
| Communications | 0 | 0.0% |
| Arts & Humanities | 3 | 2.5% |
| Total | 119 | 100.0% |
Transportation & Commute in Sutton Alpine
Vehicle Availability by Sex in Sutton Alpine
The most prevalent vehicle ownership categories in Sutton Alpine are males with 3 vehicles (84, accounting for 43.1%) and females with 3 vehicles (64, making up 53.2%).
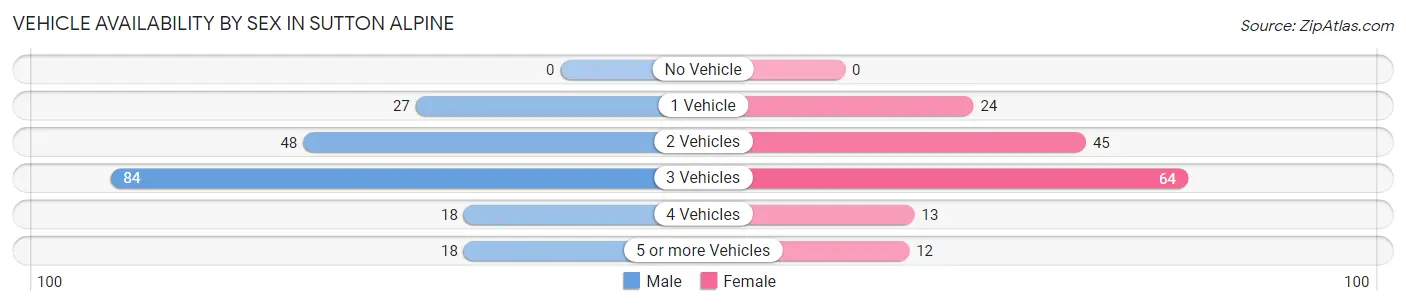
| Vehicles Available | Male | Female |
| No Vehicle | 0 (0.0%) | 0 (0.0%) |
| 1 Vehicle | 27 (13.9%) | 24 (15.2%) |
| 2 Vehicles | 48 (24.6%) | 45 (28.5%) |
| 3 Vehicles | 84 (43.1%) | 64 (40.5%) |
| 4 Vehicles | 18 (9.2%) | 13 (8.2%) |
| 5 or more Vehicles | 18 (9.2%) | 12 (7.6%) |
| Total | 195 (100.0%) | 158 (100.0%) |
Commute Time in Sutton Alpine
The most frequently occuring commute durations in Sutton Alpine are 60 to 89 minutes (83 commuters, 26.2%), 20 to 24 minutes (56 commuters, 17.7%), and 45 to 59 minutes (36 commuters, 11.4%).
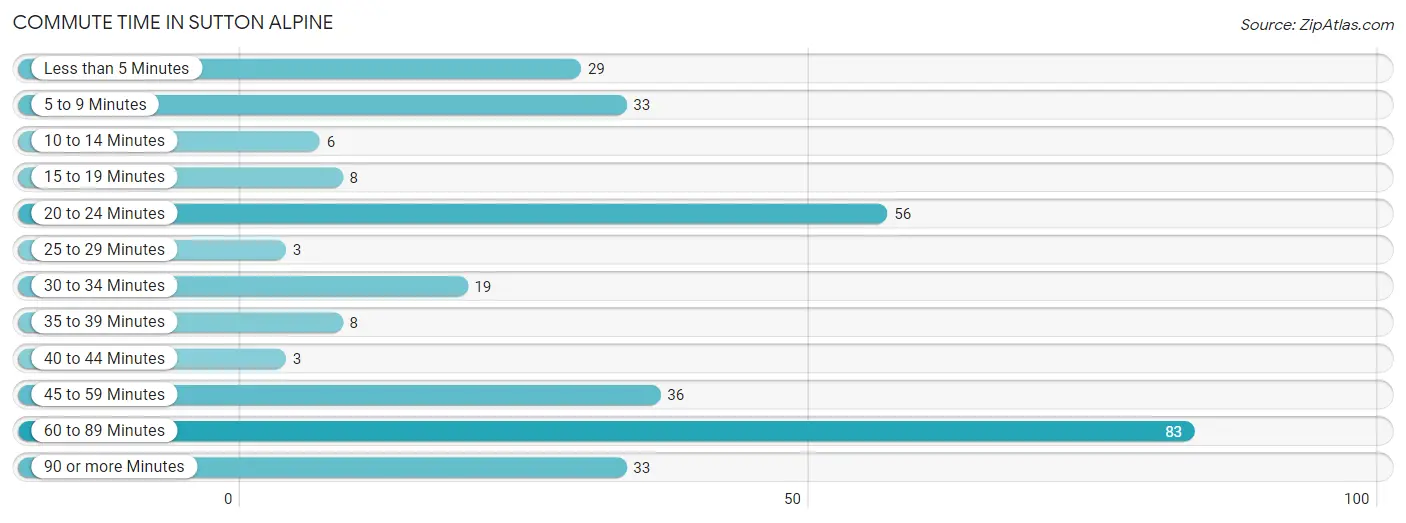
| Commute Time | # Commuters | % Commuters |
| Less than 5 Minutes | 29 | 9.1% |
| 5 to 9 Minutes | 33 | 10.4% |
| 10 to 14 Minutes | 6 | 1.9% |
| 15 to 19 Minutes | 8 | 2.5% |
| 20 to 24 Minutes | 56 | 17.7% |
| 25 to 29 Minutes | 3 | 0.9% |
| 30 to 34 Minutes | 19 | 6.0% |
| 35 to 39 Minutes | 8 | 2.5% |
| 40 to 44 Minutes | 3 | 0.9% |
| 45 to 59 Minutes | 36 | 11.4% |
| 60 to 89 Minutes | 83 | 26.2% |
| 90 or more Minutes | 33 | 10.4% |
Commute Time by Sex in Sutton Alpine
The most common commute times in Sutton Alpine are 60 to 89 minutes (65 commuters, 36.7%) for males and 20 to 24 minutes (39 commuters, 27.9%) for females.
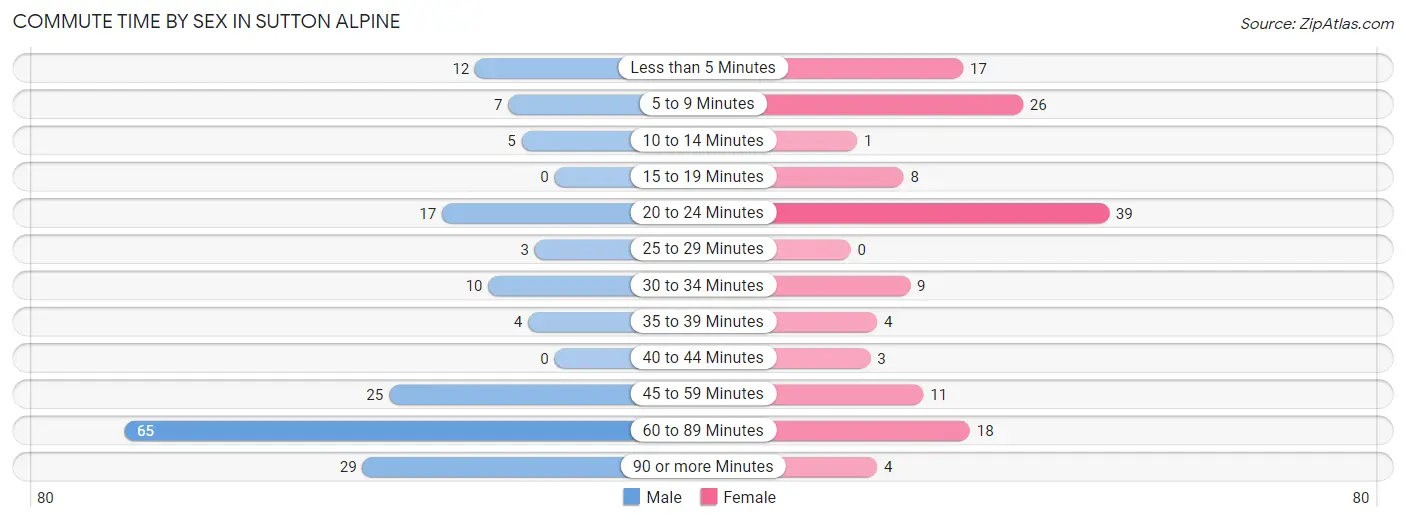
| Commute Time | Male | Female |
| Less than 5 Minutes | 12 (6.8%) | 17 (12.1%) |
| 5 to 9 Minutes | 7 (4.0%) | 26 (18.6%) |
| 10 to 14 Minutes | 5 (2.8%) | 1 (0.7%) |
| 15 to 19 Minutes | 0 (0.0%) | 8 (5.7%) |
| 20 to 24 Minutes | 17 (9.6%) | 39 (27.9%) |
| 25 to 29 Minutes | 3 (1.7%) | 0 (0.0%) |
| 30 to 34 Minutes | 10 (5.7%) | 9 (6.4%) |
| 35 to 39 Minutes | 4 (2.3%) | 4 (2.9%) |
| 40 to 44 Minutes | 0 (0.0%) | 3 (2.1%) |
| 45 to 59 Minutes | 25 (14.1%) | 11 (7.9%) |
| 60 to 89 Minutes | 65 (36.7%) | 18 (12.9%) |
| 90 or more Minutes | 29 (16.4%) | 4 (2.9%) |
Time of Departure to Work by Sex in Sutton Alpine
The most frequent times of departure to work in Sutton Alpine are 8:00 AM to 8:29 AM (27, 15.2%) for males and 7:00 AM to 7:29 AM (50, 35.7%) for females.
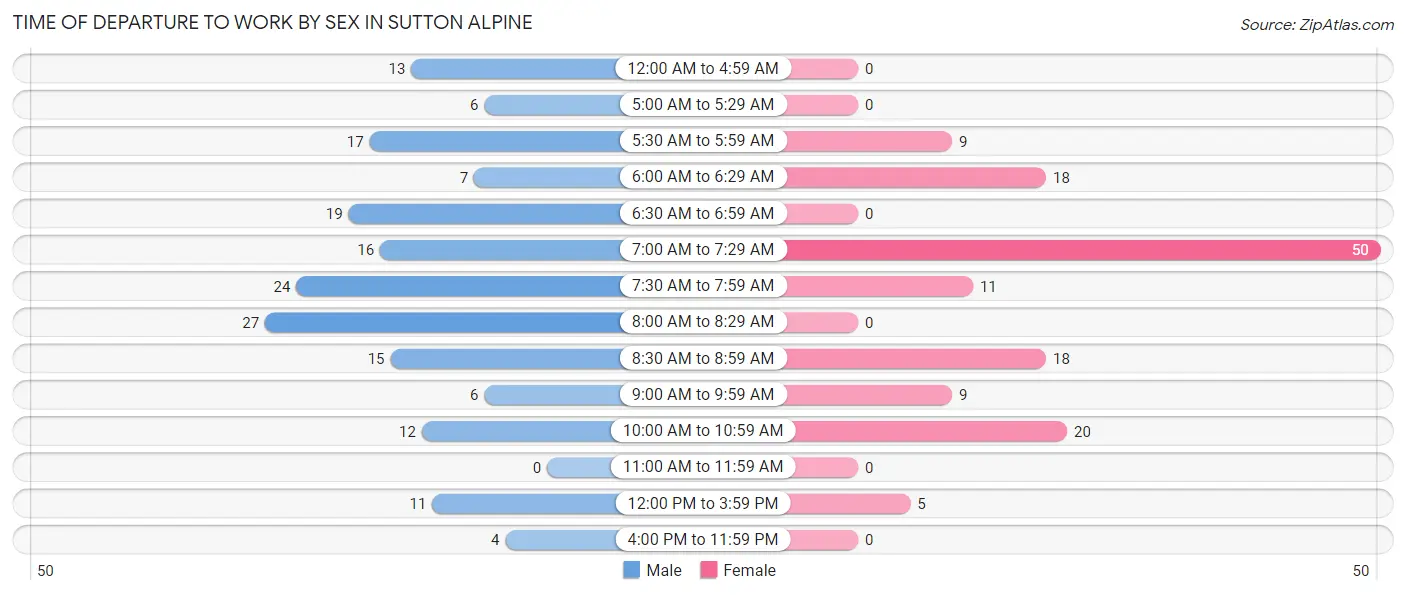
| Time of Departure | Male | Female |
| 12:00 AM to 4:59 AM | 13 (7.3%) | 0 (0.0%) |
| 5:00 AM to 5:29 AM | 6 (3.4%) | 0 (0.0%) |
| 5:30 AM to 5:59 AM | 17 (9.6%) | 9 (6.4%) |
| 6:00 AM to 6:29 AM | 7 (4.0%) | 18 (12.9%) |
| 6:30 AM to 6:59 AM | 19 (10.7%) | 0 (0.0%) |
| 7:00 AM to 7:29 AM | 16 (9.0%) | 50 (35.7%) |
| 7:30 AM to 7:59 AM | 24 (13.6%) | 11 (7.9%) |
| 8:00 AM to 8:29 AM | 27 (15.2%) | 0 (0.0%) |
| 8:30 AM to 8:59 AM | 15 (8.5%) | 18 (12.9%) |
| 9:00 AM to 9:59 AM | 6 (3.4%) | 9 (6.4%) |
| 10:00 AM to 10:59 AM | 12 (6.8%) | 20 (14.3%) |
| 11:00 AM to 11:59 AM | 0 (0.0%) | 0 (0.0%) |
| 12:00 PM to 3:59 PM | 11 (6.2%) | 5 (3.6%) |
| 4:00 PM to 11:59 PM | 4 (2.3%) | 0 (0.0%) |
| Total | 177 (100.0%) | 140 (100.0%) |
Housing Occupancy in Sutton Alpine
Occupancy by Ownership in Sutton Alpine
Of the total 368 dwellings in Sutton Alpine, owner-occupied units account for 304 (82.6%), while renter-occupied units make up 64 (17.4%).
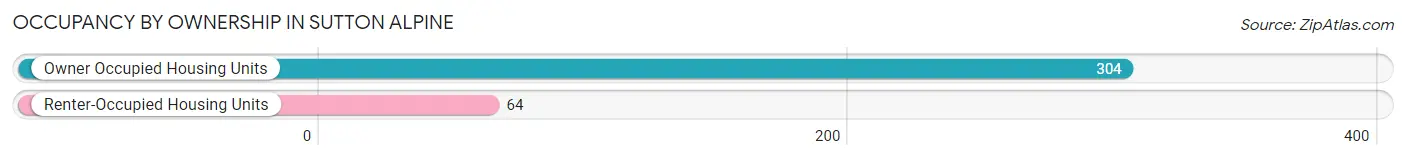
| Occupancy | # Housing Units | % Housing Units |
| Owner Occupied Housing Units | 304 | 82.6% |
| Renter-Occupied Housing Units | 64 | 17.4% |
| Total Occupied Housing Units | 368 | 100.0% |
Occupancy by Household Size in Sutton Alpine
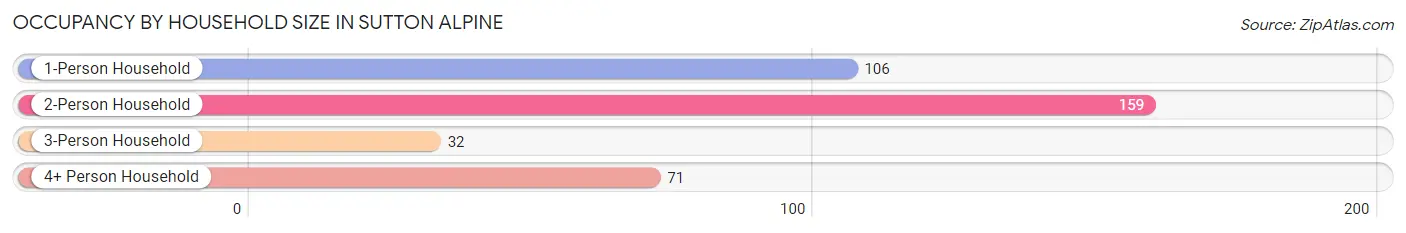
| Household Size | # Housing Units | % Housing Units |
| 1-Person Household | 106 | 28.8% |
| 2-Person Household | 159 | 43.2% |
| 3-Person Household | 32 | 8.7% |
| 4+ Person Household | 71 | 19.3% |
| Total Housing Units | 368 | 100.0% |
Occupancy by Ownership by Household Size in Sutton Alpine
| Household Size | Owner-occupied | Renter-occupied |
| 1-Person Household | 78 (73.6%) | 28 (26.4%) |
| 2-Person Household | 141 (88.7%) | 18 (11.3%) |
| 3-Person Household | 29 (90.6%) | 3 (9.4%) |
| 4+ Person Household | 56 (78.9%) | 15 (21.1%) |
| Total Housing Units | 304 (82.6%) | 64 (17.4%) |
Occupancy by Educational Attainment in Sutton Alpine
| Household Size | Owner-occupied | Renter-occupied |
| Less than High School | 7 (53.8%) | 6 (46.2%) |
| High School Diploma | 127 (86.4%) | 20 (13.6%) |
| College/Associate Degree | 123 (86.0%) | 20 (14.0%) |
| Bachelor's Degree or higher | 47 (72.3%) | 18 (27.7%) |
Occupancy by Age of Householder in Sutton Alpine
| Age Bracket | # Households | % Households |
| Under 35 Years | 53 | 14.4% |
| 35 to 44 Years | 55 | 14.9% |
| 45 to 54 Years | 48 | 13.0% |
| 55 to 64 Years | 104 | 28.3% |
| 65 to 74 Years | 84 | 22.8% |
| 75 to 84 Years | 24 | 6.5% |
| 85 Years and Over | 0 | 0.0% |
| Total | 368 | 100.0% |
Housing Finances in Sutton Alpine
Median Income by Occupancy in Sutton Alpine
| Occupancy Type | # Households | Median Income |
| Owner-Occupied | 304 (82.6%) | $72,308 |
| Renter-Occupied | 64 (17.4%) | $45,500 |
| Average | 368 (100.0%) | $71,058 |
Occupancy by Householder Income Bracket in Sutton Alpine
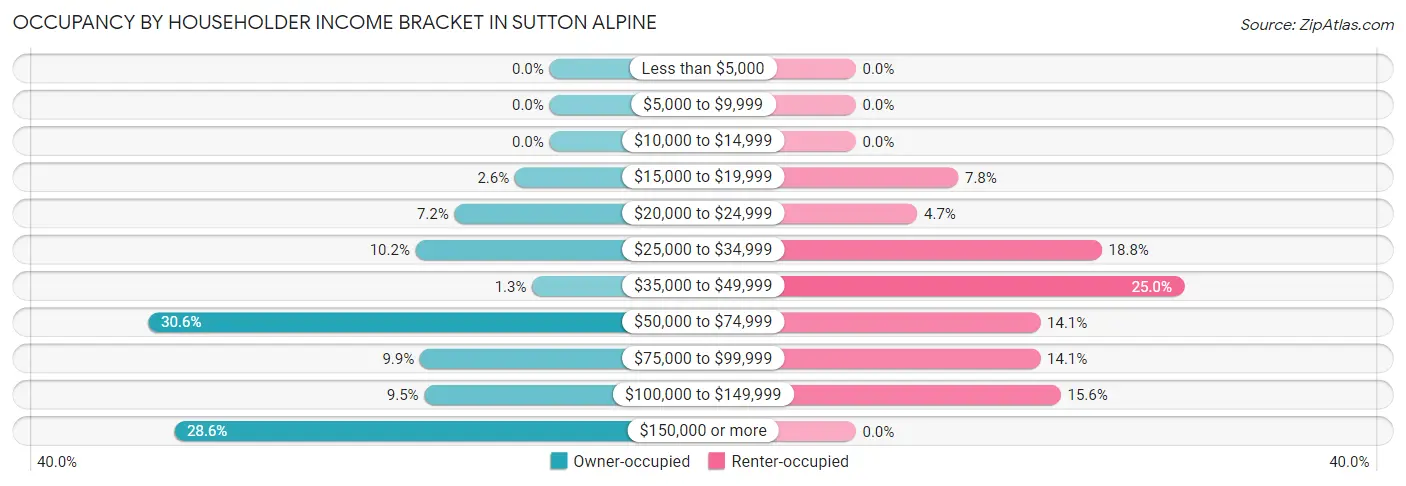
| Income Bracket | Owner-occupied | Renter-occupied |
| Less than $5,000 | 0 (0.0%) | 0 (0.0%) |
| $5,000 to $9,999 | 0 (0.0%) | 0 (0.0%) |
| $10,000 to $14,999 | 0 (0.0%) | 0 (0.0%) |
| $15,000 to $19,999 | 8 (2.6%) | 5 (7.8%) |
| $20,000 to $24,999 | 22 (7.2%) | 3 (4.7%) |
| $25,000 to $34,999 | 31 (10.2%) | 12 (18.8%) |
| $35,000 to $49,999 | 4 (1.3%) | 16 (25.0%) |
| $50,000 to $74,999 | 93 (30.6%) | 9 (14.1%) |
| $75,000 to $99,999 | 30 (9.9%) | 9 (14.1%) |
| $100,000 to $149,999 | 29 (9.5%) | 10 (15.6%) |
| $150,000 or more | 87 (28.6%) | 0 (0.0%) |
| Total | 304 (100.0%) | 64 (100.0%) |
Monthly Housing Cost Tiers in Sutton Alpine
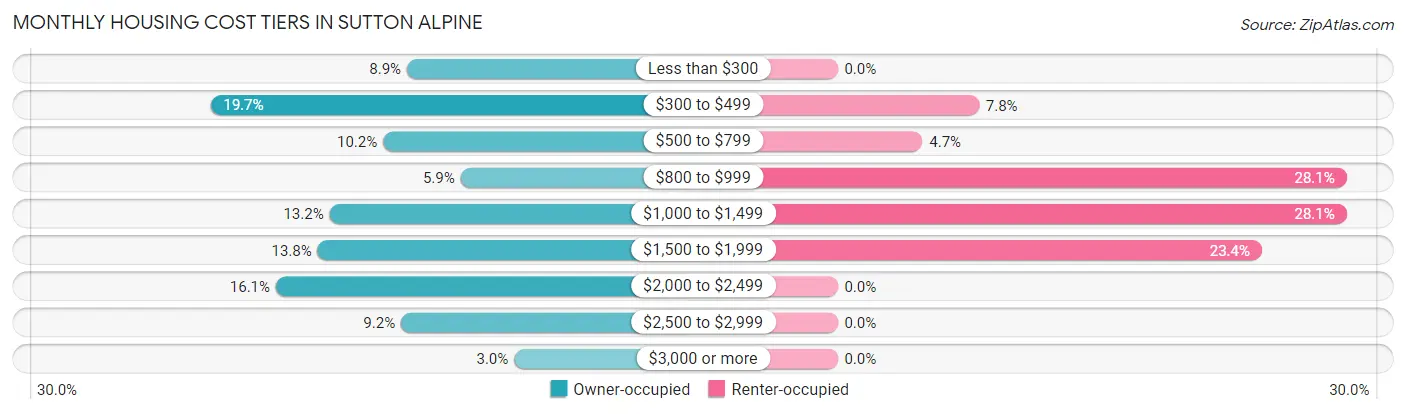
| Monthly Cost | Owner-occupied | Renter-occupied |
| Less than $300 | 27 (8.9%) | 0 (0.0%) |
| $300 to $499 | 60 (19.7%) | 5 (7.8%) |
| $500 to $799 | 31 (10.2%) | 3 (4.7%) |
| $800 to $999 | 18 (5.9%) | 18 (28.1%) |
| $1,000 to $1,499 | 40 (13.2%) | 18 (28.1%) |
| $1,500 to $1,999 | 42 (13.8%) | 15 (23.4%) |
| $2,000 to $2,499 | 49 (16.1%) | 0 (0.0%) |
| $2,500 to $2,999 | 28 (9.2%) | 0 (0.0%) |
| $3,000 or more | 9 (3.0%) | 0 (0.0%) |
| Total | 304 (100.0%) | 64 (100.0%) |
Physical Housing Characteristics in Sutton Alpine
Housing Structures in Sutton Alpine
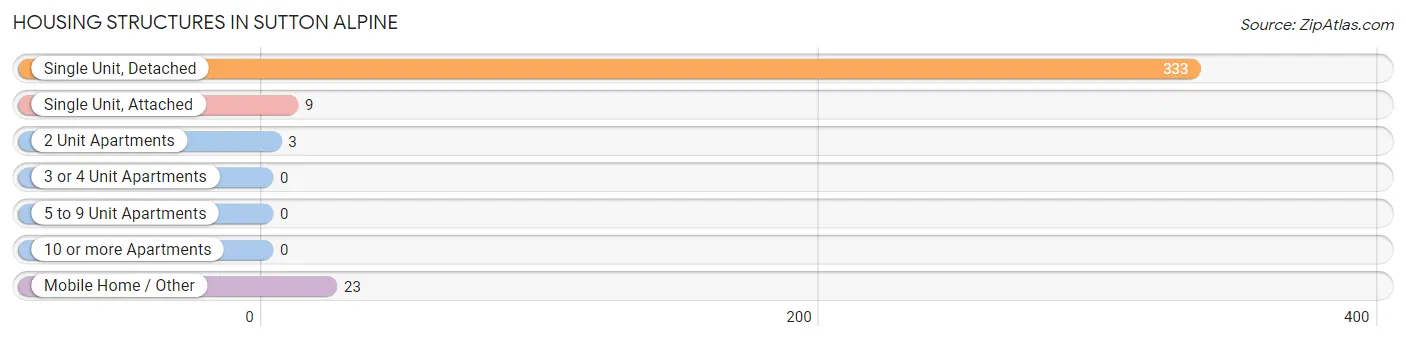
| Structure Type | # Housing Units | % Housing Units |
| Single Unit, Detached | 333 | 90.5% |
| Single Unit, Attached | 9 | 2.5% |
| 2 Unit Apartments | 3 | 0.8% |
| 3 or 4 Unit Apartments | 0 | 0.0% |
| 5 to 9 Unit Apartments | 0 | 0.0% |
| 10 or more Apartments | 0 | 0.0% |
| Mobile Home / Other | 23 | 6.2% |
| Total | 368 | 100.0% |
Housing Structures by Occupancy in Sutton Alpine
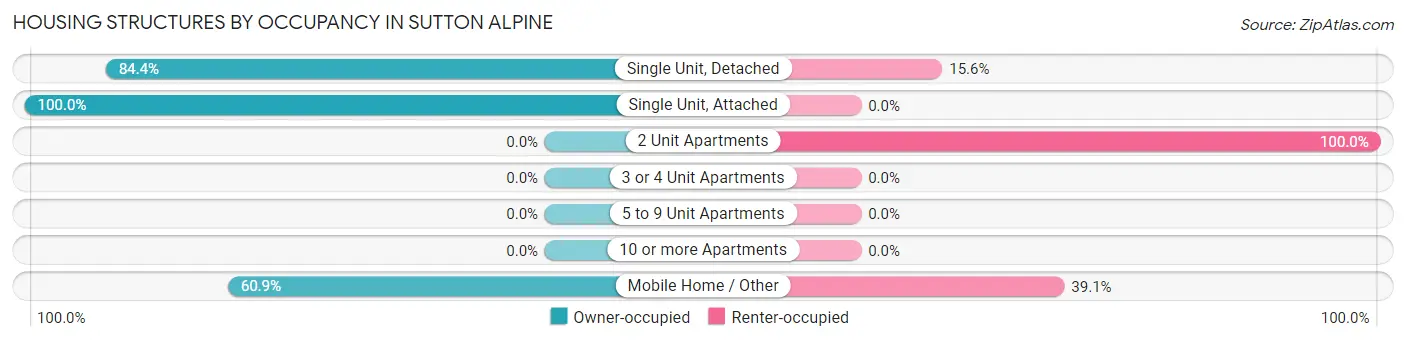
| Structure Type | Owner-occupied | Renter-occupied |
| Single Unit, Detached | 281 (84.4%) | 52 (15.6%) |
| Single Unit, Attached | 9 (100.0%) | 0 (0.0%) |
| 2 Unit Apartments | 0 (0.0%) | 3 (100.0%) |
| 3 or 4 Unit Apartments | 0 (0.0%) | 0 (0.0%) |
| 5 to 9 Unit Apartments | 0 (0.0%) | 0 (0.0%) |
| 10 or more Apartments | 0 (0.0%) | 0 (0.0%) |
| Mobile Home / Other | 14 (60.9%) | 9 (39.1%) |
| Total | 304 (82.6%) | 64 (17.4%) |
Housing Structures by Number of Rooms in Sutton Alpine
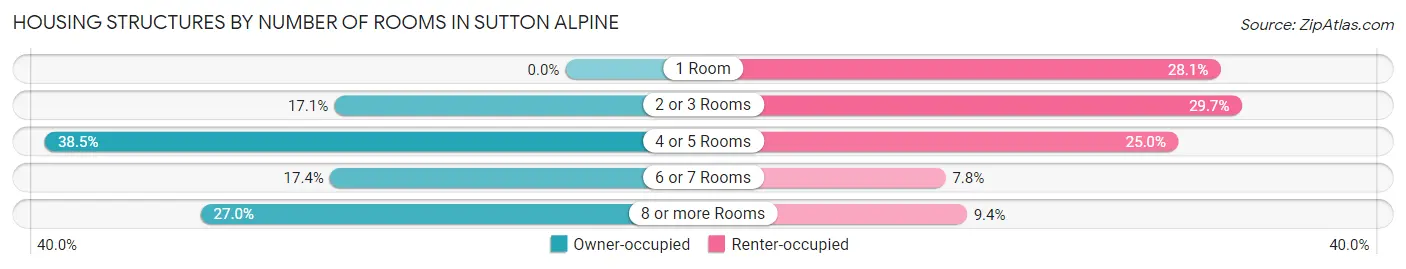
| Number of Rooms | Owner-occupied | Renter-occupied |
| 1 Room | 0 (0.0%) | 18 (28.1%) |
| 2 or 3 Rooms | 52 (17.1%) | 19 (29.7%) |
| 4 or 5 Rooms | 117 (38.5%) | 16 (25.0%) |
| 6 or 7 Rooms | 53 (17.4%) | 5 (7.8%) |
| 8 or more Rooms | 82 (27.0%) | 6 (9.4%) |
| Total | 304 (100.0%) | 64 (100.0%) |
Housing Structure by Heating Type in Sutton Alpine
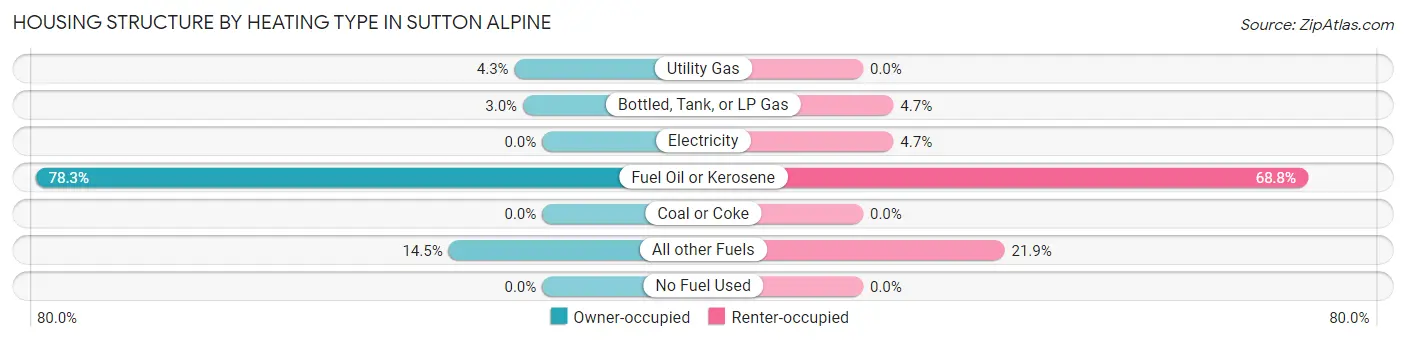
| Heating Type | Owner-occupied | Renter-occupied |
| Utility Gas | 13 (4.3%) | 0 (0.0%) |
| Bottled, Tank, or LP Gas | 9 (3.0%) | 3 (4.7%) |
| Electricity | 0 (0.0%) | 3 (4.7%) |
| Fuel Oil or Kerosene | 238 (78.3%) | 44 (68.8%) |
| Coal or Coke | 0 (0.0%) | 0 (0.0%) |
| All other Fuels | 44 (14.5%) | 14 (21.9%) |
| No Fuel Used | 0 (0.0%) | 0 (0.0%) |
| Total | 304 (100.0%) | 64 (100.0%) |
Household Vehicle Usage in Sutton Alpine
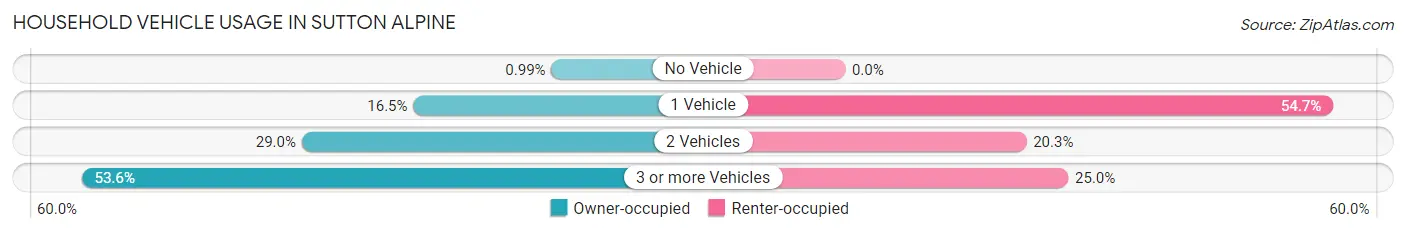
| Vehicles per Household | Owner-occupied | Renter-occupied |
| No Vehicle | 3 (1.0%) | 0 (0.0%) |
| 1 Vehicle | 50 (16.5%) | 35 (54.7%) |
| 2 Vehicles | 88 (28.9%) | 13 (20.3%) |
| 3 or more Vehicles | 163 (53.6%) | 16 (25.0%) |
| Total | 304 (100.0%) | 64 (100.0%) |
Real Estate & Mortgages in Sutton Alpine
Real Estate and Mortgage Overview in Sutton Alpine
| Characteristic | Without Mortgage | With Mortgage |
| Housing Units | 135 | 169 |
| Median Property Value | $187,500 | $237,900 |
| Median Household Income | $62,212 | $68 |
| Monthly Housing Costs | $411 | $9 |
| Real Estate Taxes | $2,226 | $31 |
Property Value by Mortgage Status in Sutton Alpine
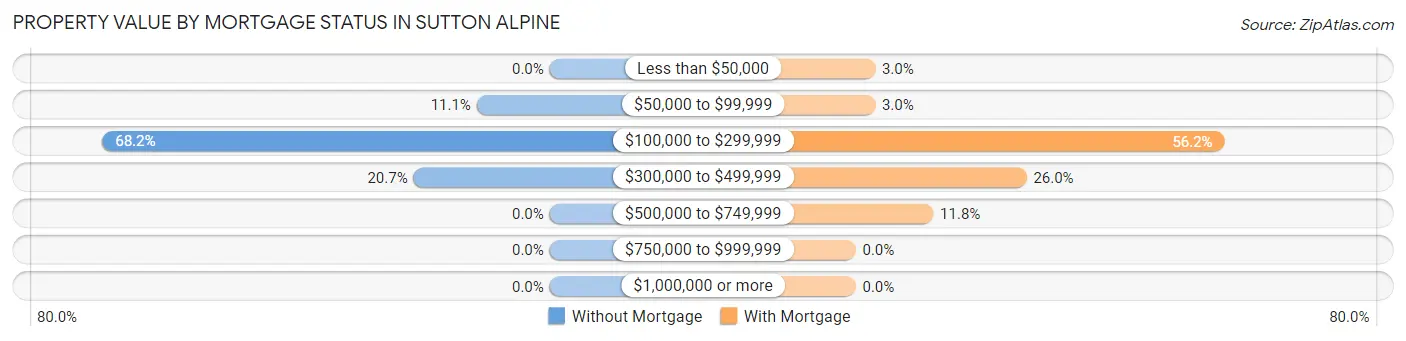
| Property Value | Without Mortgage | With Mortgage |
| Less than $50,000 | 0 (0.0%) | 5 (3.0%) |
| $50,000 to $99,999 | 15 (11.1%) | 5 (3.0%) |
| $100,000 to $299,999 | 92 (68.1%) | 95 (56.2%) |
| $300,000 to $499,999 | 28 (20.7%) | 44 (26.0%) |
| $500,000 to $749,999 | 0 (0.0%) | 20 (11.8%) |
| $750,000 to $999,999 | 0 (0.0%) | 0 (0.0%) |
| $1,000,000 or more | 0 (0.0%) | 0 (0.0%) |
| Total | 135 (100.0%) | 169 (100.0%) |
Household Income by Mortgage Status in Sutton Alpine
| Household Income | Without Mortgage | With Mortgage |
| Less than $10,000 | 0 (0.0%) | 4 (2.4%) |
| $10,000 to $24,999 | 21 (15.6%) | 0 (0.0%) |
| $25,000 to $34,999 | 16 (11.8%) | 9 (5.3%) |
| $35,000 to $49,999 | 4 (3.0%) | 15 (8.9%) |
| $50,000 to $74,999 | 53 (39.3%) | 0 (0.0%) |
| $75,000 to $99,999 | 12 (8.9%) | 40 (23.7%) |
| $100,000 to $149,999 | 10 (7.4%) | 18 (10.6%) |
| $150,000 or more | 19 (14.1%) | 19 (11.2%) |
| Total | 135 (100.0%) | 169 (100.0%) |
Property Value to Household Income Ratio in Sutton Alpine
| Value-to-Income Ratio | Without Mortgage | With Mortgage |
| Less than 2.0x | 23 (17.0%) | 110,313 (65,274.0%) |
| 2.0x to 2.9x | 46 (34.1%) | 57 (33.7%) |
| 3.0x to 3.9x | 20 (14.8%) | 36 (21.3%) |
| 4.0x or more | 46 (34.1%) | 38 (22.5%) |
| Total | 135 (100.0%) | 169 (100.0%) |
Real Estate Taxes by Mortgage Status in Sutton Alpine
| Property Taxes | Without Mortgage | With Mortgage |
| Less than $800 | 5 (3.7%) | 0 (0.0%) |
| $800 to $1,499 | 21 (15.6%) | 4 (2.4%) |
| $800 to $1,499 | 46 (34.1%) | 6 (3.5%) |
| Total | 135 (100.0%) | 169 (100.0%) |
Health & Disability in Sutton Alpine
Health Insurance Coverage by Age in Sutton Alpine
| Age Bracket | With Coverage | Without Coverage |
| Under 6 Years | 36 (83.7%) | 7 (16.3%) |
| 6 to 18 Years | 136 (93.1%) | 10 (6.9%) |
| 19 to 25 Years | 47 (88.7%) | 6 (11.3%) |
| 26 to 34 Years | 61 (68.5%) | 28 (31.5%) |
| 35 to 44 Years | 69 (69.0%) | 31 (31.0%) |
| 45 to 54 Years | 75 (88.2%) | 10 (11.8%) |
| 55 to 64 Years | 139 (79.4%) | 36 (20.6%) |
| 65 to 74 Years | 129 (96.3%) | 5 (3.7%) |
| 75 Years and older | 45 (100.0%) | 0 (0.0%) |
| Total | 737 (84.7%) | 133 (15.3%) |
Health Insurance Coverage by Citizenship Status in Sutton Alpine
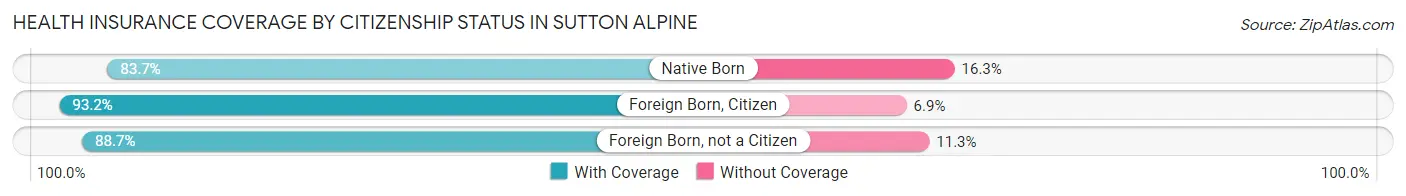
| Citizenship Status | With Coverage | Without Coverage |
| Native Born | 36 (83.7%) | 7 (16.3%) |
| Foreign Born, Citizen | 136 (93.1%) | 10 (6.9%) |
| Foreign Born, not a Citizen | 47 (88.7%) | 6 (11.3%) |
Health Insurance Coverage by Household Income in Sutton Alpine

| Household Income | With Coverage | Without Coverage |
| Under $25,000 | 45 (93.8%) | 3 (6.2%) |
| $25,000 to $49,999 | 121 (80.7%) | 29 (19.3%) |
| $50,000 to $74,999 | 172 (80.0%) | 43 (20.0%) |
| $75,000 to $99,999 | 48 (60.0%) | 32 (40.0%) |
| $100,000 and over | 351 (93.1%) | 26 (6.9%) |
Public vs Private Health Insurance Coverage by Age in Sutton Alpine
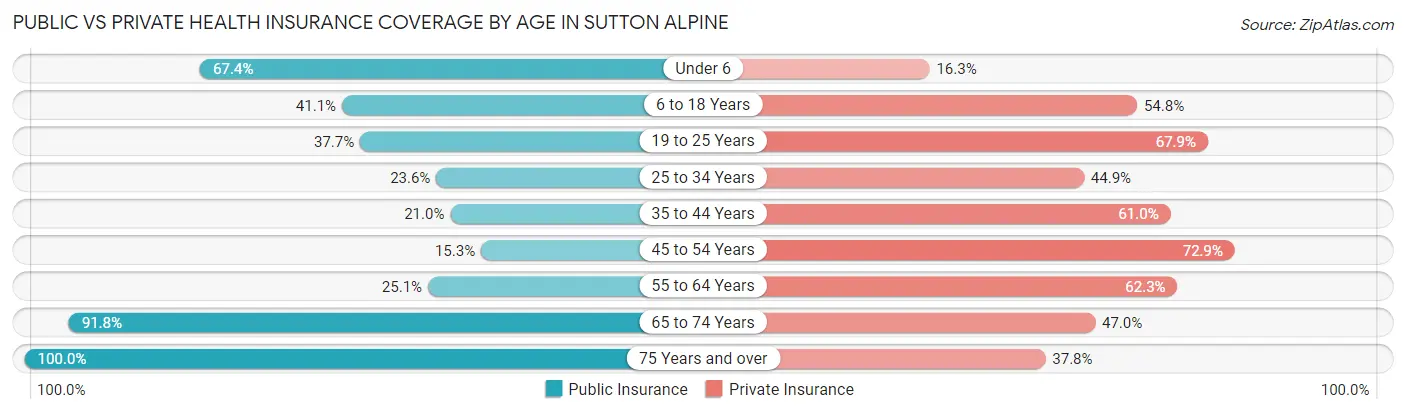
| Age Bracket | Public Insurance | Private Insurance |
| Under 6 | 29 (67.4%) | 7 (16.3%) |
| 6 to 18 Years | 60 (41.1%) | 80 (54.8%) |
| 19 to 25 Years | 20 (37.7%) | 36 (67.9%) |
| 25 to 34 Years | 21 (23.6%) | 40 (44.9%) |
| 35 to 44 Years | 21 (21.0%) | 61 (61.0%) |
| 45 to 54 Years | 13 (15.3%) | 62 (72.9%) |
| 55 to 64 Years | 44 (25.1%) | 109 (62.3%) |
| 65 to 74 Years | 123 (91.8%) | 63 (47.0%) |
| 75 Years and over | 45 (100.0%) | 17 (37.8%) |
| Total | 376 (43.2%) | 475 (54.6%) |
Disability Status by Sex by Age in Sutton Alpine
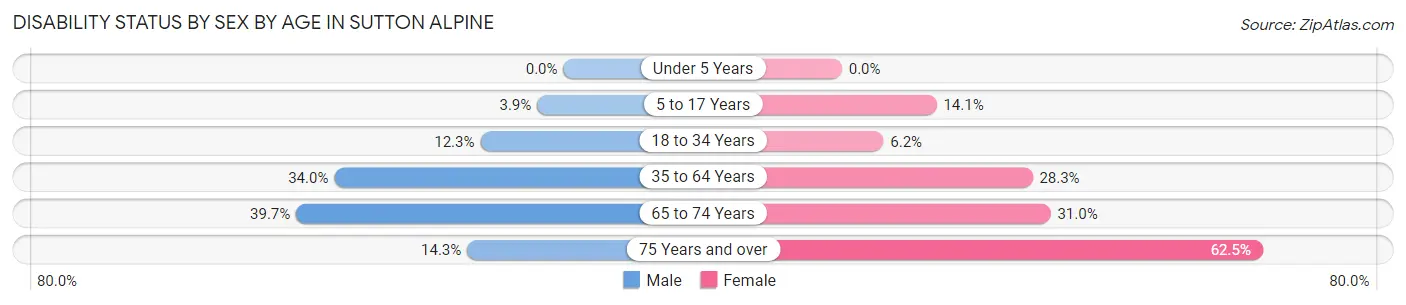
| Age Bracket | Male | Female |
| Under 5 Years | 0 (0.0%) | 0 (0.0%) |
| 5 to 17 Years | 3 (3.9%) | 9 (14.1%) |
| 18 to 34 Years | 9 (12.3%) | 5 (6.2%) |
| 35 to 64 Years | 66 (34.0%) | 47 (28.3%) |
| 65 to 74 Years | 25 (39.7%) | 22 (31.0%) |
| 75 Years and over | 3 (14.3%) | 15 (62.5%) |
Disability Class by Sex by Age in Sutton Alpine
Disability Class: Hearing Difficulty
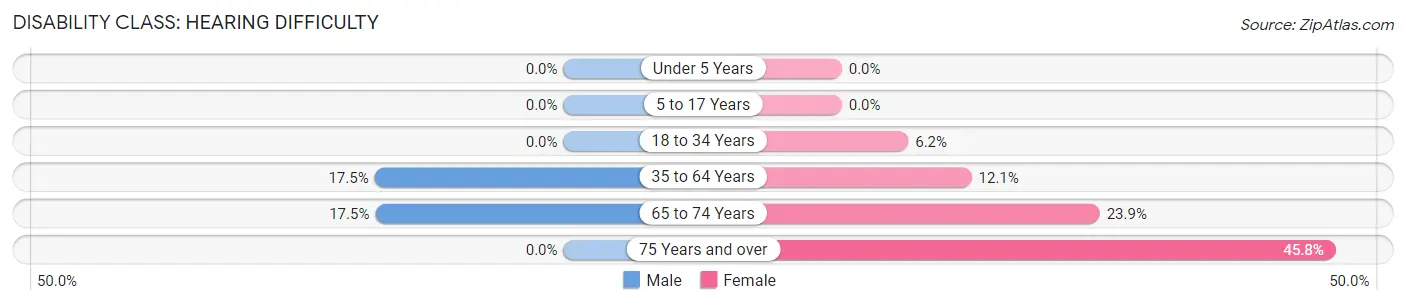
| Age Bracket | Male | Female |
| Under 5 Years | 0 (0.0%) | 0 (0.0%) |
| 5 to 17 Years | 0 (0.0%) | 0 (0.0%) |
| 18 to 34 Years | 0 (0.0%) | 5 (6.2%) |
| 35 to 64 Years | 34 (17.5%) | 20 (12.0%) |
| 65 to 74 Years | 11 (17.5%) | 17 (23.9%) |
| 75 Years and over | 0 (0.0%) | 11 (45.8%) |
Disability Class: Vision Difficulty
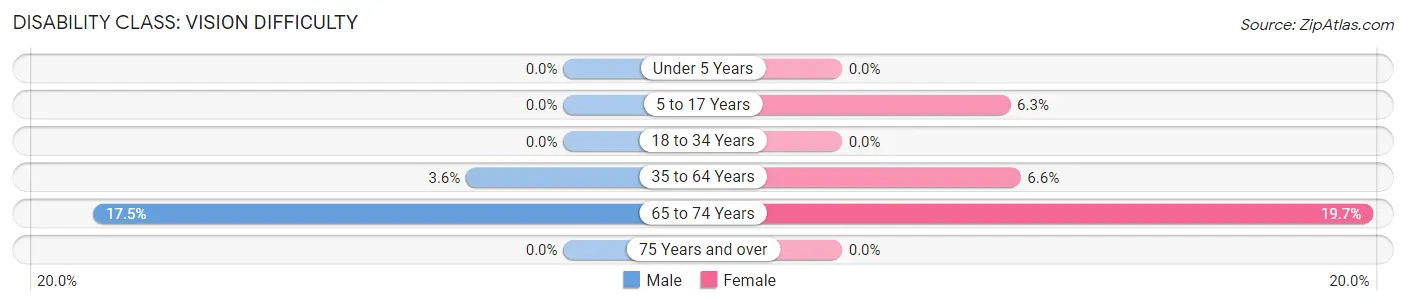
| Age Bracket | Male | Female |
| Under 5 Years | 0 (0.0%) | 0 (0.0%) |
| 5 to 17 Years | 0 (0.0%) | 4 (6.2%) |
| 18 to 34 Years | 0 (0.0%) | 0 (0.0%) |
| 35 to 64 Years | 7 (3.6%) | 11 (6.6%) |
| 65 to 74 Years | 11 (17.5%) | 14 (19.7%) |
| 75 Years and over | 0 (0.0%) | 0 (0.0%) |
Disability Class: Cognitive Difficulty
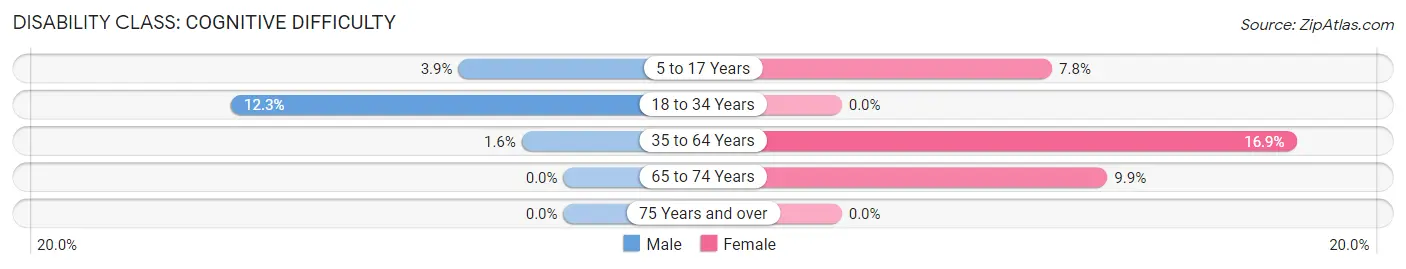
| Age Bracket | Male | Female |
| 5 to 17 Years | 3 (3.9%) | 5 (7.8%) |
| 18 to 34 Years | 9 (12.3%) | 0 (0.0%) |
| 35 to 64 Years | 3 (1.5%) | 28 (16.9%) |
| 65 to 74 Years | 0 (0.0%) | 7 (9.9%) |
| 75 Years and over | 0 (0.0%) | 0 (0.0%) |
Disability Class: Ambulatory Difficulty
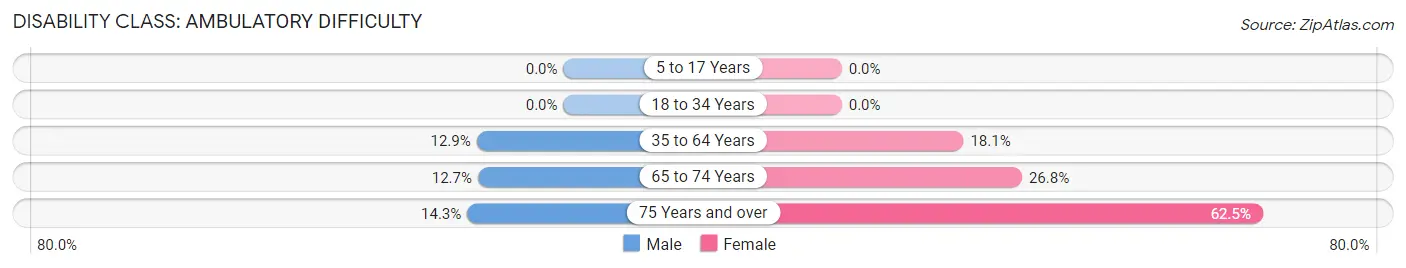
| Age Bracket | Male | Female |
| 5 to 17 Years | 0 (0.0%) | 0 (0.0%) |
| 18 to 34 Years | 0 (0.0%) | 0 (0.0%) |
| 35 to 64 Years | 25 (12.9%) | 30 (18.1%) |
| 65 to 74 Years | 8 (12.7%) | 19 (26.8%) |
| 75 Years and over | 3 (14.3%) | 15 (62.5%) |
Disability Class: Self-Care Difficulty
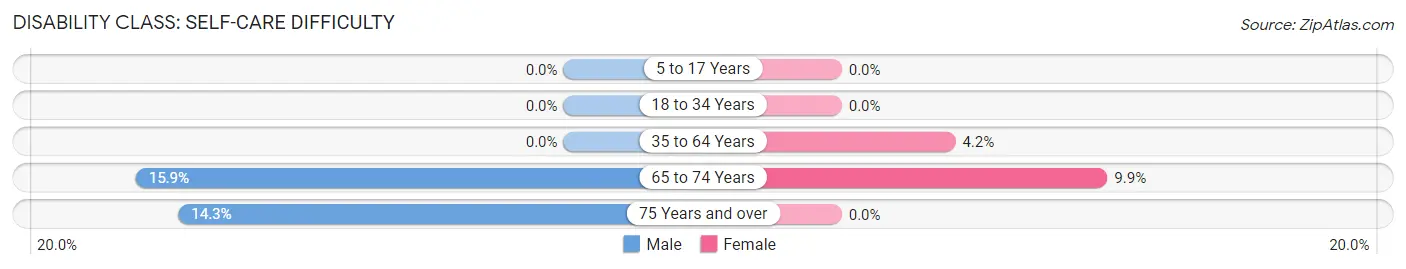
| Age Bracket | Male | Female |
| 5 to 17 Years | 0 (0.0%) | 0 (0.0%) |
| 18 to 34 Years | 0 (0.0%) | 0 (0.0%) |
| 35 to 64 Years | 0 (0.0%) | 7 (4.2%) |
| 65 to 74 Years | 10 (15.9%) | 7 (9.9%) |
| 75 Years and over | 3 (14.3%) | 0 (0.0%) |
Technology Access in Sutton Alpine
Computing Device Access in Sutton Alpine
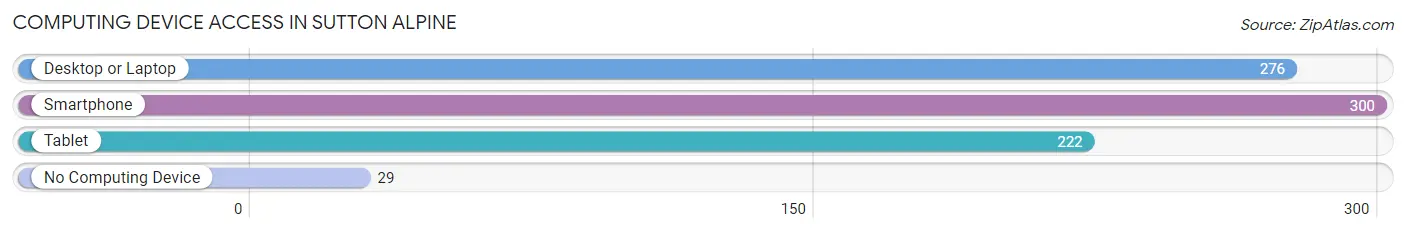
| Device Type | # Households | % Households |
| Desktop or Laptop | 276 | 75.0% |
| Smartphone | 300 | 81.5% |
| Tablet | 222 | 60.3% |
| No Computing Device | 29 | 7.9% |
| Total | 368 | 100.0% |
Internet Access in Sutton Alpine
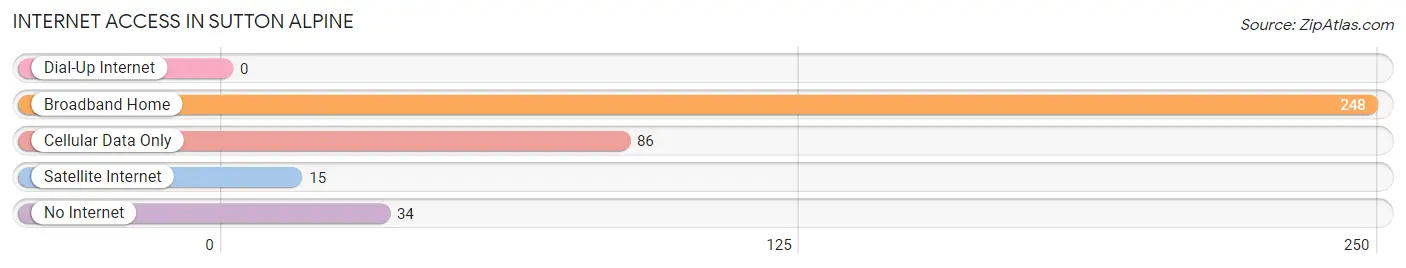
| Internet Type | # Households | % Households |
| Dial-Up Internet | 0 | 0.0% |
| Broadband Home | 248 | 67.4% |
| Cellular Data Only | 86 | 23.4% |
| Satellite Internet | 15 | 4.1% |
| No Internet | 34 | 9.2% |
| Total | 368 | 100.0% |
Sutton Alpine Summary
Sutton Alpine is a small unincorporated community located in the Matanuska-Susitna Borough of Alaska. It is situated on the south side of the Matanuska River, approximately 40 miles northeast of Anchorage. The community is home to approximately 200 people, and is a popular destination for outdoor recreation and hunting.
History
Sutton Alpine was first settled in the early 1900s by homesteaders who were attracted to the area by its abundant natural resources. The community was named after the nearby Sutton Mountains, which were named after the first settlers in the area, the Sutton family. The first post office in the area was established in 1921, and the community was officially incorporated in 1945.
Geography
Sutton Alpine is located in the Matanuska-Susitna Borough of Alaska, approximately 40 miles northeast of Anchorage. The community is situated on the south side of the Matanuska River, and is surrounded by the Chugach Mountains to the east and the Talkeetna Mountains to the west. The area is known for its abundant wildlife, including moose, bear, and caribou.
Economy
The economy of Sutton Alpine is largely based on tourism and outdoor recreation. The area is a popular destination for hunting, fishing, and camping, and is home to several lodges and resorts. The community is also home to a number of small businesses, including a general store, a gas station, and a restaurant.
Demographics
As of the 2010 census, the population of Sutton Alpine was approximately 200 people. The racial makeup of the community was 95.5% White, 0.5% Native American, 0.5% Asian, and 3.5% from other races. The median household income was $50,000, and the median age was 44 years.
Conclusion
Sutton Alpine is a small unincorporated community located in the Matanuska-Susitna Borough of Alaska. It was first settled in the early 1900s by homesteaders, and is now a popular destination for outdoor recreation and hunting. The economy of the community is largely based on tourism and outdoor recreation, and the population is approximately 200 people.
Common Questions
What is Per Capita Income in Sutton Alpine?
Per Capita income in Sutton Alpine is $29,078.
What is the Median Family Income in Sutton Alpine?
Median Family Income in Sutton Alpine is $92,083.
What is the Median Household income in Sutton Alpine?
Median Household Income in Sutton Alpine is $71,058.
What is Income or Wage Gap in Sutton Alpine?
Income or Wage Gap in Sutton Alpine is 40.5%.
Women in Sutton Alpine earn 59.5 cents for every dollar earned by a man.
What is Inequality or Gini Index in Sutton Alpine?
Inequality or Gini Index in Sutton Alpine is 0.41.
What is the Total Population of Sutton Alpine?
Total Population of Sutton Alpine is 1,323.
What is the Total Male Population of Sutton Alpine?
Total Male Population of Sutton Alpine is 892.
What is the Total Female Population of Sutton Alpine?
Total Female Population of Sutton Alpine is 431.
What is the Ratio of Males per 100 Females in Sutton Alpine?
There are 206.96 Males per 100 Females in Sutton Alpine.
What is the Ratio of Females per 100 Males in Sutton Alpine?
There are 48.32 Females per 100 Males in Sutton Alpine.
What is the Median Population Age in Sutton Alpine?
Median Population Age in Sutton Alpine is 40.5 Years.
What is the Average Family Size in Sutton Alpine
Average Family Size in Sutton Alpine is 3.1 People.
What is the Average Household Size in Sutton Alpine
Average Household Size in Sutton Alpine is 2.4 People.
How Large is the Labor Force in Sutton Alpine?
There are 416 People in the Labor Forcein in Sutton Alpine.
What is the Percentage of People in the Labor Force in Sutton Alpine?
36.3% of People are in the Labor Force in Sutton Alpine.
What is the Unemployment Rate in Sutton Alpine?
Unemployment Rate in Sutton Alpine is 13.2%.