Saxman, AK Map & Demographics
Saxman Map
Saxman Overview
$24,381
PER CAPITA INCOME
$53,750
AVG FAMILY INCOME
$50,500
AVG HOUSEHOLD INCOME
56.3%
WAGE / INCOME GAP [ % ]
43.7¢/ $1
WAGE / INCOME GAP [ $ ]
0.47
INEQUALITY / GINI INDEX
361
TOTAL POPULATION
199
MALE POPULATION
162
FEMALE POPULATION
122.84
MALES / 100 FEMALES
81.41
FEMALES / 100 MALES
48.2
MEDIAN AGE
3.7
AVG FAMILY SIZE
3.0
AVG HOUSEHOLD SIZE
121
LABOR FORCE [ PEOPLE ]
39.7%
PERCENT IN LABOR FORCE
14.0%
UNEMPLOYMENT RATE
Saxman Area Codes
Income in Saxman
Income Overview in Saxman
Per Capita Income in Saxman is $24,381, while median incomes of families and households are $53,750 and $50,500 respectively.
| Characteristic | Number | Measure |
| Per Capita Income | 361 | $24,381 |
| Median Family Income | 76 | $53,750 |
| Mean Family Income | 76 | $68,038 |
| Median Household Income | 118 | $50,500 |
| Mean Household Income | 118 | $69,082 |
| Income Deficit | 76 | $0 |
| Wage / Income Gap (%) | 361 | 56.32% |
| Wage / Income Gap ($) | 361 | 43.68¢ per $1 |
| Gini / Inequality Index | 361 | 0.47 |
Earnings by Sex in Saxman
Average Earnings in Saxman are $27,813, $36,250 for men and $15,833 for women, a difference of 56.3%.
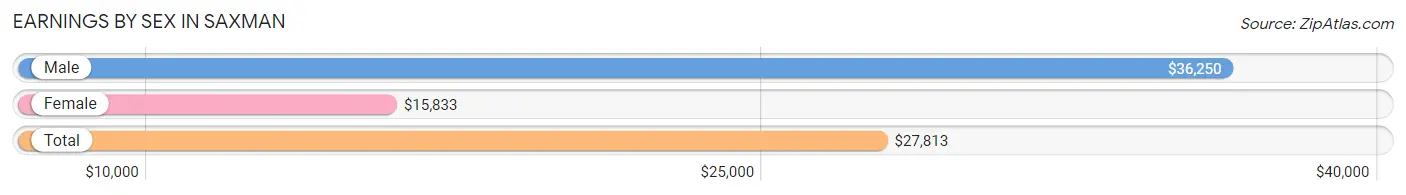
| Sex | Number | Average Earnings |
| Male | 68 (50.0%) | $36,250 |
| Female | 68 (50.0%) | $15,833 |
| Total | 136 (100.0%) | $27,813 |
Earnings by Sex by Income Bracket in Saxman
The most common earnings brackets in Saxman are $12,500 to $14,999 for men (12 | 17.6%) and $10,000 to $12,499 for women (13 | 19.1%).
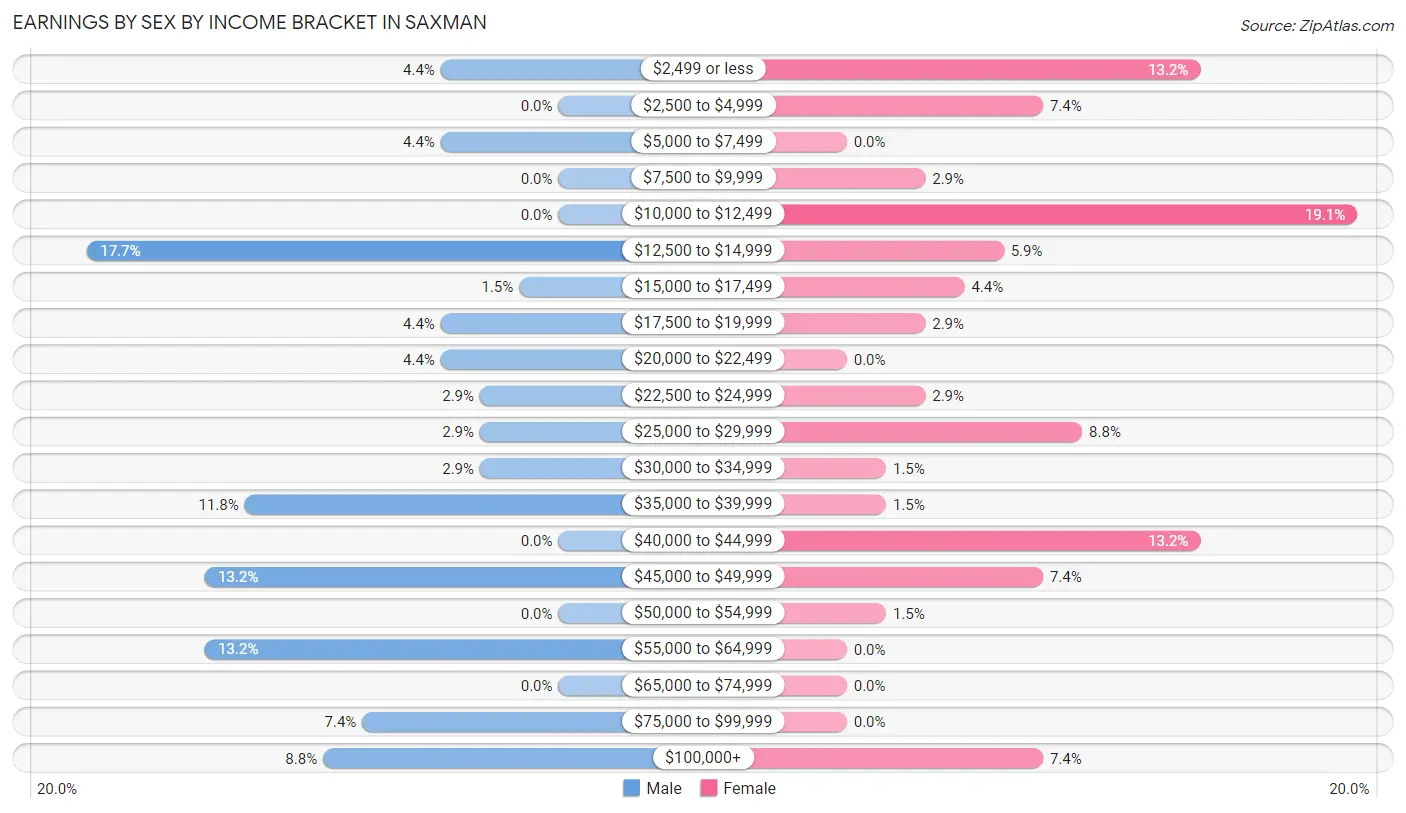
| Income | Male | Female |
| $2,499 or less | 3 (4.4%) | 9 (13.2%) |
| $2,500 to $4,999 | 0 (0.0%) | 5 (7.3%) |
| $5,000 to $7,499 | 3 (4.4%) | 0 (0.0%) |
| $7,500 to $9,999 | 0 (0.0%) | 2 (2.9%) |
| $10,000 to $12,499 | 0 (0.0%) | 13 (19.1%) |
| $12,500 to $14,999 | 12 (17.6%) | 4 (5.9%) |
| $15,000 to $17,499 | 1 (1.5%) | 3 (4.4%) |
| $17,500 to $19,999 | 3 (4.4%) | 2 (2.9%) |
| $20,000 to $22,499 | 3 (4.4%) | 0 (0.0%) |
| $22,500 to $24,999 | 2 (2.9%) | 2 (2.9%) |
| $25,000 to $29,999 | 2 (2.9%) | 6 (8.8%) |
| $30,000 to $34,999 | 2 (2.9%) | 1 (1.5%) |
| $35,000 to $39,999 | 8 (11.8%) | 1 (1.5%) |
| $40,000 to $44,999 | 0 (0.0%) | 9 (13.2%) |
| $45,000 to $49,999 | 9 (13.2%) | 5 (7.3%) |
| $50,000 to $54,999 | 0 (0.0%) | 1 (1.5%) |
| $55,000 to $64,999 | 9 (13.2%) | 0 (0.0%) |
| $65,000 to $74,999 | 0 (0.0%) | 0 (0.0%) |
| $75,000 to $99,999 | 5 (7.3%) | 0 (0.0%) |
| $100,000+ | 6 (8.8%) | 5 (7.3%) |
| Total | 68 (100.0%) | 68 (100.0%) |
Earnings by Sex by Educational Attainment in Saxman
Average earnings in Saxman are $36,875 for men and $29,063 for women, a difference of 21.2%. Men with an educational attainment of less than high school enjoy the highest average annual earnings of $48,125, while those with high school diploma education earn the least with $36,667. Women with an educational attainment of college or associate's degree earn the most with the average annual earnings of $37,500, while those with college or associate's degree education have the smallest earnings of $37,500.
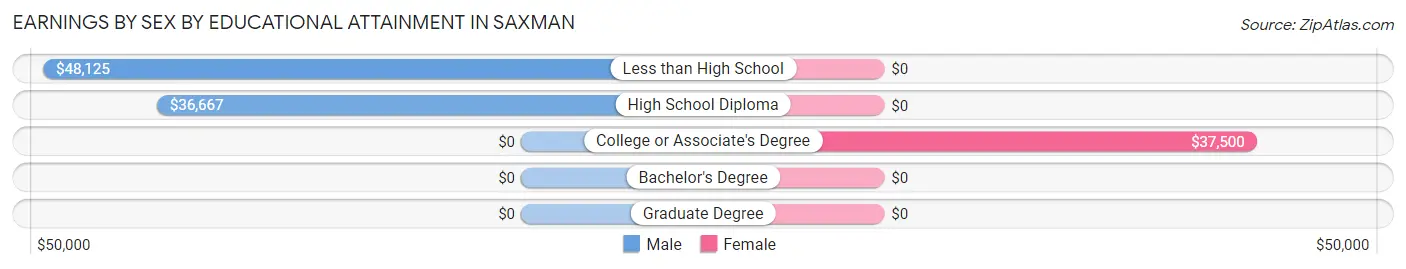
| Educational Attainment | Male Income | Female Income |
| Less than High School | $48,125 | $0 |
| High School Diploma | $36,667 | $0 |
| College or Associate's Degree | - | - |
| Bachelor's Degree | - | - |
| Graduate Degree | - | - |
| Total | $36,875 | $29,063 |
Family Income in Saxman
Family Income Brackets in Saxman
According to the Saxman family income data, there are 23 families falling into the $50,000 to $74,999 income range, which is the most common income bracket and makes up 30.3% of all families. Conversely, the $15,000 to $24,999 income bracket is the least frequent group with only 1 families (1.3%) belonging to this category.
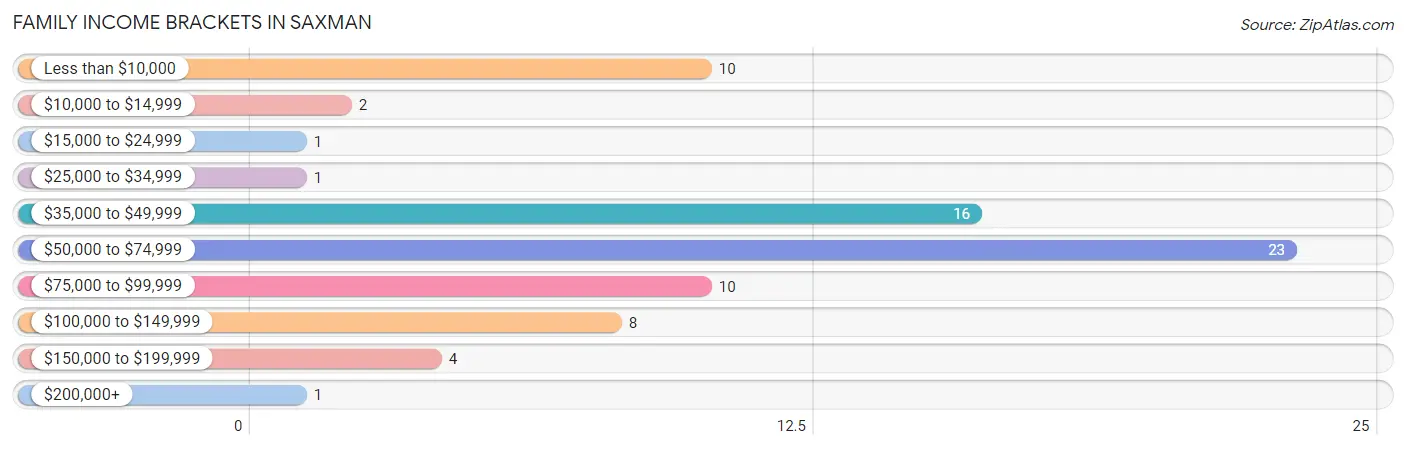
| Income Bracket | # Families | % Families |
| Less than $10,000 | 10 | 13.2% |
| $10,000 to $14,999 | 2 | 2.6% |
| $15,000 to $24,999 | 1 | 1.3% |
| $25,000 to $34,999 | 1 | 1.3% |
| $35,000 to $49,999 | 16 | 21.1% |
| $50,000 to $74,999 | 23 | 30.3% |
| $75,000 to $99,999 | 10 | 13.2% |
| $100,000 to $149,999 | 8 | 10.5% |
| $150,000 to $199,999 | 4 | 5.3% |
| $200,000+ | 1 | 1.3% |
Family Income by Famaliy Size in Saxman
4-person families (12 | 15.8%) account for the highest median family income in Saxman with $113,750 per family, while 4-person families (12 | 15.8%) have the highest median income of $28,438 per family member.
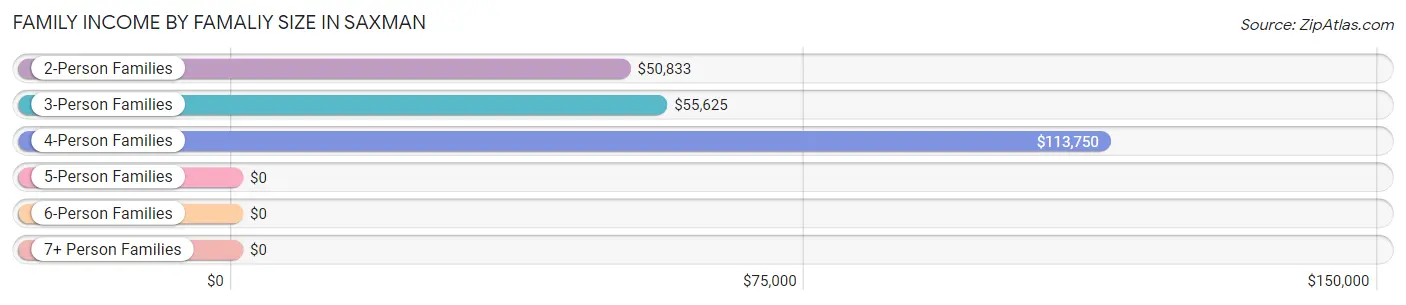
| Income Bracket | # Families | Median Income |
| 2-Person Families | 32 (42.1%) | $50,833 |
| 3-Person Families | 25 (32.9%) | $55,625 |
| 4-Person Families | 12 (15.8%) | $113,750 |
| 5-Person Families | 1 (1.3%) | $0 |
| 6-Person Families | 3 (4.0%) | $0 |
| 7+ Person Families | 3 (4.0%) | $0 |
| Total | 76 (100.0%) | $53,750 |
Family Income by Number of Earners in Saxman
The median family income in Saxman is $53,750, with families comprising 3+ earners (7) having the highest median family income of $121,875, while families with no earners (10) have the lowest median family income of $48,750, accounting for 9.2% and 13.2% of families, respectively.
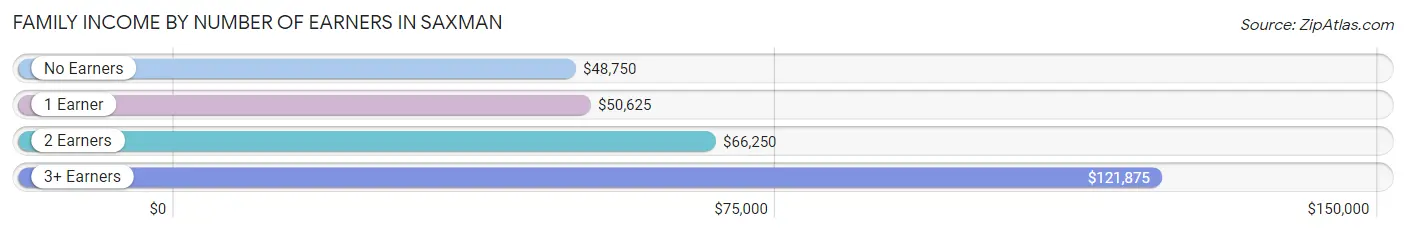
| Number of Earners | # Families | Median Income |
| No Earners | 10 (13.2%) | $48,750 |
| 1 Earner | 45 (59.2%) | $50,625 |
| 2 Earners | 14 (18.4%) | $66,250 |
| 3+ Earners | 7 (9.2%) | $121,875 |
| Total | 76 (100.0%) | $53,750 |
Household Income in Saxman
Household Income Brackets in Saxman
With 23 households falling in the category, the $50,000 to $74,999 income range is the most frequent in Saxman, accounting for 19.5% of all households. In contrast, only 4 households (3.4%) fall into the $10,000 to $14,999 income bracket, making it the least populous group.
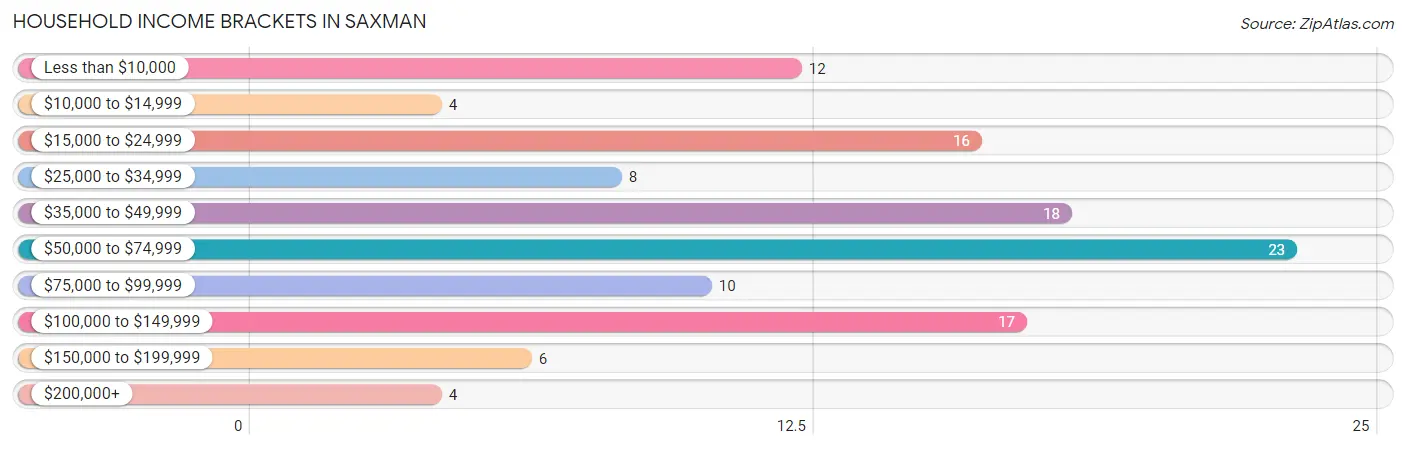
| Income Bracket | # Households | % Households |
| Less than $10,000 | 12 | 10.2% |
| $10,000 to $14,999 | 4 | 3.4% |
| $15,000 to $24,999 | 16 | 13.6% |
| $25,000 to $34,999 | 8 | 6.8% |
| $35,000 to $49,999 | 18 | 15.3% |
| $50,000 to $74,999 | 23 | 19.5% |
| $75,000 to $99,999 | 10 | 8.5% |
| $100,000 to $149,999 | 17 | 14.4% |
| $150,000 to $199,999 | 6 | 5.1% |
| $200,000+ | 4 | 3.4% |
Household Income by Householder Age in Saxman
The median household income in Saxman is $50,500, with the highest median household income of $62,500 found in the 45 to 64 years age bracket for the primary householder. A total of 48 households (40.7%) fall into this category. Meanwhile, the 15 to 24 years age bracket for the primary householder has the lowest median household income of $0, with 4 households (3.4%) in this group.
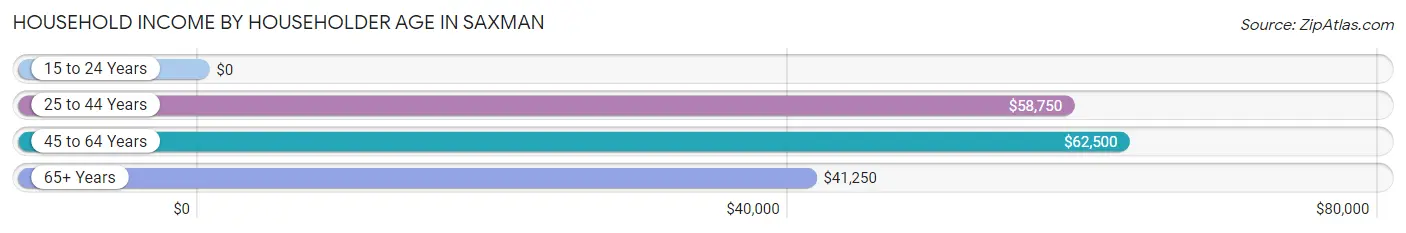
| Income Bracket | # Households | Median Income |
| 15 to 24 Years | 4 (3.4%) | $0 |
| 25 to 44 Years | 16 (13.6%) | $58,750 |
| 45 to 64 Years | 48 (40.7%) | $62,500 |
| 65+ Years | 50 (42.4%) | $41,250 |
| Total | 118 (100.0%) | $50,500 |
Poverty in Saxman
Income Below Poverty by Sex and Age in Saxman
With 14.6% poverty level for males and 21.6% for females among the residents of Saxman, 16 and 17 year old males and 12 to 14 year old females are the most vulnerable to poverty, with 2 males (100.0%) and 4 females (100.0%) in their respective age groups living below the poverty level.
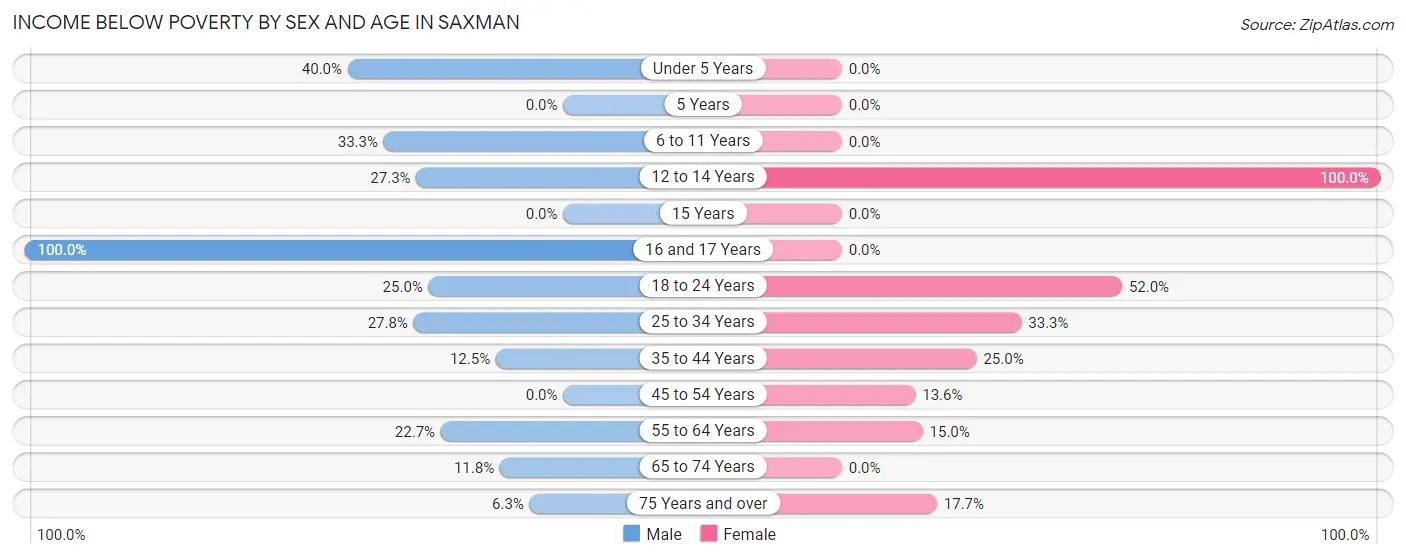
| Age Bracket | Male | Female |
| Under 5 Years | 2 (40.0%) | 0 (0.0%) |
| 5 Years | 0 (0.0%) | 0 (0.0%) |
| 6 to 11 Years | 3 (33.3%) | 0 (0.0%) |
| 12 to 14 Years | 3 (27.3%) | 4 (100.0%) |
| 15 Years | 0 (0.0%) | 0 (0.0%) |
| 16 and 17 Years | 2 (100.0%) | 0 (0.0%) |
| 18 to 24 Years | 3 (25.0%) | 13 (52.0%) |
| 25 to 34 Years | 5 (27.8%) | 6 (33.3%) |
| 35 to 44 Years | 2 (12.5%) | 3 (25.0%) |
| 45 to 54 Years | 0 (0.0%) | 3 (13.6%) |
| 55 to 64 Years | 5 (22.7%) | 3 (15.0%) |
| 65 to 74 Years | 2 (11.8%) | 0 (0.0%) |
| 75 Years and over | 2 (6.2%) | 3 (17.6%) |
| Total | 29 (14.6%) | 35 (21.6%) |
Income Above Poverty by Sex and Age in Saxman
According to the poverty statistics in Saxman, males aged 5 years and females aged under 5 years are the age groups that are most secure financially, with 100.0% of males and 100.0% of females in these age groups living above the poverty line.
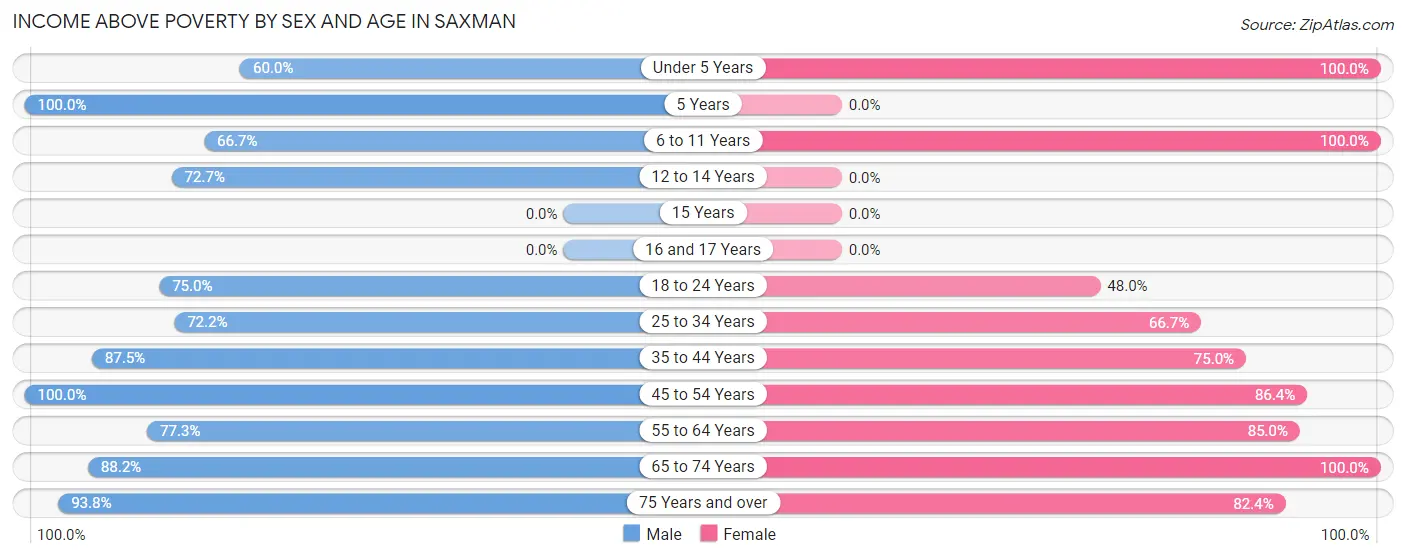
| Age Bracket | Male | Female |
| Under 5 Years | 3 (60.0%) | 13 (100.0%) |
| 5 Years | 3 (100.0%) | 0 (0.0%) |
| 6 to 11 Years | 6 (66.7%) | 11 (100.0%) |
| 12 to 14 Years | 8 (72.7%) | 0 (0.0%) |
| 15 Years | 0 (0.0%) | 0 (0.0%) |
| 16 and 17 Years | 0 (0.0%) | 0 (0.0%) |
| 18 to 24 Years | 9 (75.0%) | 12 (48.0%) |
| 25 to 34 Years | 13 (72.2%) | 12 (66.7%) |
| 35 to 44 Years | 14 (87.5%) | 9 (75.0%) |
| 45 to 54 Years | 52 (100.0%) | 19 (86.4%) |
| 55 to 64 Years | 17 (77.3%) | 17 (85.0%) |
| 65 to 74 Years | 15 (88.2%) | 20 (100.0%) |
| 75 Years and over | 30 (93.8%) | 14 (82.4%) |
| Total | 170 (85.4%) | 127 (78.4%) |
Income Below Poverty Among Married-Couple Families in Saxman
The poverty statistics for married-couple families in Saxman show that 4.0% or 1 of the total 25 families live below the poverty line. Families with 3 or 4 children have the highest poverty rate of 100.0%, comprising of 1 families. On the other hand, families with no children have the lowest poverty rate of 0.0%, which includes 0 families.
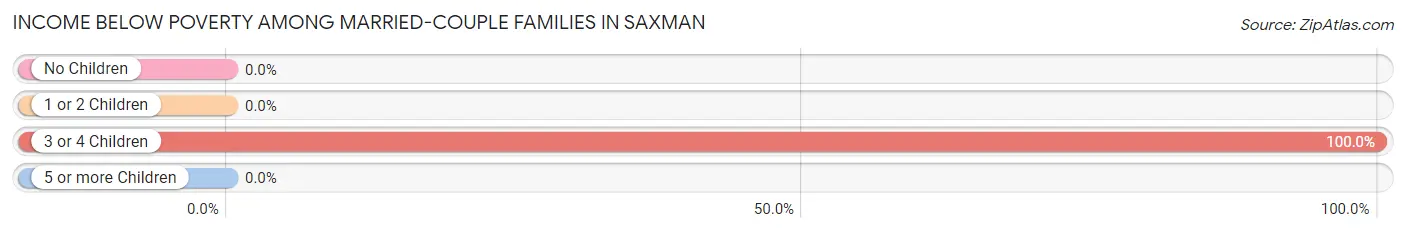
| Children | Above Poverty | Below Poverty |
| No Children | 15 (100.0%) | 0 (0.0%) |
| 1 or 2 Children | 8 (100.0%) | 0 (0.0%) |
| 3 or 4 Children | 0 (0.0%) | 1 (100.0%) |
| 5 or more Children | 1 (100.0%) | 0 (0.0%) |
| Total | 24 (96.0%) | 1 (4.0%) |
Income Below Poverty Among Single-Parent Households in Saxman
According to the poverty data in Saxman, 10.5% or 2 single-father households and 31.2% or 10 single-mother households are living below the poverty line. Among single-father households, those with no children have the highest poverty rate, with 2 households (10.5%) experiencing poverty. Likewise, among single-mother households, those with 1 or 2 children have the highest poverty rate, with 9 households (56.2%) falling below the poverty line.
| Children | Single Father | Single Mother |
| No Children | 2 (10.5%) | 1 (7.7%) |
| 1 or 2 Children | 0 (0.0%) | 9 (56.2%) |
| 3 or 4 Children | 0 (0.0%) | 0 (0.0%) |
| 5 or more Children | 0 (0.0%) | 0 (0.0%) |
| Total | 2 (10.5%) | 10 (31.2%) |
Income Below Poverty Among Married-Couple vs Single-Parent Households in Saxman
The poverty data for Saxman shows that 1 of the married-couple family households (4.0%) and 12 of the single-parent households (23.5%) are living below the poverty level. Within the married-couple family households, those with 3 or 4 children have the highest poverty rate, with 1 households (100.0%) falling below the poverty line. Among the single-parent households, those with 1 or 2 children have the highest poverty rate, with 9 household (56.2%) living below poverty.
| Children | Married-Couple Families | Single-Parent Households |
| No Children | 0 (0.0%) | 3 (9.4%) |
| 1 or 2 Children | 0 (0.0%) | 9 (56.2%) |
| 3 or 4 Children | 1 (100.0%) | 0 (0.0%) |
| 5 or more Children | 0 (0.0%) | 0 (0.0%) |
| Total | 1 (4.0%) | 12 (23.5%) |
Race in Saxman
The most populous races in Saxman are Native / Alaskan (266 | 73.7%), White / Caucasian (69 | 19.1%), and Two or more Races (26 | 7.2%).
| Race | # Population | % Population |
| Asian | 0 | 0.0% |
| Black / African American | 0 | 0.0% |
| Hawaiian / Pacific | 0 | 0.0% |
| Hispanic or Latino | 11 | 3.0% |
| Native / Alaskan | 266 | 73.7% |
| White / Caucasian | 69 | 19.1% |
| Two or more Races | 26 | 7.2% |
| Some other Race | 0 | 0.0% |
| Total | 361 | 100.0% |
Ancestry in Saxman
The most populous ancestries reported in Saxman are Tlingit-Haida (244 | 67.6%), Tsimshian (28 | 7.8%), Irish (26 | 7.2%), Alaska Native (15 | 4.2%), and Norwegian (14 | 3.9%), together accounting for 90.6% of all Saxman residents.
| Ancestry | # Population | % Population |
| Alaska Native | 15 | 4.2% |
| Alaskan Athabascan | 2 | 0.5% |
| Aleut | 2 | 0.5% |
| American | 9 | 2.5% |
| Cherokee | 1 | 0.3% |
| Dutch | 3 | 0.8% |
| Eastern European | 2 | 0.5% |
| English | 4 | 1.1% |
| French | 10 | 2.8% |
| German | 6 | 1.7% |
| Icelander | 3 | 0.8% |
| Inupiat | 12 | 3.3% |
| Irish | 26 | 7.2% |
| Italian | 9 | 2.5% |
| Mexican | 1 | 0.3% |
| Norwegian | 14 | 3.9% |
| Scandinavian | 4 | 1.1% |
| Swiss | 2 | 0.5% |
| Tlingit-Haida | 244 | 67.6% |
| Tsimshian | 28 | 7.8% |
| Yup'ik | 6 | 1.7% | View All 21 Rows |
Immigrants in Saxman
The most numerous immigrant groups reported in Saxman came from Europe (2 | 0.5%), and Northern Europe (2 | 0.5%), together accounting for 1.1% of all Saxman residents.
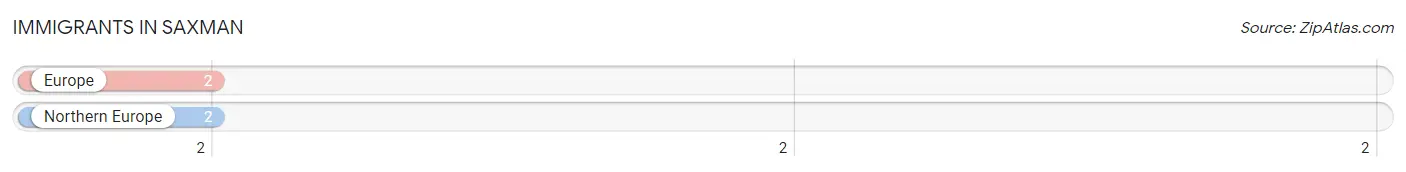
| Immigration Origin | # Population | % Population |
| Europe | 2 | 0.5% |
| Northern Europe | 2 | 0.5% | View All 2 Rows |
Sex and Age in Saxman
Sex and Age in Saxman
The most populous age groups in Saxman are 45 to 49 Years (37 | 18.6%) for men and 50 to 54 Years (16 | 9.9%) for women.
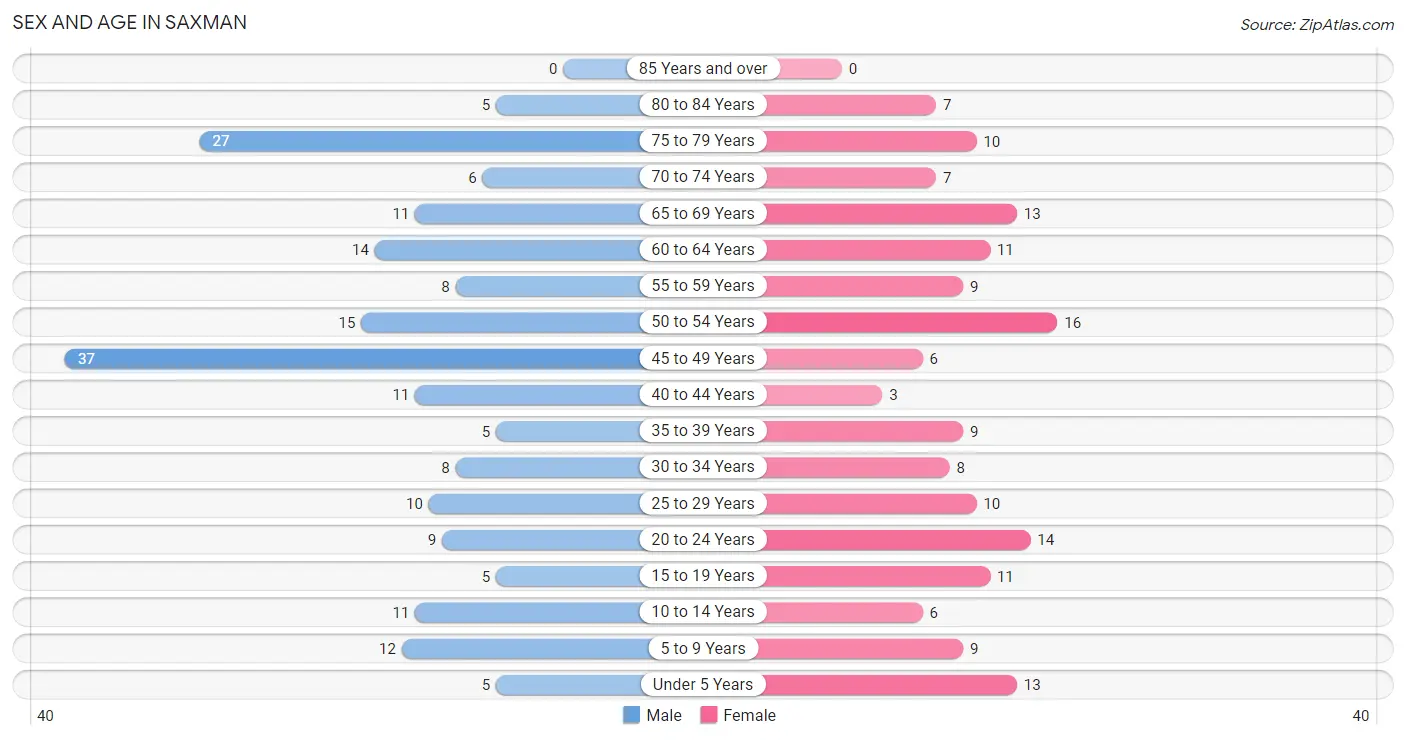
| Age Bracket | Male | Female |
| Under 5 Years | 5 (2.5%) | 13 (8.0%) |
| 5 to 9 Years | 12 (6.0%) | 9 (5.6%) |
| 10 to 14 Years | 11 (5.5%) | 6 (3.7%) |
| 15 to 19 Years | 5 (2.5%) | 11 (6.8%) |
| 20 to 24 Years | 9 (4.5%) | 14 (8.6%) |
| 25 to 29 Years | 10 (5.0%) | 10 (6.2%) |
| 30 to 34 Years | 8 (4.0%) | 8 (4.9%) |
| 35 to 39 Years | 5 (2.5%) | 9 (5.6%) |
| 40 to 44 Years | 11 (5.5%) | 3 (1.8%) |
| 45 to 49 Years | 37 (18.6%) | 6 (3.7%) |
| 50 to 54 Years | 15 (7.5%) | 16 (9.9%) |
| 55 to 59 Years | 8 (4.0%) | 9 (5.6%) |
| 60 to 64 Years | 14 (7.0%) | 11 (6.8%) |
| 65 to 69 Years | 11 (5.5%) | 13 (8.0%) |
| 70 to 74 Years | 6 (3.0%) | 7 (4.3%) |
| 75 to 79 Years | 27 (13.6%) | 10 (6.2%) |
| 80 to 84 Years | 5 (2.5%) | 7 (4.3%) |
| 85 Years and over | 0 (0.0%) | 0 (0.0%) |
| Total | 199 (100.0%) | 162 (100.0%) |
Families and Households in Saxman
Median Family Size in Saxman
The median family size in Saxman is 3.68 persons per family, with married-couple families (25 | 32.9%) accounting for the largest median family size of 4.6 persons per family. On the other hand, single female/mother families (32 | 42.1%) represent the smallest median family size with 3.19 persons per family.
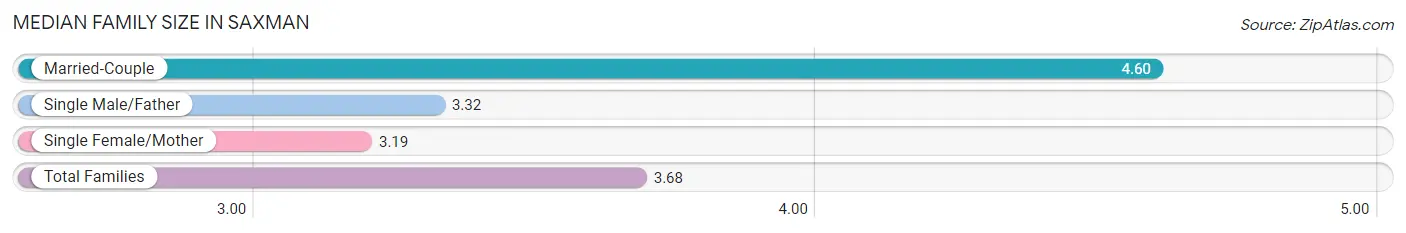
| Family Type | # Families | Family Size |
| Married-Couple | 25 (32.9%) | 4.60 |
| Single Male/Father | 19 (25.0%) | 3.32 |
| Single Female/Mother | 32 (42.1%) | 3.19 |
| Total Families | 76 (100.0%) | 3.68 |
Median Household Size in Saxman
The median household size in Saxman is 3.03 persons per household, with married-couple households (25 | 21.2%) accounting for the largest median household size of 4.96 persons per household. non-family households (42 | 35.6%) represent the smallest median household size with 1.29 persons per household.
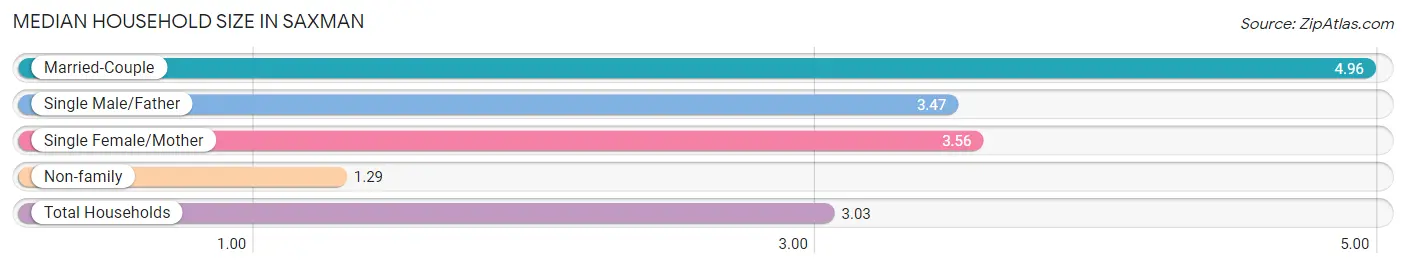
| Household Type | # Households | Household Size |
| Married-Couple | 25 (21.2%) | 4.96 |
| Single Male/Father | 19 (16.1%) | 3.47 |
| Single Female/Mother | 32 (27.1%) | 3.56 |
| Non-family | 42 (35.6%) | 1.29 |
| Total Households | 118 (100.0%) | 3.03 |
Household Size by Marriage Status in Saxman
Out of a total of 118 households in Saxman, 76 (64.4%) are family households, while 42 (35.6%) are nonfamily households. The most numerous type of family households are 2-person households, comprising 29, and the most common type of nonfamily households are 1-person households, comprising 34.
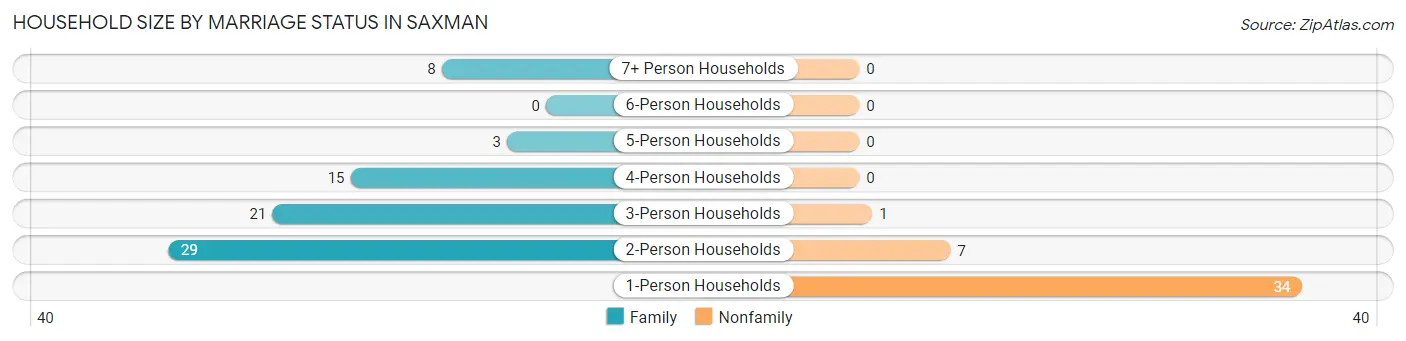
| Household Size | Family Households | Nonfamily Households |
| 1-Person Households | - | 34 (28.8%) |
| 2-Person Households | 29 (24.6%) | 7 (5.9%) |
| 3-Person Households | 21 (17.8%) | 1 (0.9%) |
| 4-Person Households | 15 (12.7%) | 0 (0.0%) |
| 5-Person Households | 3 (2.5%) | 0 (0.0%) |
| 6-Person Households | 0 (0.0%) | 0 (0.0%) |
| 7+ Person Households | 8 (6.8%) | 0 (0.0%) |
| Total | 76 (64.4%) | 42 (35.6%) |
Female Fertility in Saxman
Fertility by Age in Saxman
| Age Bracket | Women with Births | Births / 1,000 Women |
| 15 to 19 years | 0 (0.0%) | 0.0 |
| 20 to 34 years | 0 (0.0%) | 0.0 |
| 35 to 50 years | 0 (0.0%) | 0.0 |
| Total | 0 (0.0%) | 0.0 |
Fertility by Age by Marriage Status in Saxman
| Age Bracket | Married | Unmarried |
| 15 to 19 years | 0 (0.0%) | 0 (0.0%) |
| 20 to 34 years | 0 (0.0%) | 0 (0.0%) |
| 35 to 50 years | 0 (0.0%) | 0 (0.0%) |
| Total | 0 (0.0%) | 0 (0.0%) |
Fertility by Education in Saxman
| Educational Attainment | Women with Births | Births / 1,000 Women |
| Less than High School | 0 (0.0%) | 0.0 |
| High School Diploma | 0 (0.0%) | 0.0 |
| College or Associate's Degree | 0 (0.0%) | 0.0 |
| Bachelor's Degree | 0 (0.0%) | 0.0 |
| Graduate Degree | 0 (0.0%) | 0.0 |
| Total | 0 (0.0%) | 0.0 |
Fertility by Education by Marriage Status in Saxman
| Educational Attainment | Married | Unmarried |
| Less than High School | 0 (0.0%) | 0 (0.0%) |
| High School Diploma | 0 (0.0%) | 0 (0.0%) |
| College or Associate's Degree | 0 (0.0%) | 0 (0.0%) |
| Bachelor's Degree | 0 (0.0%) | 0 (0.0%) |
| Graduate Degree | 0 (0.0%) | 0 (0.0%) |
| Total | 0 (0.0%) | 0 (0.0%) |
Employment Characteristics in Saxman
Employment by Class of Employer in Saxman
Among the 95 employed individuals in Saxman, private company employees (53 | 55.8%), not-for-profit organizations (16 | 16.8%), and local government employees (8 | 8.4%) make up the most common classes of employment.
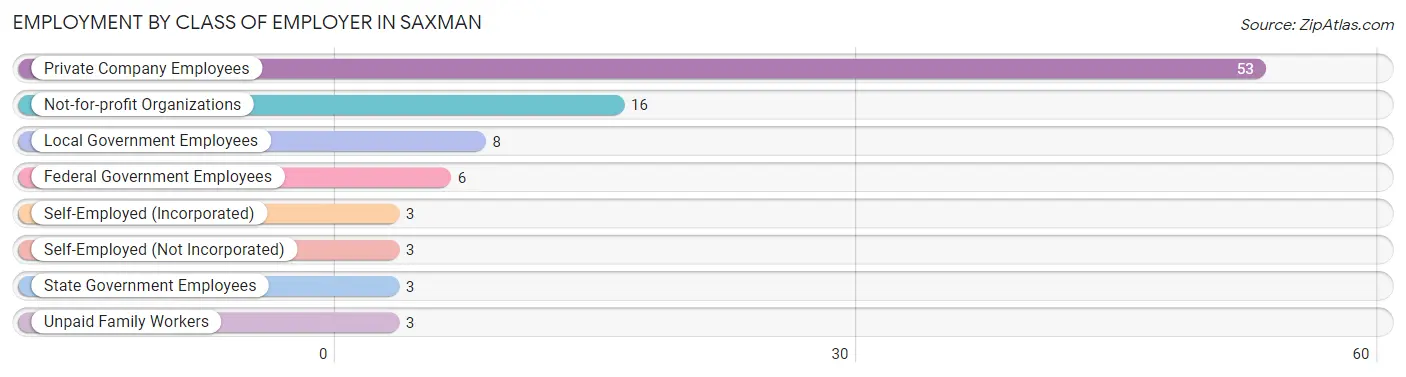
| Employer Class | # Employees | % Employees |
| Private Company Employees | 53 | 55.8% |
| Self-Employed (Incorporated) | 3 | 3.2% |
| Self-Employed (Not Incorporated) | 3 | 3.2% |
| Not-for-profit Organizations | 16 | 16.8% |
| Local Government Employees | 8 | 8.4% |
| State Government Employees | 3 | 3.2% |
| Federal Government Employees | 6 | 6.3% |
| Unpaid Family Workers | 3 | 3.2% |
| Total | 95 | 100.0% |
Employment Status by Age in Saxman
According to the labor force statistics for Saxman, out of the total population over 16 years of age (305), 39.7% or 121 individuals are in the labor force, with 14.0% or 17 of them unemployed. The age group with the highest labor force participation rate is 20 to 24 years, with 73.9% or 17 individuals in the labor force. Within the labor force, the 30 to 34 years age range has the highest percentage of unemployed individuals, with 50.0% or 4 of them being unemployed.
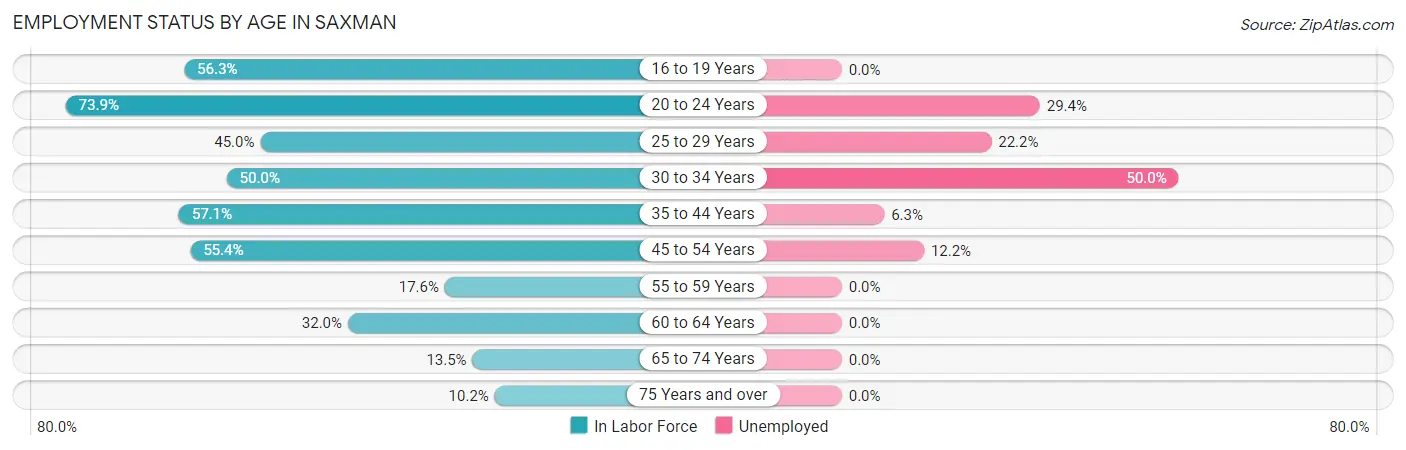
| Age Bracket | In Labor Force | Unemployed |
| 16 to 19 Years | 9 (56.3%) | 0 (0.0%) |
| 20 to 24 Years | 17 (73.9%) | 5 (29.4%) |
| 25 to 29 Years | 9 (45.0%) | 2 (22.2%) |
| 30 to 34 Years | 8 (50.0%) | 4 (50.0%) |
| 35 to 44 Years | 16 (57.1%) | 1 (6.3%) |
| 45 to 54 Years | 41 (55.4%) | 5 (12.2%) |
| 55 to 59 Years | 3 (17.6%) | 0 (0.0%) |
| 60 to 64 Years | 8 (32.0%) | 0 (0.0%) |
| 65 to 74 Years | 5 (13.5%) | 0 (0.0%) |
| 75 Years and over | 5 (10.2%) | 0 (0.0%) |
| Total | 121 (39.7%) | 17 (14.0%) |
Employment Status by Educational Attainment in Saxman
According to labor force statistics for Saxman, 47.2% of individuals (85) out of the total population between 25 and 64 years of age (180) are in the labor force, with 14.1% or 12 of them being unemployed. The group with the highest labor force participation rate are those with the educational attainment of bachelor's degree or higher, with 77.8% or 7 individuals in the labor force. Within the labor force, individuals with less than high school education have the highest percentage of unemployment, with 50.0% or 2 of them being unemployed.
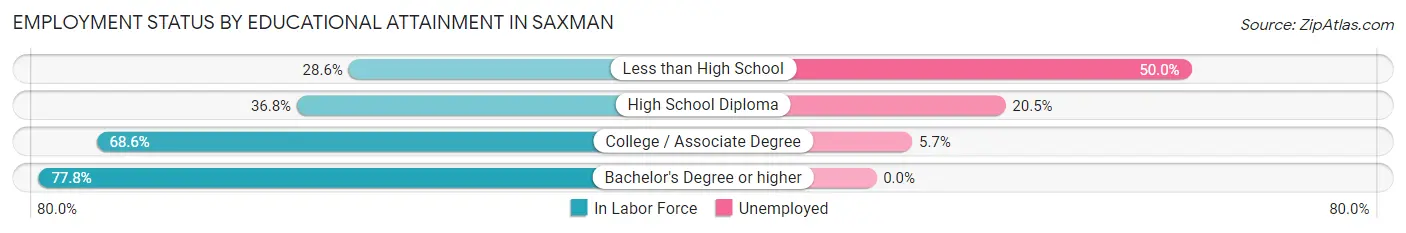
| Educational Attainment | In Labor Force | Unemployed |
| Less than High School | 4 (28.6%) | 7 (50.0%) |
| High School Diploma | 39 (36.8%) | 22 (20.5%) |
| College / Associate Degree | 35 (68.6%) | 3 (5.7%) |
| Bachelor's Degree or higher | 7 (77.8%) | 0 (0.0%) |
| Total | 85 (47.2%) | 25 (14.1%) |
Employment Occupations by Sex in Saxman
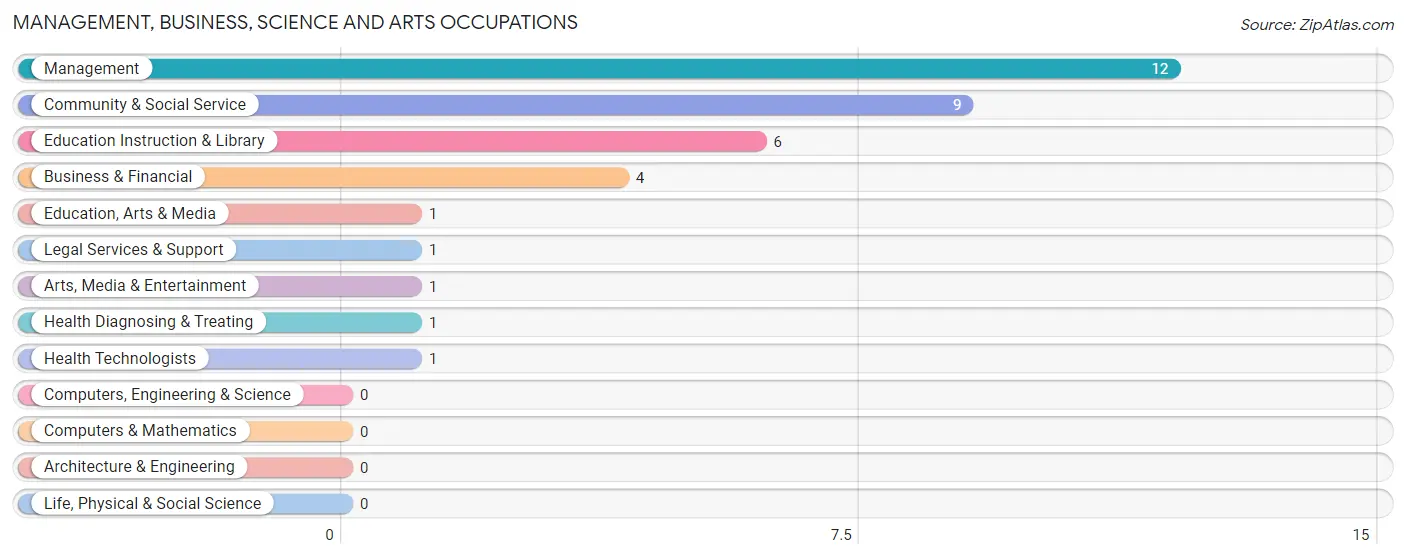
Management, Business, Science and Arts Occupations
The most common Management, Business, Science and Arts occupations in Saxman are Management (12 | 11.5%), Community & Social Service (9 | 8.6%), Education Instruction & Library (6 | 5.8%), Business & Financial (4 | 3.8%), and Education, Arts & Media (1 | 1.0%).
Management, Business, Science and Arts Occupations by Sex
Within the Management, Business, Science and Arts occupations in Saxman, the most male-oriented occupations are Arts, Media & Entertainment (100.0%), Health Diagnosing & Treating (100.0%), and Health Technologists (100.0%), while the most female-oriented occupations are Education, Arts & Media (100.0%), Legal Services & Support (100.0%), and Education Instruction & Library (100.0%).
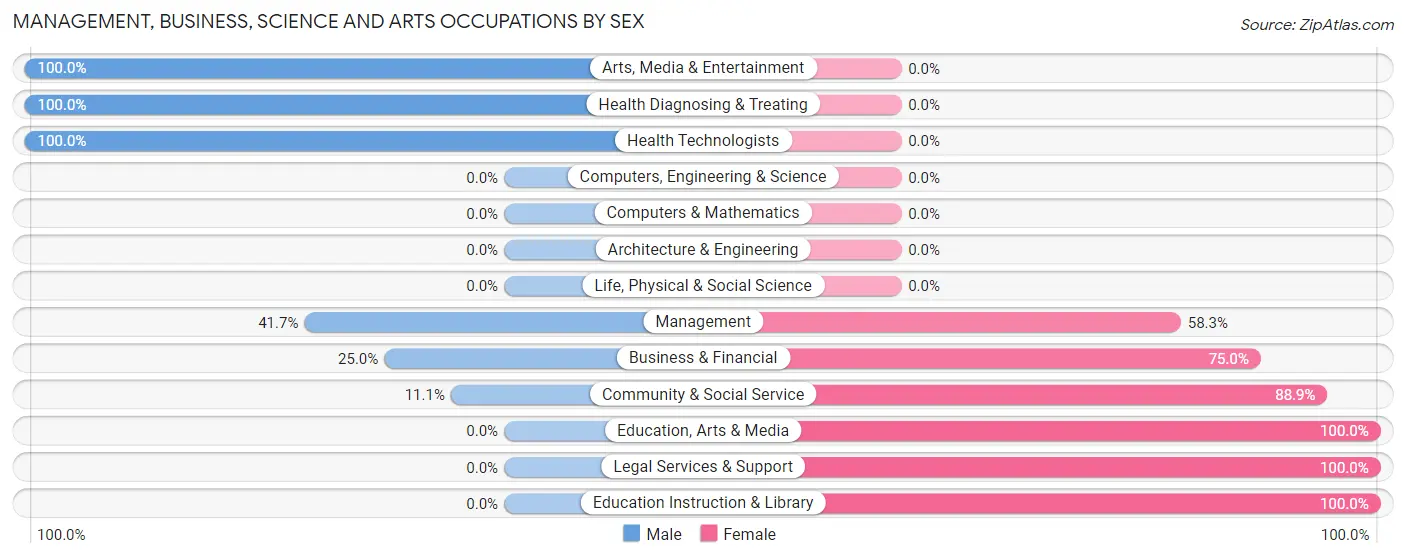
| Occupation | Male | Female |
| Management | 5 (41.7%) | 7 (58.3%) |
| Business & Financial | 1 (25.0%) | 3 (75.0%) |
| Computers, Engineering & Science | 0 (0.0%) | 0 (0.0%) |
| Computers & Mathematics | 0 (0.0%) | 0 (0.0%) |
| Architecture & Engineering | 0 (0.0%) | 0 (0.0%) |
| Life, Physical & Social Science | 0 (0.0%) | 0 (0.0%) |
| Community & Social Service | 1 (11.1%) | 8 (88.9%) |
| Education, Arts & Media | 0 (0.0%) | 1 (100.0%) |
| Legal Services & Support | 0 (0.0%) | 1 (100.0%) |
| Education Instruction & Library | 0 (0.0%) | 6 (100.0%) |
| Arts, Media & Entertainment | 1 (100.0%) | 0 (0.0%) |
| Health Diagnosing & Treating | 1 (100.0%) | 0 (0.0%) |
| Health Technologists | 1 (100.0%) | 0 (0.0%) |
| Total (Category) | 8 (30.8%) | 18 (69.2%) |
| Total (Overall) | 48 (46.2%) | 56 (53.8%) |
Services Occupations
The most common Services occupations in Saxman are Food Preparation & Serving (7 | 6.7%), Personal Care & Service (7 | 6.7%), Cleaning & Maintenance (4 | 3.8%), Security & Protection (2 | 1.9%), and Law Enforcement (2 | 1.9%).
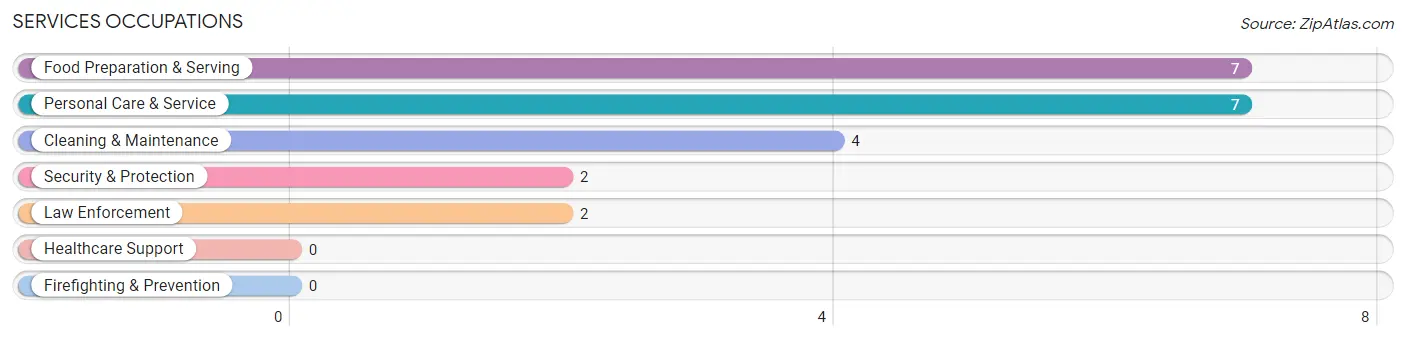
Services Occupations by Sex
Within the Services occupations in Saxman, the most male-oriented occupations are Security & Protection (100.0%), Law Enforcement (100.0%), and Food Preparation & Serving (71.4%), while the most female-oriented occupations are Personal Care & Service (100.0%), Cleaning & Maintenance (50.0%), and Food Preparation & Serving (28.6%).
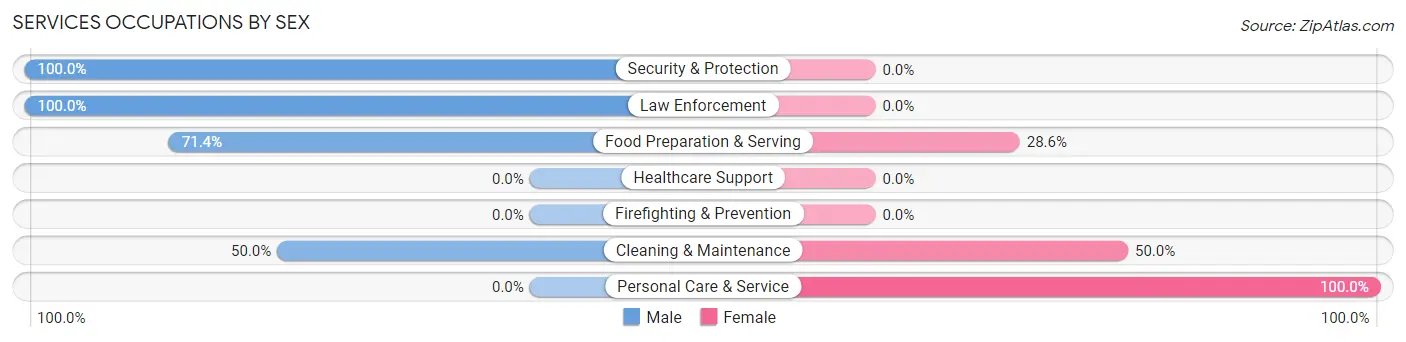
| Occupation | Male | Female |
| Healthcare Support | 0 (0.0%) | 0 (0.0%) |
| Security & Protection | 2 (100.0%) | 0 (0.0%) |
| Firefighting & Prevention | 0 (0.0%) | 0 (0.0%) |
| Law Enforcement | 2 (100.0%) | 0 (0.0%) |
| Food Preparation & Serving | 5 (71.4%) | 2 (28.6%) |
| Cleaning & Maintenance | 2 (50.0%) | 2 (50.0%) |
| Personal Care & Service | 0 (0.0%) | 7 (100.0%) |
| Total (Category) | 9 (45.0%) | 11 (55.0%) |
| Total (Overall) | 48 (46.2%) | 56 (53.8%) |
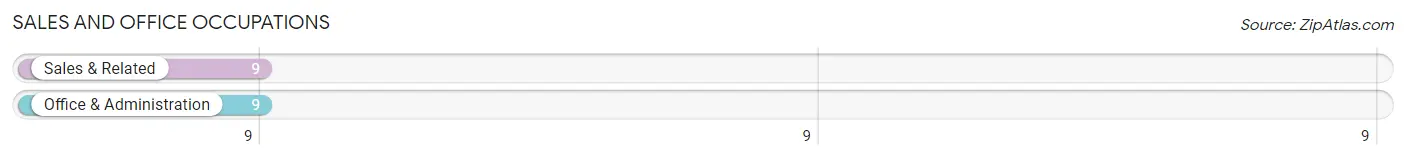
Sales and Office Occupations
The most common Sales and Office occupations in Saxman are Sales & Related (9 | 8.6%), and Office & Administration (9 | 8.6%).
Sales and Office Occupations by Sex
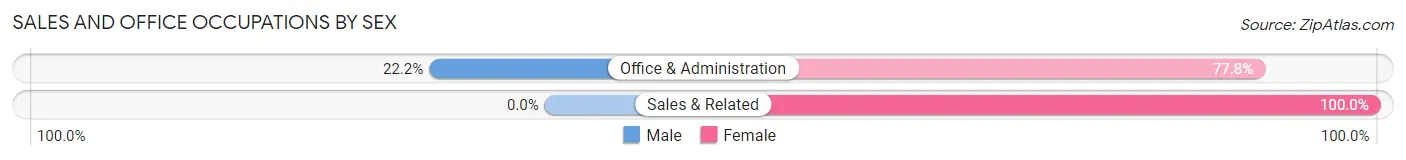
| Occupation | Male | Female |
| Sales & Related | 0 (0.0%) | 9 (100.0%) |
| Office & Administration | 2 (22.2%) | 7 (77.8%) |
| Total (Category) | 2 (11.1%) | 16 (88.9%) |
| Total (Overall) | 48 (46.2%) | 56 (53.8%) |
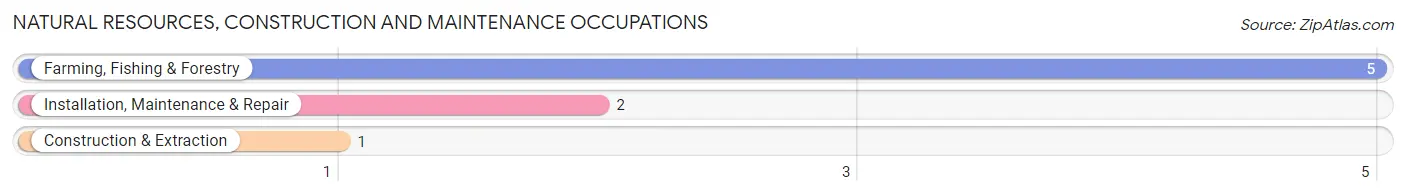
Natural Resources, Construction and Maintenance Occupations
The most common Natural Resources, Construction and Maintenance occupations in Saxman are Farming, Fishing & Forestry (5 | 4.8%), Installation, Maintenance & Repair (2 | 1.9%), and Construction & Extraction (1 | 1.0%).
Natural Resources, Construction and Maintenance Occupations by Sex
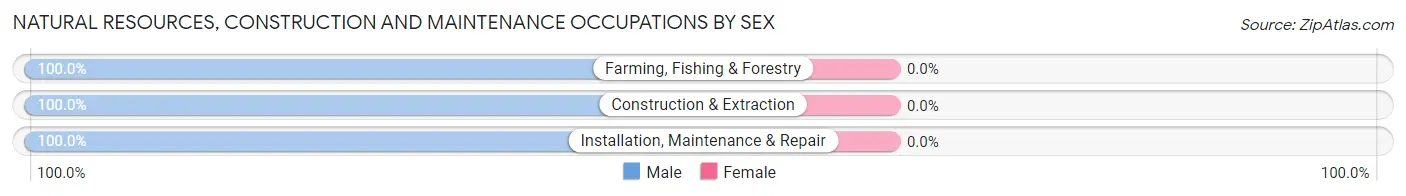
| Occupation | Male | Female |
| Farming, Fishing & Forestry | 5 (100.0%) | 0 (0.0%) |
| Construction & Extraction | 1 (100.0%) | 0 (0.0%) |
| Installation, Maintenance & Repair | 2 (100.0%) | 0 (0.0%) |
| Total (Category) | 8 (100.0%) | 0 (0.0%) |
| Total (Overall) | 48 (46.2%) | 56 (53.8%) |
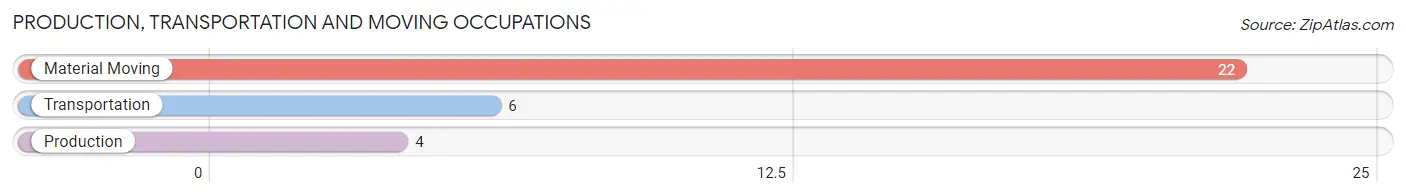
Production, Transportation and Moving Occupations
The most common Production, Transportation and Moving occupations in Saxman are Material Moving (22 | 21.1%), Transportation (6 | 5.8%), and Production (4 | 3.8%).
Production, Transportation and Moving Occupations by Sex
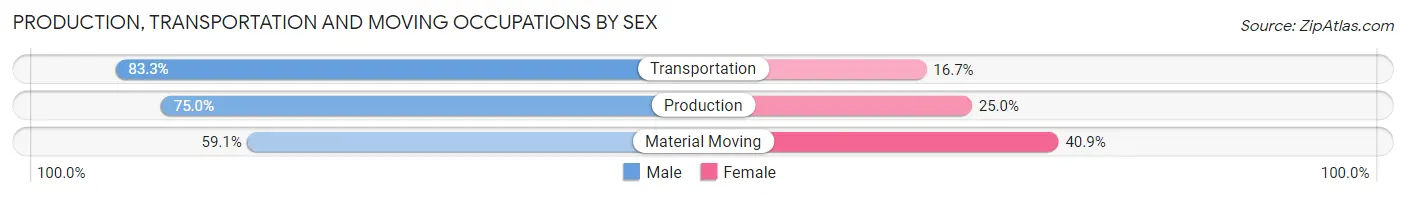
| Occupation | Male | Female |
| Production | 3 (75.0%) | 1 (25.0%) |
| Transportation | 5 (83.3%) | 1 (16.7%) |
| Material Moving | 13 (59.1%) | 9 (40.9%) |
| Total (Category) | 21 (65.6%) | 11 (34.4%) |
| Total (Overall) | 48 (46.2%) | 56 (53.8%) |
Employment Industries by Sex in Saxman
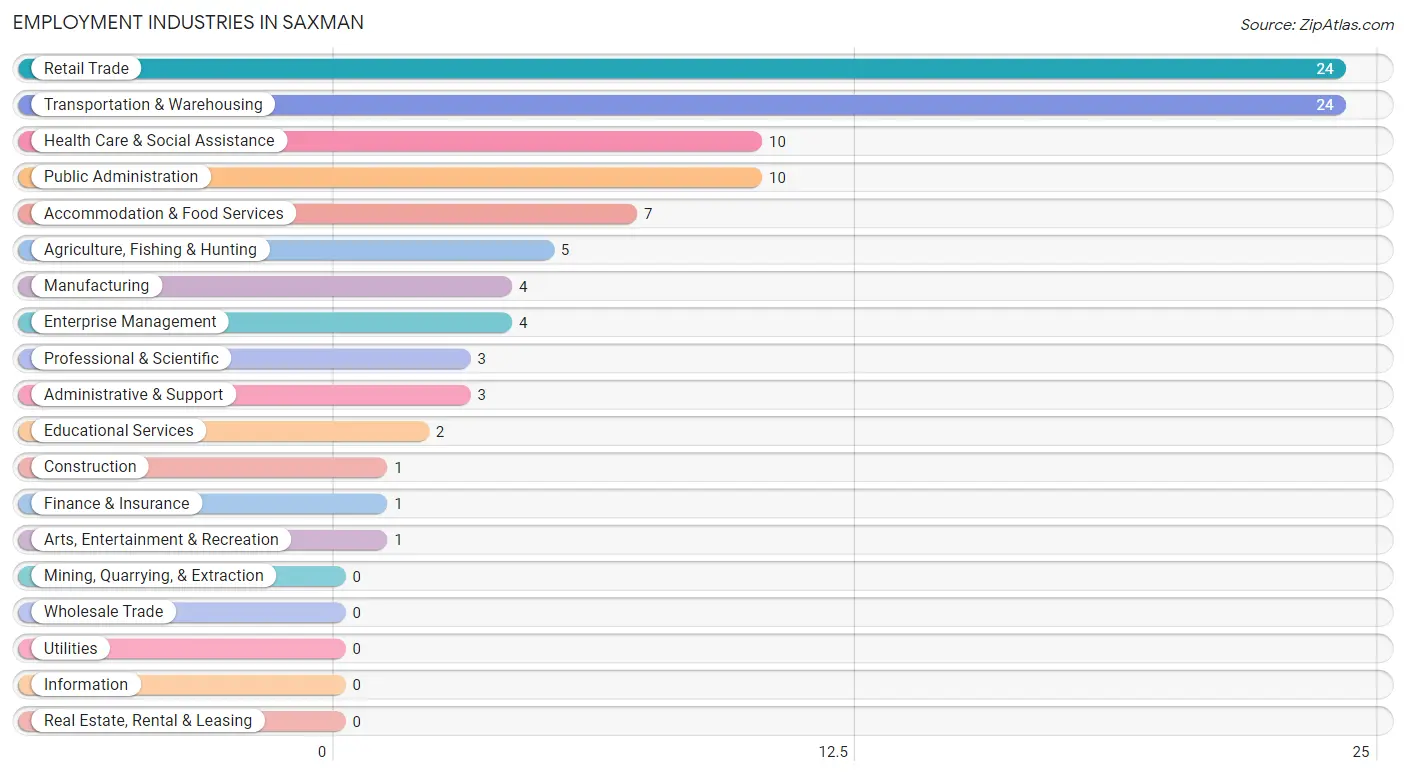
Employment Industries in Saxman
The major employment industries in Saxman include Retail Trade (24 | 23.1%), Transportation & Warehousing (24 | 23.1%), Health Care & Social Assistance (10 | 9.6%), Public Administration (10 | 9.6%), and Accommodation & Food Services (7 | 6.7%).
Employment Industries by Sex in Saxman
The Saxman industries that see more men than women are Agriculture, Fishing & Hunting (100.0%), Construction (100.0%), and Professional & Scientific (100.0%), whereas the industries that tend to have a higher number of women are Finance & Insurance (100.0%), Educational Services (100.0%), and Arts, Entertainment & Recreation (100.0%).
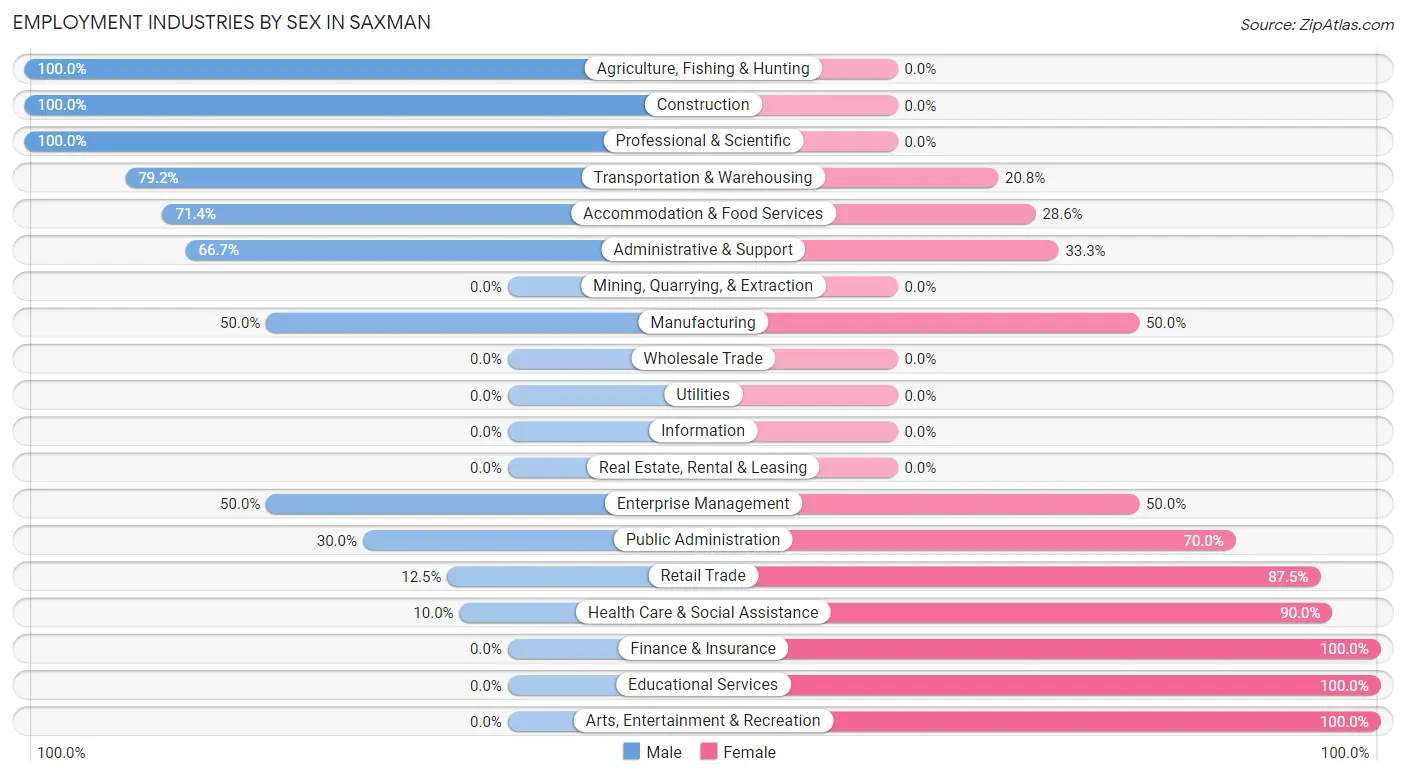
| Industry | Male | Female |
| Agriculture, Fishing & Hunting | 5 (100.0%) | 0 (0.0%) |
| Mining, Quarrying, & Extraction | 0 (0.0%) | 0 (0.0%) |
| Construction | 1 (100.0%) | 0 (0.0%) |
| Manufacturing | 2 (50.0%) | 2 (50.0%) |
| Wholesale Trade | 0 (0.0%) | 0 (0.0%) |
| Retail Trade | 3 (12.5%) | 21 (87.5%) |
| Transportation & Warehousing | 19 (79.2%) | 5 (20.8%) |
| Utilities | 0 (0.0%) | 0 (0.0%) |
| Information | 0 (0.0%) | 0 (0.0%) |
| Finance & Insurance | 0 (0.0%) | 1 (100.0%) |
| Real Estate, Rental & Leasing | 0 (0.0%) | 0 (0.0%) |
| Professional & Scientific | 3 (100.0%) | 0 (0.0%) |
| Enterprise Management | 2 (50.0%) | 2 (50.0%) |
| Administrative & Support | 2 (66.7%) | 1 (33.3%) |
| Educational Services | 0 (0.0%) | 2 (100.0%) |
| Health Care & Social Assistance | 1 (10.0%) | 9 (90.0%) |
| Arts, Entertainment & Recreation | 0 (0.0%) | 1 (100.0%) |
| Accommodation & Food Services | 5 (71.4%) | 2 (28.6%) |
| Public Administration | 3 (30.0%) | 7 (70.0%) |
| Total | 48 (46.2%) | 56 (53.8%) |
Education in Saxman
School Enrollment in Saxman
The most common levels of schooling among the 55 students in Saxman are high school (20 | 36.4%), elementary school (17 | 30.9%), and middle school (9 | 16.4%).
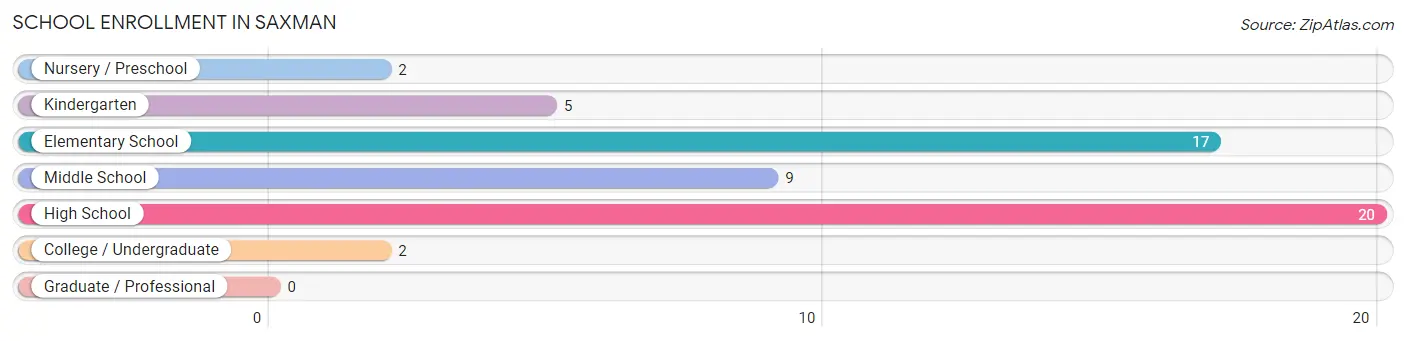
| School Level | # Students | % Students |
| Nursery / Preschool | 2 | 3.6% |
| Kindergarten | 5 | 9.1% |
| Elementary School | 17 | 30.9% |
| Middle School | 9 | 16.4% |
| High School | 20 | 36.4% |
| College / Undergraduate | 2 | 3.6% |
| Graduate / Professional | 0 | 0.0% |
| Total | 55 | 100.0% |
School Enrollment by Age by Funding Source in Saxman
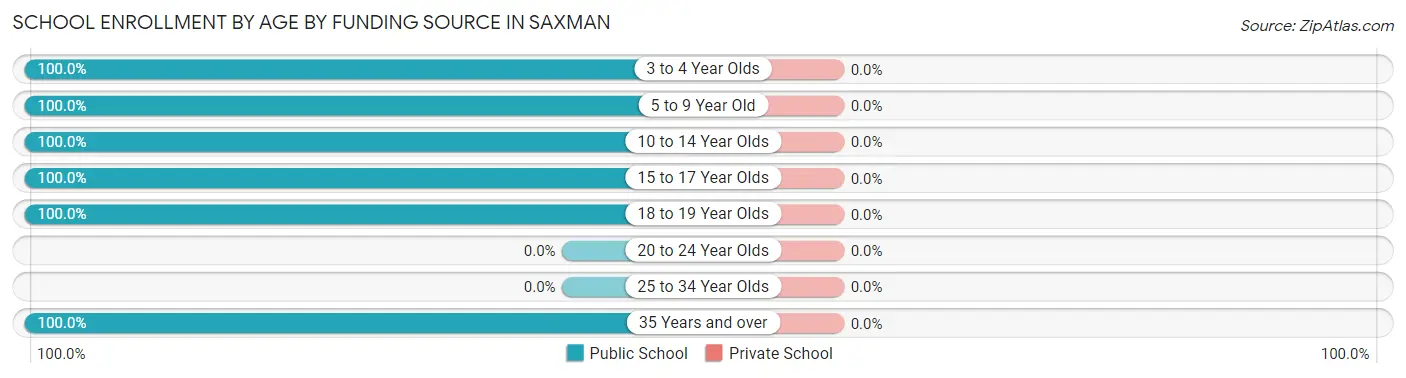
| Age Bracket | Public School | Private School |
| 3 to 4 Year Olds | 2 (100.0%) | 0 (0.0%) |
| 5 to 9 Year Old | 21 (100.0%) | 0 (0.0%) |
| 10 to 14 Year Olds | 17 (100.0%) | 0 (0.0%) |
| 15 to 17 Year Olds | 2 (100.0%) | 0 (0.0%) |
| 18 to 19 Year Olds | 11 (100.0%) | 0 (0.0%) |
| 20 to 24 Year Olds | 0 (0.0%) | 0 (0.0%) |
| 25 to 34 Year Olds | 0 (0.0%) | 0 (0.0%) |
| 35 Years and over | 2 (100.0%) | 0 (0.0%) |
| Total | 55 (100.0%) | 0 (0.0%) |
Educational Attainment by Field of Study in Saxman
Science & technology (5 | 38.5%), business (2 | 15.4%), arts & humanities (2 | 15.4%), bio, nature & agricultural (1 | 7.7%), and physical & health sciences (1 | 7.7%) are the most common fields of study among 13 individuals in Saxman who have obtained a bachelor's degree or higher.
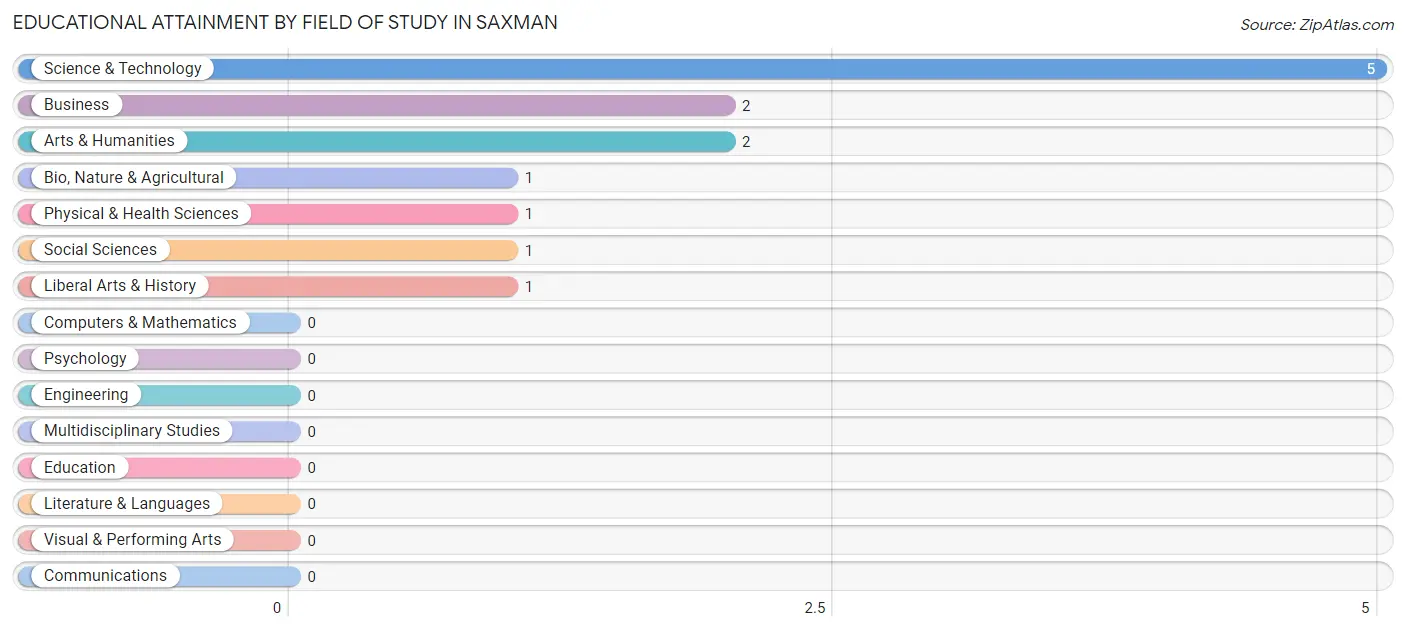
| Field of Study | # Graduates | % Graduates |
| Computers & Mathematics | 0 | 0.0% |
| Bio, Nature & Agricultural | 1 | 7.7% |
| Physical & Health Sciences | 1 | 7.7% |
| Psychology | 0 | 0.0% |
| Social Sciences | 1 | 7.7% |
| Engineering | 0 | 0.0% |
| Multidisciplinary Studies | 0 | 0.0% |
| Science & Technology | 5 | 38.5% |
| Business | 2 | 15.4% |
| Education | 0 | 0.0% |
| Literature & Languages | 0 | 0.0% |
| Liberal Arts & History | 1 | 7.7% |
| Visual & Performing Arts | 0 | 0.0% |
| Communications | 0 | 0.0% |
| Arts & Humanities | 2 | 15.4% |
| Total | 13 | 100.0% |
Transportation & Commute in Saxman
Vehicle Availability by Sex in Saxman
The most prevalent vehicle ownership categories in Saxman are males with 2 vehicles (17, accounting for 41.5%) and females with 2 vehicles (21, making up 32.7%).
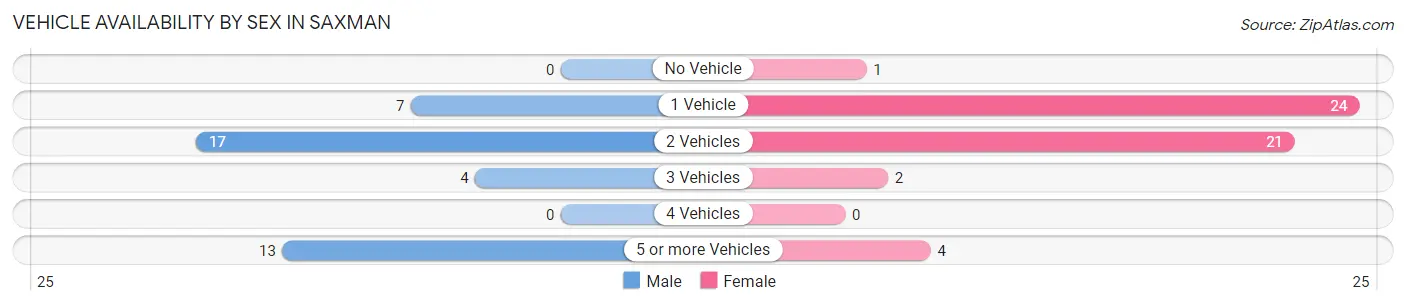
| Vehicles Available | Male | Female |
| No Vehicle | 0 (0.0%) | 1 (1.9%) |
| 1 Vehicle | 7 (17.1%) | 24 (46.2%) |
| 2 Vehicles | 17 (41.5%) | 21 (40.4%) |
| 3 Vehicles | 4 (9.8%) | 2 (3.8%) |
| 4 Vehicles | 0 (0.0%) | 0 (0.0%) |
| 5 or more Vehicles | 13 (31.7%) | 4 (7.7%) |
| Total | 41 (100.0%) | 52 (100.0%) |
Commute Time in Saxman
The most frequently occuring commute durations in Saxman are 20 to 24 minutes (30 commuters, 33.0%), 15 to 19 minutes (24 commuters, 26.4%), and 10 to 14 minutes (15 commuters, 16.5%).
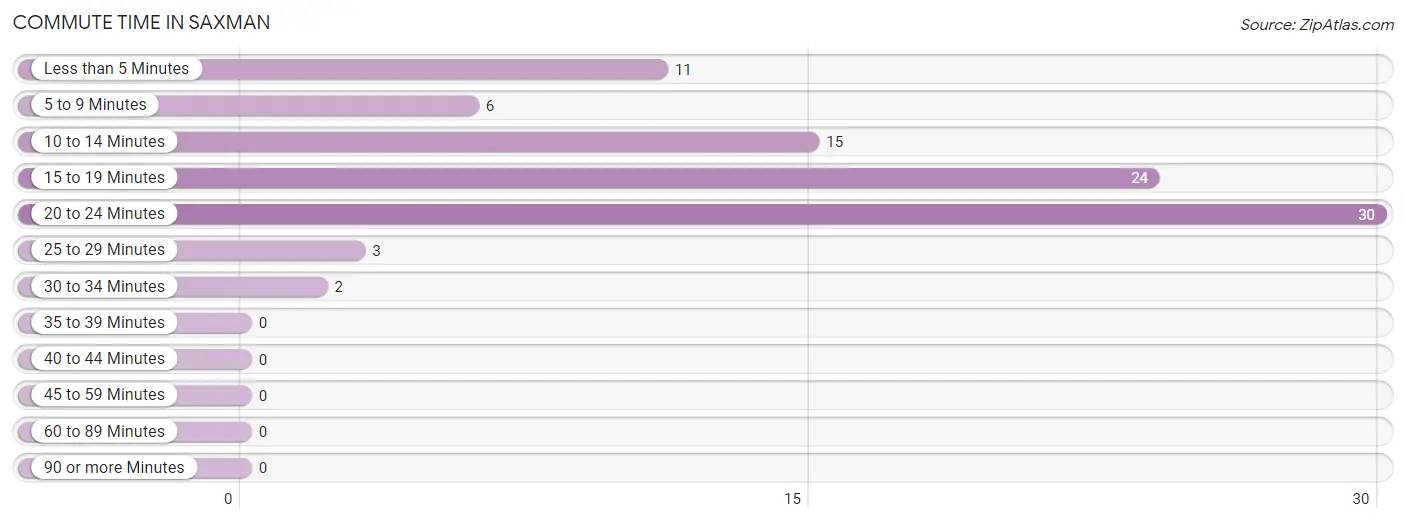
| Commute Time | # Commuters | % Commuters |
| Less than 5 Minutes | 11 | 12.1% |
| 5 to 9 Minutes | 6 | 6.6% |
| 10 to 14 Minutes | 15 | 16.5% |
| 15 to 19 Minutes | 24 | 26.4% |
| 20 to 24 Minutes | 30 | 33.0% |
| 25 to 29 Minutes | 3 | 3.3% |
| 30 to 34 Minutes | 2 | 2.2% |
| 35 to 39 Minutes | 0 | 0.0% |
| 40 to 44 Minutes | 0 | 0.0% |
| 45 to 59 Minutes | 0 | 0.0% |
| 60 to 89 Minutes | 0 | 0.0% |
| 90 or more Minutes | 0 | 0.0% |
Commute Time by Sex in Saxman
The most common commute times in Saxman are 20 to 24 minutes (19 commuters, 44.2%) for males and 15 to 19 minutes (13 commuters, 27.1%) for females.
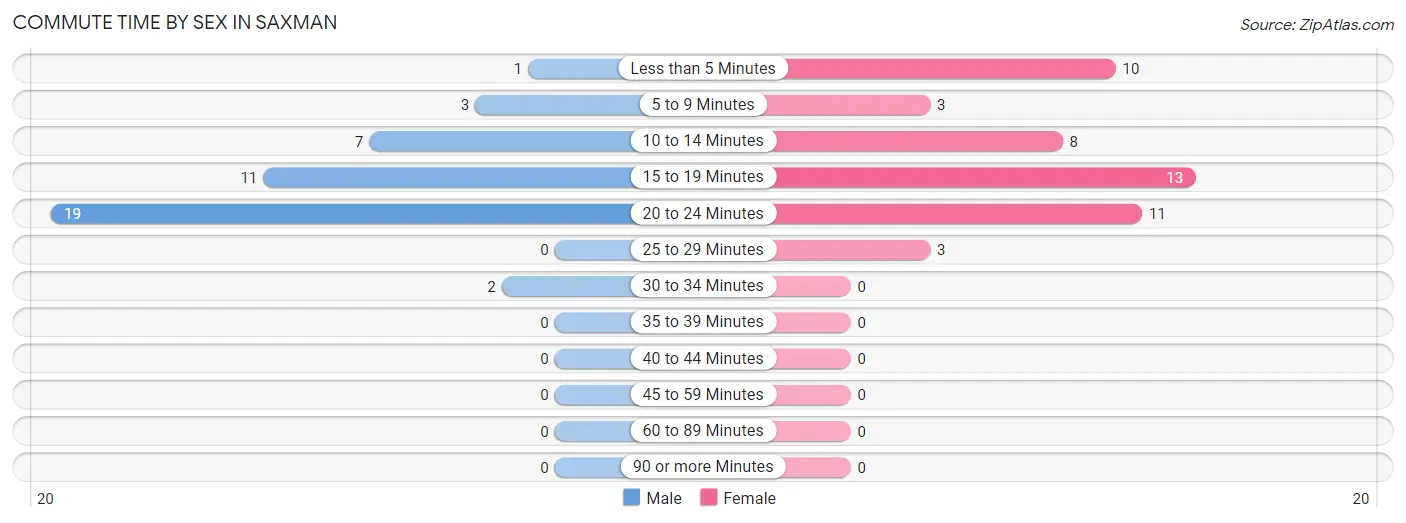
| Commute Time | Male | Female |
| Less than 5 Minutes | 1 (2.3%) | 10 (20.8%) |
| 5 to 9 Minutes | 3 (7.0%) | 3 (6.2%) |
| 10 to 14 Minutes | 7 (16.3%) | 8 (16.7%) |
| 15 to 19 Minutes | 11 (25.6%) | 13 (27.1%) |
| 20 to 24 Minutes | 19 (44.2%) | 11 (22.9%) |
| 25 to 29 Minutes | 0 (0.0%) | 3 (6.2%) |
| 30 to 34 Minutes | 2 (4.6%) | 0 (0.0%) |
| 35 to 39 Minutes | 0 (0.0%) | 0 (0.0%) |
| 40 to 44 Minutes | 0 (0.0%) | 0 (0.0%) |
| 45 to 59 Minutes | 0 (0.0%) | 0 (0.0%) |
| 60 to 89 Minutes | 0 (0.0%) | 0 (0.0%) |
| 90 or more Minutes | 0 (0.0%) | 0 (0.0%) |
Time of Departure to Work by Sex in Saxman
The most frequent times of departure to work in Saxman are 6:30 AM to 6:59 AM (13, 30.2%) for males and 10:00 AM to 10:59 AM (11, 22.9%) for females.
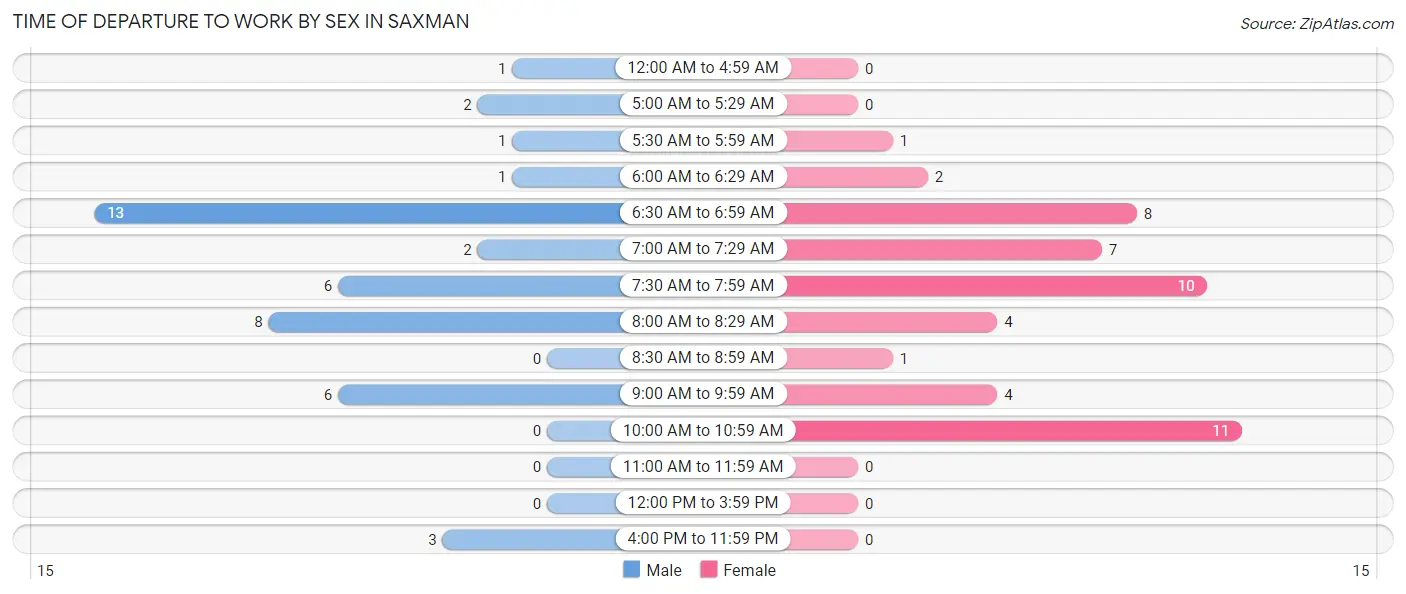
| Time of Departure | Male | Female |
| 12:00 AM to 4:59 AM | 1 (2.3%) | 0 (0.0%) |
| 5:00 AM to 5:29 AM | 2 (4.6%) | 0 (0.0%) |
| 5:30 AM to 5:59 AM | 1 (2.3%) | 1 (2.1%) |
| 6:00 AM to 6:29 AM | 1 (2.3%) | 2 (4.2%) |
| 6:30 AM to 6:59 AM | 13 (30.2%) | 8 (16.7%) |
| 7:00 AM to 7:29 AM | 2 (4.6%) | 7 (14.6%) |
| 7:30 AM to 7:59 AM | 6 (14.0%) | 10 (20.8%) |
| 8:00 AM to 8:29 AM | 8 (18.6%) | 4 (8.3%) |
| 8:30 AM to 8:59 AM | 0 (0.0%) | 1 (2.1%) |
| 9:00 AM to 9:59 AM | 6 (14.0%) | 4 (8.3%) |
| 10:00 AM to 10:59 AM | 0 (0.0%) | 11 (22.9%) |
| 11:00 AM to 11:59 AM | 0 (0.0%) | 0 (0.0%) |
| 12:00 PM to 3:59 PM | 0 (0.0%) | 0 (0.0%) |
| 4:00 PM to 11:59 PM | 3 (7.0%) | 0 (0.0%) |
| Total | 43 (100.0%) | 48 (100.0%) |
Housing Occupancy in Saxman
Occupancy by Ownership in Saxman
Of the total 118 dwellings in Saxman, owner-occupied units account for 79 (66.9%), while renter-occupied units make up 39 (33.1%).
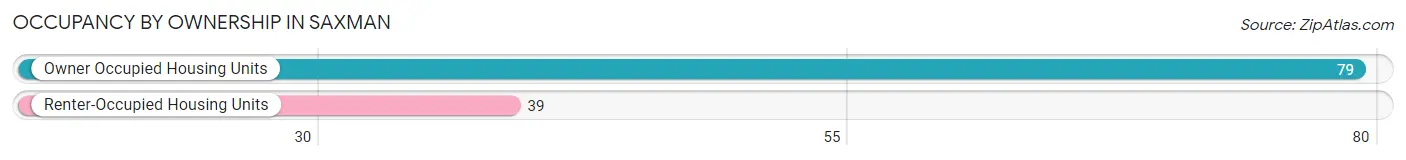
| Occupancy | # Housing Units | % Housing Units |
| Owner Occupied Housing Units | 79 | 66.9% |
| Renter-Occupied Housing Units | 39 | 33.1% |
| Total Occupied Housing Units | 118 | 100.0% |
Occupancy by Household Size in Saxman
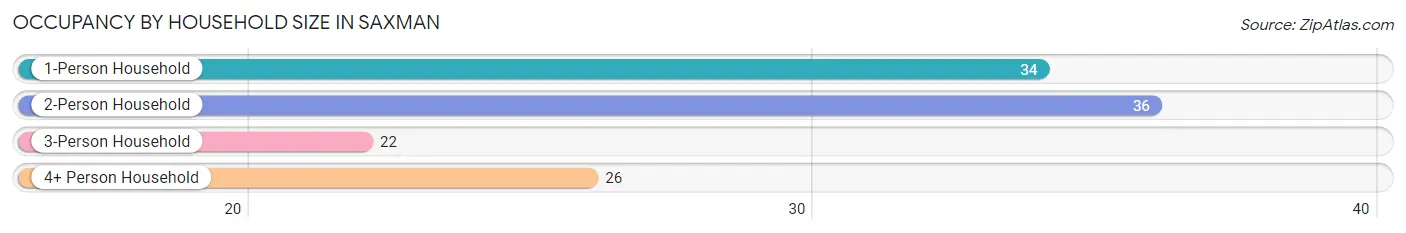
| Household Size | # Housing Units | % Housing Units |
| 1-Person Household | 34 | 28.8% |
| 2-Person Household | 36 | 30.5% |
| 3-Person Household | 22 | 18.6% |
| 4+ Person Household | 26 | 22.0% |
| Total Housing Units | 118 | 100.0% |
Occupancy by Ownership by Household Size in Saxman
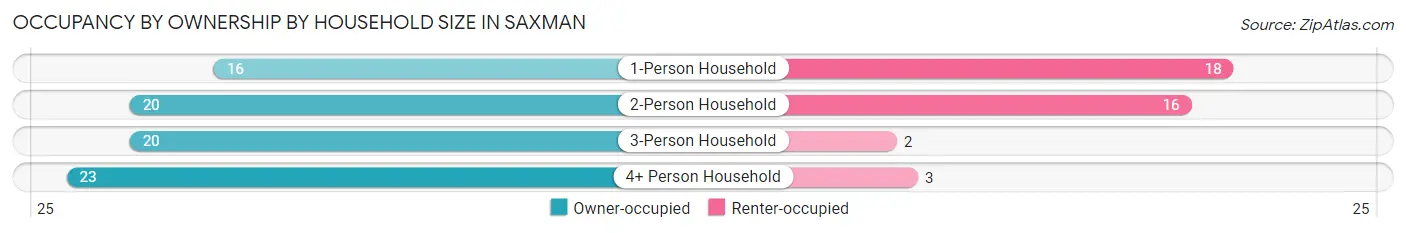
| Household Size | Owner-occupied | Renter-occupied |
| 1-Person Household | 16 (47.1%) | 18 (52.9%) |
| 2-Person Household | 20 (55.6%) | 16 (44.4%) |
| 3-Person Household | 20 (90.9%) | 2 (9.1%) |
| 4+ Person Household | 23 (88.5%) | 3 (11.5%) |
| Total Housing Units | 79 (66.9%) | 39 (33.1%) |
Occupancy by Educational Attainment in Saxman
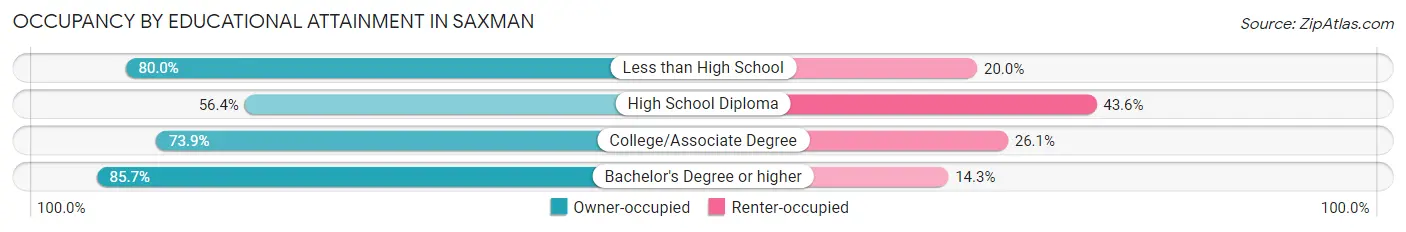
| Household Size | Owner-occupied | Renter-occupied |
| Less than High School | 8 (80.0%) | 2 (20.0%) |
| High School Diploma | 31 (56.4%) | 24 (43.6%) |
| College/Associate Degree | 34 (73.9%) | 12 (26.1%) |
| Bachelor's Degree or higher | 6 (85.7%) | 1 (14.3%) |
Occupancy by Age of Householder in Saxman
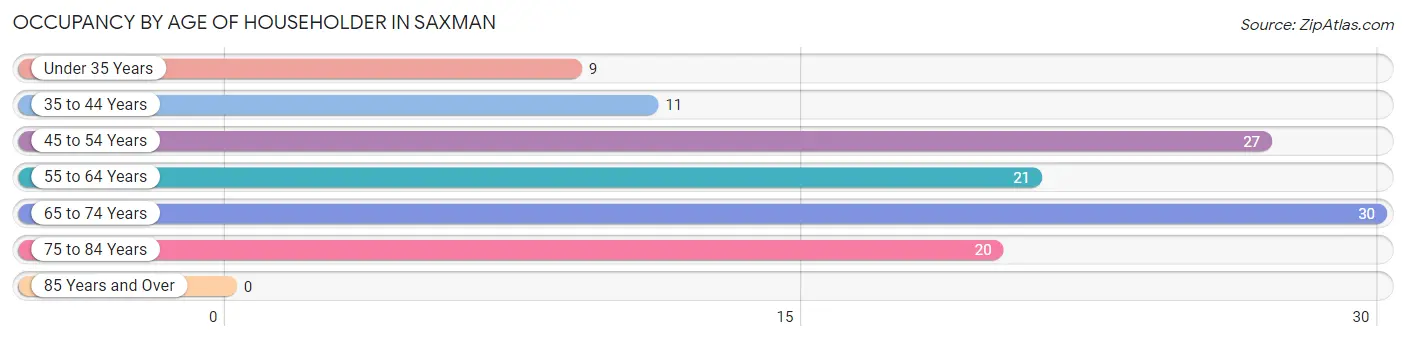
| Age Bracket | # Households | % Households |
| Under 35 Years | 9 | 7.6% |
| 35 to 44 Years | 11 | 9.3% |
| 45 to 54 Years | 27 | 22.9% |
| 55 to 64 Years | 21 | 17.8% |
| 65 to 74 Years | 30 | 25.4% |
| 75 to 84 Years | 20 | 17.0% |
| 85 Years and Over | 0 | 0.0% |
| Total | 118 | 100.0% |
Housing Finances in Saxman
Median Income by Occupancy in Saxman
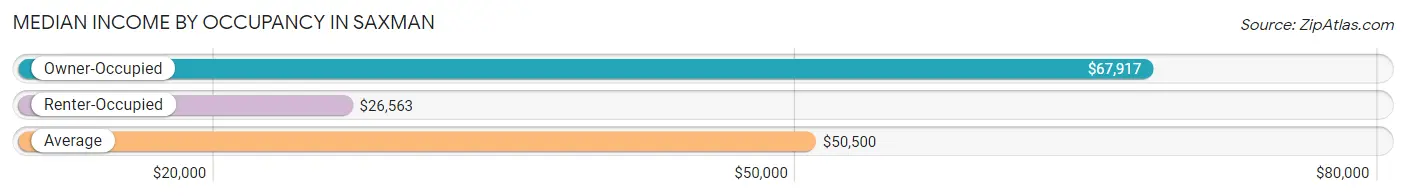
| Occupancy Type | # Households | Median Income |
| Owner-Occupied | 79 (66.9%) | $67,917 |
| Renter-Occupied | 39 (33.1%) | $26,563 |
| Average | 118 (100.0%) | $50,500 |
Occupancy by Householder Income Bracket in Saxman
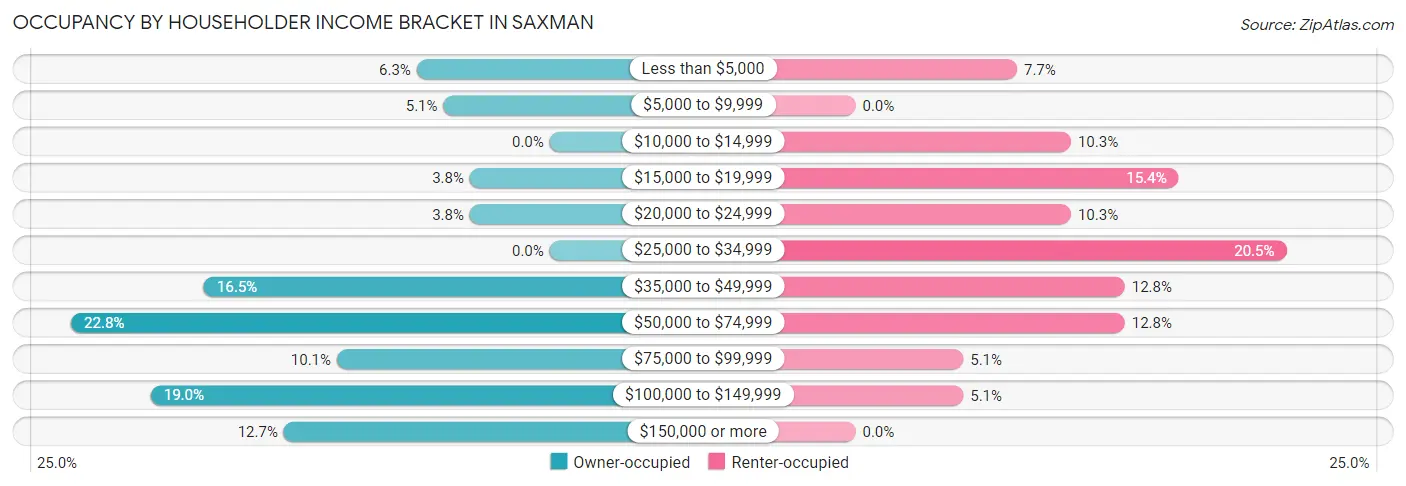
| Income Bracket | Owner-occupied | Renter-occupied |
| Less than $5,000 | 5 (6.3%) | 3 (7.7%) |
| $5,000 to $9,999 | 4 (5.1%) | 0 (0.0%) |
| $10,000 to $14,999 | 0 (0.0%) | 4 (10.3%) |
| $15,000 to $19,999 | 3 (3.8%) | 6 (15.4%) |
| $20,000 to $24,999 | 3 (3.8%) | 4 (10.3%) |
| $25,000 to $34,999 | 0 (0.0%) | 8 (20.5%) |
| $35,000 to $49,999 | 13 (16.5%) | 5 (12.8%) |
| $50,000 to $74,999 | 18 (22.8%) | 5 (12.8%) |
| $75,000 to $99,999 | 8 (10.1%) | 2 (5.1%) |
| $100,000 to $149,999 | 15 (19.0%) | 2 (5.1%) |
| $150,000 or more | 10 (12.7%) | 0 (0.0%) |
| Total | 79 (100.0%) | 39 (100.0%) |
Monthly Housing Cost Tiers in Saxman
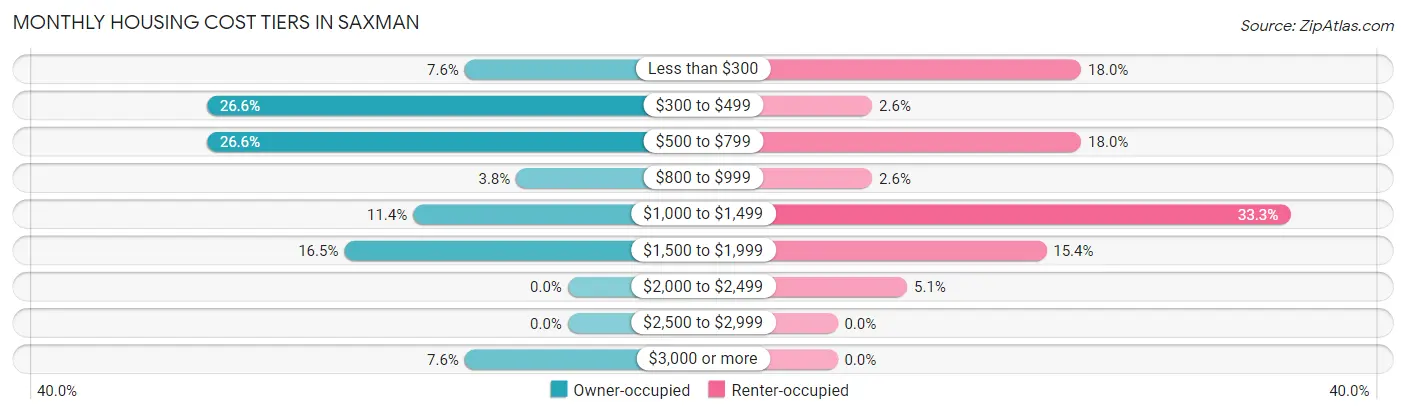
| Monthly Cost | Owner-occupied | Renter-occupied |
| Less than $300 | 6 (7.6%) | 7 (17.9%) |
| $300 to $499 | 21 (26.6%) | 1 (2.6%) |
| $500 to $799 | 21 (26.6%) | 7 (17.9%) |
| $800 to $999 | 3 (3.8%) | 1 (2.6%) |
| $1,000 to $1,499 | 9 (11.4%) | 13 (33.3%) |
| $1,500 to $1,999 | 13 (16.5%) | 6 (15.4%) |
| $2,000 to $2,499 | 0 (0.0%) | 2 (5.1%) |
| $2,500 to $2,999 | 0 (0.0%) | 0 (0.0%) |
| $3,000 or more | 6 (7.6%) | 0 (0.0%) |
| Total | 79 (100.0%) | 39 (100.0%) |
Physical Housing Characteristics in Saxman
Housing Structures in Saxman
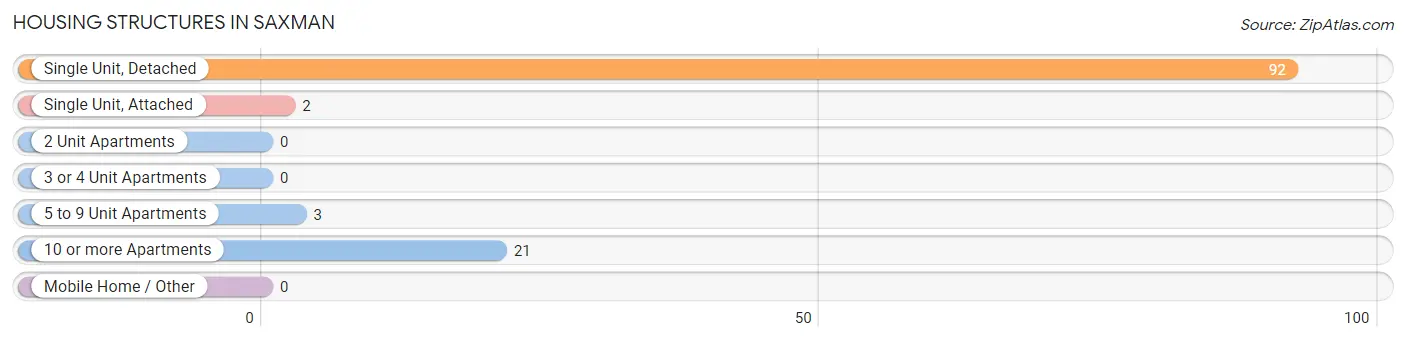
| Structure Type | # Housing Units | % Housing Units |
| Single Unit, Detached | 92 | 78.0% |
| Single Unit, Attached | 2 | 1.7% |
| 2 Unit Apartments | 0 | 0.0% |
| 3 or 4 Unit Apartments | 0 | 0.0% |
| 5 to 9 Unit Apartments | 3 | 2.5% |
| 10 or more Apartments | 21 | 17.8% |
| Mobile Home / Other | 0 | 0.0% |
| Total | 118 | 100.0% |
Housing Structures by Occupancy in Saxman
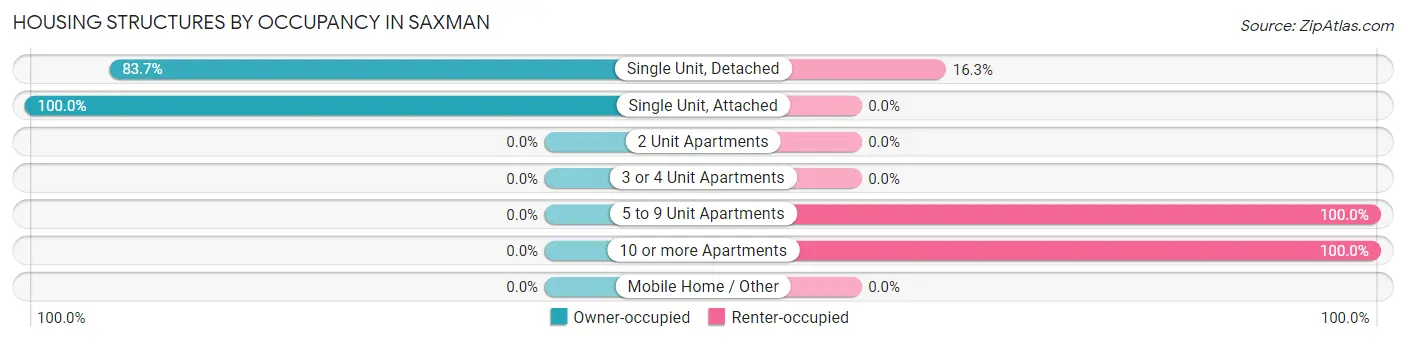
| Structure Type | Owner-occupied | Renter-occupied |
| Single Unit, Detached | 77 (83.7%) | 15 (16.3%) |
| Single Unit, Attached | 2 (100.0%) | 0 (0.0%) |
| 2 Unit Apartments | 0 (0.0%) | 0 (0.0%) |
| 3 or 4 Unit Apartments | 0 (0.0%) | 0 (0.0%) |
| 5 to 9 Unit Apartments | 0 (0.0%) | 3 (100.0%) |
| 10 or more Apartments | 0 (0.0%) | 21 (100.0%) |
| Mobile Home / Other | 0 (0.0%) | 0 (0.0%) |
| Total | 79 (66.9%) | 39 (33.1%) |
Housing Structures by Number of Rooms in Saxman
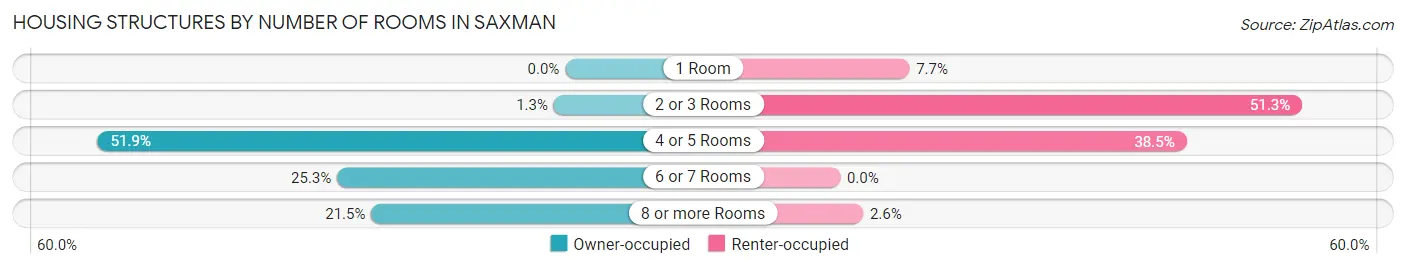
| Number of Rooms | Owner-occupied | Renter-occupied |
| 1 Room | 0 (0.0%) | 3 (7.7%) |
| 2 or 3 Rooms | 1 (1.3%) | 20 (51.3%) |
| 4 or 5 Rooms | 41 (51.9%) | 15 (38.5%) |
| 6 or 7 Rooms | 20 (25.3%) | 0 (0.0%) |
| 8 or more Rooms | 17 (21.5%) | 1 (2.6%) |
| Total | 79 (100.0%) | 39 (100.0%) |
Housing Structure by Heating Type in Saxman
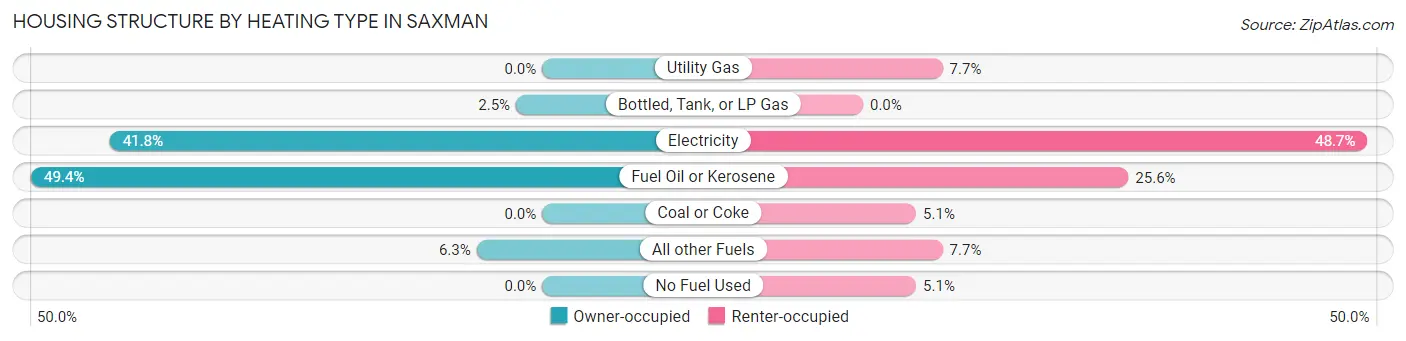
| Heating Type | Owner-occupied | Renter-occupied |
| Utility Gas | 0 (0.0%) | 3 (7.7%) |
| Bottled, Tank, or LP Gas | 2 (2.5%) | 0 (0.0%) |
| Electricity | 33 (41.8%) | 19 (48.7%) |
| Fuel Oil or Kerosene | 39 (49.4%) | 10 (25.6%) |
| Coal or Coke | 0 (0.0%) | 2 (5.1%) |
| All other Fuels | 5 (6.3%) | 3 (7.7%) |
| No Fuel Used | 0 (0.0%) | 2 (5.1%) |
| Total | 79 (100.0%) | 39 (100.0%) |
Household Vehicle Usage in Saxman
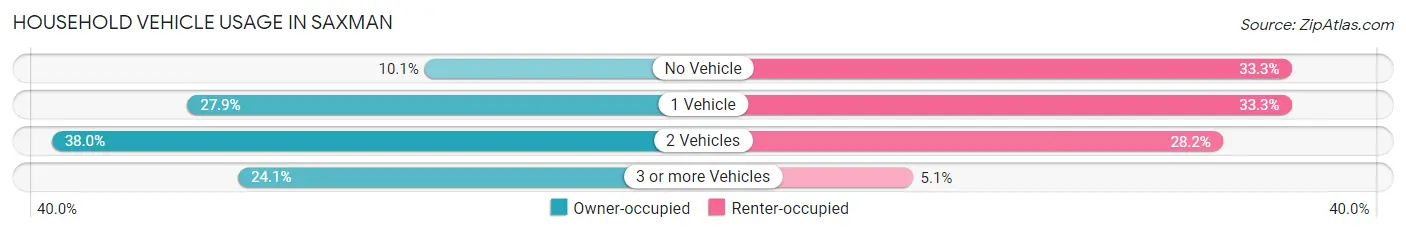
| Vehicles per Household | Owner-occupied | Renter-occupied |
| No Vehicle | 8 (10.1%) | 13 (33.3%) |
| 1 Vehicle | 22 (27.9%) | 13 (33.3%) |
| 2 Vehicles | 30 (38.0%) | 11 (28.2%) |
| 3 or more Vehicles | 19 (24.0%) | 2 (5.1%) |
| Total | 79 (100.0%) | 39 (100.0%) |
Real Estate & Mortgages in Saxman
Real Estate and Mortgage Overview in Saxman
| Characteristic | Without Mortgage | With Mortgage |
| Housing Units | 48 | 31 |
| Median Property Value | $265,000 | $272,500 |
| Median Household Income | $46,750 | $6 |
| Monthly Housing Costs | $500 | $6 |
| Real Estate Taxes | $875 | $7 |
Property Value by Mortgage Status in Saxman
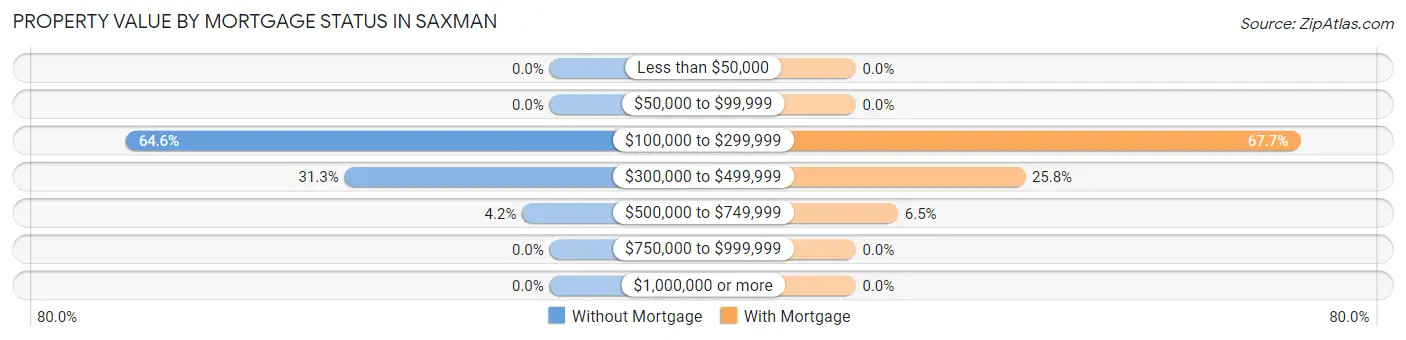
| Property Value | Without Mortgage | With Mortgage |
| Less than $50,000 | 0 (0.0%) | 0 (0.0%) |
| $50,000 to $99,999 | 0 (0.0%) | 0 (0.0%) |
| $100,000 to $299,999 | 31 (64.6%) | 21 (67.7%) |
| $300,000 to $499,999 | 15 (31.2%) | 8 (25.8%) |
| $500,000 to $749,999 | 2 (4.2%) | 2 (6.5%) |
| $750,000 to $999,999 | 0 (0.0%) | 0 (0.0%) |
| $1,000,000 or more | 0 (0.0%) | 0 (0.0%) |
| Total | 48 (100.0%) | 31 (100.0%) |
Household Income by Mortgage Status in Saxman
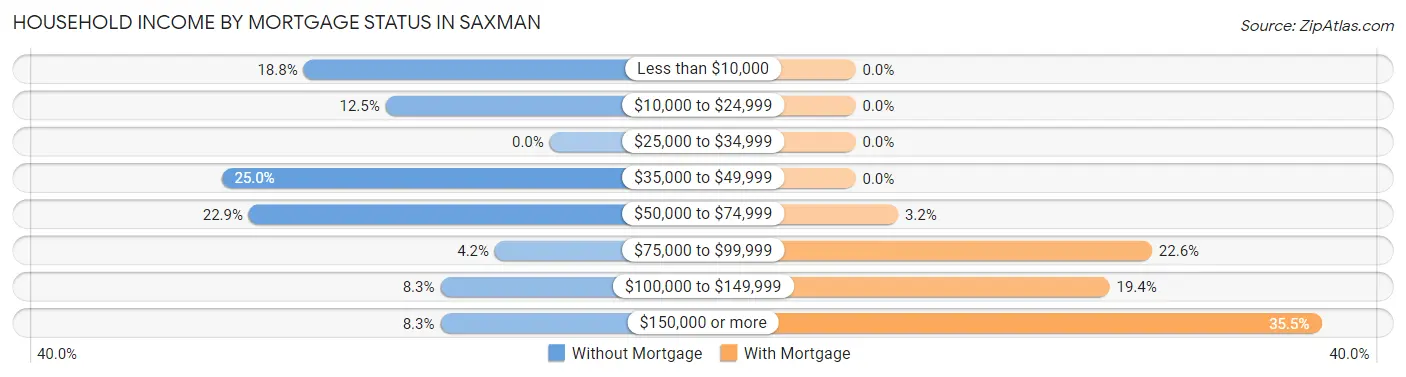
| Household Income | Without Mortgage | With Mortgage |
| Less than $10,000 | 9 (18.8%) | 0 (0.0%) |
| $10,000 to $24,999 | 6 (12.5%) | 0 (0.0%) |
| $25,000 to $34,999 | 0 (0.0%) | 0 (0.0%) |
| $35,000 to $49,999 | 12 (25.0%) | 0 (0.0%) |
| $50,000 to $74,999 | 11 (22.9%) | 1 (3.2%) |
| $75,000 to $99,999 | 2 (4.2%) | 7 (22.6%) |
| $100,000 to $149,999 | 4 (8.3%) | 6 (19.4%) |
| $150,000 or more | 4 (8.3%) | 11 (35.5%) |
| Total | 48 (100.0%) | 31 (100.0%) |
Property Value to Household Income Ratio in Saxman
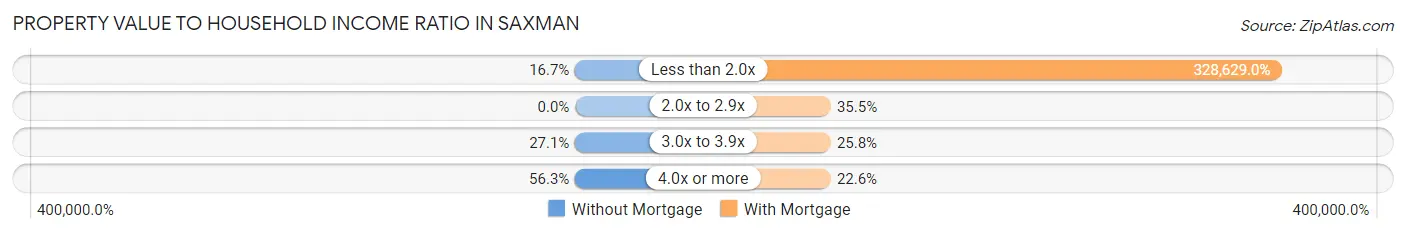
| Value-to-Income Ratio | Without Mortgage | With Mortgage |
| Less than 2.0x | 8 (16.7%) | 101,875 (328,629.0%) |
| 2.0x to 2.9x | 0 (0.0%) | 11 (35.5%) |
| 3.0x to 3.9x | 13 (27.1%) | 8 (25.8%) |
| 4.0x or more | 27 (56.2%) | 7 (22.6%) |
| Total | 48 (100.0%) | 31 (100.0%) |
Real Estate Taxes by Mortgage Status in Saxman
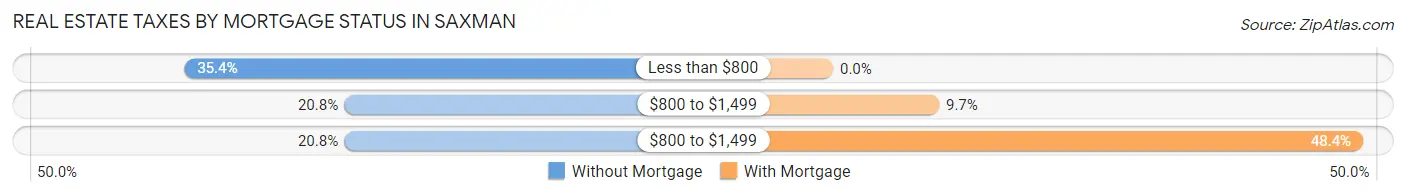
| Property Taxes | Without Mortgage | With Mortgage |
| Less than $800 | 17 (35.4%) | 0 (0.0%) |
| $800 to $1,499 | 10 (20.8%) | 3 (9.7%) |
| $800 to $1,499 | 10 (20.8%) | 15 (48.4%) |
| Total | 48 (100.0%) | 31 (100.0%) |
Health & Disability in Saxman
Health Insurance Coverage by Age in Saxman
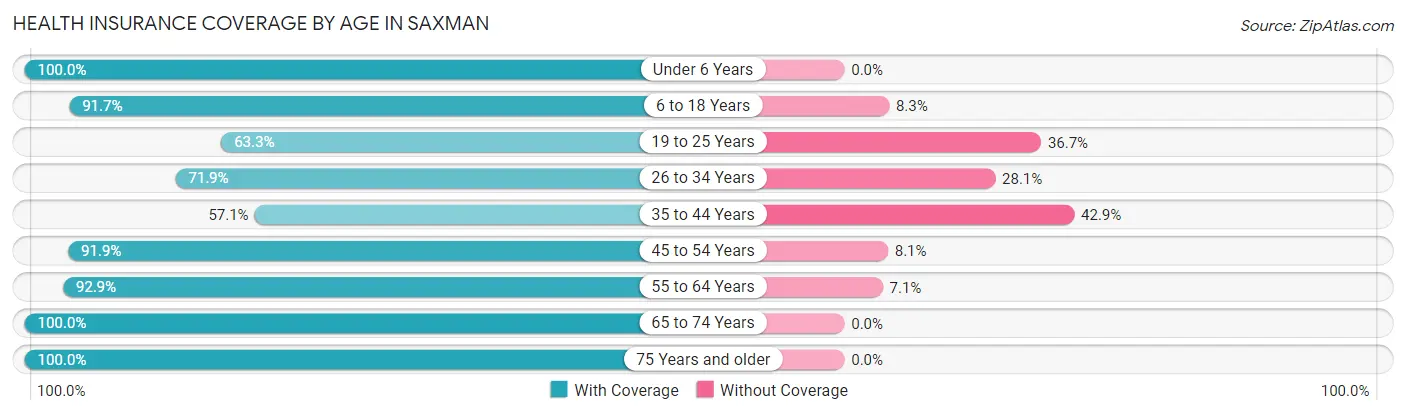
| Age Bracket | With Coverage | Without Coverage |
| Under 6 Years | 21 (100.0%) | 0 (0.0%) |
| 6 to 18 Years | 44 (91.7%) | 4 (8.3%) |
| 19 to 25 Years | 19 (63.3%) | 11 (36.7%) |
| 26 to 34 Years | 23 (71.9%) | 9 (28.1%) |
| 35 to 44 Years | 16 (57.1%) | 12 (42.9%) |
| 45 to 54 Years | 68 (91.9%) | 6 (8.1%) |
| 55 to 64 Years | 39 (92.9%) | 3 (7.1%) |
| 65 to 74 Years | 37 (100.0%) | 0 (0.0%) |
| 75 Years and older | 49 (100.0%) | 0 (0.0%) |
| Total | 316 (87.5%) | 45 (12.5%) |
Health Insurance Coverage by Citizenship Status in Saxman
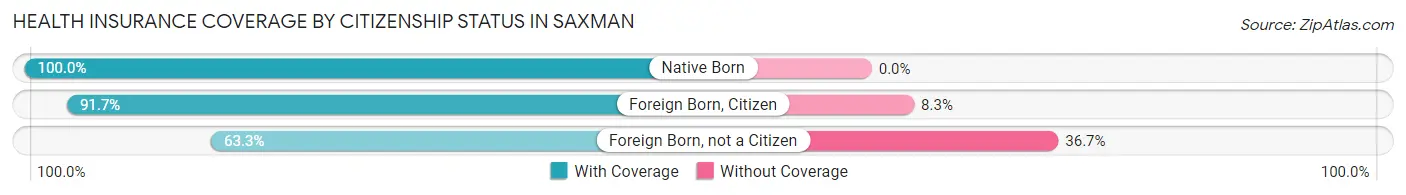
| Citizenship Status | With Coverage | Without Coverage |
| Native Born | 21 (100.0%) | 0 (0.0%) |
| Foreign Born, Citizen | 44 (91.7%) | 4 (8.3%) |
| Foreign Born, not a Citizen | 19 (63.3%) | 11 (36.7%) |
Health Insurance Coverage by Household Income in Saxman
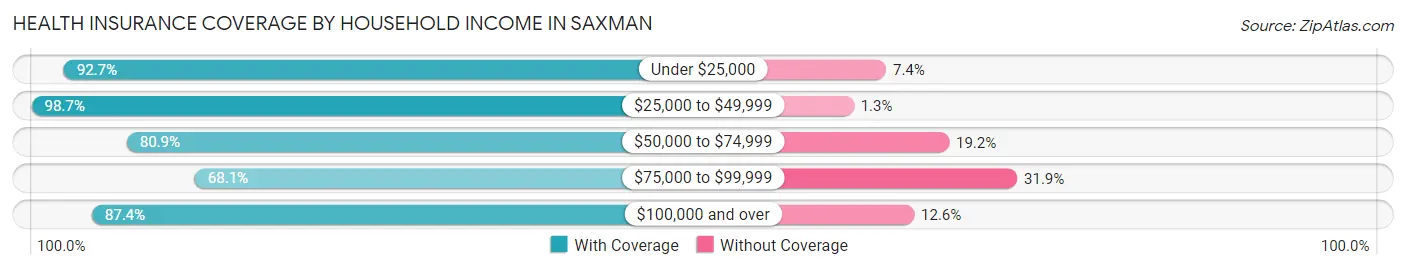
| Household Income | With Coverage | Without Coverage |
| Under $25,000 | 63 (92.6%) | 5 (7.3%) |
| $25,000 to $49,999 | 76 (98.7%) | 1 (1.3%) |
| $50,000 to $74,999 | 38 (80.8%) | 9 (19.2%) |
| $75,000 to $99,999 | 32 (68.1%) | 15 (31.9%) |
| $100,000 and over | 104 (87.4%) | 15 (12.6%) |
Public vs Private Health Insurance Coverage by Age in Saxman
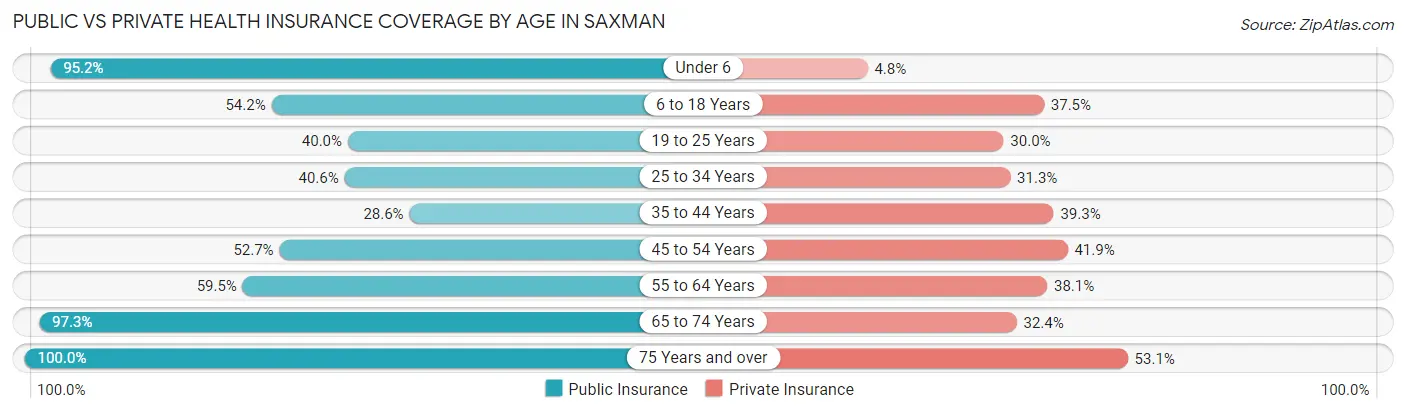
| Age Bracket | Public Insurance | Private Insurance |
| Under 6 | 20 (95.2%) | 1 (4.8%) |
| 6 to 18 Years | 26 (54.2%) | 18 (37.5%) |
| 19 to 25 Years | 12 (40.0%) | 9 (30.0%) |
| 25 to 34 Years | 13 (40.6%) | 10 (31.2%) |
| 35 to 44 Years | 8 (28.6%) | 11 (39.3%) |
| 45 to 54 Years | 39 (52.7%) | 31 (41.9%) |
| 55 to 64 Years | 25 (59.5%) | 16 (38.1%) |
| 65 to 74 Years | 36 (97.3%) | 12 (32.4%) |
| 75 Years and over | 49 (100.0%) | 26 (53.1%) |
| Total | 228 (63.2%) | 134 (37.1%) |
Disability Status by Sex by Age in Saxman
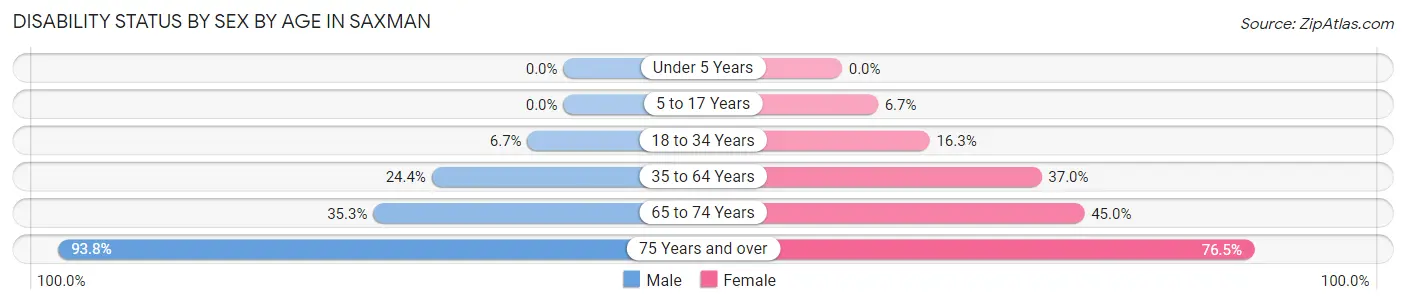
| Age Bracket | Male | Female |
| Under 5 Years | 0 (0.0%) | 0 (0.0%) |
| 5 to 17 Years | 0 (0.0%) | 1 (6.7%) |
| 18 to 34 Years | 2 (6.7%) | 7 (16.3%) |
| 35 to 64 Years | 22 (24.4%) | 20 (37.0%) |
| 65 to 74 Years | 6 (35.3%) | 9 (45.0%) |
| 75 Years and over | 30 (93.8%) | 13 (76.5%) |
Disability Class by Sex by Age in Saxman
Disability Class: Hearing Difficulty
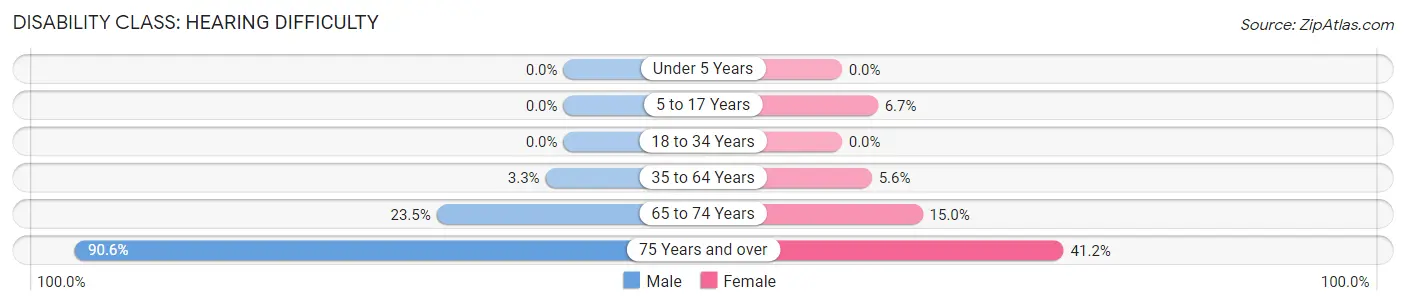
| Age Bracket | Male | Female |
| Under 5 Years | 0 (0.0%) | 0 (0.0%) |
| 5 to 17 Years | 0 (0.0%) | 1 (6.7%) |
| 18 to 34 Years | 0 (0.0%) | 0 (0.0%) |
| 35 to 64 Years | 3 (3.3%) | 3 (5.6%) |
| 65 to 74 Years | 4 (23.5%) | 3 (15.0%) |
| 75 Years and over | 29 (90.6%) | 7 (41.2%) |
Disability Class: Vision Difficulty
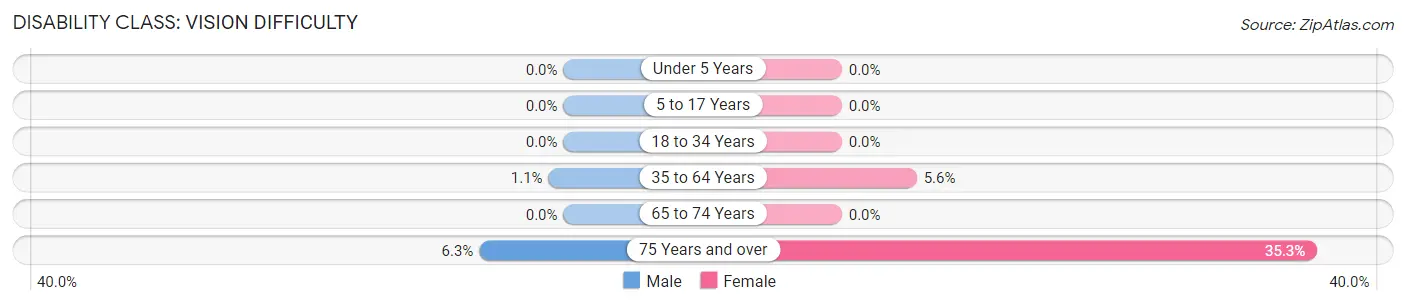
| Age Bracket | Male | Female |
| Under 5 Years | 0 (0.0%) | 0 (0.0%) |
| 5 to 17 Years | 0 (0.0%) | 0 (0.0%) |
| 18 to 34 Years | 0 (0.0%) | 0 (0.0%) |
| 35 to 64 Years | 1 (1.1%) | 3 (5.6%) |
| 65 to 74 Years | 0 (0.0%) | 0 (0.0%) |
| 75 Years and over | 2 (6.2%) | 6 (35.3%) |
Disability Class: Cognitive Difficulty
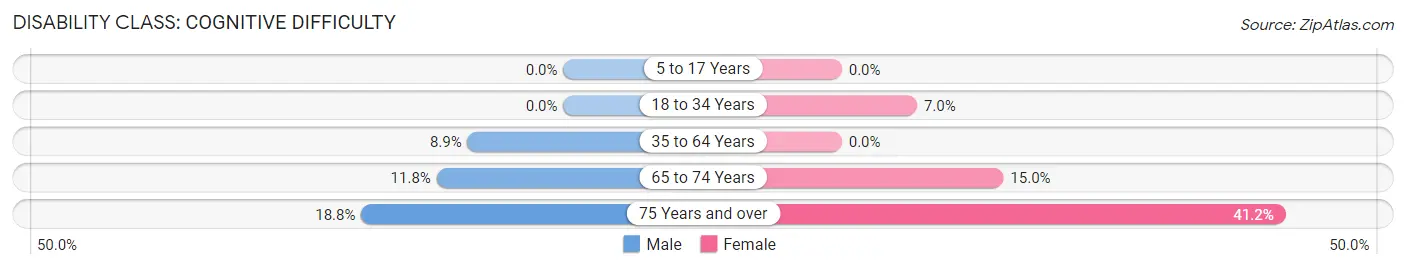
| Age Bracket | Male | Female |
| 5 to 17 Years | 0 (0.0%) | 0 (0.0%) |
| 18 to 34 Years | 0 (0.0%) | 3 (7.0%) |
| 35 to 64 Years | 8 (8.9%) | 0 (0.0%) |
| 65 to 74 Years | 2 (11.8%) | 3 (15.0%) |
| 75 Years and over | 6 (18.8%) | 7 (41.2%) |
Disability Class: Ambulatory Difficulty
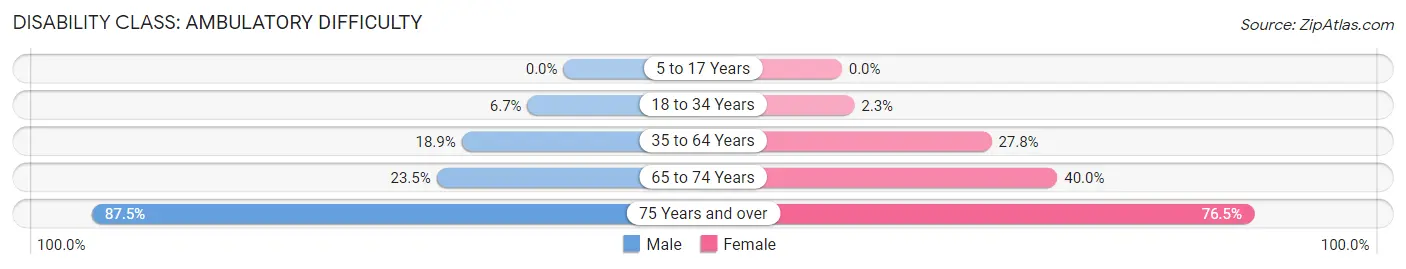
| Age Bracket | Male | Female |
| 5 to 17 Years | 0 (0.0%) | 0 (0.0%) |
| 18 to 34 Years | 2 (6.7%) | 1 (2.3%) |
| 35 to 64 Years | 17 (18.9%) | 15 (27.8%) |
| 65 to 74 Years | 4 (23.5%) | 8 (40.0%) |
| 75 Years and over | 28 (87.5%) | 13 (76.5%) |
Disability Class: Self-Care Difficulty
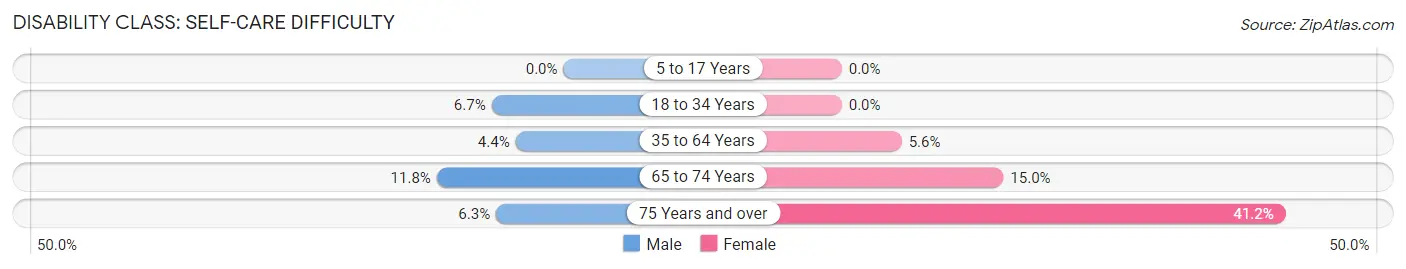
| Age Bracket | Male | Female |
| 5 to 17 Years | 0 (0.0%) | 0 (0.0%) |
| 18 to 34 Years | 2 (6.7%) | 0 (0.0%) |
| 35 to 64 Years | 4 (4.4%) | 3 (5.6%) |
| 65 to 74 Years | 2 (11.8%) | 3 (15.0%) |
| 75 Years and over | 2 (6.2%) | 7 (41.2%) |
Technology Access in Saxman
Computing Device Access in Saxman
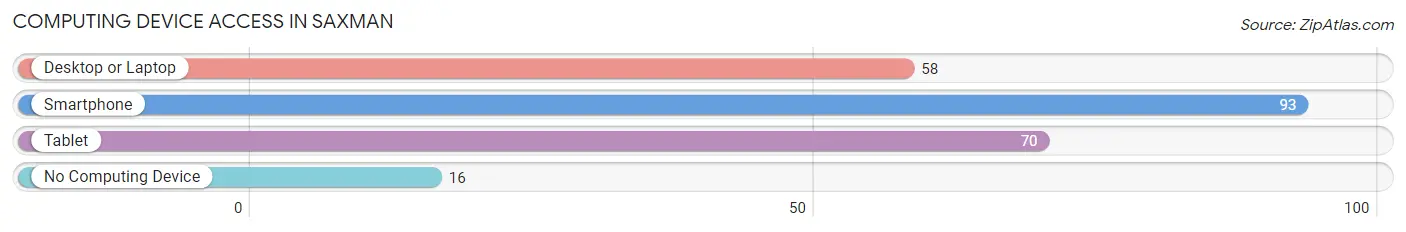
| Device Type | # Households | % Households |
| Desktop or Laptop | 58 | 49.1% |
| Smartphone | 93 | 78.8% |
| Tablet | 70 | 59.3% |
| No Computing Device | 16 | 13.6% |
| Total | 118 | 100.0% |
Internet Access in Saxman
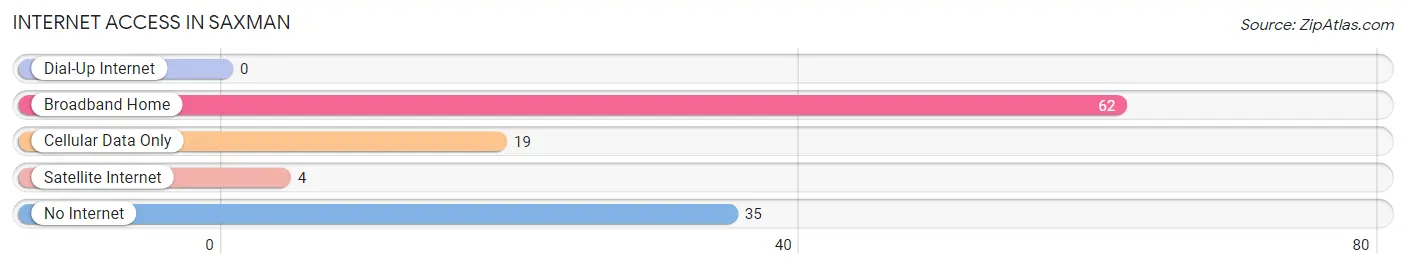
| Internet Type | # Households | % Households |
| Dial-Up Internet | 0 | 0.0% |
| Broadband Home | 62 | 52.5% |
| Cellular Data Only | 19 | 16.1% |
| Satellite Internet | 4 | 3.4% |
| No Internet | 35 | 29.7% |
| Total | 118 | 100.0% |
Saxman Summary
Saxman is a small city located in the southeastern corner of Alaska, in the Ketchikan Gateway Borough. It is situated on the east side of Revillagigedo Island, about 10 miles south of Ketchikan. The city is home to a population of about 1,000 people, and is known for its rich cultural heritage and its connection to the Tlingit people.
Geography
Saxman is located in the southeastern corner of Alaska, in the Ketchikan Gateway Borough. It is situated on the east side of Revillagigedo Island, about 10 miles south of Ketchikan. The city is surrounded by the Tongass National Forest, and is located near the mouth of the Ketchikan River. The terrain is mostly mountainous, with the highest point being Mount Verstovia, which rises to an elevation of 3,890 feet. The climate is mild and wet, with temperatures ranging from the mid-30s in the winter to the mid-60s in the summer.
Economy
The economy of Saxman is largely based on fishing and tourism. The city is home to several seafood processing plants, which process salmon, halibut, and other fish for export. The city also has a number of small businesses, including restaurants, gift shops, and art galleries. Tourism is also an important part of the economy, with visitors coming to the city to experience its rich cultural heritage and to take part in outdoor activities such as fishing, hiking, and kayaking.
Demographics
As of the 2010 census, the population of Saxman was 1,012. The racial makeup of the city was 75.3% White, 0.7% African American, 16.2% Native American, 0.3% Asian, 0.1% Pacific Islander, and 7.4% from two or more races. The median household income was $41,250, and the median family income was $48,750. The per capita income was $20,945.
History
Saxman was founded in the late 19th century by the Tlingit people, who had lived in the area for centuries. The city was named after Chief Saxman, a Tlingit leader who was instrumental in the development of the city. In the early 20th century, the city became a center for the salmon canning industry, and it was incorporated in 1912. In the 1950s, the city began to experience a decline in the salmon canning industry, and the economy shifted to tourism and other industries. Today, Saxman is a popular tourist destination, and it is home to a number of cultural attractions, including the Saxman Totem Park and the Totem Heritage Center.
Common Questions
What is Per Capita Income in Saxman?
Per Capita income in Saxman is $24,381.
What is the Median Family Income in Saxman?
Median Family Income in Saxman is $53,750.
What is the Median Household income in Saxman?
Median Household Income in Saxman is $50,500.
What is Income or Wage Gap in Saxman?
Income or Wage Gap in Saxman is 56.3%.
Women in Saxman earn 43.7 cents for every dollar earned by a man.
What is Inequality or Gini Index in Saxman?
Inequality or Gini Index in Saxman is 0.47.
What is the Total Population of Saxman?
Total Population of Saxman is 361.
What is the Total Male Population of Saxman?
Total Male Population of Saxman is 199.
What is the Total Female Population of Saxman?
Total Female Population of Saxman is 162.
What is the Ratio of Males per 100 Females in Saxman?
There are 122.84 Males per 100 Females in Saxman.
What is the Ratio of Females per 100 Males in Saxman?
There are 81.41 Females per 100 Males in Saxman.
What is the Median Population Age in Saxman?
Median Population Age in Saxman is 48.2 Years.
What is the Average Family Size in Saxman
Average Family Size in Saxman is 3.7 People.
What is the Average Household Size in Saxman
Average Household Size in Saxman is 3.0 People.
How Large is the Labor Force in Saxman?
There are 121 People in the Labor Forcein in Saxman.
What is the Percentage of People in the Labor Force in Saxman?
39.7% of People are in the Labor Force in Saxman.
What is the Unemployment Rate in Saxman?
Unemployment Rate in Saxman is 14.0%.