Clayton, NM Map & Demographics
Clayton Map
Clayton Overview
$17,167
PER CAPITA INCOME
$41,528
AVG FAMILY INCOME
$33,239
AVG HOUSEHOLD INCOME
41.4%
WAGE / INCOME GAP [ % ]
58.6¢/ $1
WAGE / INCOME GAP [ $ ]
0.44
INEQUALITY / GINI INDEX
2,825
TOTAL POPULATION
1,515
MALE POPULATION
1,310
FEMALE POPULATION
115.65
MALES / 100 FEMALES
86.47
FEMALES / 100 MALES
39.1
MEDIAN AGE
3.1
AVG FAMILY SIZE
2.5
AVG HOUSEHOLD SIZE
880
LABOR FORCE [ PEOPLE ]
38.0%
PERCENT IN LABOR FORCE
8.8%
UNEMPLOYMENT RATE
Clayton Zip Codes
Clayton Area Codes
Income in Clayton
Income Overview in Clayton
Per Capita Income in Clayton is $17,167, while median incomes of families and households are $41,528 and $33,239 respectively.
| Characteristic | Number | Measure |
| Per Capita Income | 2,825 | $17,167 |
| Median Family Income | 541 | $41,528 |
| Mean Family Income | 541 | $50,465 |
| Median Household Income | 930 | $33,239 |
| Mean Household Income | 930 | $47,640 |
| Income Deficit | 541 | $0 |
| Wage / Income Gap (%) | 2,825 | 41.40% |
| Wage / Income Gap ($) | 2,825 | 58.60¢ per $1 |
| Gini / Inequality Index | 2,825 | 0.44 |
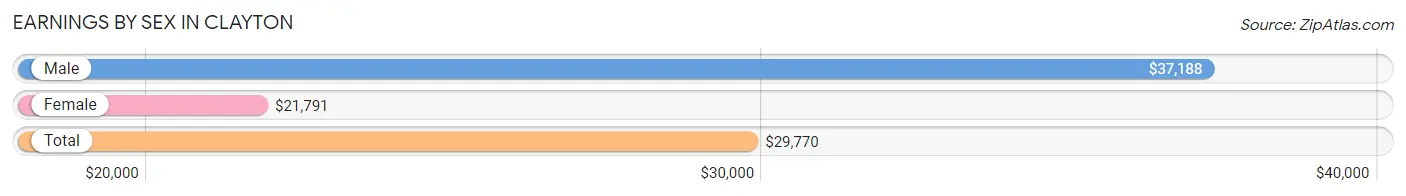
Earnings by Sex in Clayton
Average Earnings in Clayton are $29,770, $37,188 for men and $21,791 for women, a difference of 41.4%.
| Sex | Number | Average Earnings |
| Male | 414 (46.3%) | $37,188 |
| Female | 480 (53.7%) | $21,791 |
| Total | 894 (100.0%) | $29,770 |
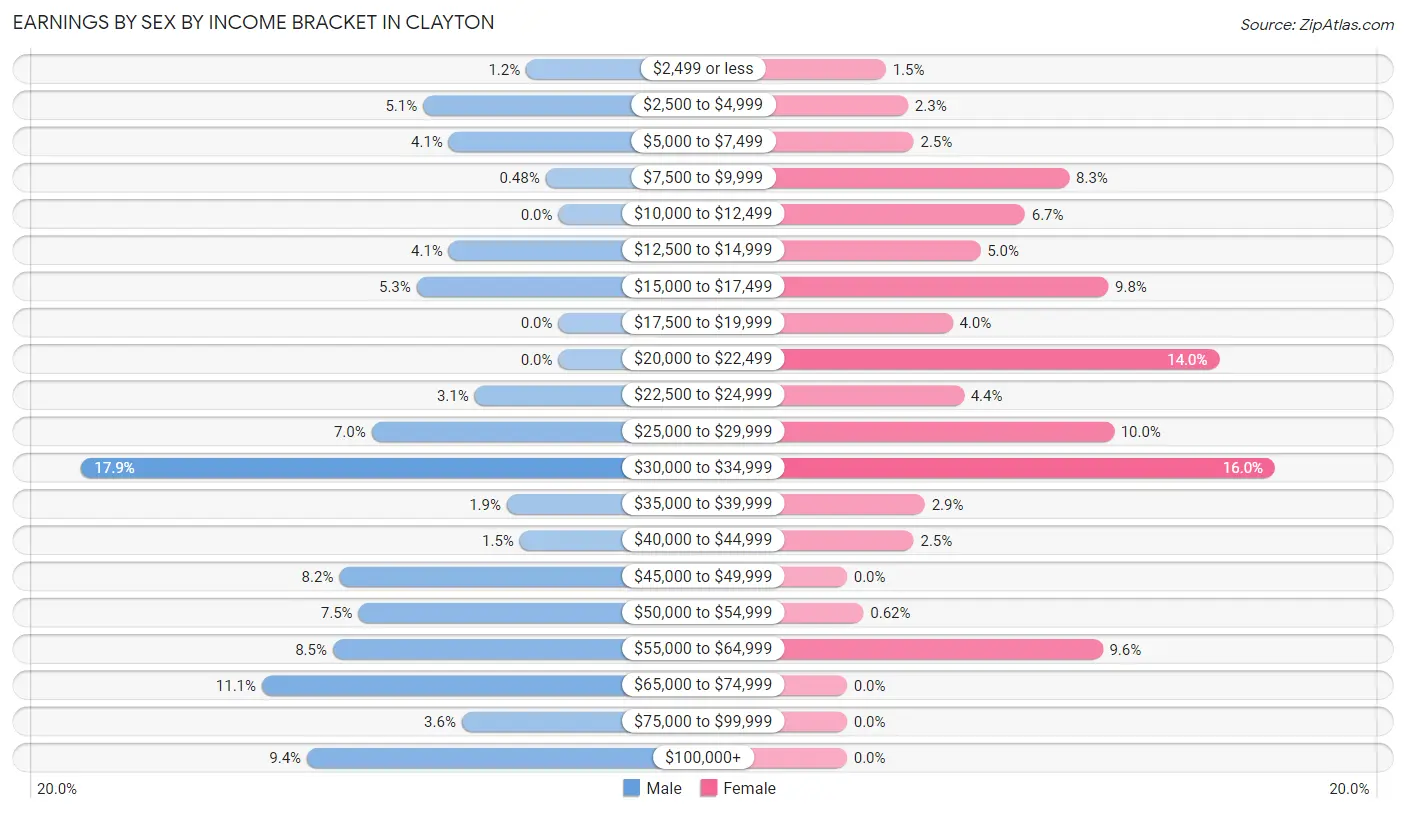
Earnings by Sex by Income Bracket in Clayton
The most common earnings brackets in Clayton are $30,000 to $34,999 for men (74 | 17.9%) and $30,000 to $34,999 for women (77 | 16.0%).
| Income | Male | Female |
| $2,499 or less | 5 (1.2%) | 7 (1.5%) |
| $2,500 to $4,999 | 21 (5.1%) | 11 (2.3%) |
| $5,000 to $7,499 | 17 (4.1%) | 12 (2.5%) |
| $7,500 to $9,999 | 2 (0.5%) | 40 (8.3%) |
| $10,000 to $12,499 | 0 (0.0%) | 32 (6.7%) |
| $12,500 to $14,999 | 17 (4.1%) | 24 (5.0%) |
| $15,000 to $17,499 | 22 (5.3%) | 47 (9.8%) |
| $17,500 to $19,999 | 0 (0.0%) | 19 (4.0%) |
| $20,000 to $22,499 | 0 (0.0%) | 67 (14.0%) |
| $22,500 to $24,999 | 13 (3.1%) | 21 (4.4%) |
| $25,000 to $29,999 | 29 (7.0%) | 48 (10.0%) |
| $30,000 to $34,999 | 74 (17.9%) | 77 (16.0%) |
| $35,000 to $39,999 | 8 (1.9%) | 14 (2.9%) |
| $40,000 to $44,999 | 6 (1.5%) | 12 (2.5%) |
| $45,000 to $49,999 | 34 (8.2%) | 0 (0.0%) |
| $50,000 to $54,999 | 31 (7.5%) | 3 (0.6%) |
| $55,000 to $64,999 | 35 (8.5%) | 46 (9.6%) |
| $65,000 to $74,999 | 46 (11.1%) | 0 (0.0%) |
| $75,000 to $99,999 | 15 (3.6%) | 0 (0.0%) |
| $100,000+ | 39 (9.4%) | 0 (0.0%) |
| Total | 414 (100.0%) | 480 (100.0%) |
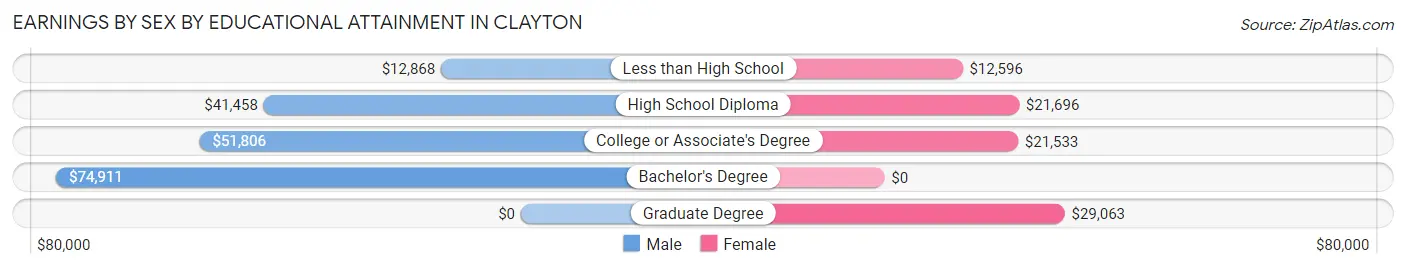
Earnings by Sex by Educational Attainment in Clayton
Average earnings in Clayton are $46,434 for men and $21,399 for women, a difference of 53.9%. Men with an educational attainment of bachelor's degree enjoy the highest average annual earnings of $74,911, while those with less than high school education earn the least with $12,868. Women with an educational attainment of graduate degree earn the most with the average annual earnings of $29,063, while those with less than high school education have the smallest earnings of $12,596.
| Educational Attainment | Male Income | Female Income |
| Less than High School | $12,868 | $12,596 |
| High School Diploma | $41,458 | $21,696 |
| College or Associate's Degree | $51,806 | $21,533 |
| Bachelor's Degree | $74,911 | $0 |
| Graduate Degree | - | - |
| Total | $46,434 | $21,399 |
Family Income in Clayton
Family Income Brackets in Clayton
According to the Clayton family income data, there are 147 families falling into the $50,000 to $74,999 income range, which is the most common income bracket and makes up 27.2% of all families. Conversely, the $150,000 to $199,999 income bracket is the least frequent group with only 3 families (0.5%) belonging to this category.
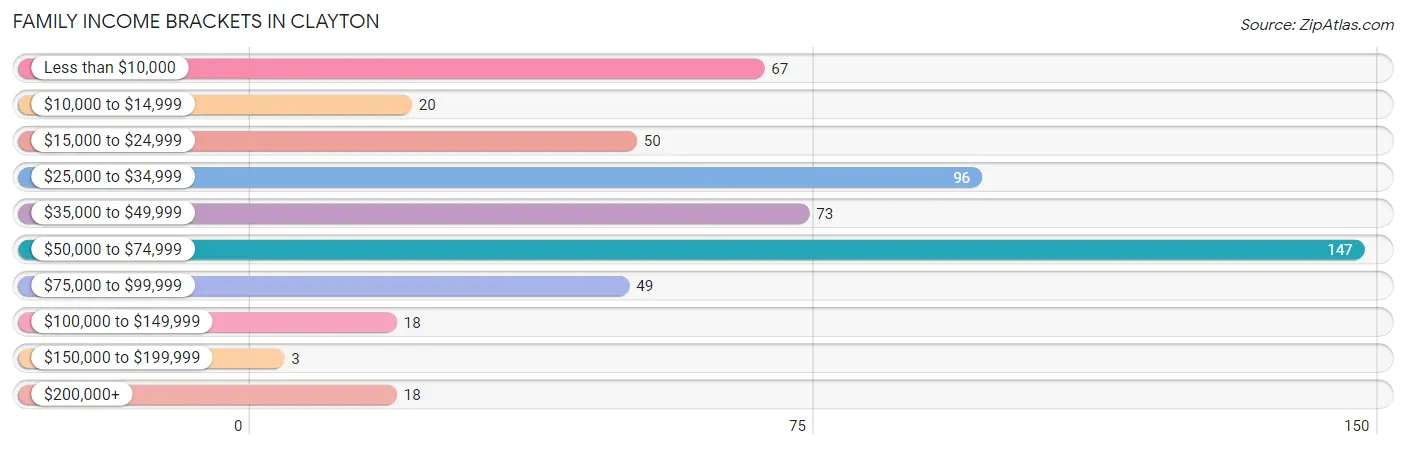
| Income Bracket | # Families | % Families |
| Less than $10,000 | 67 | 12.4% |
| $10,000 to $14,999 | 20 | 3.7% |
| $15,000 to $24,999 | 50 | 9.2% |
| $25,000 to $34,999 | 96 | 17.7% |
| $35,000 to $49,999 | 73 | 13.5% |
| $50,000 to $74,999 | 147 | 27.2% |
| $75,000 to $99,999 | 49 | 9.1% |
| $100,000 to $149,999 | 18 | 3.3% |
| $150,000 to $199,999 | 3 | 0.6% |
| $200,000+ | 18 | 3.3% |
Family Income by Famaliy Size in Clayton
5-person families (47 | 8.7%) account for the highest median family income in Clayton with $57,120 per family, while 2-person families (316 | 58.4%) have the highest median income of $17,386 per family member.
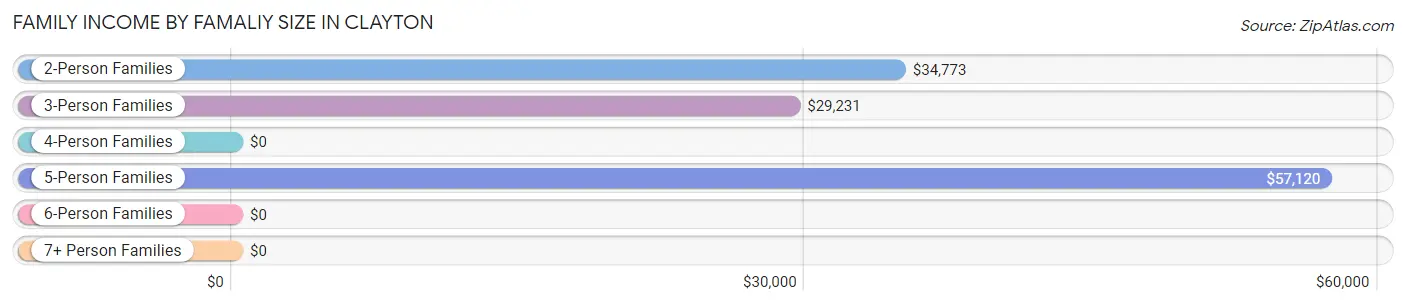
| Income Bracket | # Families | Median Income |
| 2-Person Families | 316 (58.4%) | $34,773 |
| 3-Person Families | 104 (19.2%) | $29,231 |
| 4-Person Families | 74 (13.7%) | $0 |
| 5-Person Families | 47 (8.7%) | $57,120 |
| 6-Person Families | 0 (0.0%) | $0 |
| 7+ Person Families | 0 (0.0%) | $0 |
| Total | 541 (100.0%) | $41,528 |
Family Income by Number of Earners in Clayton
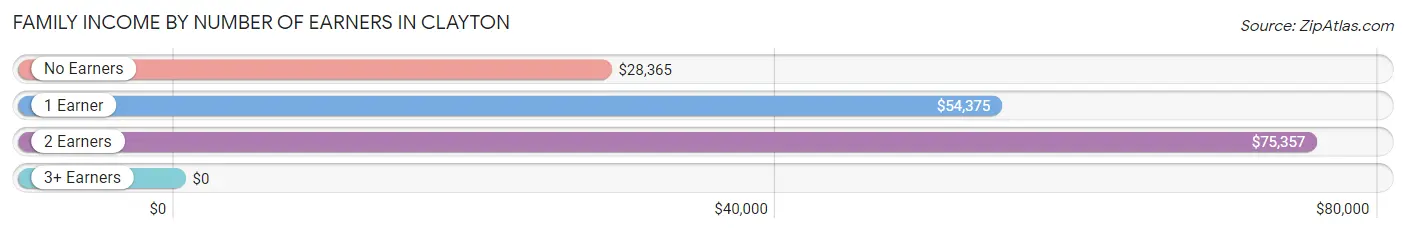
| Number of Earners | # Families | Median Income |
| No Earners | 203 (37.5%) | $28,365 |
| 1 Earner | 213 (39.4%) | $54,375 |
| 2 Earners | 122 (22.6%) | $75,357 |
| 3+ Earners | 3 (0.5%) | $0 |
| Total | 541 (100.0%) | $41,528 |
Household Income in Clayton
Household Income Brackets in Clayton
With 199 households falling in the category, the $50,000 to $74,999 income range is the most frequent in Clayton, accounting for 21.4% of all households. In contrast, only 13 households (1.4%) fall into the $150,000 to $199,999 income bracket, making it the least populous group.
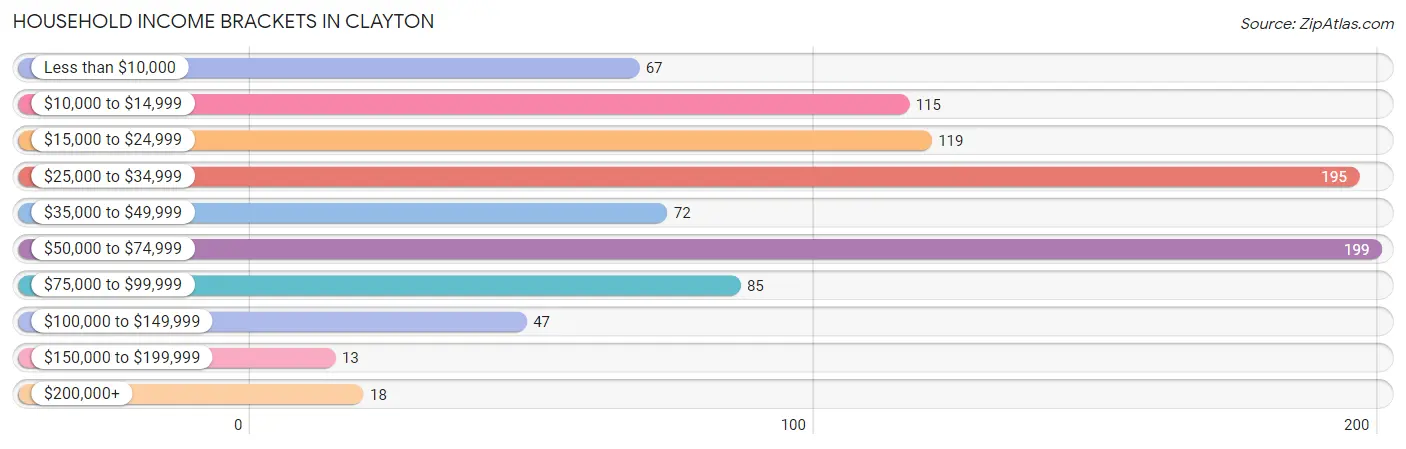
| Income Bracket | # Households | % Households |
| Less than $10,000 | 67 | 7.2% |
| $10,000 to $14,999 | 115 | 12.4% |
| $15,000 to $24,999 | 119 | 12.8% |
| $25,000 to $34,999 | 195 | 21.0% |
| $35,000 to $49,999 | 72 | 7.7% |
| $50,000 to $74,999 | 199 | 21.4% |
| $75,000 to $99,999 | 85 | 9.1% |
| $100,000 to $149,999 | 47 | 5.1% |
| $150,000 to $199,999 | 13 | 1.4% |
| $200,000+ | 18 | 1.9% |
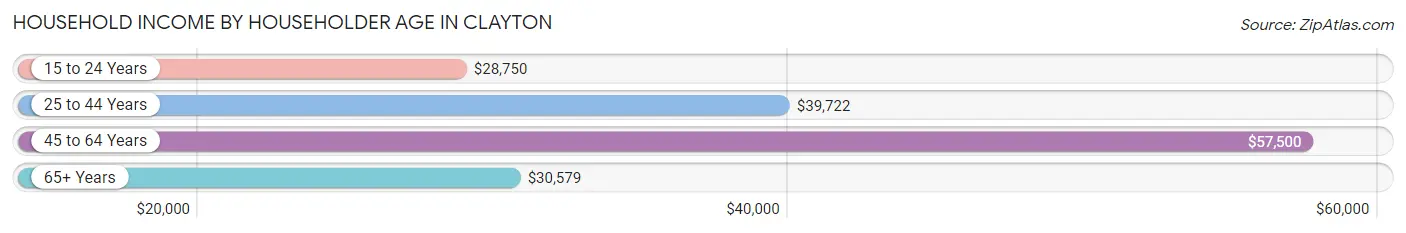
Household Income by Householder Age in Clayton
The median household income in Clayton is $33,239, with the highest median household income of $57,500 found in the 45 to 64 years age bracket for the primary householder. A total of 284 households (30.5%) fall into this category. Meanwhile, the 15 to 24 years age bracket for the primary householder has the lowest median household income of $28,750, with 41 households (4.4%) in this group.
| Income Bracket | # Households | Median Income |
| 15 to 24 Years | 41 (4.4%) | $28,750 |
| 25 to 44 Years | 182 (19.6%) | $39,722 |
| 45 to 64 Years | 284 (30.5%) | $57,500 |
| 65+ Years | 423 (45.5%) | $30,579 |
| Total | 930 (100.0%) | $33,239 |
Poverty in Clayton
Income Below Poverty by Sex and Age in Clayton
With 21.4% poverty level for males and 26.6% for females among the residents of Clayton, 5 year old males and 16 and 17 year old females are the most vulnerable to poverty, with 8 males (72.7%) and 37 females (100.0%) in their respective age groups living below the poverty level.
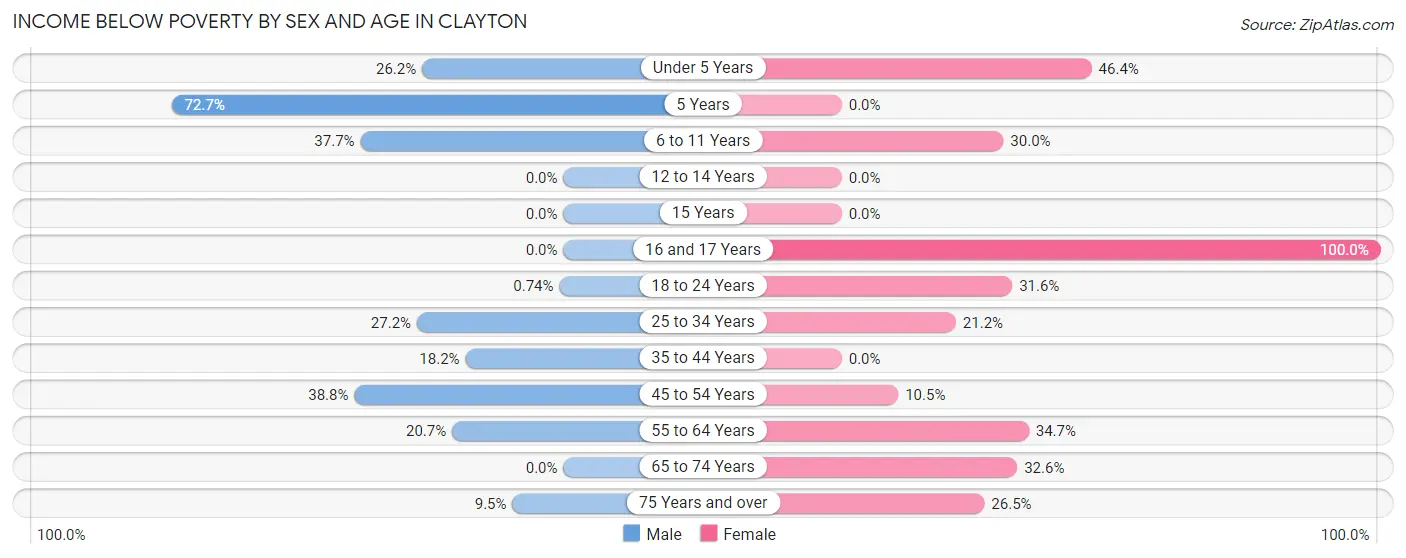
| Age Bracket | Male | Female |
| Under 5 Years | 32 (26.2%) | 32 (46.4%) |
| 5 Years | 8 (72.7%) | 0 (0.0%) |
| 6 to 11 Years | 55 (37.7%) | 30 (30.0%) |
| 12 to 14 Years | 0 (0.0%) | 0 (0.0%) |
| 15 Years | 0 (0.0%) | 0 (0.0%) |
| 16 and 17 Years | 0 (0.0%) | 37 (100.0%) |
| 18 to 24 Years | 1 (0.7%) | 31 (31.6%) |
| 25 to 34 Years | 28 (27.2%) | 43 (21.2%) |
| 35 to 44 Years | 18 (18.2%) | 0 (0.0%) |
| 45 to 54 Years | 52 (38.8%) | 11 (10.5%) |
| 55 to 64 Years | 25 (20.7%) | 42 (34.7%) |
| 65 to 74 Years | 0 (0.0%) | 70 (32.6%) |
| 75 Years and over | 7 (9.5%) | 45 (26.5%) |
| Total | 226 (21.4%) | 341 (26.6%) |
Income Above Poverty by Sex and Age in Clayton
According to the poverty statistics in Clayton, males aged 65 to 74 years and females aged 5 years are the age groups that are most secure financially, with 100.0% of males and 100.0% of females in these age groups living above the poverty line.
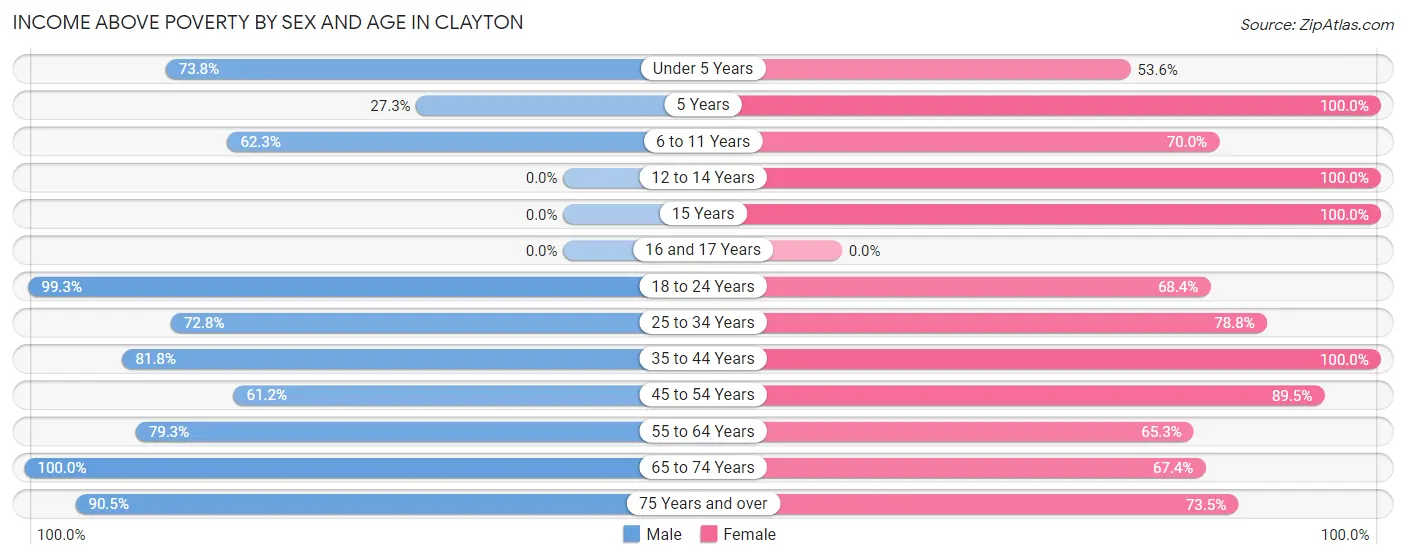
| Age Bracket | Male | Female |
| Under 5 Years | 90 (73.8%) | 37 (53.6%) |
| 5 Years | 3 (27.3%) | 34 (100.0%) |
| 6 to 11 Years | 91 (62.3%) | 70 (70.0%) |
| 12 to 14 Years | 0 (0.0%) | 11 (100.0%) |
| 15 Years | 0 (0.0%) | 11 (100.0%) |
| 16 and 17 Years | 0 (0.0%) | 0 (0.0%) |
| 18 to 24 Years | 134 (99.3%) | 67 (68.4%) |
| 25 to 34 Years | 75 (72.8%) | 160 (78.8%) |
| 35 to 44 Years | 81 (81.8%) | 107 (100.0%) |
| 45 to 54 Years | 82 (61.2%) | 94 (89.5%) |
| 55 to 64 Years | 96 (79.3%) | 79 (65.3%) |
| 65 to 74 Years | 112 (100.0%) | 145 (67.4%) |
| 75 Years and over | 67 (90.5%) | 125 (73.5%) |
| Total | 831 (78.6%) | 940 (73.4%) |
Income Below Poverty Among Married-Couple Families in Clayton
The poverty statistics for married-couple families in Clayton show that 5.1% or 13 of the total 257 families live below the poverty line. Families with no children have the highest poverty rate of 6.0%, comprising of 13 families. On the other hand, families with 1 or 2 children have the lowest poverty rate of 0.0%, which includes 0 families.
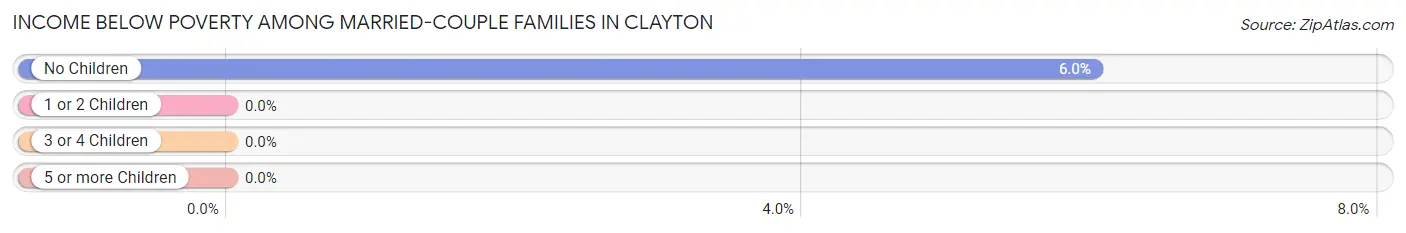
| Children | Above Poverty | Below Poverty |
| No Children | 203 (94.0%) | 13 (6.0%) |
| 1 or 2 Children | 37 (100.0%) | 0 (0.0%) |
| 3 or 4 Children | 4 (100.0%) | 0 (0.0%) |
| 5 or more Children | 0 (0.0%) | 0 (0.0%) |
| Total | 244 (94.9%) | 13 (5.1%) |
Income Below Poverty Among Single-Parent Households in Clayton
According to the poverty data in Clayton, 56.5% or 52 single-father households and 32.3% or 62 single-mother households are living below the poverty line. Among single-father households, those with 1 or 2 children have the highest poverty rate, with 52 households (56.5%) experiencing poverty. Likewise, among single-mother households, those with 1 or 2 children have the highest poverty rate, with 43 households (34.1%) falling below the poverty line.
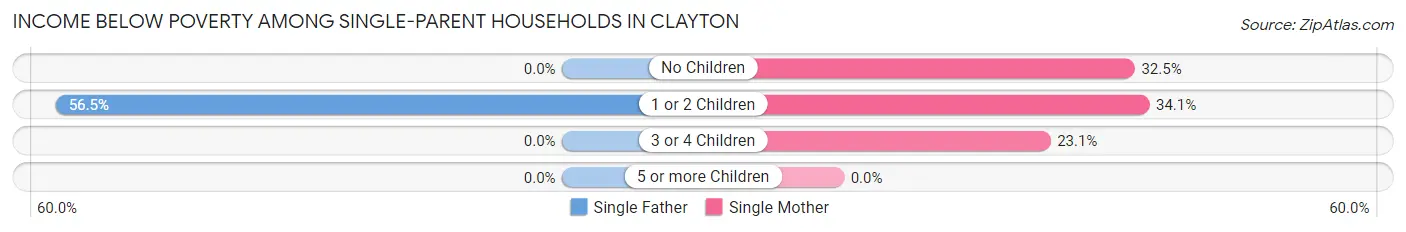
| Children | Single Father | Single Mother |
| No Children | 0 (0.0%) | 13 (32.5%) |
| 1 or 2 Children | 52 (56.5%) | 43 (34.1%) |
| 3 or 4 Children | 0 (0.0%) | 6 (23.1%) |
| 5 or more Children | 0 (0.0%) | 0 (0.0%) |
| Total | 52 (56.5%) | 62 (32.3%) |
Income Below Poverty Among Married-Couple vs Single-Parent Households in Clayton
The poverty data for Clayton shows that 13 of the married-couple family households (5.1%) and 114 of the single-parent households (40.1%) are living below the poverty level. Within the married-couple family households, those with no children have the highest poverty rate, with 13 households (6.0%) falling below the poverty line. Among the single-parent households, those with 1 or 2 children have the highest poverty rate, with 95 household (43.6%) living below poverty.
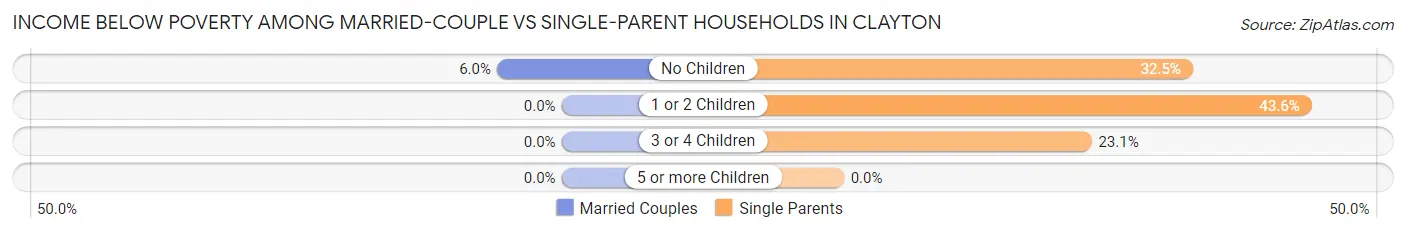
| Children | Married-Couple Families | Single-Parent Households |
| No Children | 13 (6.0%) | 13 (32.5%) |
| 1 or 2 Children | 0 (0.0%) | 95 (43.6%) |
| 3 or 4 Children | 0 (0.0%) | 6 (23.1%) |
| 5 or more Children | 0 (0.0%) | 0 (0.0%) |
| Total | 13 (5.1%) | 114 (40.1%) |
Race in Clayton
The most populous races in Clayton are White / Caucasian (1,818 | 64.3%), Hispanic or Latino (1,489 | 52.7%), and Two or more Races (708 | 25.1%).
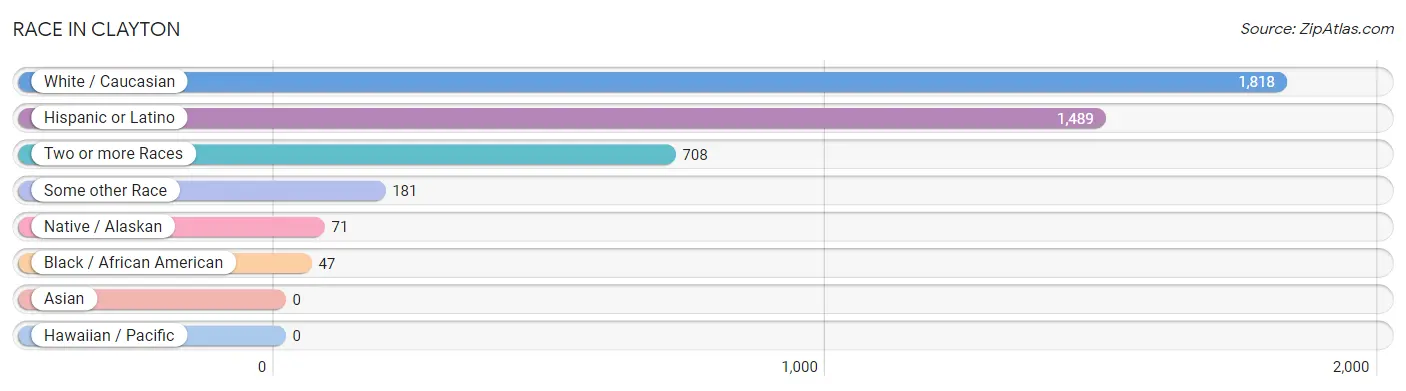
| Race | # Population | % Population |
| Asian | 0 | 0.0% |
| Black / African American | 47 | 1.7% |
| Hawaiian / Pacific | 0 | 0.0% |
| Hispanic or Latino | 1,489 | 52.7% |
| Native / Alaskan | 71 | 2.5% |
| White / Caucasian | 1,818 | 64.3% |
| Two or more Races | 708 | 25.1% |
| Some other Race | 181 | 6.4% |
| Total | 2,825 | 100.0% |
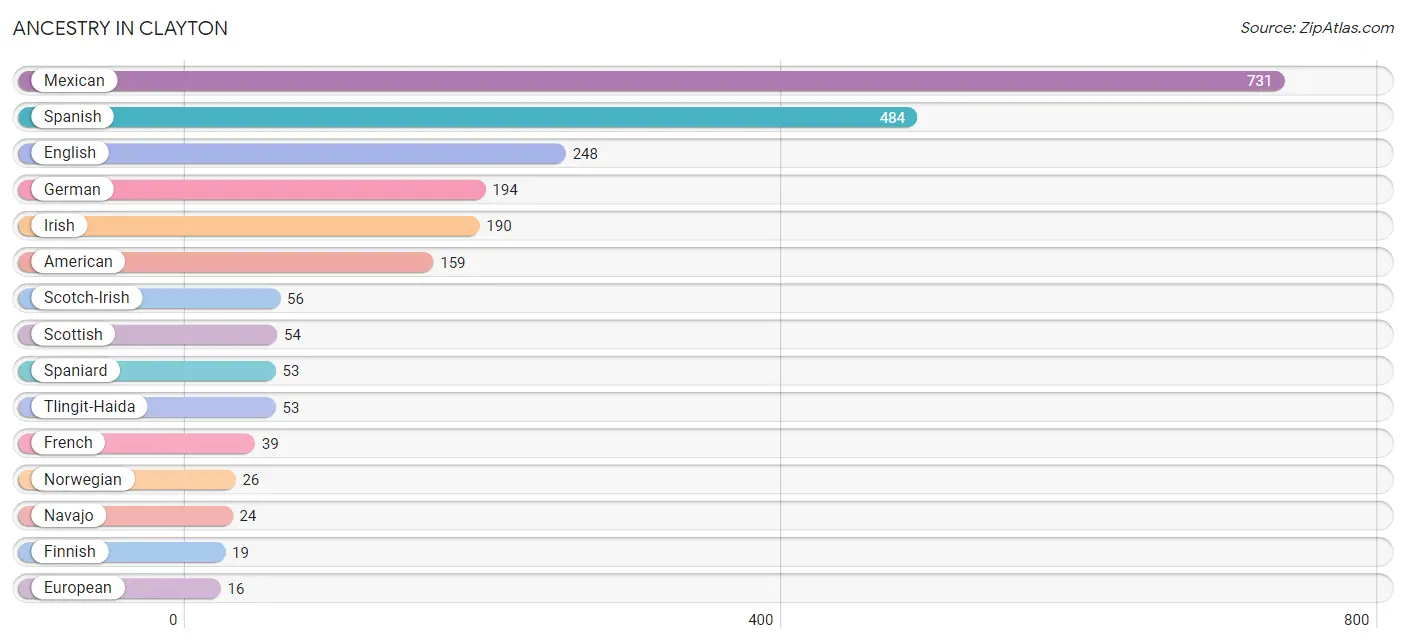
Ancestry in Clayton
The most populous ancestries reported in Clayton are Mexican (731 | 25.9%), Spanish (484 | 17.1%), English (248 | 8.8%), German (194 | 6.9%), and Irish (190 | 6.7%), together accounting for 65.4% of all Clayton residents.
| Ancestry | # Population | % Population |
| African | 8 | 0.3% |
| Alaska Native | 5 | 0.2% |
| American | 159 | 5.6% |
| Apache | 2 | 0.1% |
| British | 5 | 0.2% |
| Cherokee | 9 | 0.3% |
| Croatian | 1 | 0.0% |
| Dutch | 5 | 0.2% |
| English | 248 | 8.8% |
| European | 16 | 0.6% |
| Finnish | 19 | 0.7% |
| French | 39 | 1.4% |
| French Canadian | 1 | 0.0% |
| German | 194 | 6.9% |
| Irish | 190 | 6.7% |
| Italian | 13 | 0.5% |
| Mexican | 731 | 25.9% |
| Navajo | 24 | 0.9% |
| Northern European | 6 | 0.2% |
| Norwegian | 26 | 0.9% |
| Polish | 13 | 0.5% |
| Portuguese | 6 | 0.2% |
| Russian | 10 | 0.4% |
| Scotch-Irish | 56 | 2.0% |
| Scottish | 54 | 1.9% |
| Slovak | 3 | 0.1% |
| Spaniard | 53 | 1.9% |
| Spanish | 484 | 17.1% |
| Subsaharan African | 8 | 0.3% |
| Swedish | 12 | 0.4% |
| Swiss | 3 | 0.1% |
| Tlingit-Haida | 53 | 1.9% |
| Welsh | 2 | 0.1% | View All 33 Rows |
Immigrants in Clayton
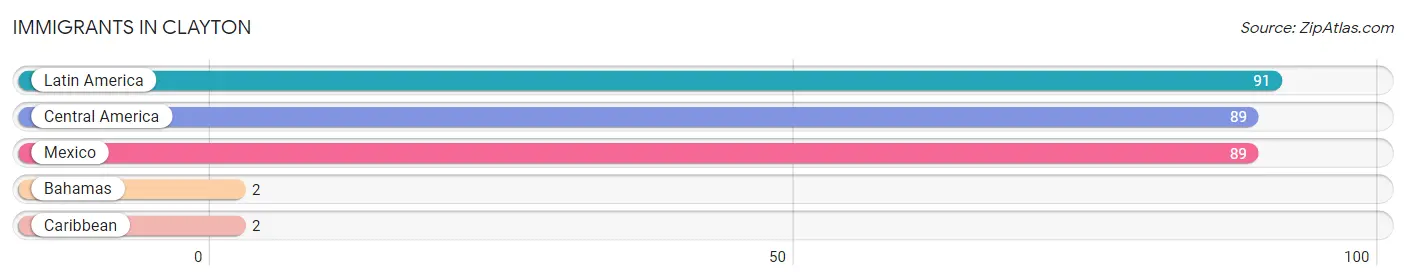
The most numerous immigrant groups reported in Clayton came from Latin America (91 | 3.2%), Central America (89 | 3.2%), Mexico (89 | 3.2%), Bahamas (2 | 0.1%), and Caribbean (2 | 0.1%), together accounting for 9.7% of all Clayton residents.
| Immigration Origin | # Population | % Population |
| Bahamas | 2 | 0.1% |
| Caribbean | 2 | 0.1% |
| Central America | 89 | 3.2% |
| Latin America | 91 | 3.2% |
| Mexico | 89 | 3.2% | View All 5 Rows |
Sex and Age in Clayton
Sex and Age in Clayton
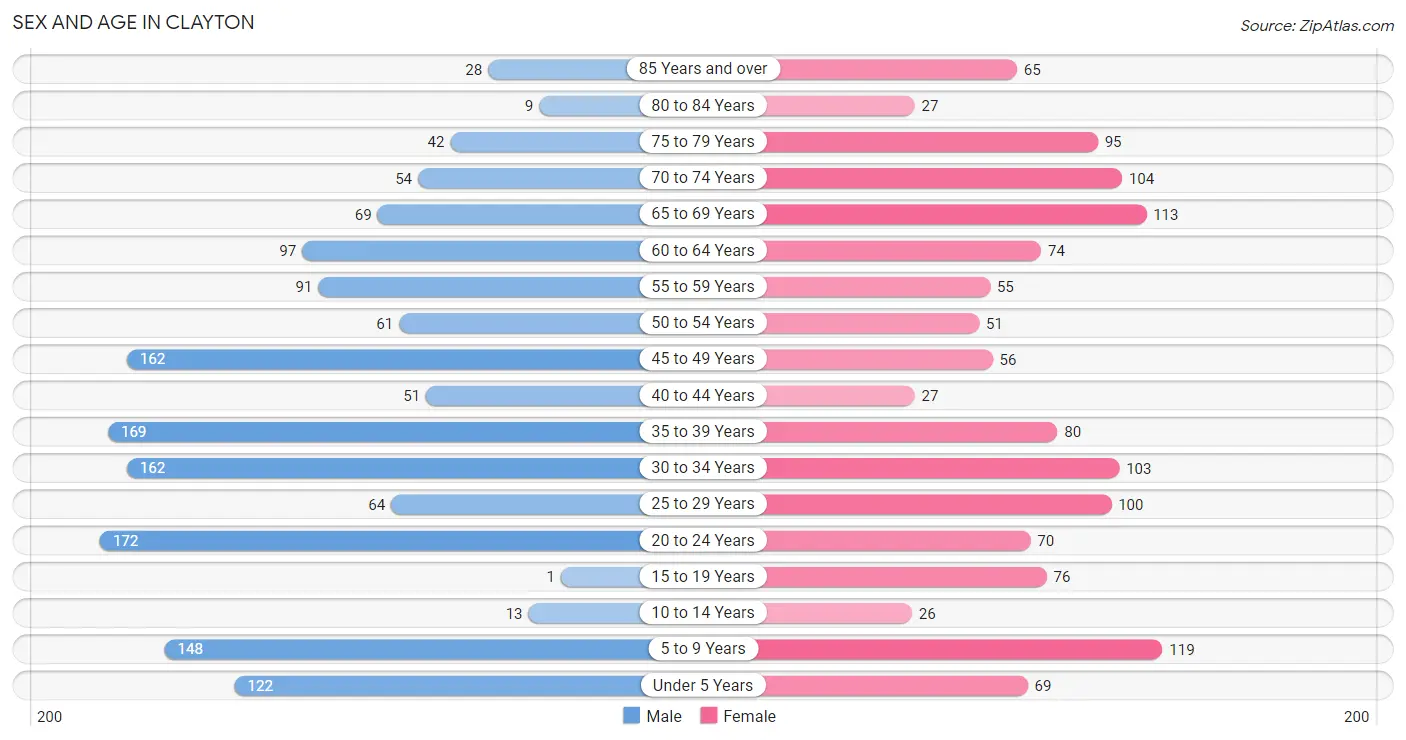
The most populous age groups in Clayton are 20 to 24 Years (172 | 11.4%) for men and 5 to 9 Years (119 | 9.1%) for women.
| Age Bracket | Male | Female |
| Under 5 Years | 122 (8.1%) | 69 (5.3%) |
| 5 to 9 Years | 148 (9.8%) | 119 (9.1%) |
| 10 to 14 Years | 13 (0.9%) | 26 (2.0%) |
| 15 to 19 Years | 1 (0.1%) | 76 (5.8%) |
| 20 to 24 Years | 172 (11.4%) | 70 (5.3%) |
| 25 to 29 Years | 64 (4.2%) | 100 (7.6%) |
| 30 to 34 Years | 162 (10.7%) | 103 (7.9%) |
| 35 to 39 Years | 169 (11.2%) | 80 (6.1%) |
| 40 to 44 Years | 51 (3.4%) | 27 (2.1%) |
| 45 to 49 Years | 162 (10.7%) | 56 (4.3%) |
| 50 to 54 Years | 61 (4.0%) | 51 (3.9%) |
| 55 to 59 Years | 91 (6.0%) | 55 (4.2%) |
| 60 to 64 Years | 97 (6.4%) | 74 (5.7%) |
| 65 to 69 Years | 69 (4.5%) | 113 (8.6%) |
| 70 to 74 Years | 54 (3.6%) | 104 (7.9%) |
| 75 to 79 Years | 42 (2.8%) | 95 (7.2%) |
| 80 to 84 Years | 9 (0.6%) | 27 (2.1%) |
| 85 Years and over | 28 (1.8%) | 65 (5.0%) |
| Total | 1,515 (100.0%) | 1,310 (100.0%) |
Families and Households in Clayton
Median Family Size in Clayton
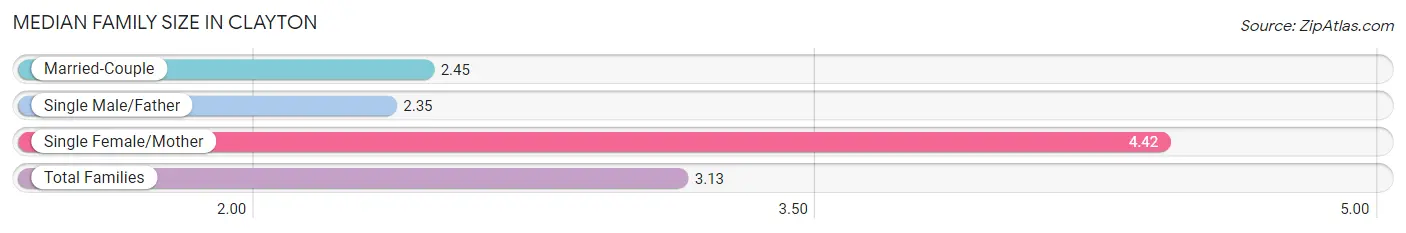
The median family size in Clayton is 3.13 persons per family, with single female/mother families (192 | 35.5%) accounting for the largest median family size of 4.42 persons per family. On the other hand, single male/father families (92 | 17.0%) represent the smallest median family size with 2.35 persons per family.
| Family Type | # Families | Family Size |
| Married-Couple | 257 (47.5%) | 2.45 |
| Single Male/Father | 92 (17.0%) | 2.35 |
| Single Female/Mother | 192 (35.5%) | 4.42 |
| Total Families | 541 (100.0%) | 3.13 |
Median Household Size in Clayton
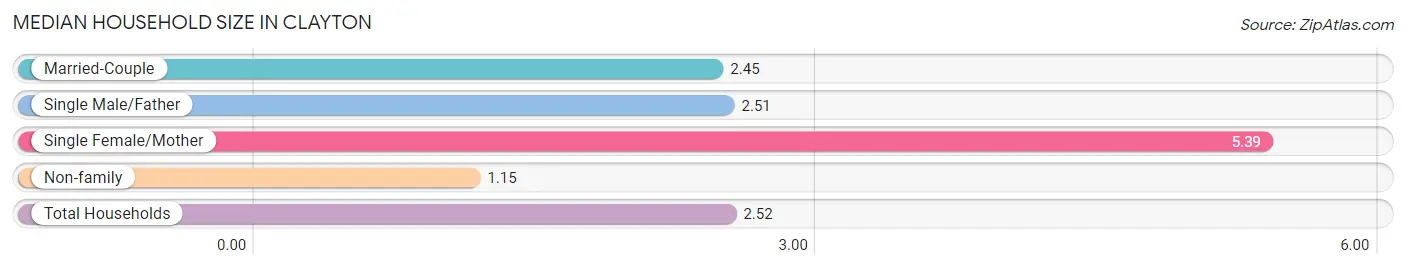
The median household size in Clayton is 2.52 persons per household, with single female/mother households (192 | 20.6%) accounting for the largest median household size of 5.39 persons per household. non-family households (389 | 41.8%) represent the smallest median household size with 1.15 persons per household.
| Household Type | # Households | Household Size |
| Married-Couple | 257 (27.6%) | 2.45 |
| Single Male/Father | 92 (9.9%) | 2.51 |
| Single Female/Mother | 192 (20.6%) | 5.39 |
| Non-family | 389 (41.8%) | 1.15 |
| Total Households | 930 (100.0%) | 2.52 |
Household Size by Marriage Status in Clayton
Out of a total of 930 households in Clayton, 541 (58.2%) are family households, while 389 (41.8%) are nonfamily households. The most numerous type of family households are 2-person households, comprising 292, and the most common type of nonfamily households are 1-person households, comprising 341.
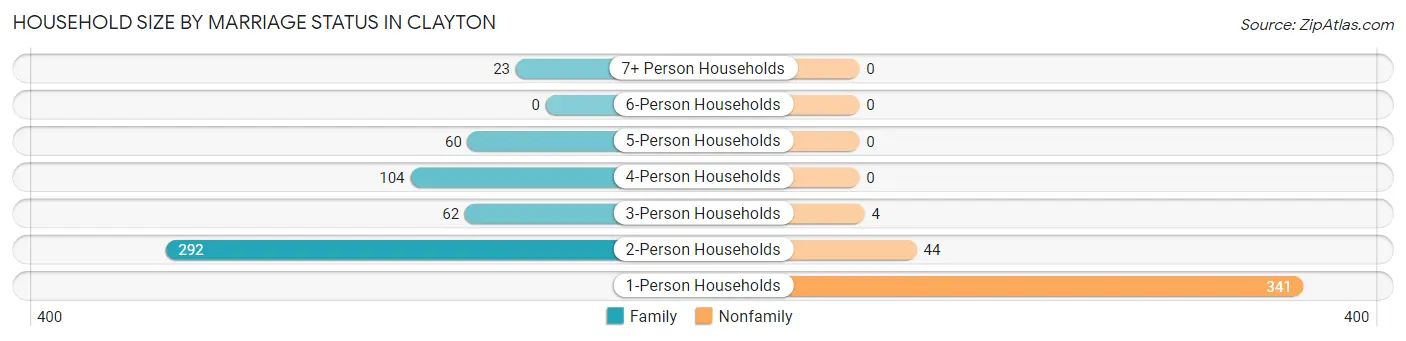
| Household Size | Family Households | Nonfamily Households |
| 1-Person Households | - | 341 (36.7%) |
| 2-Person Households | 292 (31.4%) | 44 (4.7%) |
| 3-Person Households | 62 (6.7%) | 4 (0.4%) |
| 4-Person Households | 104 (11.2%) | 0 (0.0%) |
| 5-Person Households | 60 (6.5%) | 0 (0.0%) |
| 6-Person Households | 0 (0.0%) | 0 (0.0%) |
| 7+ Person Households | 23 (2.5%) | 0 (0.0%) |
| Total | 541 (58.2%) | 389 (41.8%) |
Female Fertility in Clayton
Fertility by Age in Clayton
Average fertility rate in Clayton is 72.0 births per 1,000 women. Women in the age bracket of 20 to 34 years have the highest fertility rate with 136.0 births per 1,000 women. Women in the age bracket of 20 to 34 years acount for 100.0% of all women with births.
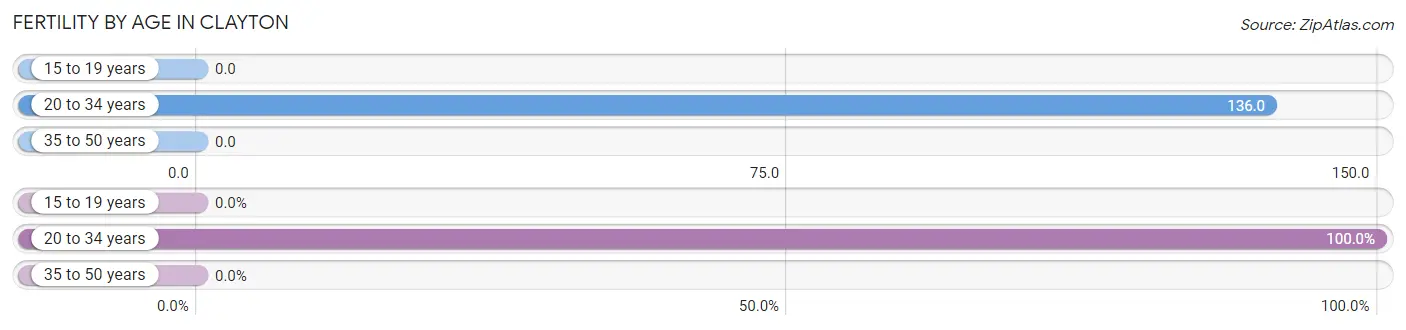
| Age Bracket | Women with Births | Births / 1,000 Women |
| 15 to 19 years | 0 (0.0%) | 0.0 |
| 20 to 34 years | 37 (100.0%) | 136.0 |
| 35 to 50 years | 0 (0.0%) | 0.0 |
| Total | 37 (100.0%) | 72.0 |
Fertility by Age by Marriage Status in Clayton
35.1% of women with births (37) in Clayton are married. The highest percentage of unmarried women with births falls into 20 to 34 years age bracket with 64.9% of them unmarried at the time of birth, while the lowest percentage of unmarried women with births belong to 20 to 34 years age bracket with 64.9% of them unmarried.
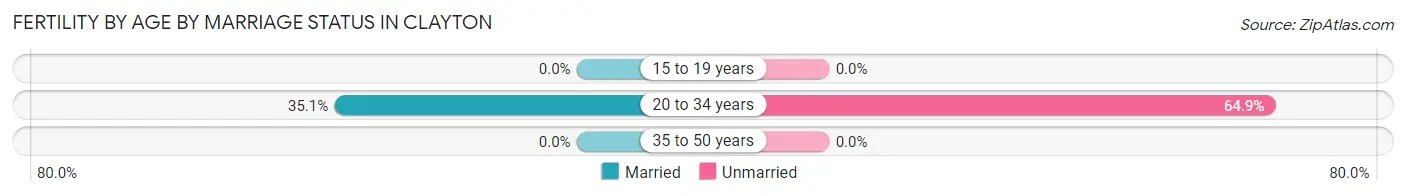
| Age Bracket | Married | Unmarried |
| 15 to 19 years | 0 (0.0%) | 0 (0.0%) |
| 20 to 34 years | 13 (35.1%) | 24 (64.9%) |
| 35 to 50 years | 0 (0.0%) | 0 (0.0%) |
| Total | 13 (35.1%) | 24 (64.9%) |
Fertility by Education in Clayton
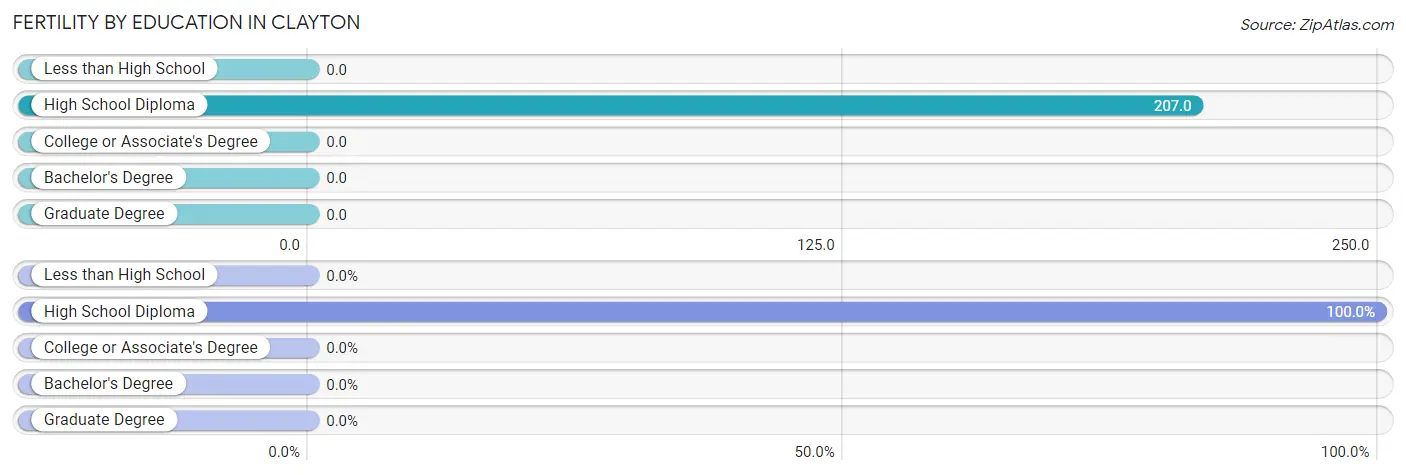
| Educational Attainment | Women with Births | Births / 1,000 Women |
| Less than High School | 0 (0.0%) | 0.0 |
| High School Diploma | 37 (100.0%) | 207.0 |
| College or Associate's Degree | 0 (0.0%) | 0.0 |
| Bachelor's Degree | 0 (0.0%) | 0.0 |
| Graduate Degree | 0 (0.0%) | 0.0 |
| Total | 37 (100.0%) | 72.0 |
Fertility by Education by Marriage Status in Clayton
64.9% of women with births in Clayton are unmarried. Women with the educational attainment of high school diploma are most likely to be married with 35.1% of them married at childbirth, while women with the educational attainment of high school diploma are least likely to be married with 64.9% of them unmarried at childbirth.
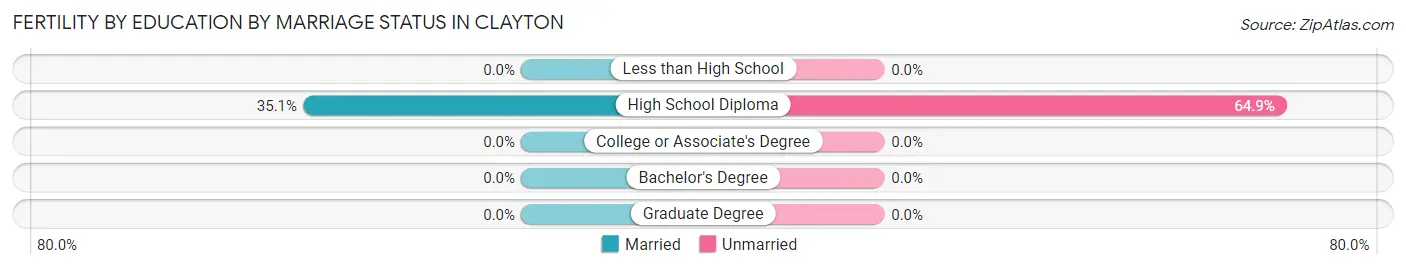
| Educational Attainment | Married | Unmarried |
| Less than High School | 0 (0.0%) | 0 (0.0%) |
| High School Diploma | 13 (35.1%) | 24 (64.9%) |
| College or Associate's Degree | 0 (0.0%) | 0 (0.0%) |
| Bachelor's Degree | 0 (0.0%) | 0 (0.0%) |
| Graduate Degree | 0 (0.0%) | 0 (0.0%) |
| Total | 13 (35.1%) | 24 (64.9%) |
Employment Characteristics in Clayton
Employment by Class of Employer in Clayton
Among the 785 employed individuals in Clayton, private company employees (472 | 60.1%), local government employees (116 | 14.8%), and federal government employees (54 | 6.9%) make up the most common classes of employment.
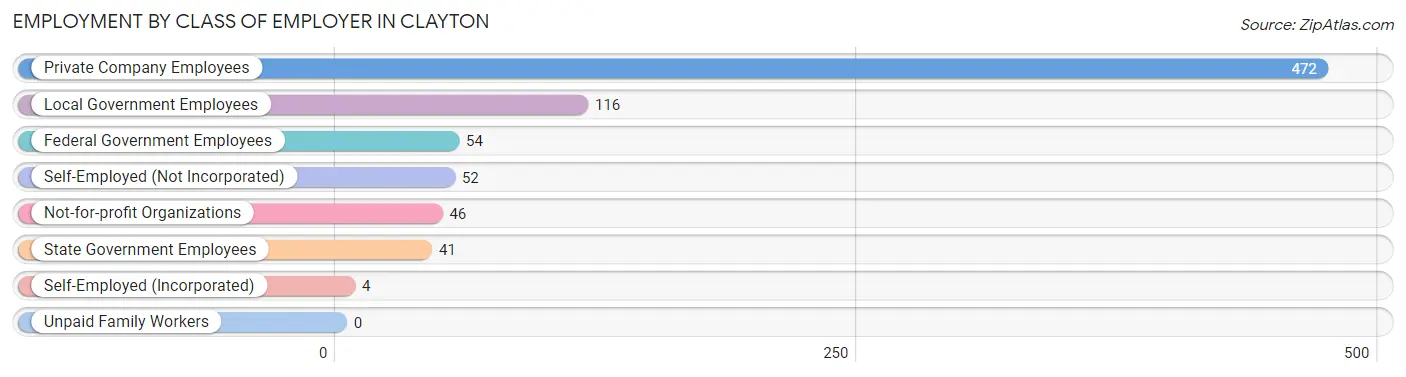
| Employer Class | # Employees | % Employees |
| Private Company Employees | 472 | 60.1% |
| Self-Employed (Incorporated) | 4 | 0.5% |
| Self-Employed (Not Incorporated) | 52 | 6.6% |
| Not-for-profit Organizations | 46 | 5.9% |
| Local Government Employees | 116 | 14.8% |
| State Government Employees | 41 | 5.2% |
| Federal Government Employees | 54 | 6.9% |
| Unpaid Family Workers | 0 | 0.0% |
| Total | 785 | 100.0% |
Employment Status by Age in Clayton
According to the labor force statistics for Clayton, out of the total population over 16 years of age (2,317), 38.0% or 880 individuals are in the labor force, with 8.8% or 77 of them unemployed. The age group with the highest labor force participation rate is 30 to 34 years, with 59.2% or 157 individuals in the labor force. Within the labor force, the 20 to 24 years age range has the highest percentage of unemployed individuals, with 20.2% or 24 of them being unemployed.
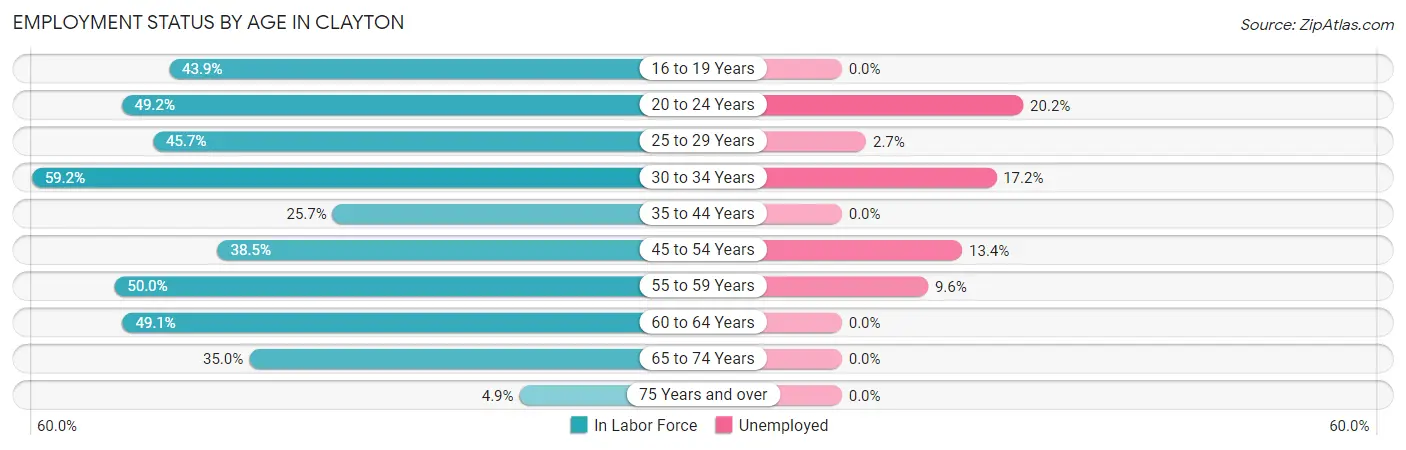
| Age Bracket | In Labor Force | Unemployed |
| 16 to 19 Years | 29 (43.9%) | 0 (0.0%) |
| 20 to 24 Years | 119 (49.2%) | 24 (20.2%) |
| 25 to 29 Years | 75 (45.7%) | 2 (2.7%) |
| 30 to 34 Years | 157 (59.2%) | 27 (17.2%) |
| 35 to 44 Years | 84 (25.7%) | 0 (0.0%) |
| 45 to 54 Years | 127 (38.5%) | 17 (13.4%) |
| 55 to 59 Years | 73 (50.0%) | 7 (9.6%) |
| 60 to 64 Years | 84 (49.1%) | 0 (0.0%) |
| 65 to 74 Years | 119 (35.0%) | 0 (0.0%) |
| 75 Years and over | 13 (4.9%) | 0 (0.0%) |
| Total | 880 (38.0%) | 77 (8.8%) |
Employment Status by Educational Attainment in Clayton
According to labor force statistics for Clayton, 42.8% of individuals (600) out of the total population between 25 and 64 years of age (1,403) are in the labor force, with 8.8% or 53 of them being unemployed. The group with the highest labor force participation rate are those with the educational attainment of college / associate degree, with 57.4% or 205 individuals in the labor force. Within the labor force, individuals with less than high school education have the highest percentage of unemployment, with 65.4% or 34 of them being unemployed.
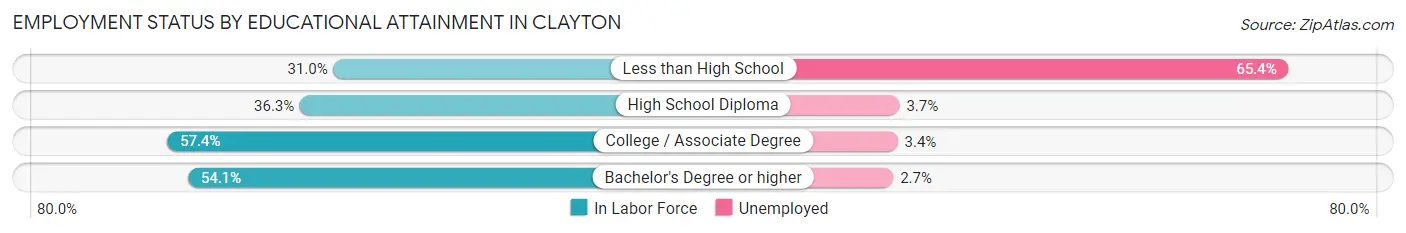
| Educational Attainment | In Labor Force | Unemployed |
| Less than High School | 52 (31.0%) | 110 (65.4%) |
| High School Diploma | 270 (36.3%) | 27 (3.7%) |
| College / Associate Degree | 205 (57.4%) | 12 (3.4%) |
| Bachelor's Degree or higher | 73 (54.1%) | 4 (2.7%) |
| Total | 600 (42.8%) | 123 (8.8%) |
Employment Occupations by Sex in Clayton
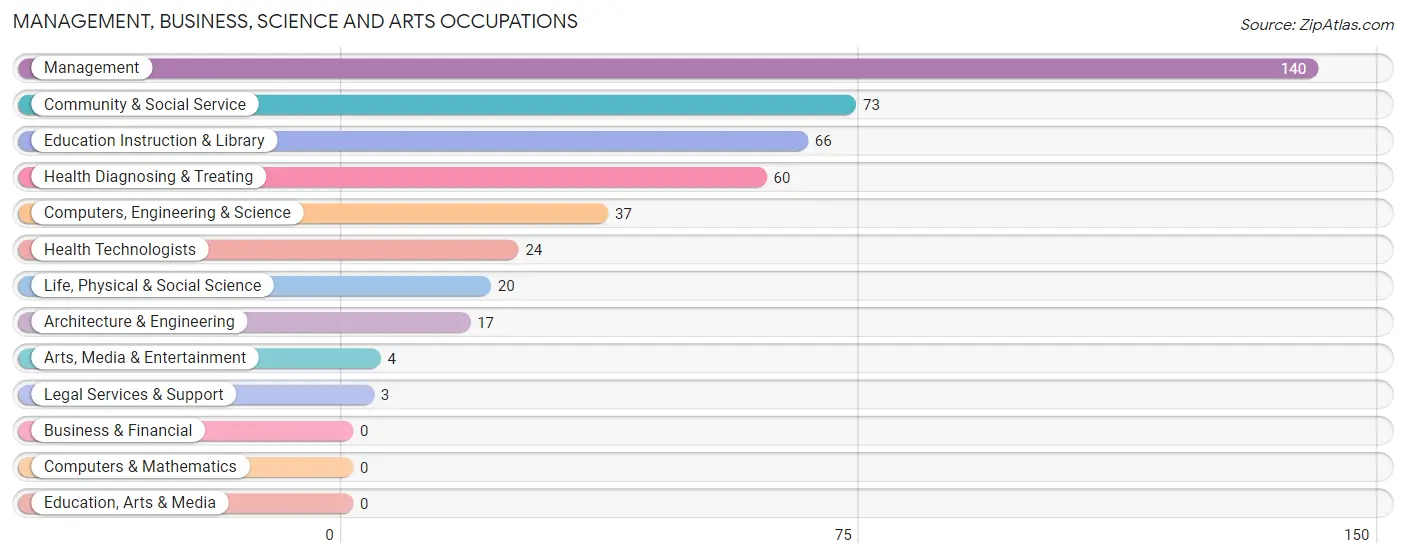
Management, Business, Science and Arts Occupations
The most common Management, Business, Science and Arts occupations in Clayton are Management (140 | 17.4%), Community & Social Service (73 | 9.1%), Education Instruction & Library (66 | 8.2%), Health Diagnosing & Treating (60 | 7.5%), and Computers, Engineering & Science (37 | 4.6%).
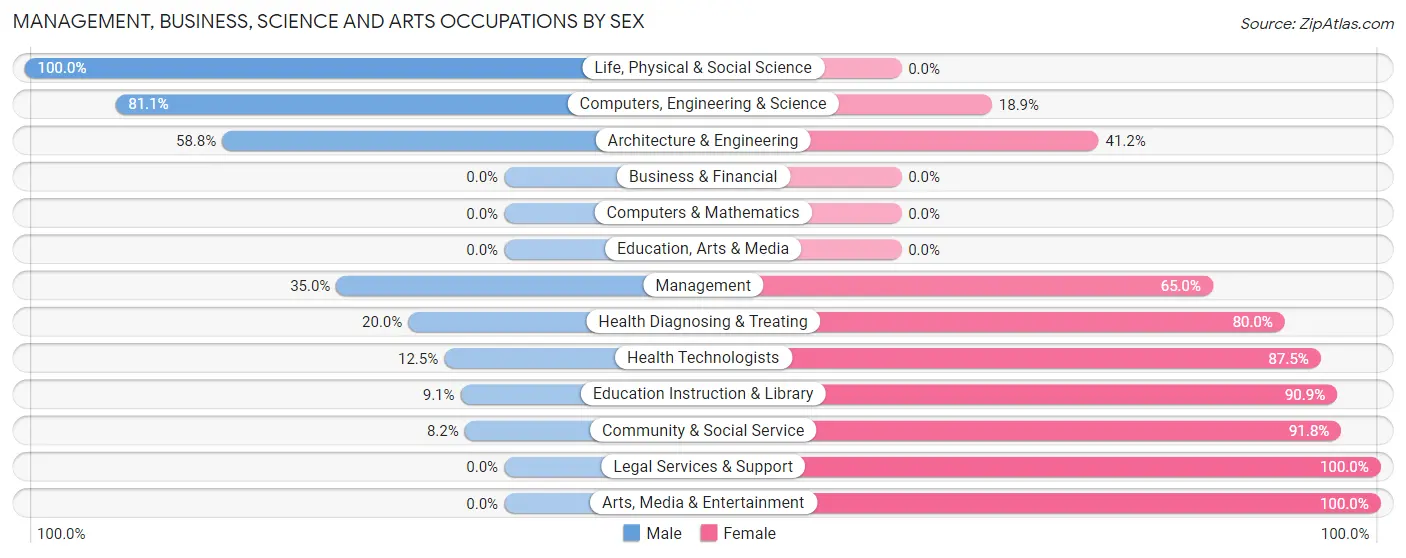
Management, Business, Science and Arts Occupations by Sex
Within the Management, Business, Science and Arts occupations in Clayton, the most male-oriented occupations are Life, Physical & Social Science (100.0%), Computers, Engineering & Science (81.1%), and Architecture & Engineering (58.8%), while the most female-oriented occupations are Legal Services & Support (100.0%), Arts, Media & Entertainment (100.0%), and Community & Social Service (91.8%).
| Occupation | Male | Female |
| Management | 49 (35.0%) | 91 (65.0%) |
| Business & Financial | 0 (0.0%) | 0 (0.0%) |
| Computers, Engineering & Science | 30 (81.1%) | 7 (18.9%) |
| Computers & Mathematics | 0 (0.0%) | 0 (0.0%) |
| Architecture & Engineering | 10 (58.8%) | 7 (41.2%) |
| Life, Physical & Social Science | 20 (100.0%) | 0 (0.0%) |
| Community & Social Service | 6 (8.2%) | 67 (91.8%) |
| Education, Arts & Media | 0 (0.0%) | 0 (0.0%) |
| Legal Services & Support | 0 (0.0%) | 3 (100.0%) |
| Education Instruction & Library | 6 (9.1%) | 60 (90.9%) |
| Arts, Media & Entertainment | 0 (0.0%) | 4 (100.0%) |
| Health Diagnosing & Treating | 12 (20.0%) | 48 (80.0%) |
| Health Technologists | 3 (12.5%) | 21 (87.5%) |
| Total (Category) | 97 (31.3%) | 213 (68.7%) |
| Total (Overall) | 357 (44.5%) | 446 (55.5%) |
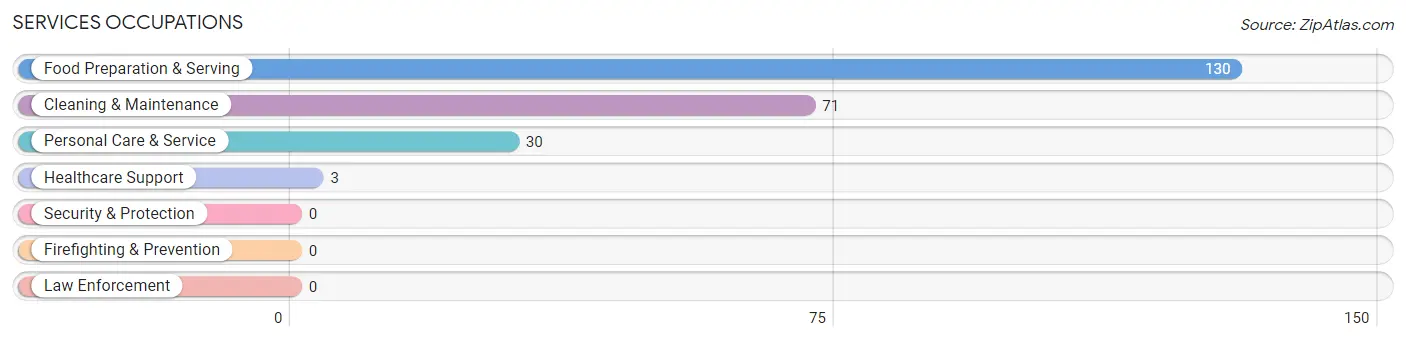
Services Occupations
The most common Services occupations in Clayton are Food Preparation & Serving (130 | 16.2%), Cleaning & Maintenance (71 | 8.8%), Personal Care & Service (30 | 3.7%), and Healthcare Support (3 | 0.4%).
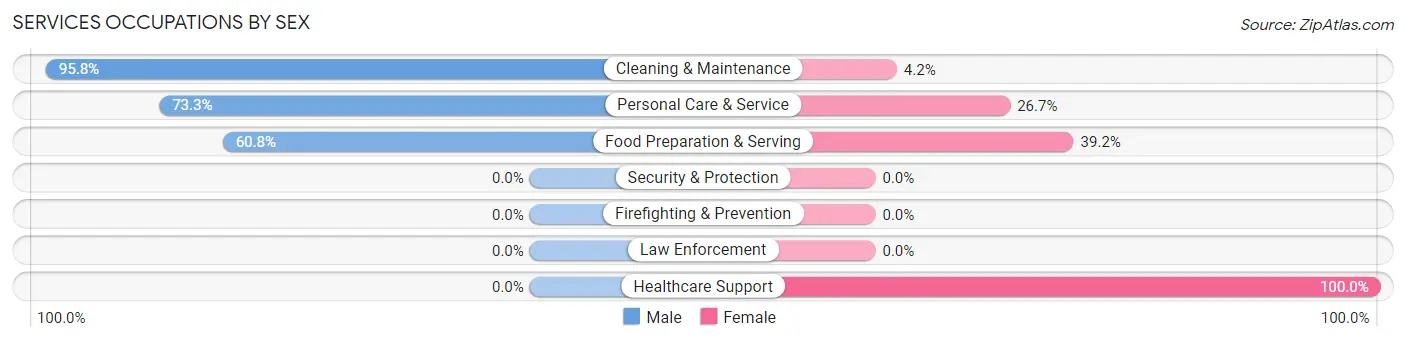
Services Occupations by Sex
Within the Services occupations in Clayton, the most male-oriented occupations are Cleaning & Maintenance (95.8%), Personal Care & Service (73.3%), and Food Preparation & Serving (60.8%), while the most female-oriented occupations are Healthcare Support (100.0%), Food Preparation & Serving (39.2%), and Personal Care & Service (26.7%).
| Occupation | Male | Female |
| Healthcare Support | 0 (0.0%) | 3 (100.0%) |
| Security & Protection | 0 (0.0%) | 0 (0.0%) |
| Firefighting & Prevention | 0 (0.0%) | 0 (0.0%) |
| Law Enforcement | 0 (0.0%) | 0 (0.0%) |
| Food Preparation & Serving | 79 (60.8%) | 51 (39.2%) |
| Cleaning & Maintenance | 68 (95.8%) | 3 (4.2%) |
| Personal Care & Service | 22 (73.3%) | 8 (26.7%) |
| Total (Category) | 169 (72.2%) | 65 (27.8%) |
| Total (Overall) | 357 (44.5%) | 446 (55.5%) |
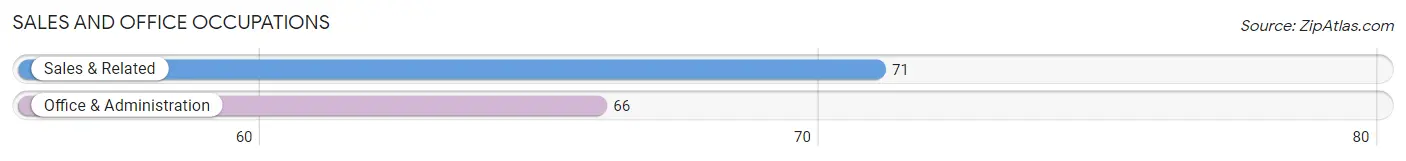
Sales and Office Occupations
The most common Sales and Office occupations in Clayton are Sales & Related (71 | 8.8%), and Office & Administration (66 | 8.2%).
Sales and Office Occupations by Sex
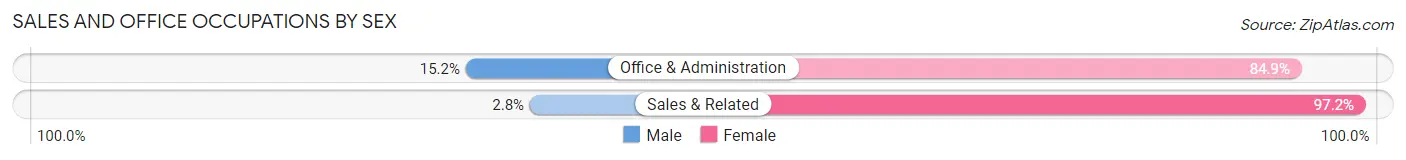
| Occupation | Male | Female |
| Sales & Related | 2 (2.8%) | 69 (97.2%) |
| Office & Administration | 10 (15.1%) | 56 (84.9%) |
| Total (Category) | 12 (8.8%) | 125 (91.2%) |
| Total (Overall) | 357 (44.5%) | 446 (55.5%) |
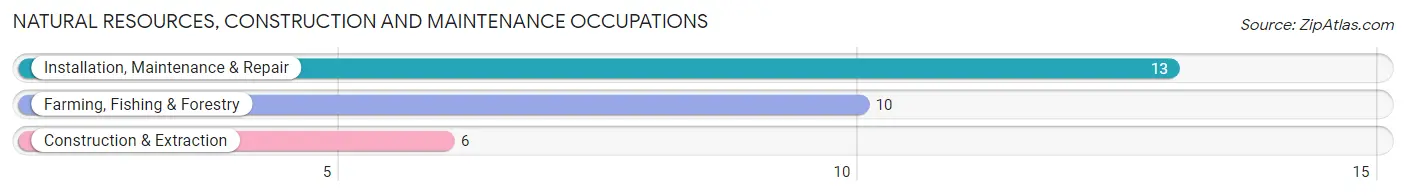
Natural Resources, Construction and Maintenance Occupations
The most common Natural Resources, Construction and Maintenance occupations in Clayton are Installation, Maintenance & Repair (13 | 1.6%), Farming, Fishing & Forestry (10 | 1.3%), and Construction & Extraction (6 | 0.7%).
Natural Resources, Construction and Maintenance Occupations by Sex
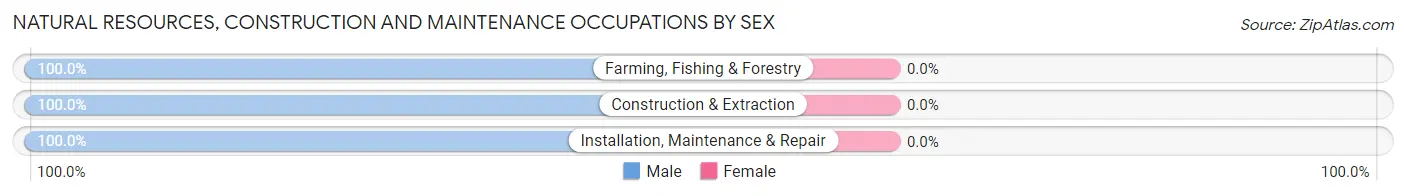
| Occupation | Male | Female |
| Farming, Fishing & Forestry | 10 (100.0%) | 0 (0.0%) |
| Construction & Extraction | 6 (100.0%) | 0 (0.0%) |
| Installation, Maintenance & Repair | 13 (100.0%) | 0 (0.0%) |
| Total (Category) | 29 (100.0%) | 0 (0.0%) |
| Total (Overall) | 357 (44.5%) | 446 (55.5%) |
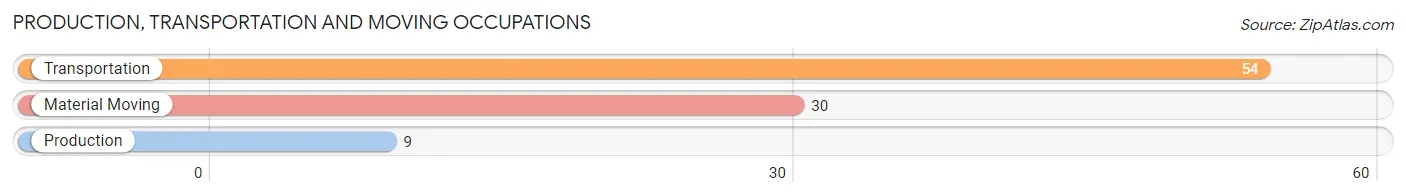
Production, Transportation and Moving Occupations
The most common Production, Transportation and Moving occupations in Clayton are Transportation (54 | 6.7%), Material Moving (30 | 3.7%), and Production (9 | 1.1%).
Production, Transportation and Moving Occupations by Sex
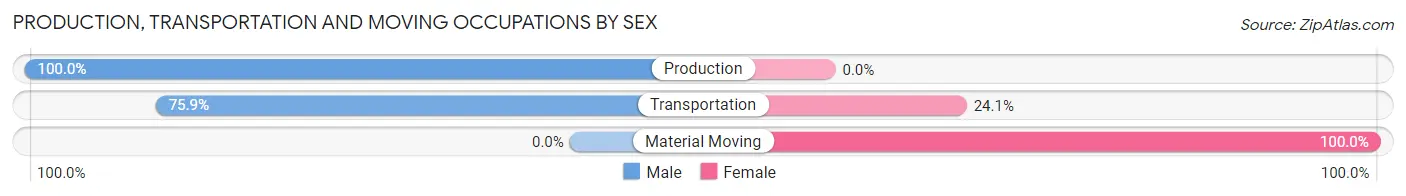
| Occupation | Male | Female |
| Production | 9 (100.0%) | 0 (0.0%) |
| Transportation | 41 (75.9%) | 13 (24.1%) |
| Material Moving | 0 (0.0%) | 30 (100.0%) |
| Total (Category) | 50 (53.8%) | 43 (46.2%) |
| Total (Overall) | 357 (44.5%) | 446 (55.5%) |
Employment Industries by Sex in Clayton
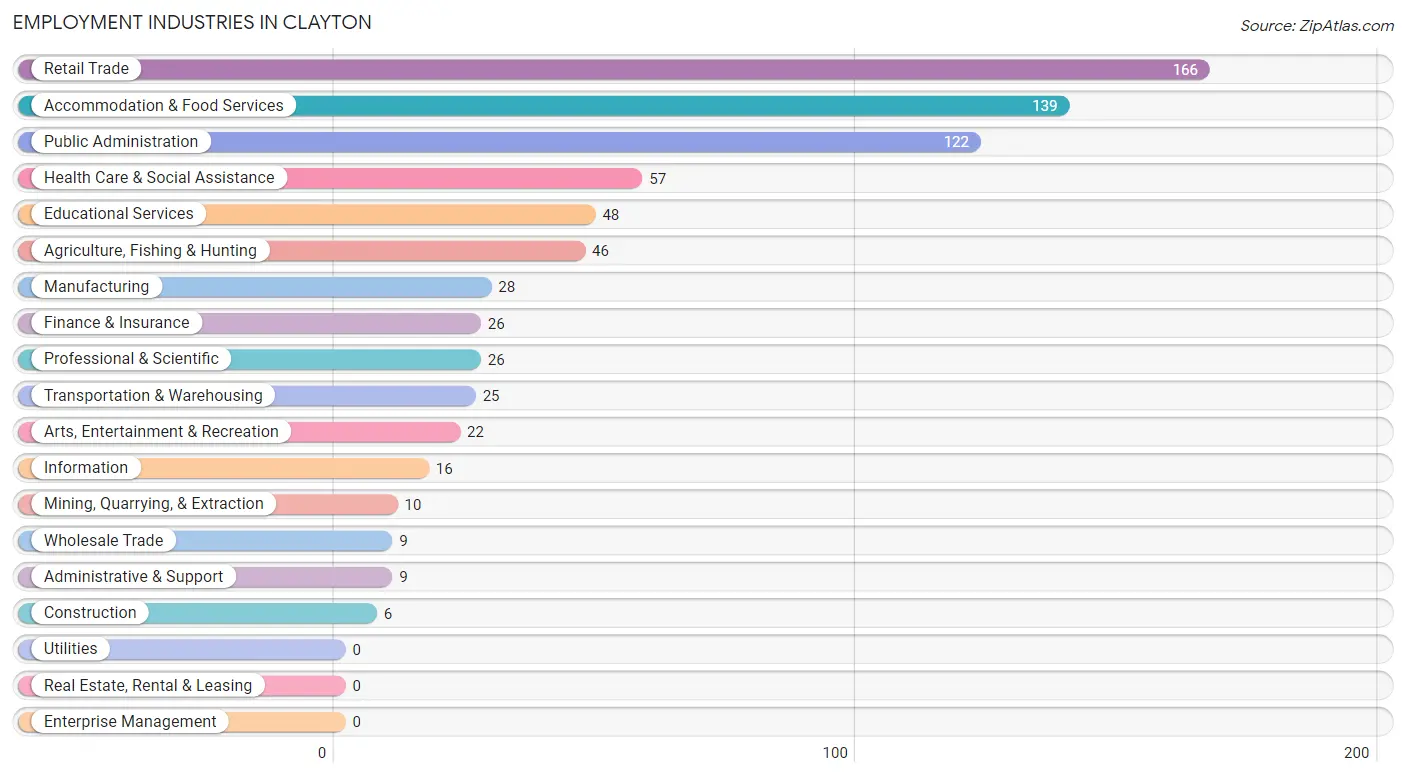
Employment Industries in Clayton
The major employment industries in Clayton include Retail Trade (166 | 20.7%), Accommodation & Food Services (139 | 17.3%), Public Administration (122 | 15.2%), Health Care & Social Assistance (57 | 7.1%), and Educational Services (48 | 6.0%).
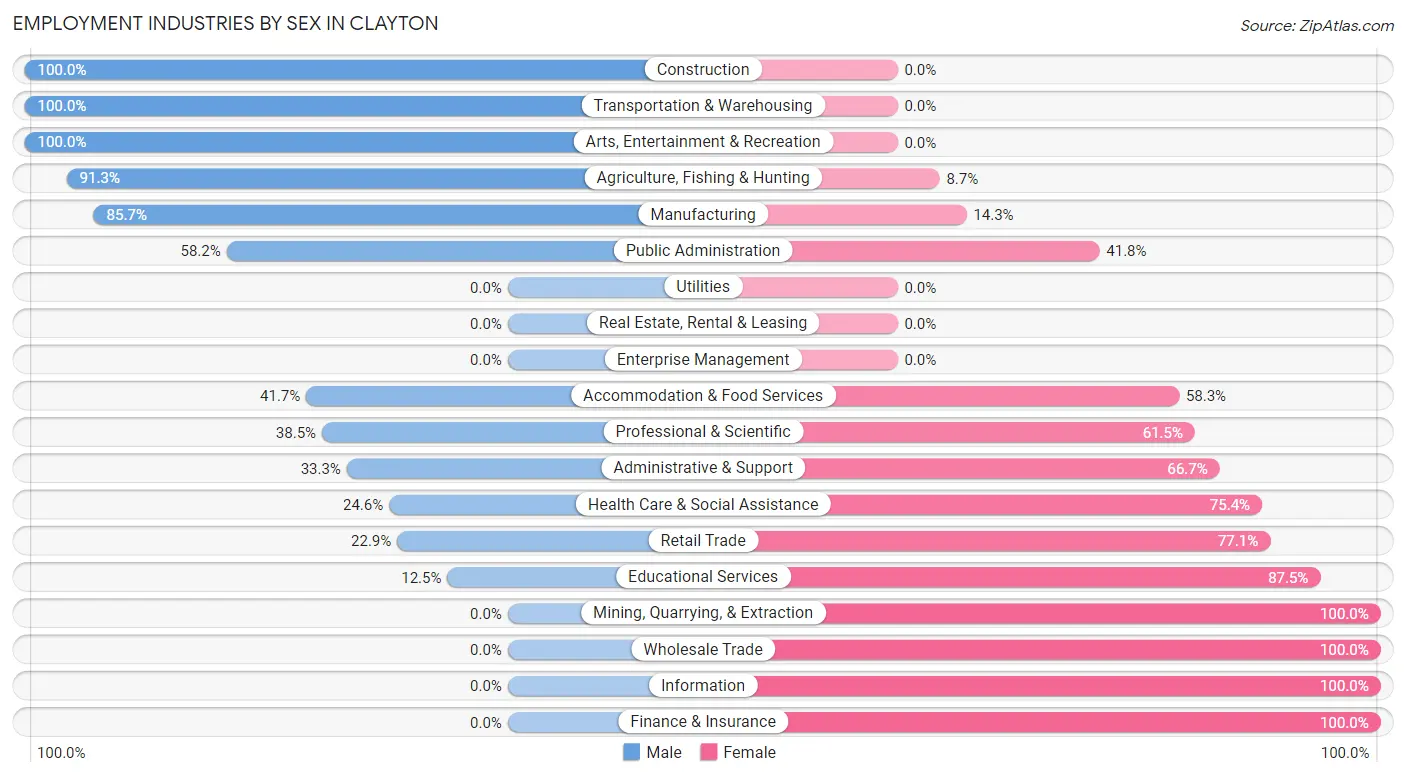
Employment Industries by Sex in Clayton
The Clayton industries that see more men than women are Construction (100.0%), Transportation & Warehousing (100.0%), and Arts, Entertainment & Recreation (100.0%), whereas the industries that tend to have a higher number of women are Mining, Quarrying, & Extraction (100.0%), Wholesale Trade (100.0%), and Information (100.0%).
| Industry | Male | Female |
| Agriculture, Fishing & Hunting | 42 (91.3%) | 4 (8.7%) |
| Mining, Quarrying, & Extraction | 0 (0.0%) | 10 (100.0%) |
| Construction | 6 (100.0%) | 0 (0.0%) |
| Manufacturing | 24 (85.7%) | 4 (14.3%) |
| Wholesale Trade | 0 (0.0%) | 9 (100.0%) |
| Retail Trade | 38 (22.9%) | 128 (77.1%) |
| Transportation & Warehousing | 25 (100.0%) | 0 (0.0%) |
| Utilities | 0 (0.0%) | 0 (0.0%) |
| Information | 0 (0.0%) | 16 (100.0%) |
| Finance & Insurance | 0 (0.0%) | 26 (100.0%) |
| Real Estate, Rental & Leasing | 0 (0.0%) | 0 (0.0%) |
| Professional & Scientific | 10 (38.5%) | 16 (61.5%) |
| Enterprise Management | 0 (0.0%) | 0 (0.0%) |
| Administrative & Support | 3 (33.3%) | 6 (66.7%) |
| Educational Services | 6 (12.5%) | 42 (87.5%) |
| Health Care & Social Assistance | 14 (24.6%) | 43 (75.4%) |
| Arts, Entertainment & Recreation | 22 (100.0%) | 0 (0.0%) |
| Accommodation & Food Services | 58 (41.7%) | 81 (58.3%) |
| Public Administration | 71 (58.2%) | 51 (41.8%) |
| Total | 357 (44.5%) | 446 (55.5%) |
Education in Clayton
School Enrollment in Clayton
The most common levels of schooling among the 504 students in Clayton are elementary school (226 | 44.8%), college / undergraduate (121 | 24.0%), and high school (54 | 10.7%).
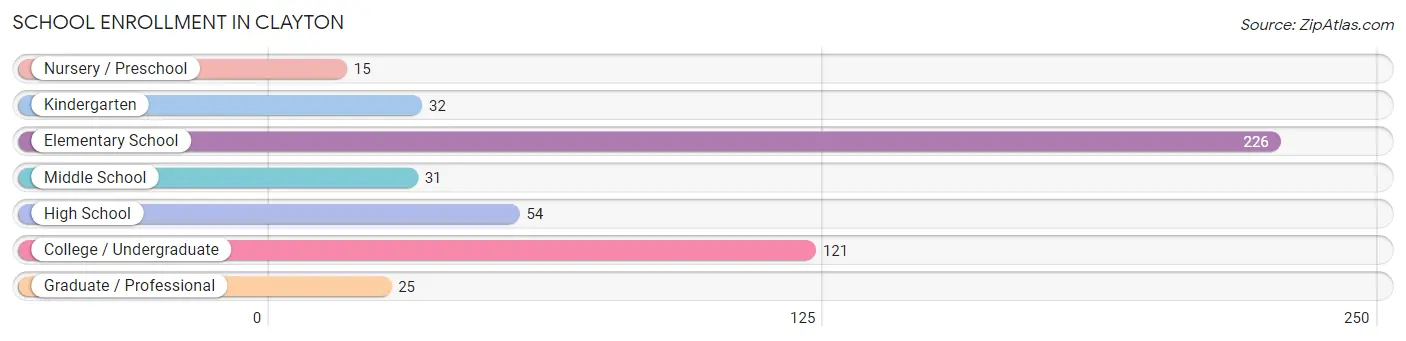
| School Level | # Students | % Students |
| Nursery / Preschool | 15 | 3.0% |
| Kindergarten | 32 | 6.4% |
| Elementary School | 226 | 44.8% |
| Middle School | 31 | 6.1% |
| High School | 54 | 10.7% |
| College / Undergraduate | 121 | 24.0% |
| Graduate / Professional | 25 | 5.0% |
| Total | 504 | 100.0% |
School Enrollment by Age by Funding Source in Clayton
Out of a total of 504 students who are enrolled in schools in Clayton, 16 (3.2%) attend a private institution, while the remaining 488 (96.8%) are enrolled in public schools. The age group of 35 years and over has the highest likelihood of being enrolled in private schools, with 6 (23.1% in the age bracket) enrolled. Conversely, the age group of 3 to 4 year olds has the lowest likelihood of being enrolled in a private school, with 5 (100.0% in the age bracket) attending a public institution.
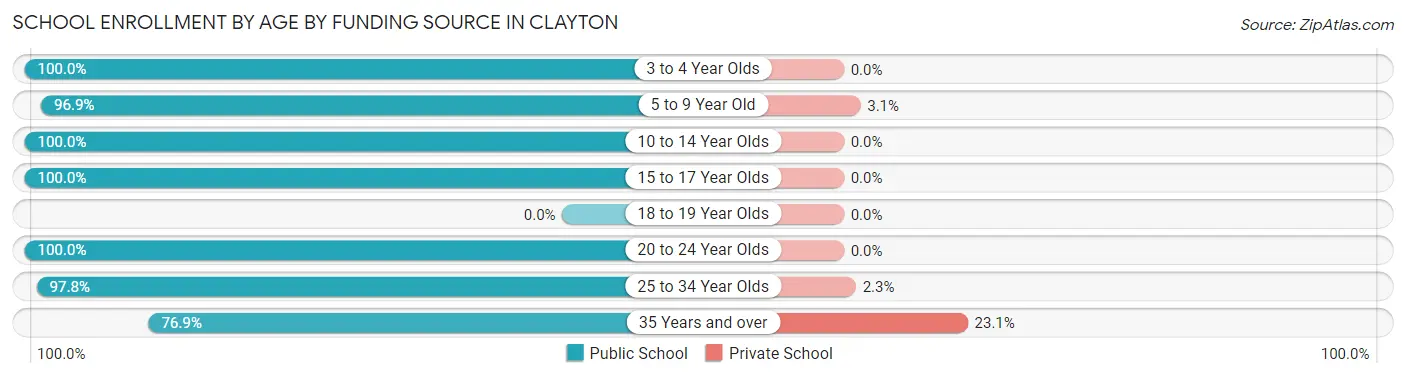
| Age Bracket | Public School | Private School |
| 3 to 4 Year Olds | 5 (100.0%) | 0 (0.0%) |
| 5 to 9 Year Old | 251 (96.9%) | 8 (3.1%) |
| 10 to 14 Year Olds | 39 (100.0%) | 0 (0.0%) |
| 15 to 17 Year Olds | 48 (100.0%) | 0 (0.0%) |
| 18 to 19 Year Olds | 0 (0.0%) | 0 (0.0%) |
| 20 to 24 Year Olds | 38 (100.0%) | 0 (0.0%) |
| 25 to 34 Year Olds | 87 (97.8%) | 2 (2.2%) |
| 35 Years and over | 20 (76.9%) | 6 (23.1%) |
| Total | 488 (96.8%) | 16 (3.2%) |
Educational Attainment by Field of Study in Clayton
Bio, nature & agricultural (99 | 34.1%), social sciences (53 | 18.3%), education (53 | 18.3%), arts & humanities (23 | 7.9%), and liberal arts & history (20 | 6.9%) are the most common fields of study among 290 individuals in Clayton who have obtained a bachelor's degree or higher.
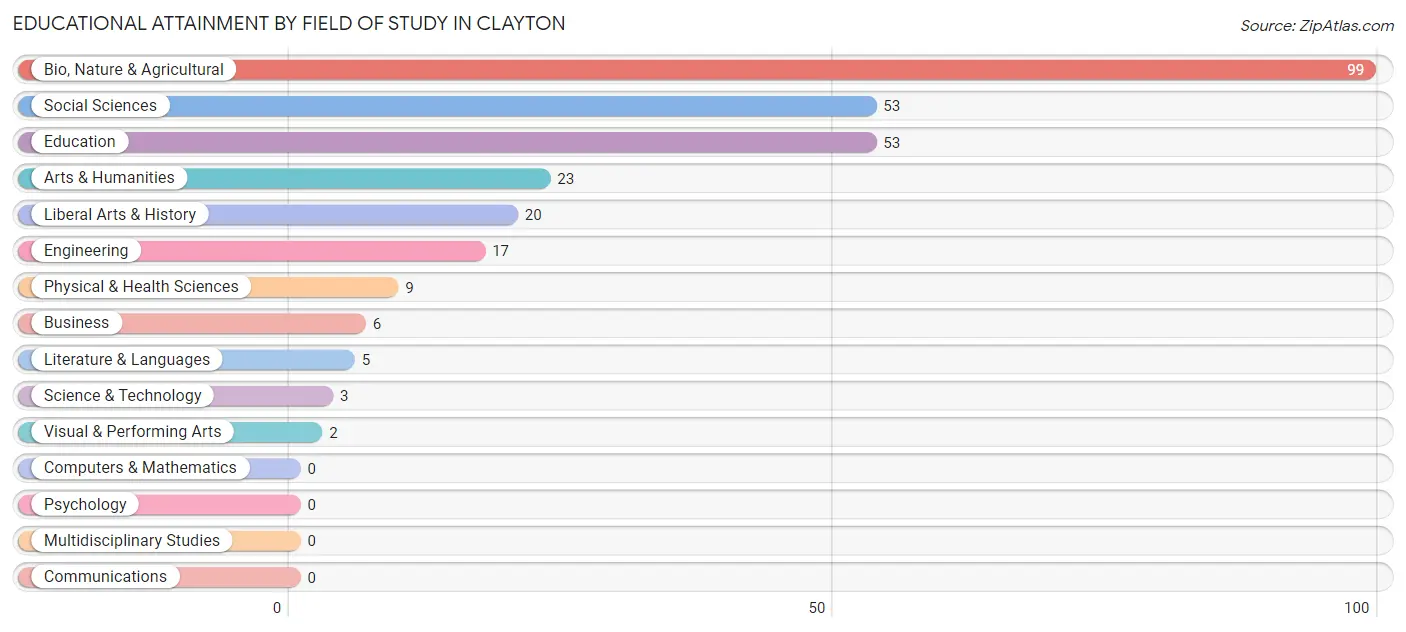
| Field of Study | # Graduates | % Graduates |
| Computers & Mathematics | 0 | 0.0% |
| Bio, Nature & Agricultural | 99 | 34.1% |
| Physical & Health Sciences | 9 | 3.1% |
| Psychology | 0 | 0.0% |
| Social Sciences | 53 | 18.3% |
| Engineering | 17 | 5.9% |
| Multidisciplinary Studies | 0 | 0.0% |
| Science & Technology | 3 | 1.0% |
| Business | 6 | 2.1% |
| Education | 53 | 18.3% |
| Literature & Languages | 5 | 1.7% |
| Liberal Arts & History | 20 | 6.9% |
| Visual & Performing Arts | 2 | 0.7% |
| Communications | 0 | 0.0% |
| Arts & Humanities | 23 | 7.9% |
| Total | 290 | 100.0% |
Transportation & Commute in Clayton
Vehicle Availability by Sex in Clayton
The most prevalent vehicle ownership categories in Clayton are males with 2 vehicles (120, accounting for 33.6%) and females with 2 vehicles (134, making up 28.0%).
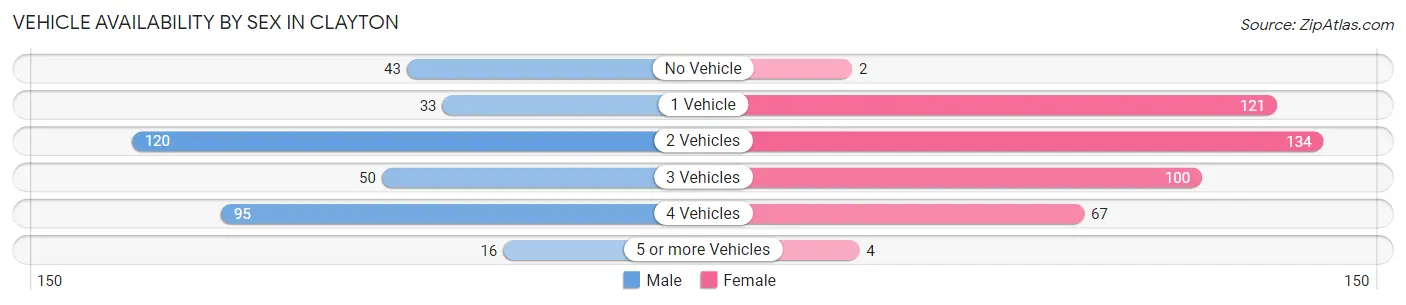
| Vehicles Available | Male | Female |
| No Vehicle | 43 (12.0%) | 2 (0.5%) |
| 1 Vehicle | 33 (9.2%) | 121 (28.3%) |
| 2 Vehicles | 120 (33.6%) | 134 (31.3%) |
| 3 Vehicles | 50 (14.0%) | 100 (23.4%) |
| 4 Vehicles | 95 (26.6%) | 67 (15.7%) |
| 5 or more Vehicles | 16 (4.5%) | 4 (0.9%) |
| Total | 357 (100.0%) | 428 (100.0%) |
Commute Time in Clayton
The most frequently occuring commute durations in Clayton are 5 to 9 minutes (328 commuters, 41.8%), 10 to 14 minutes (154 commuters, 19.6%), and less than 5 minutes (139 commuters, 17.7%).
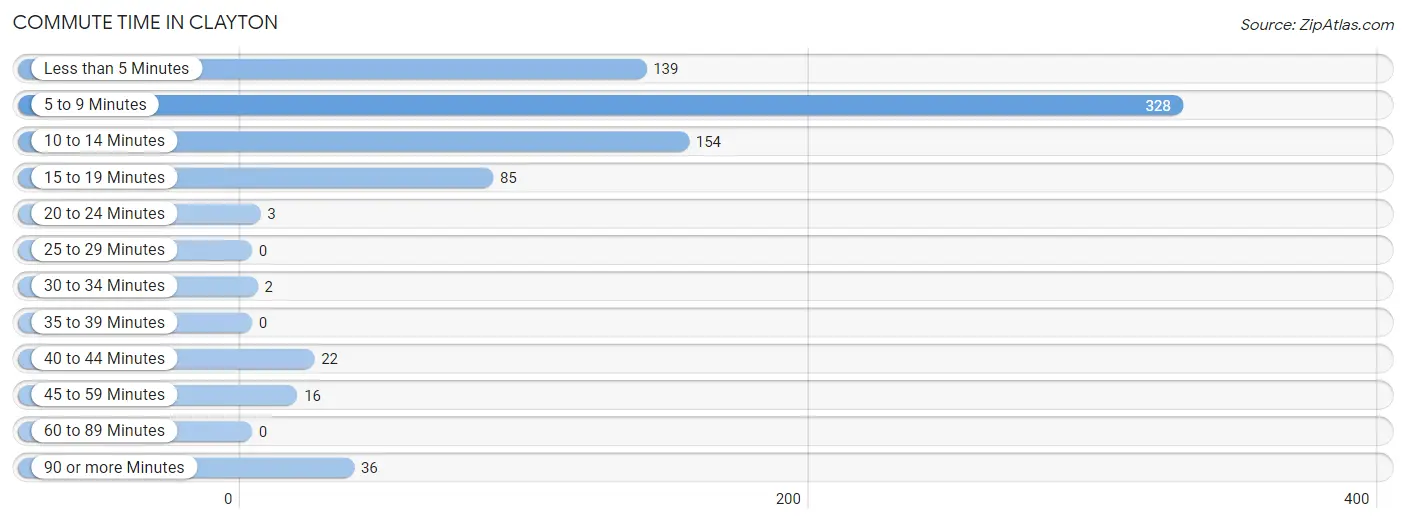
| Commute Time | # Commuters | % Commuters |
| Less than 5 Minutes | 139 | 17.7% |
| 5 to 9 Minutes | 328 | 41.8% |
| 10 to 14 Minutes | 154 | 19.6% |
| 15 to 19 Minutes | 85 | 10.8% |
| 20 to 24 Minutes | 3 | 0.4% |
| 25 to 29 Minutes | 0 | 0.0% |
| 30 to 34 Minutes | 2 | 0.3% |
| 35 to 39 Minutes | 0 | 0.0% |
| 40 to 44 Minutes | 22 | 2.8% |
| 45 to 59 Minutes | 16 | 2.0% |
| 60 to 89 Minutes | 0 | 0.0% |
| 90 or more Minutes | 36 | 4.6% |
Commute Time by Sex in Clayton
The most common commute times in Clayton are 5 to 9 minutes (90 commuters, 25.2%) for males and 5 to 9 minutes (238 commuters, 55.6%) for females.
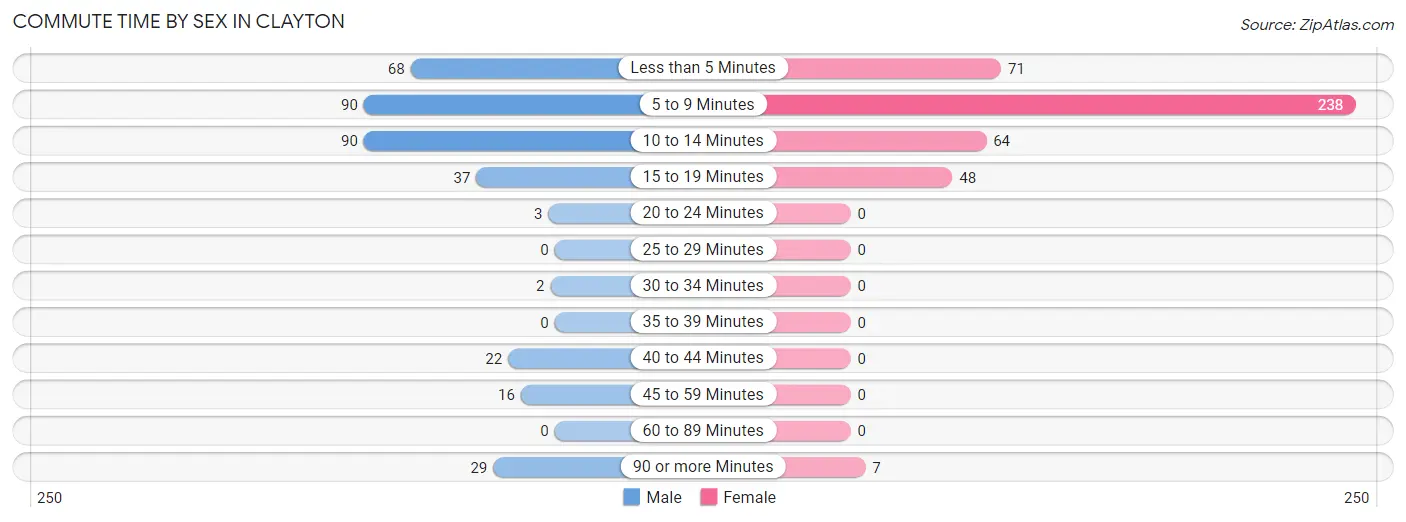
| Commute Time | Male | Female |
| Less than 5 Minutes | 68 (19.1%) | 71 (16.6%) |
| 5 to 9 Minutes | 90 (25.2%) | 238 (55.6%) |
| 10 to 14 Minutes | 90 (25.2%) | 64 (14.9%) |
| 15 to 19 Minutes | 37 (10.4%) | 48 (11.2%) |
| 20 to 24 Minutes | 3 (0.8%) | 0 (0.0%) |
| 25 to 29 Minutes | 0 (0.0%) | 0 (0.0%) |
| 30 to 34 Minutes | 2 (0.6%) | 0 (0.0%) |
| 35 to 39 Minutes | 0 (0.0%) | 0 (0.0%) |
| 40 to 44 Minutes | 22 (6.2%) | 0 (0.0%) |
| 45 to 59 Minutes | 16 (4.5%) | 0 (0.0%) |
| 60 to 89 Minutes | 0 (0.0%) | 0 (0.0%) |
| 90 or more Minutes | 29 (8.1%) | 7 (1.6%) |
Time of Departure to Work by Sex in Clayton
The most frequent times of departure to work in Clayton are 6:30 AM to 6:59 AM (73, 20.4%) for males and 12:00 AM to 4:59 AM (81, 18.9%) for females.
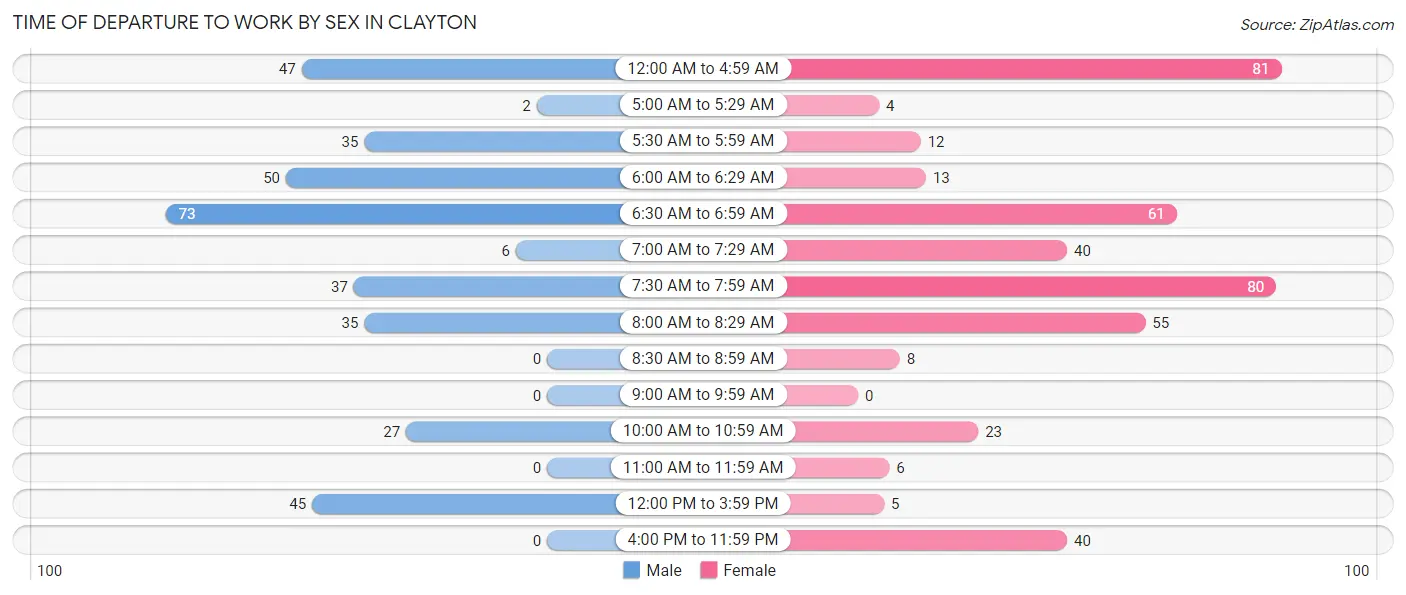
| Time of Departure | Male | Female |
| 12:00 AM to 4:59 AM | 47 (13.2%) | 81 (18.9%) |
| 5:00 AM to 5:29 AM | 2 (0.6%) | 4 (0.9%) |
| 5:30 AM to 5:59 AM | 35 (9.8%) | 12 (2.8%) |
| 6:00 AM to 6:29 AM | 50 (14.0%) | 13 (3.0%) |
| 6:30 AM to 6:59 AM | 73 (20.4%) | 61 (14.2%) |
| 7:00 AM to 7:29 AM | 6 (1.7%) | 40 (9.3%) |
| 7:30 AM to 7:59 AM | 37 (10.4%) | 80 (18.7%) |
| 8:00 AM to 8:29 AM | 35 (9.8%) | 55 (12.9%) |
| 8:30 AM to 8:59 AM | 0 (0.0%) | 8 (1.9%) |
| 9:00 AM to 9:59 AM | 0 (0.0%) | 0 (0.0%) |
| 10:00 AM to 10:59 AM | 27 (7.6%) | 23 (5.4%) |
| 11:00 AM to 11:59 AM | 0 (0.0%) | 6 (1.4%) |
| 12:00 PM to 3:59 PM | 45 (12.6%) | 5 (1.2%) |
| 4:00 PM to 11:59 PM | 0 (0.0%) | 40 (9.3%) |
| Total | 357 (100.0%) | 428 (100.0%) |
Housing Occupancy in Clayton
Occupancy by Ownership in Clayton
Of the total 930 dwellings in Clayton, owner-occupied units account for 619 (66.6%), while renter-occupied units make up 311 (33.4%).
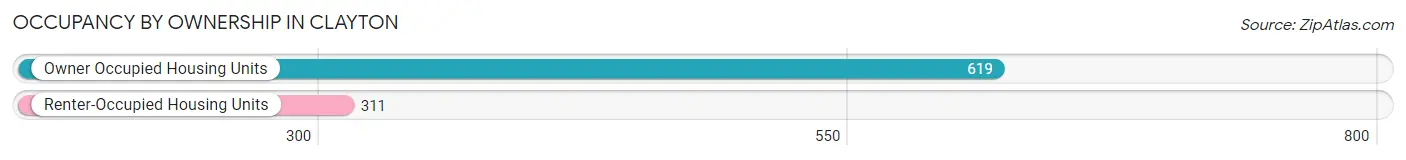
| Occupancy | # Housing Units | % Housing Units |
| Owner Occupied Housing Units | 619 | 66.6% |
| Renter-Occupied Housing Units | 311 | 33.4% |
| Total Occupied Housing Units | 930 | 100.0% |
Occupancy by Household Size in Clayton

| Household Size | # Housing Units | % Housing Units |
| 1-Person Household | 341 | 36.7% |
| 2-Person Household | 336 | 36.1% |
| 3-Person Household | 66 | 7.1% |
| 4+ Person Household | 187 | 20.1% |
| Total Housing Units | 930 | 100.0% |
Occupancy by Ownership by Household Size in Clayton
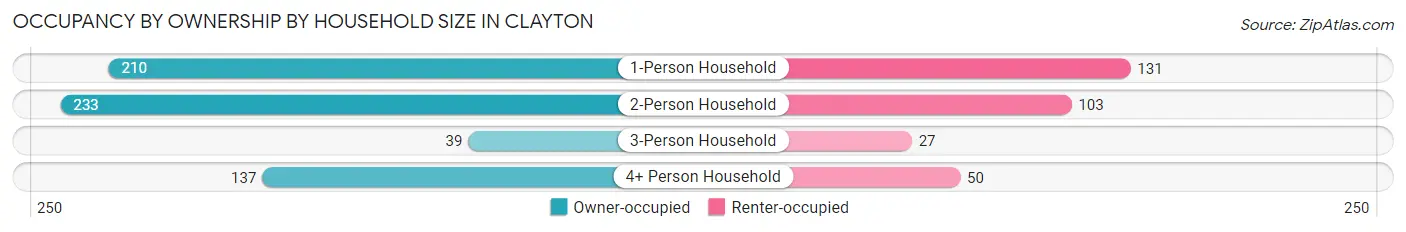
| Household Size | Owner-occupied | Renter-occupied |
| 1-Person Household | 210 (61.6%) | 131 (38.4%) |
| 2-Person Household | 233 (69.4%) | 103 (30.6%) |
| 3-Person Household | 39 (59.1%) | 27 (40.9%) |
| 4+ Person Household | 137 (73.3%) | 50 (26.7%) |
| Total Housing Units | 619 (66.6%) | 311 (33.4%) |
Occupancy by Educational Attainment in Clayton
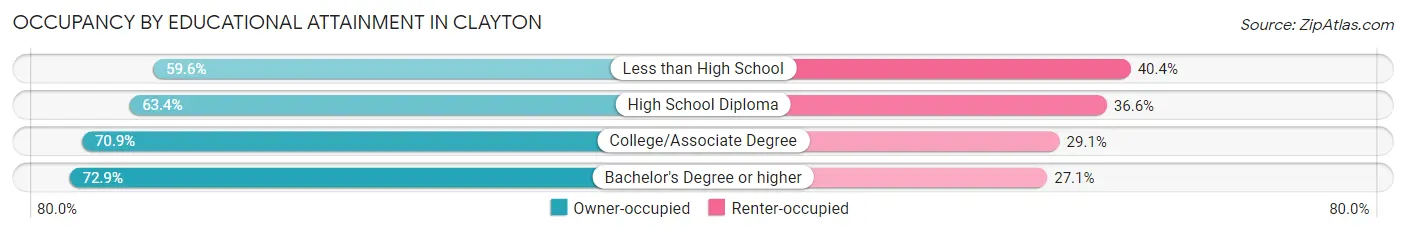
| Household Size | Owner-occupied | Renter-occupied |
| Less than High School | 62 (59.6%) | 42 (40.4%) |
| High School Diploma | 265 (63.4%) | 153 (36.6%) |
| College/Associate Degree | 190 (70.9%) | 78 (29.1%) |
| Bachelor's Degree or higher | 102 (72.9%) | 38 (27.1%) |
Occupancy by Age of Householder in Clayton
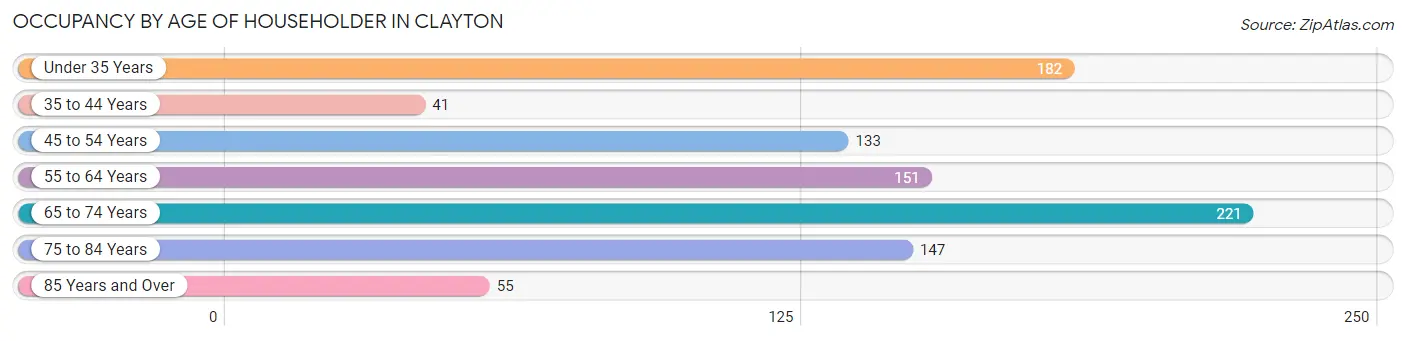
| Age Bracket | # Households | % Households |
| Under 35 Years | 182 | 19.6% |
| 35 to 44 Years | 41 | 4.4% |
| 45 to 54 Years | 133 | 14.3% |
| 55 to 64 Years | 151 | 16.2% |
| 65 to 74 Years | 221 | 23.8% |
| 75 to 84 Years | 147 | 15.8% |
| 85 Years and Over | 55 | 5.9% |
| Total | 930 | 100.0% |
Housing Finances in Clayton
Median Income by Occupancy in Clayton
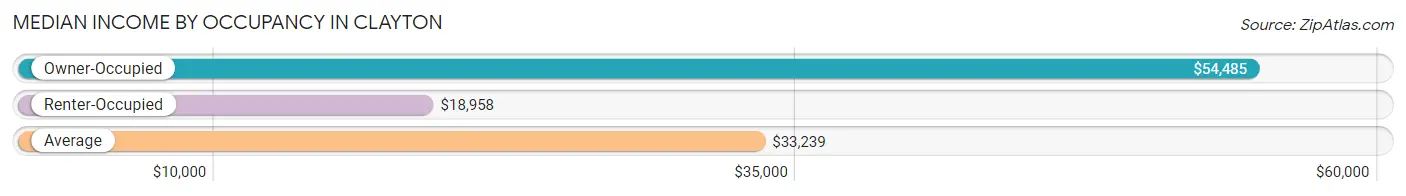
| Occupancy Type | # Households | Median Income |
| Owner-Occupied | 619 (66.6%) | $54,485 |
| Renter-Occupied | 311 (33.4%) | $18,958 |
| Average | 930 (100.0%) | $33,239 |
Occupancy by Householder Income Bracket in Clayton
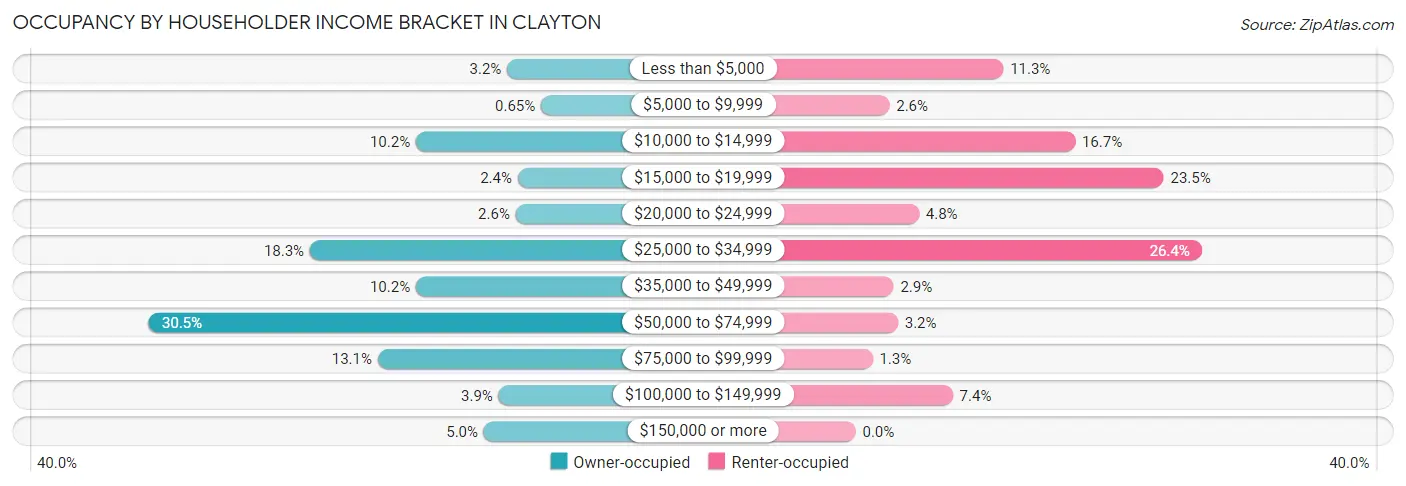
| Income Bracket | Owner-occupied | Renter-occupied |
| Less than $5,000 | 20 (3.2%) | 35 (11.3%) |
| $5,000 to $9,999 | 4 (0.6%) | 8 (2.6%) |
| $10,000 to $14,999 | 63 (10.2%) | 52 (16.7%) |
| $15,000 to $19,999 | 15 (2.4%) | 73 (23.5%) |
| $20,000 to $24,999 | 16 (2.6%) | 15 (4.8%) |
| $25,000 to $34,999 | 113 (18.3%) | 82 (26.4%) |
| $35,000 to $49,999 | 63 (10.2%) | 9 (2.9%) |
| $50,000 to $74,999 | 189 (30.5%) | 10 (3.2%) |
| $75,000 to $99,999 | 81 (13.1%) | 4 (1.3%) |
| $100,000 to $149,999 | 24 (3.9%) | 23 (7.4%) |
| $150,000 or more | 31 (5.0%) | 0 (0.0%) |
| Total | 619 (100.0%) | 311 (100.0%) |
Monthly Housing Cost Tiers in Clayton
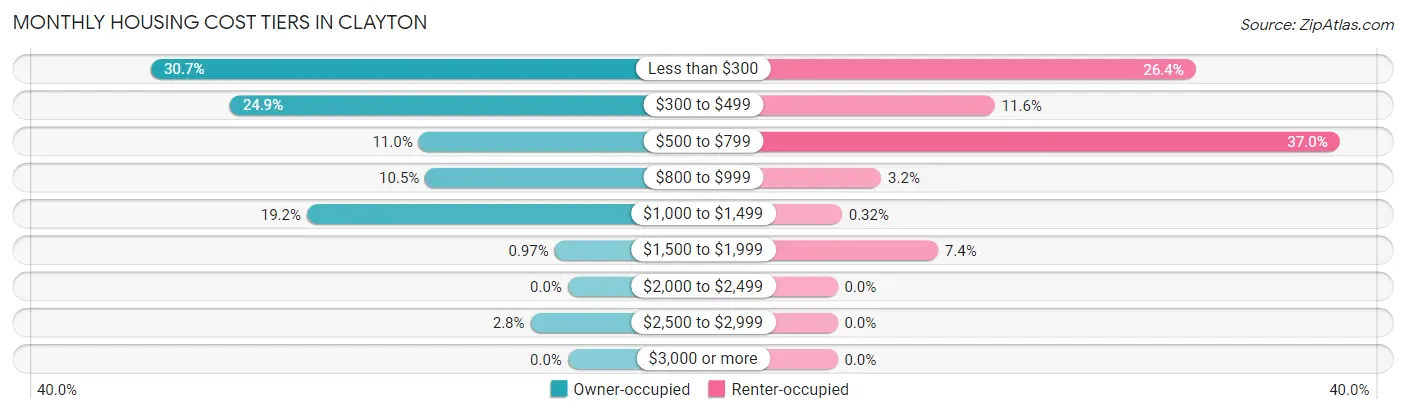
| Monthly Cost | Owner-occupied | Renter-occupied |
| Less than $300 | 190 (30.7%) | 82 (26.4%) |
| $300 to $499 | 154 (24.9%) | 36 (11.6%) |
| $500 to $799 | 68 (11.0%) | 115 (37.0%) |
| $800 to $999 | 65 (10.5%) | 10 (3.2%) |
| $1,000 to $1,499 | 119 (19.2%) | 1 (0.3%) |
| $1,500 to $1,999 | 6 (1.0%) | 23 (7.4%) |
| $2,000 to $2,499 | 0 (0.0%) | 0 (0.0%) |
| $2,500 to $2,999 | 17 (2.8%) | 0 (0.0%) |
| $3,000 or more | 0 (0.0%) | 0 (0.0%) |
| Total | 619 (100.0%) | 311 (100.0%) |
Physical Housing Characteristics in Clayton
Housing Structures in Clayton
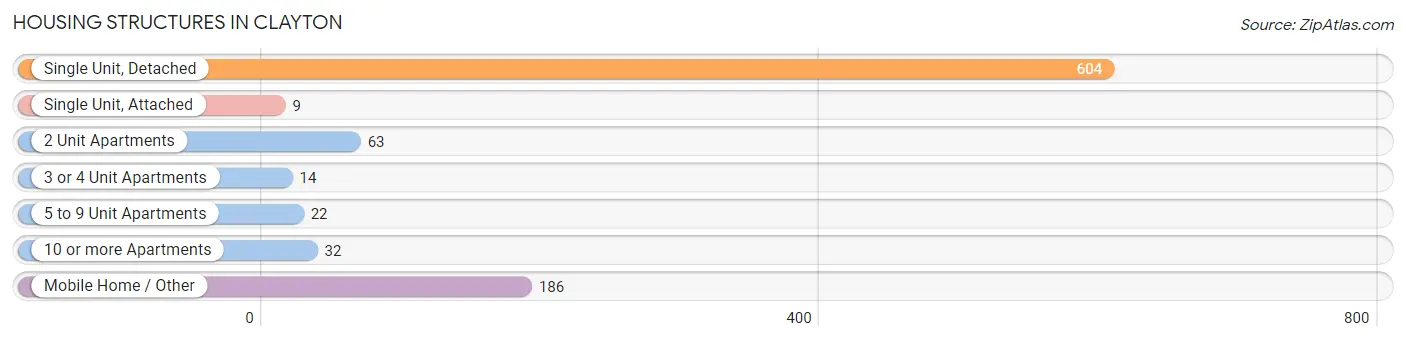
| Structure Type | # Housing Units | % Housing Units |
| Single Unit, Detached | 604 | 64.9% |
| Single Unit, Attached | 9 | 1.0% |
| 2 Unit Apartments | 63 | 6.8% |
| 3 or 4 Unit Apartments | 14 | 1.5% |
| 5 to 9 Unit Apartments | 22 | 2.4% |
| 10 or more Apartments | 32 | 3.4% |
| Mobile Home / Other | 186 | 20.0% |
| Total | 930 | 100.0% |
Housing Structures by Occupancy in Clayton
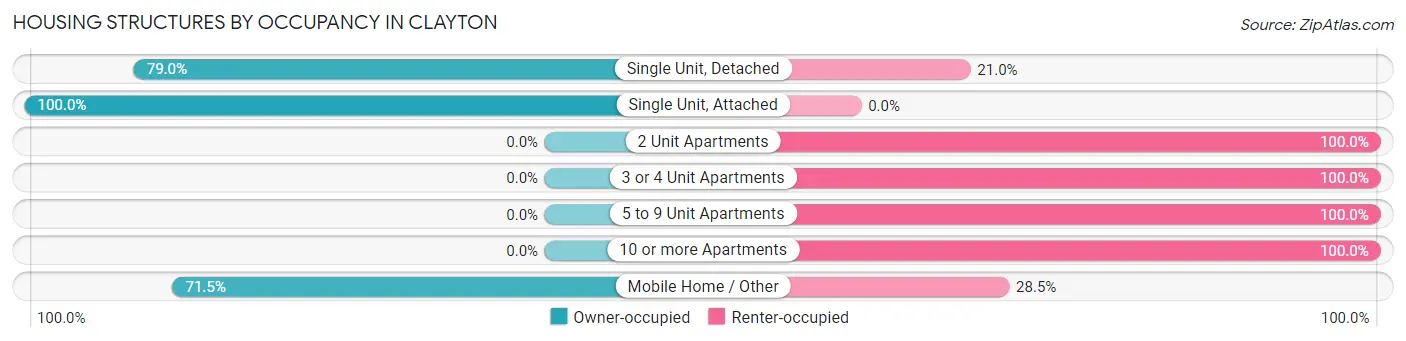
| Structure Type | Owner-occupied | Renter-occupied |
| Single Unit, Detached | 477 (79.0%) | 127 (21.0%) |
| Single Unit, Attached | 9 (100.0%) | 0 (0.0%) |
| 2 Unit Apartments | 0 (0.0%) | 63 (100.0%) |
| 3 or 4 Unit Apartments | 0 (0.0%) | 14 (100.0%) |
| 5 to 9 Unit Apartments | 0 (0.0%) | 22 (100.0%) |
| 10 or more Apartments | 0 (0.0%) | 32 (100.0%) |
| Mobile Home / Other | 133 (71.5%) | 53 (28.5%) |
| Total | 619 (66.6%) | 311 (33.4%) |
Housing Structures by Number of Rooms in Clayton
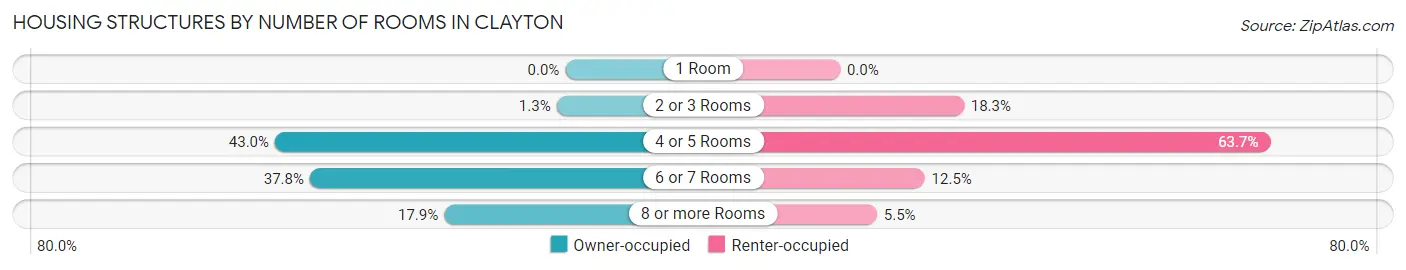
| Number of Rooms | Owner-occupied | Renter-occupied |
| 1 Room | 0 (0.0%) | 0 (0.0%) |
| 2 or 3 Rooms | 8 (1.3%) | 57 (18.3%) |
| 4 or 5 Rooms | 266 (43.0%) | 198 (63.7%) |
| 6 or 7 Rooms | 234 (37.8%) | 39 (12.5%) |
| 8 or more Rooms | 111 (17.9%) | 17 (5.5%) |
| Total | 619 (100.0%) | 311 (100.0%) |
Housing Structure by Heating Type in Clayton
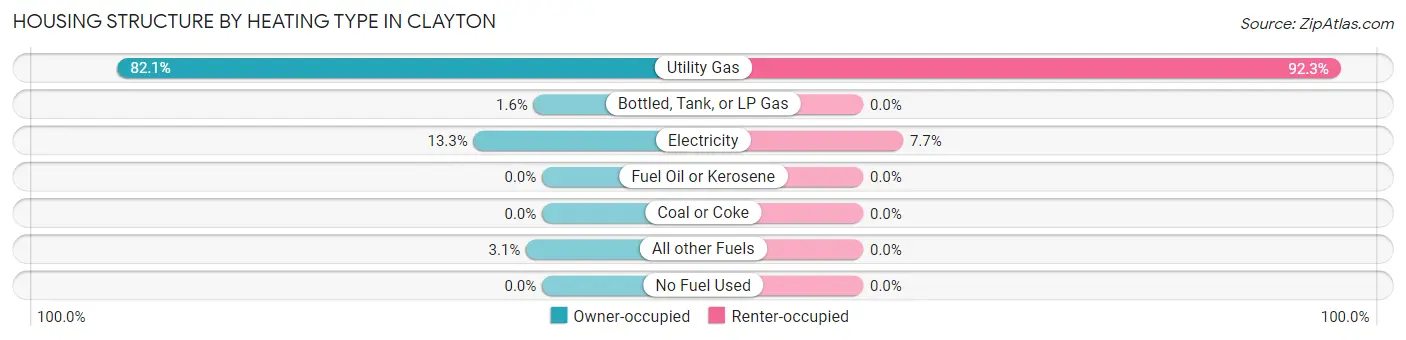
| Heating Type | Owner-occupied | Renter-occupied |
| Utility Gas | 508 (82.1%) | 287 (92.3%) |
| Bottled, Tank, or LP Gas | 10 (1.6%) | 0 (0.0%) |
| Electricity | 82 (13.3%) | 24 (7.7%) |
| Fuel Oil or Kerosene | 0 (0.0%) | 0 (0.0%) |
| Coal or Coke | 0 (0.0%) | 0 (0.0%) |
| All other Fuels | 19 (3.1%) | 0 (0.0%) |
| No Fuel Used | 0 (0.0%) | 0 (0.0%) |
| Total | 619 (100.0%) | 311 (100.0%) |
Household Vehicle Usage in Clayton
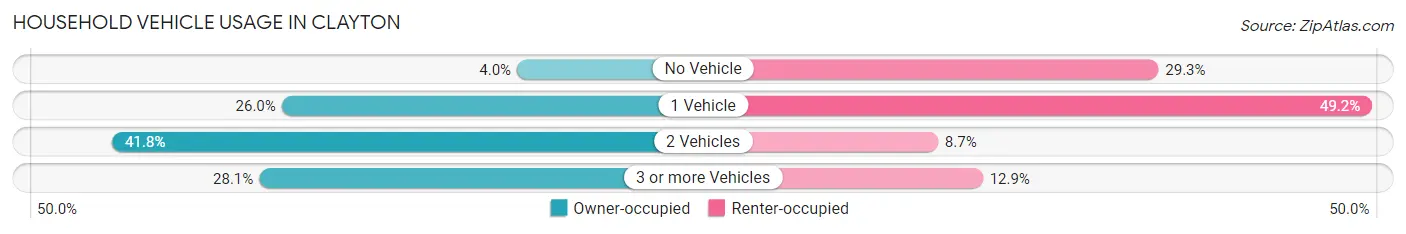
| Vehicles per Household | Owner-occupied | Renter-occupied |
| No Vehicle | 25 (4.0%) | 91 (29.3%) |
| 1 Vehicle | 161 (26.0%) | 153 (49.2%) |
| 2 Vehicles | 259 (41.8%) | 27 (8.7%) |
| 3 or more Vehicles | 174 (28.1%) | 40 (12.9%) |
| Total | 619 (100.0%) | 311 (100.0%) |
Real Estate & Mortgages in Clayton
Real Estate and Mortgage Overview in Clayton
| Characteristic | Without Mortgage | With Mortgage |
| Housing Units | 410 | 209 |
| Median Property Value | $83,000 | $122,400 |
| Median Household Income | $43,125 | $10 |
| Monthly Housing Costs | $310 | $0 |
| Real Estate Taxes | $448 | $23 |
Property Value by Mortgage Status in Clayton
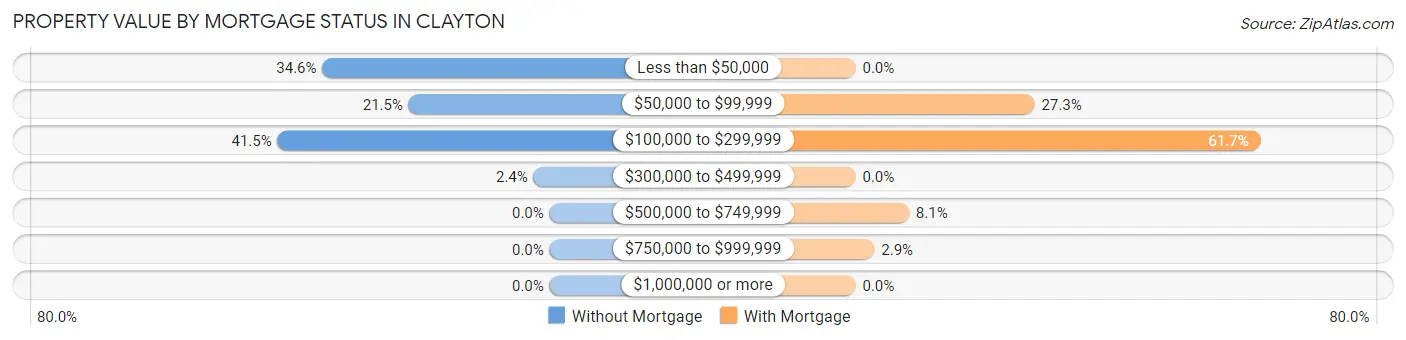
| Property Value | Without Mortgage | With Mortgage |
| Less than $50,000 | 142 (34.6%) | 0 (0.0%) |
| $50,000 to $99,999 | 88 (21.5%) | 57 (27.3%) |
| $100,000 to $299,999 | 170 (41.5%) | 129 (61.7%) |
| $300,000 to $499,999 | 10 (2.4%) | 0 (0.0%) |
| $500,000 to $749,999 | 0 (0.0%) | 17 (8.1%) |
| $750,000 to $999,999 | 0 (0.0%) | 6 (2.9%) |
| $1,000,000 or more | 0 (0.0%) | 0 (0.0%) |
| Total | 410 (100.0%) | 209 (100.0%) |
Household Income by Mortgage Status in Clayton
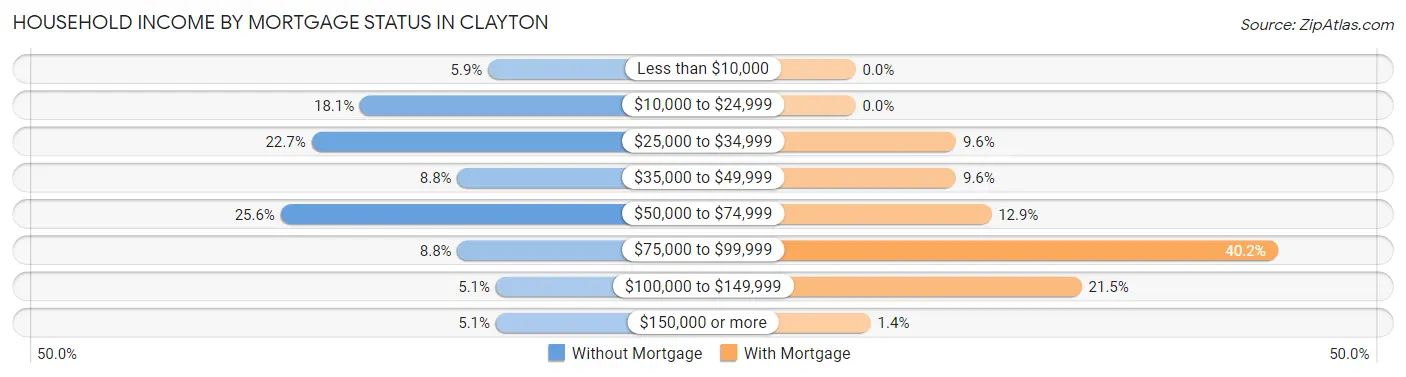
| Household Income | Without Mortgage | With Mortgage |
| Less than $10,000 | 24 (5.9%) | 0 (0.0%) |
| $10,000 to $24,999 | 74 (18.0%) | 0 (0.0%) |
| $25,000 to $34,999 | 93 (22.7%) | 20 (9.6%) |
| $35,000 to $49,999 | 36 (8.8%) | 20 (9.6%) |
| $50,000 to $74,999 | 105 (25.6%) | 27 (12.9%) |
| $75,000 to $99,999 | 36 (8.8%) | 84 (40.2%) |
| $100,000 to $149,999 | 21 (5.1%) | 45 (21.5%) |
| $150,000 or more | 21 (5.1%) | 3 (1.4%) |
| Total | 410 (100.0%) | 209 (100.0%) |
Property Value to Household Income Ratio in Clayton
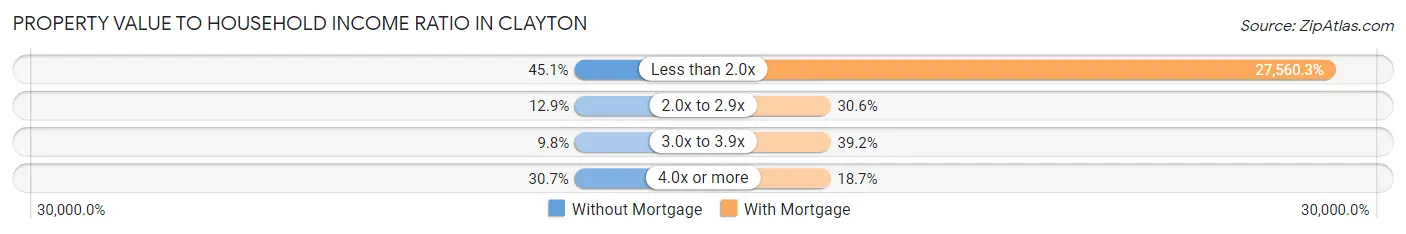
| Value-to-Income Ratio | Without Mortgage | With Mortgage |
| Less than 2.0x | 185 (45.1%) | 57,601 (27,560.3%) |
| 2.0x to 2.9x | 53 (12.9%) | 64 (30.6%) |
| 3.0x to 3.9x | 40 (9.8%) | 82 (39.2%) |
| 4.0x or more | 126 (30.7%) | 39 (18.7%) |
| Total | 410 (100.0%) | 209 (100.0%) |
Real Estate Taxes by Mortgage Status in Clayton
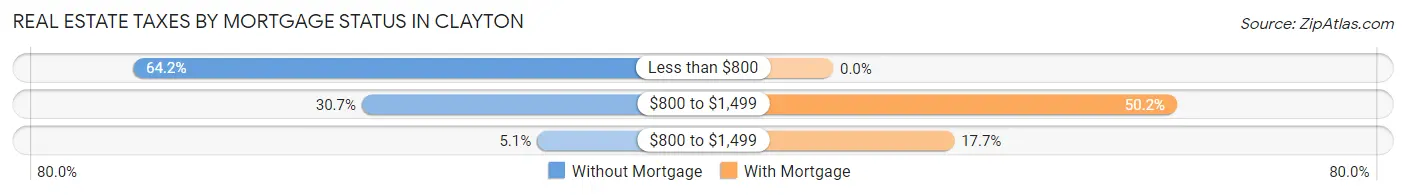
| Property Taxes | Without Mortgage | With Mortgage |
| Less than $800 | 263 (64.1%) | 0 (0.0%) |
| $800 to $1,499 | 126 (30.7%) | 105 (50.2%) |
| $800 to $1,499 | 21 (5.1%) | 37 (17.7%) |
| Total | 410 (100.0%) | 209 (100.0%) |
Health & Disability in Clayton
Health Insurance Coverage by Age in Clayton
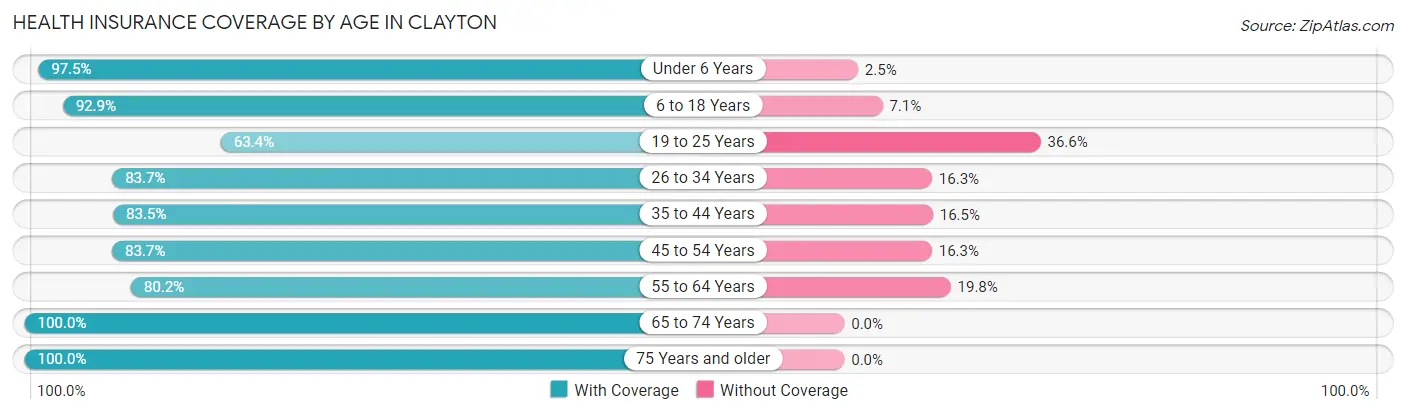
| Age Bracket | With Coverage | Without Coverage |
| Under 6 Years | 230 (97.5%) | 6 (2.5%) |
| 6 to 18 Years | 313 (92.9%) | 24 (7.1%) |
| 19 to 25 Years | 130 (63.4%) | 75 (36.6%) |
| 26 to 34 Years | 256 (83.7%) | 50 (16.3%) |
| 35 to 44 Years | 172 (83.5%) | 34 (16.5%) |
| 45 to 54 Years | 200 (83.7%) | 39 (16.3%) |
| 55 to 64 Years | 194 (80.2%) | 48 (19.8%) |
| 65 to 74 Years | 327 (100.0%) | 0 (0.0%) |
| 75 Years and older | 244 (100.0%) | 0 (0.0%) |
| Total | 2,066 (88.2%) | 276 (11.8%) |
Health Insurance Coverage by Citizenship Status in Clayton
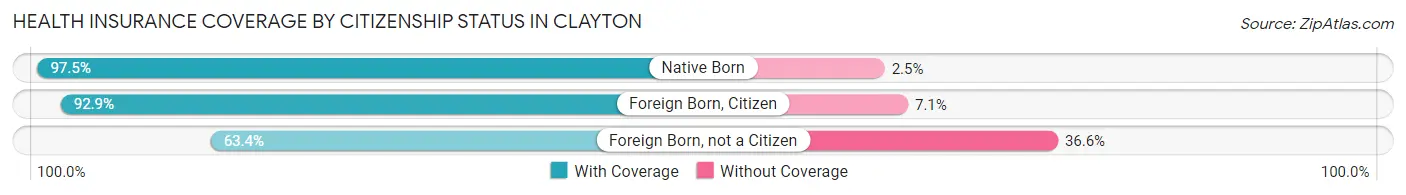
| Citizenship Status | With Coverage | Without Coverage |
| Native Born | 230 (97.5%) | 6 (2.5%) |
| Foreign Born, Citizen | 313 (92.9%) | 24 (7.1%) |
| Foreign Born, not a Citizen | 130 (63.4%) | 75 (36.6%) |
Health Insurance Coverage by Household Income in Clayton
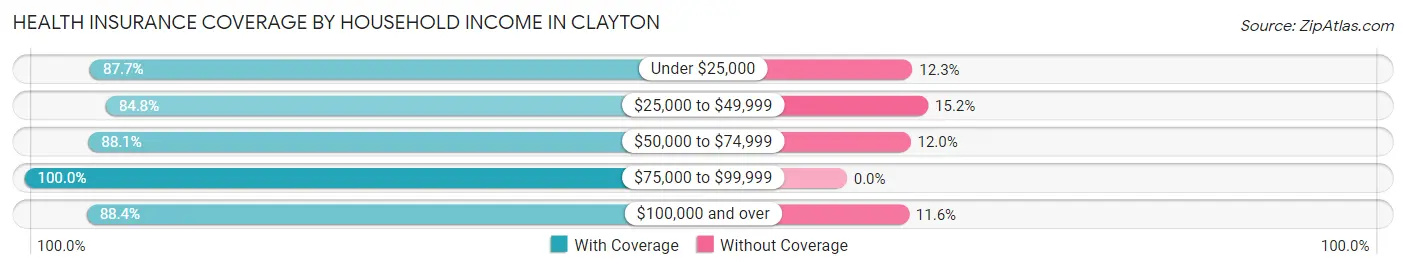
| Household Income | With Coverage | Without Coverage |
| Under $25,000 | 478 (87.7%) | 67 (12.3%) |
| $25,000 to $49,999 | 462 (84.8%) | 83 (15.2%) |
| $50,000 to $74,999 | 641 (88.0%) | 87 (11.9%) |
| $75,000 to $99,999 | 189 (100.0%) | 0 (0.0%) |
| $100,000 and over | 296 (88.4%) | 39 (11.6%) |
Public vs Private Health Insurance Coverage by Age in Clayton
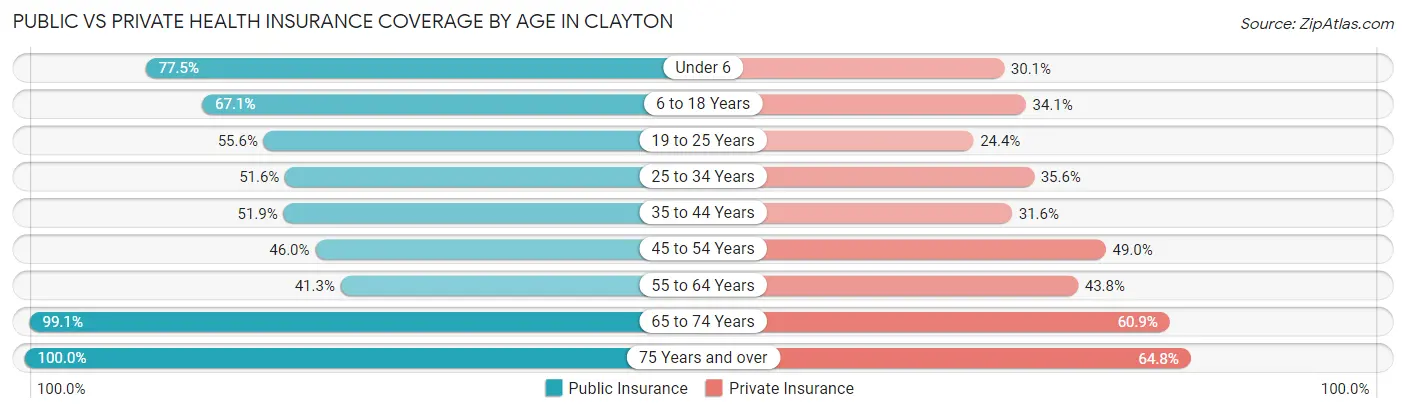
| Age Bracket | Public Insurance | Private Insurance |
| Under 6 | 183 (77.5%) | 71 (30.1%) |
| 6 to 18 Years | 226 (67.1%) | 115 (34.1%) |
| 19 to 25 Years | 114 (55.6%) | 50 (24.4%) |
| 25 to 34 Years | 158 (51.6%) | 109 (35.6%) |
| 35 to 44 Years | 107 (51.9%) | 65 (31.6%) |
| 45 to 54 Years | 110 (46.0%) | 117 (48.9%) |
| 55 to 64 Years | 100 (41.3%) | 106 (43.8%) |
| 65 to 74 Years | 324 (99.1%) | 199 (60.9%) |
| 75 Years and over | 244 (100.0%) | 158 (64.7%) |
| Total | 1,566 (66.9%) | 990 (42.3%) |
Disability Status by Sex by Age in Clayton
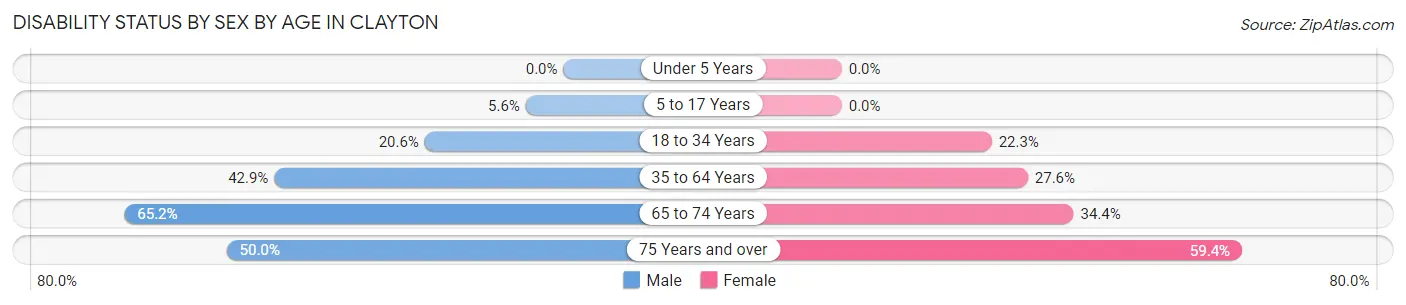
| Age Bracket | Male | Female |
| Under 5 Years | 0 (0.0%) | 0 (0.0%) |
| 5 to 17 Years | 9 (5.6%) | 0 (0.0%) |
| 18 to 34 Years | 49 (20.6%) | 67 (22.3%) |
| 35 to 64 Years | 152 (42.9%) | 92 (27.6%) |
| 65 to 74 Years | 73 (65.2%) | 74 (34.4%) |
| 75 Years and over | 37 (50.0%) | 101 (59.4%) |
Disability Class by Sex by Age in Clayton
Disability Class: Hearing Difficulty
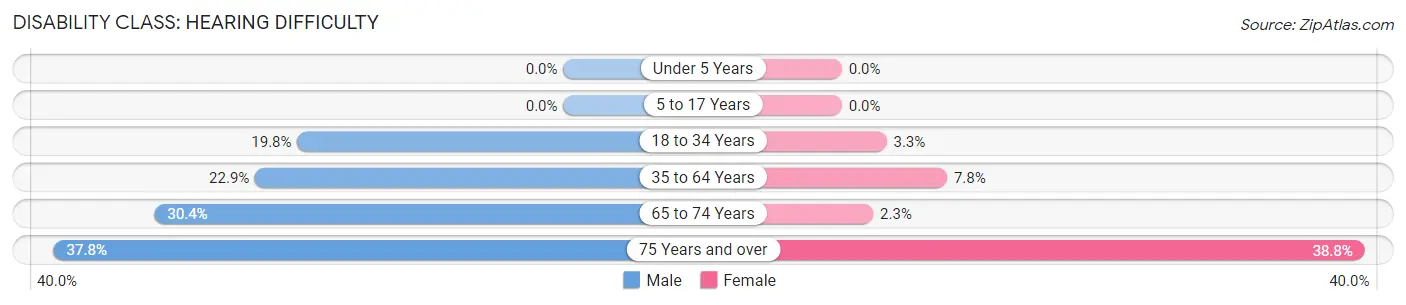
| Age Bracket | Male | Female |
| Under 5 Years | 0 (0.0%) | 0 (0.0%) |
| 5 to 17 Years | 0 (0.0%) | 0 (0.0%) |
| 18 to 34 Years | 47 (19.8%) | 10 (3.3%) |
| 35 to 64 Years | 81 (22.9%) | 26 (7.8%) |
| 65 to 74 Years | 34 (30.4%) | 5 (2.3%) |
| 75 Years and over | 28 (37.8%) | 66 (38.8%) |
Disability Class: Vision Difficulty
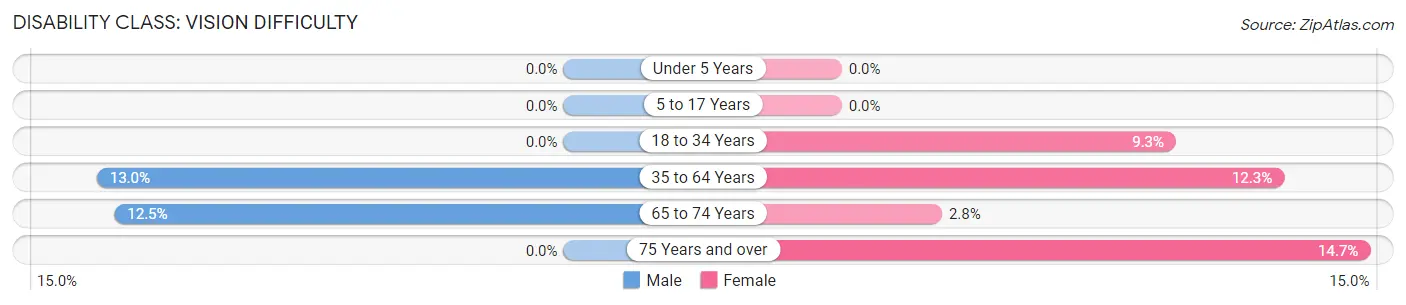
| Age Bracket | Male | Female |
| Under 5 Years | 0 (0.0%) | 0 (0.0%) |
| 5 to 17 Years | 0 (0.0%) | 0 (0.0%) |
| 18 to 34 Years | 0 (0.0%) | 28 (9.3%) |
| 35 to 64 Years | 46 (13.0%) | 41 (12.3%) |
| 65 to 74 Years | 14 (12.5%) | 6 (2.8%) |
| 75 Years and over | 0 (0.0%) | 25 (14.7%) |
Disability Class: Cognitive Difficulty
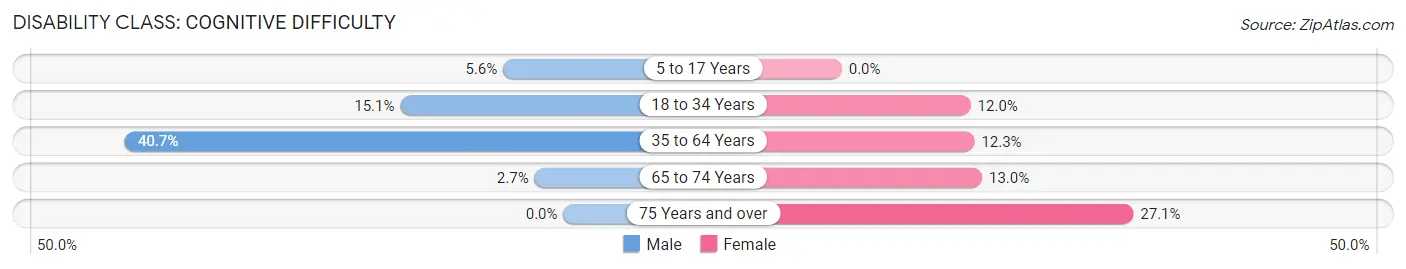
| Age Bracket | Male | Female |
| 5 to 17 Years | 9 (5.6%) | 0 (0.0%) |
| 18 to 34 Years | 36 (15.1%) | 36 (12.0%) |
| 35 to 64 Years | 144 (40.7%) | 41 (12.3%) |
| 65 to 74 Years | 3 (2.7%) | 28 (13.0%) |
| 75 Years and over | 0 (0.0%) | 46 (27.1%) |
Disability Class: Ambulatory Difficulty
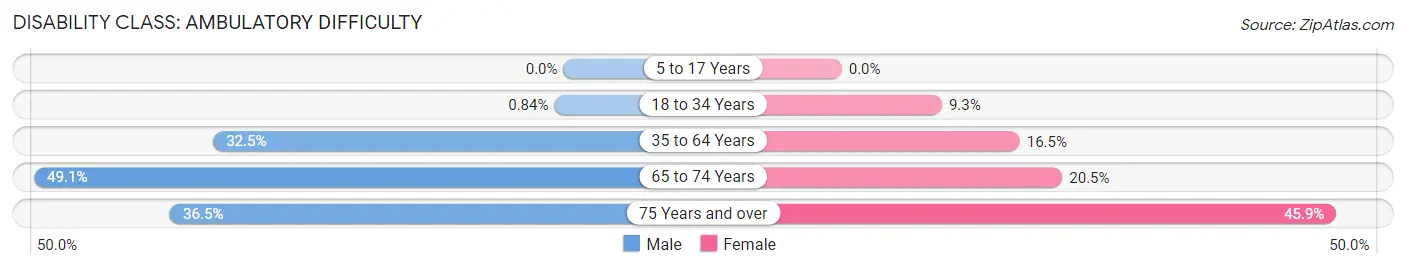
| Age Bracket | Male | Female |
| 5 to 17 Years | 0 (0.0%) | 0 (0.0%) |
| 18 to 34 Years | 2 (0.8%) | 28 (9.3%) |
| 35 to 64 Years | 115 (32.5%) | 55 (16.5%) |
| 65 to 74 Years | 55 (49.1%) | 44 (20.5%) |
| 75 Years and over | 27 (36.5%) | 78 (45.9%) |
Disability Class: Self-Care Difficulty
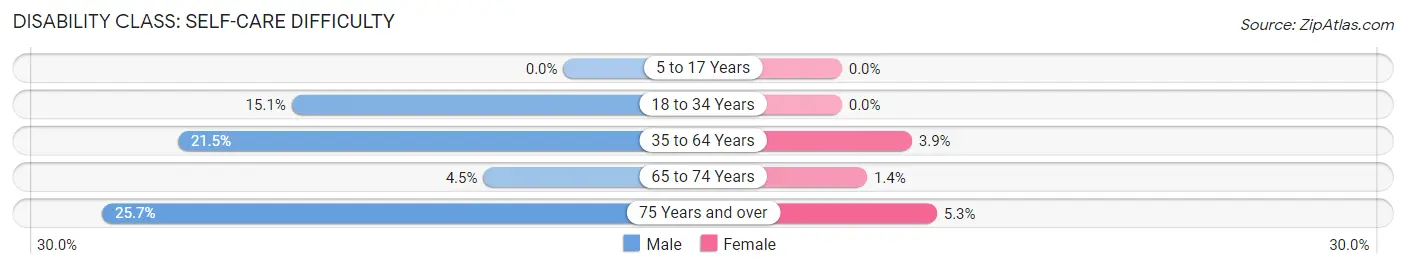
| Age Bracket | Male | Female |
| 5 to 17 Years | 0 (0.0%) | 0 (0.0%) |
| 18 to 34 Years | 36 (15.1%) | 0 (0.0%) |
| 35 to 64 Years | 76 (21.5%) | 13 (3.9%) |
| 65 to 74 Years | 5 (4.5%) | 3 (1.4%) |
| 75 Years and over | 19 (25.7%) | 9 (5.3%) |
Technology Access in Clayton
Computing Device Access in Clayton
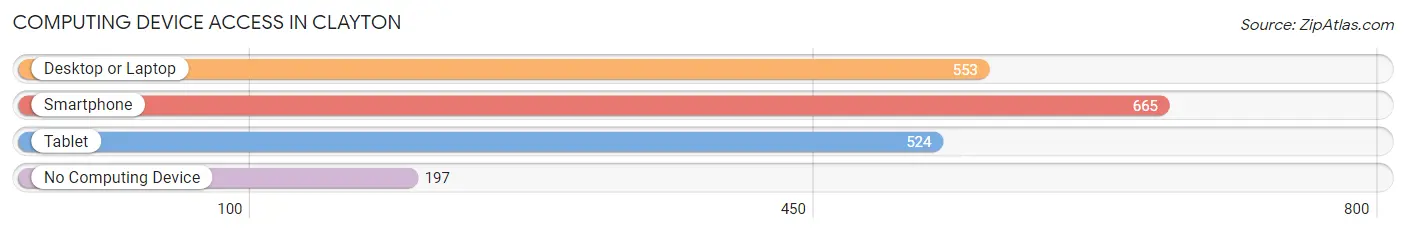
| Device Type | # Households | % Households |
| Desktop or Laptop | 553 | 59.5% |
| Smartphone | 665 | 71.5% |
| Tablet | 524 | 56.3% |
| No Computing Device | 197 | 21.2% |
| Total | 930 | 100.0% |
Internet Access in Clayton
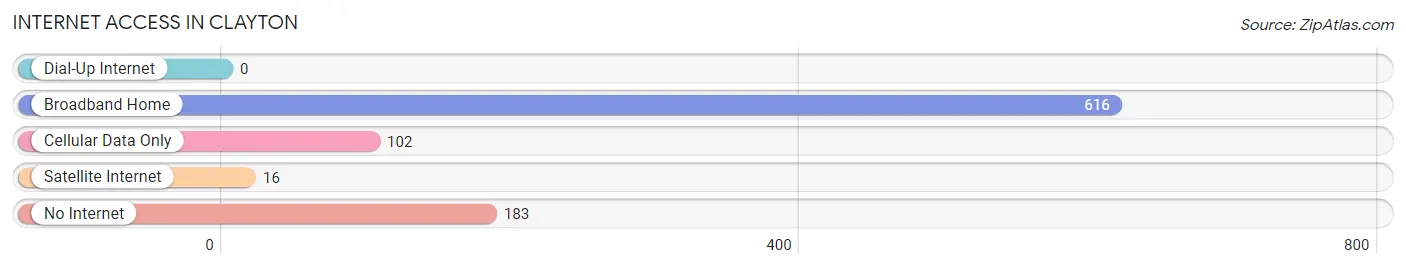
| Internet Type | # Households | % Households |
| Dial-Up Internet | 0 | 0.0% |
| Broadband Home | 616 | 66.2% |
| Cellular Data Only | 102 | 11.0% |
| Satellite Internet | 16 | 1.7% |
| No Internet | 183 | 19.7% |
| Total | 930 | 100.0% |
Clayton Summary
Clayton is a small town located in Union County, New Mexico. It is the county seat and the largest town in the county. The town is situated in the northeast corner of the state, near the Oklahoma border. The town is located in the high plains of the Great Plains region, and is surrounded by rolling hills and grasslands. The town is located at an elevation of 4,719 feet above sea level.
History
Clayton was founded in 1887 by the Union Pacific Railroad. The town was named after the railroad's president, John B. Clayton. The town was originally a stop on the railroad, and was used as a supply point for the surrounding area. The town quickly grew, and by the early 1900s, it had become a major trading center for the region.
In the early 1900s, Clayton was a major center for the cattle industry. The town was home to several large ranches, and the surrounding area was used for grazing. The town also had several large grain elevators, which were used to store and ship grain from the area.
In the 1950s, Clayton began to experience a decline in population. This was due to the decline of the cattle industry, as well as the decline of the railroad. The town was also affected by the Dust Bowl, which caused many people to leave the area.
Geography
Clayton is located in the northeast corner of New Mexico, near the Oklahoma border. The town is situated in the high plains of the Great Plains region, and is surrounded by rolling hills and grasslands. The town is located at an elevation of 4,719 feet above sea level.
The climate in Clayton is semi-arid, with hot summers and cold winters. The average annual temperature is around 60 degrees Fahrenheit. The average annual precipitation is around 16 inches.
Economy
The economy of Clayton is largely based on agriculture and ranching. The town is home to several large ranches, and the surrounding area is used for grazing. The town also has several large grain elevators, which are used to store and ship grain from the area.
The town is also home to several small businesses, including restaurants, retail stores, and service providers. The town is also home to a small airport, which is used for private and commercial flights.
Demographics
As of the 2010 census, the population of Clayton was 2,719. The racial makeup of the town was 94.3% White, 0.3% African American, 0.7% Native American, 0.2% Asian, 0.1% Pacific Islander, 2.3% from other races, and 2.2% from two or more races. Hispanic or Latino of any race were 8.2% of the population.
The median household income in Clayton was $31,250, and the median family income was $37,500. The per capita income in Clayton was $17,845. About 16.2% of the population was below the poverty line.
Common Questions
What is Per Capita Income in Clayton?
Per Capita income in Clayton is $17,167.
What is the Median Family Income in Clayton?
Median Family Income in Clayton is $41,528.
What is the Median Household income in Clayton?
Median Household Income in Clayton is $33,239.
What is Income or Wage Gap in Clayton?
Income or Wage Gap in Clayton is 41.4%.
Women in Clayton earn 58.6 cents for every dollar earned by a man.
What is Inequality or Gini Index in Clayton?
Inequality or Gini Index in Clayton is 0.44.
What is the Total Population of Clayton?
Total Population of Clayton is 2,825.
What is the Total Male Population of Clayton?
Total Male Population of Clayton is 1,515.
What is the Total Female Population of Clayton?
Total Female Population of Clayton is 1,310.
What is the Ratio of Males per 100 Females in Clayton?
There are 115.65 Males per 100 Females in Clayton.
What is the Ratio of Females per 100 Males in Clayton?
There are 86.47 Females per 100 Males in Clayton.
What is the Median Population Age in Clayton?
Median Population Age in Clayton is 39.1 Years.
What is the Average Family Size in Clayton
Average Family Size in Clayton is 3.1 People.
What is the Average Household Size in Clayton
Average Household Size in Clayton is 2.5 People.
How Large is the Labor Force in Clayton?
There are 880 People in the Labor Forcein in Clayton.
What is the Percentage of People in the Labor Force in Clayton?
38.0% of People are in the Labor Force in Clayton.
What is the Unemployment Rate in Clayton?
Unemployment Rate in Clayton is 8.8%.