Pelican, AK Map & Demographics
Pelican Map
Pelican Overview
$50,277
PER CAPITA INCOME
0.38
INEQUALITY / GINI INDEX
57
TOTAL POPULATION
28
MALE POPULATION
29
FEMALE POPULATION
96.55
MALES / 100 FEMALES
103.57
FEMALES / 100 MALES
48.6
MEDIAN AGE
2.2
AVG FAMILY SIZE
1.6
AVG HOUSEHOLD SIZE
42
LABOR FORCE [ PEOPLE ]
73.7%
PERCENT IN LABOR FORCE
14.3%
UNEMPLOYMENT RATE
Pelican Zip Codes
Pelican Area Codes
Income in Pelican
Income Overview in Pelican
| Characteristic | Number | Measure |
| Per Capita Income | 57 | $50,277 |
| Median Family Income | 6 | $0 |
| Mean Family Income | 6 | $0 |
| Median Household Income | 36 | $0 |
| Mean Household Income | 36 | $79,331 |
| Income Deficit | 6 | $0 |
| Wage / Income Gap (%) | 57 | 0.00% |
| Wage / Income Gap ($) | 57 | 100.00¢ per $1 |
| Gini / Inequality Index | 57 | 0.38 |
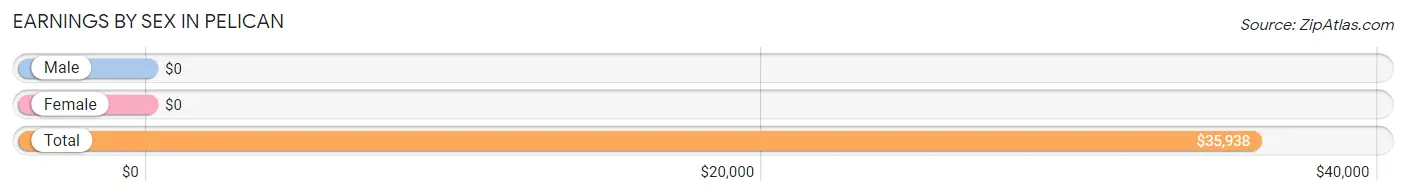
Earnings by Sex in Pelican
| Sex | Number | Average Earnings |
| Male | 19 (45.2%) | $0 |
| Female | 23 (54.8%) | $0 |
| Total | 42 (100.0%) | $35,938 |
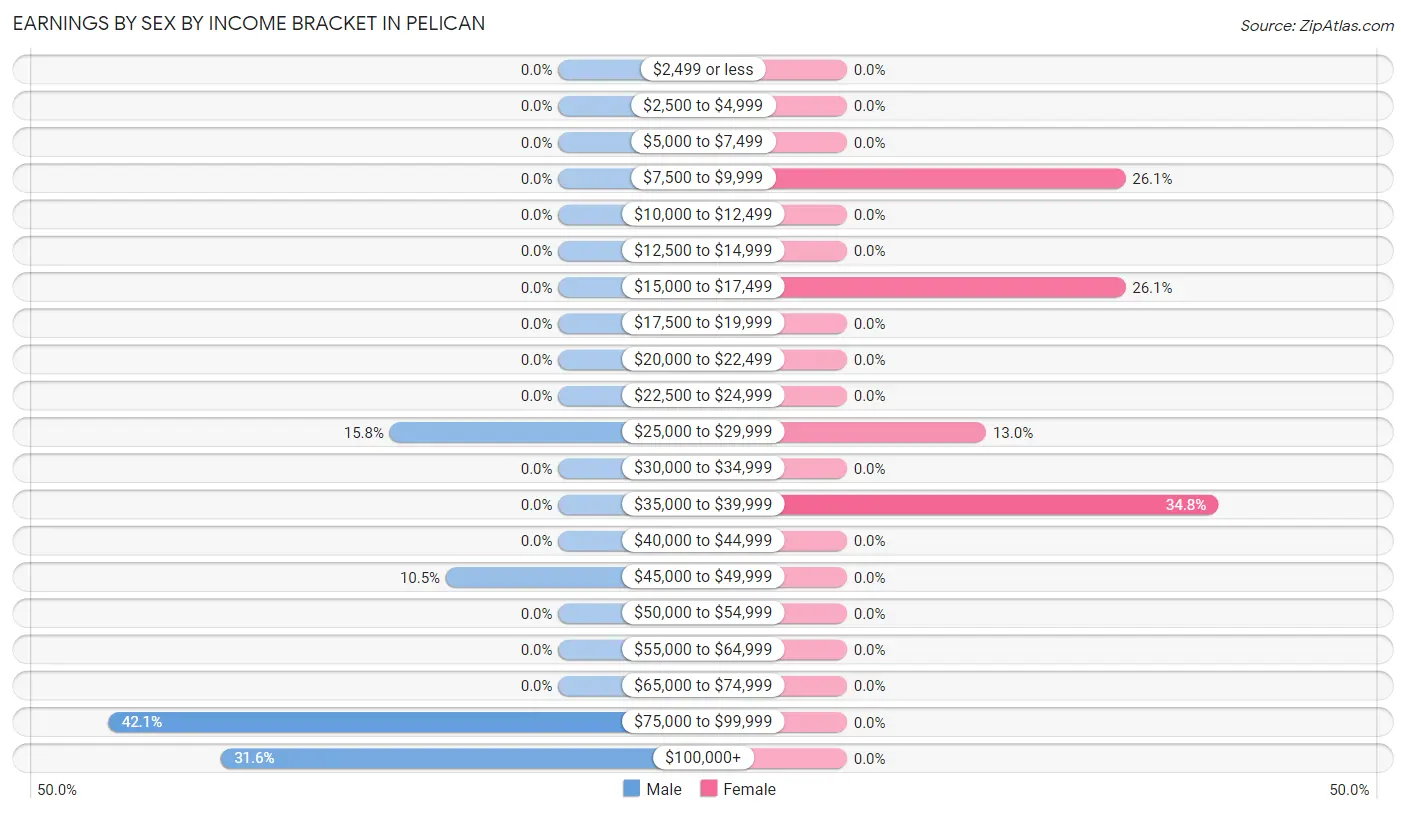
Earnings by Sex by Income Bracket in Pelican
The most common earnings brackets in Pelican are $75,000 to $99,999 for men (8 | 42.1%) and $35,000 to $39,999 for women (8 | 34.8%).
| Income | Male | Female |
| $2,499 or less | 0 (0.0%) | 0 (0.0%) |
| $2,500 to $4,999 | 0 (0.0%) | 0 (0.0%) |
| $5,000 to $7,499 | 0 (0.0%) | 0 (0.0%) |
| $7,500 to $9,999 | 0 (0.0%) | 6 (26.1%) |
| $10,000 to $12,499 | 0 (0.0%) | 0 (0.0%) |
| $12,500 to $14,999 | 0 (0.0%) | 0 (0.0%) |
| $15,000 to $17,499 | 0 (0.0%) | 6 (26.1%) |
| $17,500 to $19,999 | 0 (0.0%) | 0 (0.0%) |
| $20,000 to $22,499 | 0 (0.0%) | 0 (0.0%) |
| $22,500 to $24,999 | 0 (0.0%) | 0 (0.0%) |
| $25,000 to $29,999 | 3 (15.8%) | 3 (13.0%) |
| $30,000 to $34,999 | 0 (0.0%) | 0 (0.0%) |
| $35,000 to $39,999 | 0 (0.0%) | 8 (34.8%) |
| $40,000 to $44,999 | 0 (0.0%) | 0 (0.0%) |
| $45,000 to $49,999 | 2 (10.5%) | 0 (0.0%) |
| $50,000 to $54,999 | 0 (0.0%) | 0 (0.0%) |
| $55,000 to $64,999 | 0 (0.0%) | 0 (0.0%) |
| $65,000 to $74,999 | 0 (0.0%) | 0 (0.0%) |
| $75,000 to $99,999 | 8 (42.1%) | 0 (0.0%) |
| $100,000+ | 6 (31.6%) | 0 (0.0%) |
| Total | 19 (100.0%) | 23 (100.0%) |
Earnings by Sex by Educational Attainment in Pelican
| Educational Attainment | Male Income | Female Income |
| Less than High School | - | - |
| High School Diploma | - | - |
| College or Associate's Degree | - | - |
| Bachelor's Degree | - | - |
| Graduate Degree | - | - |
| Total | $78,036 | $0 |
Family Income in Pelican
Family Income Brackets in Pelican
According to the Pelican family income data, there are 4 families falling into the $35,000 to $49,999 income range, which is the most common income bracket and makes up 66.7% of all families.
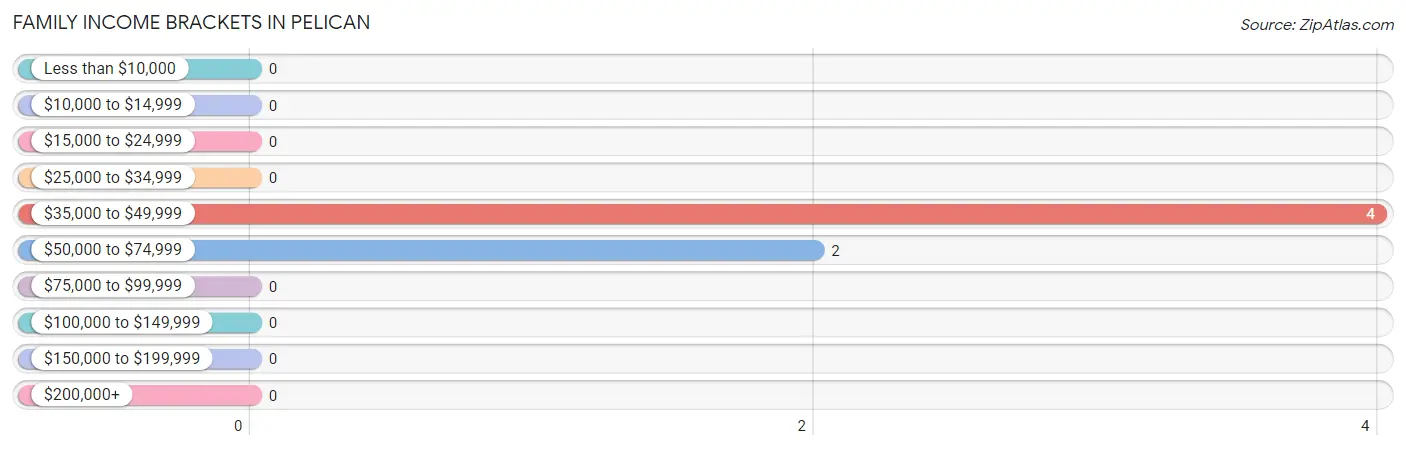
| Income Bracket | # Families | % Families |
| Less than $10,000 | 0 | 0.0% |
| $10,000 to $14,999 | 0 | 0.0% |
| $15,000 to $24,999 | 0 | 0.0% |
| $25,000 to $34,999 | 0 | 0.0% |
| $35,000 to $49,999 | 4 | 66.7% |
| $50,000 to $74,999 | 2 | 33.3% |
| $75,000 to $99,999 | 0 | 0.0% |
| $100,000 to $149,999 | 0 | 0.0% |
| $150,000 to $199,999 | 0 | 0.0% |
| $200,000+ | 0 | 0.0% |
Family Income by Famaliy Size in Pelican
| Income Bracket | # Families | Median Income |
| 2-Person Families | 6 (100.0%) | $0 |
| 3-Person Families | 0 (0.0%) | $0 |
| 4-Person Families | 0 (0.0%) | $0 |
| 5-Person Families | 0 (0.0%) | $0 |
| 6-Person Families | 0 (0.0%) | $0 |
| 7+ Person Families | 0 (0.0%) | $0 |
| Total | 6 (100.0%) | $0 |
Family Income by Number of Earners in Pelican
| Number of Earners | # Families | Median Income |
| No Earners | 6 (100.0%) | $0 |
| 1 Earner | 0 (0.0%) | $0 |
| 2 Earners | 0 (0.0%) | $0 |
| 3+ Earners | 0 (0.0%) | $0 |
| Total | 6 (100.0%) | $0 |
Household Income in Pelican
Household Income Brackets in Pelican
With 10 households falling in the category, the $35,000 to $49,999 income range is the most frequent in Pelican, accounting for 27.8% of all households.
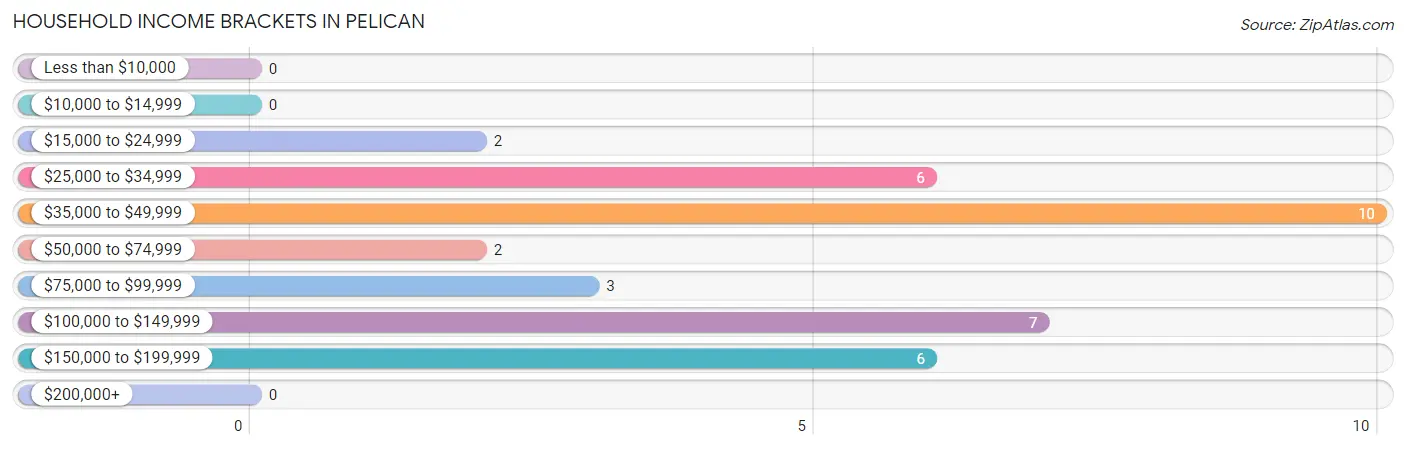
| Income Bracket | # Households | % Households |
| Less than $10,000 | 0 | 0.0% |
| $10,000 to $14,999 | 0 | 0.0% |
| $15,000 to $24,999 | 2 | 5.6% |
| $25,000 to $34,999 | 6 | 16.7% |
| $35,000 to $49,999 | 10 | 27.8% |
| $50,000 to $74,999 | 2 | 5.6% |
| $75,000 to $99,999 | 3 | 8.3% |
| $100,000 to $149,999 | 7 | 19.4% |
| $150,000 to $199,999 | 6 | 16.7% |
| $200,000+ | 0 | 0.0% |
Household Income by Householder Age in Pelican
The median household income in Pelican is $0, with the highest median household income of $41,250 found in the 65+ years age bracket for the primary householder. A total of 8 households (22.2%) fall into this category. Meanwhile, the 15 to 24 years age bracket for the primary householder has the lowest median household income of $0, with 6 households (16.7%) in this group.
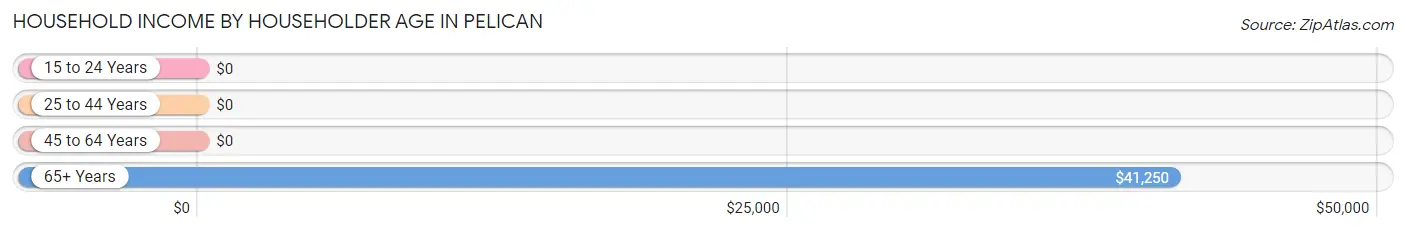
| Income Bracket | # Households | Median Income |
| 15 to 24 Years | 6 (16.7%) | $0 |
| 25 to 44 Years | 2 (5.6%) | $0 |
| 45 to 64 Years | 20 (55.6%) | $0 |
| 65+ Years | 8 (22.2%) | $41,250 |
| Total | 36 (100.0%) | $0 |
Poverty in Pelican
Income Below Poverty by Sex and Age in Pelican
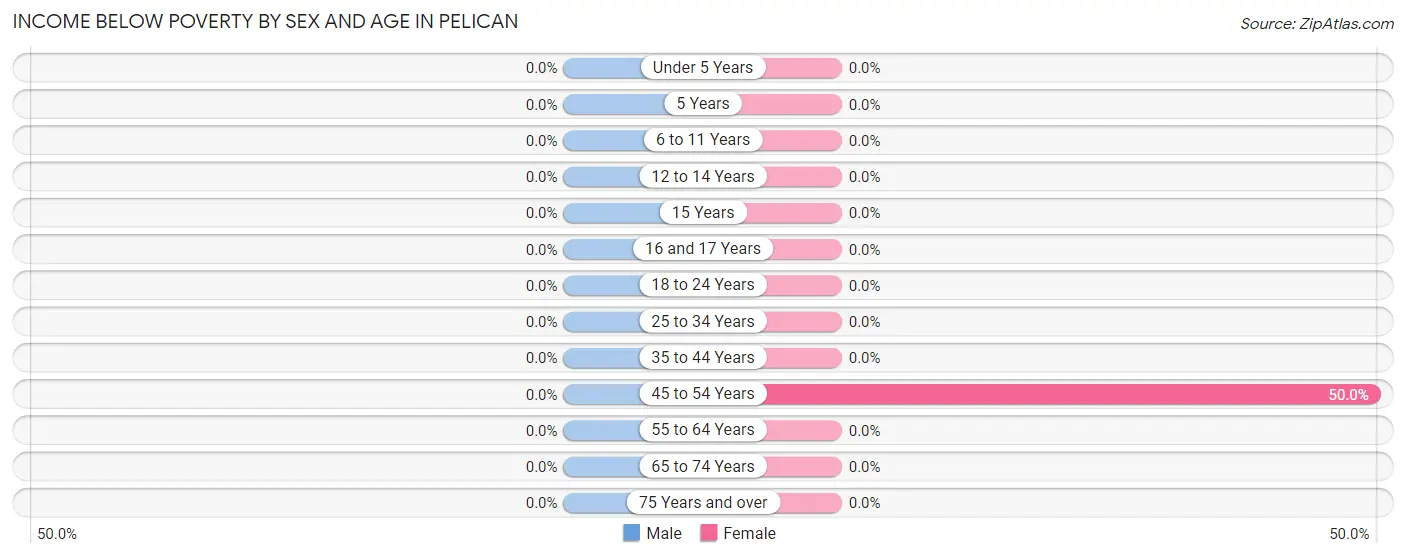
| Age Bracket | Male | Female |
| Under 5 Years | 0 (0.0%) | 0 (0.0%) |
| 5 Years | 0 (0.0%) | 0 (0.0%) |
| 6 to 11 Years | 0 (0.0%) | 0 (0.0%) |
| 12 to 14 Years | 0 (0.0%) | 0 (0.0%) |
| 15 Years | 0 (0.0%) | 0 (0.0%) |
| 16 and 17 Years | 0 (0.0%) | 0 (0.0%) |
| 18 to 24 Years | 0 (0.0%) | 0 (0.0%) |
| 25 to 34 Years | 0 (0.0%) | 0 (0.0%) |
| 35 to 44 Years | 0 (0.0%) | 0 (0.0%) |
| 45 to 54 Years | 0 (0.0%) | 6 (50.0%) |
| 55 to 64 Years | 0 (0.0%) | 0 (0.0%) |
| 65 to 74 Years | 0 (0.0%) | 0 (0.0%) |
| 75 Years and over | 0 (0.0%) | 0 (0.0%) |
| Total | 0 (0.0%) | 6 (20.7%) |
Income Above Poverty by Sex and Age in Pelican
According to the poverty statistics in Pelican, males aged 18 to 24 years and females aged 18 to 24 years are the age groups that are most secure financially, with 100.0% of males and 100.0% of females in these age groups living above the poverty line.
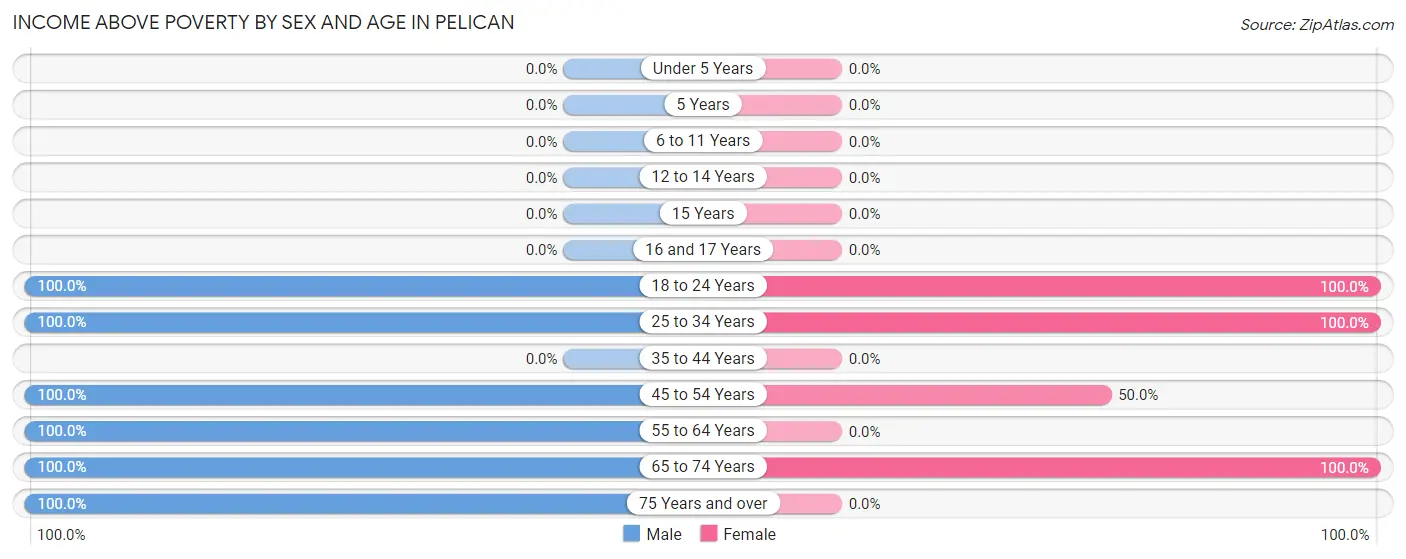
| Age Bracket | Male | Female |
| Under 5 Years | 0 (0.0%) | 0 (0.0%) |
| 5 Years | 0 (0.0%) | 0 (0.0%) |
| 6 to 11 Years | 0 (0.0%) | 0 (0.0%) |
| 12 to 14 Years | 0 (0.0%) | 0 (0.0%) |
| 15 Years | 0 (0.0%) | 0 (0.0%) |
| 16 and 17 Years | 0 (0.0%) | 0 (0.0%) |
| 18 to 24 Years | 6 (100.0%) | 3 (100.0%) |
| 25 to 34 Years | 2 (100.0%) | 8 (100.0%) |
| 35 to 44 Years | 0 (0.0%) | 0 (0.0%) |
| 45 to 54 Years | 10 (100.0%) | 6 (50.0%) |
| 55 to 64 Years | 1 (100.0%) | 0 (0.0%) |
| 65 to 74 Years | 6 (100.0%) | 6 (100.0%) |
| 75 Years and over | 3 (100.0%) | 0 (0.0%) |
| Total | 28 (100.0%) | 23 (79.3%) |
Income Below Poverty Among Married-Couple Families in Pelican
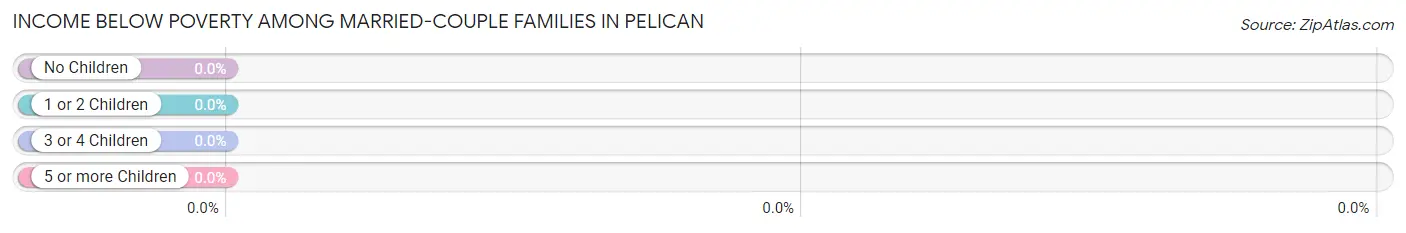
| Children | Above Poverty | Below Poverty |
| No Children | 6 (100.0%) | 0 (0.0%) |
| 1 or 2 Children | 0 (0.0%) | 0 (0.0%) |
| 3 or 4 Children | 0 (0.0%) | 0 (0.0%) |
| 5 or more Children | 0 (0.0%) | 0 (0.0%) |
| Total | 6 (100.0%) | 0 (0.0%) |
Income Below Poverty Among Single-Parent Households in Pelican
| Children | Single Father | Single Mother |
| No Children | 0 (0.0%) | 0 (0.0%) |
| 1 or 2 Children | 0 (0.0%) | 0 (0.0%) |
| 3 or 4 Children | 0 (0.0%) | 0 (0.0%) |
| 5 or more Children | 0 (0.0%) | 0 (0.0%) |
| Total | 0 (0.0%) | 0 (0.0%) |
Income Below Poverty Among Married-Couple vs Single-Parent Households in Pelican
| Children | Married-Couple Families | Single-Parent Households |
| No Children | 0 (0.0%) | 0 (0.0%) |
| 1 or 2 Children | 0 (0.0%) | 0 (0.0%) |
| 3 or 4 Children | 0 (0.0%) | 0 (0.0%) |
| 5 or more Children | 0 (0.0%) | 0 (0.0%) |
| Total | 0 (0.0%) | 0 (0.0%) |
Race in Pelican
The most populous races in Pelican are White / Caucasian (35 | 61.4%), Native / Alaskan (16 | 28.1%), and Two or more Races (6 | 10.5%).
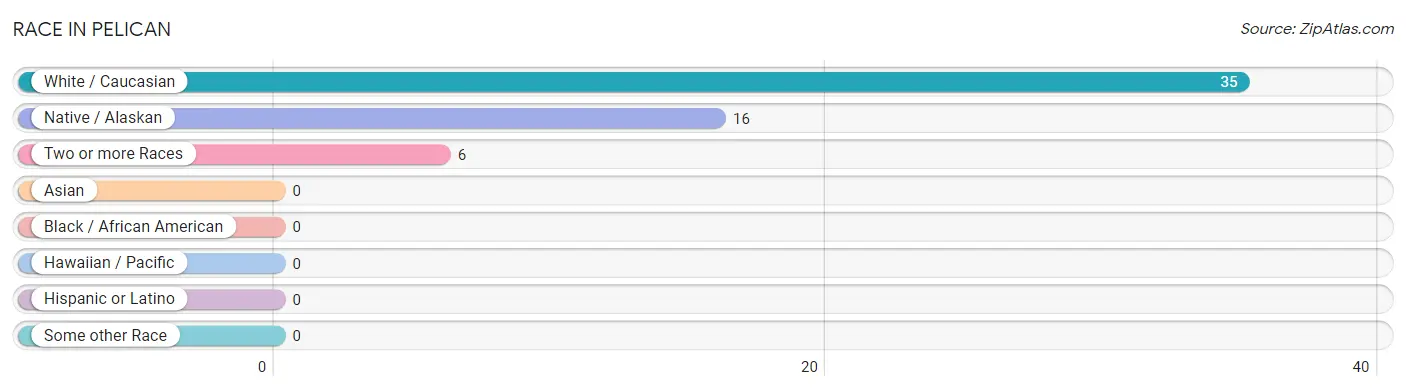
| Race | # Population | % Population |
| Asian | 0 | 0.0% |
| Black / African American | 0 | 0.0% |
| Hawaiian / Pacific | 0 | 0.0% |
| Hispanic or Latino | 0 | 0.0% |
| Native / Alaskan | 16 | 28.1% |
| White / Caucasian | 35 | 61.4% |
| Two or more Races | 6 | 10.5% |
| Some other Race | 0 | 0.0% |
| Total | 57 | 100.0% |
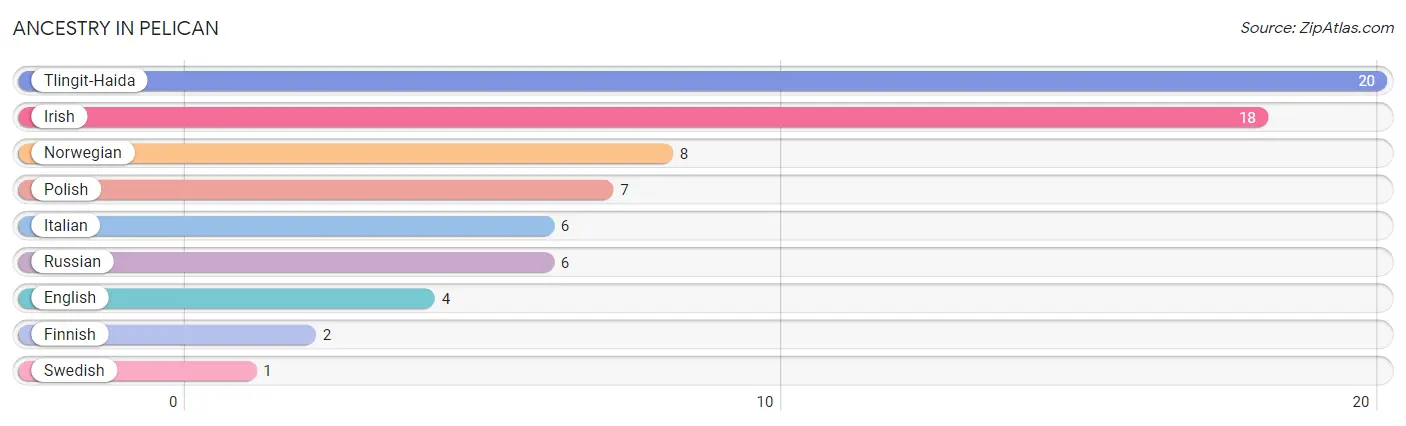
Ancestry in Pelican
The most populous ancestries reported in Pelican are Tlingit-Haida (20 | 35.1%), Irish (18 | 31.6%), Norwegian (8 | 14.0%), Polish (7 | 12.3%), and Italian (6 | 10.5%), together accounting for 103.5% of all Pelican residents.
| Ancestry | # Population | % Population |
| English | 4 | 7.0% |
| Finnish | 2 | 3.5% |
| Irish | 18 | 31.6% |
| Italian | 6 | 10.5% |
| Norwegian | 8 | 14.0% |
| Polish | 7 | 12.3% |
| Russian | 6 | 10.5% |
| Swedish | 1 | 1.8% |
| Tlingit-Haida | 20 | 35.1% | View All 9 Rows |
Immigrants in Pelican

| Immigration Origin | # Population | % Population | View All 0 Rows |
Sex and Age in Pelican
Sex and Age in Pelican
The most populous age groups in Pelican are 50 to 54 Years (10 | 35.7%) for men and 45 to 49 Years (12 | 41.4%) for women.
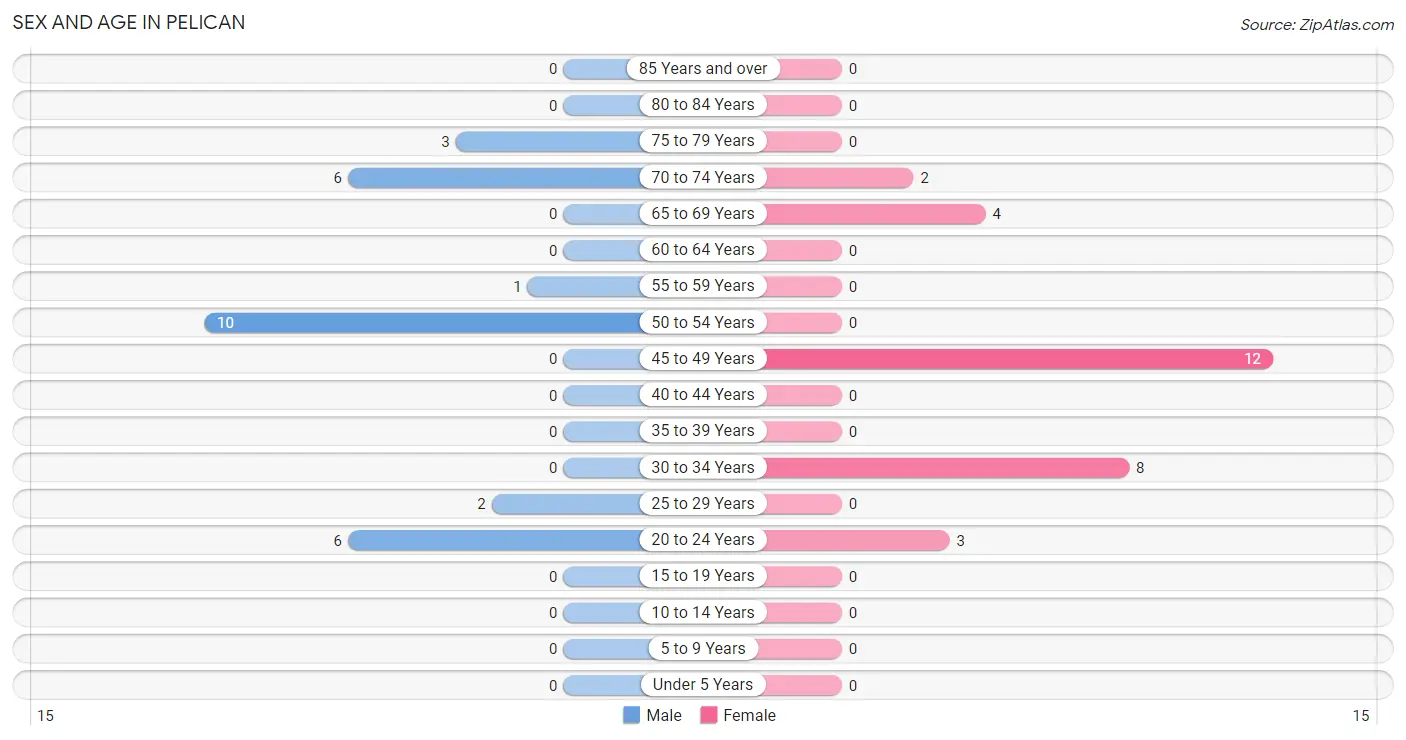
| Age Bracket | Male | Female |
| Under 5 Years | 0 (0.0%) | 0 (0.0%) |
| 5 to 9 Years | 0 (0.0%) | 0 (0.0%) |
| 10 to 14 Years | 0 (0.0%) | 0 (0.0%) |
| 15 to 19 Years | 0 (0.0%) | 0 (0.0%) |
| 20 to 24 Years | 6 (21.4%) | 3 (10.3%) |
| 25 to 29 Years | 2 (7.1%) | 0 (0.0%) |
| 30 to 34 Years | 0 (0.0%) | 8 (27.6%) |
| 35 to 39 Years | 0 (0.0%) | 0 (0.0%) |
| 40 to 44 Years | 0 (0.0%) | 0 (0.0%) |
| 45 to 49 Years | 0 (0.0%) | 12 (41.4%) |
| 50 to 54 Years | 10 (35.7%) | 0 (0.0%) |
| 55 to 59 Years | 1 (3.6%) | 0 (0.0%) |
| 60 to 64 Years | 0 (0.0%) | 0 (0.0%) |
| 65 to 69 Years | 0 (0.0%) | 4 (13.8%) |
| 70 to 74 Years | 6 (21.4%) | 2 (6.9%) |
| 75 to 79 Years | 3 (10.7%) | 0 (0.0%) |
| 80 to 84 Years | 0 (0.0%) | 0 (0.0%) |
| 85 Years and over | 0 (0.0%) | 0 (0.0%) |
| Total | 28 (100.0%) | 29 (100.0%) |
Families and Households in Pelican
Median Family Size in Pelican
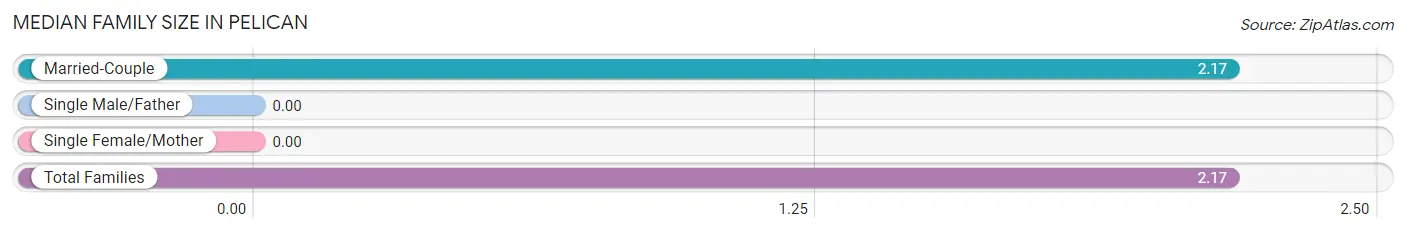
| Family Type | # Families | Family Size |
| Married-Couple | 6 (100.0%) | 2.17 |
| Single Male/Father | 0 (0.0%) | - |
| Single Female/Mother | 0 (0.0%) | - |
| Total Families | 6 (100.0%) | 2.17 |
Median Household Size in Pelican
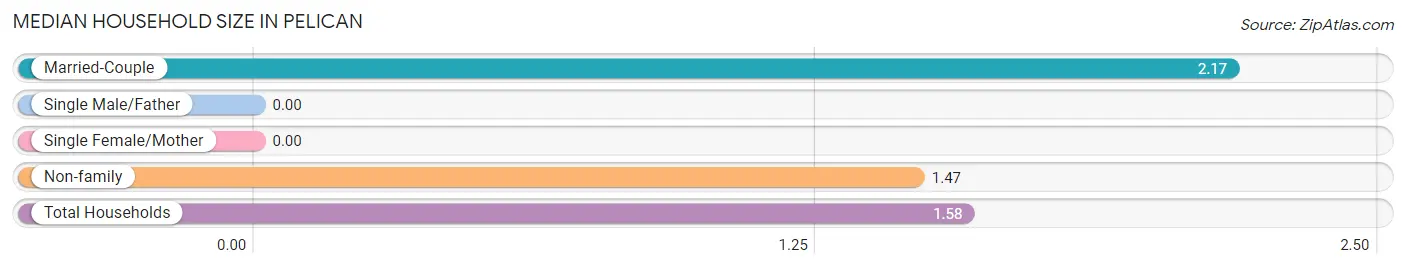
| Household Type | # Households | Household Size |
| Married-Couple | 6 (16.7%) | 2.17 |
| Single Male/Father | 0 (0.0%) | - |
| Single Female/Mother | 0 (0.0%) | - |
| Non-family | 30 (83.3%) | 1.47 |
| Total Households | 36 (100.0%) | 1.58 |
Household Size by Marriage Status in Pelican
Out of a total of 36 households in Pelican, 6 (16.7%) are family households, while 30 (83.3%) are nonfamily households. The most numerous type of family households are 2-person households, comprising 6, and the most common type of nonfamily households are 1-person households, comprising 15.
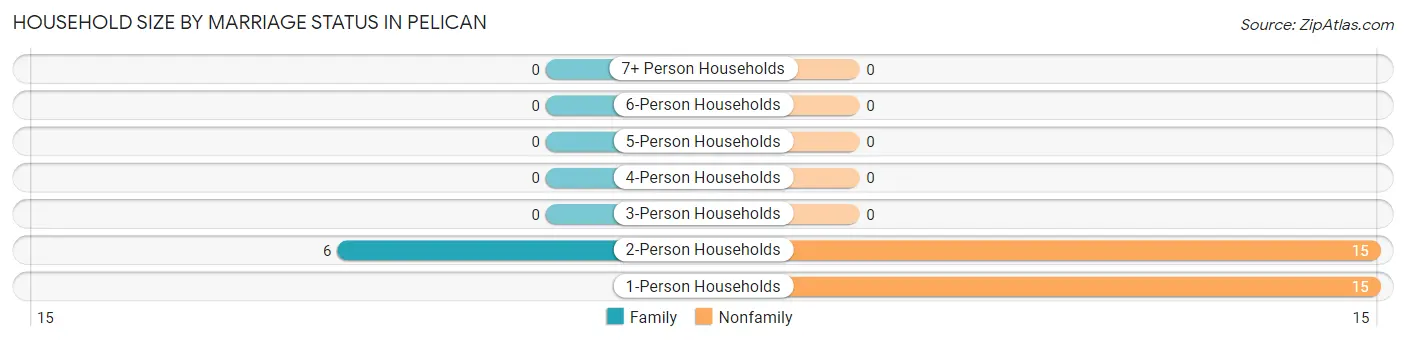
| Household Size | Family Households | Nonfamily Households |
| 1-Person Households | - | 15 (41.7%) |
| 2-Person Households | 6 (16.7%) | 15 (41.7%) |
| 3-Person Households | 0 (0.0%) | 0 (0.0%) |
| 4-Person Households | 0 (0.0%) | 0 (0.0%) |
| 5-Person Households | 0 (0.0%) | 0 (0.0%) |
| 6-Person Households | 0 (0.0%) | 0 (0.0%) |
| 7+ Person Households | 0 (0.0%) | 0 (0.0%) |
| Total | 6 (16.7%) | 30 (83.3%) |
Female Fertility in Pelican
Fertility by Age in Pelican
| Age Bracket | Women with Births | Births / 1,000 Women |
| 15 to 19 years | 0 (0.0%) | 0.0 |
| 20 to 34 years | 0 (0.0%) | 0.0 |
| 35 to 50 years | 0 (0.0%) | 0.0 |
| Total | 0 (0.0%) | 0.0 |
Fertility by Age by Marriage Status in Pelican
| Age Bracket | Married | Unmarried |
| 15 to 19 years | 0 (0.0%) | 0 (0.0%) |
| 20 to 34 years | 0 (0.0%) | 0 (0.0%) |
| 35 to 50 years | 0 (0.0%) | 0 (0.0%) |
| Total | 0 (0.0%) | 0 (0.0%) |
Fertility by Education in Pelican
| Educational Attainment | Women with Births | Births / 1,000 Women |
| Less than High School | 0 (0.0%) | 0.0 |
| High School Diploma | 0 (0.0%) | 0.0 |
| College or Associate's Degree | 0 (0.0%) | 0.0 |
| Bachelor's Degree | 0 (0.0%) | 0.0 |
| Graduate Degree | 0 (0.0%) | 0.0 |
| Total | 0 (0.0%) | 0.0 |
Fertility by Education by Marriage Status in Pelican
| Educational Attainment | Married | Unmarried |
| Less than High School | 0 (0.0%) | 0 (0.0%) |
| High School Diploma | 0 (0.0%) | 0 (0.0%) |
| College or Associate's Degree | 0 (0.0%) | 0 (0.0%) |
| Bachelor's Degree | 0 (0.0%) | 0 (0.0%) |
| Graduate Degree | 0 (0.0%) | 0 (0.0%) |
| Total | 0 (0.0%) | 0 (0.0%) |
Employment Characteristics in Pelican
Employment by Class of Employer in Pelican
Among the 36 employed individuals in Pelican, self-employed (not incorporated) (10 | 27.8%), local government employees (10 | 27.8%), and private company employees (7 | 19.4%) make up the most common classes of employment.
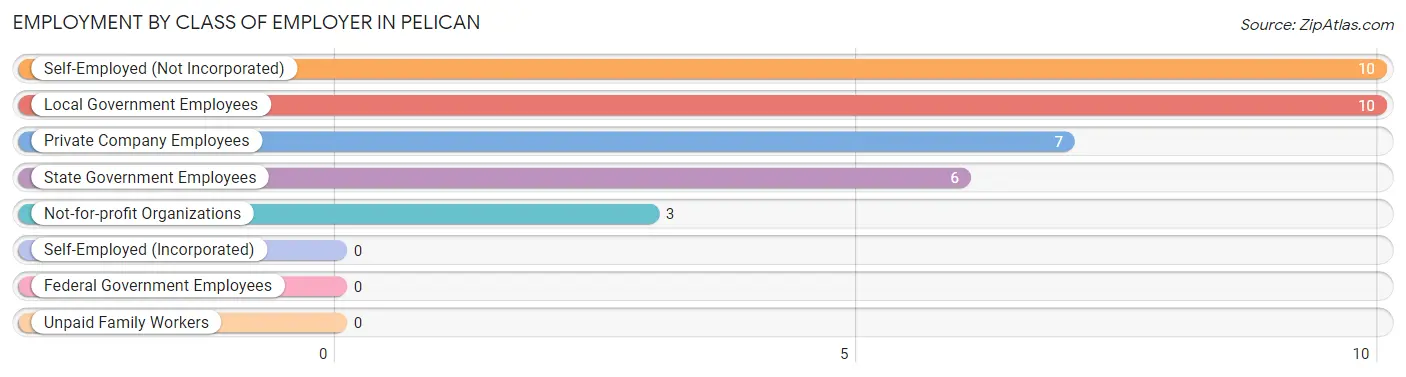
| Employer Class | # Employees | % Employees |
| Private Company Employees | 7 | 19.4% |
| Self-Employed (Incorporated) | 0 | 0.0% |
| Self-Employed (Not Incorporated) | 10 | 27.8% |
| Not-for-profit Organizations | 3 | 8.3% |
| Local Government Employees | 10 | 27.8% |
| State Government Employees | 6 | 16.7% |
| Federal Government Employees | 0 | 0.0% |
| Unpaid Family Workers | 0 | 0.0% |
| Total | 36 | 100.0% |
Employment Status by Age in Pelican
According to the labor force statistics for Pelican, out of the total population over 16 years of age (57), 73.7% or 42 individuals are in the labor force, with 14.3% or 6 of them unemployed. The age group with the highest labor force participation rate is 20 to 24 years, with 100.0% or 9 individuals in the labor force. Within the labor force, the 20 to 24 years age range has the highest percentage of unemployed individuals, with 66.7% or 6 of them being unemployed.
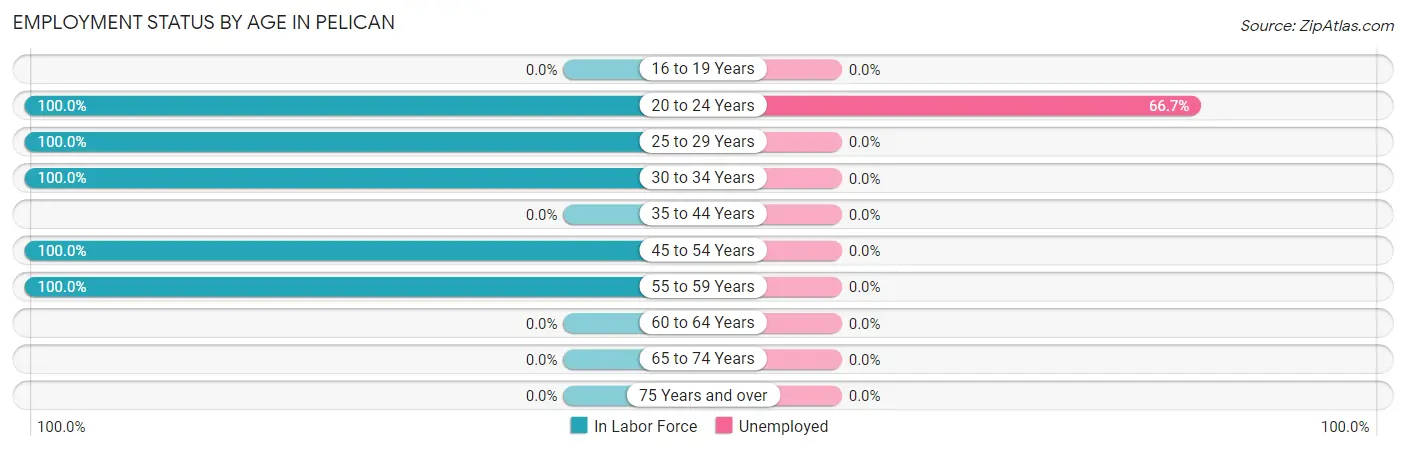
| Age Bracket | In Labor Force | Unemployed |
| 16 to 19 Years | 0 (0.0%) | 0 (0.0%) |
| 20 to 24 Years | 9 (100.0%) | 6 (66.7%) |
| 25 to 29 Years | 2 (100.0%) | 0 (0.0%) |
| 30 to 34 Years | 8 (100.0%) | 0 (0.0%) |
| 35 to 44 Years | 0 (0.0%) | 0 (0.0%) |
| 45 to 54 Years | 22 (100.0%) | 0 (0.0%) |
| 55 to 59 Years | 1 (100.0%) | 0 (0.0%) |
| 60 to 64 Years | 0 (0.0%) | 0 (0.0%) |
| 65 to 74 Years | 0 (0.0%) | 0 (0.0%) |
| 75 Years and over | 0 (0.0%) | 0 (0.0%) |
| Total | 42 (73.7%) | 6 (14.3%) |
Employment Status by Educational Attainment in Pelican
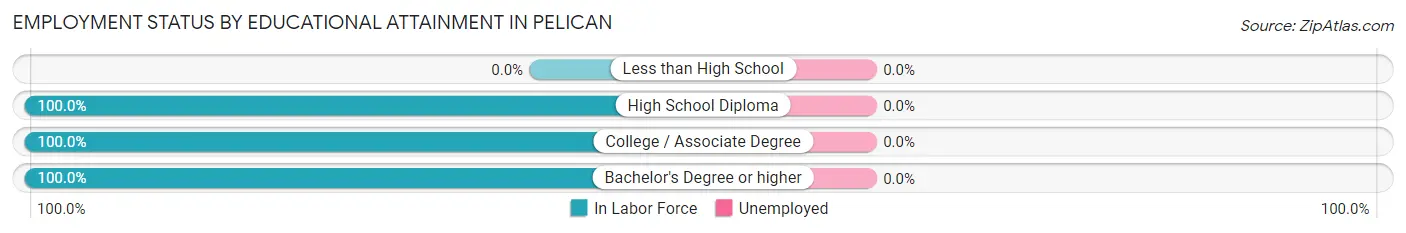
| Educational Attainment | In Labor Force | Unemployed |
| Less than High School | 0 (0.0%) | 0 (0.0%) |
| High School Diploma | 9 (100.0%) | 0 (0.0%) |
| College / Associate Degree | 11 (100.0%) | 0 (0.0%) |
| Bachelor's Degree or higher | 13 (100.0%) | 0 (0.0%) |
| Total | 33 (100.0%) | 0 (0.0%) |
Employment Occupations by Sex in Pelican
Management, Business, Science and Arts Occupations
The most common Management, Business, Science and Arts occupations in Pelican are , and Management (8 | 22.2%).
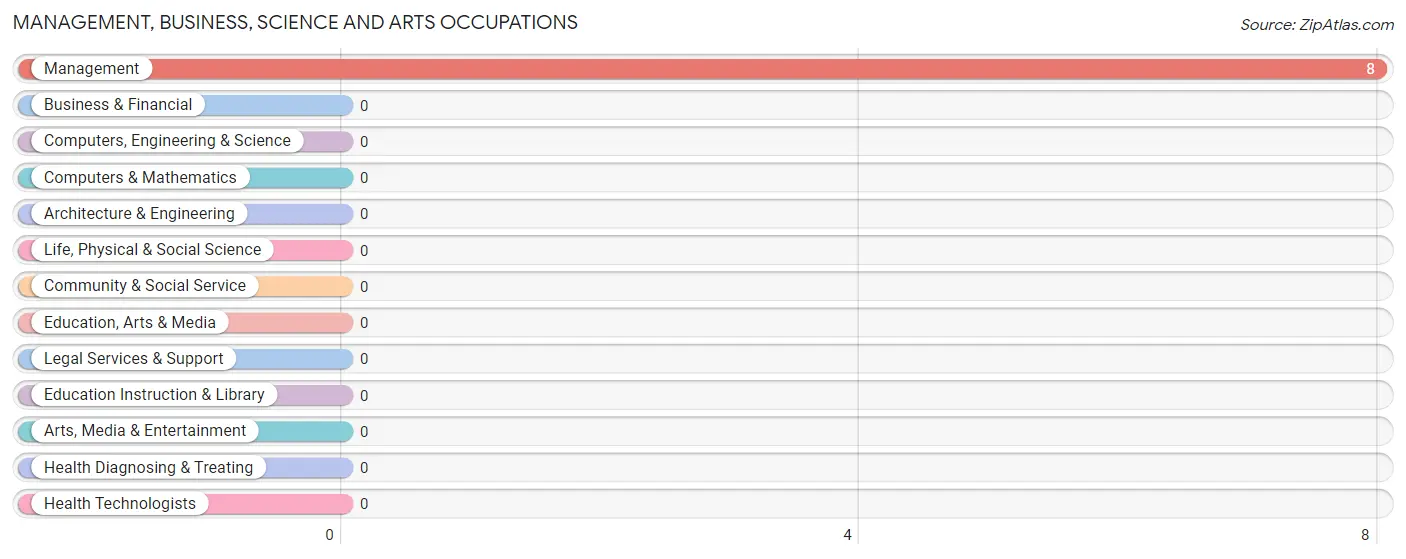
Management, Business, Science and Arts Occupations by Sex
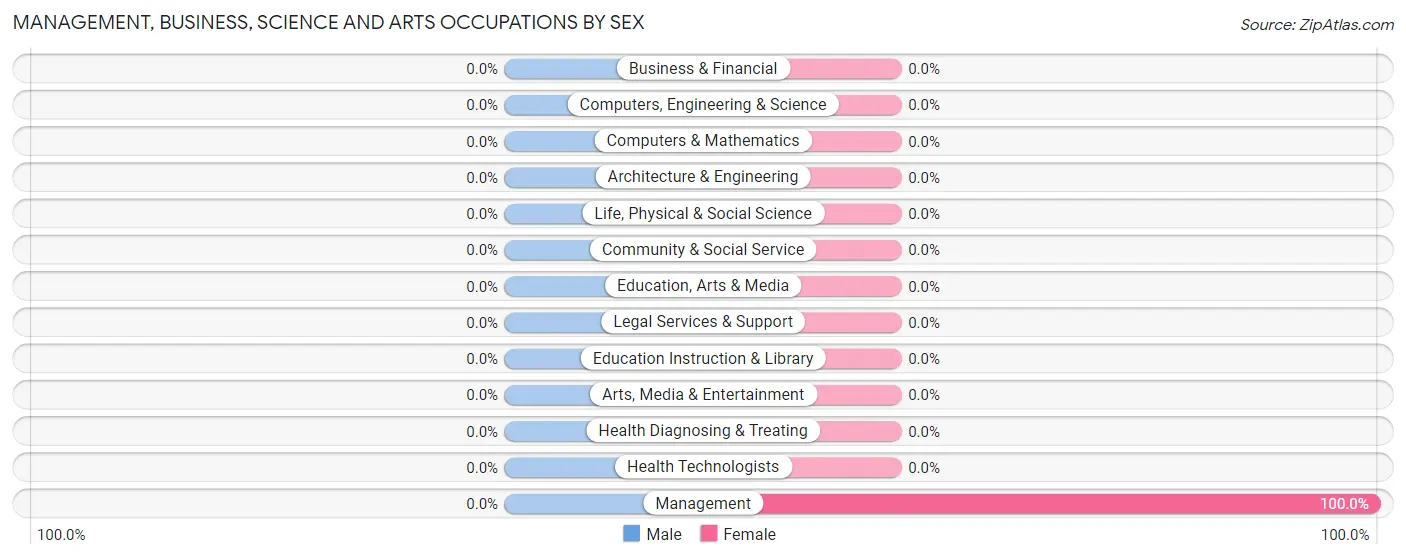
| Occupation | Male | Female |
| Management | 0 (0.0%) | 8 (100.0%) |
| Business & Financial | 0 (0.0%) | 0 (0.0%) |
| Computers, Engineering & Science | 0 (0.0%) | 0 (0.0%) |
| Computers & Mathematics | 0 (0.0%) | 0 (0.0%) |
| Architecture & Engineering | 0 (0.0%) | 0 (0.0%) |
| Life, Physical & Social Science | 0 (0.0%) | 0 (0.0%) |
| Community & Social Service | 0 (0.0%) | 0 (0.0%) |
| Education, Arts & Media | 0 (0.0%) | 0 (0.0%) |
| Legal Services & Support | 0 (0.0%) | 0 (0.0%) |
| Education Instruction & Library | 0 (0.0%) | 0 (0.0%) |
| Arts, Media & Entertainment | 0 (0.0%) | 0 (0.0%) |
| Health Diagnosing & Treating | 0 (0.0%) | 0 (0.0%) |
| Health Technologists | 0 (0.0%) | 0 (0.0%) |
| Total (Category) | 0 (0.0%) | 8 (100.0%) |
| Total (Overall) | 13 (36.1%) | 23 (63.9%) |
Services Occupations
The most common Services occupations in Pelican are Personal Care & Service (6 | 16.7%), and Healthcare Support (3 | 8.3%).
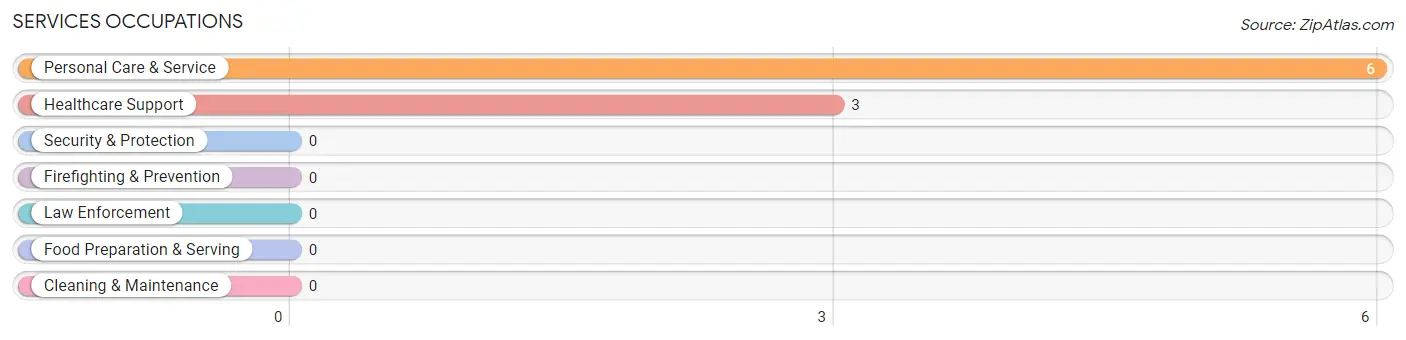
Services Occupations by Sex
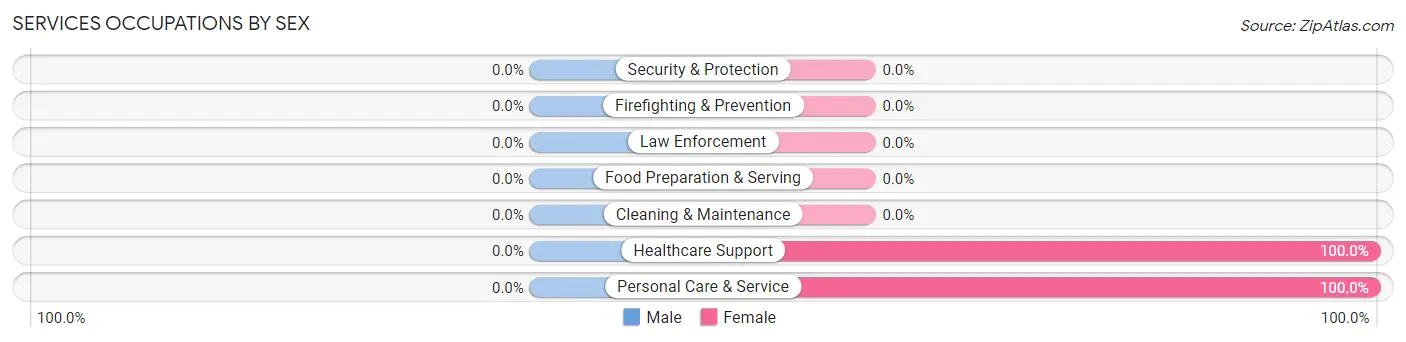
| Occupation | Male | Female |
| Healthcare Support | 0 (0.0%) | 3 (100.0%) |
| Security & Protection | 0 (0.0%) | 0 (0.0%) |
| Firefighting & Prevention | 0 (0.0%) | 0 (0.0%) |
| Law Enforcement | 0 (0.0%) | 0 (0.0%) |
| Food Preparation & Serving | 0 (0.0%) | 0 (0.0%) |
| Cleaning & Maintenance | 0 (0.0%) | 0 (0.0%) |
| Personal Care & Service | 0 (0.0%) | 6 (100.0%) |
| Total (Category) | 0 (0.0%) | 9 (100.0%) |
| Total (Overall) | 13 (36.1%) | 23 (63.9%) |
Sales and Office Occupations
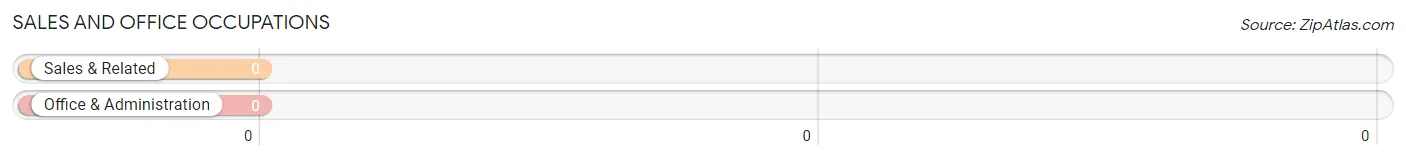
Sales and Office Occupations by Sex
| Occupation | Male | Female |
| Sales & Related | 0 (0.0%) | 0 (0.0%) |
| Office & Administration | 0 (0.0%) | 0 (0.0%) |
| Total (Category) | 0 (0.0%) | 0 (0.0%) |
| Total (Overall) | 13 (36.1%) | 23 (63.9%) |
Natural Resources, Construction and Maintenance Occupations
The most common Natural Resources, Construction and Maintenance occupations in Pelican are Farming, Fishing & Forestry (3 | 8.3%), and Installation, Maintenance & Repair (1 | 2.8%).
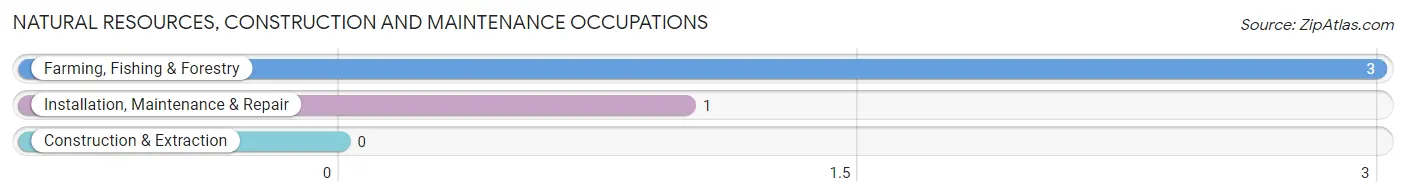
Natural Resources, Construction and Maintenance Occupations by Sex
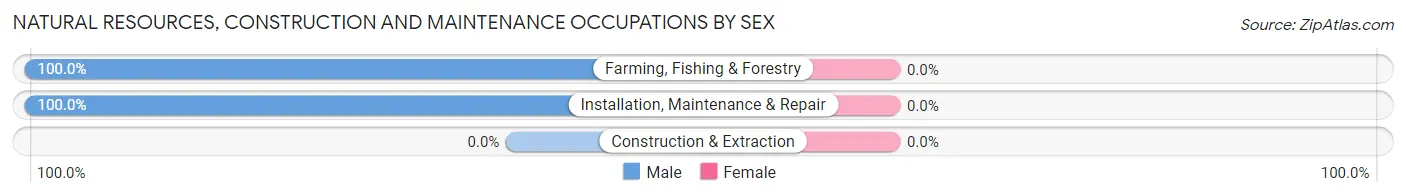
| Occupation | Male | Female |
| Farming, Fishing & Forestry | 3 (100.0%) | 0 (0.0%) |
| Construction & Extraction | 0 (0.0%) | 0 (0.0%) |
| Installation, Maintenance & Repair | 1 (100.0%) | 0 (0.0%) |
| Total (Category) | 4 (100.0%) | 0 (0.0%) |
| Total (Overall) | 13 (36.1%) | 23 (63.9%) |
Production, Transportation and Moving Occupations
The most common Production, Transportation and Moving occupations in Pelican are Production (8 | 22.2%), and Transportation (7 | 19.4%).
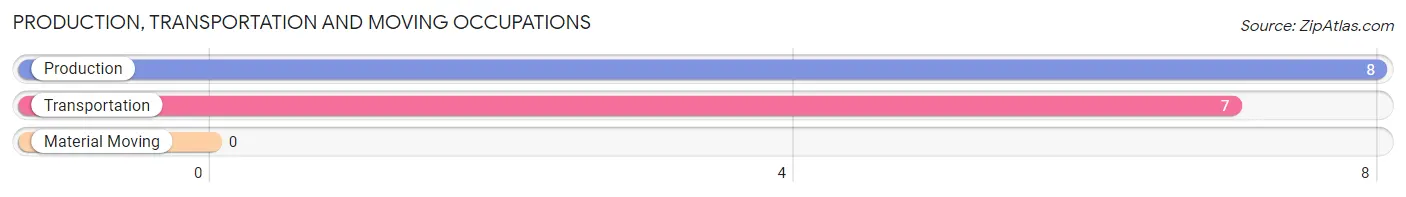
Production, Transportation and Moving Occupations by Sex
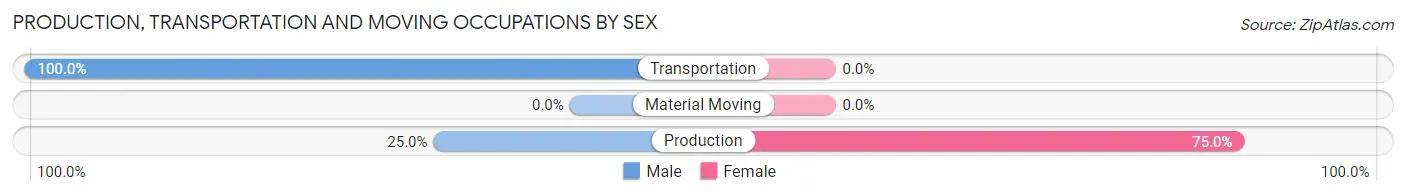
| Occupation | Male | Female |
| Production | 2 (25.0%) | 6 (75.0%) |
| Transportation | 7 (100.0%) | 0 (0.0%) |
| Material Moving | 0 (0.0%) | 0 (0.0%) |
| Total (Category) | 9 (60.0%) | 6 (40.0%) |
| Total (Overall) | 13 (36.1%) | 23 (63.9%) |
Employment Industries by Sex in Pelican
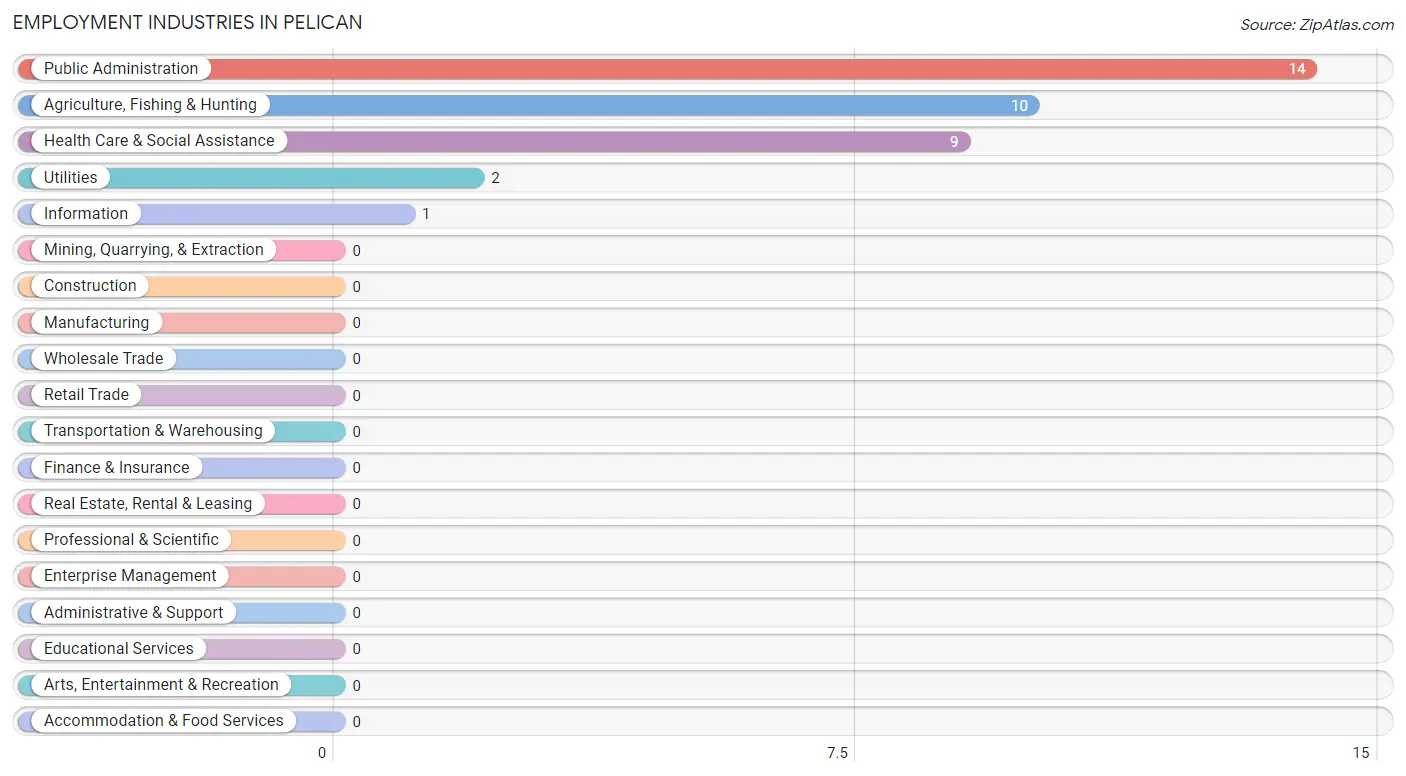
Employment Industries in Pelican
The major employment industries in Pelican include Public Administration (14 | 38.9%), Agriculture, Fishing & Hunting (10 | 27.8%), Health Care & Social Assistance (9 | 25.0%), Utilities (2 | 5.6%), and Information (1 | 2.8%).
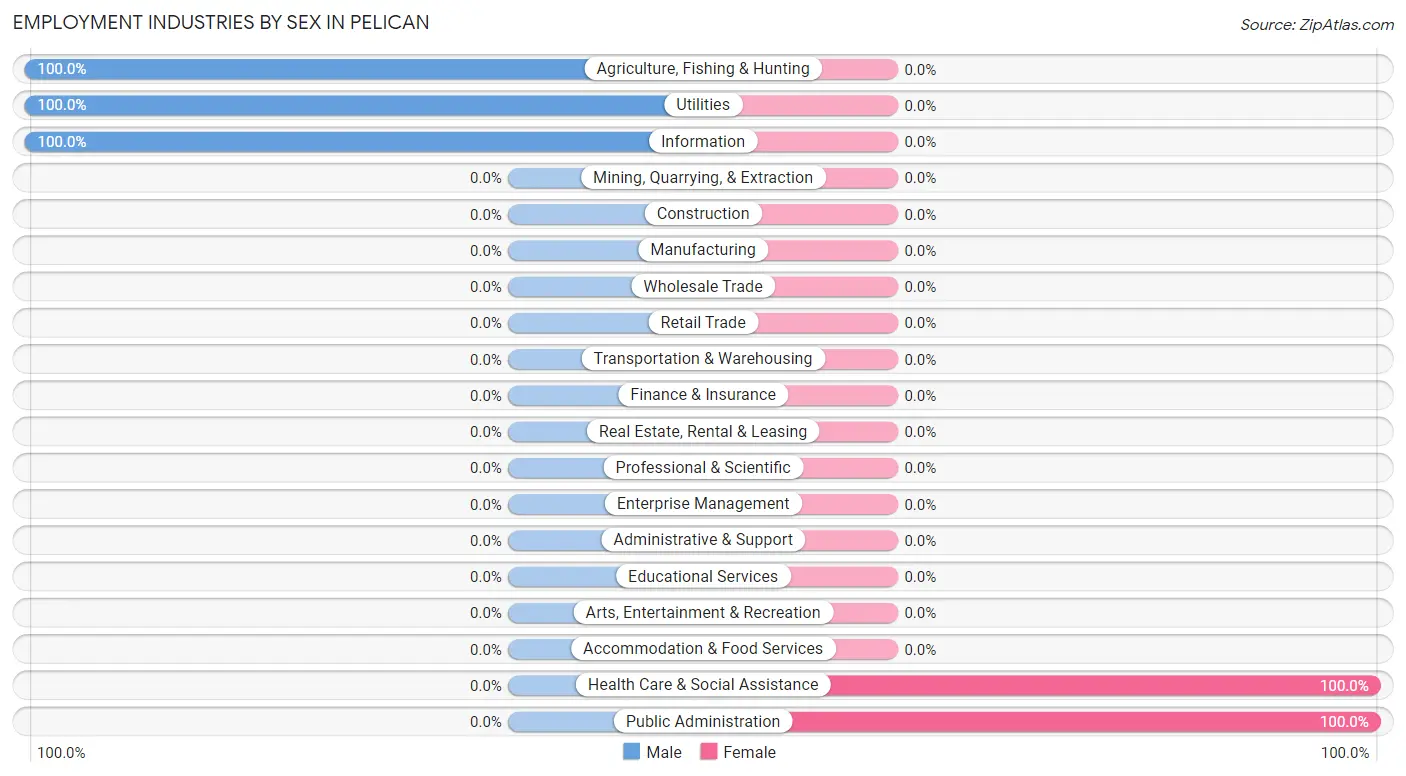
Employment Industries by Sex in Pelican
The Pelican industries that see more men than women are Agriculture, Fishing & Hunting (100.0%), Utilities (100.0%), and Information (100.0%), whereas the industries that tend to have a higher number of women are Health Care & Social Assistance (100.0%), and Public Administration (100.0%).
| Industry | Male | Female |
| Agriculture, Fishing & Hunting | 10 (100.0%) | 0 (0.0%) |
| Mining, Quarrying, & Extraction | 0 (0.0%) | 0 (0.0%) |
| Construction | 0 (0.0%) | 0 (0.0%) |
| Manufacturing | 0 (0.0%) | 0 (0.0%) |
| Wholesale Trade | 0 (0.0%) | 0 (0.0%) |
| Retail Trade | 0 (0.0%) | 0 (0.0%) |
| Transportation & Warehousing | 0 (0.0%) | 0 (0.0%) |
| Utilities | 2 (100.0%) | 0 (0.0%) |
| Information | 1 (100.0%) | 0 (0.0%) |
| Finance & Insurance | 0 (0.0%) | 0 (0.0%) |
| Real Estate, Rental & Leasing | 0 (0.0%) | 0 (0.0%) |
| Professional & Scientific | 0 (0.0%) | 0 (0.0%) |
| Enterprise Management | 0 (0.0%) | 0 (0.0%) |
| Administrative & Support | 0 (0.0%) | 0 (0.0%) |
| Educational Services | 0 (0.0%) | 0 (0.0%) |
| Health Care & Social Assistance | 0 (0.0%) | 9 (100.0%) |
| Arts, Entertainment & Recreation | 0 (0.0%) | 0 (0.0%) |
| Accommodation & Food Services | 0 (0.0%) | 0 (0.0%) |
| Public Administration | 0 (0.0%) | 14 (100.0%) |
| Total | 13 (36.1%) | 23 (63.9%) |
Education in Pelican
School Enrollment in Pelican
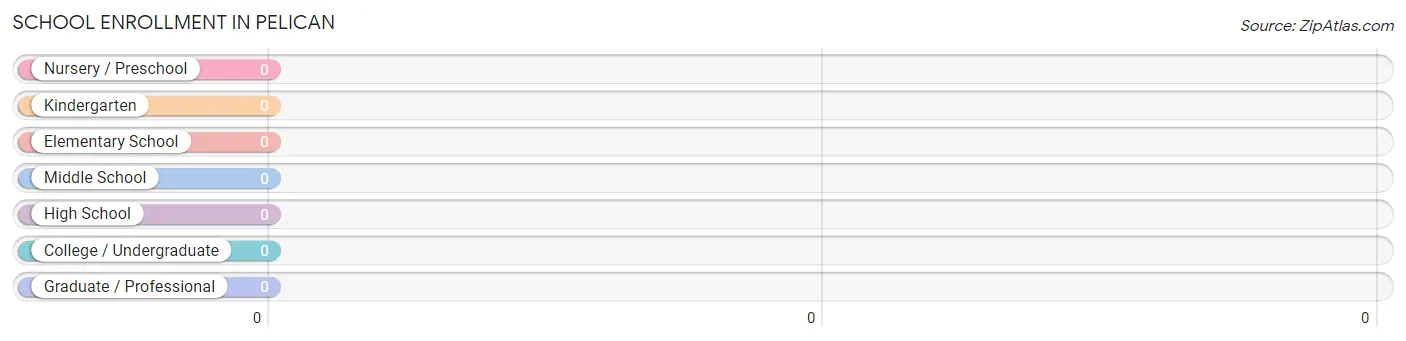
| School Level | # Students | % Students |
| Nursery / Preschool | 0 | 0.0% |
| Kindergarten | 0 | 0.0% |
| Elementary School | 0 | 0.0% |
| Middle School | 0 | 0.0% |
| High School | 0 | 0.0% |
| College / Undergraduate | 0 | 0.0% |
| Graduate / Professional | 0 | 0.0% |
| Total | 0 | 0.0% |
School Enrollment by Age by Funding Source in Pelican
| Age Bracket | Public School | Private School |
| 3 to 4 Year Olds | 0 (0.0%) | 0 (0.0%) |
| 5 to 9 Year Old | 0 (0.0%) | 0 (0.0%) |
| 10 to 14 Year Olds | 0 (0.0%) | 0 (0.0%) |
| 15 to 17 Year Olds | 0 (0.0%) | 0 (0.0%) |
| 18 to 19 Year Olds | 0 (0.0%) | 0 (0.0%) |
| 20 to 24 Year Olds | 0 (0.0%) | 0 (0.0%) |
| 25 to 34 Year Olds | 0 (0.0%) | 0 (0.0%) |
| 35 Years and over | 0 (0.0%) | 0 (0.0%) |
| Total | 0 (0.0%) | 0 (0.0%) |
Educational Attainment by Field of Study in Pelican
Arts & humanities (10 | 43.5%), visual & performing arts (7 | 30.4%), and computers & mathematics (6 | 26.1%) are the most common fields of study among 23 individuals in Pelican who have obtained a bachelor's degree or higher.

| Field of Study | # Graduates | % Graduates |
| Computers & Mathematics | 6 | 26.1% |
| Bio, Nature & Agricultural | 0 | 0.0% |
| Physical & Health Sciences | 0 | 0.0% |
| Psychology | 0 | 0.0% |
| Social Sciences | 0 | 0.0% |
| Engineering | 0 | 0.0% |
| Multidisciplinary Studies | 0 | 0.0% |
| Science & Technology | 0 | 0.0% |
| Business | 0 | 0.0% |
| Education | 0 | 0.0% |
| Literature & Languages | 0 | 0.0% |
| Liberal Arts & History | 0 | 0.0% |
| Visual & Performing Arts | 7 | 30.4% |
| Communications | 0 | 0.0% |
| Arts & Humanities | 10 | 43.5% |
| Total | 23 | 100.0% |
Transportation & Commute in Pelican
Vehicle Availability by Sex in Pelican
The most prevalent vehicle ownership categories in Pelican are males with no vehicle (9, accounting for 69.2%) and females with no vehicle (17, making up 39.1%).
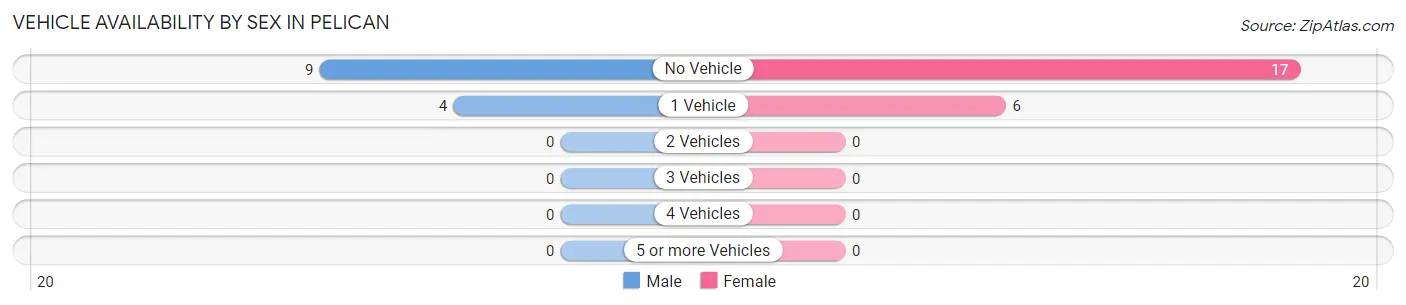
| Vehicles Available | Male | Female |
| No Vehicle | 9 (69.2%) | 17 (73.9%) |
| 1 Vehicle | 4 (30.8%) | 6 (26.1%) |
| 2 Vehicles | 0 (0.0%) | 0 (0.0%) |
| 3 Vehicles | 0 (0.0%) | 0 (0.0%) |
| 4 Vehicles | 0 (0.0%) | 0 (0.0%) |
| 5 or more Vehicles | 0 (0.0%) | 0 (0.0%) |
| Total | 13 (100.0%) | 23 (100.0%) |
Commute Time in Pelican
The most frequently occuring commute durations in Pelican are 10 to 14 minutes (9 commuters, 25.0%), 5 to 9 minutes (8 commuters, 22.2%), and 15 to 19 minutes (7 commuters, 19.4%).
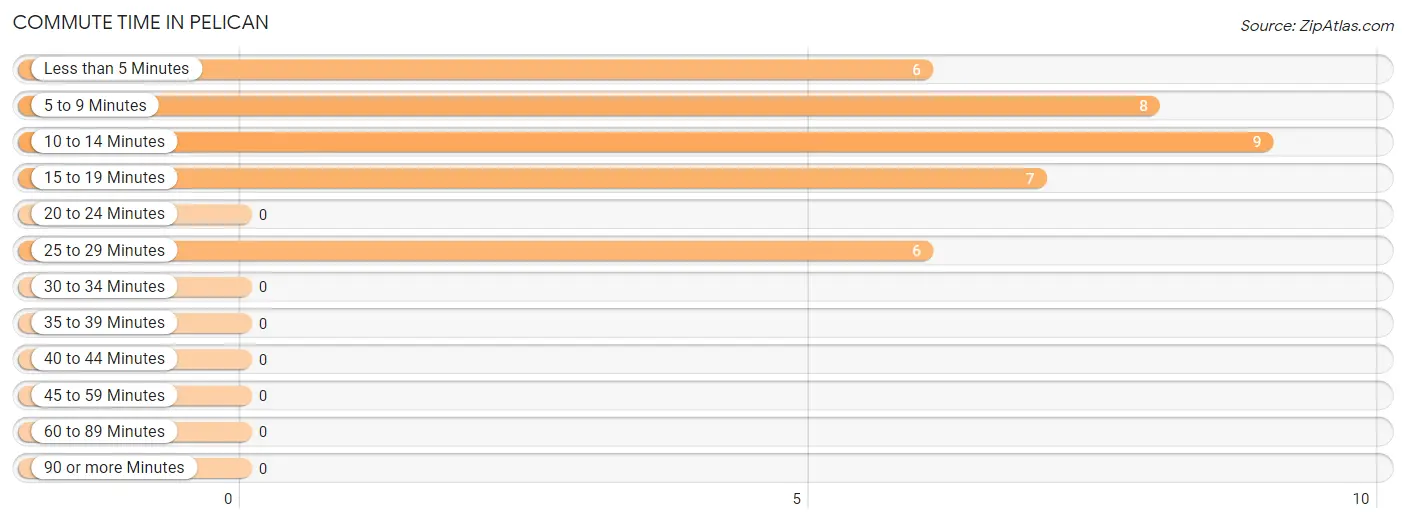
| Commute Time | # Commuters | % Commuters |
| Less than 5 Minutes | 6 | 16.7% |
| 5 to 9 Minutes | 8 | 22.2% |
| 10 to 14 Minutes | 9 | 25.0% |
| 15 to 19 Minutes | 7 | 19.4% |
| 20 to 24 Minutes | 0 | 0.0% |
| 25 to 29 Minutes | 6 | 16.7% |
| 30 to 34 Minutes | 0 | 0.0% |
| 35 to 39 Minutes | 0 | 0.0% |
| 40 to 44 Minutes | 0 | 0.0% |
| 45 to 59 Minutes | 0 | 0.0% |
| 60 to 89 Minutes | 0 | 0.0% |
| 90 or more Minutes | 0 | 0.0% |
Commute Time by Sex in Pelican
The most common commute times in Pelican are 15 to 19 minutes (7 commuters, 53.8%) for males and 5 to 9 minutes (8 commuters, 34.8%) for females.
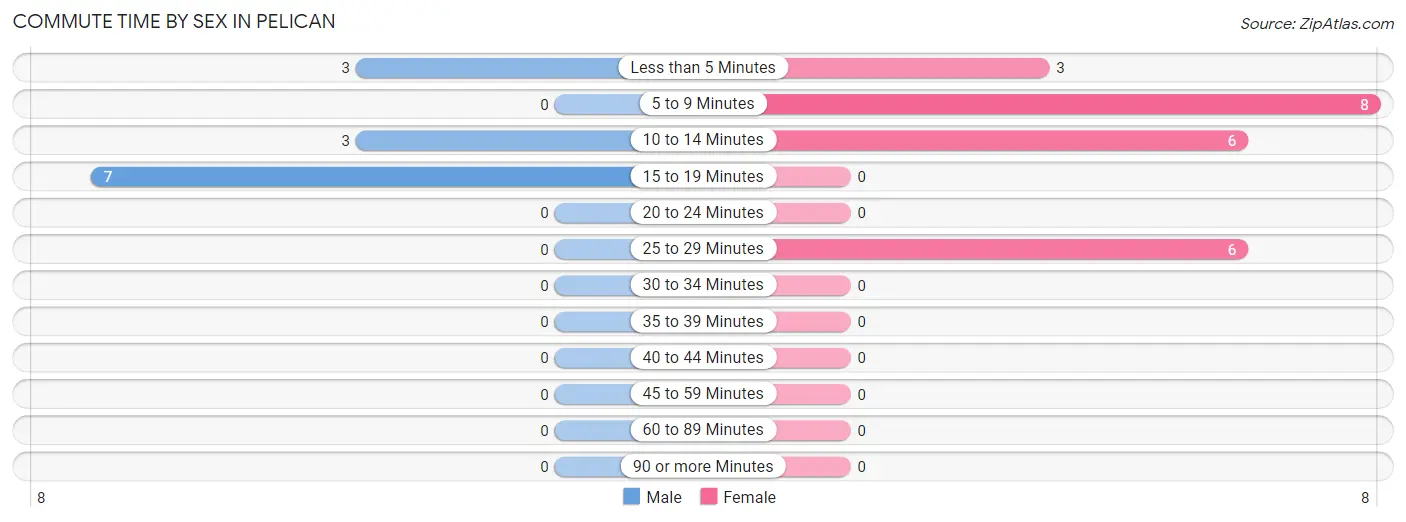
| Commute Time | Male | Female |
| Less than 5 Minutes | 3 (23.1%) | 3 (13.0%) |
| 5 to 9 Minutes | 0 (0.0%) | 8 (34.8%) |
| 10 to 14 Minutes | 3 (23.1%) | 6 (26.1%) |
| 15 to 19 Minutes | 7 (53.8%) | 0 (0.0%) |
| 20 to 24 Minutes | 0 (0.0%) | 0 (0.0%) |
| 25 to 29 Minutes | 0 (0.0%) | 6 (26.1%) |
| 30 to 34 Minutes | 0 (0.0%) | 0 (0.0%) |
| 35 to 39 Minutes | 0 (0.0%) | 0 (0.0%) |
| 40 to 44 Minutes | 0 (0.0%) | 0 (0.0%) |
| 45 to 59 Minutes | 0 (0.0%) | 0 (0.0%) |
| 60 to 89 Minutes | 0 (0.0%) | 0 (0.0%) |
| 90 or more Minutes | 0 (0.0%) | 0 (0.0%) |
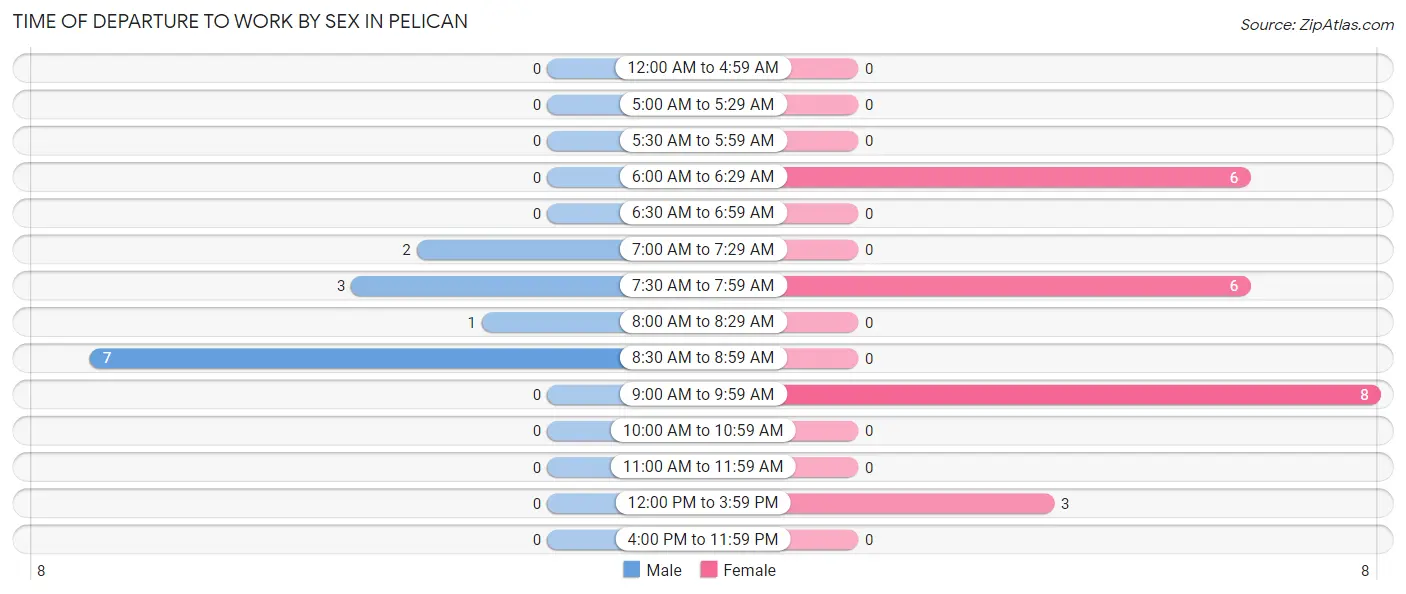
Time of Departure to Work by Sex in Pelican
The most frequent times of departure to work in Pelican are 8:30 AM to 8:59 AM (7, 53.8%) for males and 9:00 AM to 9:59 AM (8, 34.8%) for females.
| Time of Departure | Male | Female |
| 12:00 AM to 4:59 AM | 0 (0.0%) | 0 (0.0%) |
| 5:00 AM to 5:29 AM | 0 (0.0%) | 0 (0.0%) |
| 5:30 AM to 5:59 AM | 0 (0.0%) | 0 (0.0%) |
| 6:00 AM to 6:29 AM | 0 (0.0%) | 6 (26.1%) |
| 6:30 AM to 6:59 AM | 0 (0.0%) | 0 (0.0%) |
| 7:00 AM to 7:29 AM | 2 (15.4%) | 0 (0.0%) |
| 7:30 AM to 7:59 AM | 3 (23.1%) | 6 (26.1%) |
| 8:00 AM to 8:29 AM | 1 (7.7%) | 0 (0.0%) |
| 8:30 AM to 8:59 AM | 7 (53.8%) | 0 (0.0%) |
| 9:00 AM to 9:59 AM | 0 (0.0%) | 8 (34.8%) |
| 10:00 AM to 10:59 AM | 0 (0.0%) | 0 (0.0%) |
| 11:00 AM to 11:59 AM | 0 (0.0%) | 0 (0.0%) |
| 12:00 PM to 3:59 PM | 0 (0.0%) | 3 (13.0%) |
| 4:00 PM to 11:59 PM | 0 (0.0%) | 0 (0.0%) |
| Total | 13 (100.0%) | 23 (100.0%) |
Housing Occupancy in Pelican
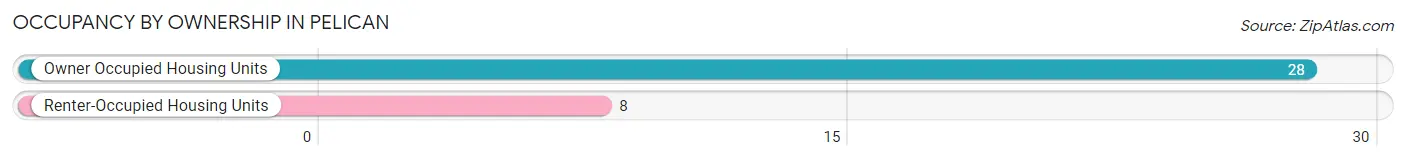
Occupancy by Ownership in Pelican
Of the total 36 dwellings in Pelican, owner-occupied units account for 28 (77.8%), while renter-occupied units make up 8 (22.2%).
| Occupancy | # Housing Units | % Housing Units |
| Owner Occupied Housing Units | 28 | 77.8% |
| Renter-Occupied Housing Units | 8 | 22.2% |
| Total Occupied Housing Units | 36 | 100.0% |
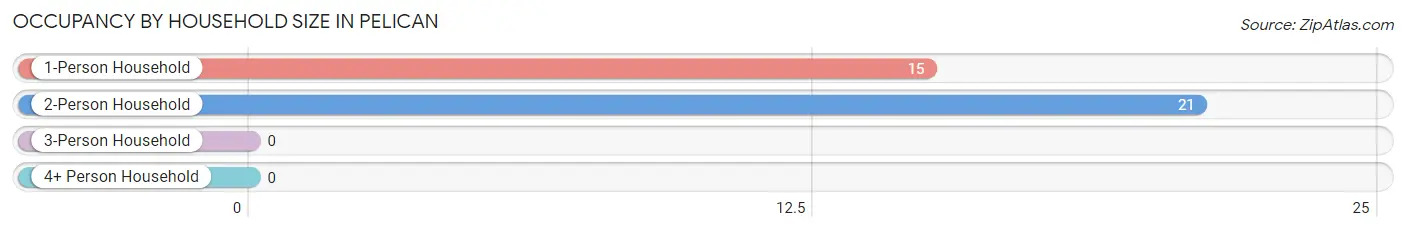
Occupancy by Household Size in Pelican
| Household Size | # Housing Units | % Housing Units |
| 1-Person Household | 15 | 41.7% |
| 2-Person Household | 21 | 58.3% |
| 3-Person Household | 0 | 0.0% |
| 4+ Person Household | 0 | 0.0% |
| Total Housing Units | 36 | 100.0% |
Occupancy by Ownership by Household Size in Pelican
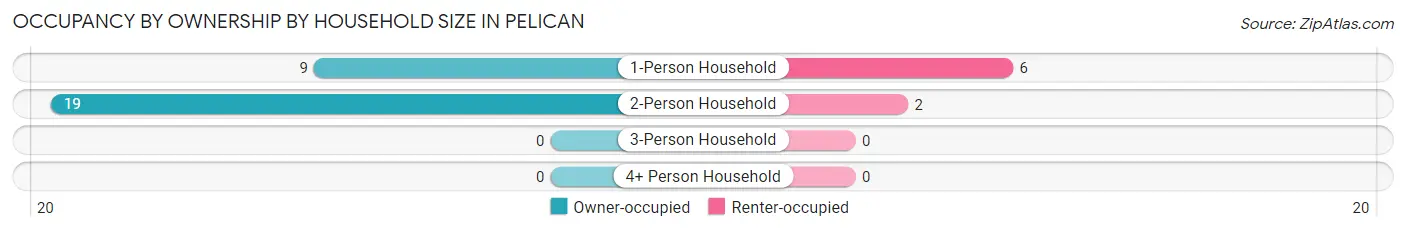
| Household Size | Owner-occupied | Renter-occupied |
| 1-Person Household | 9 (60.0%) | 6 (40.0%) |
| 2-Person Household | 19 (90.5%) | 2 (9.5%) |
| 3-Person Household | 0 (0.0%) | 0 (0.0%) |
| 4+ Person Household | 0 (0.0%) | 0 (0.0%) |
| Total Housing Units | 28 (77.8%) | 8 (22.2%) |
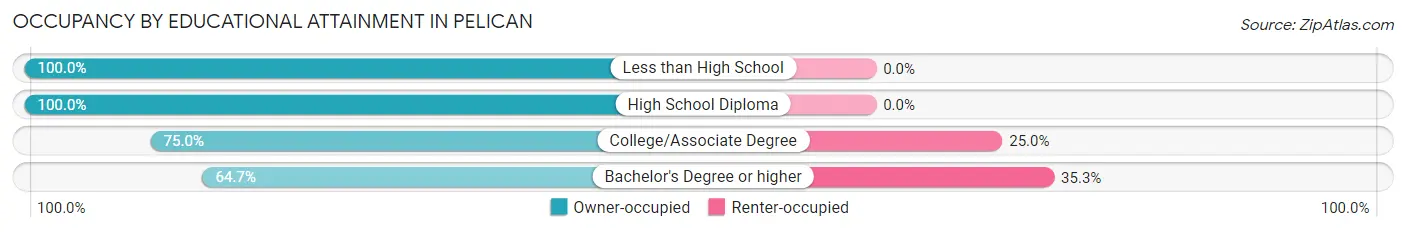
Occupancy by Educational Attainment in Pelican
| Household Size | Owner-occupied | Renter-occupied |
| Less than High School | 2 (100.0%) | 0 (0.0%) |
| High School Diploma | 9 (100.0%) | 0 (0.0%) |
| College/Associate Degree | 6 (75.0%) | 2 (25.0%) |
| Bachelor's Degree or higher | 11 (64.7%) | 6 (35.3%) |
Occupancy by Age of Householder in Pelican
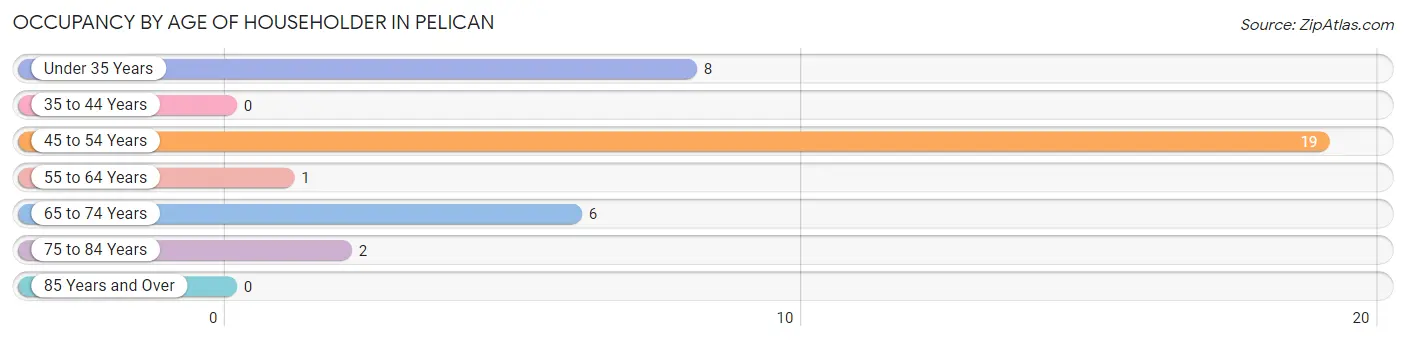
| Age Bracket | # Households | % Households |
| Under 35 Years | 8 | 22.2% |
| 35 to 44 Years | 0 | 0.0% |
| 45 to 54 Years | 19 | 52.8% |
| 55 to 64 Years | 1 | 2.8% |
| 65 to 74 Years | 6 | 16.7% |
| 75 to 84 Years | 2 | 5.6% |
| 85 Years and Over | 0 | 0.0% |
| Total | 36 | 100.0% |
Housing Finances in Pelican
Median Income by Occupancy in Pelican
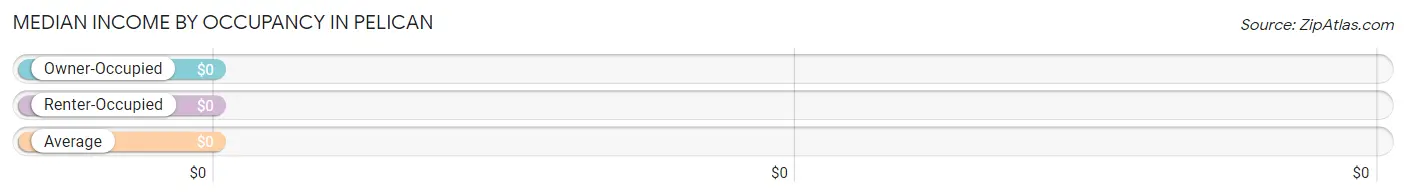
| Occupancy Type | # Households | Median Income |
| Owner-Occupied | 28 (77.8%) | $0 |
| Renter-Occupied | 8 (22.2%) | $0 |
| Average | 36 (100.0%) | $0 |
Occupancy by Householder Income Bracket in Pelican
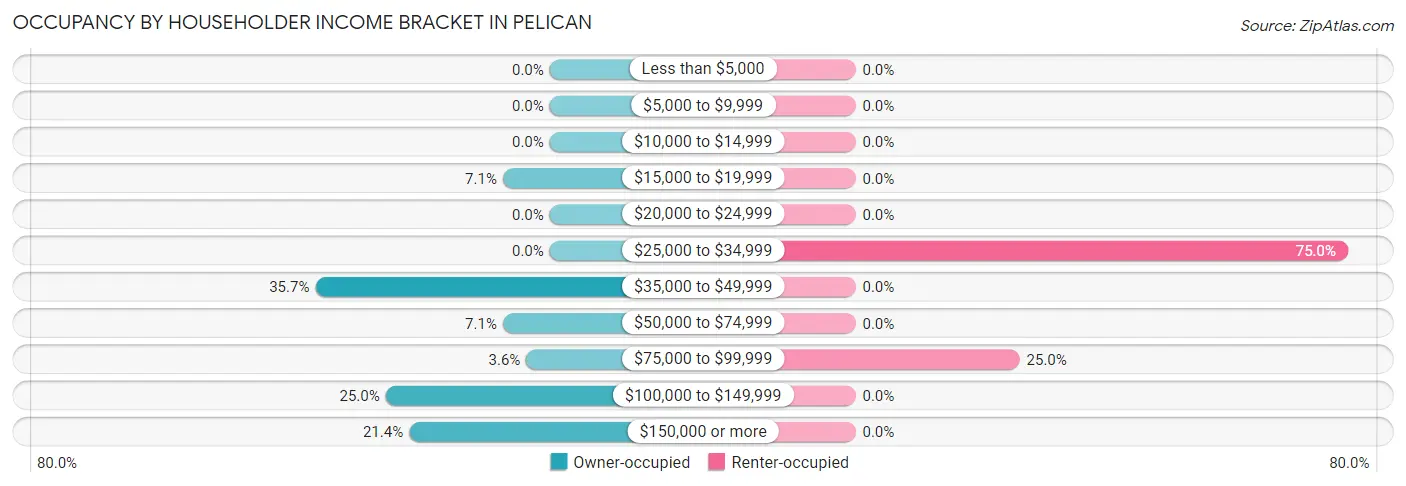
| Income Bracket | Owner-occupied | Renter-occupied |
| Less than $5,000 | 0 (0.0%) | 0 (0.0%) |
| $5,000 to $9,999 | 0 (0.0%) | 0 (0.0%) |
| $10,000 to $14,999 | 0 (0.0%) | 0 (0.0%) |
| $15,000 to $19,999 | 2 (7.1%) | 0 (0.0%) |
| $20,000 to $24,999 | 0 (0.0%) | 0 (0.0%) |
| $25,000 to $34,999 | 0 (0.0%) | 6 (75.0%) |
| $35,000 to $49,999 | 10 (35.7%) | 0 (0.0%) |
| $50,000 to $74,999 | 2 (7.1%) | 0 (0.0%) |
| $75,000 to $99,999 | 1 (3.6%) | 2 (25.0%) |
| $100,000 to $149,999 | 7 (25.0%) | 0 (0.0%) |
| $150,000 or more | 6 (21.4%) | 0 (0.0%) |
| Total | 28 (100.0%) | 8 (100.0%) |
Monthly Housing Cost Tiers in Pelican
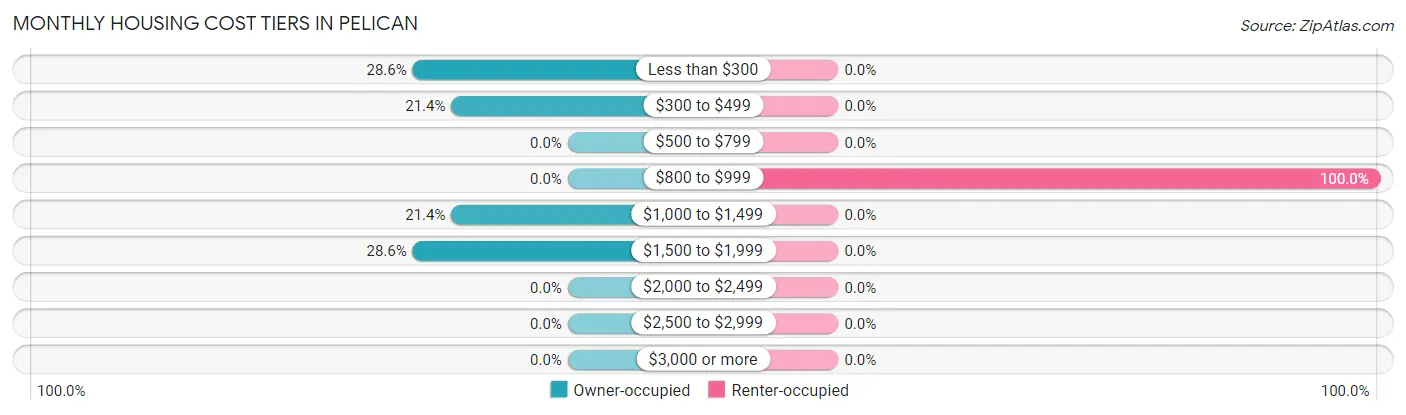
| Monthly Cost | Owner-occupied | Renter-occupied |
| Less than $300 | 8 (28.6%) | 0 (0.0%) |
| $300 to $499 | 6 (21.4%) | 0 (0.0%) |
| $500 to $799 | 0 (0.0%) | 0 (0.0%) |
| $800 to $999 | 0 (0.0%) | 8 (100.0%) |
| $1,000 to $1,499 | 6 (21.4%) | 0 (0.0%) |
| $1,500 to $1,999 | 8 (28.6%) | 0 (0.0%) |
| $2,000 to $2,499 | 0 (0.0%) | 0 (0.0%) |
| $2,500 to $2,999 | 0 (0.0%) | 0 (0.0%) |
| $3,000 or more | 0 (0.0%) | 0 (0.0%) |
| Total | 28 (100.0%) | 8 (100.0%) |
Physical Housing Characteristics in Pelican
Housing Structures in Pelican
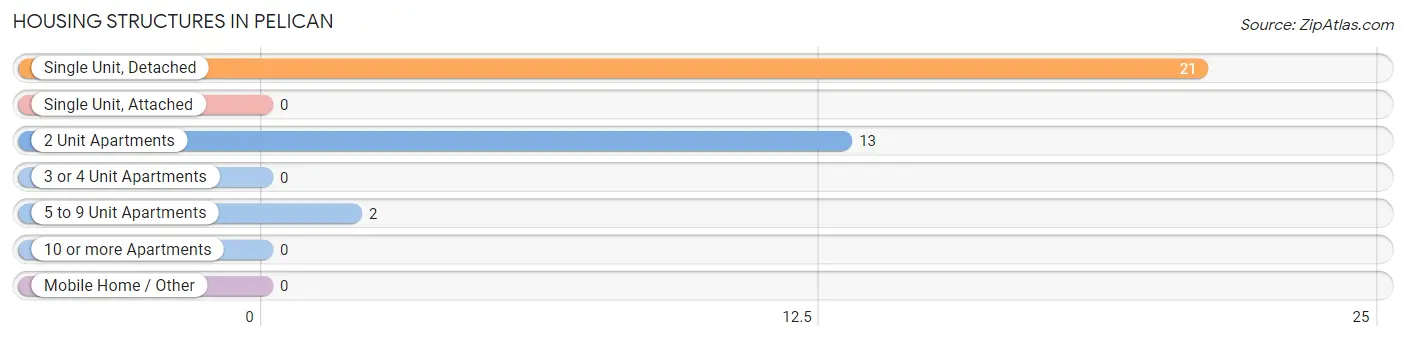
| Structure Type | # Housing Units | % Housing Units |
| Single Unit, Detached | 21 | 58.3% |
| Single Unit, Attached | 0 | 0.0% |
| 2 Unit Apartments | 13 | 36.1% |
| 3 or 4 Unit Apartments | 0 | 0.0% |
| 5 to 9 Unit Apartments | 2 | 5.6% |
| 10 or more Apartments | 0 | 0.0% |
| Mobile Home / Other | 0 | 0.0% |
| Total | 36 | 100.0% |
Housing Structures by Occupancy in Pelican
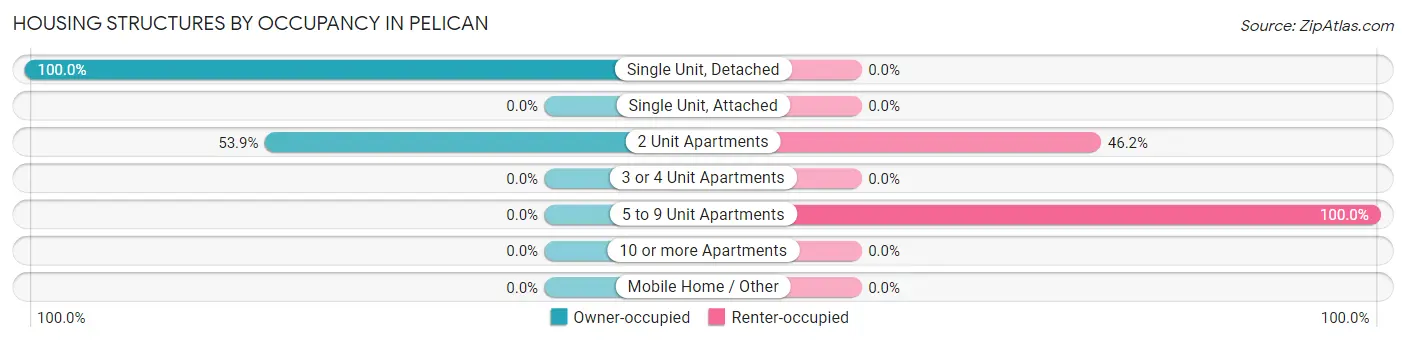
| Structure Type | Owner-occupied | Renter-occupied |
| Single Unit, Detached | 21 (100.0%) | 0 (0.0%) |
| Single Unit, Attached | 0 (0.0%) | 0 (0.0%) |
| 2 Unit Apartments | 7 (53.8%) | 6 (46.2%) |
| 3 or 4 Unit Apartments | 0 (0.0%) | 0 (0.0%) |
| 5 to 9 Unit Apartments | 0 (0.0%) | 2 (100.0%) |
| 10 or more Apartments | 0 (0.0%) | 0 (0.0%) |
| Mobile Home / Other | 0 (0.0%) | 0 (0.0%) |
| Total | 28 (77.8%) | 8 (22.2%) |
Housing Structures by Number of Rooms in Pelican
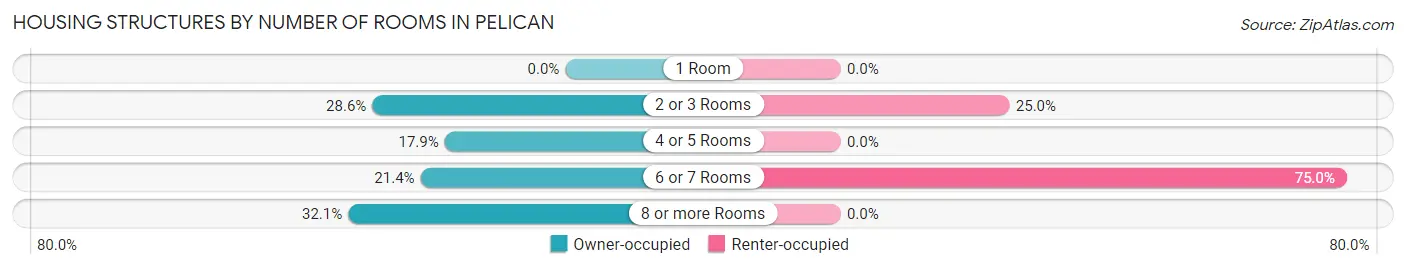
| Number of Rooms | Owner-occupied | Renter-occupied |
| 1 Room | 0 (0.0%) | 0 (0.0%) |
| 2 or 3 Rooms | 8 (28.6%) | 2 (25.0%) |
| 4 or 5 Rooms | 5 (17.9%) | 0 (0.0%) |
| 6 or 7 Rooms | 6 (21.4%) | 6 (75.0%) |
| 8 or more Rooms | 9 (32.1%) | 0 (0.0%) |
| Total | 28 (100.0%) | 8 (100.0%) |
Housing Structure by Heating Type in Pelican
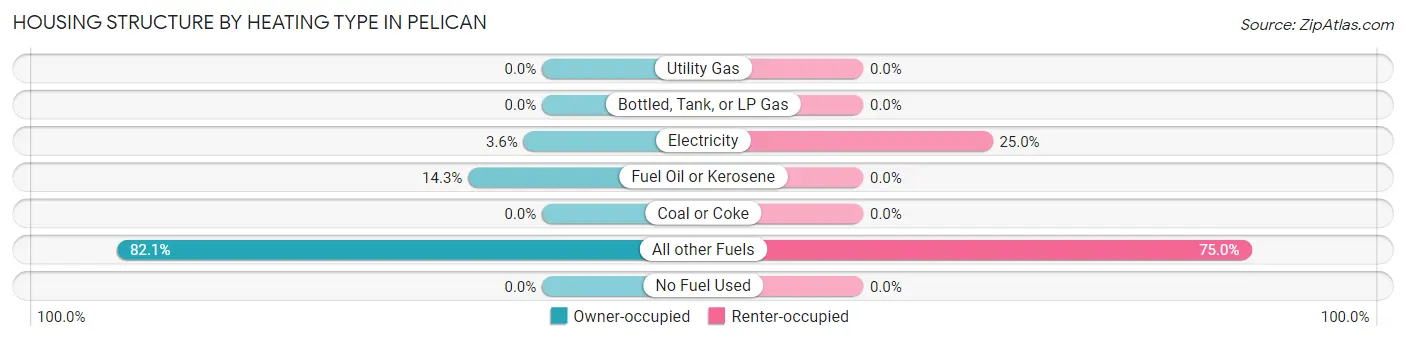
| Heating Type | Owner-occupied | Renter-occupied |
| Utility Gas | 0 (0.0%) | 0 (0.0%) |
| Bottled, Tank, or LP Gas | 0 (0.0%) | 0 (0.0%) |
| Electricity | 1 (3.6%) | 2 (25.0%) |
| Fuel Oil or Kerosene | 4 (14.3%) | 0 (0.0%) |
| Coal or Coke | 0 (0.0%) | 0 (0.0%) |
| All other Fuels | 23 (82.1%) | 6 (75.0%) |
| No Fuel Used | 0 (0.0%) | 0 (0.0%) |
| Total | 28 (100.0%) | 8 (100.0%) |
Household Vehicle Usage in Pelican
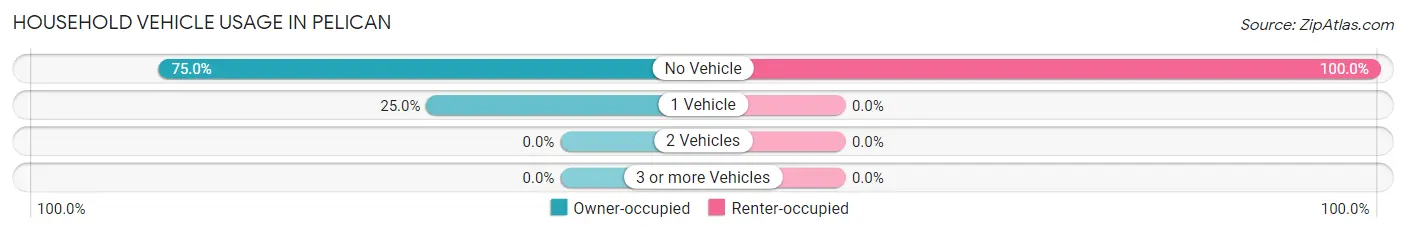
| Vehicles per Household | Owner-occupied | Renter-occupied |
| No Vehicle | 21 (75.0%) | 8 (100.0%) |
| 1 Vehicle | 7 (25.0%) | 0 (0.0%) |
| 2 Vehicles | 0 (0.0%) | 0 (0.0%) |
| 3 or more Vehicles | 0 (0.0%) | 0 (0.0%) |
| Total | 28 (100.0%) | 8 (100.0%) |
Real Estate & Mortgages in Pelican
Real Estate and Mortgage Overview in Pelican
| Characteristic | Without Mortgage | With Mortgage |
| Housing Units | 14 | 14 |
| Median Property Value | $104,200 | $0 |
| Median Household Income | - | - |
| Monthly Housing Costs | - | - |
| Real Estate Taxes | - | - |
Property Value by Mortgage Status in Pelican
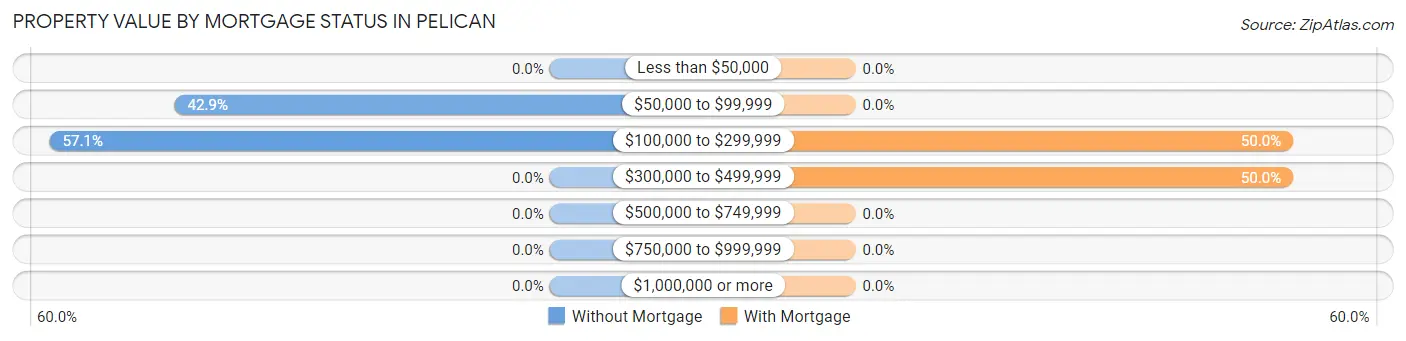
| Property Value | Without Mortgage | With Mortgage |
| Less than $50,000 | 0 (0.0%) | 0 (0.0%) |
| $50,000 to $99,999 | 6 (42.9%) | 0 (0.0%) |
| $100,000 to $299,999 | 8 (57.1%) | 7 (50.0%) |
| $300,000 to $499,999 | 0 (0.0%) | 7 (50.0%) |
| $500,000 to $749,999 | 0 (0.0%) | 0 (0.0%) |
| $750,000 to $999,999 | 0 (0.0%) | 0 (0.0%) |
| $1,000,000 or more | 0 (0.0%) | 0 (0.0%) |
| Total | 14 (100.0%) | 14 (100.0%) |
Household Income by Mortgage Status in Pelican
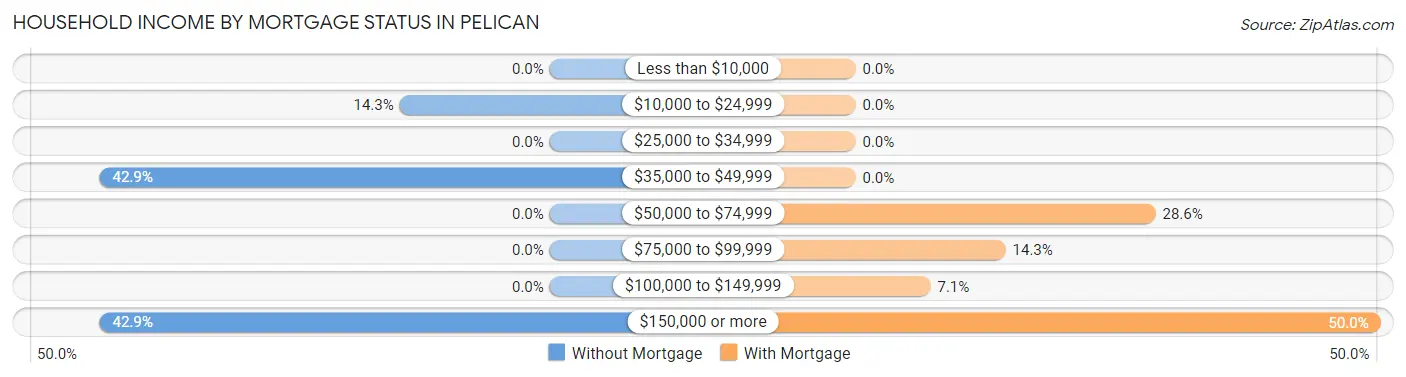
| Household Income | Without Mortgage | With Mortgage |
| Less than $10,000 | 0 (0.0%) | 0 (0.0%) |
| $10,000 to $24,999 | 2 (14.3%) | 0 (0.0%) |
| $25,000 to $34,999 | 0 (0.0%) | 0 (0.0%) |
| $35,000 to $49,999 | 6 (42.9%) | 0 (0.0%) |
| $50,000 to $74,999 | 0 (0.0%) | 4 (28.6%) |
| $75,000 to $99,999 | 0 (0.0%) | 2 (14.3%) |
| $100,000 to $149,999 | 0 (0.0%) | 1 (7.1%) |
| $150,000 or more | 6 (42.9%) | 7 (50.0%) |
| Total | 14 (100.0%) | 14 (100.0%) |
Property Value to Household Income Ratio in Pelican
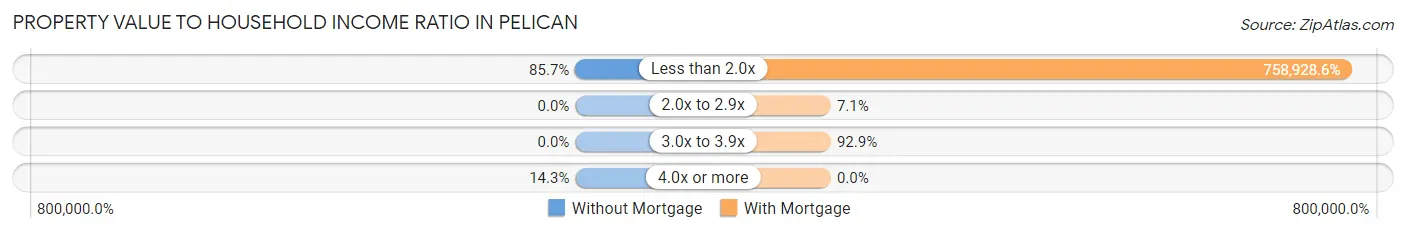
| Value-to-Income Ratio | Without Mortgage | With Mortgage |
| Less than 2.0x | 12 (85.7%) | 106,250 (758,928.6%) |
| 2.0x to 2.9x | 0 (0.0%) | 1 (7.1%) |
| 3.0x to 3.9x | 0 (0.0%) | 13 (92.9%) |
| 4.0x or more | 2 (14.3%) | 0 (0.0%) |
| Total | 14 (100.0%) | 14 (100.0%) |
Real Estate Taxes by Mortgage Status in Pelican
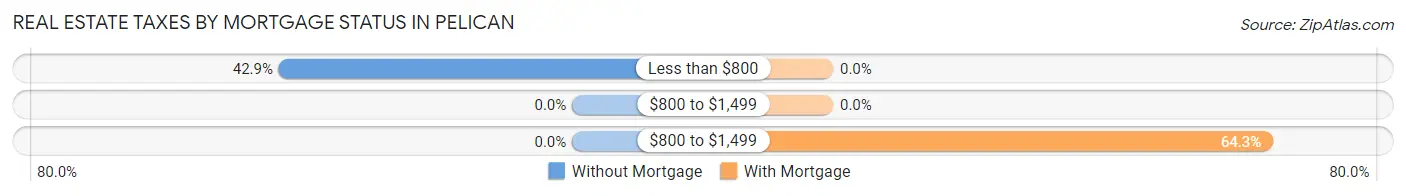
| Property Taxes | Without Mortgage | With Mortgage |
| Less than $800 | 6 (42.9%) | 0 (0.0%) |
| $800 to $1,499 | 0 (0.0%) | 0 (0.0%) |
| $800 to $1,499 | 0 (0.0%) | 9 (64.3%) |
| Total | 14 (100.0%) | 14 (100.0%) |
Health & Disability in Pelican
Health Insurance Coverage by Age in Pelican
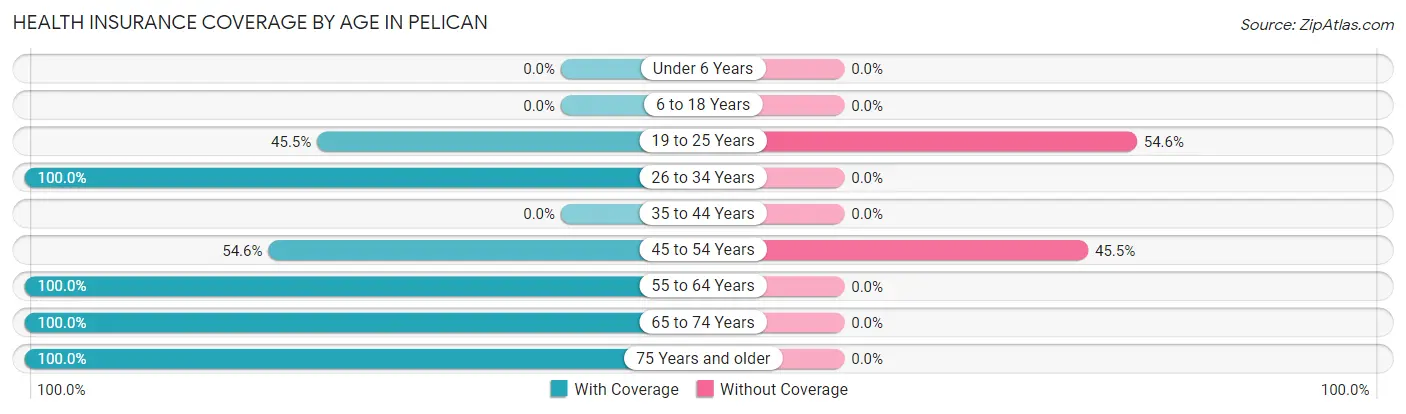
| Age Bracket | With Coverage | Without Coverage |
| Under 6 Years | 0 (0.0%) | 0 (0.0%) |
| 6 to 18 Years | 0 (0.0%) | 0 (0.0%) |
| 19 to 25 Years | 5 (45.5%) | 6 (54.5%) |
| 26 to 34 Years | 8 (100.0%) | 0 (0.0%) |
| 35 to 44 Years | 0 (0.0%) | 0 (0.0%) |
| 45 to 54 Years | 12 (54.5%) | 10 (45.5%) |
| 55 to 64 Years | 1 (100.0%) | 0 (0.0%) |
| 65 to 74 Years | 12 (100.0%) | 0 (0.0%) |
| 75 Years and older | 3 (100.0%) | 0 (0.0%) |
| Total | 41 (71.9%) | 16 (28.1%) |
Health Insurance Coverage by Citizenship Status in Pelican
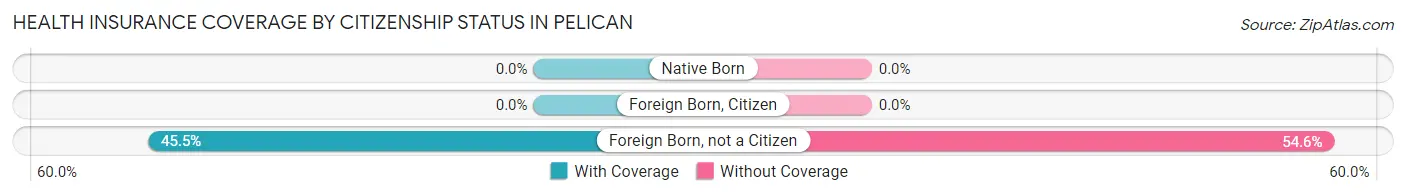
| Citizenship Status | With Coverage | Without Coverage |
| Native Born | 0 (0.0%) | 0 (0.0%) |
| Foreign Born, Citizen | 0 (0.0%) | 0 (0.0%) |
| Foreign Born, not a Citizen | 5 (45.5%) | 6 (54.5%) |
Health Insurance Coverage by Household Income in Pelican
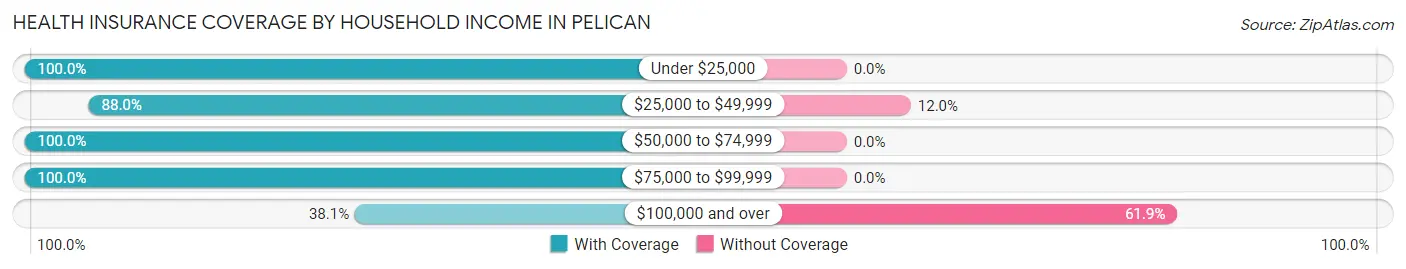
| Household Income | With Coverage | Without Coverage |
| Under $25,000 | 2 (100.0%) | 0 (0.0%) |
| $25,000 to $49,999 | 22 (88.0%) | 3 (12.0%) |
| $50,000 to $74,999 | 3 (100.0%) | 0 (0.0%) |
| $75,000 to $99,999 | 6 (100.0%) | 0 (0.0%) |
| $100,000 and over | 8 (38.1%) | 13 (61.9%) |
Public vs Private Health Insurance Coverage by Age in Pelican
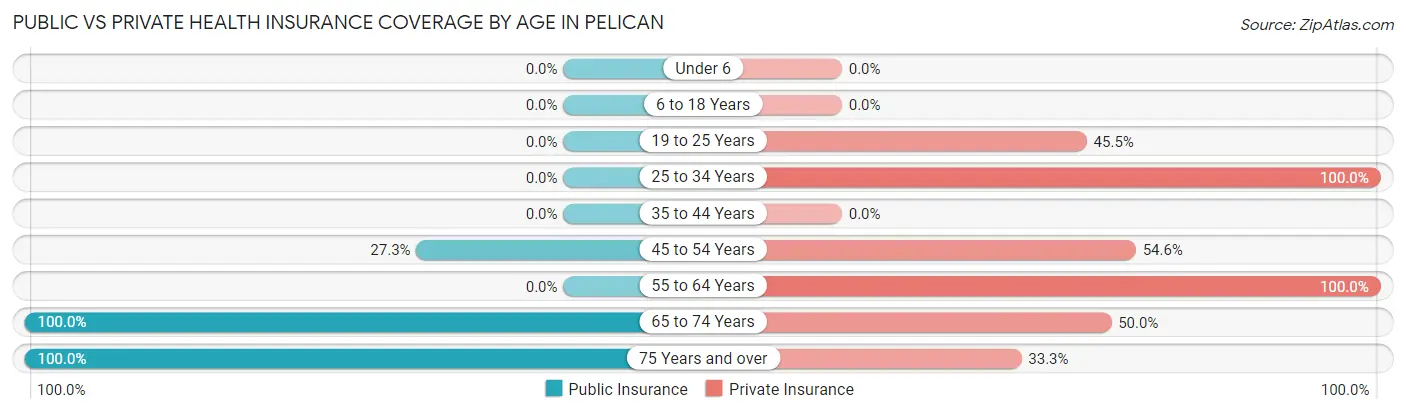
| Age Bracket | Public Insurance | Private Insurance |
| Under 6 | 0 (0.0%) | 0 (0.0%) |
| 6 to 18 Years | 0 (0.0%) | 0 (0.0%) |
| 19 to 25 Years | 0 (0.0%) | 5 (45.5%) |
| 25 to 34 Years | 0 (0.0%) | 8 (100.0%) |
| 35 to 44 Years | 0 (0.0%) | 0 (0.0%) |
| 45 to 54 Years | 6 (27.3%) | 12 (54.5%) |
| 55 to 64 Years | 0 (0.0%) | 1 (100.0%) |
| 65 to 74 Years | 12 (100.0%) | 6 (50.0%) |
| 75 Years and over | 3 (100.0%) | 1 (33.3%) |
| Total | 21 (36.8%) | 33 (57.9%) |
Disability Status by Sex by Age in Pelican
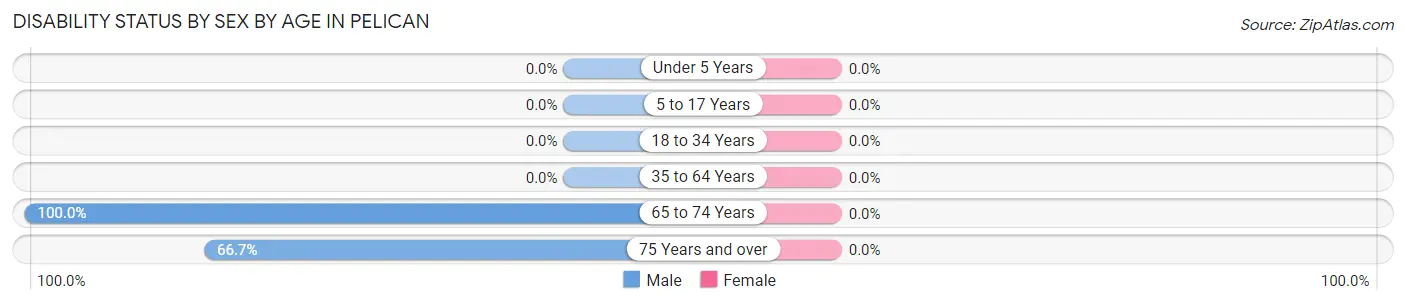
| Age Bracket | Male | Female |
| Under 5 Years | 0 (0.0%) | 0 (0.0%) |
| 5 to 17 Years | 0 (0.0%) | 0 (0.0%) |
| 18 to 34 Years | 0 (0.0%) | 0 (0.0%) |
| 35 to 64 Years | 0 (0.0%) | 0 (0.0%) |
| 65 to 74 Years | 6 (100.0%) | 0 (0.0%) |
| 75 Years and over | 2 (66.7%) | 0 (0.0%) |
Disability Class by Sex by Age in Pelican
Disability Class: Hearing Difficulty
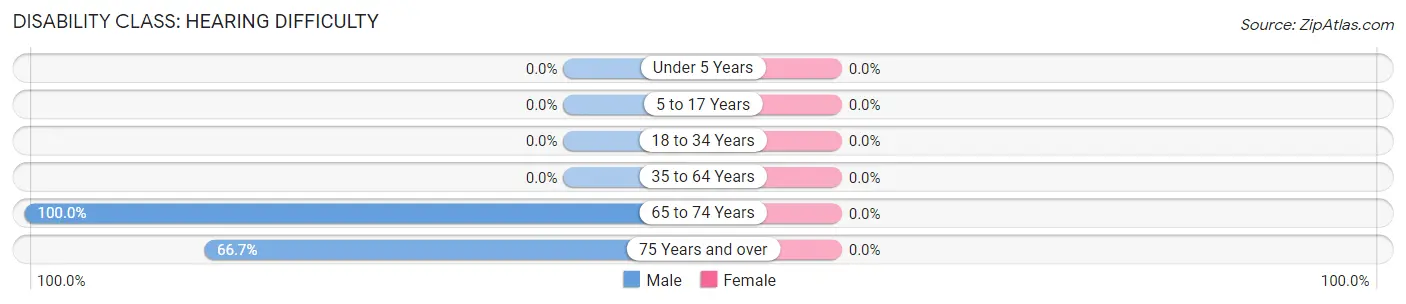
| Age Bracket | Male | Female |
| Under 5 Years | 0 (0.0%) | 0 (0.0%) |
| 5 to 17 Years | 0 (0.0%) | 0 (0.0%) |
| 18 to 34 Years | 0 (0.0%) | 0 (0.0%) |
| 35 to 64 Years | 0 (0.0%) | 0 (0.0%) |
| 65 to 74 Years | 6 (100.0%) | 0 (0.0%) |
| 75 Years and over | 2 (66.7%) | 0 (0.0%) |
Disability Class: Vision Difficulty
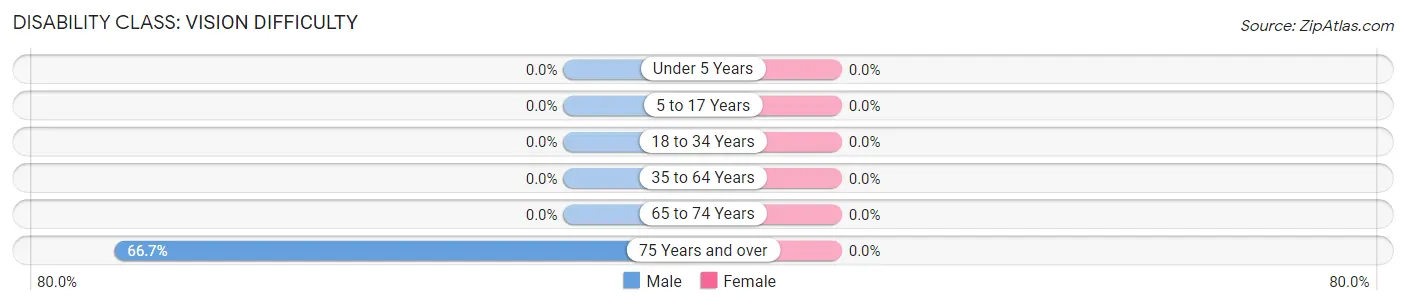
| Age Bracket | Male | Female |
| Under 5 Years | 0 (0.0%) | 0 (0.0%) |
| 5 to 17 Years | 0 (0.0%) | 0 (0.0%) |
| 18 to 34 Years | 0 (0.0%) | 0 (0.0%) |
| 35 to 64 Years | 0 (0.0%) | 0 (0.0%) |
| 65 to 74 Years | 0 (0.0%) | 0 (0.0%) |
| 75 Years and over | 2 (66.7%) | 0 (0.0%) |
Disability Class: Cognitive Difficulty
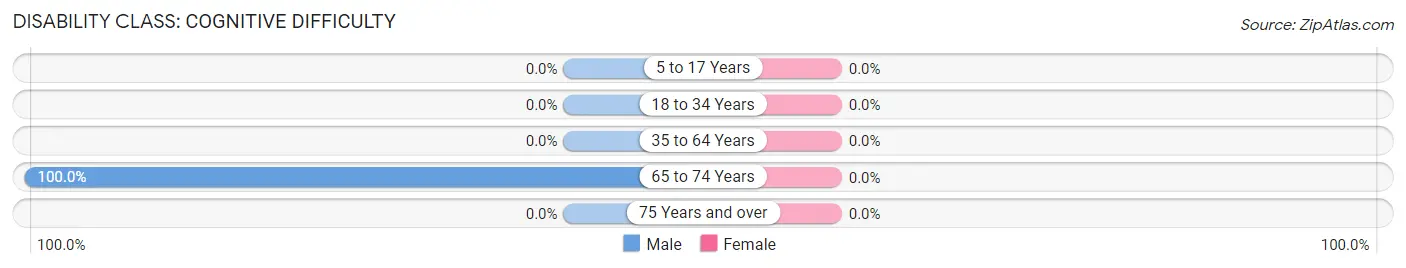
| Age Bracket | Male | Female |
| 5 to 17 Years | 0 (0.0%) | 0 (0.0%) |
| 18 to 34 Years | 0 (0.0%) | 0 (0.0%) |
| 35 to 64 Years | 0 (0.0%) | 0 (0.0%) |
| 65 to 74 Years | 6 (100.0%) | 0 (0.0%) |
| 75 Years and over | 0 (0.0%) | 0 (0.0%) |
Disability Class: Ambulatory Difficulty
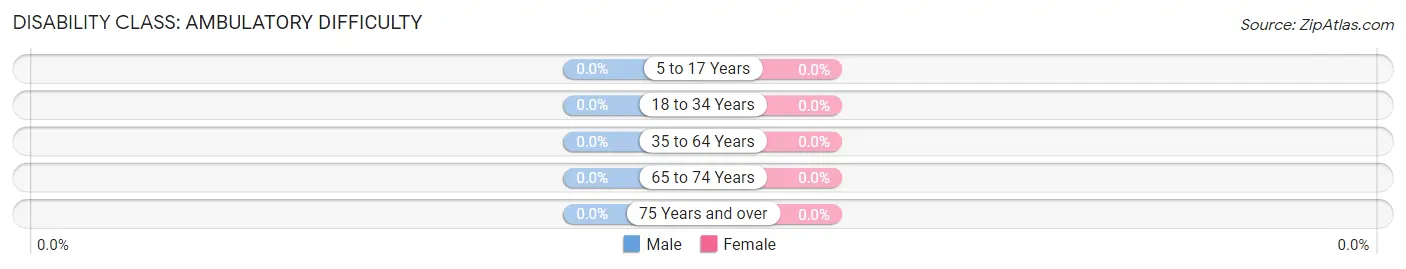
| Age Bracket | Male | Female |
| 5 to 17 Years | 0 (0.0%) | 0 (0.0%) |
| 18 to 34 Years | 0 (0.0%) | 0 (0.0%) |
| 35 to 64 Years | 0 (0.0%) | 0 (0.0%) |
| 65 to 74 Years | 0 (0.0%) | 0 (0.0%) |
| 75 Years and over | 0 (0.0%) | 0 (0.0%) |
Disability Class: Self-Care Difficulty
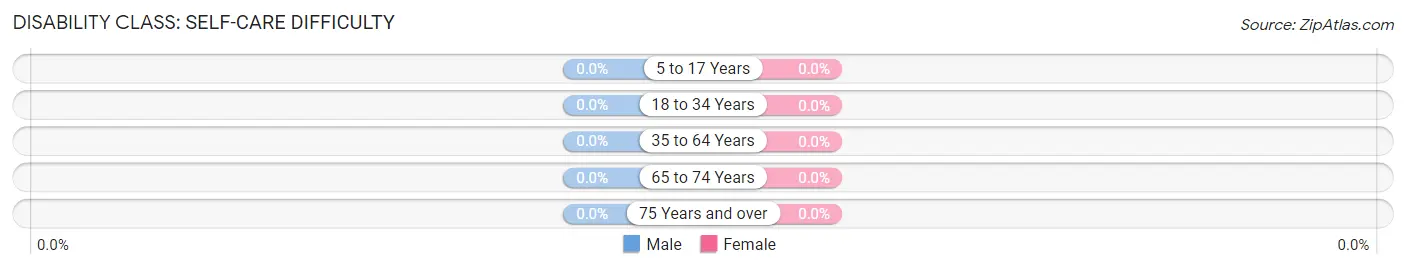
| Age Bracket | Male | Female |
| 5 to 17 Years | 0 (0.0%) | 0 (0.0%) |
| 18 to 34 Years | 0 (0.0%) | 0 (0.0%) |
| 35 to 64 Years | 0 (0.0%) | 0 (0.0%) |
| 65 to 74 Years | 0 (0.0%) | 0 (0.0%) |
| 75 Years and over | 0 (0.0%) | 0 (0.0%) |
Technology Access in Pelican
Computing Device Access in Pelican
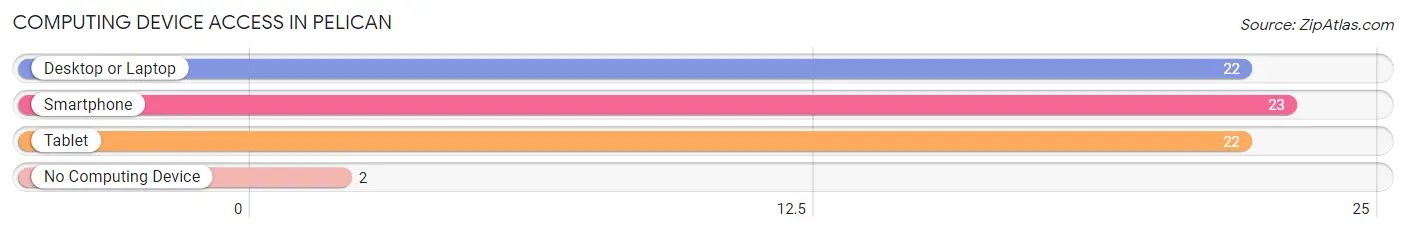
| Device Type | # Households | % Households |
| Desktop or Laptop | 22 | 61.1% |
| Smartphone | 23 | 63.9% |
| Tablet | 22 | 61.1% |
| No Computing Device | 2 | 5.6% |
| Total | 36 | 100.0% |
Internet Access in Pelican
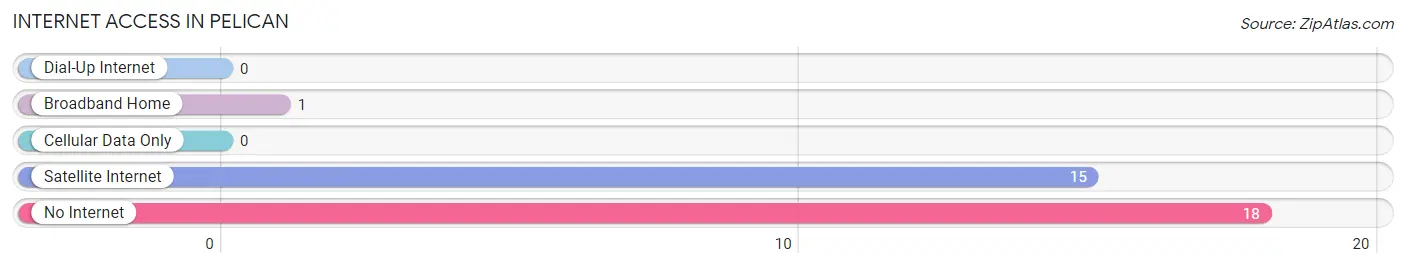
| Internet Type | # Households | % Households |
| Dial-Up Internet | 0 | 0.0% |
| Broadband Home | 1 | 2.8% |
| Cellular Data Only | 0 | 0.0% |
| Satellite Internet | 15 | 41.7% |
| No Internet | 18 | 50.0% |
| Total | 36 | 100.0% |
Pelican Summary
Pelican is a small city located in the southeastern part of Alaska, in the Chugach National Forest. It is situated on the northern shore of Chatham Strait, about 40 miles southwest of Juneau. The city has a population of about 250 people, and is the only incorporated city in the Chugach National Forest.
History
The area around Pelican has been inhabited by the Tlingit people for centuries. The first European settlers arrived in the area in the late 1800s, and the town was officially founded in 1902. The town was named after the pelicans that were common in the area.
In the early 1900s, the town was a major fishing center, and the main industry was salmon canning. The canneries provided employment for many of the town’s residents. In the 1950s, the canneries began to close, and the town’s economy shifted to logging and tourism.
In the 1970s, the town was designated as a National Historic District, and many of the buildings in the town were restored. In the 1980s, the town was designated as a National Historic Landmark.
Geography
Pelican is located in the Chugach National Forest, on the northern shore of Chatham Strait. The town is surrounded by mountains and forests, and is located about 40 miles southwest of Juneau. The town is accessible by boat or plane, and is a popular destination for tourists.
The climate in Pelican is mild and wet, with temperatures ranging from the mid-30s in the winter to the mid-60s in the summer. The town receives an average of about 80 inches of precipitation each year.
Economy
The economy of Pelican is largely based on tourism and fishing. The town is a popular destination for tourists, and there are several lodges and resorts in the area. Fishing is also an important part of the economy, and the town is home to several commercial fishing operations.
The town also has a small retail sector, with several stores and restaurants. The town is also home to a small airport, which provides air service to Juneau and other nearby towns.
Demographics
As of the 2010 census, the population of Pelican was 250 people. The racial makeup of the town was 95.2% White, 0.8% Native American, 0.4% Asian, 0.4% from other races, and 3.2% from two or more races.
The median household income in Pelican was $45,000, and the median family income was $50,000. The per capita income in the town was $20,000. About 10.4% of the population was below the poverty line.
Conclusion
Pelican is a small city located in the southeastern part of Alaska, in the Chugach National Forest. It has a population of about 250 people, and is the only incorporated city in the Chugach National Forest. The town has a long history, and was once a major fishing center. Today, the economy of Pelican is largely based on tourism and fishing. The town is a popular destination for tourists, and there are several lodges and resorts in the area. The racial makeup of the town is mostly White, with a small percentage of Native American and Asian residents. The median household income in Pelican is $45,000, and the per capita income is $20,000.
Common Questions
What is Per Capita Income in Pelican?
Per Capita income in Pelican is $50,277.
What is Inequality or Gini Index in Pelican?
Inequality or Gini Index in Pelican is 0.38.
What is the Total Population of Pelican?
Total Population of Pelican is 57.
What is the Total Male Population of Pelican?
Total Male Population of Pelican is 28.
What is the Total Female Population of Pelican?
Total Female Population of Pelican is 29.
What is the Ratio of Males per 100 Females in Pelican?
There are 96.55 Males per 100 Females in Pelican.
What is the Ratio of Females per 100 Males in Pelican?
There are 103.57 Females per 100 Males in Pelican.
What is the Median Population Age in Pelican?
Median Population Age in Pelican is 48.6 Years.
What is the Average Family Size in Pelican
Average Family Size in Pelican is 2.2 People.
What is the Average Household Size in Pelican
Average Household Size in Pelican is 1.6 People.
How Large is the Labor Force in Pelican?
There are 42 People in the Labor Forcein in Pelican.
What is the Percentage of People in the Labor Force in Pelican?
73.7% of People are in the Labor Force in Pelican.
What is the Unemployment Rate in Pelican?
Unemployment Rate in Pelican is 14.3%.