Thorne Bay, AK Map & Demographics
Thorne Bay Map
Thorne Bay Overview
$30,905
PER CAPITA INCOME
$83,333
AVG FAMILY INCOME
$63,365
AVG HOUSEHOLD INCOME
22.8%
WAGE / INCOME GAP [ % ]
77.2¢/ $1
WAGE / INCOME GAP [ $ ]
0.36
INEQUALITY / GINI INDEX
482
TOTAL POPULATION
249
MALE POPULATION
233
FEMALE POPULATION
106.87
MALES / 100 FEMALES
93.57
FEMALES / 100 MALES
53.4
MEDIAN AGE
2.4
AVG FAMILY SIZE
2.1
AVG HOUSEHOLD SIZE
225
LABOR FORCE [ PEOPLE ]
55.6%
PERCENT IN LABOR FORCE
2.2%
UNEMPLOYMENT RATE
Thorne Bay Zip Codes
Thorne Bay Area Codes
Income in Thorne Bay
Income Overview in Thorne Bay
Per Capita Income in Thorne Bay is $30,905, while median incomes of families and households are $83,333 and $63,365 respectively.
| Characteristic | Number | Measure |
| Per Capita Income | 482 | $30,905 |
| Median Family Income | 158 | $83,333 |
| Mean Family Income | 158 | $85,611 |
| Median Household Income | 227 | $63,365 |
| Mean Household Income | 227 | $72,528 |
| Income Deficit | 158 | $0 |
| Wage / Income Gap (%) | 482 | 22.84% |
| Wage / Income Gap ($) | 482 | 77.16¢ per $1 |
| Gini / Inequality Index | 482 | 0.36 |
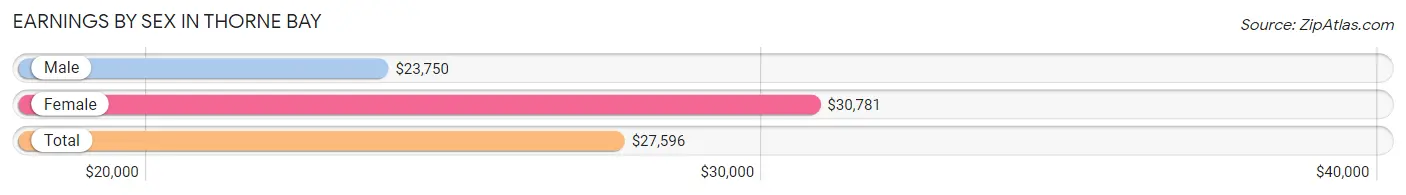
Earnings by Sex in Thorne Bay
Average Earnings in Thorne Bay are $27,596, $23,750 for men and $30,781 for women, a difference of 22.8%.
| Sex | Number | Average Earnings |
| Male | 174 (59.4%) | $23,750 |
| Female | 119 (40.6%) | $30,781 |
| Total | 293 (100.0%) | $27,596 |
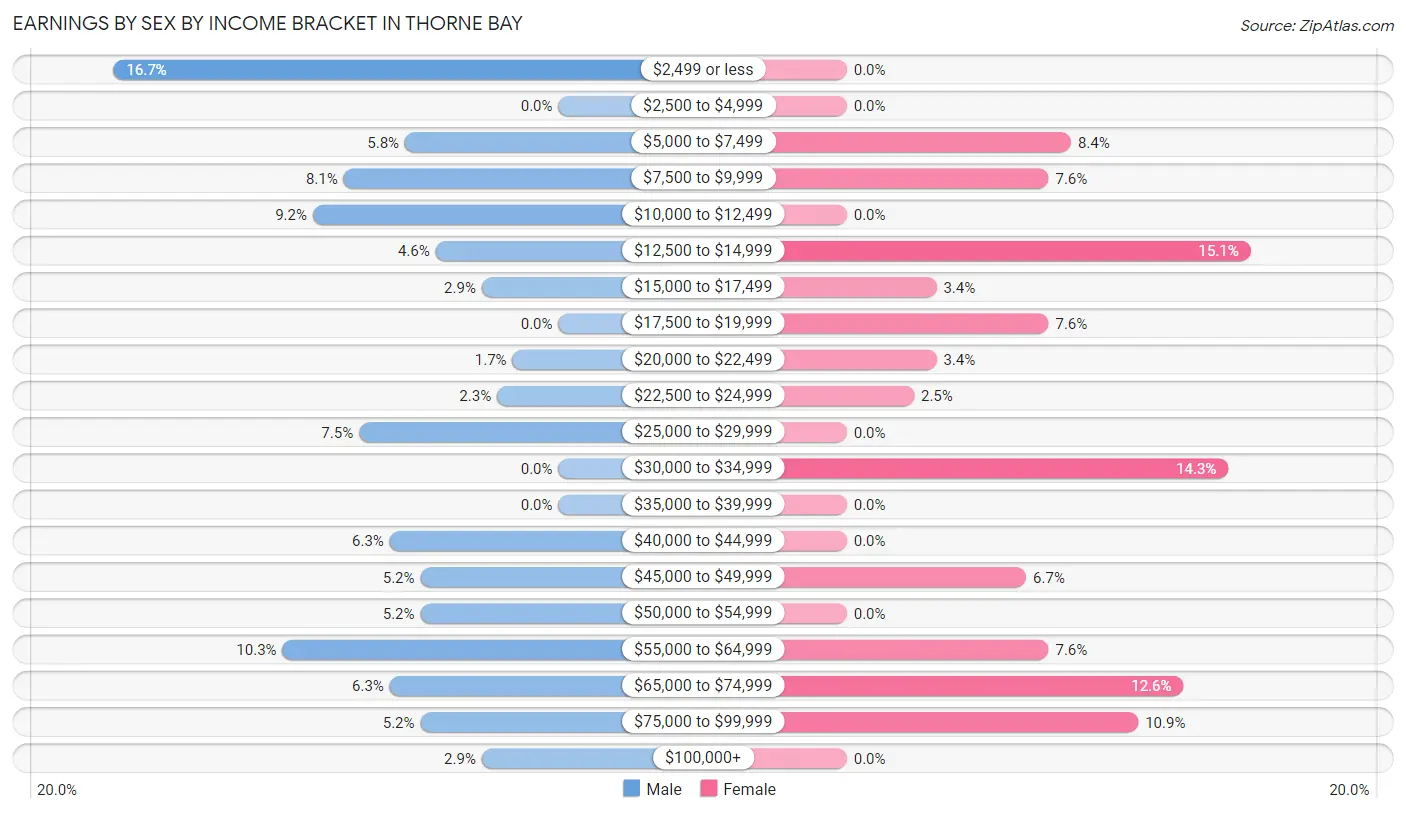
Earnings by Sex by Income Bracket in Thorne Bay
The most common earnings brackets in Thorne Bay are $2,499 or less for men (29 | 16.7%) and $12,500 to $14,999 for women (18 | 15.1%).
| Income | Male | Female |
| $2,499 or less | 29 (16.7%) | 0 (0.0%) |
| $2,500 to $4,999 | 0 (0.0%) | 0 (0.0%) |
| $5,000 to $7,499 | 10 (5.8%) | 10 (8.4%) |
| $7,500 to $9,999 | 14 (8.1%) | 9 (7.6%) |
| $10,000 to $12,499 | 16 (9.2%) | 0 (0.0%) |
| $12,500 to $14,999 | 8 (4.6%) | 18 (15.1%) |
| $15,000 to $17,499 | 5 (2.9%) | 4 (3.4%) |
| $17,500 to $19,999 | 0 (0.0%) | 9 (7.6%) |
| $20,000 to $22,499 | 3 (1.7%) | 4 (3.4%) |
| $22,500 to $24,999 | 4 (2.3%) | 3 (2.5%) |
| $25,000 to $29,999 | 13 (7.5%) | 0 (0.0%) |
| $30,000 to $34,999 | 0 (0.0%) | 17 (14.3%) |
| $35,000 to $39,999 | 0 (0.0%) | 0 (0.0%) |
| $40,000 to $44,999 | 11 (6.3%) | 0 (0.0%) |
| $45,000 to $49,999 | 9 (5.2%) | 8 (6.7%) |
| $50,000 to $54,999 | 9 (5.2%) | 0 (0.0%) |
| $55,000 to $64,999 | 18 (10.3%) | 9 (7.6%) |
| $65,000 to $74,999 | 11 (6.3%) | 15 (12.6%) |
| $75,000 to $99,999 | 9 (5.2%) | 13 (10.9%) |
| $100,000+ | 5 (2.9%) | 0 (0.0%) |
| Total | 174 (100.0%) | 119 (100.0%) |
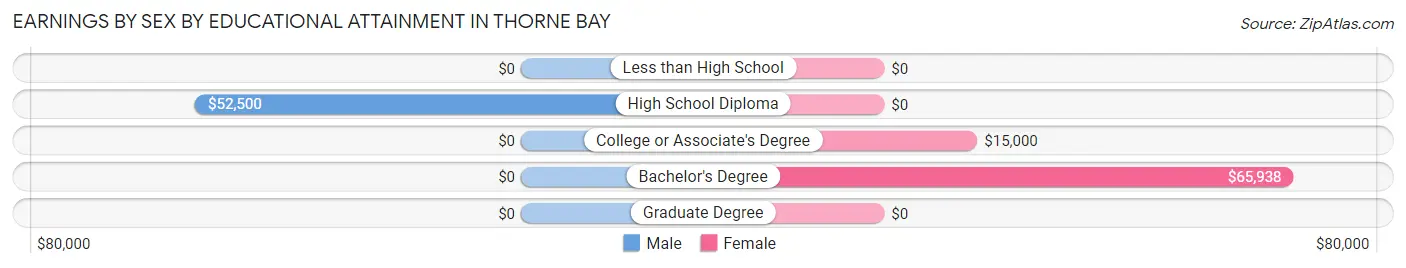
Earnings by Sex by Educational Attainment in Thorne Bay
Average earnings in Thorne Bay are $41,477 for men and $31,250 for women, a difference of 24.7%. Men with an educational attainment of high school diploma enjoy the highest average annual earnings of $52,500, while those with high school diploma education earn the least with $52,500. Women with an educational attainment of bachelor's degree earn the most with the average annual earnings of $65,938, while those with college or associate's degree education have the smallest earnings of $15,000.
| Educational Attainment | Male Income | Female Income |
| Less than High School | - | - |
| High School Diploma | $52,500 | $0 |
| College or Associate's Degree | - | - |
| Bachelor's Degree | - | - |
| Graduate Degree | - | - |
| Total | $41,477 | $31,250 |
Family Income in Thorne Bay
Family Income Brackets in Thorne Bay
According to the Thorne Bay family income data, there are 37 families falling into the $75,000 to $99,999 income range, which is the most common income bracket and makes up 23.4% of all families.
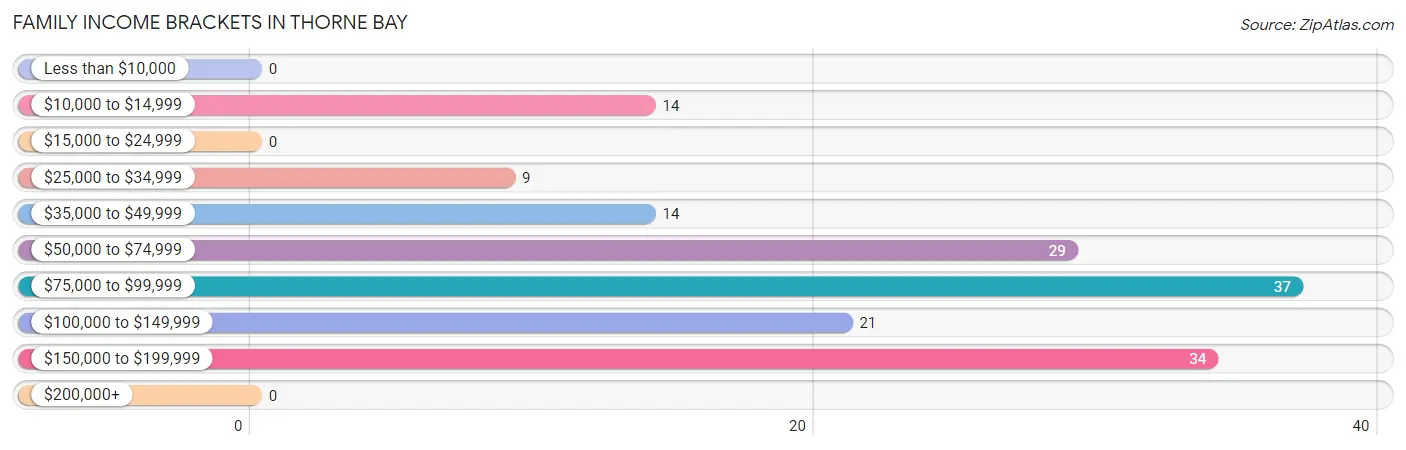
| Income Bracket | # Families | % Families |
| Less than $10,000 | 0 | 0.0% |
| $10,000 to $14,999 | 14 | 8.9% |
| $15,000 to $24,999 | 0 | 0.0% |
| $25,000 to $34,999 | 9 | 5.7% |
| $35,000 to $49,999 | 14 | 8.9% |
| $50,000 to $74,999 | 29 | 18.4% |
| $75,000 to $99,999 | 37 | 23.4% |
| $100,000 to $149,999 | 21 | 13.3% |
| $150,000 to $199,999 | 34 | 21.5% |
| $200,000+ | 0 | 0.0% |
Family Income by Famaliy Size in Thorne Bay
5-person families (17 | 10.8%) account for the highest median family income in Thorne Bay with $118,250 per family, while 3-person families (16 | 10.1%) have the highest median income of $31,389 per family member.
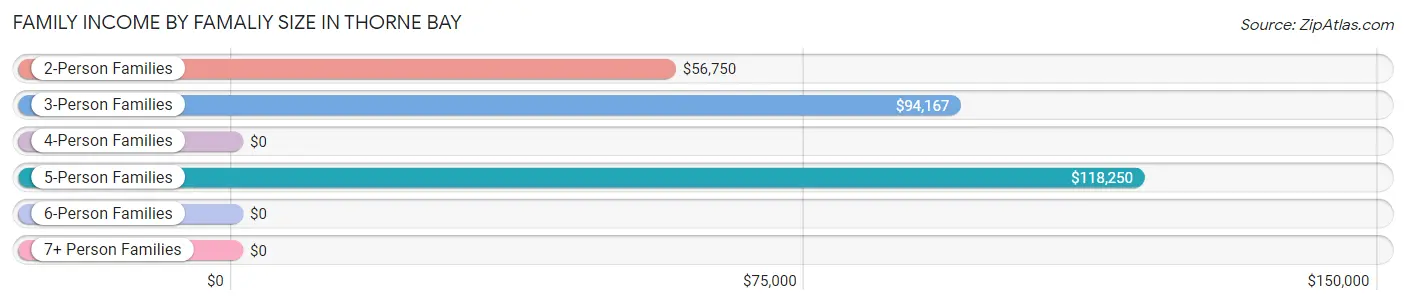
| Income Bracket | # Families | Median Income |
| 2-Person Families | 113 (71.5%) | $56,750 |
| 3-Person Families | 16 (10.1%) | $94,167 |
| 4-Person Families | 8 (5.1%) | $0 |
| 5-Person Families | 17 (10.8%) | $118,250 |
| 6-Person Families | 0 (0.0%) | $0 |
| 7+ Person Families | 4 (2.5%) | $0 |
| Total | 158 (100.0%) | $83,333 |
Family Income by Number of Earners in Thorne Bay
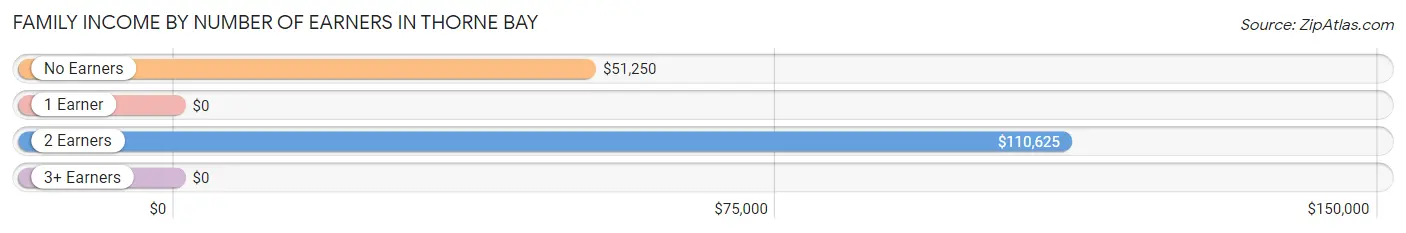
| Number of Earners | # Families | Median Income |
| No Earners | 33 (20.9%) | $51,250 |
| 1 Earner | 35 (22.2%) | $0 |
| 2 Earners | 77 (48.7%) | $110,625 |
| 3+ Earners | 13 (8.2%) | $0 |
| Total | 158 (100.0%) | $83,333 |
Household Income in Thorne Bay
Household Income Brackets in Thorne Bay
With 54 households falling in the category, the $50,000 to $74,999 income range is the most frequent in Thorne Bay, accounting for 23.8% of all households.
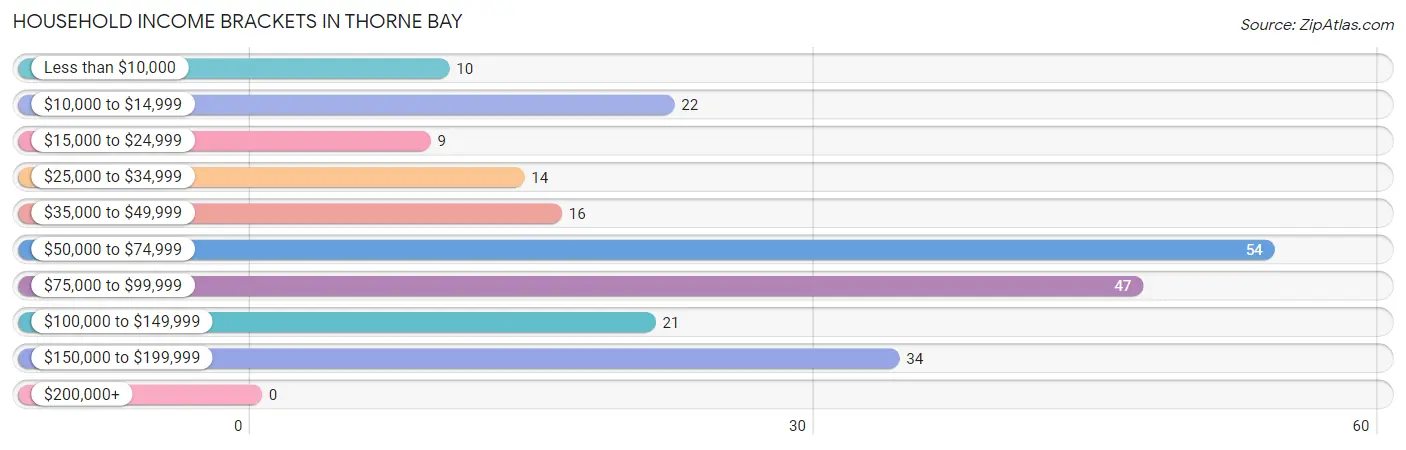
| Income Bracket | # Households | % Households |
| Less than $10,000 | 10 | 4.4% |
| $10,000 to $14,999 | 22 | 9.7% |
| $15,000 to $24,999 | 9 | 4.0% |
| $25,000 to $34,999 | 14 | 6.2% |
| $35,000 to $49,999 | 16 | 7.0% |
| $50,000 to $74,999 | 54 | 23.8% |
| $75,000 to $99,999 | 47 | 20.7% |
| $100,000 to $149,999 | 21 | 9.3% |
| $150,000 to $199,999 | 34 | 15.0% |
| $200,000+ | 0 | 0.0% |
Household Income by Householder Age in Thorne Bay
The median household income in Thorne Bay is $63,365, with the highest median household income of $91,250 found in the 45 to 64 years age bracket for the primary householder. A total of 127 households (55.9%) fall into this category. Meanwhile, the 65+ years age bracket for the primary householder has the lowest median household income of $51,319, with 59 households (26.0%) in this group.
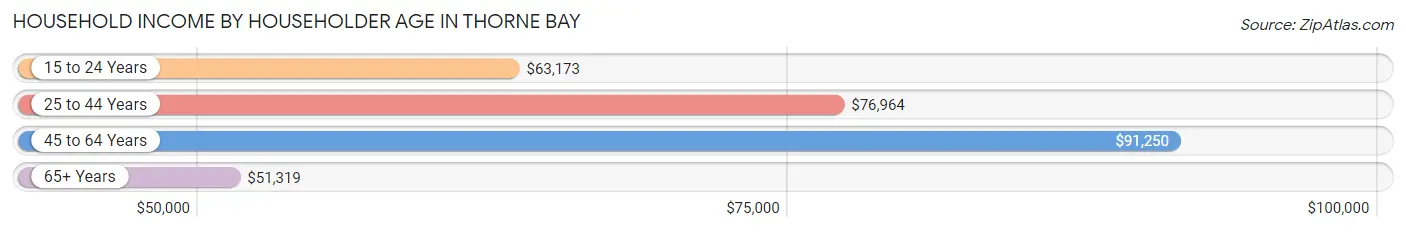
| Income Bracket | # Households | Median Income |
| 15 to 24 Years | 19 (8.4%) | $63,173 |
| 25 to 44 Years | 22 (9.7%) | $76,964 |
| 45 to 64 Years | 127 (55.9%) | $91,250 |
| 65+ Years | 59 (26.0%) | $51,319 |
| Total | 227 (100.0%) | $63,365 |
Poverty in Thorne Bay
Income Below Poverty by Sex and Age in Thorne Bay
With 11.7% poverty level for males and 3.1% for females among the residents of Thorne Bay, 55 to 64 year old males and 12 to 14 year old females are the most vulnerable to poverty, with 24 males (38.7%) and 2 females (20.0%) in their respective age groups living below the poverty level.
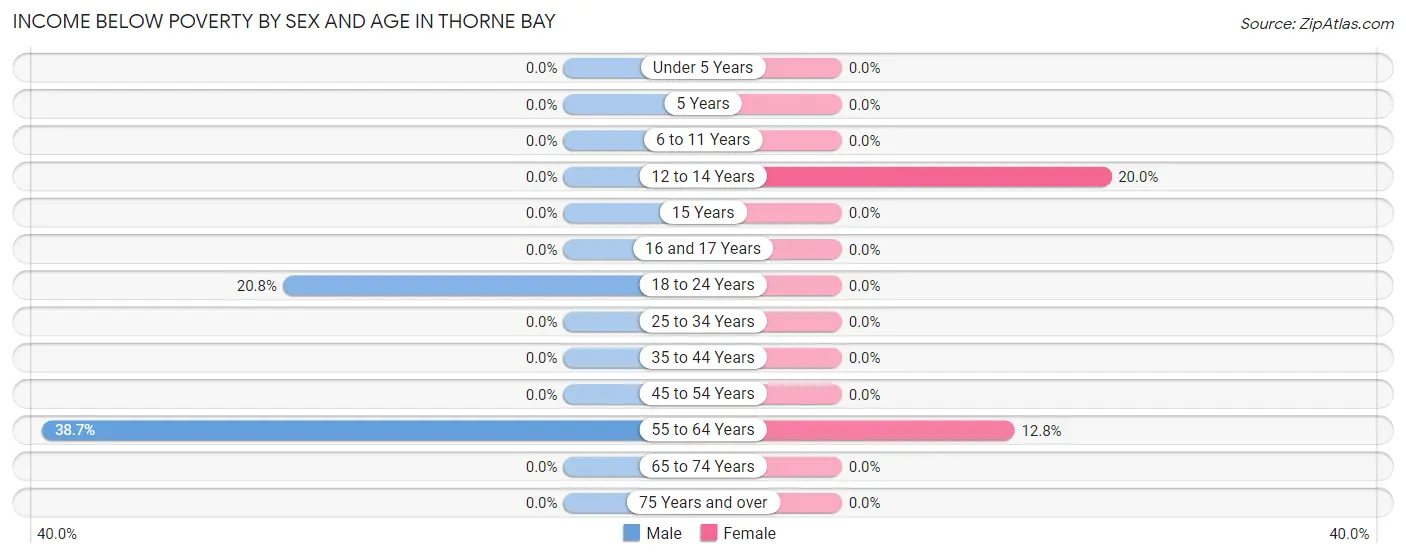
| Age Bracket | Male | Female |
| Under 5 Years | 0 (0.0%) | 0 (0.0%) |
| 5 Years | 0 (0.0%) | 0 (0.0%) |
| 6 to 11 Years | 0 (0.0%) | 0 (0.0%) |
| 12 to 14 Years | 0 (0.0%) | 2 (20.0%) |
| 15 Years | 0 (0.0%) | 0 (0.0%) |
| 16 and 17 Years | 0 (0.0%) | 0 (0.0%) |
| 18 to 24 Years | 5 (20.8%) | 0 (0.0%) |
| 25 to 34 Years | 0 (0.0%) | 0 (0.0%) |
| 35 to 44 Years | 0 (0.0%) | 0 (0.0%) |
| 45 to 54 Years | 0 (0.0%) | 0 (0.0%) |
| 55 to 64 Years | 24 (38.7%) | 5 (12.8%) |
| 65 to 74 Years | 0 (0.0%) | 0 (0.0%) |
| 75 Years and over | 0 (0.0%) | 0 (0.0%) |
| Total | 29 (11.7%) | 7 (3.1%) |
Income Above Poverty by Sex and Age in Thorne Bay
According to the poverty statistics in Thorne Bay, males aged under 5 years and females aged under 5 years are the age groups that are most secure financially, with 100.0% of males and 100.0% of females in these age groups living above the poverty line.
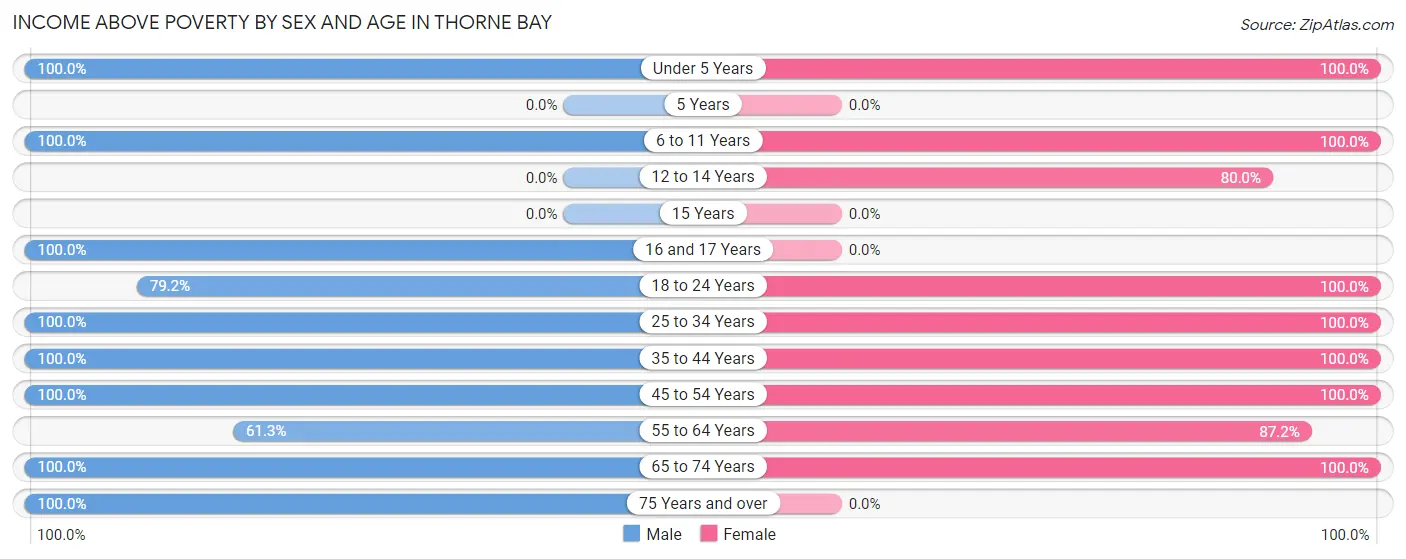
| Age Bracket | Male | Female |
| Under 5 Years | 4 (100.0%) | 26 (100.0%) |
| 5 Years | 0 (0.0%) | 0 (0.0%) |
| 6 to 11 Years | 12 (100.0%) | 16 (100.0%) |
| 12 to 14 Years | 0 (0.0%) | 8 (80.0%) |
| 15 Years | 0 (0.0%) | 0 (0.0%) |
| 16 and 17 Years | 19 (100.0%) | 0 (0.0%) |
| 18 to 24 Years | 19 (79.2%) | 25 (100.0%) |
| 25 to 34 Years | 19 (100.0%) | 16 (100.0%) |
| 35 to 44 Years | 3 (100.0%) | 5 (100.0%) |
| 45 to 54 Years | 53 (100.0%) | 33 (100.0%) |
| 55 to 64 Years | 38 (61.3%) | 34 (87.2%) |
| 65 to 74 Years | 50 (100.0%) | 54 (100.0%) |
| 75 Years and over | 3 (100.0%) | 0 (0.0%) |
| Total | 220 (88.3%) | 217 (96.9%) |
Income Below Poverty Among Married-Couple Families in Thorne Bay
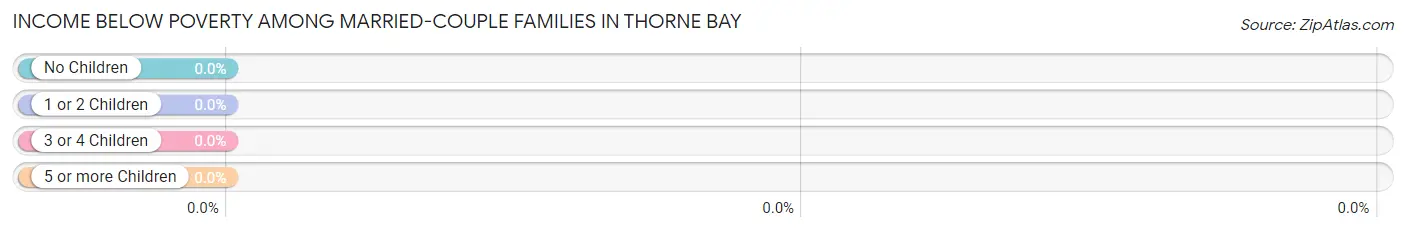
| Children | Above Poverty | Below Poverty |
| No Children | 97 (100.0%) | 0 (0.0%) |
| 1 or 2 Children | 25 (100.0%) | 0 (0.0%) |
| 3 or 4 Children | 16 (100.0%) | 0 (0.0%) |
| 5 or more Children | 0 (0.0%) | 0 (0.0%) |
| Total | 138 (100.0%) | 0 (0.0%) |
Income Below Poverty Among Single-Parent Households in Thorne Bay
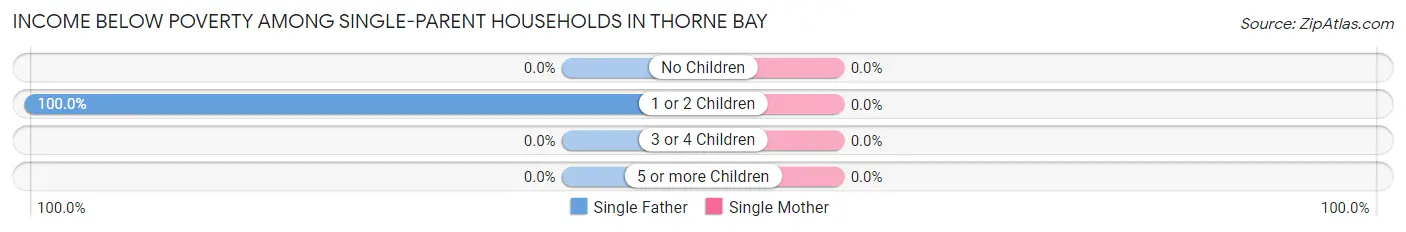
| Children | Single Father | Single Mother |
| No Children | 0 (0.0%) | 0 (0.0%) |
| 1 or 2 Children | 14 (100.0%) | 0 (0.0%) |
| 3 or 4 Children | 0 (0.0%) | 0 (0.0%) |
| 5 or more Children | 0 (0.0%) | 0 (0.0%) |
| Total | 14 (100.0%) | 0 (0.0%) |
Income Below Poverty Among Married-Couple vs Single-Parent Households in Thorne Bay
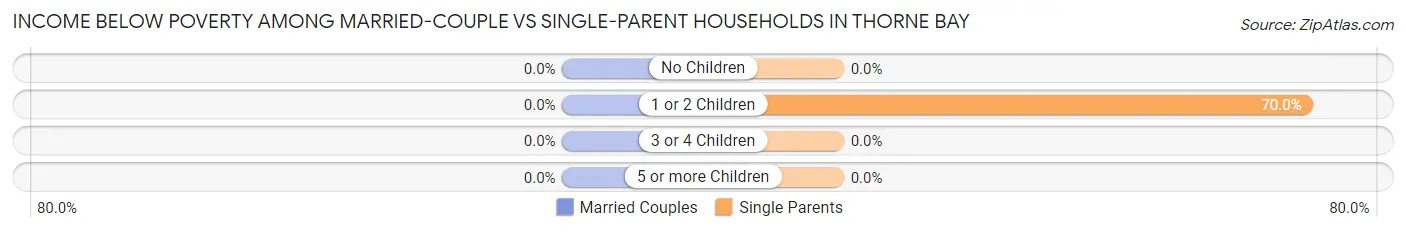
| Children | Married-Couple Families | Single-Parent Households |
| No Children | 0 (0.0%) | 0 (0.0%) |
| 1 or 2 Children | 0 (0.0%) | 14 (70.0%) |
| 3 or 4 Children | 0 (0.0%) | 0 (0.0%) |
| 5 or more Children | 0 (0.0%) | 0 (0.0%) |
| Total | 0 (0.0%) | 14 (70.0%) |
Race in Thorne Bay
The most populous races in Thorne Bay are White / Caucasian (441 | 91.5%), Hispanic or Latino (32 | 6.6%), and Two or more Races (32 | 6.6%).
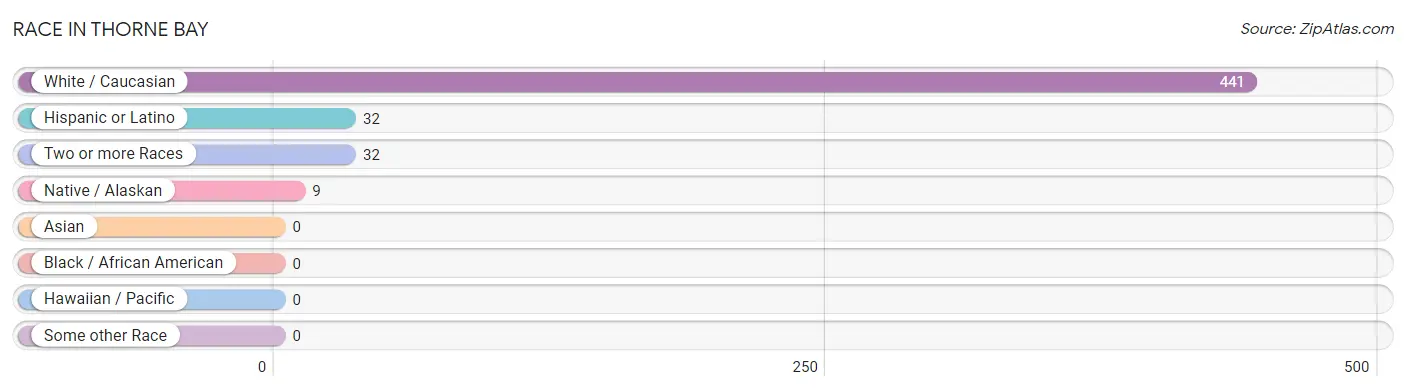
| Race | # Population | % Population |
| Asian | 0 | 0.0% |
| Black / African American | 0 | 0.0% |
| Hawaiian / Pacific | 0 | 0.0% |
| Hispanic or Latino | 32 | 6.6% |
| Native / Alaskan | 9 | 1.9% |
| White / Caucasian | 441 | 91.5% |
| Two or more Races | 32 | 6.6% |
| Some other Race | 0 | 0.0% |
| Total | 482 | 100.0% |
Ancestry in Thorne Bay
The most populous ancestries reported in Thorne Bay are German (175 | 36.3%), Irish (104 | 21.6%), English (94 | 19.5%), British (50 | 10.4%), and Scottish (42 | 8.7%), together accounting for 96.5% of all Thorne Bay residents.
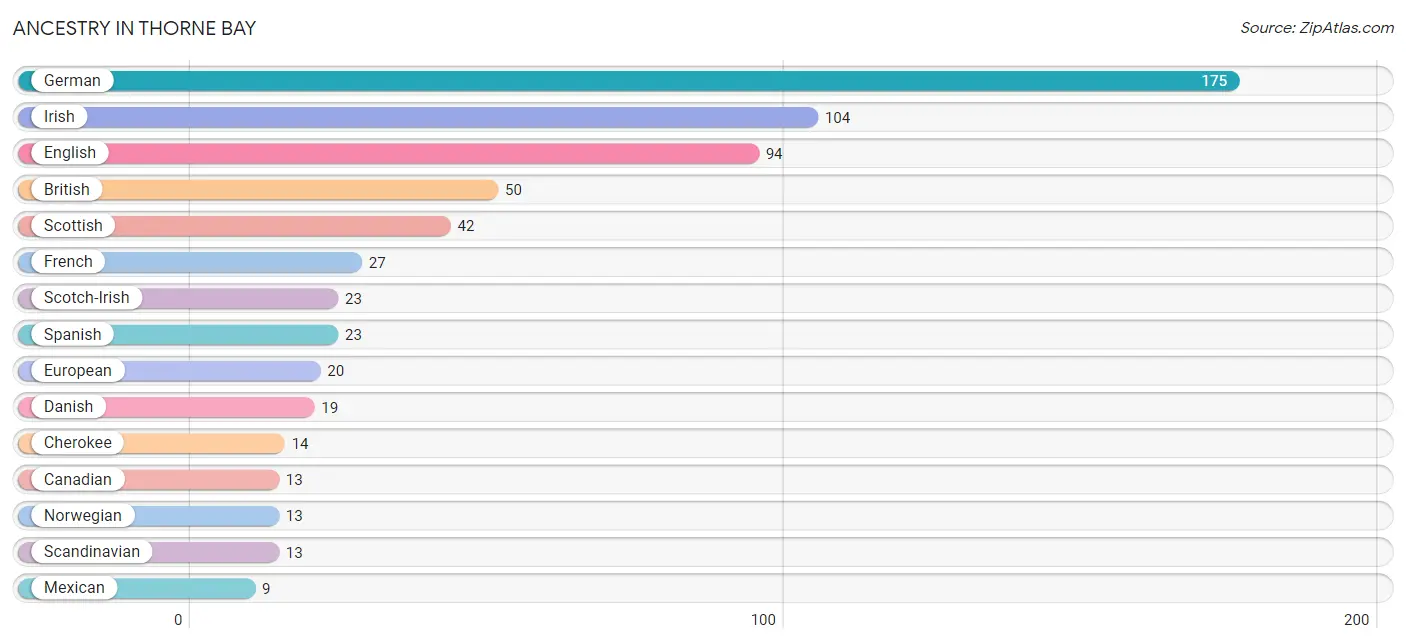
| Ancestry | # Population | % Population |
| American | 6 | 1.2% |
| Australian | 5 | 1.0% |
| Blackfeet | 8 | 1.7% |
| British | 50 | 10.4% |
| Bulgarian | 3 | 0.6% |
| Canadian | 13 | 2.7% |
| Cherokee | 14 | 2.9% |
| Danish | 19 | 3.9% |
| Dutch | 6 | 1.2% |
| English | 94 | 19.5% |
| European | 20 | 4.2% |
| French | 27 | 5.6% |
| German | 175 | 36.3% |
| Greek | 2 | 0.4% |
| Irish | 104 | 21.6% |
| Mexican | 9 | 1.9% |
| Norwegian | 13 | 2.7% |
| Scandinavian | 13 | 2.7% |
| Scotch-Irish | 23 | 4.8% |
| Scottish | 42 | 8.7% |
| Sioux | 3 | 0.6% |
| Spanish | 23 | 4.8% |
| Swedish | 7 | 1.5% |
| Swiss | 3 | 0.6% |
| Tlingit-Haida | 9 | 1.9% | View All 25 Rows |
Immigrants in Thorne Bay
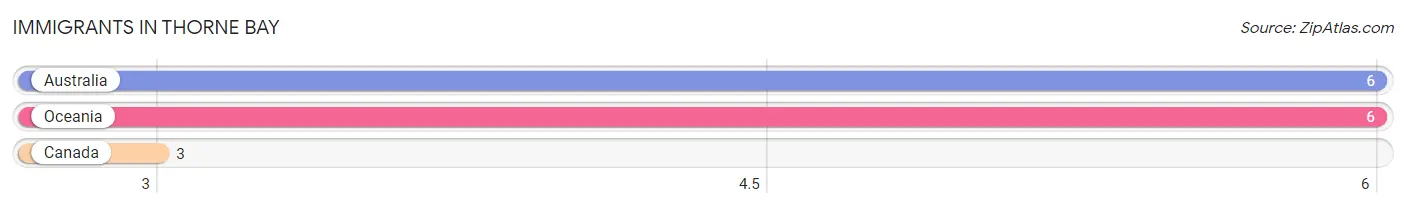
The most numerous immigrant groups reported in Thorne Bay came from Australia (6 | 1.2%), Oceania (6 | 1.2%), and Canada (3 | 0.6%), together accounting for 3.1% of all Thorne Bay residents.
| Immigration Origin | # Population | % Population |
| Australia | 6 | 1.2% |
| Canada | 3 | 0.6% |
| Oceania | 6 | 1.2% | View All 3 Rows |
Sex and Age in Thorne Bay
Sex and Age in Thorne Bay
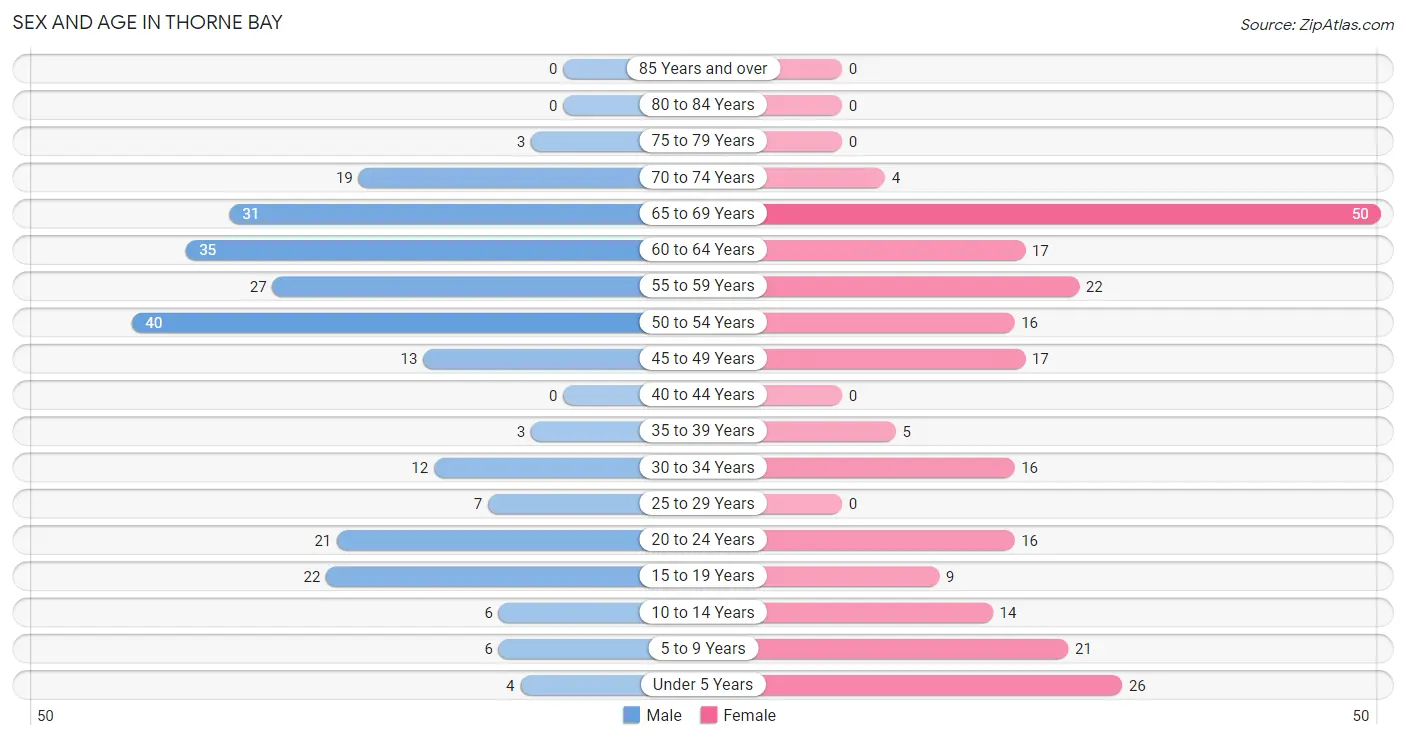
The most populous age groups in Thorne Bay are 50 to 54 Years (40 | 16.1%) for men and 65 to 69 Years (50 | 21.5%) for women.
| Age Bracket | Male | Female |
| Under 5 Years | 4 (1.6%) | 26 (11.2%) |
| 5 to 9 Years | 6 (2.4%) | 21 (9.0%) |
| 10 to 14 Years | 6 (2.4%) | 14 (6.0%) |
| 15 to 19 Years | 22 (8.8%) | 9 (3.9%) |
| 20 to 24 Years | 21 (8.4%) | 16 (6.9%) |
| 25 to 29 Years | 7 (2.8%) | 0 (0.0%) |
| 30 to 34 Years | 12 (4.8%) | 16 (6.9%) |
| 35 to 39 Years | 3 (1.2%) | 5 (2.1%) |
| 40 to 44 Years | 0 (0.0%) | 0 (0.0%) |
| 45 to 49 Years | 13 (5.2%) | 17 (7.3%) |
| 50 to 54 Years | 40 (16.1%) | 16 (6.9%) |
| 55 to 59 Years | 27 (10.8%) | 22 (9.4%) |
| 60 to 64 Years | 35 (14.1%) | 17 (7.3%) |
| 65 to 69 Years | 31 (12.4%) | 50 (21.5%) |
| 70 to 74 Years | 19 (7.6%) | 4 (1.7%) |
| 75 to 79 Years | 3 (1.2%) | 0 (0.0%) |
| 80 to 84 Years | 0 (0.0%) | 0 (0.0%) |
| 85 Years and over | 0 (0.0%) | 0 (0.0%) |
| Total | 249 (100.0%) | 233 (100.0%) |
Families and Households in Thorne Bay
Median Family Size in Thorne Bay
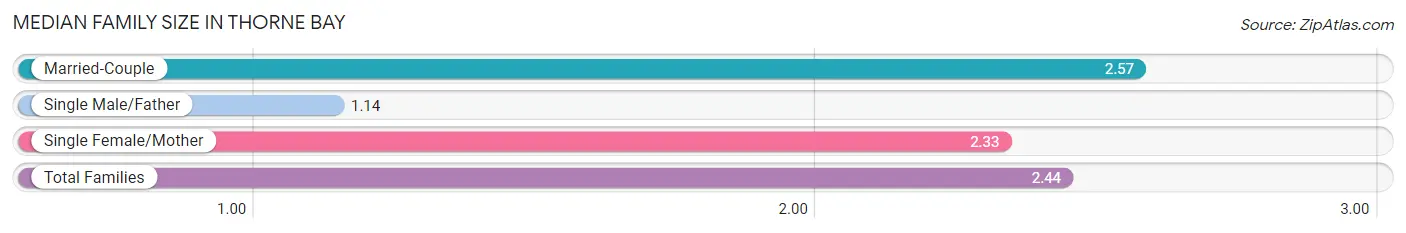
The median family size in Thorne Bay is 2.44 persons per family, with married-couple families (138 | 87.3%) accounting for the largest median family size of 2.57 persons per family. On the other hand, single male/father families (14 | 8.9%) represent the smallest median family size with 1.14 persons per family.
| Family Type | # Families | Family Size |
| Married-Couple | 138 (87.3%) | 2.57 |
| Single Male/Father | 14 (8.9%) | 1.14 |
| Single Female/Mother | 6 (3.8%) | 2.33 |
| Total Families | 158 (100.0%) | 2.44 |
Median Household Size in Thorne Bay
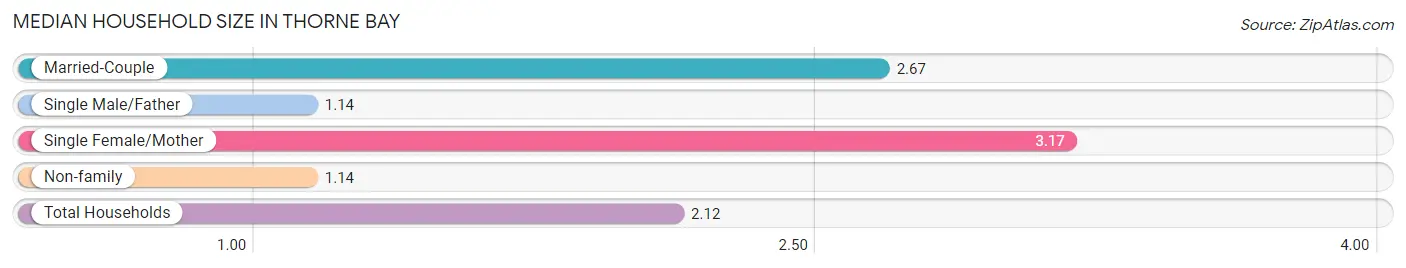
The median household size in Thorne Bay is 2.12 persons per household, with single female/mother households (6 | 2.6%) accounting for the largest median household size of 3.17 persons per household. single male/father households (14 | 6.2%) represent the smallest median household size with 1.14 persons per household.
| Household Type | # Households | Household Size |
| Married-Couple | 138 (60.8%) | 2.67 |
| Single Male/Father | 14 (6.2%) | 1.14 |
| Single Female/Mother | 6 (2.6%) | 3.17 |
| Non-family | 69 (30.4%) | 1.14 |
| Total Households | 227 (100.0%) | 2.12 |
Household Size by Marriage Status in Thorne Bay
Out of a total of 227 households in Thorne Bay, 158 (69.6%) are family households, while 69 (30.4%) are nonfamily households. The most numerous type of family households are 2-person households, comprising 106, and the most common type of nonfamily households are 1-person households, comprising 55.
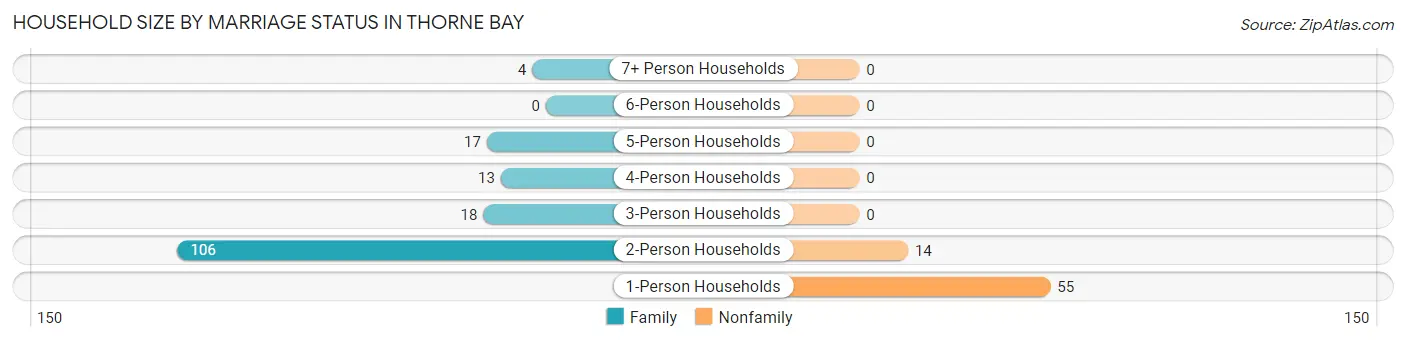
| Household Size | Family Households | Nonfamily Households |
| 1-Person Households | - | 55 (24.2%) |
| 2-Person Households | 106 (46.7%) | 14 (6.2%) |
| 3-Person Households | 18 (7.9%) | 0 (0.0%) |
| 4-Person Households | 13 (5.7%) | 0 (0.0%) |
| 5-Person Households | 17 (7.5%) | 0 (0.0%) |
| 6-Person Households | 0 (0.0%) | 0 (0.0%) |
| 7+ Person Households | 4 (1.8%) | 0 (0.0%) |
| Total | 158 (69.6%) | 69 (30.4%) |
Female Fertility in Thorne Bay
Fertility by Age in Thorne Bay
Average fertility rate in Thorne Bay is 32.0 births per 1,000 women. Women in the age bracket of 20 to 34 years have the highest fertility rate with 63.0 births per 1,000 women. Women in the age bracket of 20 to 34 years acount for 100.0% of all women with births.
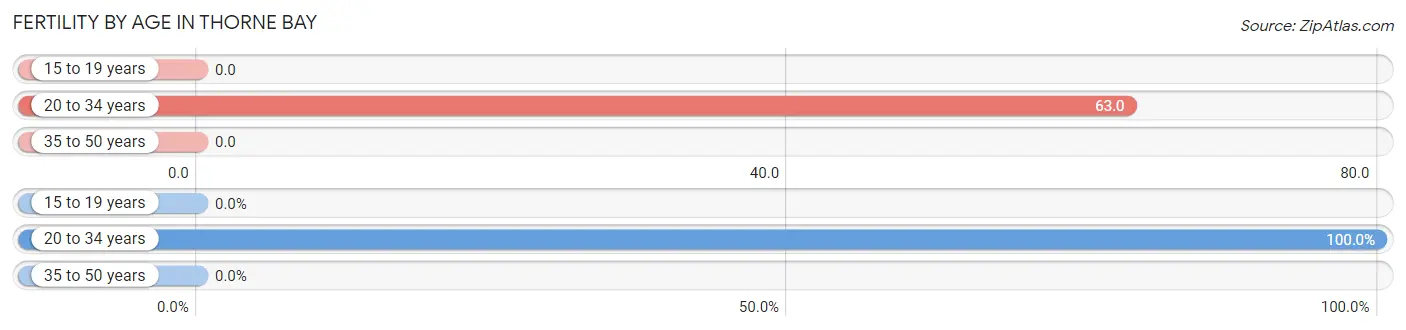
| Age Bracket | Women with Births | Births / 1,000 Women |
| 15 to 19 years | 0 (0.0%) | 0.0 |
| 20 to 34 years | 2 (100.0%) | 63.0 |
| 35 to 50 years | 0 (0.0%) | 0.0 |
| Total | 2 (100.0%) | 32.0 |
Fertility by Age by Marriage Status in Thorne Bay
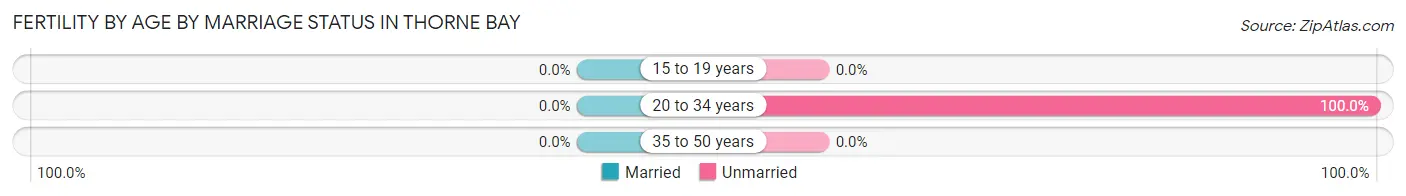
| Age Bracket | Married | Unmarried |
| 15 to 19 years | 0 (0.0%) | 0 (0.0%) |
| 20 to 34 years | 0 (0.0%) | 2 (100.0%) |
| 35 to 50 years | 0 (0.0%) | 0 (0.0%) |
| Total | 0 (0.0%) | 2 (100.0%) |
Fertility by Education in Thorne Bay
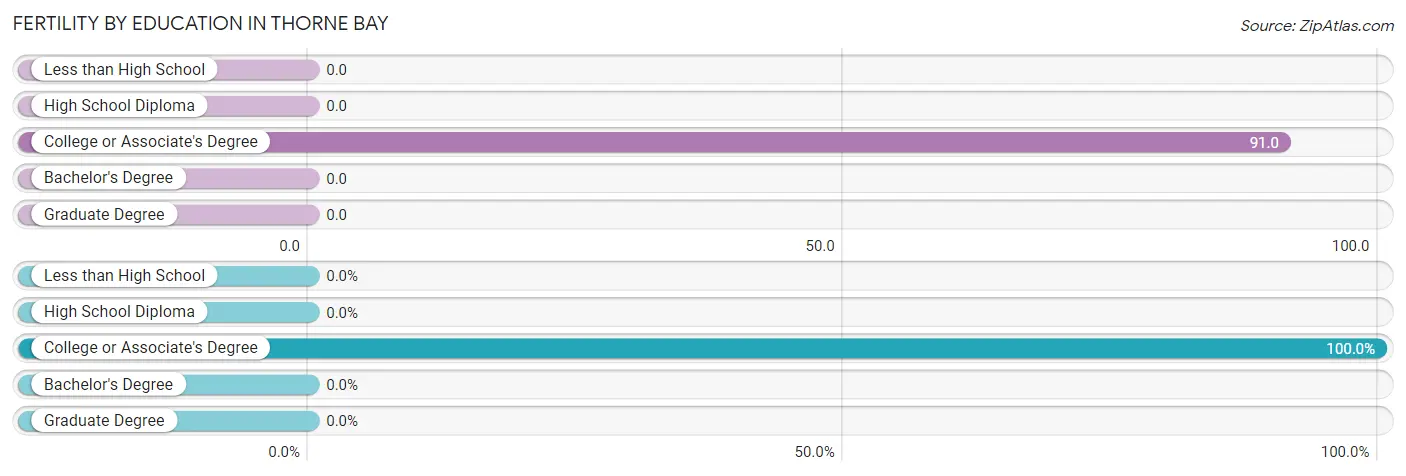
| Educational Attainment | Women with Births | Births / 1,000 Women |
| Less than High School | 0 (0.0%) | 0.0 |
| High School Diploma | 0 (0.0%) | 0.0 |
| College or Associate's Degree | 2 (100.0%) | 91.0 |
| Bachelor's Degree | 0 (0.0%) | 0.0 |
| Graduate Degree | 0 (0.0%) | 0.0 |
| Total | 2 (100.0%) | 32.0 |
Fertility by Education by Marriage Status in Thorne Bay
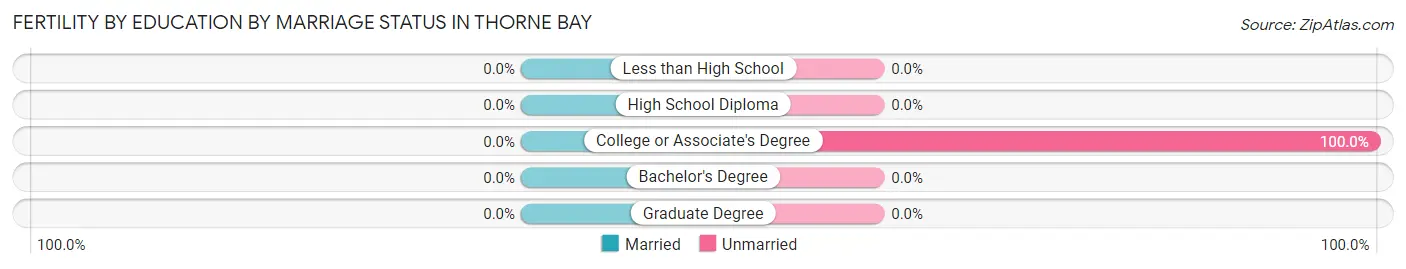
| Educational Attainment | Married | Unmarried |
| Less than High School | 0 (0.0%) | 0 (0.0%) |
| High School Diploma | 0 (0.0%) | 0 (0.0%) |
| College or Associate's Degree | 0 (0.0%) | 2 (100.0%) |
| Bachelor's Degree | 0 (0.0%) | 0 (0.0%) |
| Graduate Degree | 0 (0.0%) | 0 (0.0%) |
| Total | 0 (0.0%) | 2 (100.0%) |
Employment Characteristics in Thorne Bay
Employment by Class of Employer in Thorne Bay
Among the 211 employed individuals in Thorne Bay, local government employees (75 | 35.5%), private company employees (46 | 21.8%), and federal government employees (34 | 16.1%) make up the most common classes of employment.
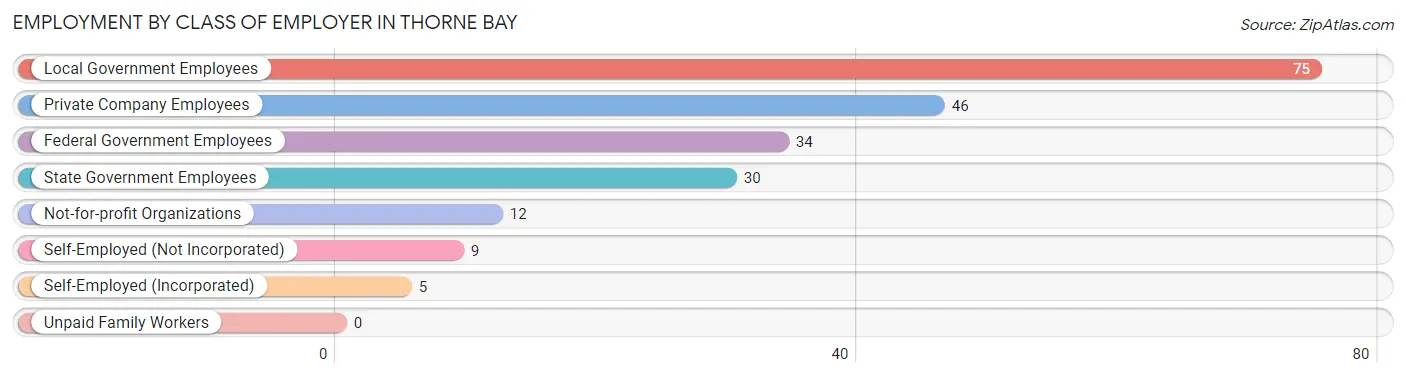
| Employer Class | # Employees | % Employees |
| Private Company Employees | 46 | 21.8% |
| Self-Employed (Incorporated) | 5 | 2.4% |
| Self-Employed (Not Incorporated) | 9 | 4.3% |
| Not-for-profit Organizations | 12 | 5.7% |
| Local Government Employees | 75 | 35.5% |
| State Government Employees | 30 | 14.2% |
| Federal Government Employees | 34 | 16.1% |
| Unpaid Family Workers | 0 | 0.0% |
| Total | 211 | 100.0% |
Employment Status by Age in Thorne Bay
According to the labor force statistics for Thorne Bay, out of the total population over 16 years of age (405), 55.6% or 225 individuals are in the labor force, with 2.2% or 5 of them unemployed. The age group with the highest labor force participation rate is 35 to 44 years, with 100.0% or 8 individuals in the labor force. Within the labor force, the 55 to 59 years age range has the highest percentage of unemployed individuals, with 11.4% or 5 of them being unemployed.
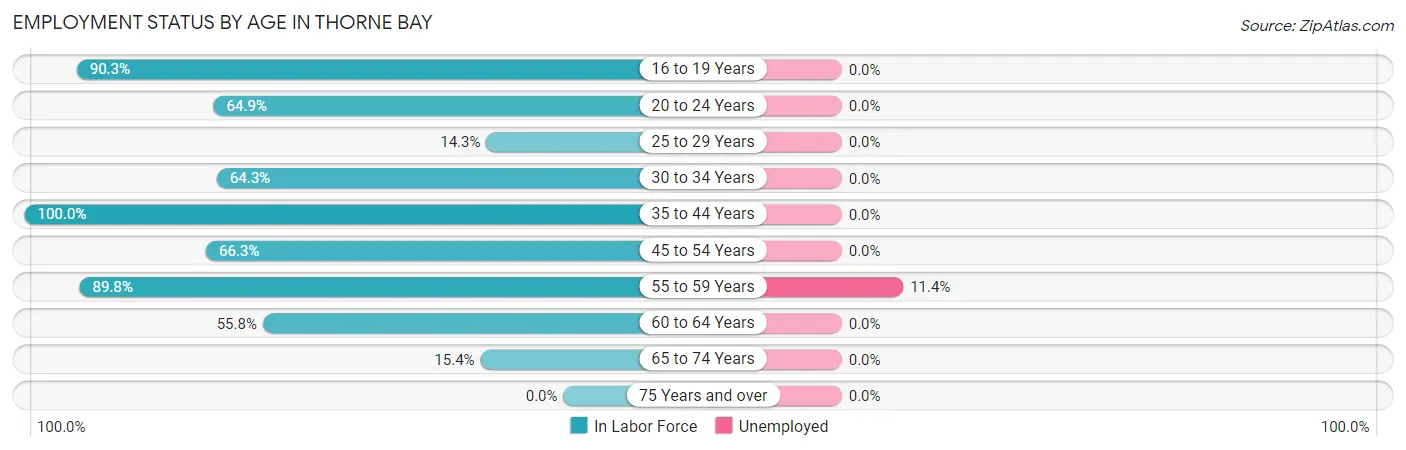
| Age Bracket | In Labor Force | Unemployed |
| 16 to 19 Years | 28 (90.3%) | 0 (0.0%) |
| 20 to 24 Years | 24 (64.9%) | 0 (0.0%) |
| 25 to 29 Years | 1 (14.3%) | 0 (0.0%) |
| 30 to 34 Years | 18 (64.3%) | 0 (0.0%) |
| 35 to 44 Years | 8 (100.0%) | 0 (0.0%) |
| 45 to 54 Years | 57 (66.3%) | 0 (0.0%) |
| 55 to 59 Years | 44 (89.8%) | 5 (11.4%) |
| 60 to 64 Years | 29 (55.8%) | 0 (0.0%) |
| 65 to 74 Years | 16 (15.4%) | 0 (0.0%) |
| 75 Years and over | 0 (0.0%) | 0 (0.0%) |
| Total | 225 (55.6%) | 5 (2.2%) |
Employment Status by Educational Attainment in Thorne Bay
According to labor force statistics for Thorne Bay, 68.3% of individuals (157) out of the total population between 25 and 64 years of age (230) are in the labor force, with 3.2% or 5 of them being unemployed. The group with the highest labor force participation rate are those with the educational attainment of less than high school, with 100.0% or 7 individuals in the labor force. Within the labor force, individuals with college / associate degree education have the highest percentage of unemployment, with 11.1% or 5 of them being unemployed.
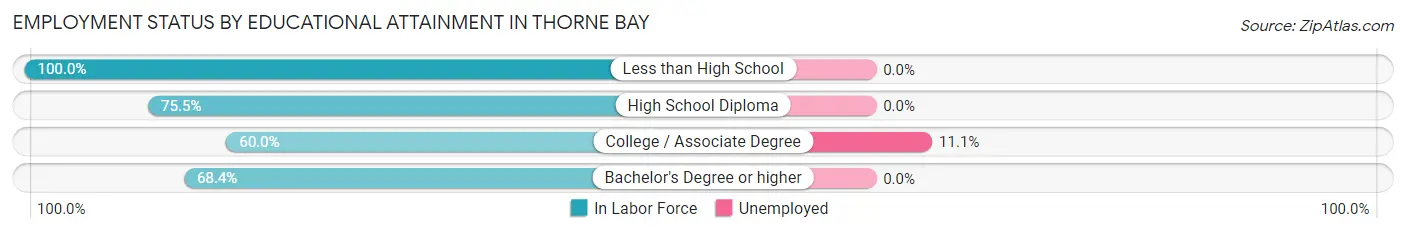
| Educational Attainment | In Labor Force | Unemployed |
| Less than High School | 7 (100.0%) | 0 (0.0%) |
| High School Diploma | 40 (75.5%) | 0 (0.0%) |
| College / Associate Degree | 45 (60.0%) | 8 (11.1%) |
| Bachelor's Degree or higher | 65 (68.4%) | 0 (0.0%) |
| Total | 157 (68.3%) | 7 (3.2%) |
Employment Occupations by Sex in Thorne Bay
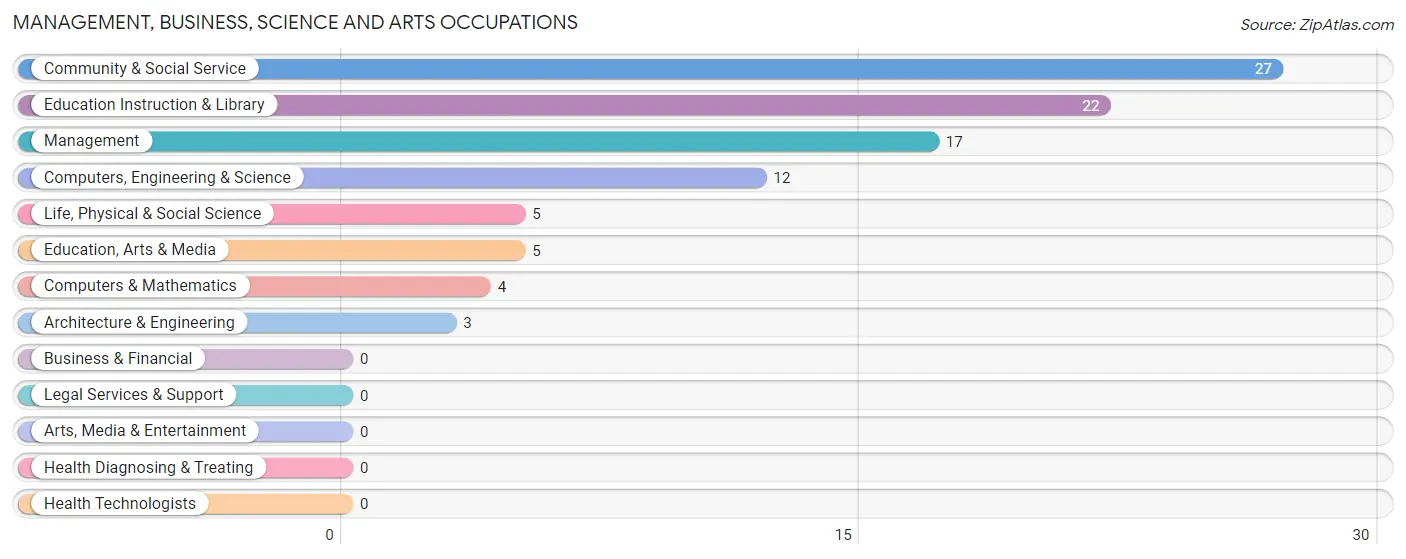
Management, Business, Science and Arts Occupations
The most common Management, Business, Science and Arts occupations in Thorne Bay are Community & Social Service (27 | 12.3%), Education Instruction & Library (22 | 10.0%), Management (17 | 7.7%), Computers, Engineering & Science (12 | 5.4%), and Life, Physical & Social Science (5 | 2.3%).
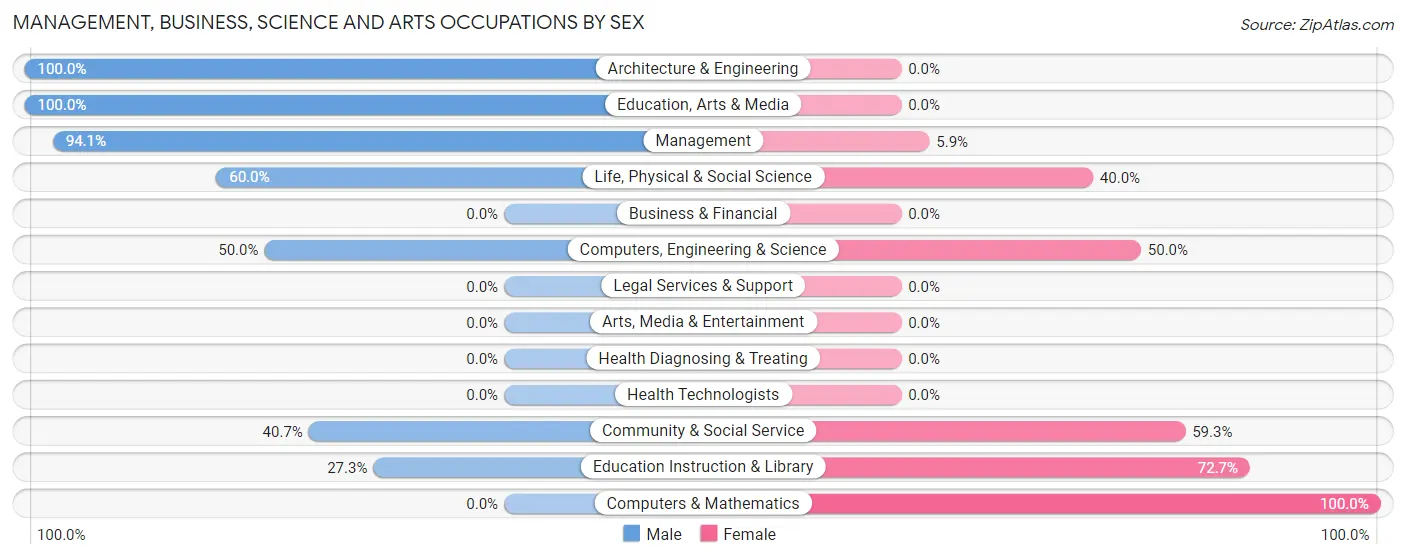
Management, Business, Science and Arts Occupations by Sex
Within the Management, Business, Science and Arts occupations in Thorne Bay, the most male-oriented occupations are Architecture & Engineering (100.0%), Education, Arts & Media (100.0%), and Management (94.1%), while the most female-oriented occupations are Computers & Mathematics (100.0%), Education Instruction & Library (72.7%), and Community & Social Service (59.3%).
| Occupation | Male | Female |
| Management | 16 (94.1%) | 1 (5.9%) |
| Business & Financial | 0 (0.0%) | 0 (0.0%) |
| Computers, Engineering & Science | 6 (50.0%) | 6 (50.0%) |
| Computers & Mathematics | 0 (0.0%) | 4 (100.0%) |
| Architecture & Engineering | 3 (100.0%) | 0 (0.0%) |
| Life, Physical & Social Science | 3 (60.0%) | 2 (40.0%) |
| Community & Social Service | 11 (40.7%) | 16 (59.3%) |
| Education, Arts & Media | 5 (100.0%) | 0 (0.0%) |
| Legal Services & Support | 0 (0.0%) | 0 (0.0%) |
| Education Instruction & Library | 6 (27.3%) | 16 (72.7%) |
| Arts, Media & Entertainment | 0 (0.0%) | 0 (0.0%) |
| Health Diagnosing & Treating | 0 (0.0%) | 0 (0.0%) |
| Health Technologists | 0 (0.0%) | 0 (0.0%) |
| Total (Category) | 33 (58.9%) | 23 (41.1%) |
| Total (Overall) | 108 (49.1%) | 112 (50.9%) |
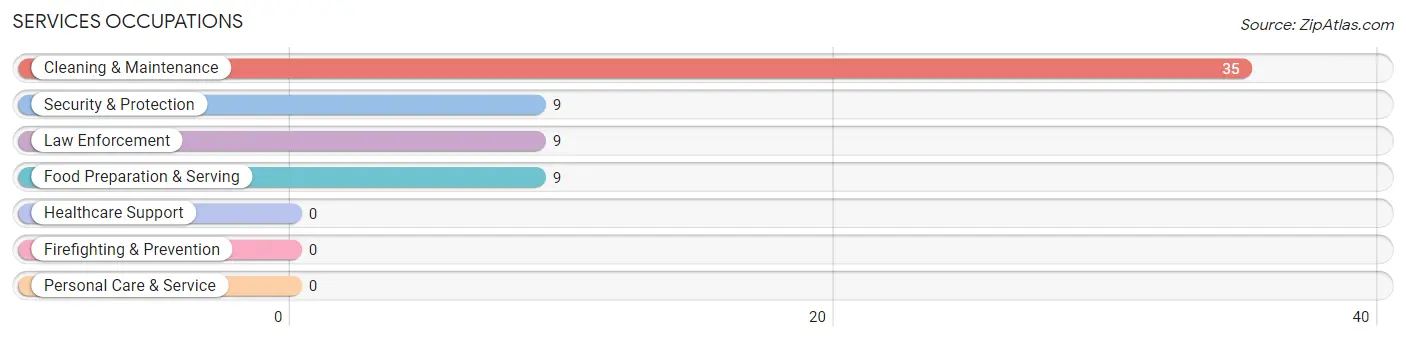
Services Occupations
The most common Services occupations in Thorne Bay are Cleaning & Maintenance (35 | 15.9%), Security & Protection (9 | 4.1%), Law Enforcement (9 | 4.1%), and Food Preparation & Serving (9 | 4.1%).
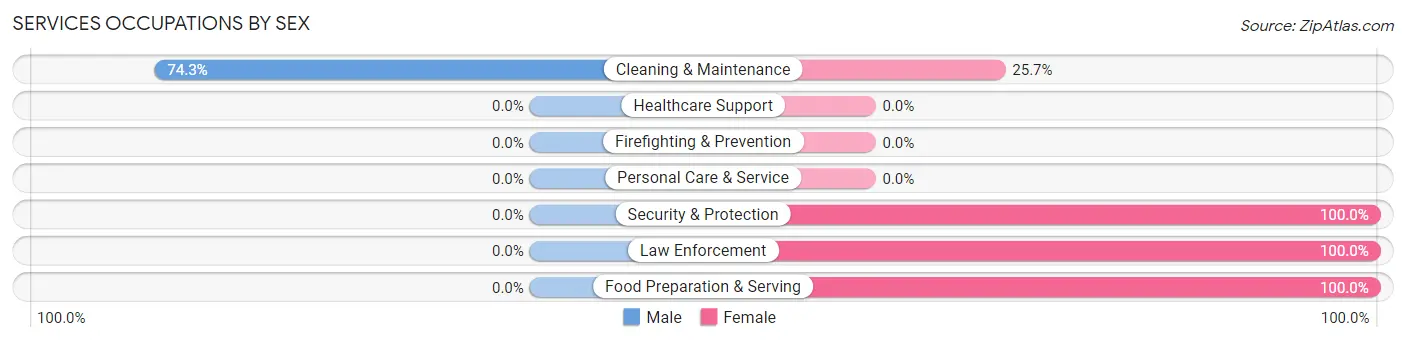
Services Occupations by Sex
| Occupation | Male | Female |
| Healthcare Support | 0 (0.0%) | 0 (0.0%) |
| Security & Protection | 0 (0.0%) | 9 (100.0%) |
| Firefighting & Prevention | 0 (0.0%) | 0 (0.0%) |
| Law Enforcement | 0 (0.0%) | 9 (100.0%) |
| Food Preparation & Serving | 0 (0.0%) | 9 (100.0%) |
| Cleaning & Maintenance | 26 (74.3%) | 9 (25.7%) |
| Personal Care & Service | 0 (0.0%) | 0 (0.0%) |
| Total (Category) | 26 (49.1%) | 27 (50.9%) |
| Total (Overall) | 108 (49.1%) | 112 (50.9%) |
Sales and Office Occupations
The most common Sales and Office occupations in Thorne Bay are Sales & Related (31 | 14.1%), and Office & Administration (25 | 11.4%).
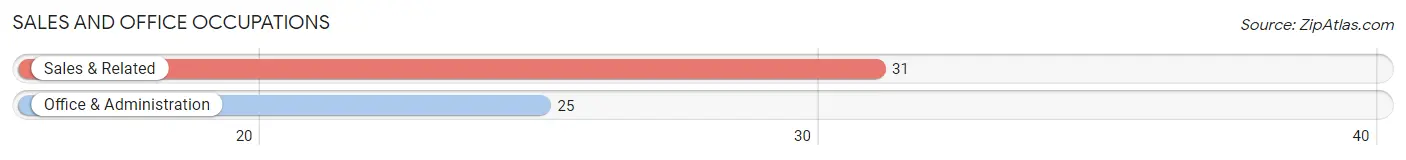
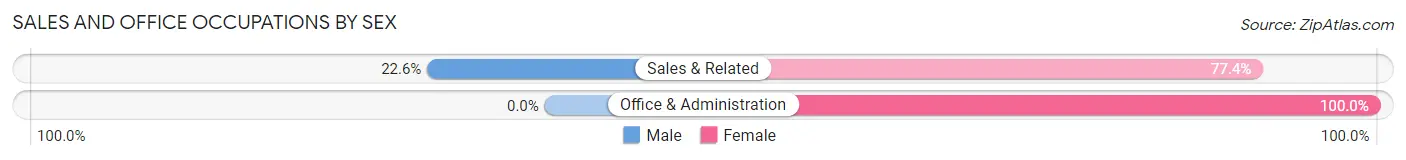
Sales and Office Occupations by Sex
| Occupation | Male | Female |
| Sales & Related | 7 (22.6%) | 24 (77.4%) |
| Office & Administration | 0 (0.0%) | 25 (100.0%) |
| Total (Category) | 7 (12.5%) | 49 (87.5%) |
| Total (Overall) | 108 (49.1%) | 112 (50.9%) |
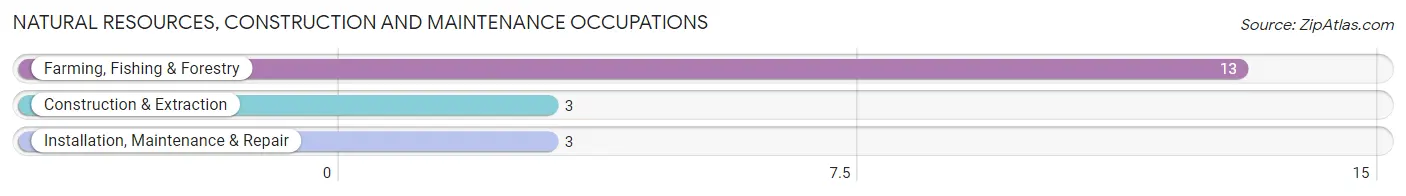
Natural Resources, Construction and Maintenance Occupations
The most common Natural Resources, Construction and Maintenance occupations in Thorne Bay are Farming, Fishing & Forestry (13 | 5.9%), Construction & Extraction (3 | 1.4%), and Installation, Maintenance & Repair (3 | 1.4%).
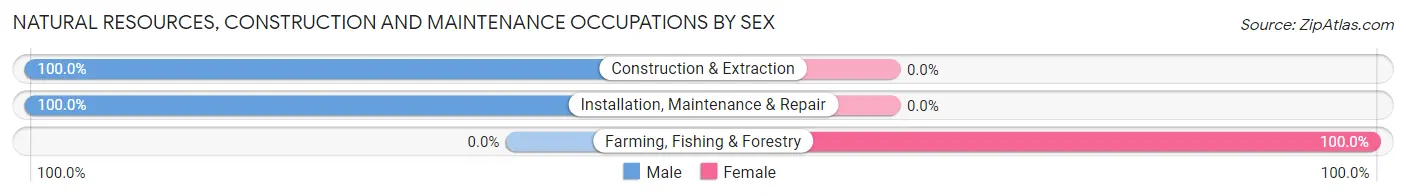
Natural Resources, Construction and Maintenance Occupations by Sex
| Occupation | Male | Female |
| Farming, Fishing & Forestry | 0 (0.0%) | 13 (100.0%) |
| Construction & Extraction | 3 (100.0%) | 0 (0.0%) |
| Installation, Maintenance & Repair | 3 (100.0%) | 0 (0.0%) |
| Total (Category) | 6 (31.6%) | 13 (68.4%) |
| Total (Overall) | 108 (49.1%) | 112 (50.9%) |
Production, Transportation and Moving Occupations
The most common Production, Transportation and Moving occupations in Thorne Bay are Transportation (18 | 8.2%), Production (15 | 6.8%), and Material Moving (3 | 1.4%).
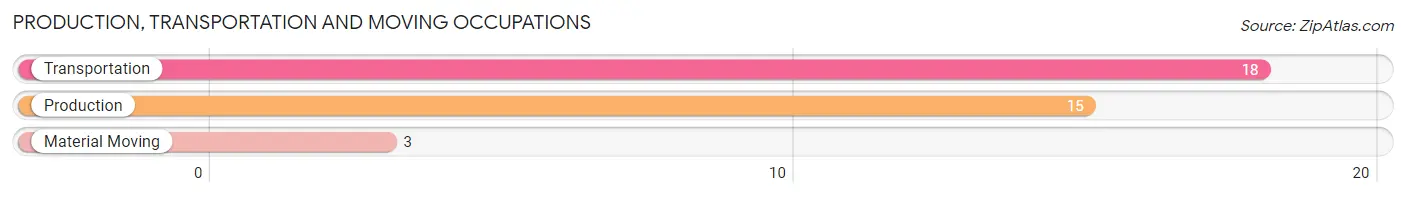
Production, Transportation and Moving Occupations by Sex
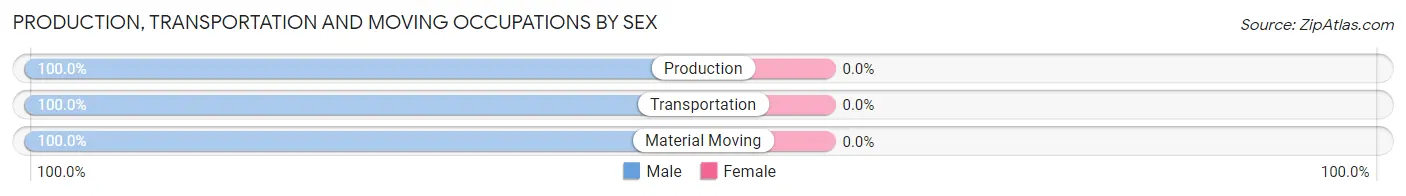
| Occupation | Male | Female |
| Production | 15 (100.0%) | 0 (0.0%) |
| Transportation | 18 (100.0%) | 0 (0.0%) |
| Material Moving | 3 (100.0%) | 0 (0.0%) |
| Total (Category) | 36 (100.0%) | 0 (0.0%) |
| Total (Overall) | 108 (49.1%) | 112 (50.9%) |
Employment Industries by Sex in Thorne Bay
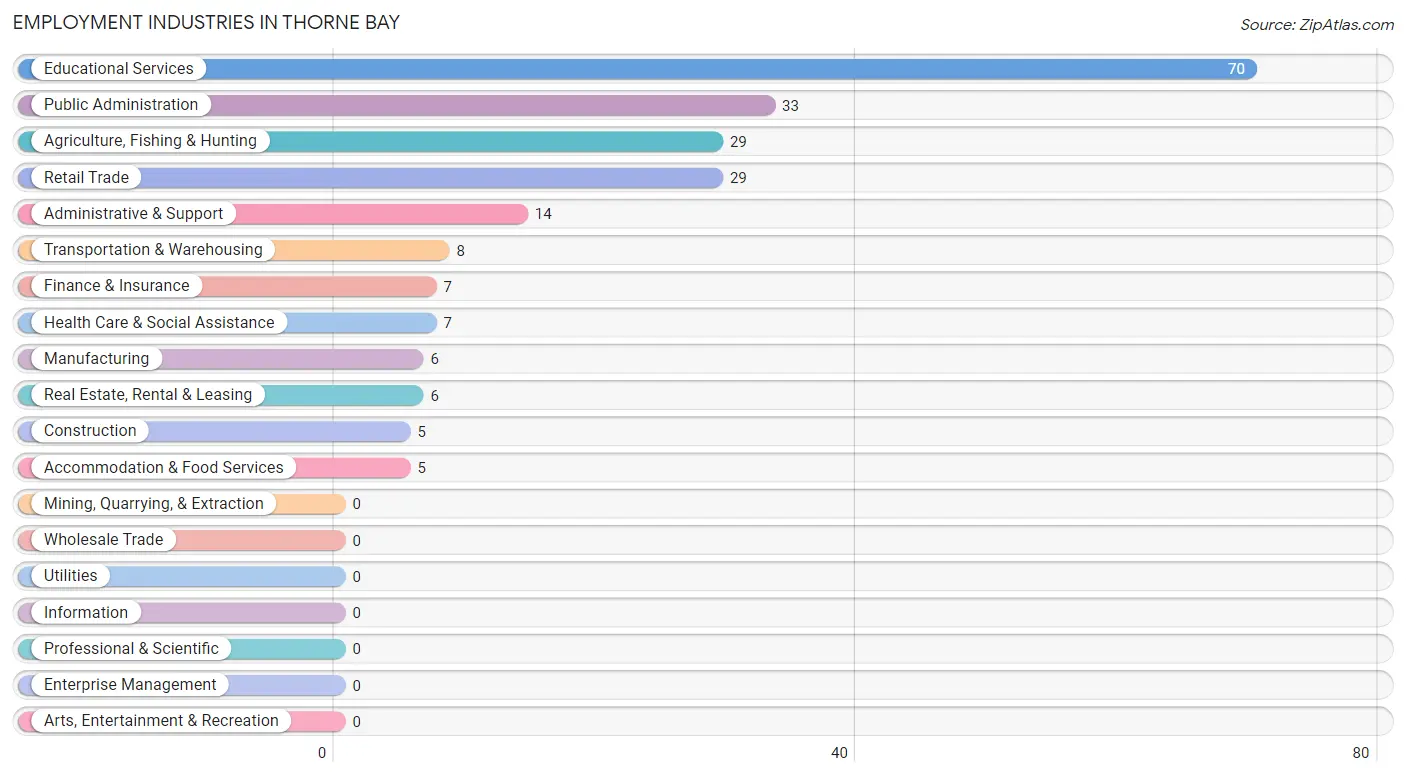
Employment Industries in Thorne Bay
The major employment industries in Thorne Bay include Educational Services (70 | 31.8%), Public Administration (33 | 15.0%), Agriculture, Fishing & Hunting (29 | 13.2%), Retail Trade (29 | 13.2%), and Administrative & Support (14 | 6.4%).
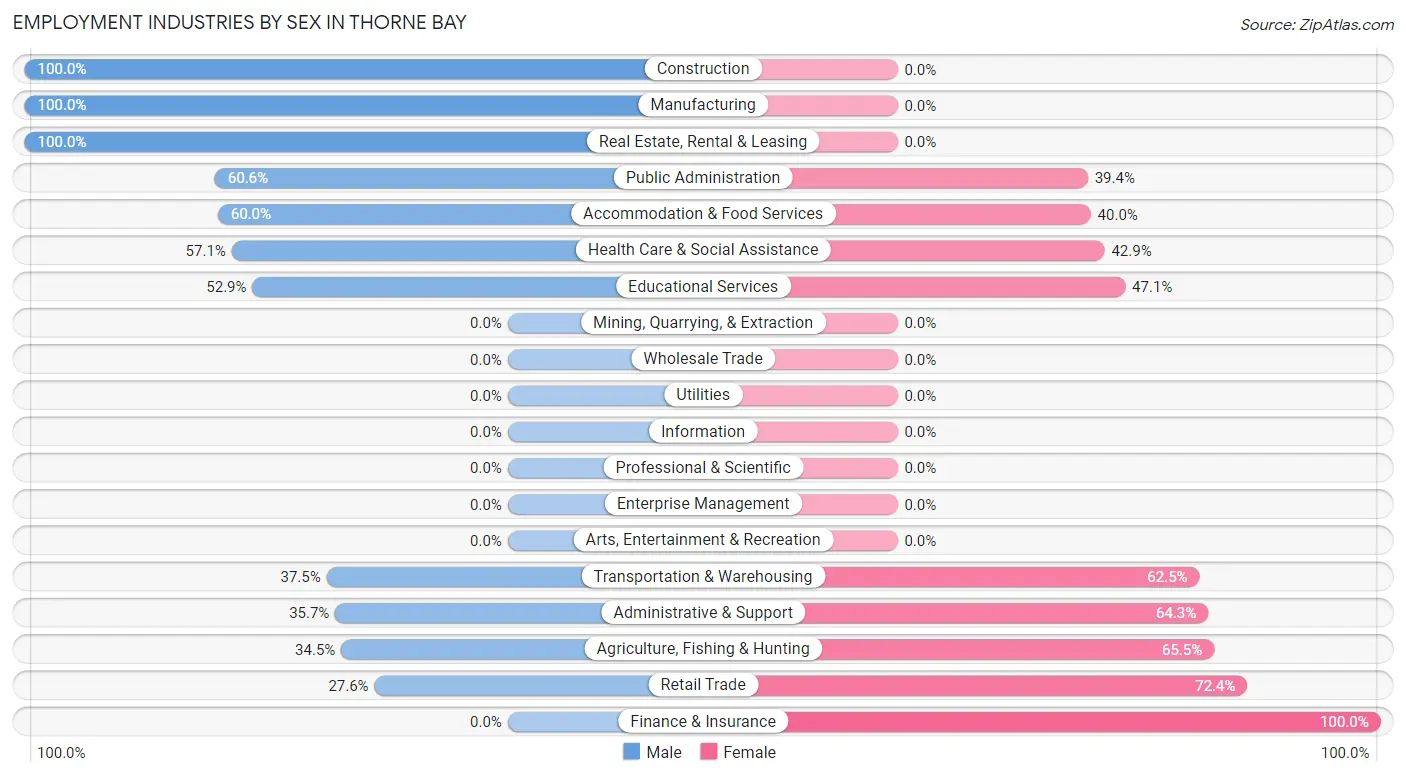
Employment Industries by Sex in Thorne Bay
The Thorne Bay industries that see more men than women are Construction (100.0%), Manufacturing (100.0%), and Real Estate, Rental & Leasing (100.0%), whereas the industries that tend to have a higher number of women are Finance & Insurance (100.0%), Retail Trade (72.4%), and Agriculture, Fishing & Hunting (65.5%).
| Industry | Male | Female |
| Agriculture, Fishing & Hunting | 10 (34.5%) | 19 (65.5%) |
| Mining, Quarrying, & Extraction | 0 (0.0%) | 0 (0.0%) |
| Construction | 5 (100.0%) | 0 (0.0%) |
| Manufacturing | 6 (100.0%) | 0 (0.0%) |
| Wholesale Trade | 0 (0.0%) | 0 (0.0%) |
| Retail Trade | 8 (27.6%) | 21 (72.4%) |
| Transportation & Warehousing | 3 (37.5%) | 5 (62.5%) |
| Utilities | 0 (0.0%) | 0 (0.0%) |
| Information | 0 (0.0%) | 0 (0.0%) |
| Finance & Insurance | 0 (0.0%) | 7 (100.0%) |
| Real Estate, Rental & Leasing | 6 (100.0%) | 0 (0.0%) |
| Professional & Scientific | 0 (0.0%) | 0 (0.0%) |
| Enterprise Management | 0 (0.0%) | 0 (0.0%) |
| Administrative & Support | 5 (35.7%) | 9 (64.3%) |
| Educational Services | 37 (52.9%) | 33 (47.1%) |
| Health Care & Social Assistance | 4 (57.1%) | 3 (42.9%) |
| Arts, Entertainment & Recreation | 0 (0.0%) | 0 (0.0%) |
| Accommodation & Food Services | 3 (60.0%) | 2 (40.0%) |
| Public Administration | 20 (60.6%) | 13 (39.4%) |
| Total | 108 (49.1%) | 112 (50.9%) |
Education in Thorne Bay
School Enrollment in Thorne Bay
The most common levels of schooling among the 85 students in Thorne Bay are elementary school (33 | 38.8%), high school (27 | 31.8%), and nursery / preschool (10 | 11.8%).
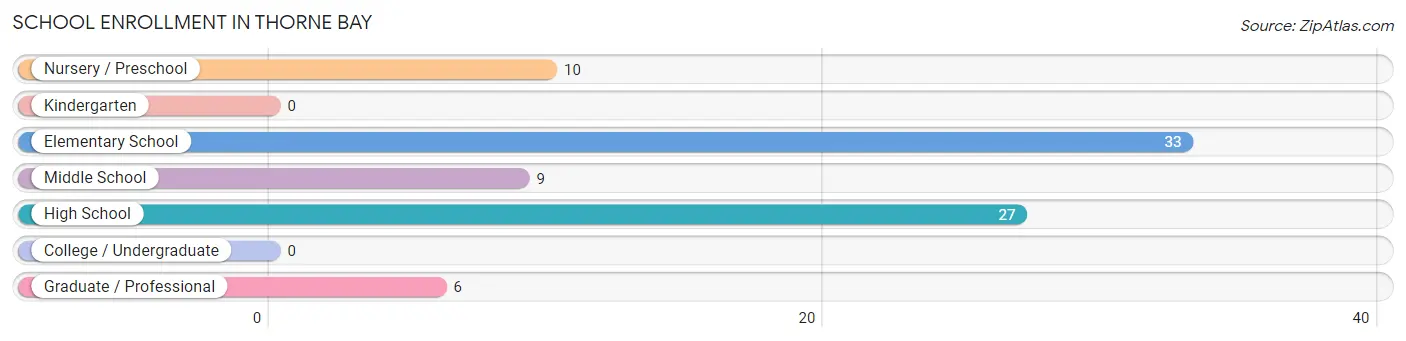
| School Level | # Students | % Students |
| Nursery / Preschool | 10 | 11.8% |
| Kindergarten | 0 | 0.0% |
| Elementary School | 33 | 38.8% |
| Middle School | 9 | 10.6% |
| High School | 27 | 31.8% |
| College / Undergraduate | 0 | 0.0% |
| Graduate / Professional | 6 | 7.1% |
| Total | 85 | 100.0% |
School Enrollment by Age by Funding Source in Thorne Bay
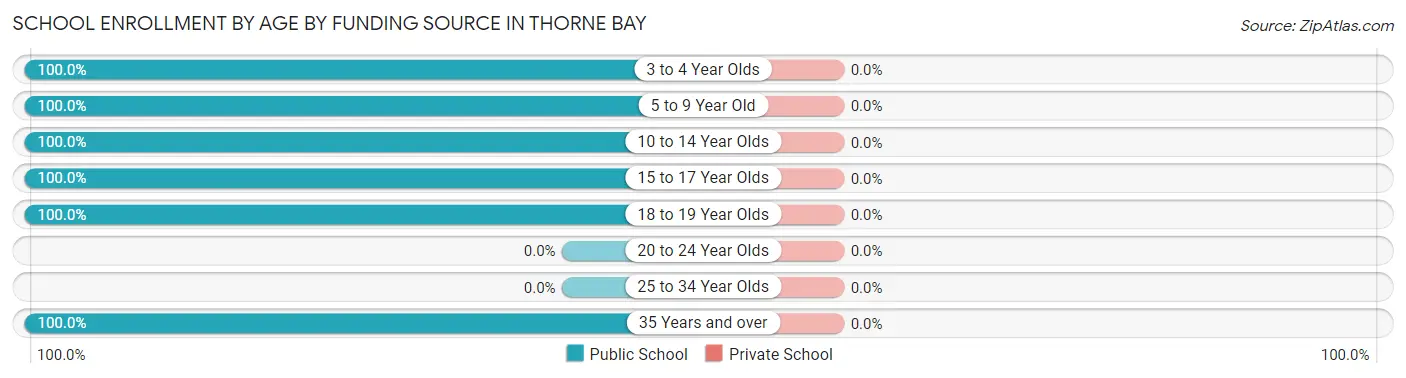
| Age Bracket | Public School | Private School |
| 3 to 4 Year Olds | 10 (100.0%) | 0 (0.0%) |
| 5 to 9 Year Old | 27 (100.0%) | 0 (0.0%) |
| 10 to 14 Year Olds | 20 (100.0%) | 0 (0.0%) |
| 15 to 17 Year Olds | 19 (100.0%) | 0 (0.0%) |
| 18 to 19 Year Olds | 3 (100.0%) | 0 (0.0%) |
| 20 to 24 Year Olds | 0 (0.0%) | 0 (0.0%) |
| 25 to 34 Year Olds | 0 (0.0%) | 0 (0.0%) |
| 35 Years and over | 6 (100.0%) | 0 (0.0%) |
| Total | 85 (100.0%) | 0 (0.0%) |
Educational Attainment by Field of Study in Thorne Bay
Bio, nature & agricultural (52 | 37.7%), business (21 | 15.2%), arts & humanities (19 | 13.8%), education (12 | 8.7%), and engineering (9 | 6.5%) are the most common fields of study among 138 individuals in Thorne Bay who have obtained a bachelor's degree or higher.
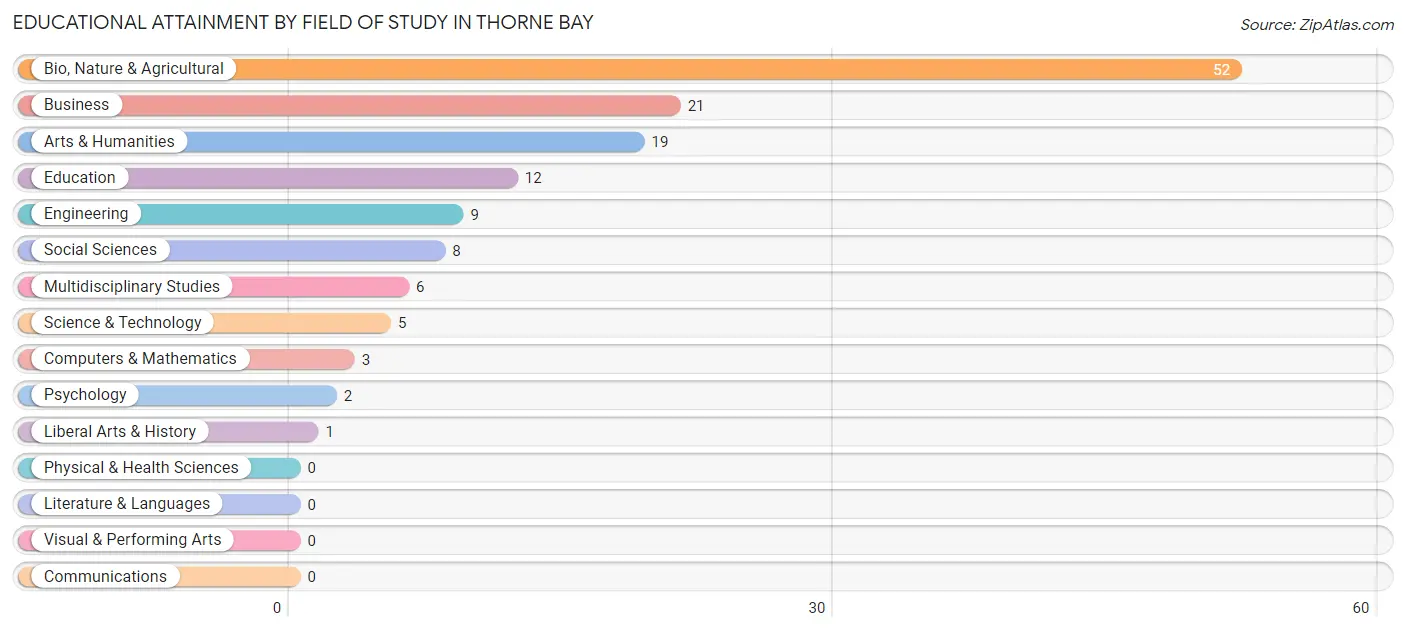
| Field of Study | # Graduates | % Graduates |
| Computers & Mathematics | 3 | 2.2% |
| Bio, Nature & Agricultural | 52 | 37.7% |
| Physical & Health Sciences | 0 | 0.0% |
| Psychology | 2 | 1.5% |
| Social Sciences | 8 | 5.8% |
| Engineering | 9 | 6.5% |
| Multidisciplinary Studies | 6 | 4.3% |
| Science & Technology | 5 | 3.6% |
| Business | 21 | 15.2% |
| Education | 12 | 8.7% |
| Literature & Languages | 0 | 0.0% |
| Liberal Arts & History | 1 | 0.7% |
| Visual & Performing Arts | 0 | 0.0% |
| Communications | 0 | 0.0% |
| Arts & Humanities | 19 | 13.8% |
| Total | 138 | 100.0% |
Transportation & Commute in Thorne Bay
Vehicle Availability by Sex in Thorne Bay
The most prevalent vehicle ownership categories in Thorne Bay are males with 1 vehicle (32, accounting for 29.6%) and females with 1 vehicle (16, making up 31.1%).
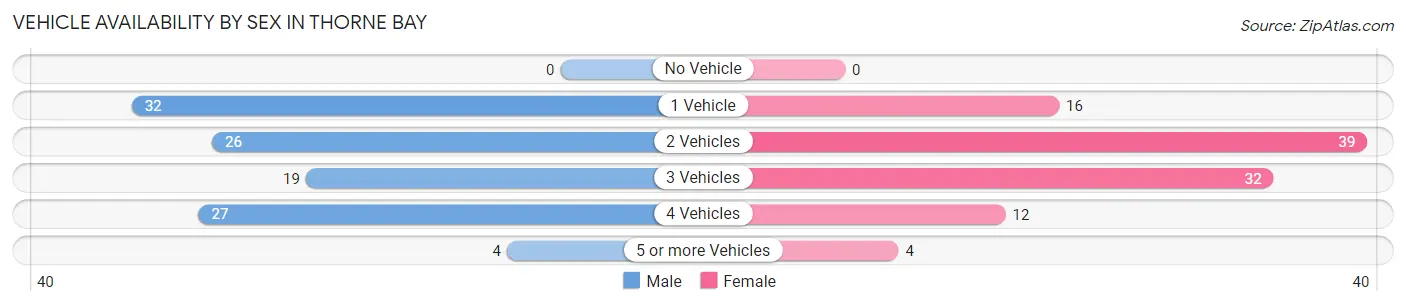
| Vehicles Available | Male | Female |
| No Vehicle | 0 (0.0%) | 0 (0.0%) |
| 1 Vehicle | 32 (29.6%) | 16 (15.5%) |
| 2 Vehicles | 26 (24.1%) | 39 (37.9%) |
| 3 Vehicles | 19 (17.6%) | 32 (31.1%) |
| 4 Vehicles | 27 (25.0%) | 12 (11.7%) |
| 5 or more Vehicles | 4 (3.7%) | 4 (3.9%) |
| Total | 108 (100.0%) | 103 (100.0%) |
Commute Time in Thorne Bay
The most frequently occuring commute durations in Thorne Bay are less than 5 minutes (87 commuters, 43.3%), 5 to 9 minutes (53 commuters, 26.4%), and 60 to 89 minutes (22 commuters, 11.0%).
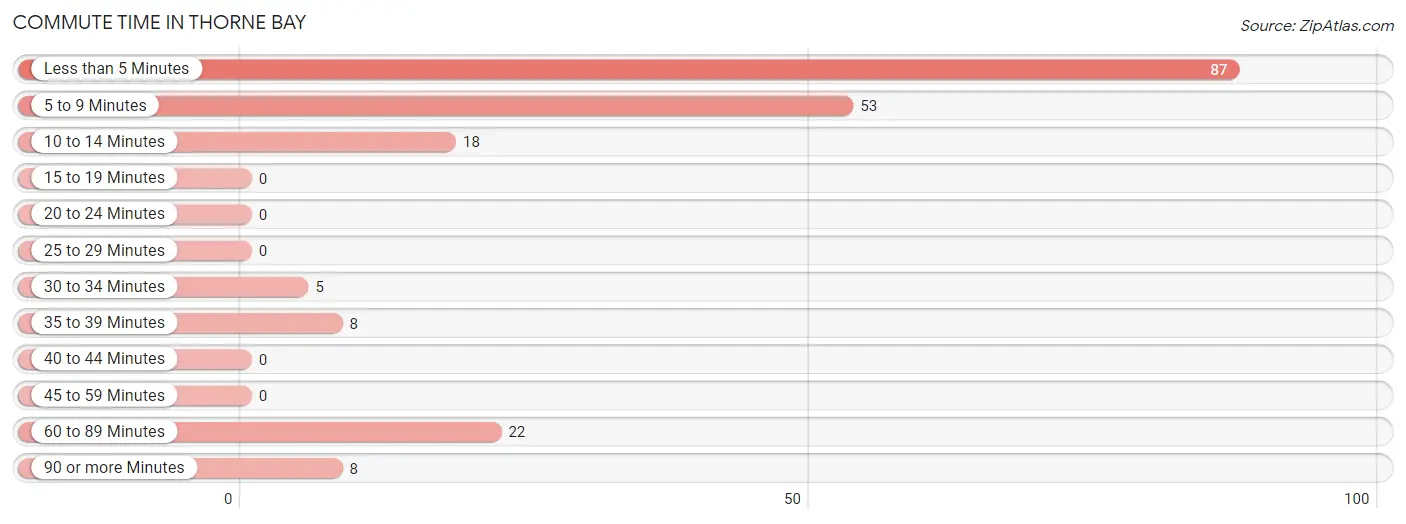
| Commute Time | # Commuters | % Commuters |
| Less than 5 Minutes | 87 | 43.3% |
| 5 to 9 Minutes | 53 | 26.4% |
| 10 to 14 Minutes | 18 | 9.0% |
| 15 to 19 Minutes | 0 | 0.0% |
| 20 to 24 Minutes | 0 | 0.0% |
| 25 to 29 Minutes | 0 | 0.0% |
| 30 to 34 Minutes | 5 | 2.5% |
| 35 to 39 Minutes | 8 | 4.0% |
| 40 to 44 Minutes | 0 | 0.0% |
| 45 to 59 Minutes | 0 | 0.0% |
| 60 to 89 Minutes | 22 | 11.0% |
| 90 or more Minutes | 8 | 4.0% |
Commute Time by Sex in Thorne Bay
The most common commute times in Thorne Bay are less than 5 minutes (55 commuters, 53.9%) for males and less than 5 minutes (32 commuters, 32.3%) for females.
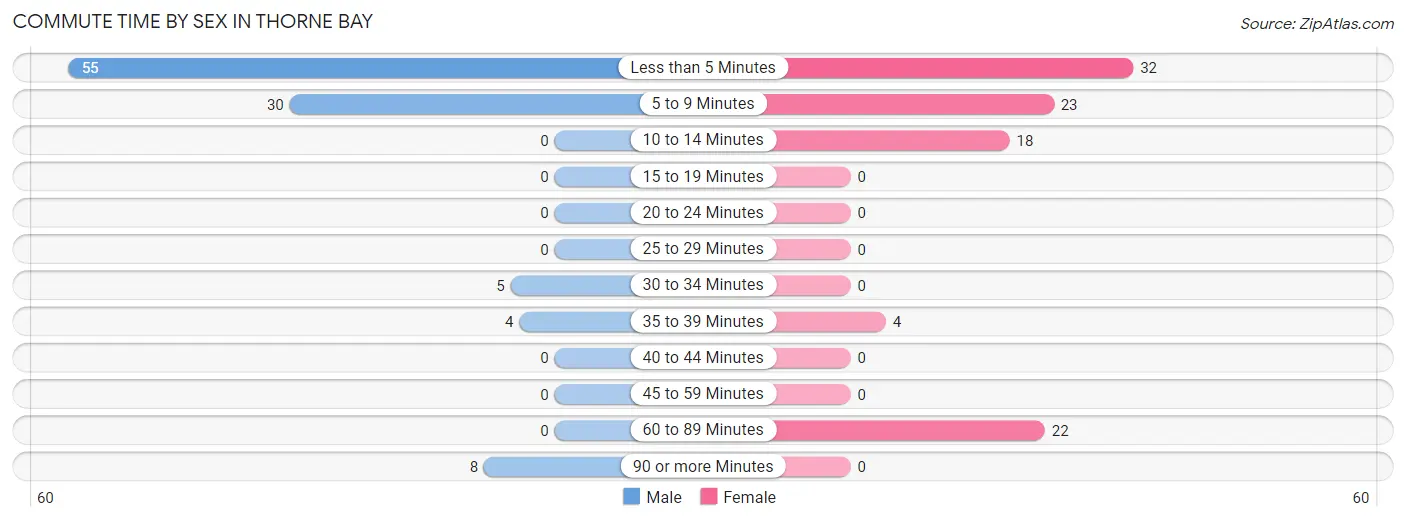
| Commute Time | Male | Female |
| Less than 5 Minutes | 55 (53.9%) | 32 (32.3%) |
| 5 to 9 Minutes | 30 (29.4%) | 23 (23.2%) |
| 10 to 14 Minutes | 0 (0.0%) | 18 (18.2%) |
| 15 to 19 Minutes | 0 (0.0%) | 0 (0.0%) |
| 20 to 24 Minutes | 0 (0.0%) | 0 (0.0%) |
| 25 to 29 Minutes | 0 (0.0%) | 0 (0.0%) |
| 30 to 34 Minutes | 5 (4.9%) | 0 (0.0%) |
| 35 to 39 Minutes | 4 (3.9%) | 4 (4.0%) |
| 40 to 44 Minutes | 0 (0.0%) | 0 (0.0%) |
| 45 to 59 Minutes | 0 (0.0%) | 0 (0.0%) |
| 60 to 89 Minutes | 0 (0.0%) | 22 (22.2%) |
| 90 or more Minutes | 8 (7.8%) | 0 (0.0%) |
Time of Departure to Work by Sex in Thorne Bay
The most frequent times of departure to work in Thorne Bay are 6:30 AM to 6:59 AM (39, 38.2%) for males and 7:00 AM to 7:29 AM (31, 31.3%) for females.

| Time of Departure | Male | Female |
| 12:00 AM to 4:59 AM | 0 (0.0%) | 0 (0.0%) |
| 5:00 AM to 5:29 AM | 0 (0.0%) | 0 (0.0%) |
| 5:30 AM to 5:59 AM | 0 (0.0%) | 0 (0.0%) |
| 6:00 AM to 6:29 AM | 0 (0.0%) | 10 (10.1%) |
| 6:30 AM to 6:59 AM | 39 (38.2%) | 22 (22.2%) |
| 7:00 AM to 7:29 AM | 32 (31.4%) | 31 (31.3%) |
| 7:30 AM to 7:59 AM | 22 (21.6%) | 9 (9.1%) |
| 8:00 AM to 8:29 AM | 0 (0.0%) | 2 (2.0%) |
| 8:30 AM to 8:59 AM | 0 (0.0%) | 5 (5.1%) |
| 9:00 AM to 9:59 AM | 1 (1.0%) | 7 (7.1%) |
| 10:00 AM to 10:59 AM | 0 (0.0%) | 9 (9.1%) |
| 11:00 AM to 11:59 AM | 0 (0.0%) | 0 (0.0%) |
| 12:00 PM to 3:59 PM | 8 (7.8%) | 4 (4.0%) |
| 4:00 PM to 11:59 PM | 0 (0.0%) | 0 (0.0%) |
| Total | 102 (100.0%) | 99 (100.0%) |
Housing Occupancy in Thorne Bay
Occupancy by Ownership in Thorne Bay
Of the total 227 dwellings in Thorne Bay, owner-occupied units account for 156 (68.7%), while renter-occupied units make up 71 (31.3%).
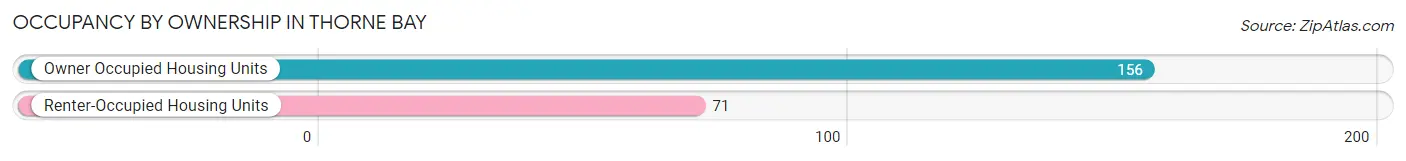
| Occupancy | # Housing Units | % Housing Units |
| Owner Occupied Housing Units | 156 | 68.7% |
| Renter-Occupied Housing Units | 71 | 31.3% |
| Total Occupied Housing Units | 227 | 100.0% |
Occupancy by Household Size in Thorne Bay
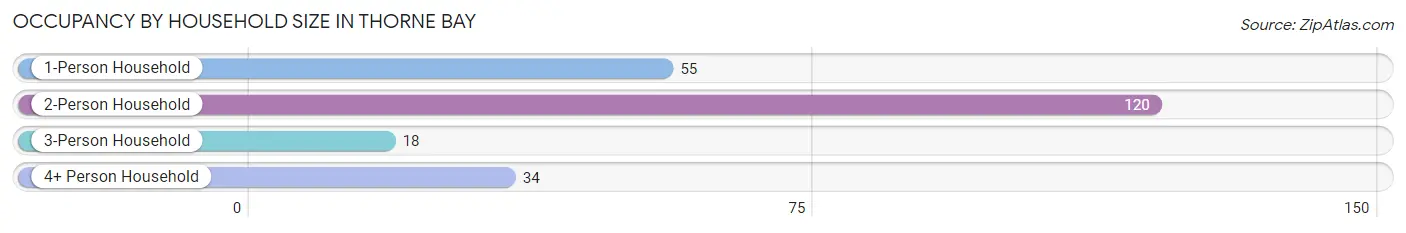
| Household Size | # Housing Units | % Housing Units |
| 1-Person Household | 55 | 24.2% |
| 2-Person Household | 120 | 52.9% |
| 3-Person Household | 18 | 7.9% |
| 4+ Person Household | 34 | 15.0% |
| Total Housing Units | 227 | 100.0% |
Occupancy by Ownership by Household Size in Thorne Bay
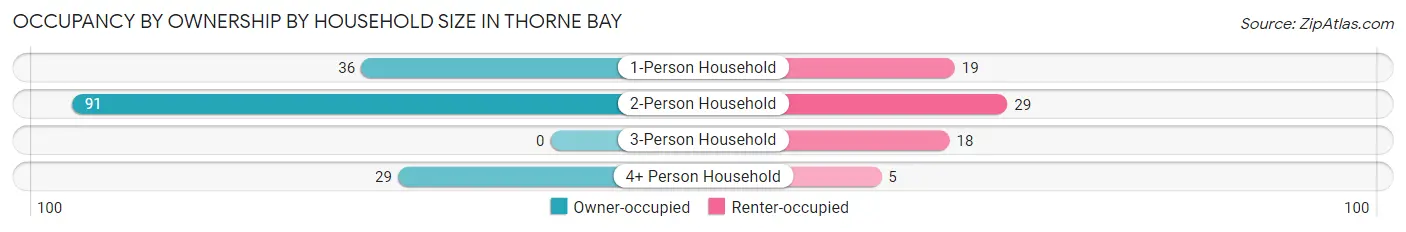
| Household Size | Owner-occupied | Renter-occupied |
| 1-Person Household | 36 (65.4%) | 19 (34.5%) |
| 2-Person Household | 91 (75.8%) | 29 (24.2%) |
| 3-Person Household | 0 (0.0%) | 18 (100.0%) |
| 4+ Person Household | 29 (85.3%) | 5 (14.7%) |
| Total Housing Units | 156 (68.7%) | 71 (31.3%) |
Occupancy by Educational Attainment in Thorne Bay
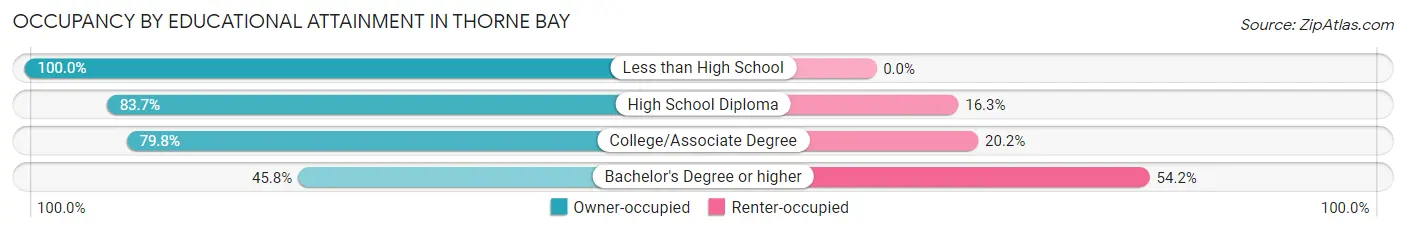
| Household Size | Owner-occupied | Renter-occupied |
| Less than High School | 7 (100.0%) | 0 (0.0%) |
| High School Diploma | 36 (83.7%) | 7 (16.3%) |
| College/Associate Degree | 75 (79.8%) | 19 (20.2%) |
| Bachelor's Degree or higher | 38 (45.8%) | 45 (54.2%) |
Occupancy by Age of Householder in Thorne Bay
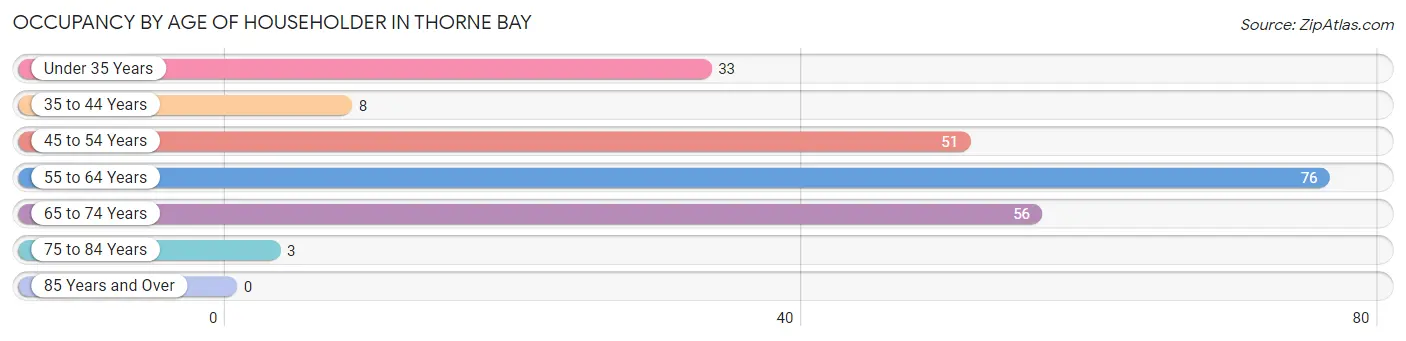
| Age Bracket | # Households | % Households |
| Under 35 Years | 33 | 14.5% |
| 35 to 44 Years | 8 | 3.5% |
| 45 to 54 Years | 51 | 22.5% |
| 55 to 64 Years | 76 | 33.5% |
| 65 to 74 Years | 56 | 24.7% |
| 75 to 84 Years | 3 | 1.3% |
| 85 Years and Over | 0 | 0.0% |
| Total | 227 | 100.0% |
Housing Finances in Thorne Bay
Median Income by Occupancy in Thorne Bay
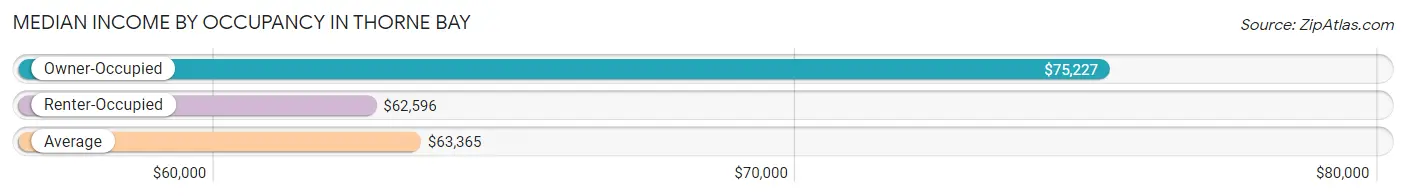
| Occupancy Type | # Households | Median Income |
| Owner-Occupied | 156 (68.7%) | $75,227 |
| Renter-Occupied | 71 (31.3%) | $62,596 |
| Average | 227 (100.0%) | $63,365 |
Occupancy by Householder Income Bracket in Thorne Bay
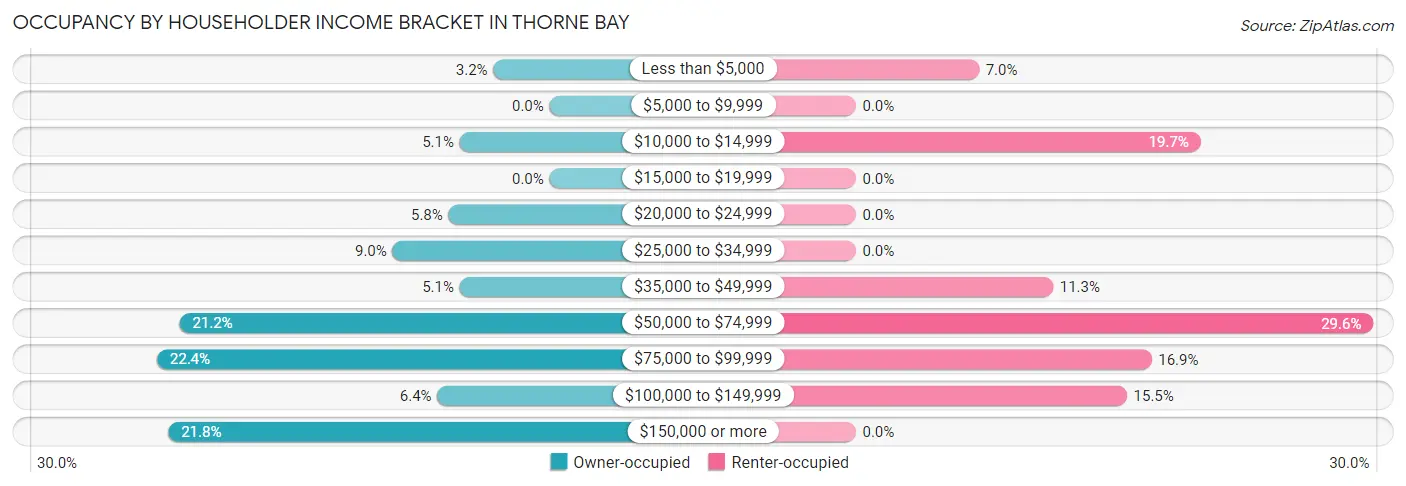
| Income Bracket | Owner-occupied | Renter-occupied |
| Less than $5,000 | 5 (3.2%) | 5 (7.0%) |
| $5,000 to $9,999 | 0 (0.0%) | 0 (0.0%) |
| $10,000 to $14,999 | 8 (5.1%) | 14 (19.7%) |
| $15,000 to $19,999 | 0 (0.0%) | 0 (0.0%) |
| $20,000 to $24,999 | 9 (5.8%) | 0 (0.0%) |
| $25,000 to $34,999 | 14 (9.0%) | 0 (0.0%) |
| $35,000 to $49,999 | 8 (5.1%) | 8 (11.3%) |
| $50,000 to $74,999 | 33 (21.1%) | 21 (29.6%) |
| $75,000 to $99,999 | 35 (22.4%) | 12 (16.9%) |
| $100,000 to $149,999 | 10 (6.4%) | 11 (15.5%) |
| $150,000 or more | 34 (21.8%) | 0 (0.0%) |
| Total | 156 (100.0%) | 71 (100.0%) |
Monthly Housing Cost Tiers in Thorne Bay
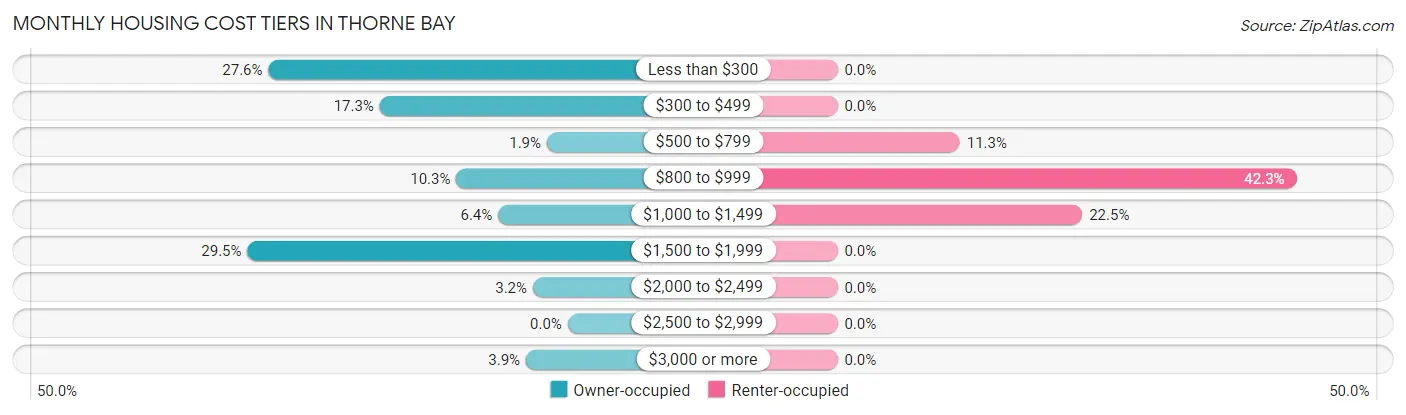
| Monthly Cost | Owner-occupied | Renter-occupied |
| Less than $300 | 43 (27.6%) | 0 (0.0%) |
| $300 to $499 | 27 (17.3%) | 0 (0.0%) |
| $500 to $799 | 3 (1.9%) | 8 (11.3%) |
| $800 to $999 | 16 (10.3%) | 30 (42.2%) |
| $1,000 to $1,499 | 10 (6.4%) | 16 (22.5%) |
| $1,500 to $1,999 | 46 (29.5%) | 0 (0.0%) |
| $2,000 to $2,499 | 5 (3.2%) | 0 (0.0%) |
| $2,500 to $2,999 | 0 (0.0%) | 0 (0.0%) |
| $3,000 or more | 6 (3.8%) | 0 (0.0%) |
| Total | 156 (100.0%) | 71 (100.0%) |
Physical Housing Characteristics in Thorne Bay
Housing Structures in Thorne Bay
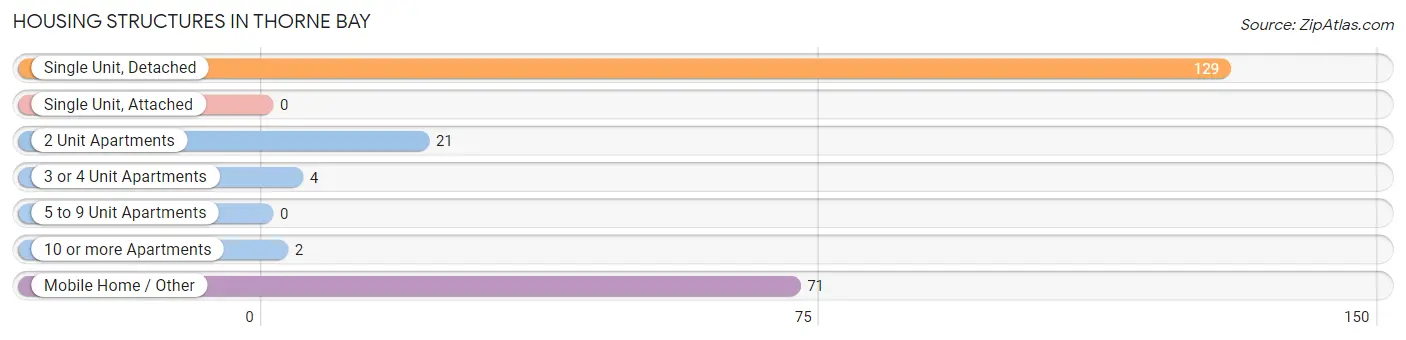
| Structure Type | # Housing Units | % Housing Units |
| Single Unit, Detached | 129 | 56.8% |
| Single Unit, Attached | 0 | 0.0% |
| 2 Unit Apartments | 21 | 9.2% |
| 3 or 4 Unit Apartments | 4 | 1.8% |
| 5 to 9 Unit Apartments | 0 | 0.0% |
| 10 or more Apartments | 2 | 0.9% |
| Mobile Home / Other | 71 | 31.3% |
| Total | 227 | 100.0% |
Housing Structures by Occupancy in Thorne Bay
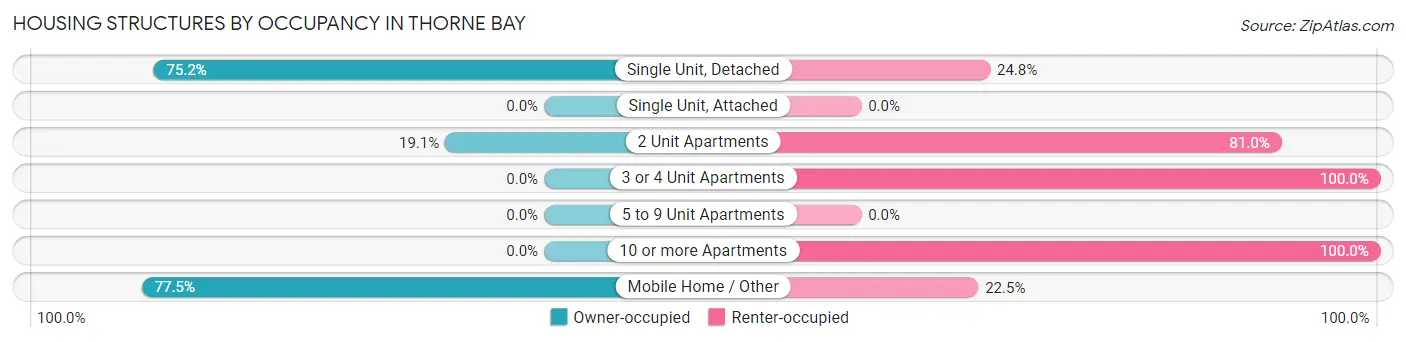
| Structure Type | Owner-occupied | Renter-occupied |
| Single Unit, Detached | 97 (75.2%) | 32 (24.8%) |
| Single Unit, Attached | 0 (0.0%) | 0 (0.0%) |
| 2 Unit Apartments | 4 (19.1%) | 17 (80.9%) |
| 3 or 4 Unit Apartments | 0 (0.0%) | 4 (100.0%) |
| 5 to 9 Unit Apartments | 0 (0.0%) | 0 (0.0%) |
| 10 or more Apartments | 0 (0.0%) | 2 (100.0%) |
| Mobile Home / Other | 55 (77.5%) | 16 (22.5%) |
| Total | 156 (68.7%) | 71 (31.3%) |
Housing Structures by Number of Rooms in Thorne Bay
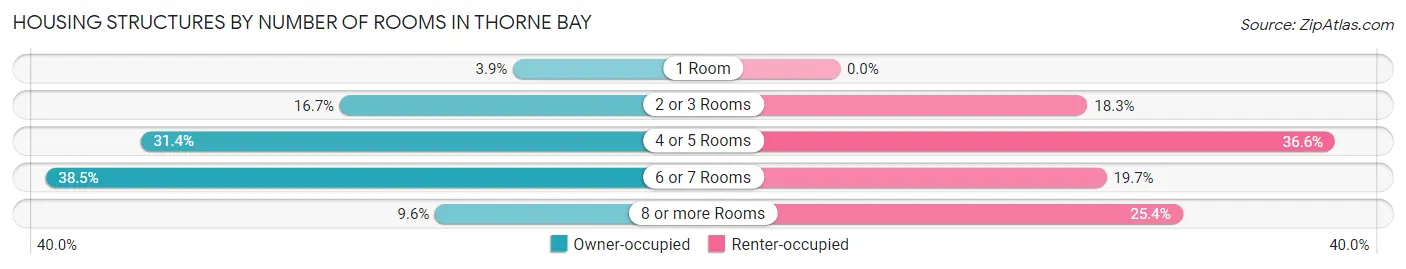
| Number of Rooms | Owner-occupied | Renter-occupied |
| 1 Room | 6 (3.8%) | 0 (0.0%) |
| 2 or 3 Rooms | 26 (16.7%) | 13 (18.3%) |
| 4 or 5 Rooms | 49 (31.4%) | 26 (36.6%) |
| 6 or 7 Rooms | 60 (38.5%) | 14 (19.7%) |
| 8 or more Rooms | 15 (9.6%) | 18 (25.4%) |
| Total | 156 (100.0%) | 71 (100.0%) |
Housing Structure by Heating Type in Thorne Bay
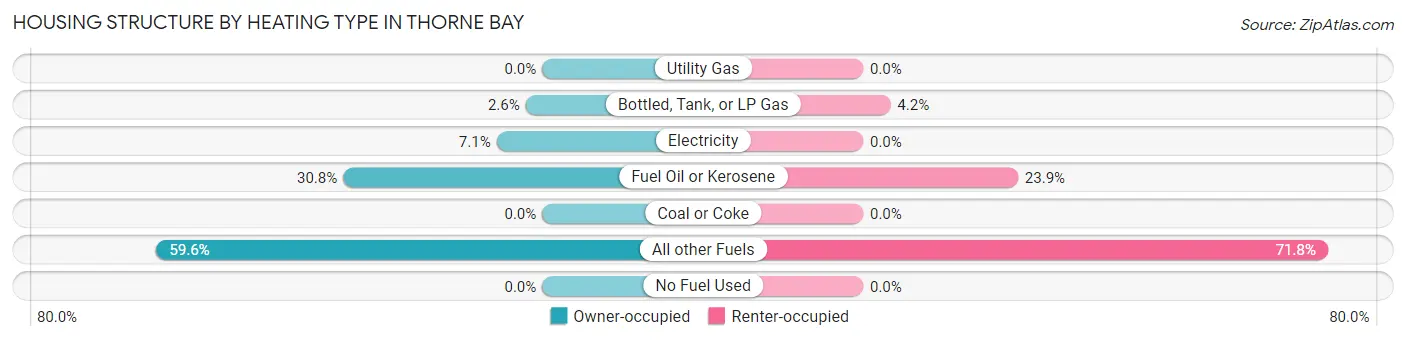
| Heating Type | Owner-occupied | Renter-occupied |
| Utility Gas | 0 (0.0%) | 0 (0.0%) |
| Bottled, Tank, or LP Gas | 4 (2.6%) | 3 (4.2%) |
| Electricity | 11 (7.0%) | 0 (0.0%) |
| Fuel Oil or Kerosene | 48 (30.8%) | 17 (23.9%) |
| Coal or Coke | 0 (0.0%) | 0 (0.0%) |
| All other Fuels | 93 (59.6%) | 51 (71.8%) |
| No Fuel Used | 0 (0.0%) | 0 (0.0%) |
| Total | 156 (100.0%) | 71 (100.0%) |
Household Vehicle Usage in Thorne Bay
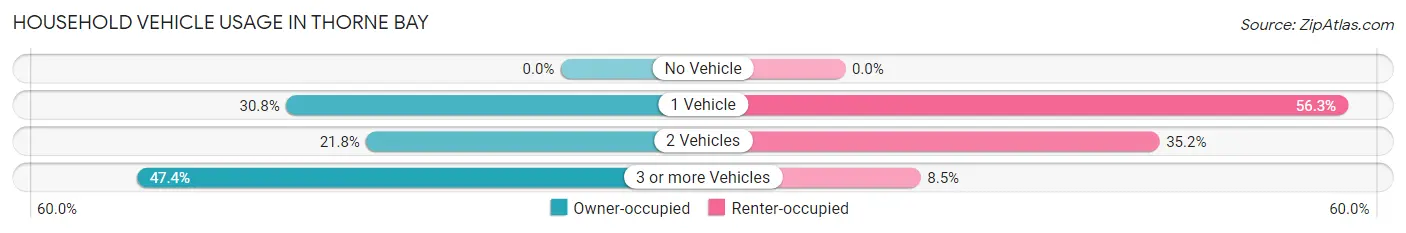
| Vehicles per Household | Owner-occupied | Renter-occupied |
| No Vehicle | 0 (0.0%) | 0 (0.0%) |
| 1 Vehicle | 48 (30.8%) | 40 (56.3%) |
| 2 Vehicles | 34 (21.8%) | 25 (35.2%) |
| 3 or more Vehicles | 74 (47.4%) | 6 (8.5%) |
| Total | 156 (100.0%) | 71 (100.0%) |
Real Estate & Mortgages in Thorne Bay
Real Estate and Mortgage Overview in Thorne Bay
| Characteristic | Without Mortgage | With Mortgage |
| Housing Units | 89 | 67 |
| Median Property Value | $178,100 | $331,300 |
| Median Household Income | $54,375 | $34 |
| Monthly Housing Costs | $361 | $6 |
| Real Estate Taxes | - | - |
Property Value by Mortgage Status in Thorne Bay
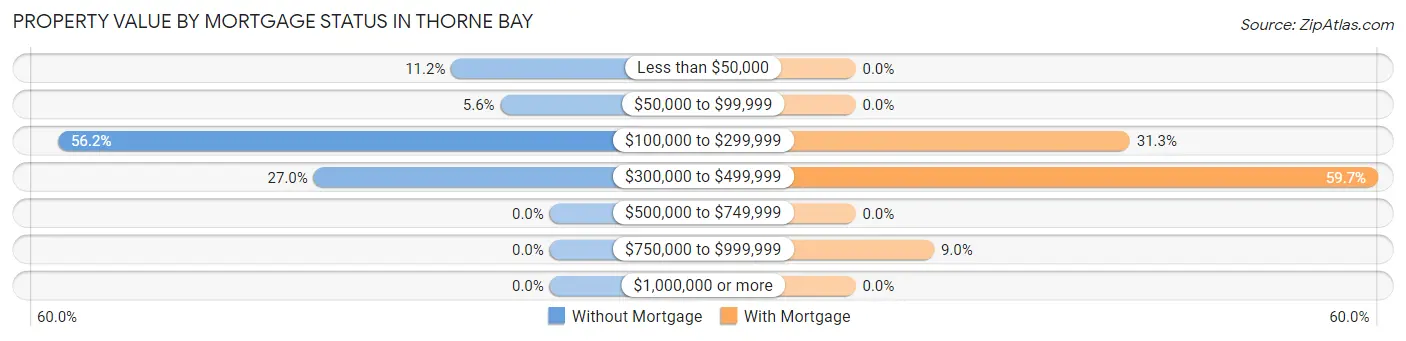
| Property Value | Without Mortgage | With Mortgage |
| Less than $50,000 | 10 (11.2%) | 0 (0.0%) |
| $50,000 to $99,999 | 5 (5.6%) | 0 (0.0%) |
| $100,000 to $299,999 | 50 (56.2%) | 21 (31.3%) |
| $300,000 to $499,999 | 24 (27.0%) | 40 (59.7%) |
| $500,000 to $749,999 | 0 (0.0%) | 0 (0.0%) |
| $750,000 to $999,999 | 0 (0.0%) | 6 (9.0%) |
| $1,000,000 or more | 0 (0.0%) | 0 (0.0%) |
| Total | 89 (100.0%) | 67 (100.0%) |
Household Income by Mortgage Status in Thorne Bay
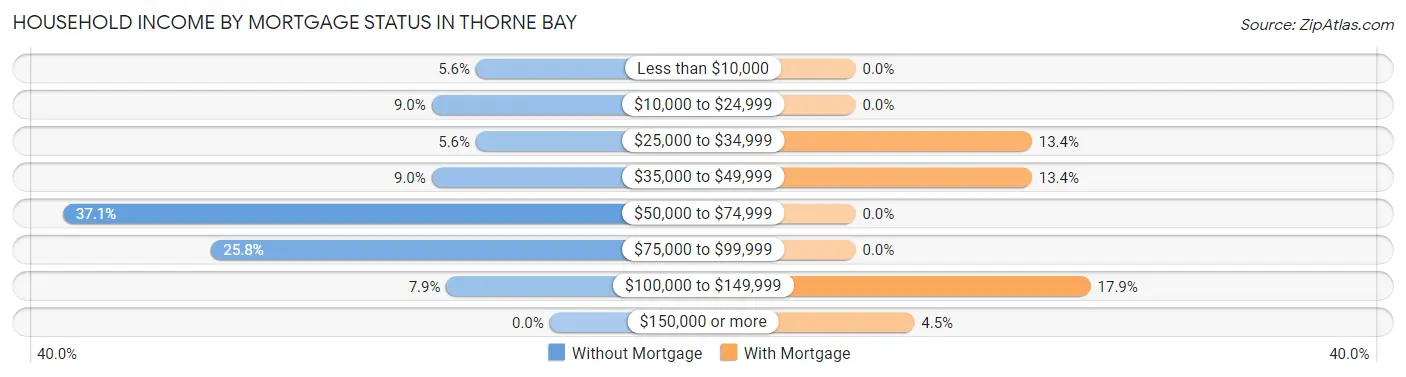
| Household Income | Without Mortgage | With Mortgage |
| Less than $10,000 | 5 (5.6%) | 0 (0.0%) |
| $10,000 to $24,999 | 8 (9.0%) | 0 (0.0%) |
| $25,000 to $34,999 | 5 (5.6%) | 9 (13.4%) |
| $35,000 to $49,999 | 8 (9.0%) | 9 (13.4%) |
| $50,000 to $74,999 | 33 (37.1%) | 0 (0.0%) |
| $75,000 to $99,999 | 23 (25.8%) | 0 (0.0%) |
| $100,000 to $149,999 | 7 (7.9%) | 12 (17.9%) |
| $150,000 or more | 0 (0.0%) | 3 (4.5%) |
| Total | 89 (100.0%) | 67 (100.0%) |
Property Value to Household Income Ratio in Thorne Bay
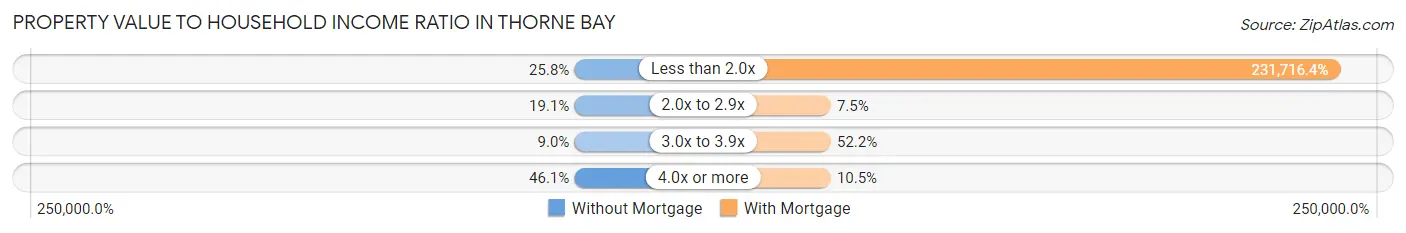
| Value-to-Income Ratio | Without Mortgage | With Mortgage |
| Less than 2.0x | 23 (25.8%) | 155,250 (231,716.4%) |
| 2.0x to 2.9x | 17 (19.1%) | 5 (7.5%) |
| 3.0x to 3.9x | 8 (9.0%) | 35 (52.2%) |
| 4.0x or more | 41 (46.1%) | 7 (10.4%) |
| Total | 89 (100.0%) | 67 (100.0%) |
Real Estate Taxes by Mortgage Status in Thorne Bay
| Property Taxes | Without Mortgage | With Mortgage |
| Less than $800 | 0 (0.0%) | 0 (0.0%) |
| $800 to $1,499 | 0 (0.0%) | 0 (0.0%) |
| $800 to $1,499 | 0 (0.0%) | 0 (0.0%) |
| Total | 89 (100.0%) | 67 (100.0%) |
Health & Disability in Thorne Bay
Health Insurance Coverage by Age in Thorne Bay
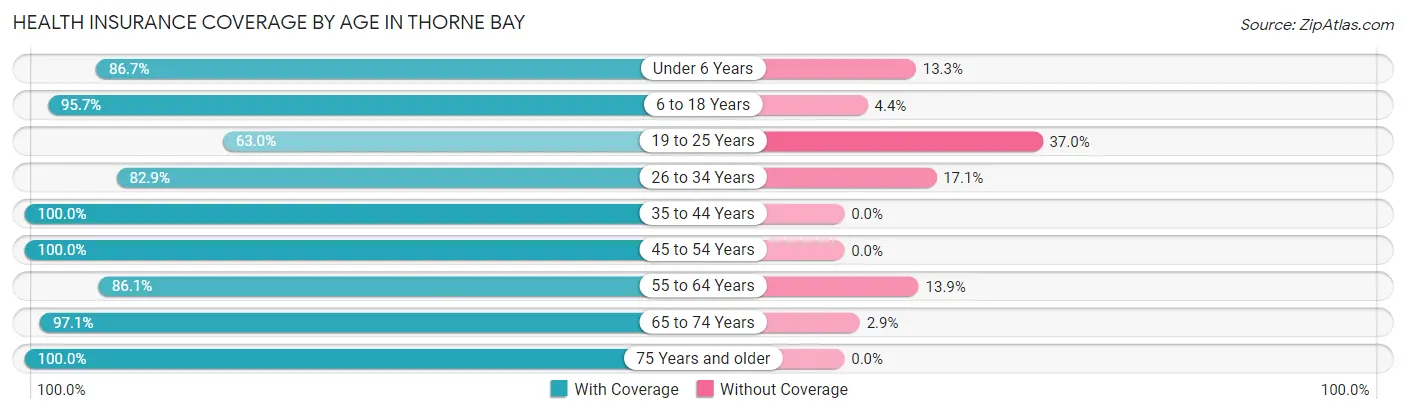
| Age Bracket | With Coverage | Without Coverage |
| Under 6 Years | 26 (86.7%) | 4 (13.3%) |
| 6 to 18 Years | 66 (95.7%) | 3 (4.3%) |
| 19 to 25 Years | 29 (63.0%) | 17 (37.0%) |
| 26 to 34 Years | 29 (82.9%) | 6 (17.1%) |
| 35 to 44 Years | 8 (100.0%) | 0 (0.0%) |
| 45 to 54 Years | 86 (100.0%) | 0 (0.0%) |
| 55 to 64 Years | 87 (86.1%) | 14 (13.9%) |
| 65 to 74 Years | 101 (97.1%) | 3 (2.9%) |
| 75 Years and older | 3 (100.0%) | 0 (0.0%) |
| Total | 435 (90.2%) | 47 (9.8%) |
Health Insurance Coverage by Citizenship Status in Thorne Bay
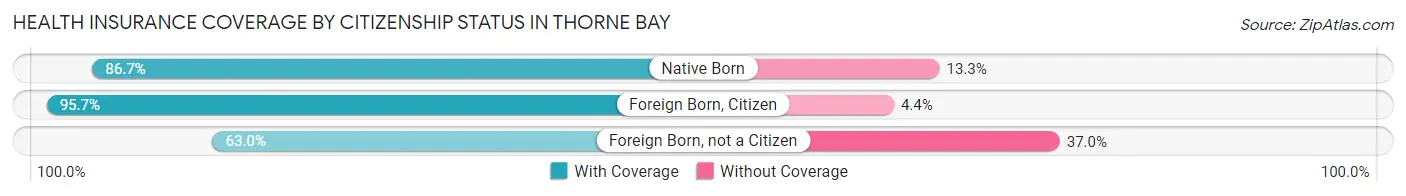
| Citizenship Status | With Coverage | Without Coverage |
| Native Born | 26 (86.7%) | 4 (13.3%) |
| Foreign Born, Citizen | 66 (95.7%) | 3 (4.3%) |
| Foreign Born, not a Citizen | 29 (63.0%) | 17 (37.0%) |
Health Insurance Coverage by Household Income in Thorne Bay
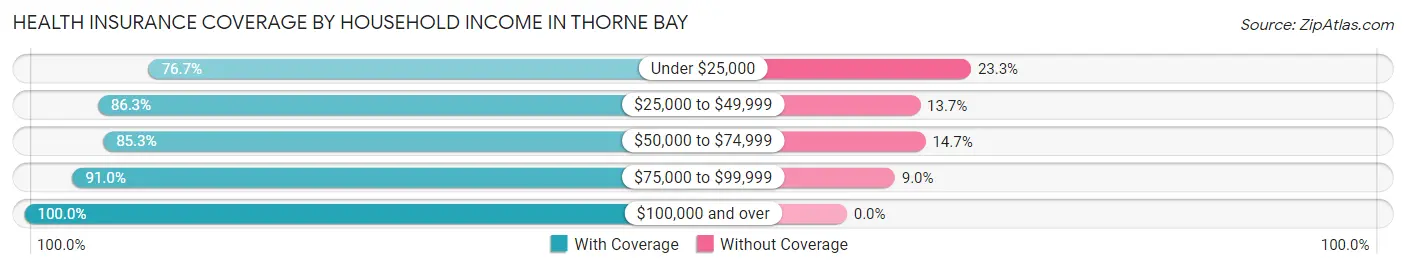
| Household Income | With Coverage | Without Coverage |
| Under $25,000 | 33 (76.7%) | 10 (23.3%) |
| $25,000 to $49,999 | 44 (86.3%) | 7 (13.7%) |
| $50,000 to $74,999 | 81 (85.3%) | 14 (14.7%) |
| $75,000 to $99,999 | 162 (91.0%) | 16 (9.0%) |
| $100,000 and over | 115 (100.0%) | 0 (0.0%) |
Public vs Private Health Insurance Coverage by Age in Thorne Bay
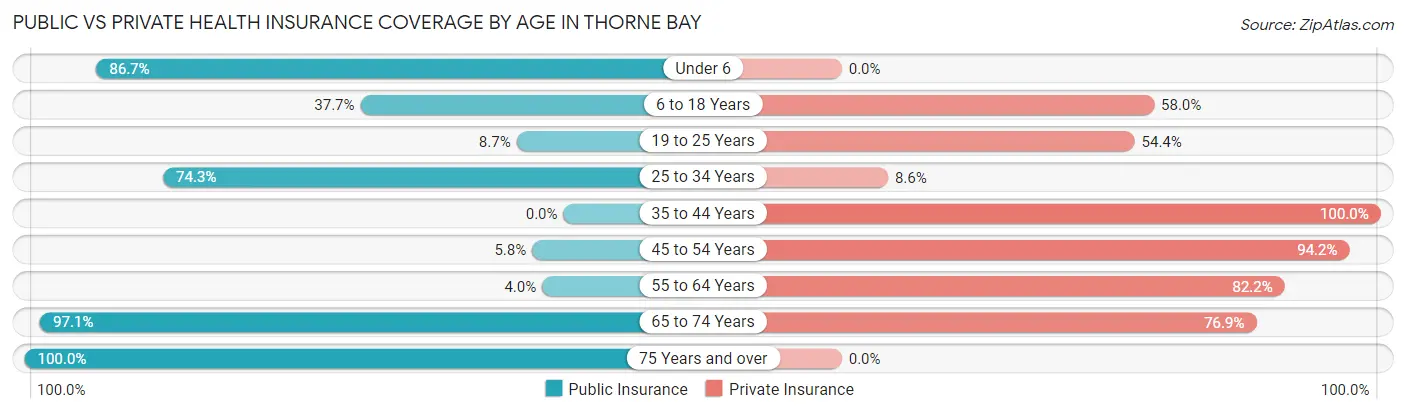
| Age Bracket | Public Insurance | Private Insurance |
| Under 6 | 26 (86.7%) | 0 (0.0%) |
| 6 to 18 Years | 26 (37.7%) | 40 (58.0%) |
| 19 to 25 Years | 4 (8.7%) | 25 (54.3%) |
| 25 to 34 Years | 26 (74.3%) | 3 (8.6%) |
| 35 to 44 Years | 0 (0.0%) | 8 (100.0%) |
| 45 to 54 Years | 5 (5.8%) | 81 (94.2%) |
| 55 to 64 Years | 4 (4.0%) | 83 (82.2%) |
| 65 to 74 Years | 101 (97.1%) | 80 (76.9%) |
| 75 Years and over | 3 (100.0%) | 0 (0.0%) |
| Total | 195 (40.5%) | 320 (66.4%) |
Disability Status by Sex by Age in Thorne Bay
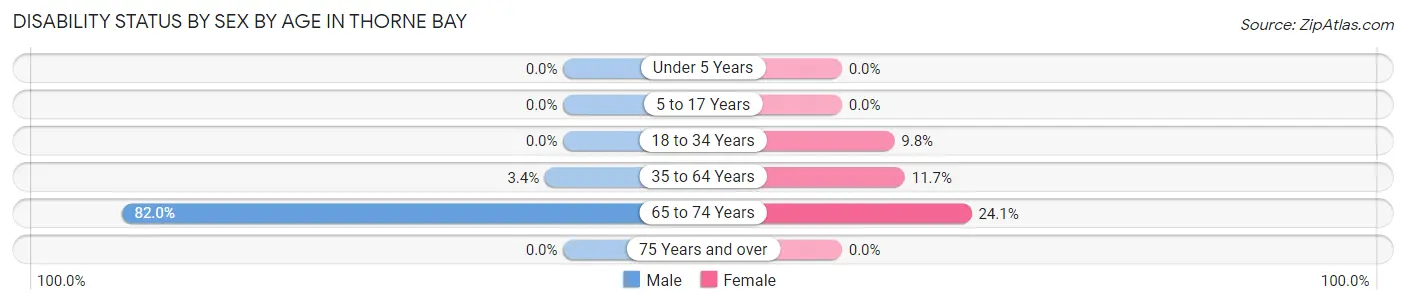
| Age Bracket | Male | Female |
| Under 5 Years | 0 (0.0%) | 0 (0.0%) |
| 5 to 17 Years | 0 (0.0%) | 0 (0.0%) |
| 18 to 34 Years | 0 (0.0%) | 4 (9.8%) |
| 35 to 64 Years | 4 (3.4%) | 9 (11.7%) |
| 65 to 74 Years | 41 (82.0%) | 13 (24.1%) |
| 75 Years and over | 0 (0.0%) | 0 (0.0%) |
Disability Class by Sex by Age in Thorne Bay
Disability Class: Hearing Difficulty
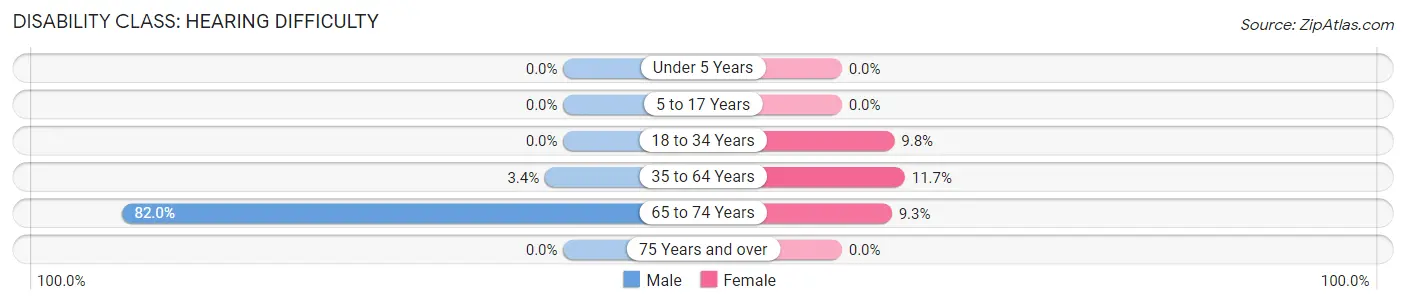
| Age Bracket | Male | Female |
| Under 5 Years | 0 (0.0%) | 0 (0.0%) |
| 5 to 17 Years | 0 (0.0%) | 0 (0.0%) |
| 18 to 34 Years | 0 (0.0%) | 4 (9.8%) |
| 35 to 64 Years | 4 (3.4%) | 9 (11.7%) |
| 65 to 74 Years | 41 (82.0%) | 5 (9.3%) |
| 75 Years and over | 0 (0.0%) | 0 (0.0%) |
Disability Class: Vision Difficulty
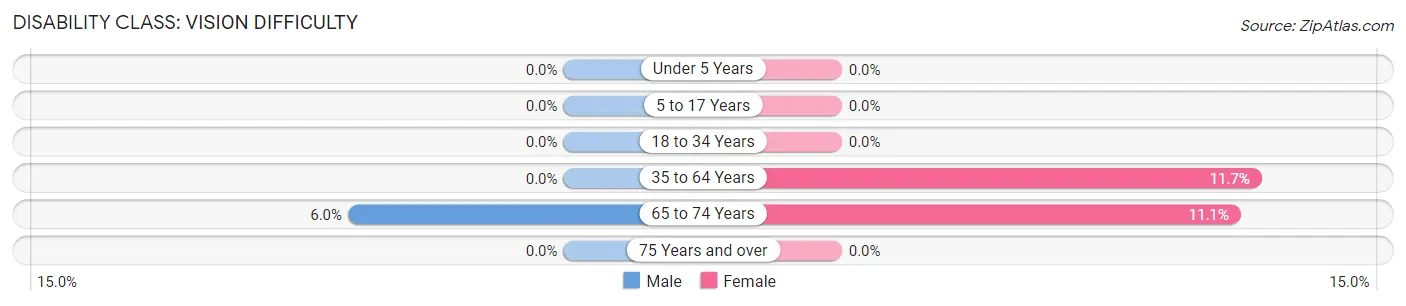
| Age Bracket | Male | Female |
| Under 5 Years | 0 (0.0%) | 0 (0.0%) |
| 5 to 17 Years | 0 (0.0%) | 0 (0.0%) |
| 18 to 34 Years | 0 (0.0%) | 0 (0.0%) |
| 35 to 64 Years | 0 (0.0%) | 9 (11.7%) |
| 65 to 74 Years | 3 (6.0%) | 6 (11.1%) |
| 75 Years and over | 0 (0.0%) | 0 (0.0%) |
Disability Class: Cognitive Difficulty
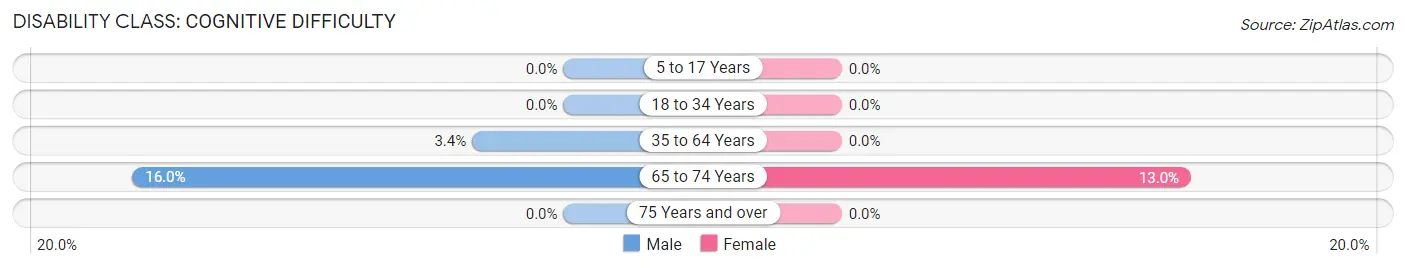
| Age Bracket | Male | Female |
| 5 to 17 Years | 0 (0.0%) | 0 (0.0%) |
| 18 to 34 Years | 0 (0.0%) | 0 (0.0%) |
| 35 to 64 Years | 4 (3.4%) | 0 (0.0%) |
| 65 to 74 Years | 8 (16.0%) | 7 (13.0%) |
| 75 Years and over | 0 (0.0%) | 0 (0.0%) |
Disability Class: Ambulatory Difficulty
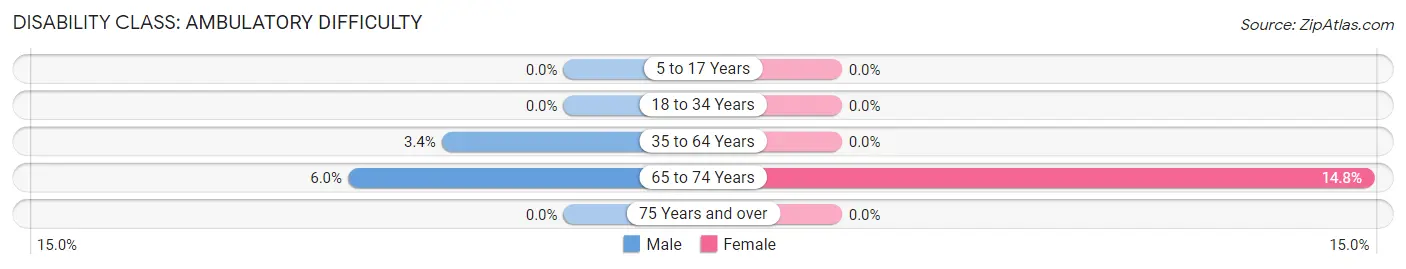
| Age Bracket | Male | Female |
| 5 to 17 Years | 0 (0.0%) | 0 (0.0%) |
| 18 to 34 Years | 0 (0.0%) | 0 (0.0%) |
| 35 to 64 Years | 4 (3.4%) | 0 (0.0%) |
| 65 to 74 Years | 3 (6.0%) | 8 (14.8%) |
| 75 Years and over | 0 (0.0%) | 0 (0.0%) |
Disability Class: Self-Care Difficulty
| Age Bracket | Male | Female |
| 5 to 17 Years | 0 (0.0%) | 0 (0.0%) |
| 18 to 34 Years | 0 (0.0%) | 0 (0.0%) |
| 35 to 64 Years | 0 (0.0%) | 0 (0.0%) |
| 65 to 74 Years | 0 (0.0%) | 0 (0.0%) |
| 75 Years and over | 0 (0.0%) | 0 (0.0%) |
Technology Access in Thorne Bay
Computing Device Access in Thorne Bay
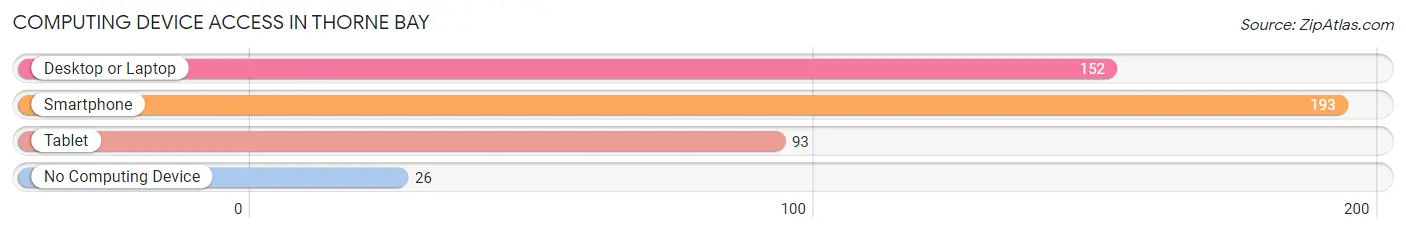
| Device Type | # Households | % Households |
| Desktop or Laptop | 152 | 67.0% |
| Smartphone | 193 | 85.0% |
| Tablet | 93 | 41.0% |
| No Computing Device | 26 | 11.5% |
| Total | 227 | 100.0% |
Internet Access in Thorne Bay
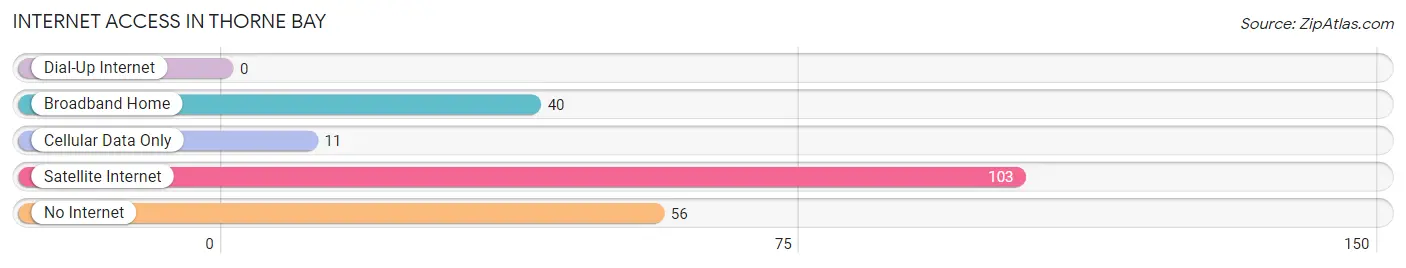
| Internet Type | # Households | % Households |
| Dial-Up Internet | 0 | 0.0% |
| Broadband Home | 40 | 17.6% |
| Cellular Data Only | 11 | 4.9% |
| Satellite Internet | 103 | 45.4% |
| No Internet | 56 | 24.7% |
| Total | 227 | 100.0% |
Thorne Bay Summary
Thorne Bay is a small city located on Prince of Wales Island in the state of Alaska. It is the largest city on the island and is located in the southeastern part of the island. The city is situated on the eastern shore of Thorne Bay, which is part of the Inside Passage. The city has a population of approximately 1,000 people and is the economic and cultural center of the island.
History
The area around Thorne Bay has been inhabited by the Tlingit people for thousands of years. The Tlingit people were the first to settle in the area and were known for their fishing and hunting skills. The first European settlers arrived in the area in the late 1800s and established a trading post. The trading post was used to trade goods with the Tlingit people and other Native American tribes in the area.
In the early 1900s, the area around Thorne Bay began to be developed for logging and fishing. The logging industry was the main source of employment for the area and the fishing industry provided a steady source of income. In the 1950s, the Alaska State Ferry System began to operate in the area, providing transportation to and from the island.
Geography
Thorne Bay is located on the eastern shore of Prince of Wales Island in the southeastern part of the island. The city is situated on the eastern shore of Thorne Bay, which is part of the Inside Passage. The city is surrounded by the Tongass National Forest and is located near the Wrangell-St. Elias National Park. The city is located approximately 40 miles from Ketchikan and is accessible by ferry or plane.
The climate in Thorne Bay is mild and temperate. The average temperature in the summer is around 60 degrees Fahrenheit and the average temperature in the winter is around 40 degrees Fahrenheit. The area receives an average of 40 inches of rain per year and the area is known for its lush vegetation and abundant wildlife.
Economy
The economy of Thorne Bay is largely based on the fishing and logging industries. The fishing industry is the main source of employment for the area and provides a steady source of income. The logging industry is also a major employer in the area and provides a steady source of income. The Alaska State Ferry System also provides transportation to and from the island and is a major source of employment.
The city also has a small tourism industry. The area is known for its abundant wildlife and lush vegetation and is a popular destination for outdoor enthusiasts. The city also has a few small shops and restaurants that cater to tourists.
Demographics
The population of Thorne Bay is approximately 1,000 people. The majority of the population is of Native American descent and the majority of the population speaks English as their primary language. The median household income in the city is approximately $50,000 and the median age is approximately 40 years old. The city has a high rate of poverty and the unemployment rate is approximately 8%.
Conclusion
Thorne Bay is a small city located on Prince of Wales Island in the state of Alaska. The city is the largest city on the island and is the economic and cultural center of the island. The city has a population of approximately 1,000 people and is largely based on the fishing and logging industries. The city also has a small tourism industry and is known for its abundant wildlife and lush vegetation. The median household income in the city is approximately $50,000 and the median age is approximately 40 years old. The city has a high rate of poverty and the unemployment rate is approximately 8%.
Common Questions
What is Per Capita Income in Thorne Bay?
Per Capita income in Thorne Bay is $30,905.
What is the Median Family Income in Thorne Bay?
Median Family Income in Thorne Bay is $83,333.
What is the Median Household income in Thorne Bay?
Median Household Income in Thorne Bay is $63,365.
What is Income or Wage Gap in Thorne Bay?
Income or Wage Gap in Thorne Bay is 22.8%.
Women in Thorne Bay earn 77.2 cents for every dollar earned by a man.
What is Inequality or Gini Index in Thorne Bay?
Inequality or Gini Index in Thorne Bay is 0.36.
What is the Total Population of Thorne Bay?
Total Population of Thorne Bay is 482.
What is the Total Male Population of Thorne Bay?
Total Male Population of Thorne Bay is 249.
What is the Total Female Population of Thorne Bay?
Total Female Population of Thorne Bay is 233.
What is the Ratio of Males per 100 Females in Thorne Bay?
There are 106.87 Males per 100 Females in Thorne Bay.
What is the Ratio of Females per 100 Males in Thorne Bay?
There are 93.57 Females per 100 Males in Thorne Bay.
What is the Median Population Age in Thorne Bay?
Median Population Age in Thorne Bay is 53.4 Years.
What is the Average Family Size in Thorne Bay
Average Family Size in Thorne Bay is 2.4 People.
What is the Average Household Size in Thorne Bay
Average Household Size in Thorne Bay is 2.1 People.
How Large is the Labor Force in Thorne Bay?
There are 225 People in the Labor Forcein in Thorne Bay.
What is the Percentage of People in the Labor Force in Thorne Bay?
55.6% of People are in the Labor Force in Thorne Bay.
What is the Unemployment Rate in Thorne Bay?
Unemployment Rate in Thorne Bay is 2.2%.