Kooskia, ID Map & Demographics
Kooskia Map
Kooskia Overview
$20,518
PER CAPITA INCOME
$45,156
AVG FAMILY INCOME
$37,292
AVG HOUSEHOLD INCOME
44.9%
WAGE / INCOME GAP [ % ]
55.1¢/ $1
WAGE / INCOME GAP [ $ ]
0.37
INEQUALITY / GINI INDEX
608
TOTAL POPULATION
312
MALE POPULATION
296
FEMALE POPULATION
105.41
MALES / 100 FEMALES
94.87
FEMALES / 100 MALES
56.0
MEDIAN AGE
2.9
AVG FAMILY SIZE
2.4
AVG HOUSEHOLD SIZE
157
LABOR FORCE [ PEOPLE ]
30.9%
PERCENT IN LABOR FORCE
4.5%
UNEMPLOYMENT RATE
Kooskia Zip Codes
Kooskia Area Codes
Income in Kooskia
Income Overview in Kooskia
Per Capita Income in Kooskia is $20,518, while median incomes of families and households are $45,156 and $37,292 respectively.
| Characteristic | Number | Measure |
| Per Capita Income | 608 | $20,518 |
| Median Family Income | 150 | $45,156 |
| Mean Family Income | 150 | $53,126 |
| Median Household Income | 249 | $37,292 |
| Mean Household Income | 249 | $46,068 |
| Income Deficit | 150 | $0 |
| Wage / Income Gap (%) | 608 | 44.93% |
| Wage / Income Gap ($) | 608 | 55.07¢ per $1 |
| Gini / Inequality Index | 608 | 0.37 |
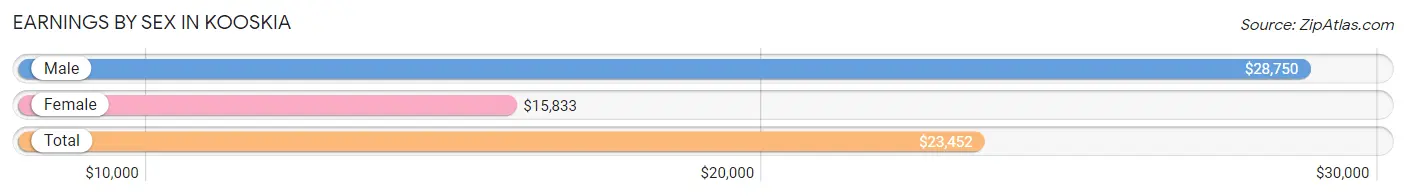
Earnings by Sex in Kooskia
Average Earnings in Kooskia are $23,452, $28,750 for men and $15,833 for women, a difference of 44.9%.
| Sex | Number | Average Earnings |
| Male | 88 (50.6%) | $28,750 |
| Female | 86 (49.4%) | $15,833 |
| Total | 174 (100.0%) | $23,452 |
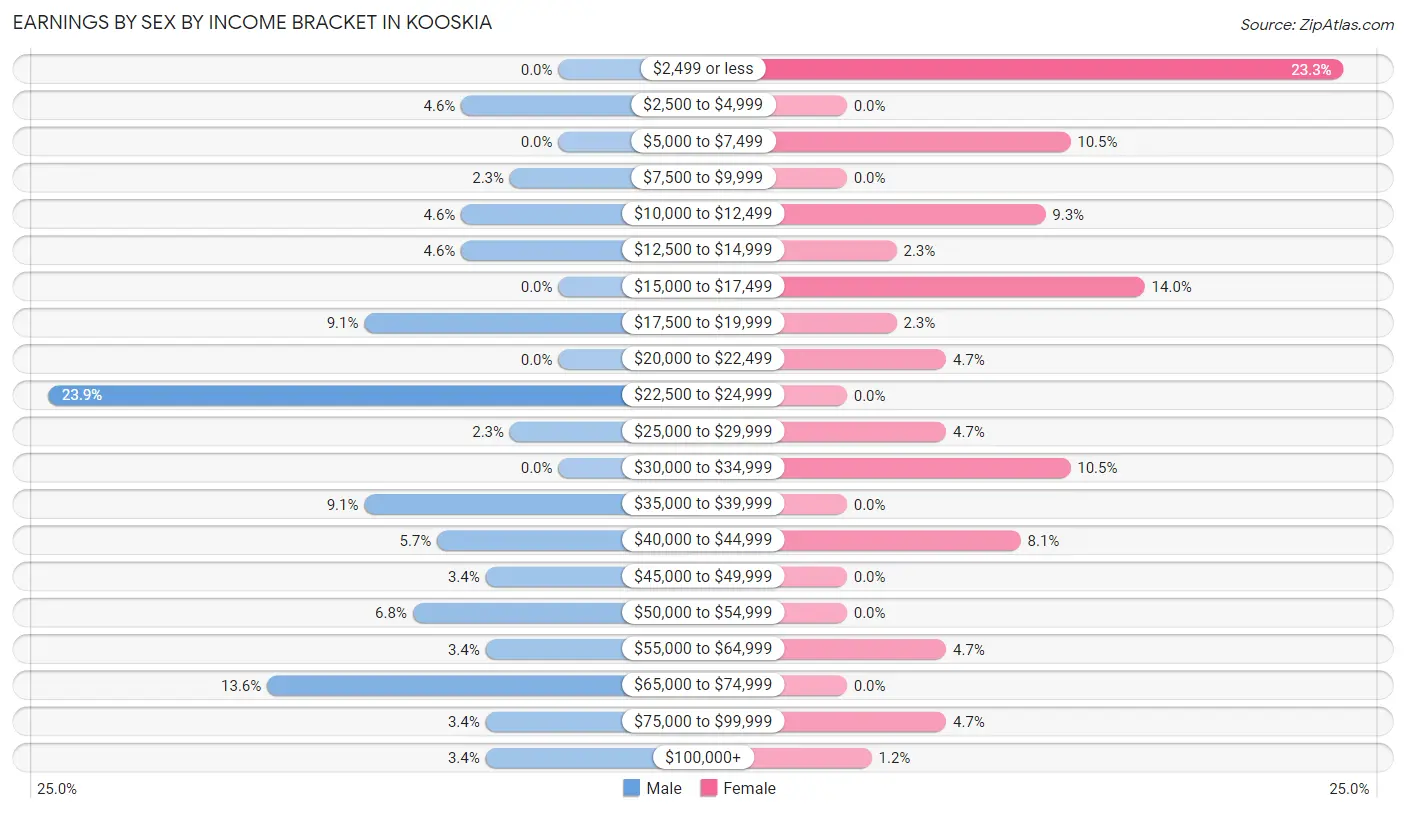
Earnings by Sex by Income Bracket in Kooskia
The most common earnings brackets in Kooskia are $22,500 to $24,999 for men (21 | 23.9%) and $2,499 or less for women (20 | 23.3%).
| Income | Male | Female |
| $2,499 or less | 0 (0.0%) | 20 (23.3%) |
| $2,500 to $4,999 | 4 (4.5%) | 0 (0.0%) |
| $5,000 to $7,499 | 0 (0.0%) | 9 (10.5%) |
| $7,500 to $9,999 | 2 (2.3%) | 0 (0.0%) |
| $10,000 to $12,499 | 4 (4.5%) | 8 (9.3%) |
| $12,500 to $14,999 | 4 (4.5%) | 2 (2.3%) |
| $15,000 to $17,499 | 0 (0.0%) | 12 (14.0%) |
| $17,500 to $19,999 | 8 (9.1%) | 2 (2.3%) |
| $20,000 to $22,499 | 0 (0.0%) | 4 (4.6%) |
| $22,500 to $24,999 | 21 (23.9%) | 0 (0.0%) |
| $25,000 to $29,999 | 2 (2.3%) | 4 (4.6%) |
| $30,000 to $34,999 | 0 (0.0%) | 9 (10.5%) |
| $35,000 to $39,999 | 8 (9.1%) | 0 (0.0%) |
| $40,000 to $44,999 | 5 (5.7%) | 7 (8.1%) |
| $45,000 to $49,999 | 3 (3.4%) | 0 (0.0%) |
| $50,000 to $54,999 | 6 (6.8%) | 0 (0.0%) |
| $55,000 to $64,999 | 3 (3.4%) | 4 (4.6%) |
| $65,000 to $74,999 | 12 (13.6%) | 0 (0.0%) |
| $75,000 to $99,999 | 3 (3.4%) | 4 (4.6%) |
| $100,000+ | 3 (3.4%) | 1 (1.2%) |
| Total | 88 (100.0%) | 86 (100.0%) |
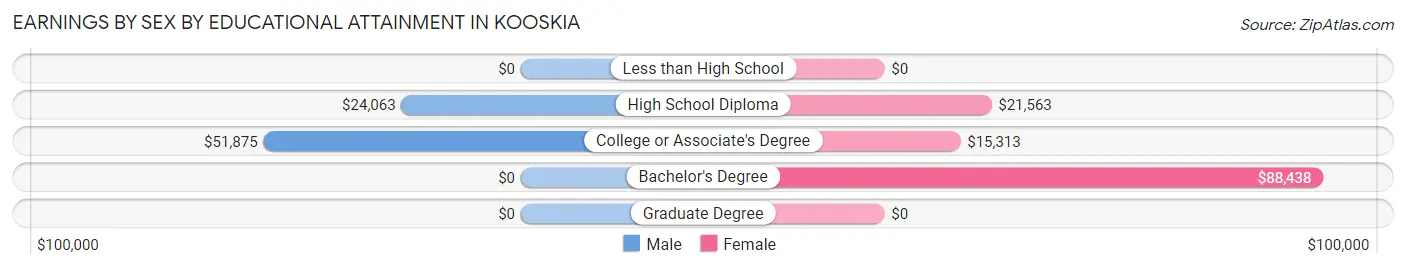
Earnings by Sex by Educational Attainment in Kooskia
Average earnings in Kooskia are $28,750 for men and $20,313 for women, a difference of 29.3%. Men with an educational attainment of college or associate's degree enjoy the highest average annual earnings of $51,875, while those with high school diploma education earn the least with $24,063. Women with an educational attainment of bachelor's degree earn the most with the average annual earnings of $88,438, while those with college or associate's degree education have the smallest earnings of $15,313.
| Educational Attainment | Male Income | Female Income |
| Less than High School | - | - |
| High School Diploma | $24,063 | $21,563 |
| College or Associate's Degree | $51,875 | $15,313 |
| Bachelor's Degree | - | - |
| Graduate Degree | - | - |
| Total | $28,750 | $20,313 |
Family Income in Kooskia
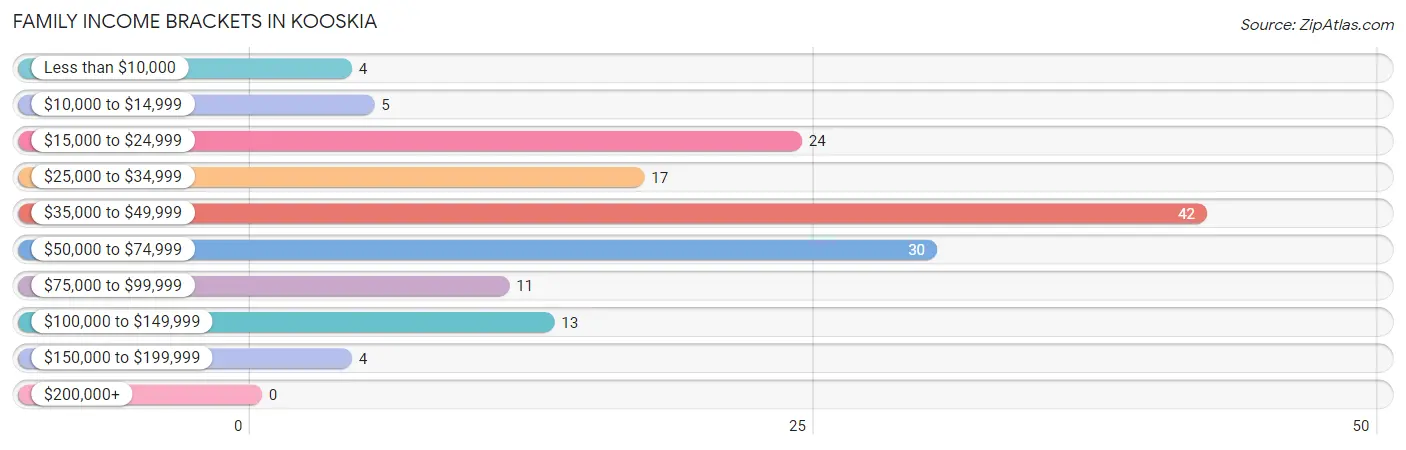
Family Income Brackets in Kooskia
According to the Kooskia family income data, there are 42 families falling into the $35,000 to $49,999 income range, which is the most common income bracket and makes up 28.0% of all families.
| Income Bracket | # Families | % Families |
| Less than $10,000 | 4 | 2.7% |
| $10,000 to $14,999 | 5 | 3.3% |
| $15,000 to $24,999 | 24 | 16.0% |
| $25,000 to $34,999 | 17 | 11.3% |
| $35,000 to $49,999 | 42 | 28.0% |
| $50,000 to $74,999 | 30 | 20.0% |
| $75,000 to $99,999 | 11 | 7.3% |
| $100,000 to $149,999 | 13 | 8.7% |
| $150,000 to $199,999 | 4 | 2.7% |
| $200,000+ | 0 | 0.0% |
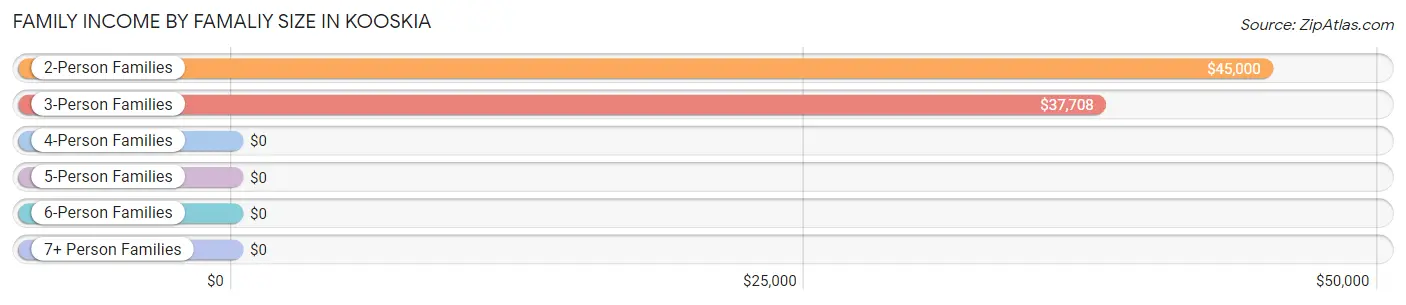
Family Income by Famaliy Size in Kooskia
2-person families (92 | 61.3%) account for the highest median family income in Kooskia with $45,000 per family, while 2-person families (92 | 61.3%) have the highest median income of $22,500 per family member.
| Income Bracket | # Families | Median Income |
| 2-Person Families | 92 (61.3%) | $45,000 |
| 3-Person Families | 35 (23.3%) | $37,708 |
| 4-Person Families | 14 (9.3%) | $0 |
| 5-Person Families | 6 (4.0%) | $0 |
| 6-Person Families | 3 (2.0%) | $0 |
| 7+ Person Families | 0 (0.0%) | $0 |
| Total | 150 (100.0%) | $45,156 |
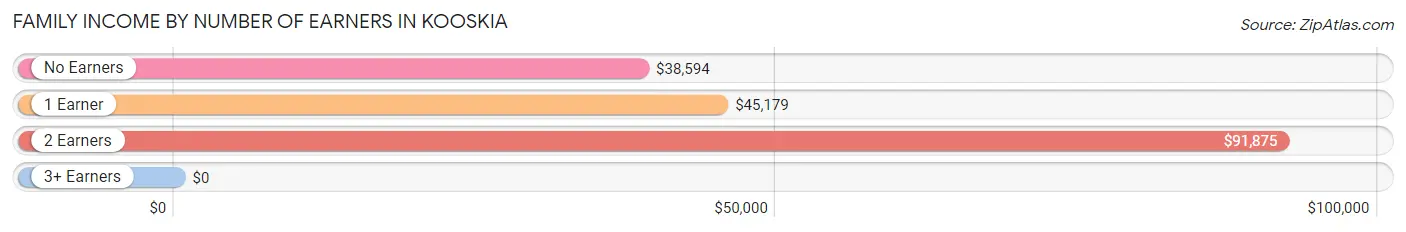
Family Income by Number of Earners in Kooskia
| Number of Earners | # Families | Median Income |
| No Earners | 59 (39.3%) | $38,594 |
| 1 Earner | 62 (41.3%) | $45,179 |
| 2 Earners | 29 (19.3%) | $91,875 |
| 3+ Earners | 0 (0.0%) | $0 |
| Total | 150 (100.0%) | $45,156 |
Household Income in Kooskia
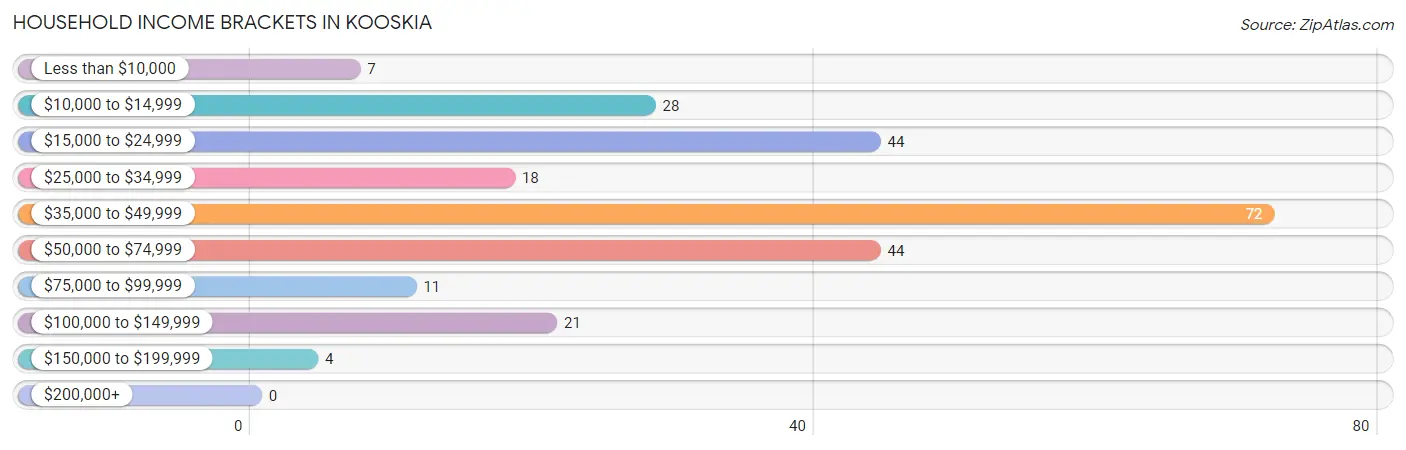
Household Income Brackets in Kooskia
With 72 households falling in the category, the $35,000 to $49,999 income range is the most frequent in Kooskia, accounting for 28.9% of all households.
| Income Bracket | # Households | % Households |
| Less than $10,000 | 7 | 2.8% |
| $10,000 to $14,999 | 28 | 11.2% |
| $15,000 to $24,999 | 44 | 17.7% |
| $25,000 to $34,999 | 18 | 7.2% |
| $35,000 to $49,999 | 72 | 28.9% |
| $50,000 to $74,999 | 44 | 17.7% |
| $75,000 to $99,999 | 11 | 4.4% |
| $100,000 to $149,999 | 21 | 8.4% |
| $150,000 to $199,999 | 4 | 1.6% |
| $200,000+ | 0 | 0.0% |
Household Income by Householder Age in Kooskia
The median household income in Kooskia is $37,292, with the highest median household income of $45,227 found in the 25 to 44 years age bracket for the primary householder. A total of 56 households (22.5%) fall into this category. Meanwhile, the 15 to 24 years age bracket for the primary householder has the lowest median household income of $0, with 3 households (1.2%) in this group.
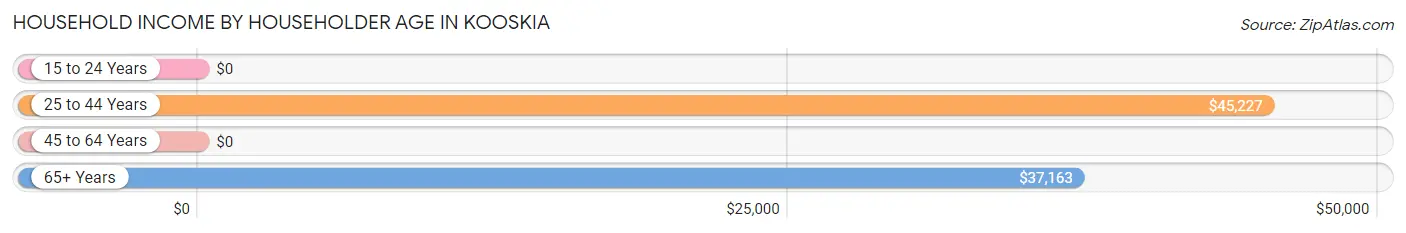
| Income Bracket | # Households | Median Income |
| 15 to 24 Years | 3 (1.2%) | $0 |
| 25 to 44 Years | 56 (22.5%) | $45,227 |
| 45 to 64 Years | 51 (20.5%) | $0 |
| 65+ Years | 139 (55.8%) | $37,163 |
| Total | 249 (100.0%) | $37,292 |
Poverty in Kooskia
Income Below Poverty by Sex and Age in Kooskia
With 16.7% poverty level for males and 16.9% for females among the residents of Kooskia, under 5 year old males and 5 year old females are the most vulnerable to poverty, with 6 males (100.0%) and 4 females (100.0%) in their respective age groups living below the poverty level.
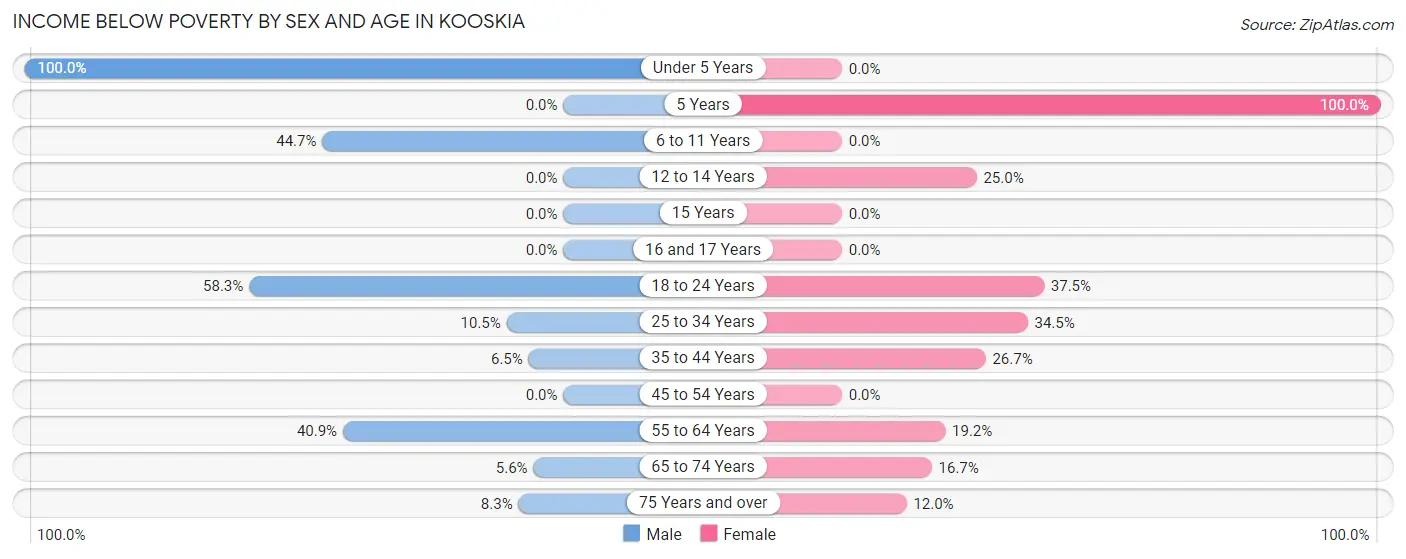
| Age Bracket | Male | Female |
| Under 5 Years | 6 (100.0%) | 0 (0.0%) |
| 5 Years | 0 (0.0%) | 4 (100.0%) |
| 6 to 11 Years | 17 (44.7%) | 0 (0.0%) |
| 12 to 14 Years | 0 (0.0%) | 1 (25.0%) |
| 15 Years | 0 (0.0%) | 0 (0.0%) |
| 16 and 17 Years | 0 (0.0%) | 0 (0.0%) |
| 18 to 24 Years | 7 (58.3%) | 3 (37.5%) |
| 25 to 34 Years | 2 (10.5%) | 10 (34.5%) |
| 35 to 44 Years | 2 (6.5%) | 4 (26.7%) |
| 45 to 54 Years | 0 (0.0%) | 0 (0.0%) |
| 55 to 64 Years | 9 (40.9%) | 14 (19.2%) |
| 65 to 74 Years | 7 (5.6%) | 11 (16.7%) |
| 75 Years and over | 2 (8.3%) | 3 (12.0%) |
| Total | 52 (16.7%) | 50 (16.9%) |
Income Above Poverty by Sex and Age in Kooskia
According to the poverty statistics in Kooskia, males aged 12 to 14 years and females aged under 5 years are the age groups that are most secure financially, with 100.0% of males and 100.0% of females in these age groups living above the poverty line.
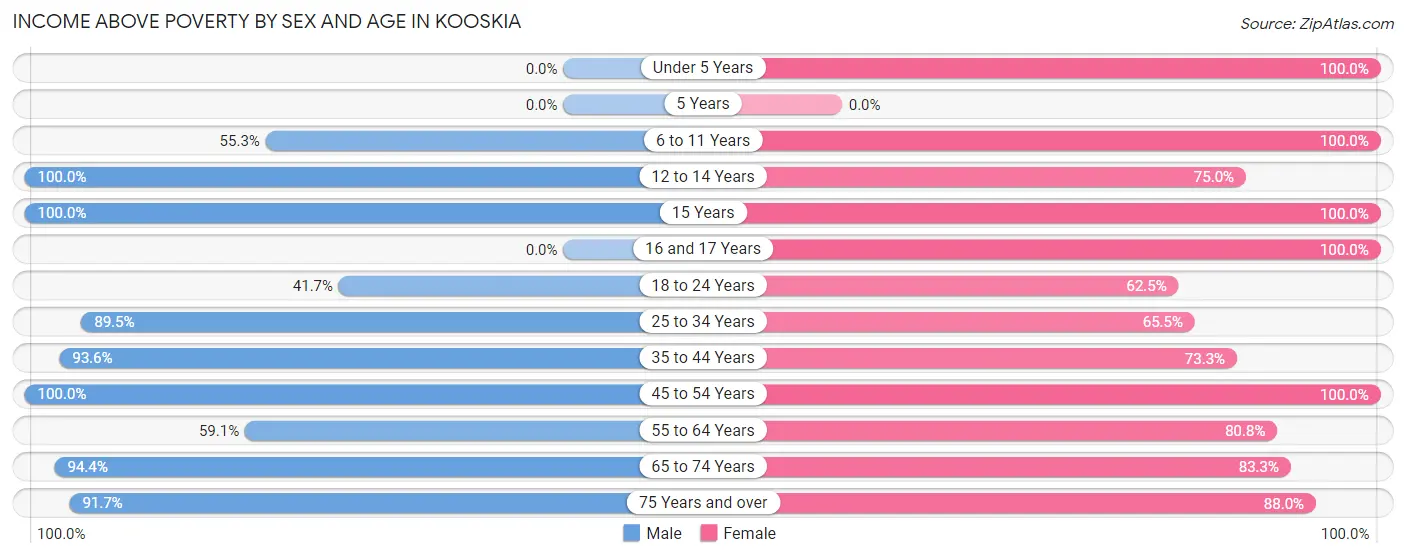
| Age Bracket | Male | Female |
| Under 5 Years | 0 (0.0%) | 16 (100.0%) |
| 5 Years | 0 (0.0%) | 0 (0.0%) |
| 6 to 11 Years | 21 (55.3%) | 9 (100.0%) |
| 12 to 14 Years | 1 (100.0%) | 3 (75.0%) |
| 15 Years | 7 (100.0%) | 15 (100.0%) |
| 16 and 17 Years | 0 (0.0%) | 21 (100.0%) |
| 18 to 24 Years | 5 (41.7%) | 5 (62.5%) |
| 25 to 34 Years | 17 (89.5%) | 19 (65.5%) |
| 35 to 44 Years | 29 (93.5%) | 11 (73.3%) |
| 45 to 54 Years | 26 (100.0%) | 11 (100.0%) |
| 55 to 64 Years | 13 (59.1%) | 59 (80.8%) |
| 65 to 74 Years | 119 (94.4%) | 55 (83.3%) |
| 75 Years and over | 22 (91.7%) | 22 (88.0%) |
| Total | 260 (83.3%) | 246 (83.1%) |
Income Below Poverty Among Married-Couple Families in Kooskia
The poverty statistics for married-couple families in Kooskia show that 4.7% or 5 of the total 107 families live below the poverty line. Families with no children have the highest poverty rate of 6.0%, comprising of 5 families. On the other hand, families with 1 or 2 children have the lowest poverty rate of 0.0%, which includes 0 families.
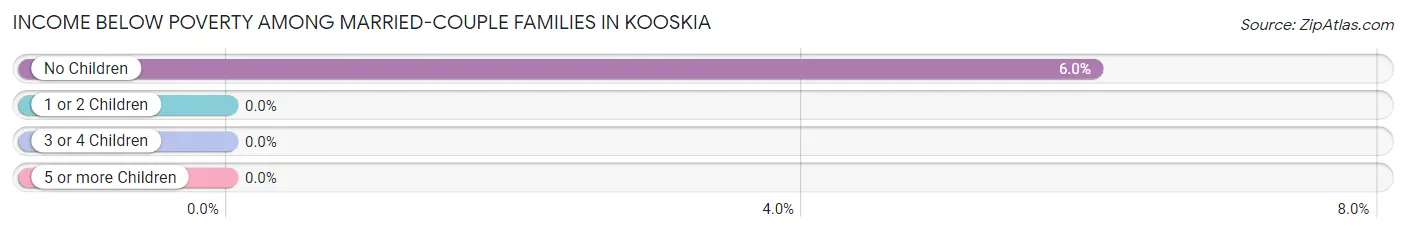
| Children | Above Poverty | Below Poverty |
| No Children | 78 (94.0%) | 5 (6.0%) |
| 1 or 2 Children | 17 (100.0%) | 0 (0.0%) |
| 3 or 4 Children | 7 (100.0%) | 0 (0.0%) |
| 5 or more Children | 0 (0.0%) | 0 (0.0%) |
| Total | 102 (95.3%) | 5 (4.7%) |
Income Below Poverty Among Single-Parent Households in Kooskia
According to the poverty data in Kooskia, 33.3% or 7 single-father households and 50.0% or 11 single-mother households are living below the poverty line. Among single-father households, those with 3 or 4 children have the highest poverty rate, with 2 households (100.0%) experiencing poverty. Likewise, among single-mother households, those with 1 or 2 children have the highest poverty rate, with 11 households (57.9%) falling below the poverty line.
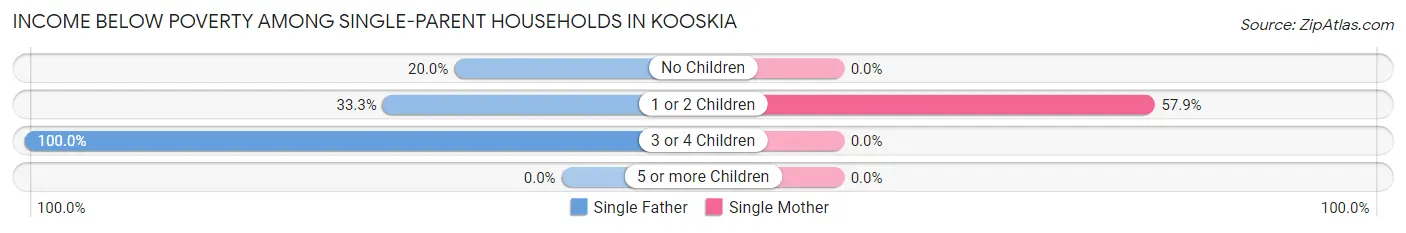
| Children | Single Father | Single Mother |
| No Children | 2 (20.0%) | 0 (0.0%) |
| 1 or 2 Children | 3 (33.3%) | 11 (57.9%) |
| 3 or 4 Children | 2 (100.0%) | 0 (0.0%) |
| 5 or more Children | 0 (0.0%) | 0 (0.0%) |
| Total | 7 (33.3%) | 11 (50.0%) |
Income Below Poverty Among Married-Couple vs Single-Parent Households in Kooskia
The poverty data for Kooskia shows that 5 of the married-couple family households (4.7%) and 18 of the single-parent households (41.9%) are living below the poverty level. Within the married-couple family households, those with no children have the highest poverty rate, with 5 households (6.0%) falling below the poverty line. Among the single-parent households, those with 3 or 4 children have the highest poverty rate, with 2 household (100.0%) living below poverty.
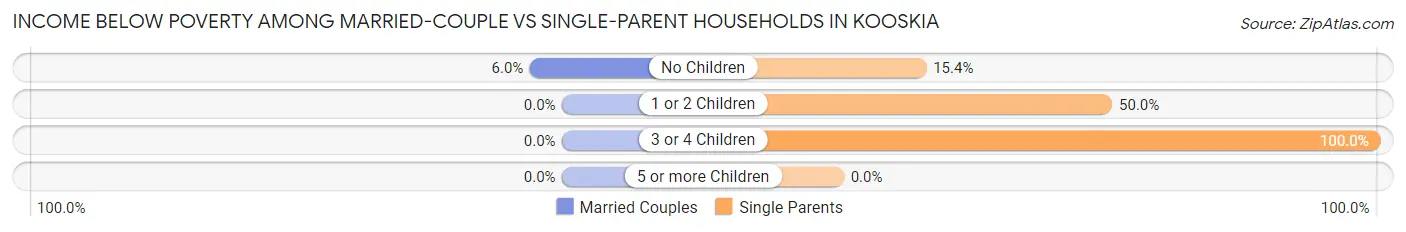
| Children | Married-Couple Families | Single-Parent Households |
| No Children | 5 (6.0%) | 2 (15.4%) |
| 1 or 2 Children | 0 (0.0%) | 14 (50.0%) |
| 3 or 4 Children | 0 (0.0%) | 2 (100.0%) |
| 5 or more Children | 0 (0.0%) | 0 (0.0%) |
| Total | 5 (4.7%) | 18 (41.9%) |
Race in Kooskia
The most populous races in Kooskia are White / Caucasian (473 | 77.8%), Native / Alaskan (110 | 18.1%), and Hispanic or Latino (16 | 2.6%).
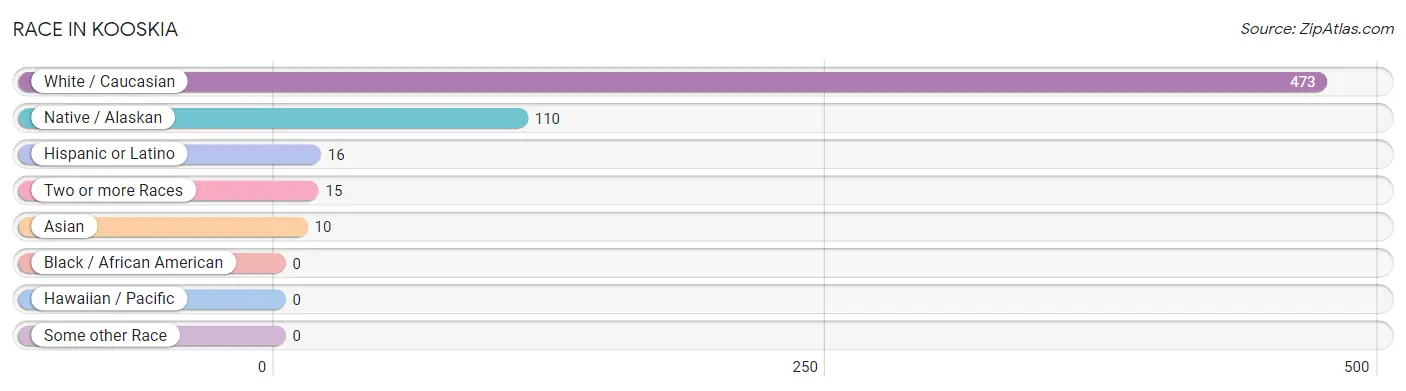
| Race | # Population | % Population |
| Asian | 10 | 1.6% |
| Black / African American | 0 | 0.0% |
| Hawaiian / Pacific | 0 | 0.0% |
| Hispanic or Latino | 16 | 2.6% |
| Native / Alaskan | 110 | 18.1% |
| White / Caucasian | 473 | 77.8% |
| Two or more Races | 15 | 2.5% |
| Some other Race | 0 | 0.0% |
| Total | 608 | 100.0% |
Ancestry in Kooskia
The most populous ancestries reported in Kooskia are German (173 | 28.4%), Irish (82 | 13.5%), English (42 | 6.9%), European (24 | 4.0%), and Tlingit-Haida (16 | 2.6%), together accounting for 55.4% of all Kooskia residents.
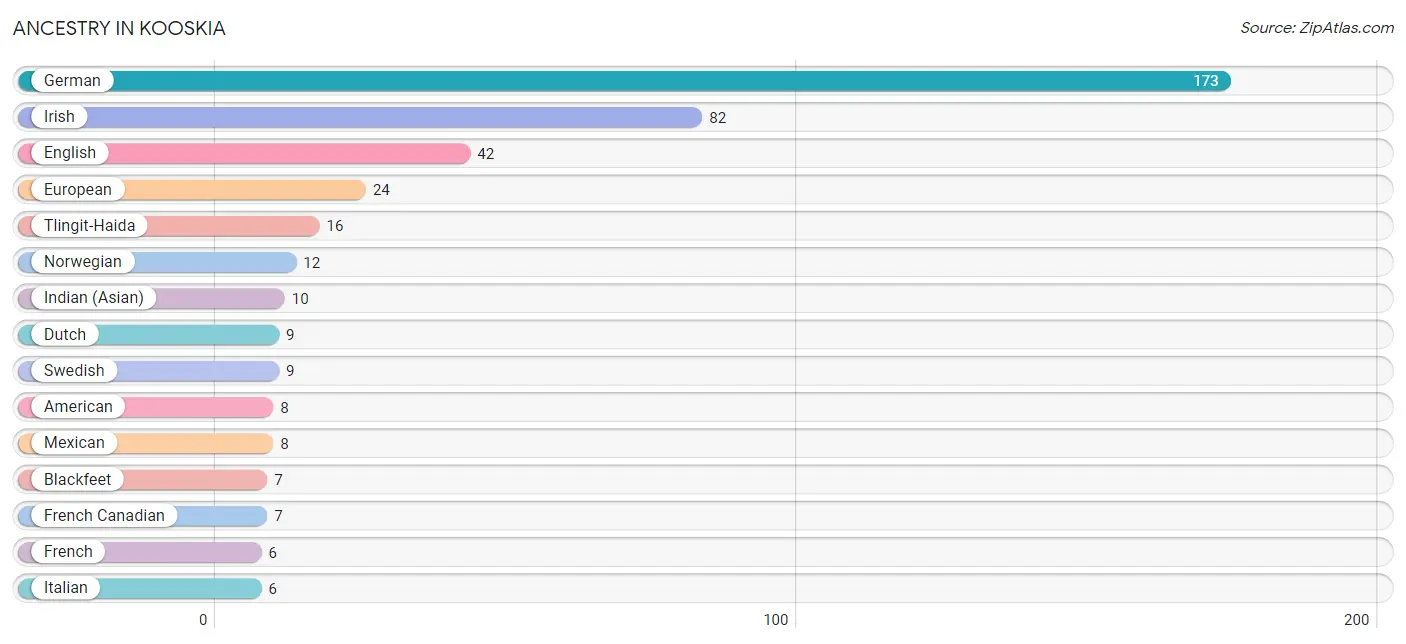
| Ancestry | # Population | % Population |
| American | 8 | 1.3% |
| Belgian | 2 | 0.3% |
| Bhutanese | 5 | 0.8% |
| Blackfeet | 7 | 1.1% |
| British | 3 | 0.5% |
| Danish | 4 | 0.7% |
| Dutch | 9 | 1.5% |
| English | 42 | 6.9% |
| European | 24 | 4.0% |
| Finnish | 4 | 0.7% |
| French | 6 | 1.0% |
| French Canadian | 7 | 1.1% |
| German | 173 | 28.4% |
| Hungarian | 4 | 0.7% |
| Indian (Asian) | 10 | 1.6% |
| Irish | 82 | 13.5% |
| Italian | 6 | 1.0% |
| Mexican | 8 | 1.3% |
| Norwegian | 12 | 2.0% |
| Peruvian | 3 | 0.5% |
| Polish | 3 | 0.5% |
| Scotch-Irish | 5 | 0.8% |
| Scottish | 4 | 0.7% |
| South American | 3 | 0.5% |
| Swedish | 9 | 1.5% |
| Swiss | 4 | 0.7% |
| Tlingit-Haida | 16 | 2.6% |
| Welsh | 4 | 0.7% | View All 28 Rows |
Immigrants in Kooskia
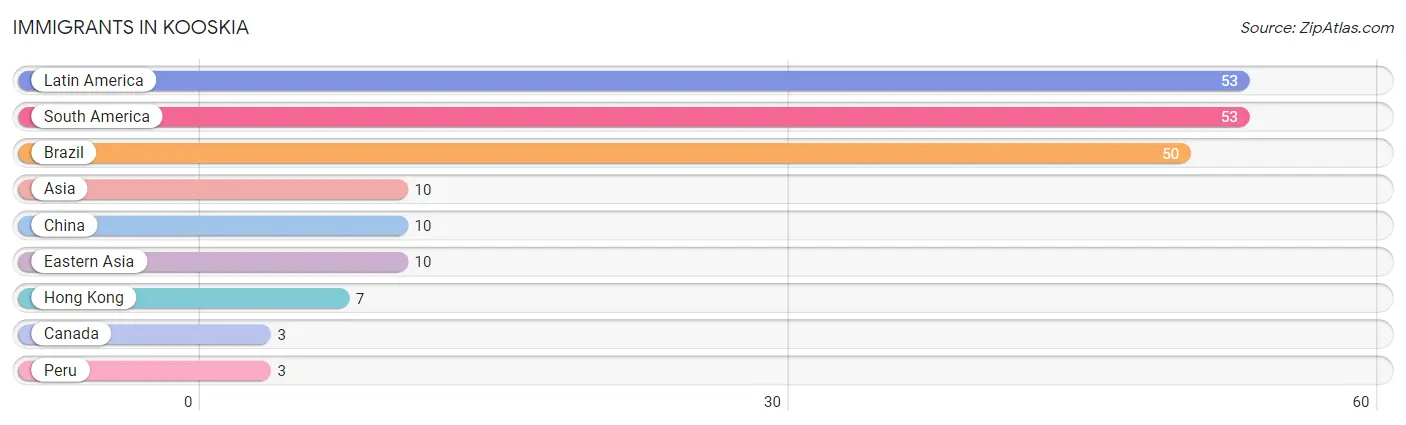
The most numerous immigrant groups reported in Kooskia came from Latin America (53 | 8.7%), South America (53 | 8.7%), Brazil (50 | 8.2%), Asia (10 | 1.6%), and China (10 | 1.6%), together accounting for 28.9% of all Kooskia residents.
| Immigration Origin | # Population | % Population |
| Asia | 10 | 1.6% |
| Brazil | 50 | 8.2% |
| Canada | 3 | 0.5% |
| China | 10 | 1.6% |
| Eastern Asia | 10 | 1.6% |
| Hong Kong | 7 | 1.1% |
| Latin America | 53 | 8.7% |
| Peru | 3 | 0.5% |
| South America | 53 | 8.7% | View All 9 Rows |
Sex and Age in Kooskia
Sex and Age in Kooskia
The most populous age groups in Kooskia are 65 to 69 Years (86 | 27.6%) for men and 55 to 59 Years (48 | 16.2%) for women.
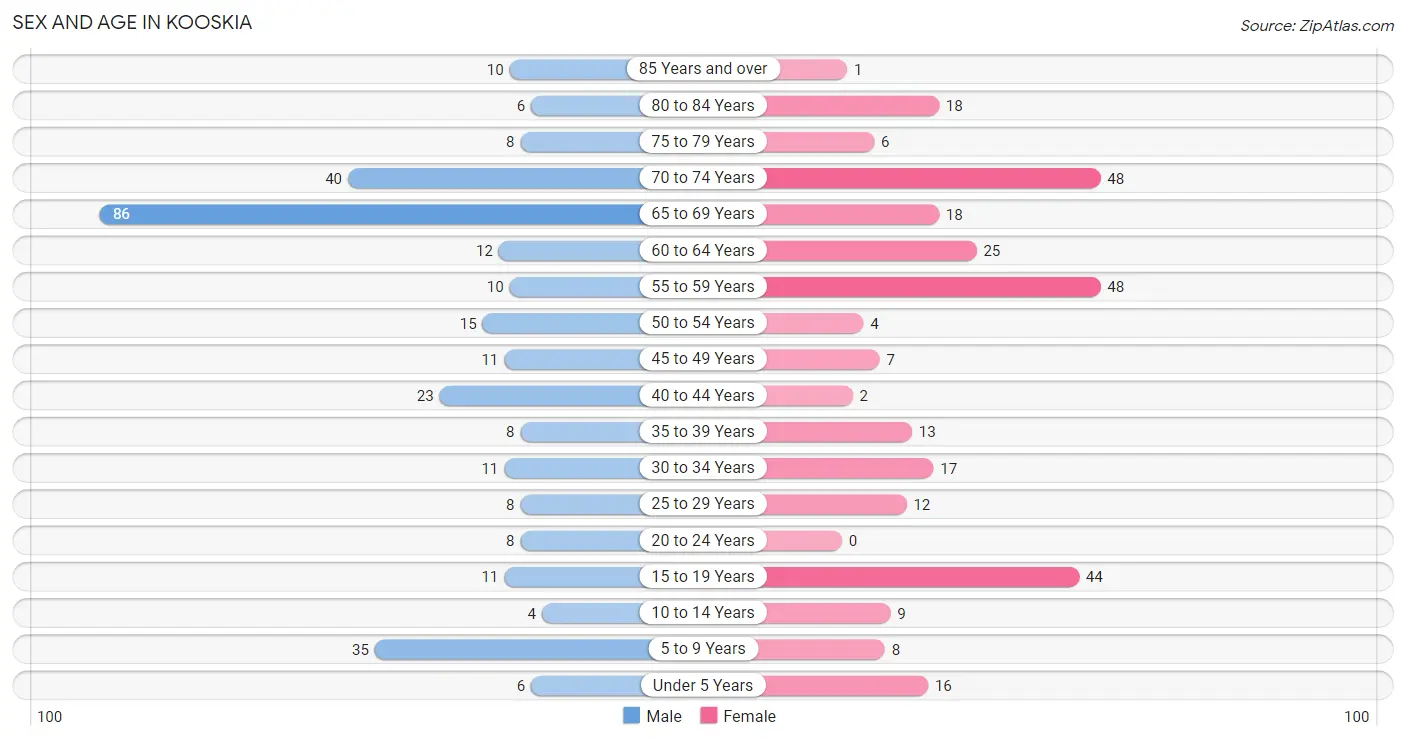
| Age Bracket | Male | Female |
| Under 5 Years | 6 (1.9%) | 16 (5.4%) |
| 5 to 9 Years | 35 (11.2%) | 8 (2.7%) |
| 10 to 14 Years | 4 (1.3%) | 9 (3.0%) |
| 15 to 19 Years | 11 (3.5%) | 44 (14.9%) |
| 20 to 24 Years | 8 (2.6%) | 0 (0.0%) |
| 25 to 29 Years | 8 (2.6%) | 12 (4.1%) |
| 30 to 34 Years | 11 (3.5%) | 17 (5.7%) |
| 35 to 39 Years | 8 (2.6%) | 13 (4.4%) |
| 40 to 44 Years | 23 (7.4%) | 2 (0.7%) |
| 45 to 49 Years | 11 (3.5%) | 7 (2.4%) |
| 50 to 54 Years | 15 (4.8%) | 4 (1.3%) |
| 55 to 59 Years | 10 (3.2%) | 48 (16.2%) |
| 60 to 64 Years | 12 (3.8%) | 25 (8.5%) |
| 65 to 69 Years | 86 (27.6%) | 18 (6.1%) |
| 70 to 74 Years | 40 (12.8%) | 48 (16.2%) |
| 75 to 79 Years | 8 (2.6%) | 6 (2.0%) |
| 80 to 84 Years | 6 (1.9%) | 18 (6.1%) |
| 85 Years and over | 10 (3.2%) | 1 (0.3%) |
| Total | 312 (100.0%) | 296 (100.0%) |
Families and Households in Kooskia
Median Family Size in Kooskia
The median family size in Kooskia is 2.93 persons per family, with single female/mother families (22 | 14.7%) accounting for the largest median family size of 3.55 persons per family. On the other hand, single male/father families (21 | 14.0%) represent the smallest median family size with 2.71 persons per family.
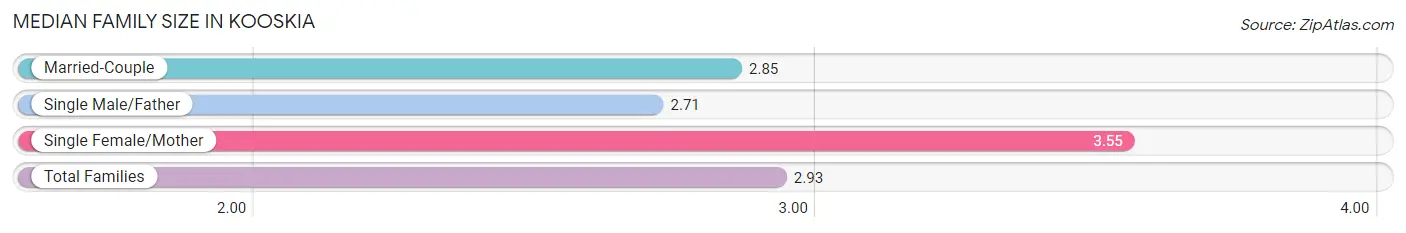
| Family Type | # Families | Family Size |
| Married-Couple | 107 (71.3%) | 2.85 |
| Single Male/Father | 21 (14.0%) | 2.71 |
| Single Female/Mother | 22 (14.7%) | 3.55 |
| Total Families | 150 (100.0%) | 2.93 |
Median Household Size in Kooskia
The median household size in Kooskia is 2.44 persons per household, with single female/mother households (22 | 8.8%) accounting for the largest median household size of 5.82 persons per household. non-family households (99 | 39.8%) represent the smallest median household size with 1.11 persons per household.
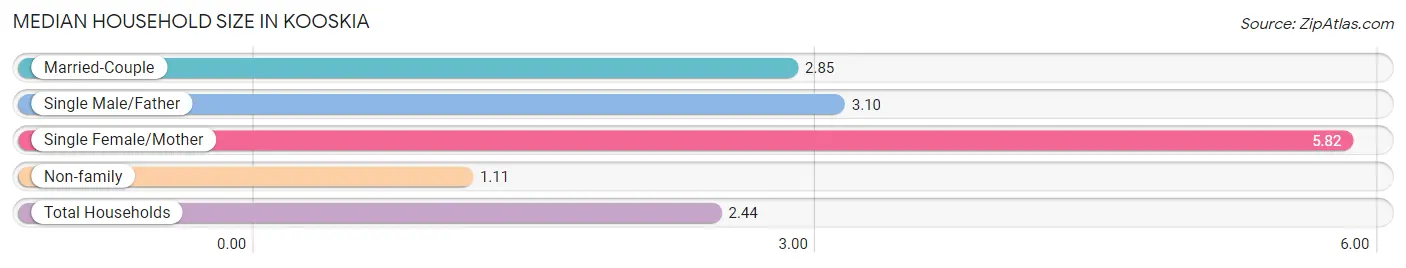
| Household Type | # Households | Household Size |
| Married-Couple | 107 (43.0%) | 2.85 |
| Single Male/Father | 21 (8.4%) | 3.10 |
| Single Female/Mother | 22 (8.8%) | 5.82 |
| Non-family | 99 (39.8%) | 1.11 |
| Total Households | 249 (100.0%) | 2.44 |
Household Size by Marriage Status in Kooskia
Out of a total of 249 households in Kooskia, 150 (60.2%) are family households, while 99 (39.8%) are nonfamily households. The most numerous type of family households are 2-person households, comprising 92, and the most common type of nonfamily households are 1-person households, comprising 88.
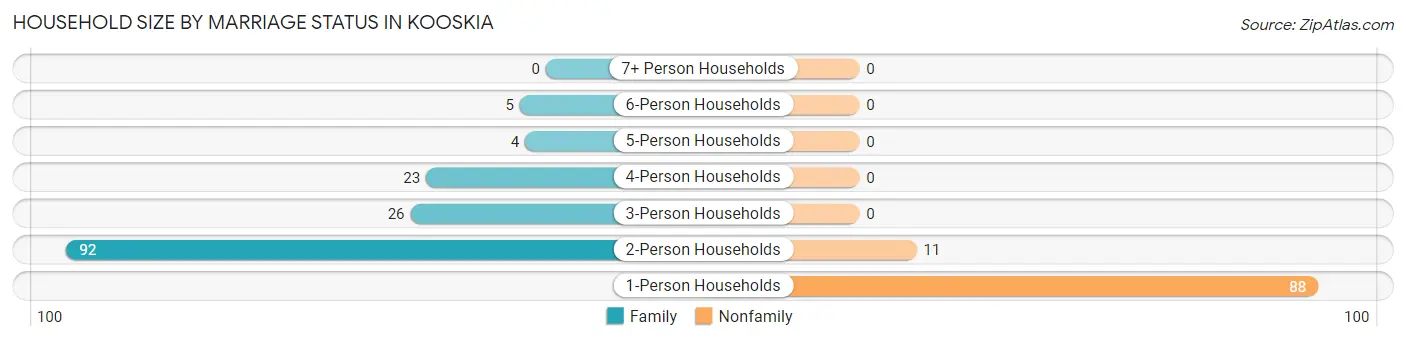
| Household Size | Family Households | Nonfamily Households |
| 1-Person Households | - | 88 (35.3%) |
| 2-Person Households | 92 (36.9%) | 11 (4.4%) |
| 3-Person Households | 26 (10.4%) | 0 (0.0%) |
| 4-Person Households | 23 (9.2%) | 0 (0.0%) |
| 5-Person Households | 4 (1.6%) | 0 (0.0%) |
| 6-Person Households | 5 (2.0%) | 0 (0.0%) |
| 7+ Person Households | 0 (0.0%) | 0 (0.0%) |
| Total | 150 (60.2%) | 99 (39.8%) |
Female Fertility in Kooskia
Fertility by Age in Kooskia
Average fertility rate in Kooskia is 42.0 births per 1,000 women. Women in the age bracket of 20 to 34 years have the highest fertility rate with 138.0 births per 1,000 women. Women in the age bracket of 20 to 34 years acount for 100.0% of all women with births.
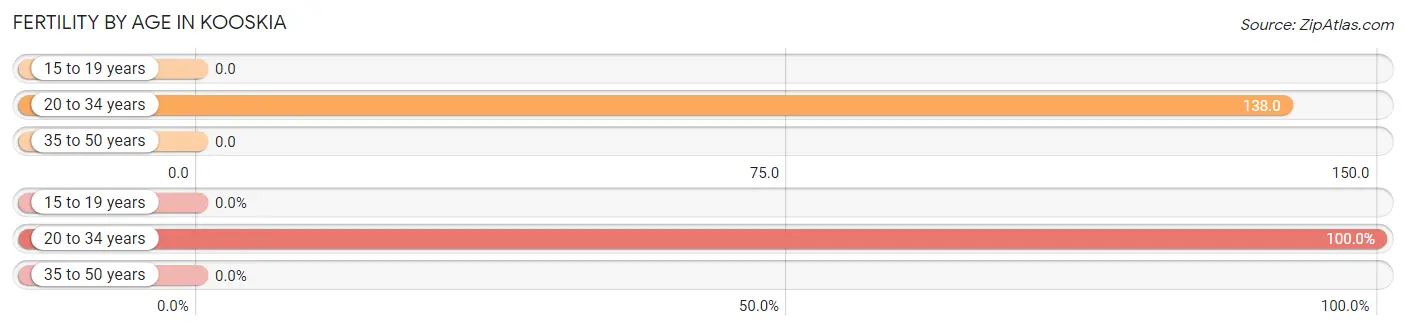
| Age Bracket | Women with Births | Births / 1,000 Women |
| 15 to 19 years | 0 (0.0%) | 0.0 |
| 20 to 34 years | 4 (100.0%) | 138.0 |
| 35 to 50 years | 0 (0.0%) | 0.0 |
| Total | 4 (100.0%) | 42.0 |
Fertility by Age by Marriage Status in Kooskia
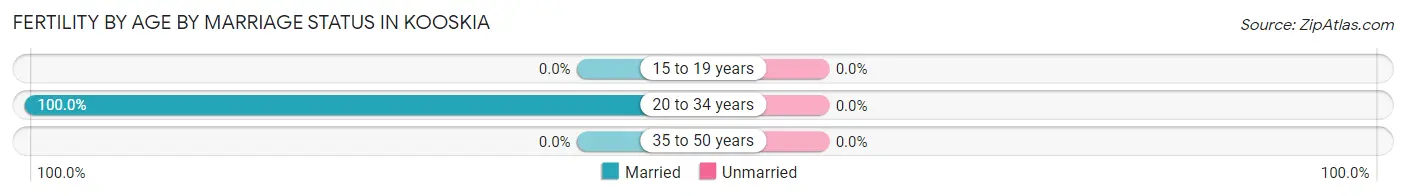
| Age Bracket | Married | Unmarried |
| 15 to 19 years | 0 (0.0%) | 0 (0.0%) |
| 20 to 34 years | 4 (100.0%) | 0 (0.0%) |
| 35 to 50 years | 0 (0.0%) | 0 (0.0%) |
| Total | 4 (100.0%) | 0 (0.0%) |
Fertility by Education in Kooskia
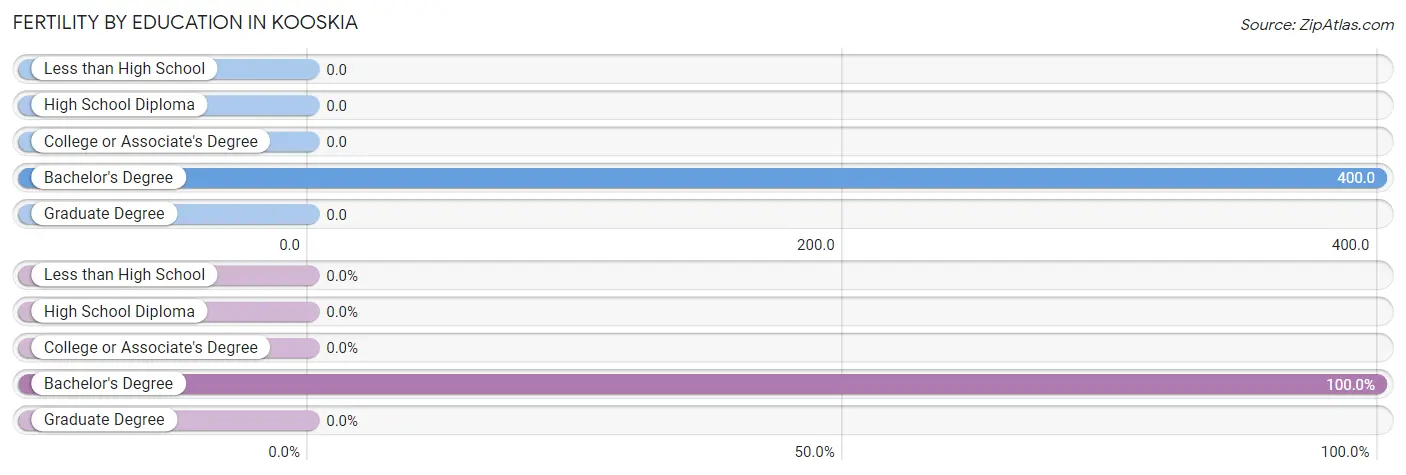
| Educational Attainment | Women with Births | Births / 1,000 Women |
| Less than High School | 0 (0.0%) | 0.0 |
| High School Diploma | 0 (0.0%) | 0.0 |
| College or Associate's Degree | 0 (0.0%) | 0.0 |
| Bachelor's Degree | 4 (100.0%) | 400.0 |
| Graduate Degree | 0 (0.0%) | 0.0 |
| Total | 4 (100.0%) | 42.0 |
Fertility by Education by Marriage Status in Kooskia
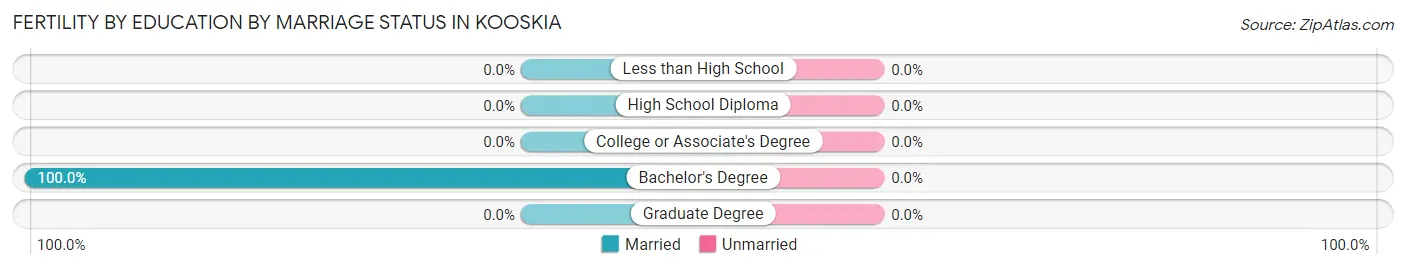
| Educational Attainment | Married | Unmarried |
| Less than High School | 0 (0.0%) | 0 (0.0%) |
| High School Diploma | 0 (0.0%) | 0 (0.0%) |
| College or Associate's Degree | 0 (0.0%) | 0 (0.0%) |
| Bachelor's Degree | 4 (100.0%) | 0 (0.0%) |
| Graduate Degree | 0 (0.0%) | 0 (0.0%) |
| Total | 4 (100.0%) | 0 (0.0%) |
Employment Characteristics in Kooskia
Employment by Class of Employer in Kooskia
Among the 140 employed individuals in Kooskia, private company employees (119 | 85.0%), self-employed (not incorporated) (8 | 5.7%), and local government employees (6 | 4.3%) make up the most common classes of employment.
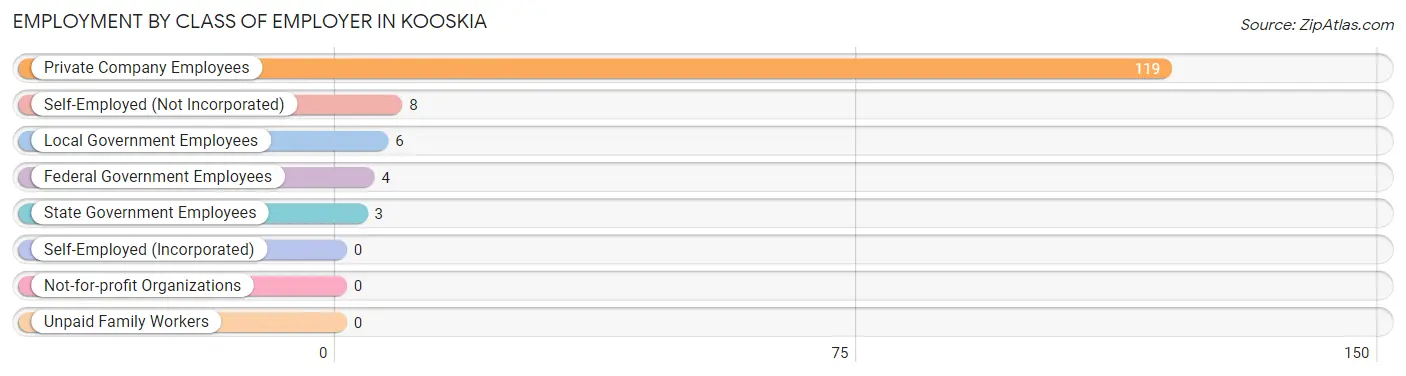
| Employer Class | # Employees | % Employees |
| Private Company Employees | 119 | 85.0% |
| Self-Employed (Incorporated) | 0 | 0.0% |
| Self-Employed (Not Incorporated) | 8 | 5.7% |
| Not-for-profit Organizations | 0 | 0.0% |
| Local Government Employees | 6 | 4.3% |
| State Government Employees | 3 | 2.1% |
| Federal Government Employees | 4 | 2.9% |
| Unpaid Family Workers | 0 | 0.0% |
| Total | 140 | 100.0% |
Employment Status by Age in Kooskia
According to the labor force statistics for Kooskia, out of the total population over 16 years of age (508), 30.9% or 157 individuals are in the labor force, with 4.5% or 7 of them unemployed. The age group with the highest labor force participation rate is 30 to 34 years, with 100.0% or 28 individuals in the labor force. Within the labor force, the 16 to 19 years age range has the highest percentage of unemployed individuals, with 37.5% or 3 of them being unemployed.
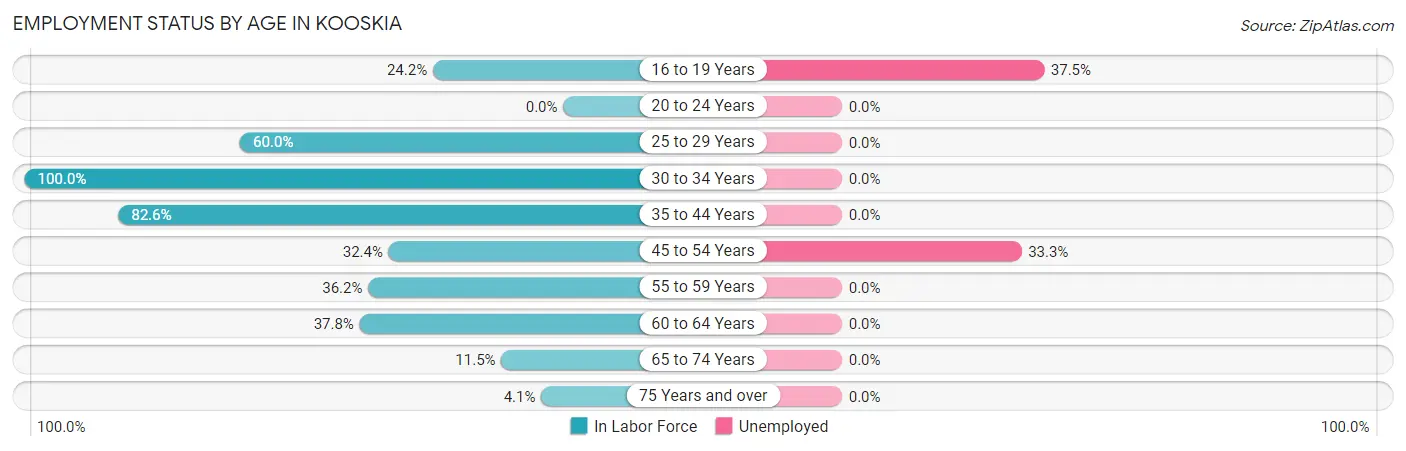
| Age Bracket | In Labor Force | Unemployed |
| 16 to 19 Years | 8 (24.2%) | 3 (37.5%) |
| 20 to 24 Years | 0 (0.0%) | 0 (0.0%) |
| 25 to 29 Years | 12 (60.0%) | 0 (0.0%) |
| 30 to 34 Years | 28 (100.0%) | 0 (0.0%) |
| 35 to 44 Years | 38 (82.6%) | 0 (0.0%) |
| 45 to 54 Years | 12 (32.4%) | 4 (33.3%) |
| 55 to 59 Years | 21 (36.2%) | 0 (0.0%) |
| 60 to 64 Years | 14 (37.8%) | 0 (0.0%) |
| 65 to 74 Years | 22 (11.5%) | 0 (0.0%) |
| 75 Years and over | 2 (4.1%) | 0 (0.0%) |
| Total | 157 (30.9%) | 7 (4.5%) |
Employment Status by Educational Attainment in Kooskia
According to labor force statistics for Kooskia, 55.3% of individuals (125) out of the total population between 25 and 64 years of age (226) are in the labor force, with 3.2% or 4 of them being unemployed. The group with the highest labor force participation rate are those with the educational attainment of bachelor's degree or higher, with 76.5% or 13 individuals in the labor force. Within the labor force, individuals with high school diploma education have the highest percentage of unemployment, with 4.5% or 4 of them being unemployed.
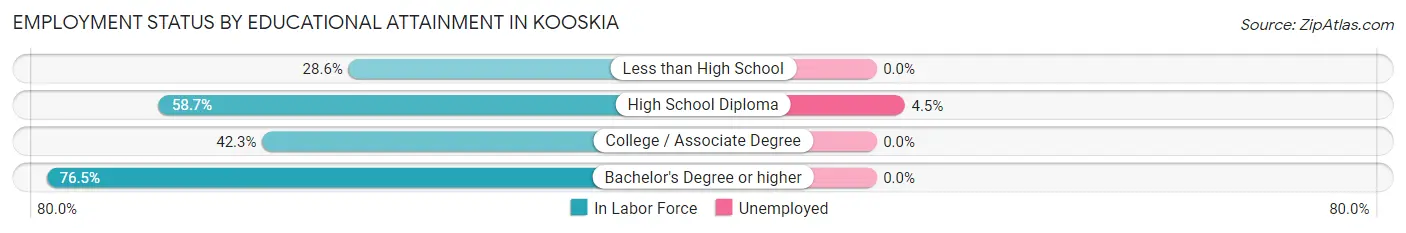
| Educational Attainment | In Labor Force | Unemployed |
| Less than High School | 2 (28.6%) | 0 (0.0%) |
| High School Diploma | 88 (58.7%) | 7 (4.5%) |
| College / Associate Degree | 22 (42.3%) | 0 (0.0%) |
| Bachelor's Degree or higher | 13 (76.5%) | 0 (0.0%) |
| Total | 125 (55.3%) | 7 (3.2%) |
Employment Occupations by Sex in Kooskia
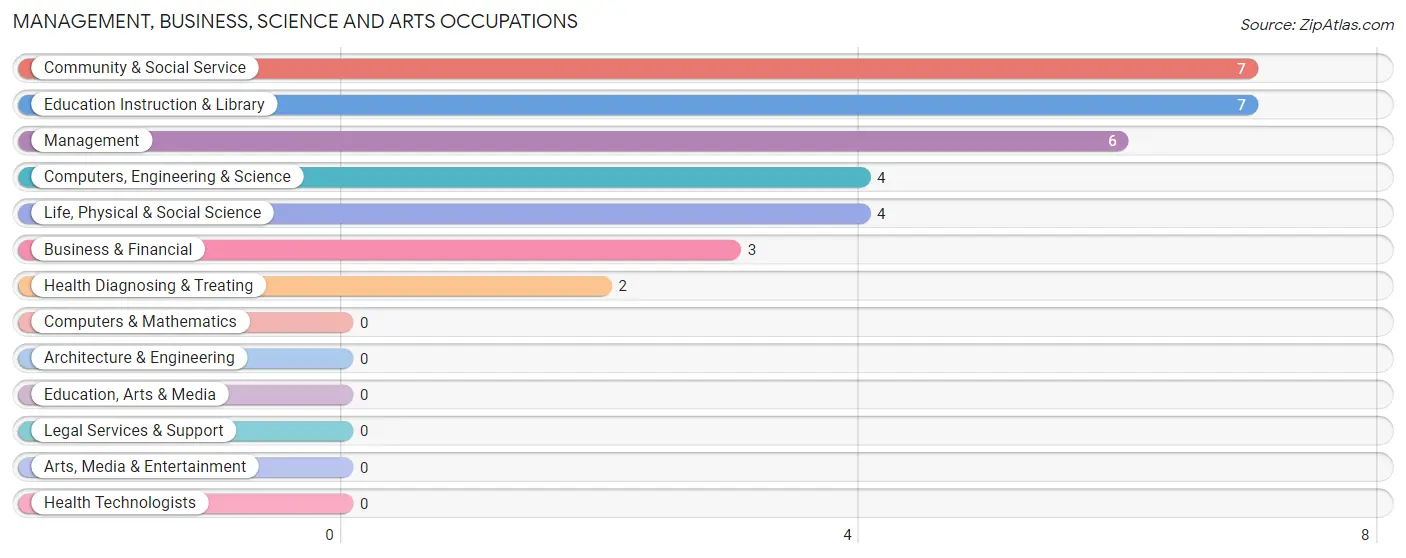
Management, Business, Science and Arts Occupations
The most common Management, Business, Science and Arts occupations in Kooskia are Community & Social Service (7 | 4.7%), Education Instruction & Library (7 | 4.7%), Management (6 | 4.0%), Computers, Engineering & Science (4 | 2.7%), and Life, Physical & Social Science (4 | 2.7%).
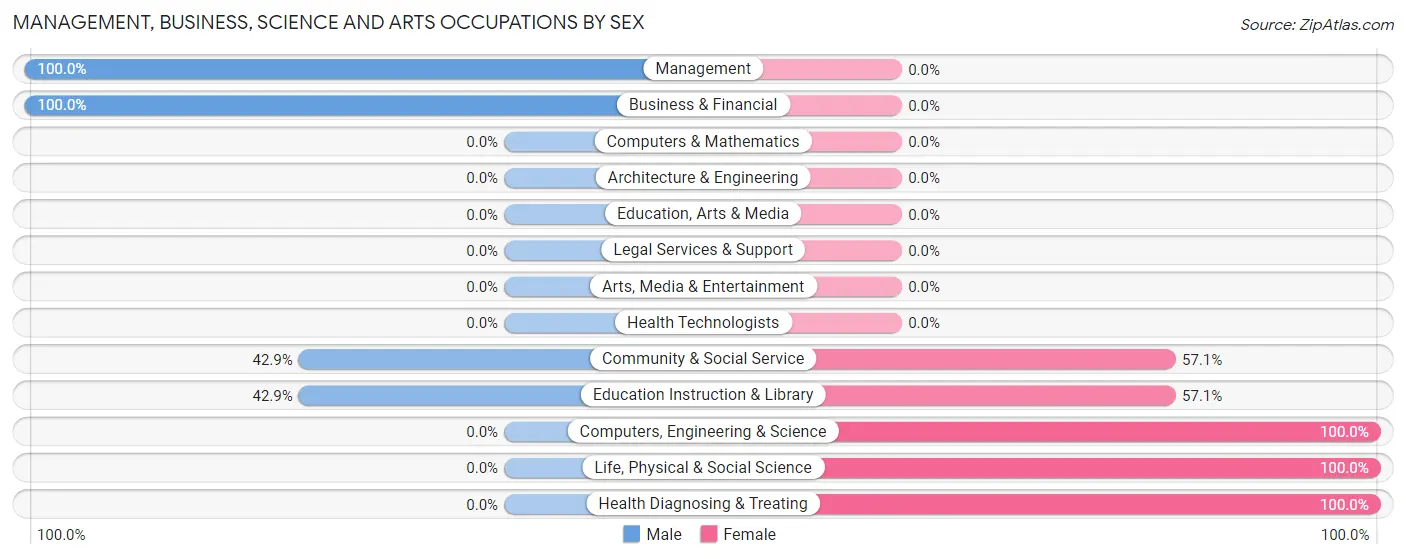
Management, Business, Science and Arts Occupations by Sex
Within the Management, Business, Science and Arts occupations in Kooskia, the most male-oriented occupations are Management (100.0%), Business & Financial (100.0%), and Community & Social Service (42.9%), while the most female-oriented occupations are Computers, Engineering & Science (100.0%), Life, Physical & Social Science (100.0%), and Health Diagnosing & Treating (100.0%).
| Occupation | Male | Female |
| Management | 6 (100.0%) | 0 (0.0%) |
| Business & Financial | 3 (100.0%) | 0 (0.0%) |
| Computers, Engineering & Science | 0 (0.0%) | 4 (100.0%) |
| Computers & Mathematics | 0 (0.0%) | 0 (0.0%) |
| Architecture & Engineering | 0 (0.0%) | 0 (0.0%) |
| Life, Physical & Social Science | 0 (0.0%) | 4 (100.0%) |
| Community & Social Service | 3 (42.9%) | 4 (57.1%) |
| Education, Arts & Media | 0 (0.0%) | 0 (0.0%) |
| Legal Services & Support | 0 (0.0%) | 0 (0.0%) |
| Education Instruction & Library | 3 (42.9%) | 4 (57.1%) |
| Arts, Media & Entertainment | 0 (0.0%) | 0 (0.0%) |
| Health Diagnosing & Treating | 0 (0.0%) | 2 (100.0%) |
| Health Technologists | 0 (0.0%) | 0 (0.0%) |
| Total (Category) | 12 (54.5%) | 10 (45.5%) |
| Total (Overall) | 84 (56.0%) | 66 (44.0%) |
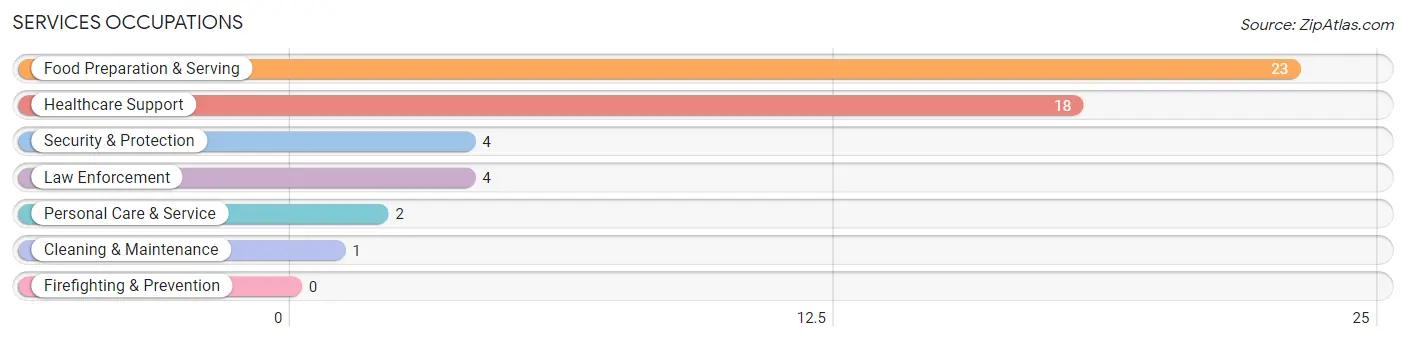
Services Occupations
The most common Services occupations in Kooskia are Food Preparation & Serving (23 | 15.3%), Healthcare Support (18 | 12.0%), Security & Protection (4 | 2.7%), Law Enforcement (4 | 2.7%), and Personal Care & Service (2 | 1.3%).
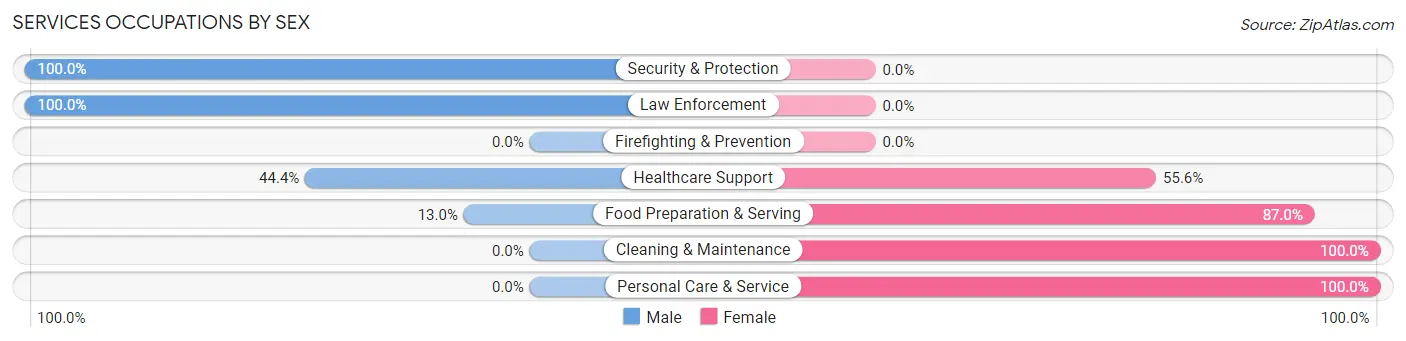
Services Occupations by Sex
Within the Services occupations in Kooskia, the most male-oriented occupations are Security & Protection (100.0%), Law Enforcement (100.0%), and Healthcare Support (44.4%), while the most female-oriented occupations are Cleaning & Maintenance (100.0%), Personal Care & Service (100.0%), and Food Preparation & Serving (87.0%).
| Occupation | Male | Female |
| Healthcare Support | 8 (44.4%) | 10 (55.6%) |
| Security & Protection | 4 (100.0%) | 0 (0.0%) |
| Firefighting & Prevention | 0 (0.0%) | 0 (0.0%) |
| Law Enforcement | 4 (100.0%) | 0 (0.0%) |
| Food Preparation & Serving | 3 (13.0%) | 20 (87.0%) |
| Cleaning & Maintenance | 0 (0.0%) | 1 (100.0%) |
| Personal Care & Service | 0 (0.0%) | 2 (100.0%) |
| Total (Category) | 15 (31.2%) | 33 (68.8%) |
| Total (Overall) | 84 (56.0%) | 66 (44.0%) |
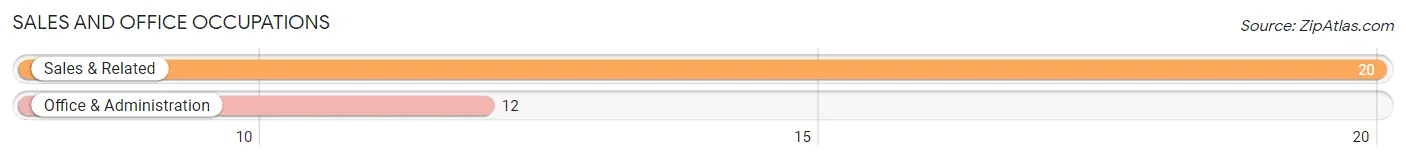
Sales and Office Occupations
The most common Sales and Office occupations in Kooskia are Sales & Related (20 | 13.3%), and Office & Administration (12 | 8.0%).
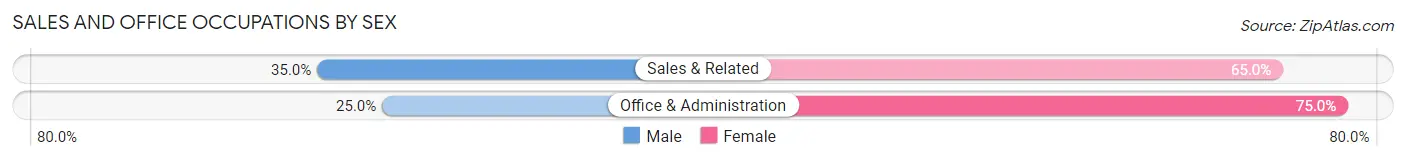
Sales and Office Occupations by Sex
| Occupation | Male | Female |
| Sales & Related | 7 (35.0%) | 13 (65.0%) |
| Office & Administration | 3 (25.0%) | 9 (75.0%) |
| Total (Category) | 10 (31.2%) | 22 (68.8%) |
| Total (Overall) | 84 (56.0%) | 66 (44.0%) |
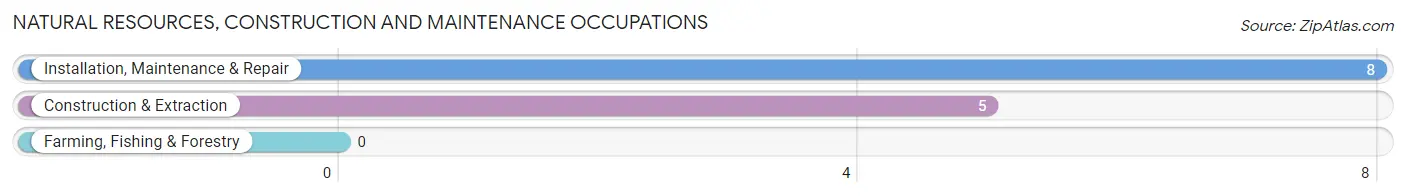
Natural Resources, Construction and Maintenance Occupations
The most common Natural Resources, Construction and Maintenance occupations in Kooskia are Installation, Maintenance & Repair (8 | 5.3%), and Construction & Extraction (5 | 3.3%).
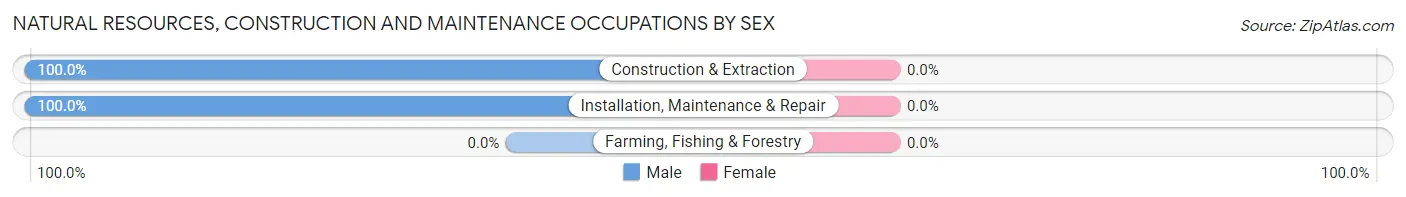
Natural Resources, Construction and Maintenance Occupations by Sex
| Occupation | Male | Female |
| Farming, Fishing & Forestry | 0 (0.0%) | 0 (0.0%) |
| Construction & Extraction | 5 (100.0%) | 0 (0.0%) |
| Installation, Maintenance & Repair | 8 (100.0%) | 0 (0.0%) |
| Total (Category) | 13 (100.0%) | 0 (0.0%) |
| Total (Overall) | 84 (56.0%) | 66 (44.0%) |
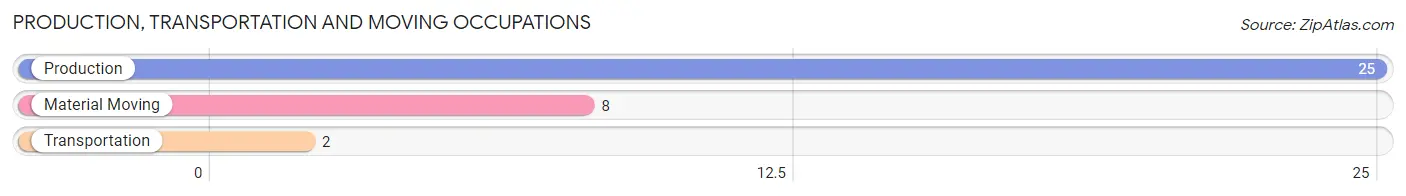
Production, Transportation and Moving Occupations
The most common Production, Transportation and Moving occupations in Kooskia are Production (25 | 16.7%), Material Moving (8 | 5.3%), and Transportation (2 | 1.3%).
Production, Transportation and Moving Occupations by Sex
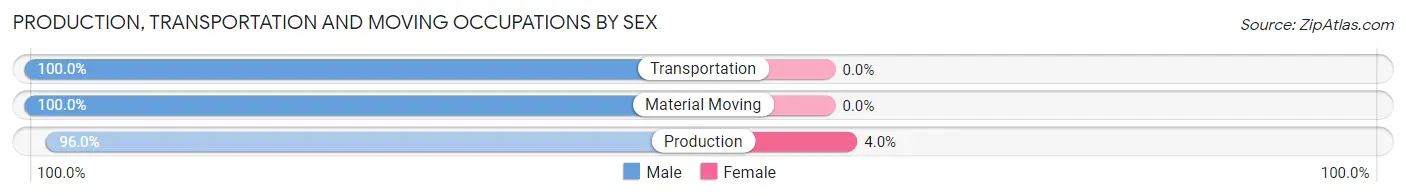
| Occupation | Male | Female |
| Production | 24 (96.0%) | 1 (4.0%) |
| Transportation | 2 (100.0%) | 0 (0.0%) |
| Material Moving | 8 (100.0%) | 0 (0.0%) |
| Total (Category) | 34 (97.1%) | 1 (2.9%) |
| Total (Overall) | 84 (56.0%) | 66 (44.0%) |
Employment Industries by Sex in Kooskia
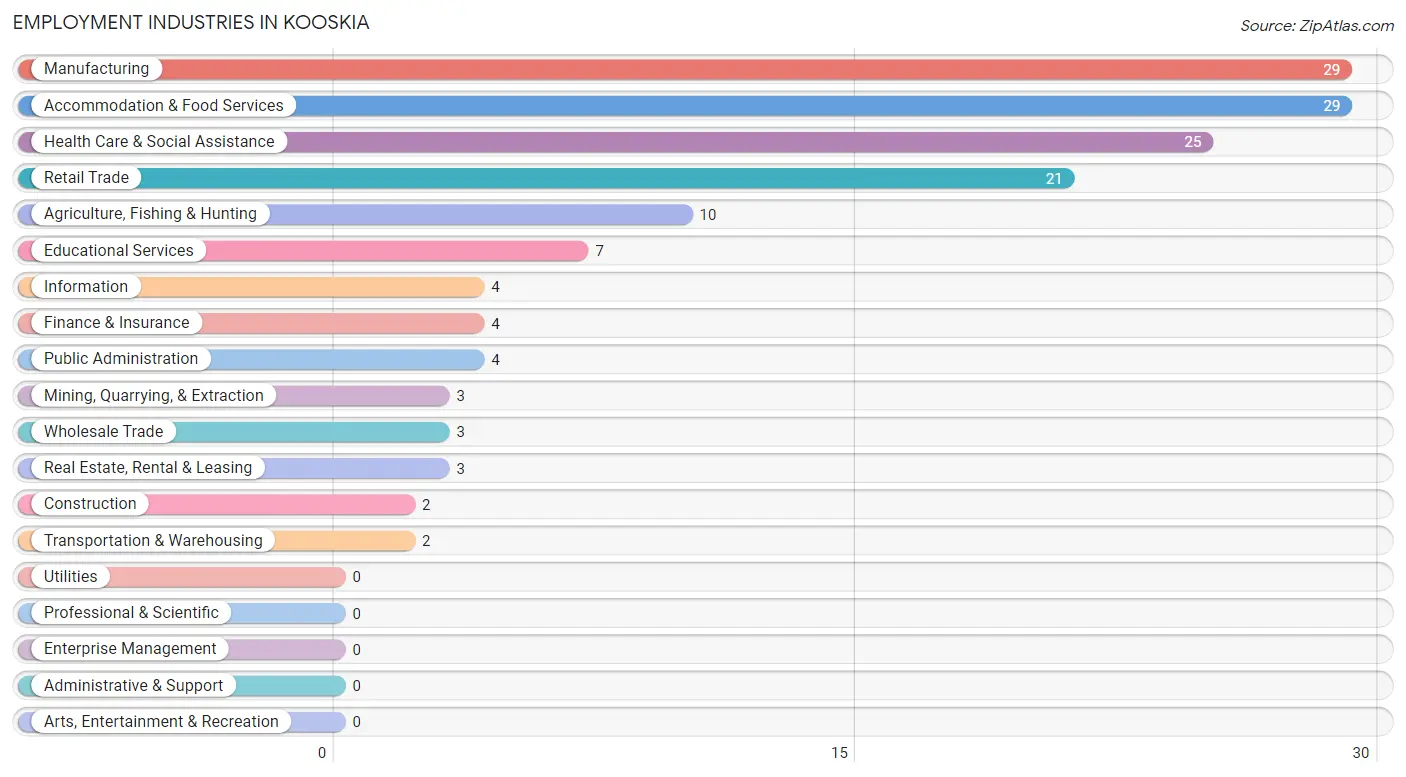
Employment Industries in Kooskia
The major employment industries in Kooskia include Manufacturing (29 | 19.3%), Accommodation & Food Services (29 | 19.3%), Health Care & Social Assistance (25 | 16.7%), Retail Trade (21 | 14.0%), and Agriculture, Fishing & Hunting (10 | 6.7%).
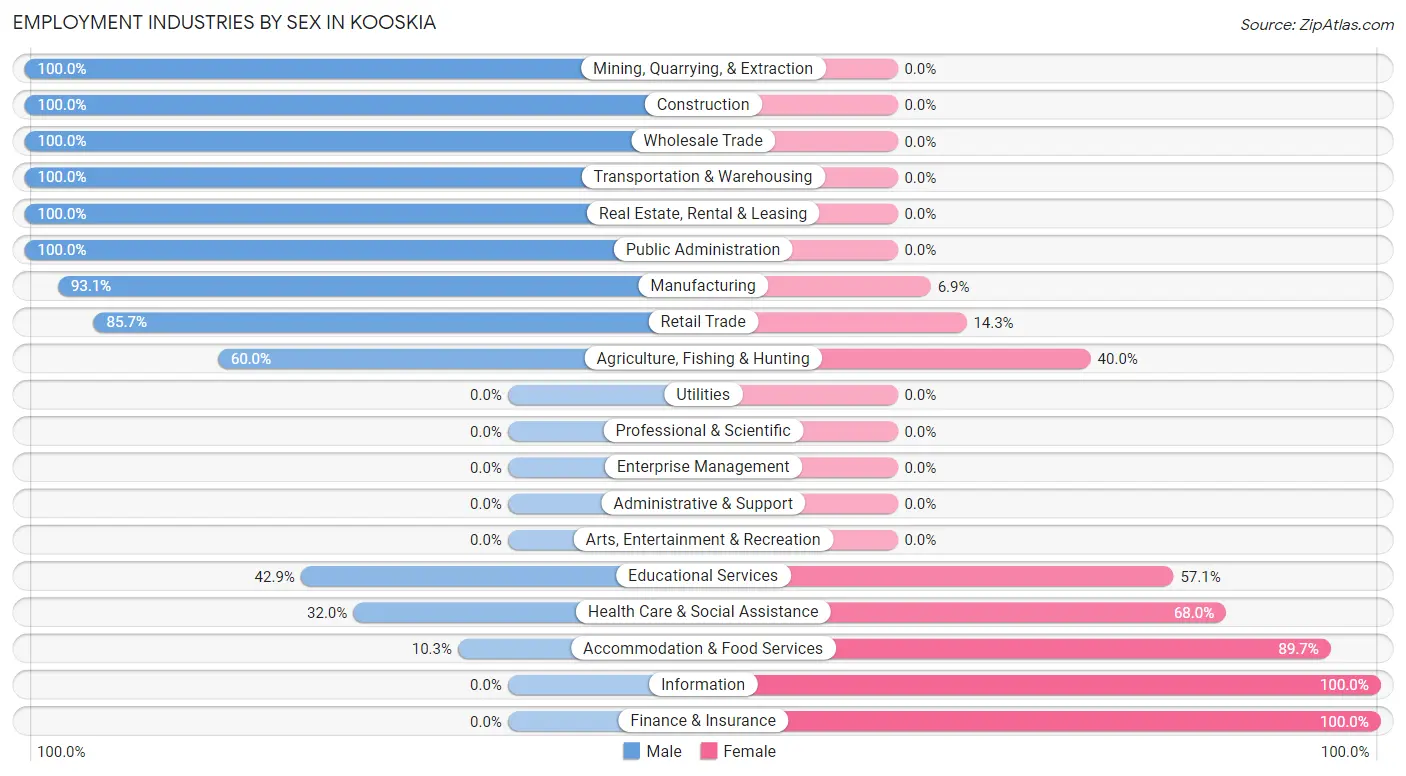
Employment Industries by Sex in Kooskia
The Kooskia industries that see more men than women are Mining, Quarrying, & Extraction (100.0%), Construction (100.0%), and Wholesale Trade (100.0%), whereas the industries that tend to have a higher number of women are Information (100.0%), Finance & Insurance (100.0%), and Accommodation & Food Services (89.7%).
| Industry | Male | Female |
| Agriculture, Fishing & Hunting | 6 (60.0%) | 4 (40.0%) |
| Mining, Quarrying, & Extraction | 3 (100.0%) | 0 (0.0%) |
| Construction | 2 (100.0%) | 0 (0.0%) |
| Manufacturing | 27 (93.1%) | 2 (6.9%) |
| Wholesale Trade | 3 (100.0%) | 0 (0.0%) |
| Retail Trade | 18 (85.7%) | 3 (14.3%) |
| Transportation & Warehousing | 2 (100.0%) | 0 (0.0%) |
| Utilities | 0 (0.0%) | 0 (0.0%) |
| Information | 0 (0.0%) | 4 (100.0%) |
| Finance & Insurance | 0 (0.0%) | 4 (100.0%) |
| Real Estate, Rental & Leasing | 3 (100.0%) | 0 (0.0%) |
| Professional & Scientific | 0 (0.0%) | 0 (0.0%) |
| Enterprise Management | 0 (0.0%) | 0 (0.0%) |
| Administrative & Support | 0 (0.0%) | 0 (0.0%) |
| Educational Services | 3 (42.9%) | 4 (57.1%) |
| Health Care & Social Assistance | 8 (32.0%) | 17 (68.0%) |
| Arts, Entertainment & Recreation | 0 (0.0%) | 0 (0.0%) |
| Accommodation & Food Services | 3 (10.3%) | 26 (89.7%) |
| Public Administration | 4 (100.0%) | 0 (0.0%) |
| Total | 84 (56.0%) | 66 (44.0%) |
Education in Kooskia
School Enrollment in Kooskia
The most common levels of schooling among the 111 students in Kooskia are elementary school (41 | 36.9%), high school (40 | 36.0%), and middle school (9 | 8.1%).
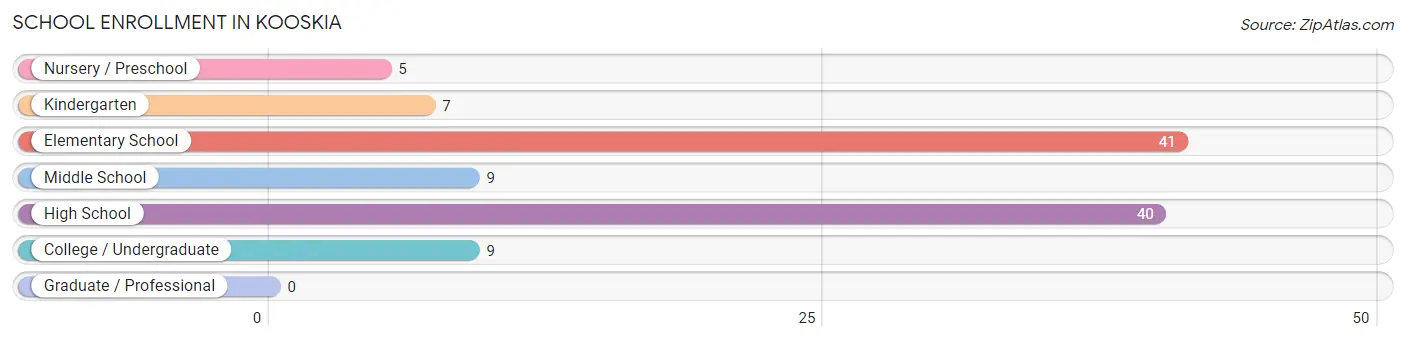
| School Level | # Students | % Students |
| Nursery / Preschool | 5 | 4.5% |
| Kindergarten | 7 | 6.3% |
| Elementary School | 41 | 36.9% |
| Middle School | 9 | 8.1% |
| High School | 40 | 36.0% |
| College / Undergraduate | 9 | 8.1% |
| Graduate / Professional | 0 | 0.0% |
| Total | 111 | 100.0% |
School Enrollment by Age by Funding Source in Kooskia
Out of a total of 111 students who are enrolled in schools in Kooskia, 4 (3.6%) attend a private institution, while the remaining 107 (96.4%) are enrolled in public schools. The age group of 10 to 14 year olds has the highest likelihood of being enrolled in private schools, with 1 (7.7% in the age bracket) enrolled. Conversely, the age group of 3 to 4 year olds has the lowest likelihood of being enrolled in a private school, with 5 (100.0% in the age bracket) attending a public institution.
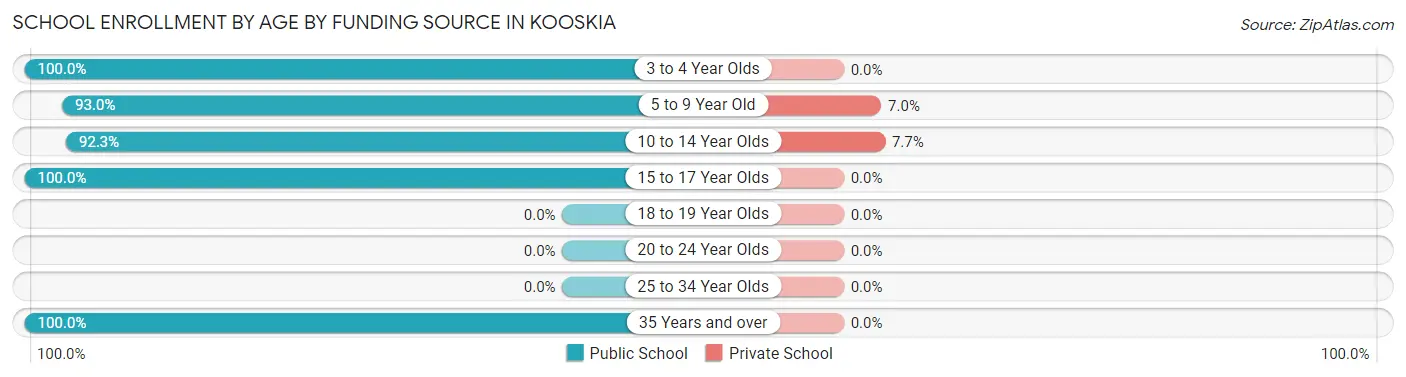
| Age Bracket | Public School | Private School |
| 3 to 4 Year Olds | 5 (100.0%) | 0 (0.0%) |
| 5 to 9 Year Old | 40 (93.0%) | 3 (7.0%) |
| 10 to 14 Year Olds | 12 (92.3%) | 1 (7.7%) |
| 15 to 17 Year Olds | 41 (100.0%) | 0 (0.0%) |
| 18 to 19 Year Olds | 0 (0.0%) | 0 (0.0%) |
| 20 to 24 Year Olds | 0 (0.0%) | 0 (0.0%) |
| 25 to 34 Year Olds | 0 (0.0%) | 0 (0.0%) |
| 35 Years and over | 9 (100.0%) | 0 (0.0%) |
| Total | 107 (96.4%) | 4 (3.6%) |
Educational Attainment by Field of Study in Kooskia
Education (27 | 56.2%), bio, nature & agricultural (7 | 14.6%), computers & mathematics (6 | 12.5%), engineering (3 | 6.2%), and liberal arts & history (3 | 6.2%) are the most common fields of study among 48 individuals in Kooskia who have obtained a bachelor's degree or higher.
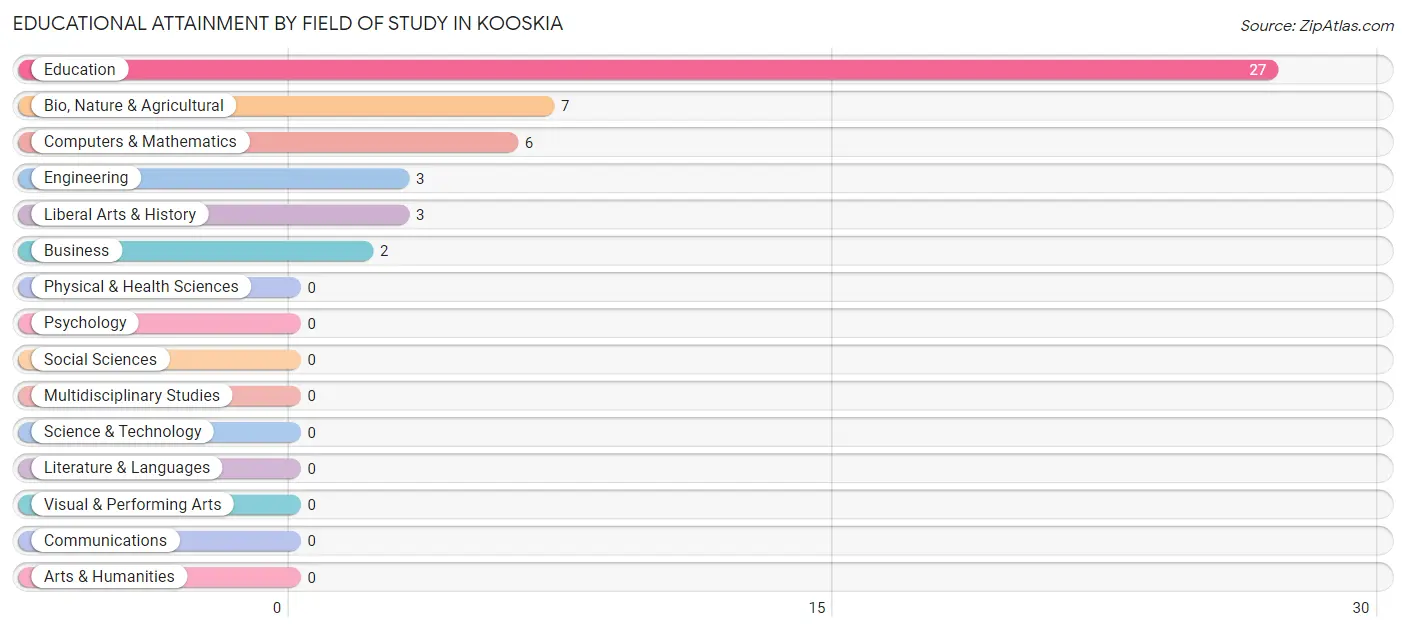
| Field of Study | # Graduates | % Graduates |
| Computers & Mathematics | 6 | 12.5% |
| Bio, Nature & Agricultural | 7 | 14.6% |
| Physical & Health Sciences | 0 | 0.0% |
| Psychology | 0 | 0.0% |
| Social Sciences | 0 | 0.0% |
| Engineering | 3 | 6.2% |
| Multidisciplinary Studies | 0 | 0.0% |
| Science & Technology | 0 | 0.0% |
| Business | 2 | 4.2% |
| Education | 27 | 56.2% |
| Literature & Languages | 0 | 0.0% |
| Liberal Arts & History | 3 | 6.2% |
| Visual & Performing Arts | 0 | 0.0% |
| Communications | 0 | 0.0% |
| Arts & Humanities | 0 | 0.0% |
| Total | 48 | 100.0% |
Transportation & Commute in Kooskia
Vehicle Availability by Sex in Kooskia
The most prevalent vehicle ownership categories in Kooskia are males with 2 vehicles (34, accounting for 44.7%) and females with 2 vehicles (25, making up 53.1%).
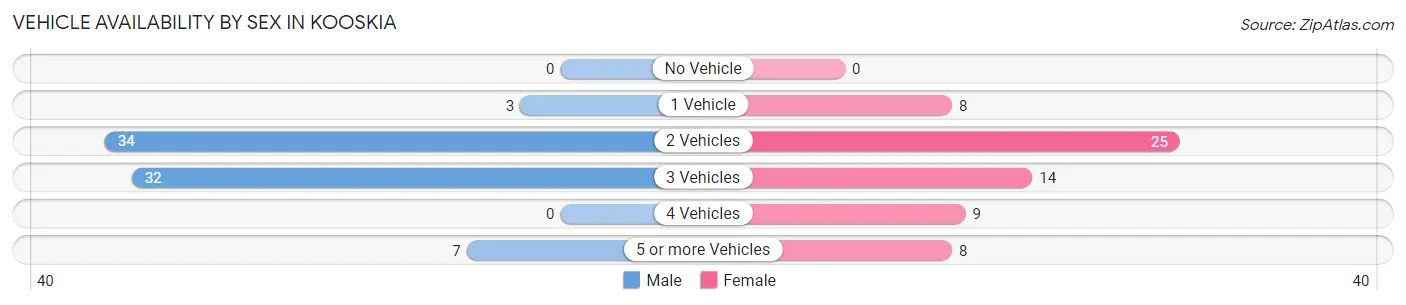
| Vehicles Available | Male | Female |
| No Vehicle | 0 (0.0%) | 0 (0.0%) |
| 1 Vehicle | 3 (4.0%) | 8 (12.5%) |
| 2 Vehicles | 34 (44.7%) | 25 (39.1%) |
| 3 Vehicles | 32 (42.1%) | 14 (21.9%) |
| 4 Vehicles | 0 (0.0%) | 9 (14.1%) |
| 5 or more Vehicles | 7 (9.2%) | 8 (12.5%) |
| Total | 76 (100.0%) | 64 (100.0%) |
Commute Time in Kooskia
The most frequently occuring commute durations in Kooskia are 10 to 14 minutes (31 commuters, 22.1%), 15 to 19 minutes (27 commuters, 19.3%), and 5 to 9 minutes (24 commuters, 17.1%).
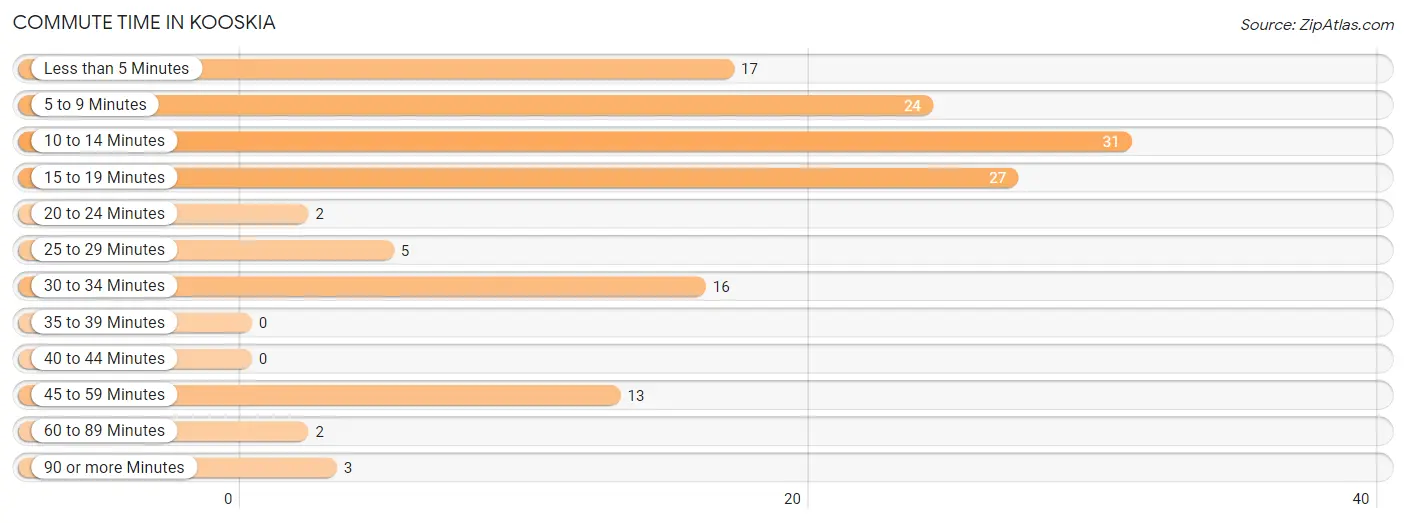
| Commute Time | # Commuters | % Commuters |
| Less than 5 Minutes | 17 | 12.1% |
| 5 to 9 Minutes | 24 | 17.1% |
| 10 to 14 Minutes | 31 | 22.1% |
| 15 to 19 Minutes | 27 | 19.3% |
| 20 to 24 Minutes | 2 | 1.4% |
| 25 to 29 Minutes | 5 | 3.6% |
| 30 to 34 Minutes | 16 | 11.4% |
| 35 to 39 Minutes | 0 | 0.0% |
| 40 to 44 Minutes | 0 | 0.0% |
| 45 to 59 Minutes | 13 | 9.3% |
| 60 to 89 Minutes | 2 | 1.4% |
| 90 or more Minutes | 3 | 2.1% |
Commute Time by Sex in Kooskia
The most common commute times in Kooskia are 15 to 19 minutes (18 commuters, 23.7%) for males and 10 to 14 minutes (18 commuters, 28.1%) for females.
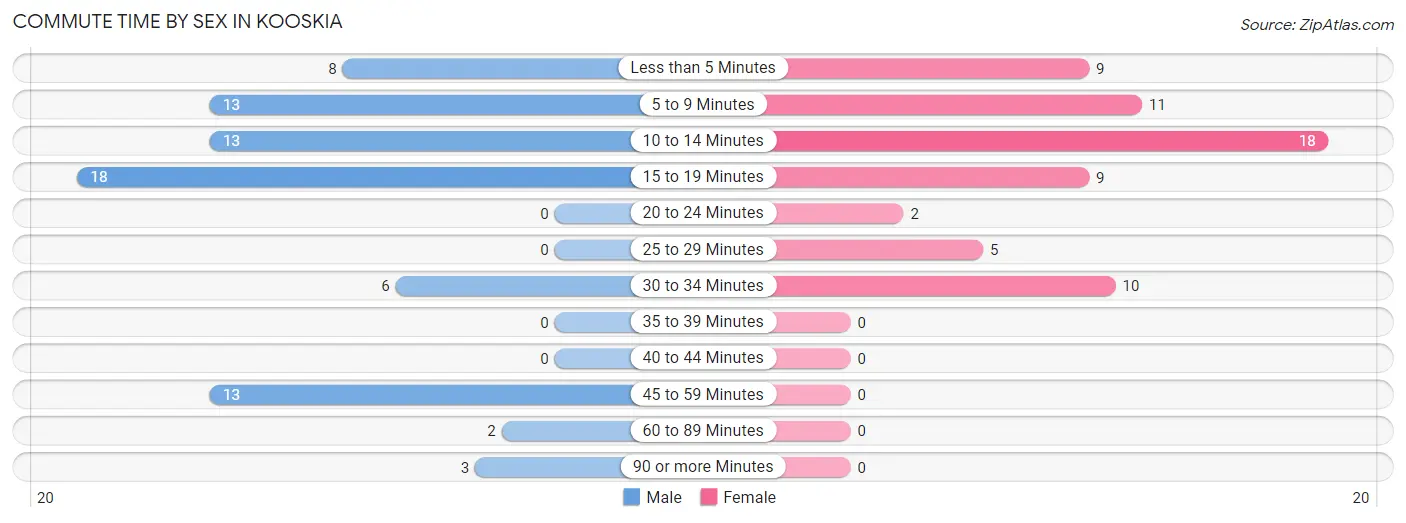
| Commute Time | Male | Female |
| Less than 5 Minutes | 8 (10.5%) | 9 (14.1%) |
| 5 to 9 Minutes | 13 (17.1%) | 11 (17.2%) |
| 10 to 14 Minutes | 13 (17.1%) | 18 (28.1%) |
| 15 to 19 Minutes | 18 (23.7%) | 9 (14.1%) |
| 20 to 24 Minutes | 0 (0.0%) | 2 (3.1%) |
| 25 to 29 Minutes | 0 (0.0%) | 5 (7.8%) |
| 30 to 34 Minutes | 6 (7.9%) | 10 (15.6%) |
| 35 to 39 Minutes | 0 (0.0%) | 0 (0.0%) |
| 40 to 44 Minutes | 0 (0.0%) | 0 (0.0%) |
| 45 to 59 Minutes | 13 (17.1%) | 0 (0.0%) |
| 60 to 89 Minutes | 2 (2.6%) | 0 (0.0%) |
| 90 or more Minutes | 3 (4.0%) | 0 (0.0%) |
Time of Departure to Work by Sex in Kooskia
The most frequent times of departure to work in Kooskia are 12:00 AM to 4:59 AM (21, 27.6%) for males and 12:00 AM to 4:59 AM (12, 18.8%) for females.
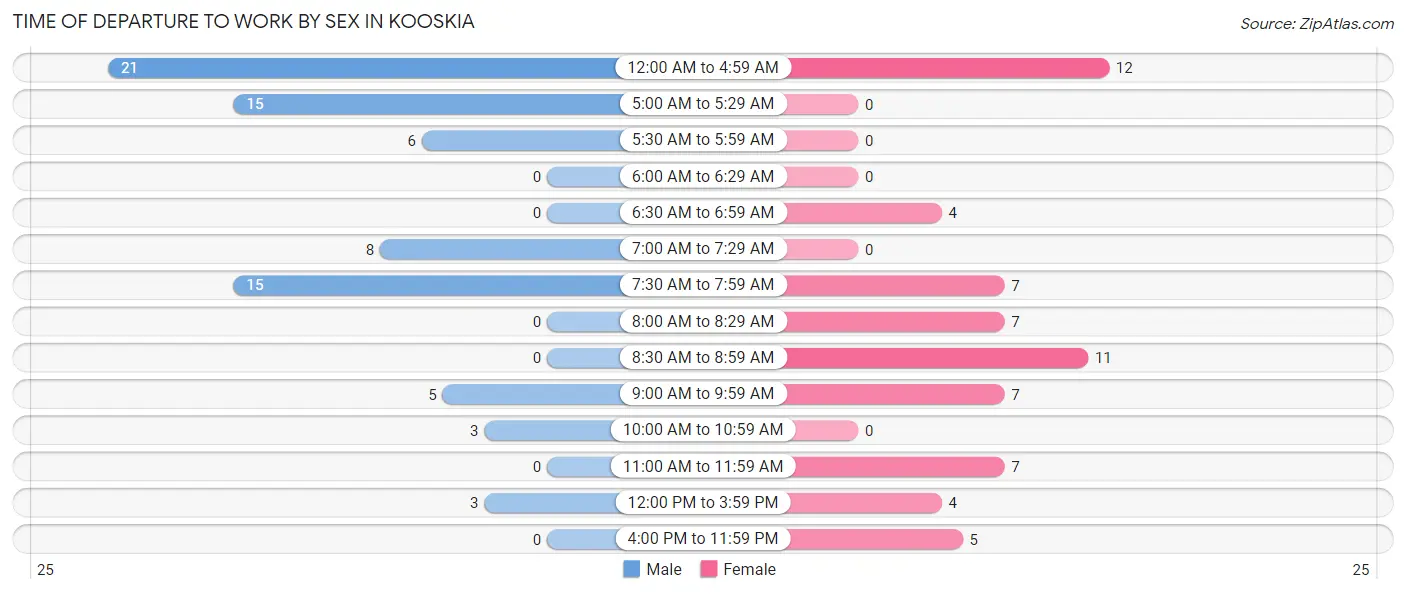
| Time of Departure | Male | Female |
| 12:00 AM to 4:59 AM | 21 (27.6%) | 12 (18.8%) |
| 5:00 AM to 5:29 AM | 15 (19.7%) | 0 (0.0%) |
| 5:30 AM to 5:59 AM | 6 (7.9%) | 0 (0.0%) |
| 6:00 AM to 6:29 AM | 0 (0.0%) | 0 (0.0%) |
| 6:30 AM to 6:59 AM | 0 (0.0%) | 4 (6.2%) |
| 7:00 AM to 7:29 AM | 8 (10.5%) | 0 (0.0%) |
| 7:30 AM to 7:59 AM | 15 (19.7%) | 7 (10.9%) |
| 8:00 AM to 8:29 AM | 0 (0.0%) | 7 (10.9%) |
| 8:30 AM to 8:59 AM | 0 (0.0%) | 11 (17.2%) |
| 9:00 AM to 9:59 AM | 5 (6.6%) | 7 (10.9%) |
| 10:00 AM to 10:59 AM | 3 (4.0%) | 0 (0.0%) |
| 11:00 AM to 11:59 AM | 0 (0.0%) | 7 (10.9%) |
| 12:00 PM to 3:59 PM | 3 (4.0%) | 4 (6.2%) |
| 4:00 PM to 11:59 PM | 0 (0.0%) | 5 (7.8%) |
| Total | 76 (100.0%) | 64 (100.0%) |
Housing Occupancy in Kooskia
Occupancy by Ownership in Kooskia
Of the total 249 dwellings in Kooskia, owner-occupied units account for 203 (81.5%), while renter-occupied units make up 46 (18.5%).

| Occupancy | # Housing Units | % Housing Units |
| Owner Occupied Housing Units | 203 | 81.5% |
| Renter-Occupied Housing Units | 46 | 18.5% |
| Total Occupied Housing Units | 249 | 100.0% |
Occupancy by Household Size in Kooskia
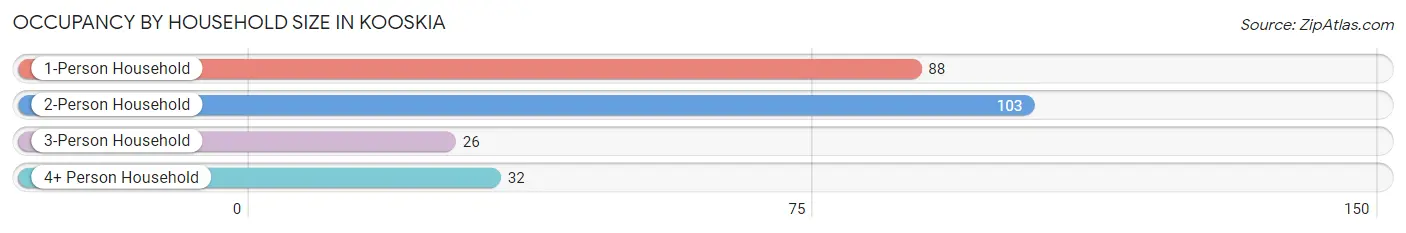
| Household Size | # Housing Units | % Housing Units |
| 1-Person Household | 88 | 35.3% |
| 2-Person Household | 103 | 41.4% |
| 3-Person Household | 26 | 10.4% |
| 4+ Person Household | 32 | 12.9% |
| Total Housing Units | 249 | 100.0% |
Occupancy by Ownership by Household Size in Kooskia
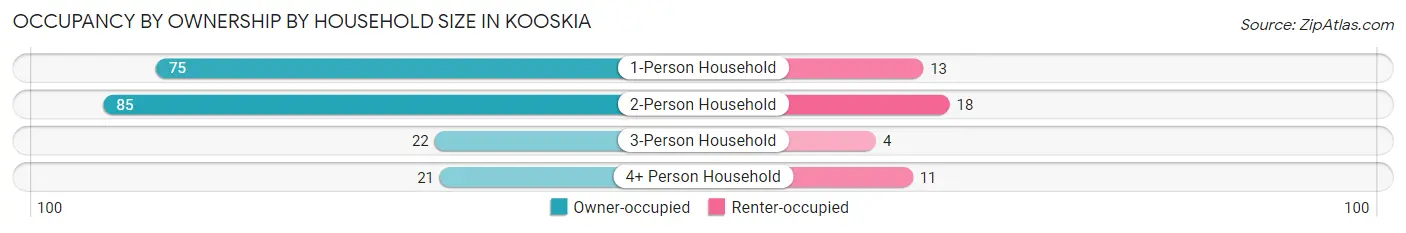
| Household Size | Owner-occupied | Renter-occupied |
| 1-Person Household | 75 (85.2%) | 13 (14.8%) |
| 2-Person Household | 85 (82.5%) | 18 (17.5%) |
| 3-Person Household | 22 (84.6%) | 4 (15.4%) |
| 4+ Person Household | 21 (65.6%) | 11 (34.4%) |
| Total Housing Units | 203 (81.5%) | 46 (18.5%) |
Occupancy by Educational Attainment in Kooskia
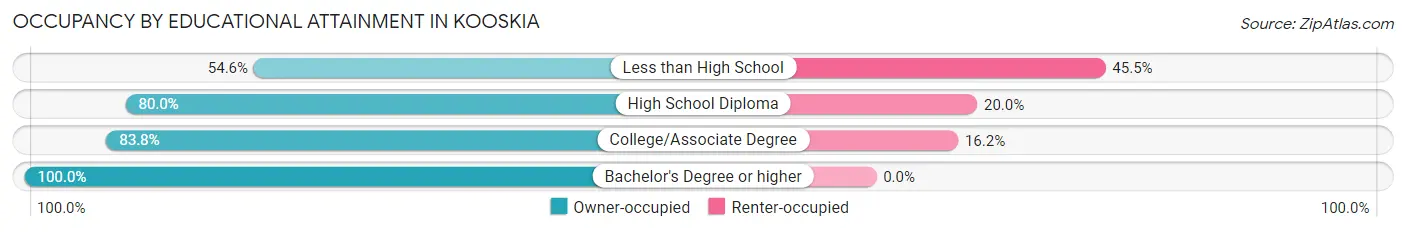
| Household Size | Owner-occupied | Renter-occupied |
| Less than High School | 12 (54.5%) | 10 (45.5%) |
| High School Diploma | 96 (80.0%) | 24 (20.0%) |
| College/Associate Degree | 62 (83.8%) | 12 (16.2%) |
| Bachelor's Degree or higher | 33 (100.0%) | 0 (0.0%) |
Occupancy by Age of Householder in Kooskia
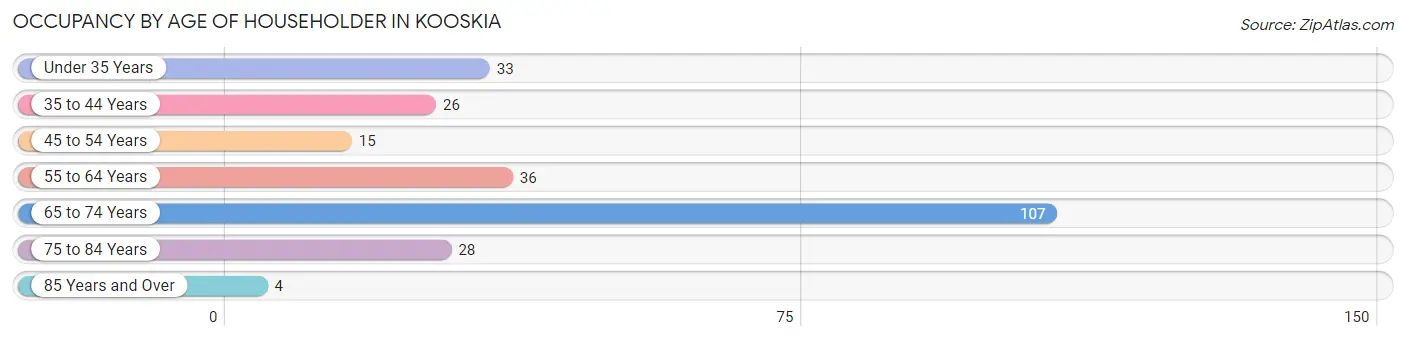
| Age Bracket | # Households | % Households |
| Under 35 Years | 33 | 13.3% |
| 35 to 44 Years | 26 | 10.4% |
| 45 to 54 Years | 15 | 6.0% |
| 55 to 64 Years | 36 | 14.5% |
| 65 to 74 Years | 107 | 43.0% |
| 75 to 84 Years | 28 | 11.2% |
| 85 Years and Over | 4 | 1.6% |
| Total | 249 | 100.0% |
Housing Finances in Kooskia
Median Income by Occupancy in Kooskia
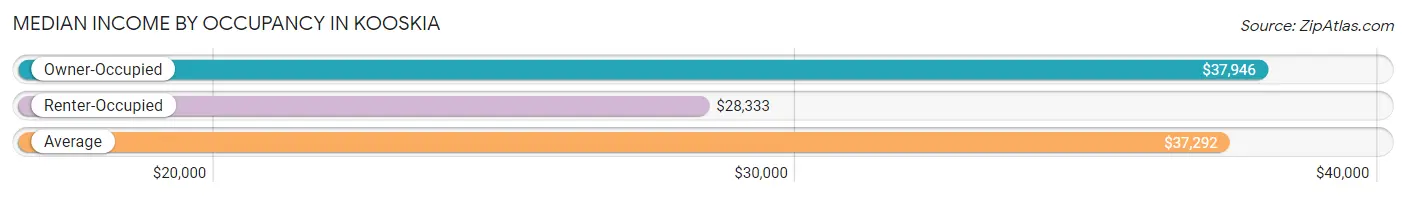
| Occupancy Type | # Households | Median Income |
| Owner-Occupied | 203 (81.5%) | $37,946 |
| Renter-Occupied | 46 (18.5%) | $28,333 |
| Average | 249 (100.0%) | $37,292 |
Occupancy by Householder Income Bracket in Kooskia
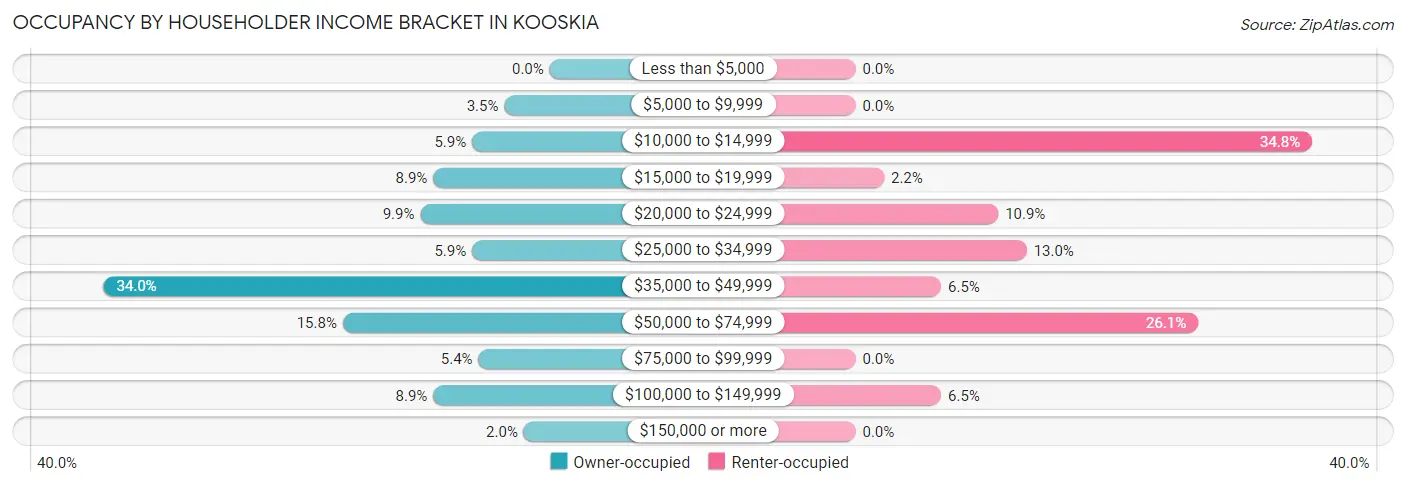
| Income Bracket | Owner-occupied | Renter-occupied |
| Less than $5,000 | 0 (0.0%) | 0 (0.0%) |
| $5,000 to $9,999 | 7 (3.5%) | 0 (0.0%) |
| $10,000 to $14,999 | 12 (5.9%) | 16 (34.8%) |
| $15,000 to $19,999 | 18 (8.9%) | 1 (2.2%) |
| $20,000 to $24,999 | 20 (9.9%) | 5 (10.9%) |
| $25,000 to $34,999 | 12 (5.9%) | 6 (13.0%) |
| $35,000 to $49,999 | 69 (34.0%) | 3 (6.5%) |
| $50,000 to $74,999 | 32 (15.8%) | 12 (26.1%) |
| $75,000 to $99,999 | 11 (5.4%) | 0 (0.0%) |
| $100,000 to $149,999 | 18 (8.9%) | 3 (6.5%) |
| $150,000 or more | 4 (2.0%) | 0 (0.0%) |
| Total | 203 (100.0%) | 46 (100.0%) |
Monthly Housing Cost Tiers in Kooskia
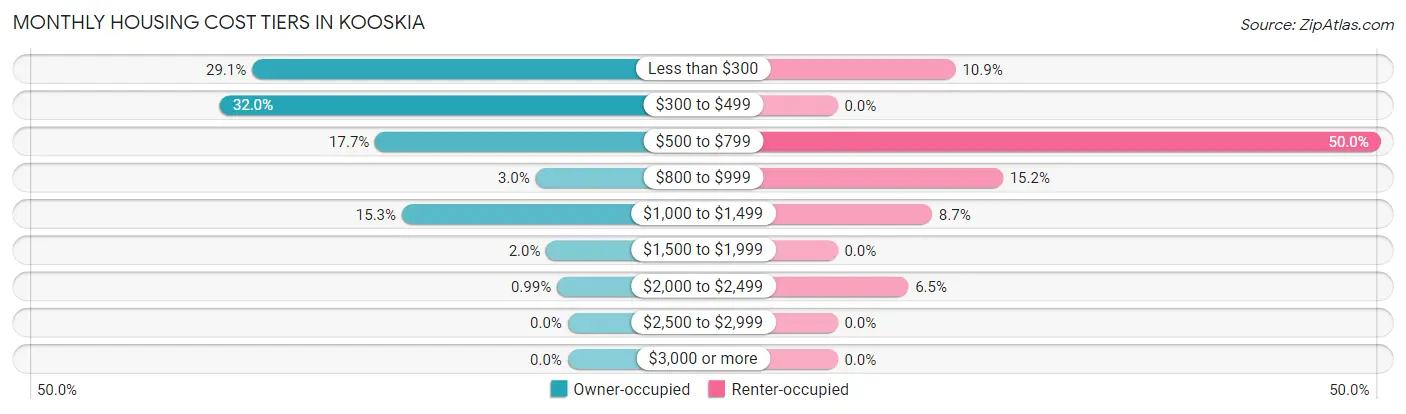
| Monthly Cost | Owner-occupied | Renter-occupied |
| Less than $300 | 59 (29.1%) | 5 (10.9%) |
| $300 to $499 | 65 (32.0%) | 0 (0.0%) |
| $500 to $799 | 36 (17.7%) | 23 (50.0%) |
| $800 to $999 | 6 (3.0%) | 7 (15.2%) |
| $1,000 to $1,499 | 31 (15.3%) | 4 (8.7%) |
| $1,500 to $1,999 | 4 (2.0%) | 0 (0.0%) |
| $2,000 to $2,499 | 2 (1.0%) | 3 (6.5%) |
| $2,500 to $2,999 | 0 (0.0%) | 0 (0.0%) |
| $3,000 or more | 0 (0.0%) | 0 (0.0%) |
| Total | 203 (100.0%) | 46 (100.0%) |
Physical Housing Characteristics in Kooskia
Housing Structures in Kooskia
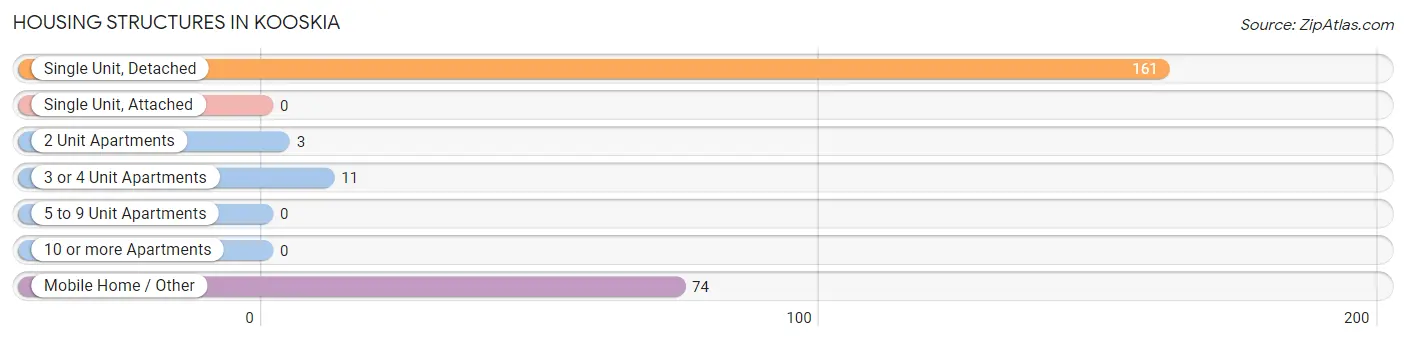
| Structure Type | # Housing Units | % Housing Units |
| Single Unit, Detached | 161 | 64.7% |
| Single Unit, Attached | 0 | 0.0% |
| 2 Unit Apartments | 3 | 1.2% |
| 3 or 4 Unit Apartments | 11 | 4.4% |
| 5 to 9 Unit Apartments | 0 | 0.0% |
| 10 or more Apartments | 0 | 0.0% |
| Mobile Home / Other | 74 | 29.7% |
| Total | 249 | 100.0% |
Housing Structures by Occupancy in Kooskia
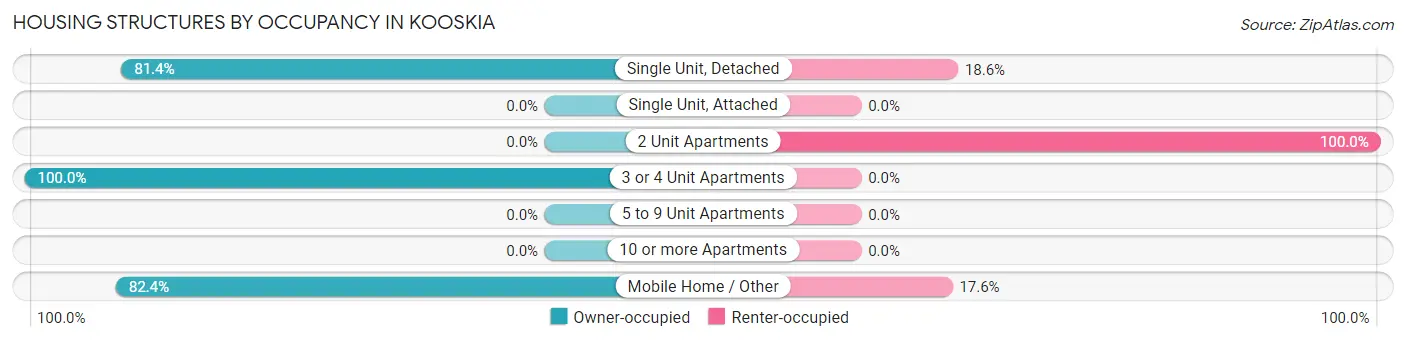
| Structure Type | Owner-occupied | Renter-occupied |
| Single Unit, Detached | 131 (81.4%) | 30 (18.6%) |
| Single Unit, Attached | 0 (0.0%) | 0 (0.0%) |
| 2 Unit Apartments | 0 (0.0%) | 3 (100.0%) |
| 3 or 4 Unit Apartments | 11 (100.0%) | 0 (0.0%) |
| 5 to 9 Unit Apartments | 0 (0.0%) | 0 (0.0%) |
| 10 or more Apartments | 0 (0.0%) | 0 (0.0%) |
| Mobile Home / Other | 61 (82.4%) | 13 (17.6%) |
| Total | 203 (81.5%) | 46 (18.5%) |
Housing Structures by Number of Rooms in Kooskia
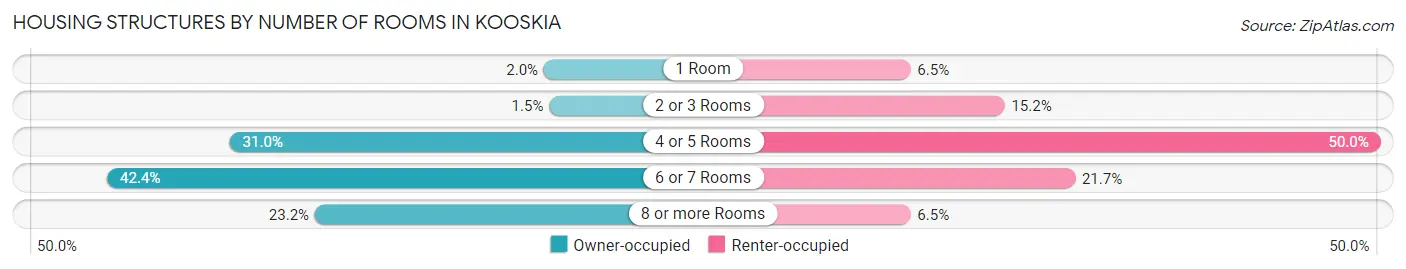
| Number of Rooms | Owner-occupied | Renter-occupied |
| 1 Room | 4 (2.0%) | 3 (6.5%) |
| 2 or 3 Rooms | 3 (1.5%) | 7 (15.2%) |
| 4 or 5 Rooms | 63 (31.0%) | 23 (50.0%) |
| 6 or 7 Rooms | 86 (42.4%) | 10 (21.7%) |
| 8 or more Rooms | 47 (23.2%) | 3 (6.5%) |
| Total | 203 (100.0%) | 46 (100.0%) |
Housing Structure by Heating Type in Kooskia
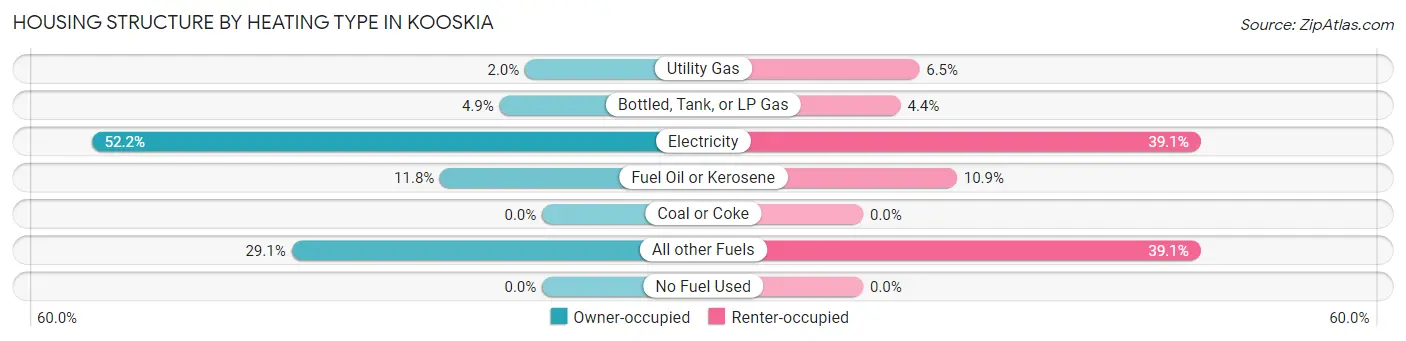
| Heating Type | Owner-occupied | Renter-occupied |
| Utility Gas | 4 (2.0%) | 3 (6.5%) |
| Bottled, Tank, or LP Gas | 10 (4.9%) | 2 (4.3%) |
| Electricity | 106 (52.2%) | 18 (39.1%) |
| Fuel Oil or Kerosene | 24 (11.8%) | 5 (10.9%) |
| Coal or Coke | 0 (0.0%) | 0 (0.0%) |
| All other Fuels | 59 (29.1%) | 18 (39.1%) |
| No Fuel Used | 0 (0.0%) | 0 (0.0%) |
| Total | 203 (100.0%) | 46 (100.0%) |
Household Vehicle Usage in Kooskia
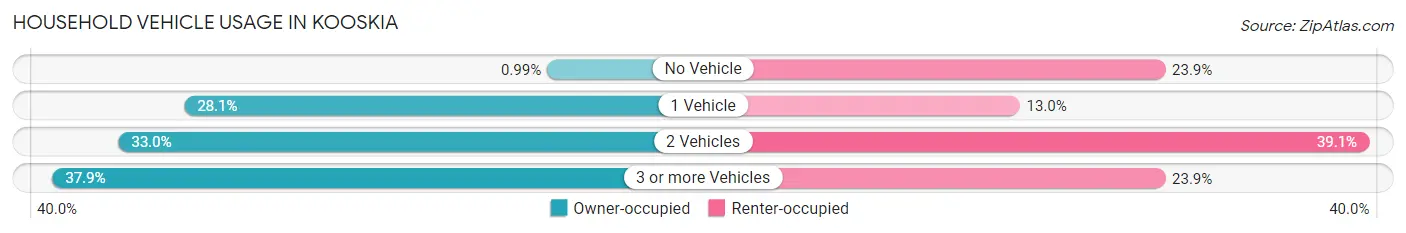
| Vehicles per Household | Owner-occupied | Renter-occupied |
| No Vehicle | 2 (1.0%) | 11 (23.9%) |
| 1 Vehicle | 57 (28.1%) | 6 (13.0%) |
| 2 Vehicles | 67 (33.0%) | 18 (39.1%) |
| 3 or more Vehicles | 77 (37.9%) | 11 (23.9%) |
| Total | 203 (100.0%) | 46 (100.0%) |
Real Estate & Mortgages in Kooskia
Real Estate and Mortgage Overview in Kooskia
| Characteristic | Without Mortgage | With Mortgage |
| Housing Units | 140 | 63 |
| Median Property Value | $153,900 | $139,600 |
| Median Household Income | $37,019 | $3 |
| Monthly Housing Costs | $342 | $0 |
| Real Estate Taxes | $542 | $5 |
Property Value by Mortgage Status in Kooskia
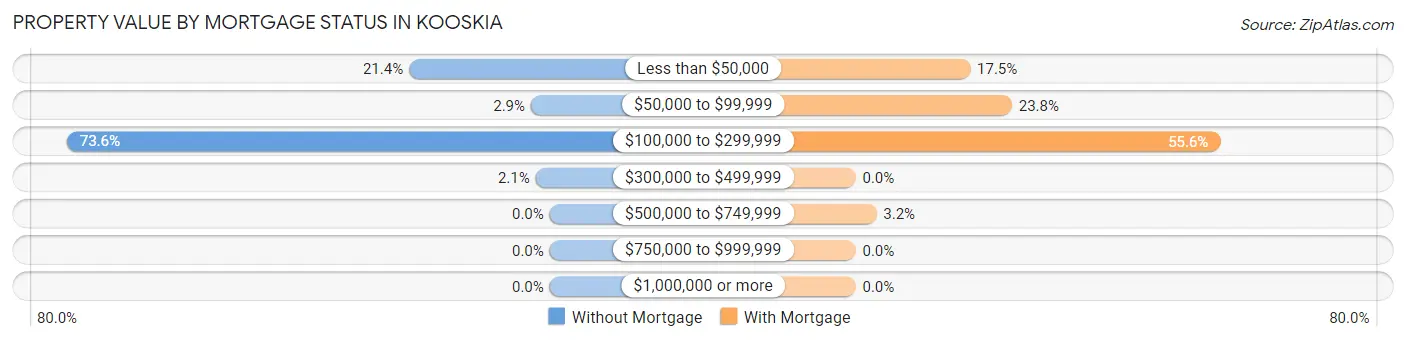
| Property Value | Without Mortgage | With Mortgage |
| Less than $50,000 | 30 (21.4%) | 11 (17.5%) |
| $50,000 to $99,999 | 4 (2.9%) | 15 (23.8%) |
| $100,000 to $299,999 | 103 (73.6%) | 35 (55.6%) |
| $300,000 to $499,999 | 3 (2.1%) | 0 (0.0%) |
| $500,000 to $749,999 | 0 (0.0%) | 2 (3.2%) |
| $750,000 to $999,999 | 0 (0.0%) | 0 (0.0%) |
| $1,000,000 or more | 0 (0.0%) | 0 (0.0%) |
| Total | 140 (100.0%) | 63 (100.0%) |
Household Income by Mortgage Status in Kooskia
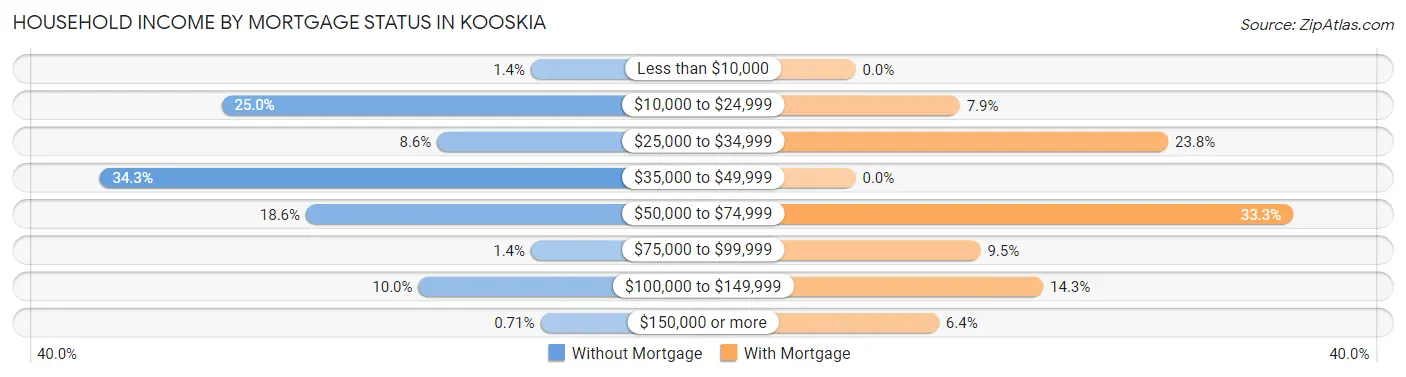
| Household Income | Without Mortgage | With Mortgage |
| Less than $10,000 | 2 (1.4%) | 0 (0.0%) |
| $10,000 to $24,999 | 35 (25.0%) | 5 (7.9%) |
| $25,000 to $34,999 | 12 (8.6%) | 15 (23.8%) |
| $35,000 to $49,999 | 48 (34.3%) | 0 (0.0%) |
| $50,000 to $74,999 | 26 (18.6%) | 21 (33.3%) |
| $75,000 to $99,999 | 2 (1.4%) | 6 (9.5%) |
| $100,000 to $149,999 | 14 (10.0%) | 9 (14.3%) |
| $150,000 or more | 1 (0.7%) | 4 (6.4%) |
| Total | 140 (100.0%) | 63 (100.0%) |
Property Value to Household Income Ratio in Kooskia
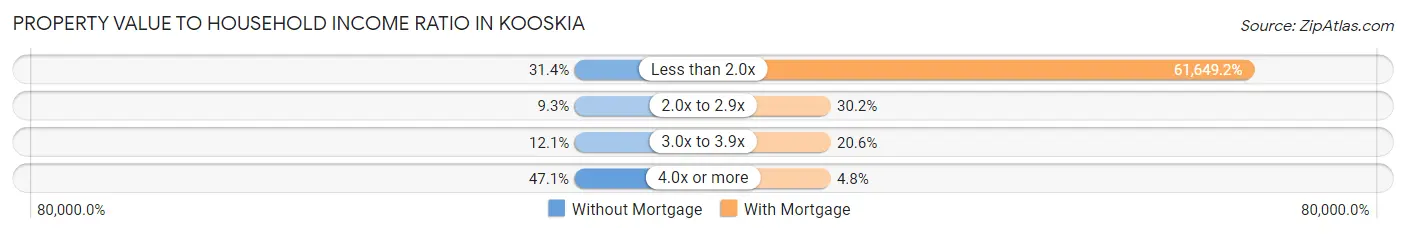
| Value-to-Income Ratio | Without Mortgage | With Mortgage |
| Less than 2.0x | 44 (31.4%) | 38,839 (61,649.2%) |
| 2.0x to 2.9x | 13 (9.3%) | 19 (30.2%) |
| 3.0x to 3.9x | 17 (12.1%) | 13 (20.6%) |
| 4.0x or more | 66 (47.1%) | 3 (4.8%) |
| Total | 140 (100.0%) | 63 (100.0%) |
Real Estate Taxes by Mortgage Status in Kooskia
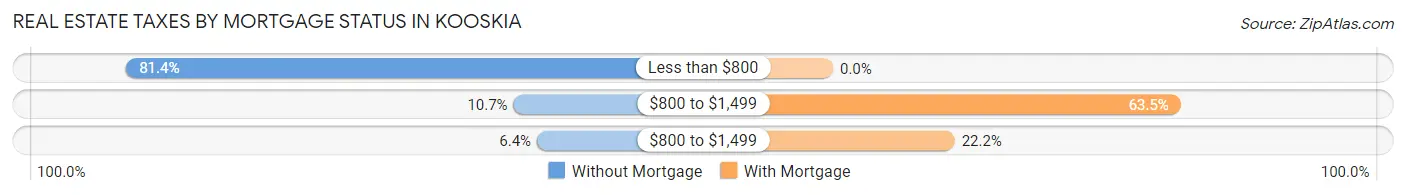
| Property Taxes | Without Mortgage | With Mortgage |
| Less than $800 | 114 (81.4%) | 0 (0.0%) |
| $800 to $1,499 | 15 (10.7%) | 40 (63.5%) |
| $800 to $1,499 | 9 (6.4%) | 14 (22.2%) |
| Total | 140 (100.0%) | 63 (100.0%) |
Health & Disability in Kooskia
Health Insurance Coverage by Age in Kooskia
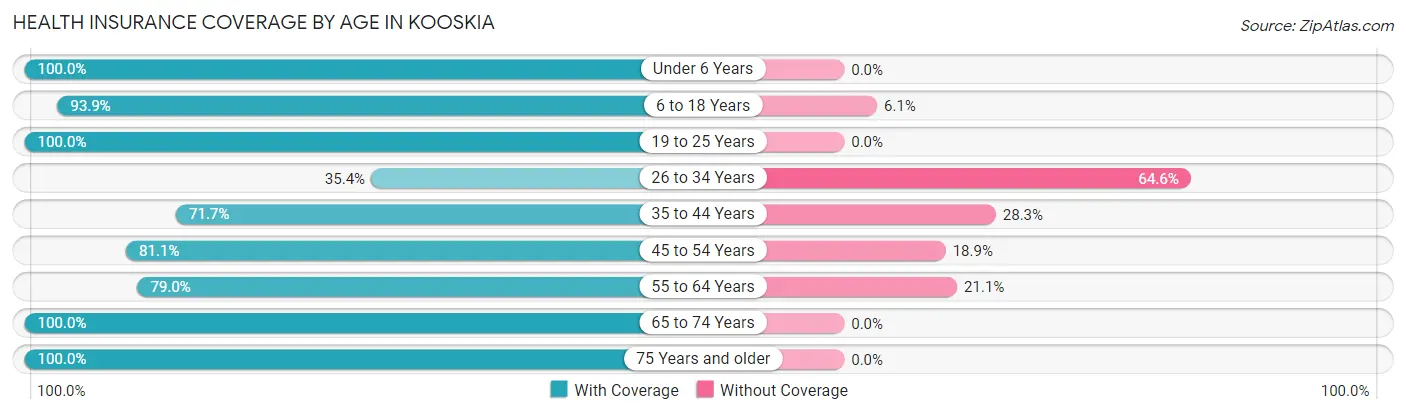
| Age Bracket | With Coverage | Without Coverage |
| Under 6 Years | 26 (100.0%) | 0 (0.0%) |
| 6 to 18 Years | 92 (93.9%) | 6 (6.1%) |
| 19 to 25 Years | 17 (100.0%) | 0 (0.0%) |
| 26 to 34 Years | 17 (35.4%) | 31 (64.6%) |
| 35 to 44 Years | 33 (71.7%) | 13 (28.3%) |
| 45 to 54 Years | 30 (81.1%) | 7 (18.9%) |
| 55 to 64 Years | 75 (78.9%) | 20 (21.0%) |
| 65 to 74 Years | 192 (100.0%) | 0 (0.0%) |
| 75 Years and older | 49 (100.0%) | 0 (0.0%) |
| Total | 531 (87.3%) | 77 (12.7%) |
Health Insurance Coverage by Citizenship Status in Kooskia
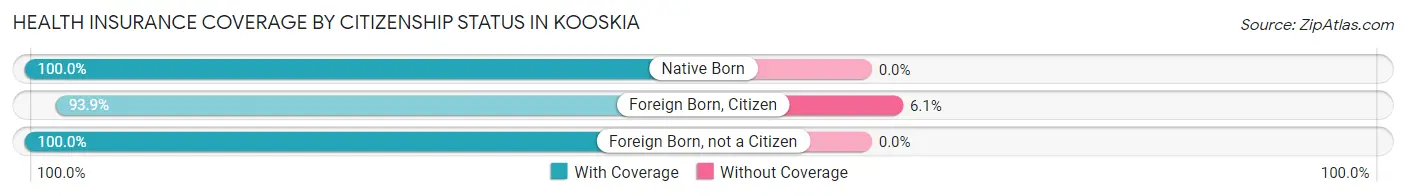
| Citizenship Status | With Coverage | Without Coverage |
| Native Born | 26 (100.0%) | 0 (0.0%) |
| Foreign Born, Citizen | 92 (93.9%) | 6 (6.1%) |
| Foreign Born, not a Citizen | 17 (100.0%) | 0 (0.0%) |
Health Insurance Coverage by Household Income in Kooskia
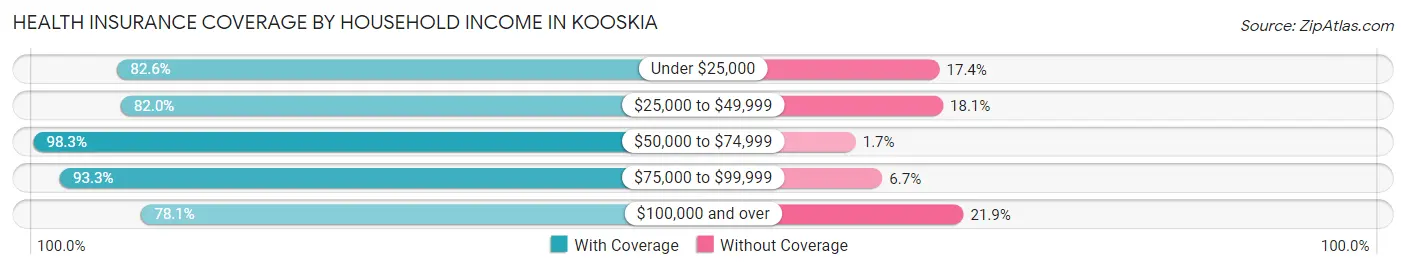
| Household Income | With Coverage | Without Coverage |
| Under $25,000 | 95 (82.6%) | 20 (17.4%) |
| $25,000 to $49,999 | 168 (82.0%) | 37 (18.0%) |
| $50,000 to $74,999 | 176 (98.3%) | 3 (1.7%) |
| $75,000 to $99,999 | 42 (93.3%) | 3 (6.7%) |
| $100,000 and over | 50 (78.1%) | 14 (21.9%) |
Public vs Private Health Insurance Coverage by Age in Kooskia
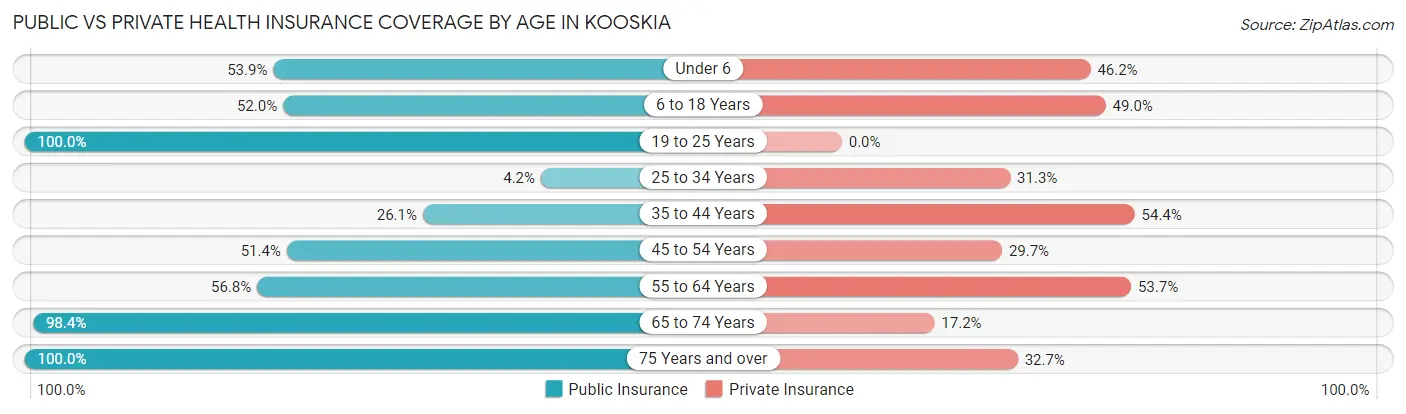
| Age Bracket | Public Insurance | Private Insurance |
| Under 6 | 14 (53.8%) | 12 (46.2%) |
| 6 to 18 Years | 51 (52.0%) | 48 (49.0%) |
| 19 to 25 Years | 17 (100.0%) | 0 (0.0%) |
| 25 to 34 Years | 2 (4.2%) | 15 (31.2%) |
| 35 to 44 Years | 12 (26.1%) | 25 (54.3%) |
| 45 to 54 Years | 19 (51.3%) | 11 (29.7%) |
| 55 to 64 Years | 54 (56.8%) | 51 (53.7%) |
| 65 to 74 Years | 189 (98.4%) | 33 (17.2%) |
| 75 Years and over | 49 (100.0%) | 16 (32.7%) |
| Total | 407 (66.9%) | 211 (34.7%) |
Disability Status by Sex by Age in Kooskia
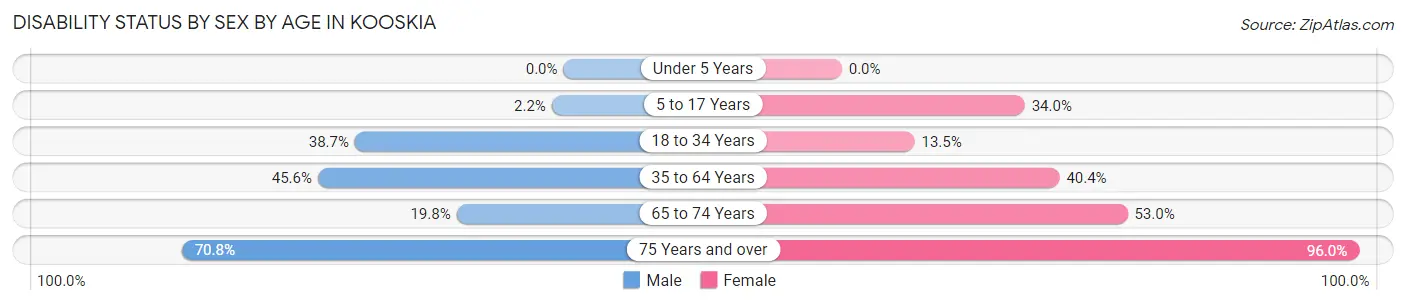
| Age Bracket | Male | Female |
| Under 5 Years | 0 (0.0%) | 0 (0.0%) |
| 5 to 17 Years | 1 (2.2%) | 18 (34.0%) |
| 18 to 34 Years | 12 (38.7%) | 5 (13.5%) |
| 35 to 64 Years | 36 (45.6%) | 40 (40.4%) |
| 65 to 74 Years | 25 (19.8%) | 35 (53.0%) |
| 75 Years and over | 17 (70.8%) | 24 (96.0%) |
Disability Class by Sex by Age in Kooskia
Disability Class: Hearing Difficulty
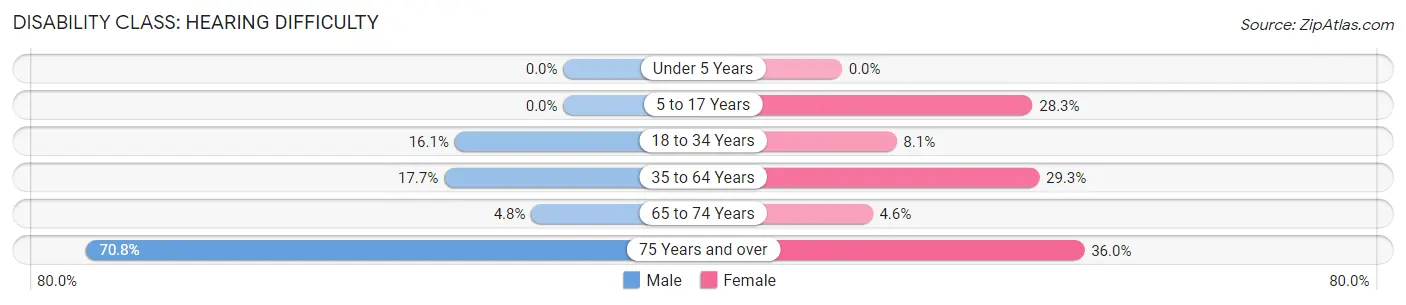
| Age Bracket | Male | Female |
| Under 5 Years | 0 (0.0%) | 0 (0.0%) |
| 5 to 17 Years | 0 (0.0%) | 15 (28.3%) |
| 18 to 34 Years | 5 (16.1%) | 3 (8.1%) |
| 35 to 64 Years | 14 (17.7%) | 29 (29.3%) |
| 65 to 74 Years | 6 (4.8%) | 3 (4.5%) |
| 75 Years and over | 17 (70.8%) | 9 (36.0%) |
Disability Class: Vision Difficulty
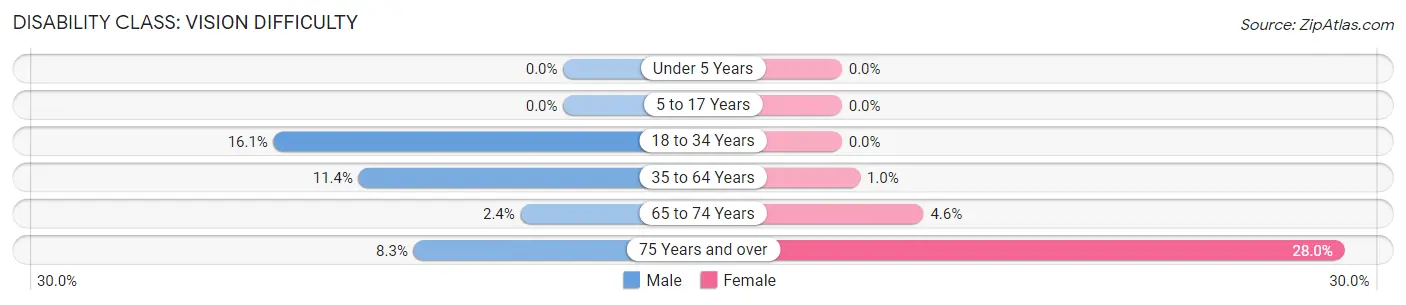
| Age Bracket | Male | Female |
| Under 5 Years | 0 (0.0%) | 0 (0.0%) |
| 5 to 17 Years | 0 (0.0%) | 0 (0.0%) |
| 18 to 34 Years | 5 (16.1%) | 0 (0.0%) |
| 35 to 64 Years | 9 (11.4%) | 1 (1.0%) |
| 65 to 74 Years | 3 (2.4%) | 3 (4.5%) |
| 75 Years and over | 2 (8.3%) | 7 (28.0%) |
Disability Class: Cognitive Difficulty
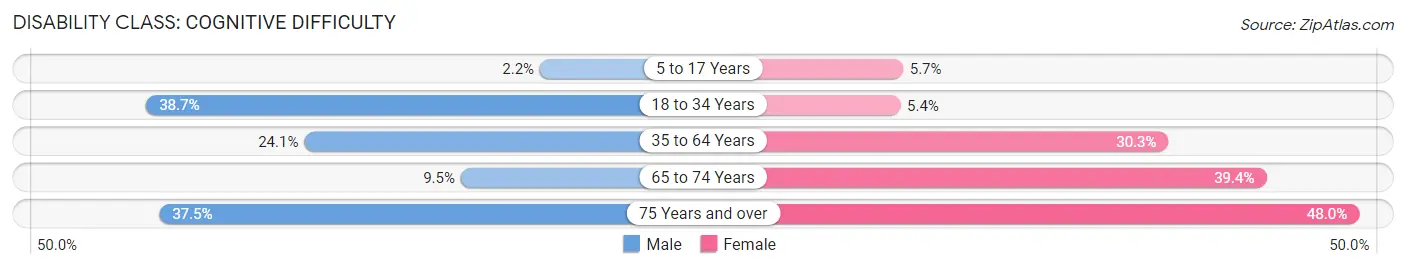
| Age Bracket | Male | Female |
| 5 to 17 Years | 1 (2.2%) | 3 (5.7%) |
| 18 to 34 Years | 12 (38.7%) | 2 (5.4%) |
| 35 to 64 Years | 19 (24.0%) | 30 (30.3%) |
| 65 to 74 Years | 12 (9.5%) | 26 (39.4%) |
| 75 Years and over | 9 (37.5%) | 12 (48.0%) |
Disability Class: Ambulatory Difficulty
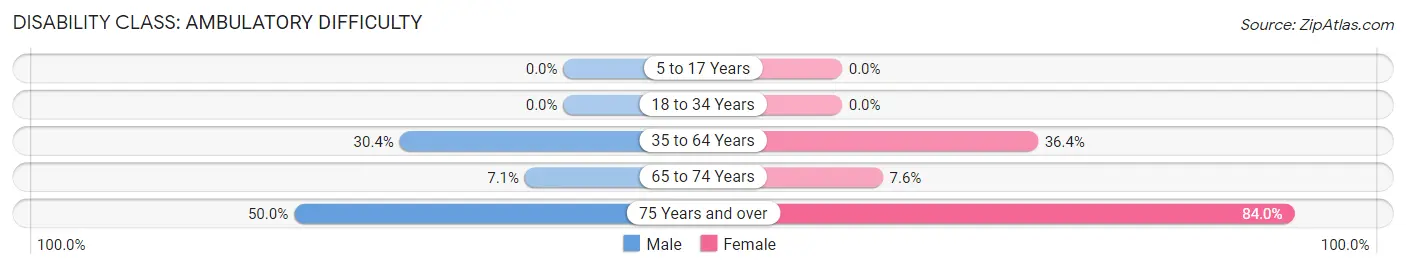
| Age Bracket | Male | Female |
| 5 to 17 Years | 0 (0.0%) | 0 (0.0%) |
| 18 to 34 Years | 0 (0.0%) | 0 (0.0%) |
| 35 to 64 Years | 24 (30.4%) | 36 (36.4%) |
| 65 to 74 Years | 9 (7.1%) | 5 (7.6%) |
| 75 Years and over | 12 (50.0%) | 21 (84.0%) |
Disability Class: Self-Care Difficulty
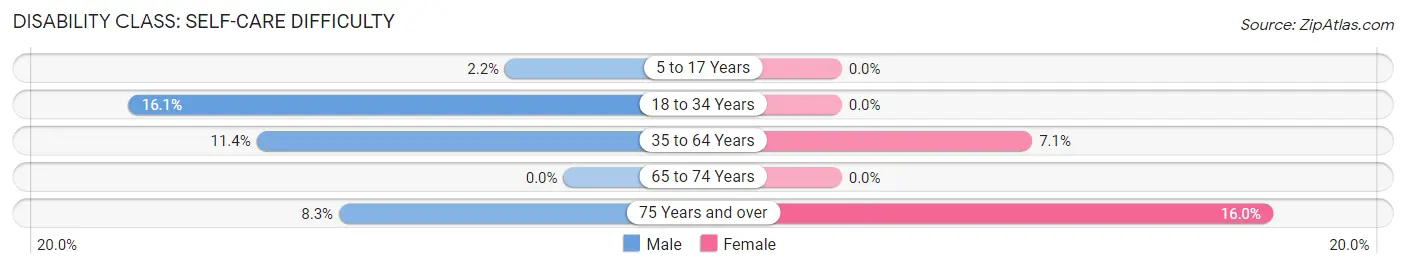
| Age Bracket | Male | Female |
| 5 to 17 Years | 1 (2.2%) | 0 (0.0%) |
| 18 to 34 Years | 5 (16.1%) | 0 (0.0%) |
| 35 to 64 Years | 9 (11.4%) | 7 (7.1%) |
| 65 to 74 Years | 0 (0.0%) | 0 (0.0%) |
| 75 Years and over | 2 (8.3%) | 4 (16.0%) |
Technology Access in Kooskia
Computing Device Access in Kooskia
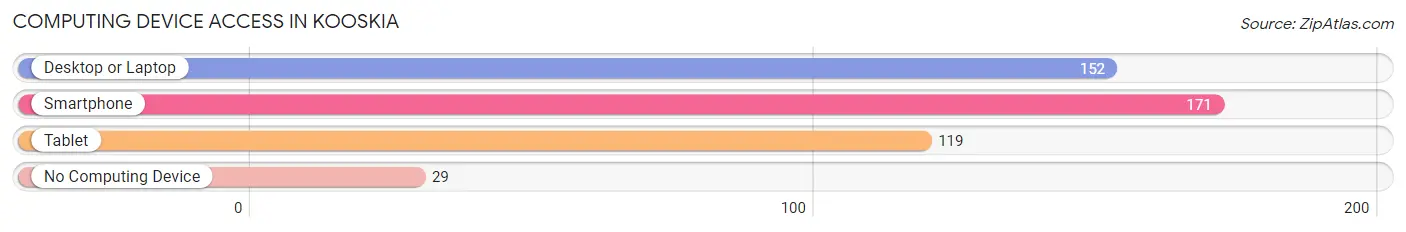
| Device Type | # Households | % Households |
| Desktop or Laptop | 152 | 61.0% |
| Smartphone | 171 | 68.7% |
| Tablet | 119 | 47.8% |
| No Computing Device | 29 | 11.7% |
| Total | 249 | 100.0% |
Internet Access in Kooskia
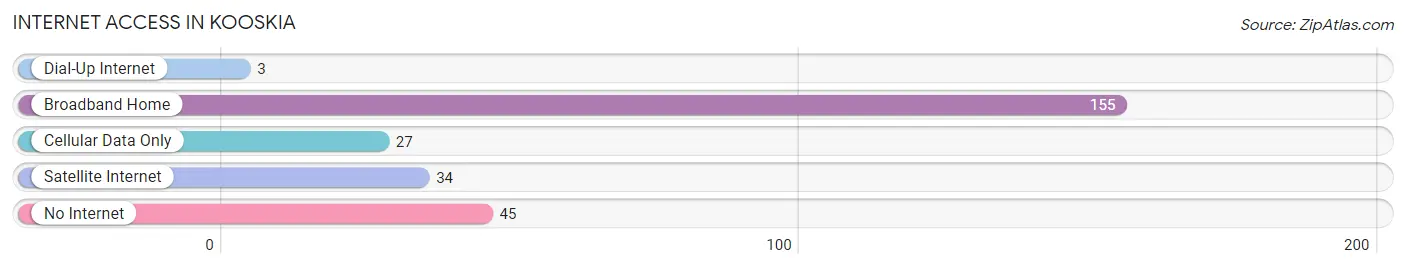
| Internet Type | # Households | % Households |
| Dial-Up Internet | 3 | 1.2% |
| Broadband Home | 155 | 62.3% |
| Cellular Data Only | 27 | 10.8% |
| Satellite Internet | 34 | 13.7% |
| No Internet | 45 | 18.1% |
| Total | 249 | 100.0% |
Kooskia Summary
Kooskia, Idaho is a small town located in the Clearwater River Valley in the north central part of the state. It is situated in the Nez Perce Indian Reservation and is the county seat of Idaho County. The town was founded in 1883 and has a population of approximately 500 people.
Kooskia is located in the Clearwater River Valley, which is part of the Columbia Plateau. The area is characterized by rolling hills, deep canyons, and steep mountains. The Clearwater River runs through the valley and is a major source of irrigation for the area. The climate is semi-arid, with hot summers and cold winters.
The economy of Kooskia is largely based on agriculture and timber. The area is home to several large timber companies, which provide jobs for many of the town’s residents. The timber industry is also a major source of revenue for the town. In addition, Kooskia is home to several small businesses, including a grocery store, a hardware store, and a few restaurants.
The demographics of Kooskia are largely Native American. According to the 2010 census, the population of Kooskia was approximately 500 people, with the majority of the population being Native American. The median age of the population is 37.5 years, and the median household income is $30,000.
Kooskia is home to several attractions, including the Nez Perce National Historical Park, which is a popular destination for visitors. The park is home to several historical sites, including the Nez Perce National Historic Trail, which is a 1,170-mile trail that follows the route of the Nez Perce tribe during their 1877 flight from the U.S. Army. The park also features several cultural sites, including the Nez Perce National Historic Site, which is a museum dedicated to the history and culture of the Nez Perce tribe.
Kooskia is also home to several outdoor recreation opportunities, including fishing, hunting, camping, and hiking. The area is also home to several ski resorts, which offer skiing and snowboarding opportunities.
Kooskia is a small town with a rich history and culture. The town is home to several attractions, including the Nez Perce National Historical Park, and offers a variety of outdoor recreation opportunities. The town’s economy is largely based on agriculture and timber, and the population is largely Native American. Kooskia is a great place to visit and explore, and is a great place to call home.
Common Questions
What is Per Capita Income in Kooskia?
Per Capita income in Kooskia is $20,518.
What is the Median Family Income in Kooskia?
Median Family Income in Kooskia is $45,156.
What is the Median Household income in Kooskia?
Median Household Income in Kooskia is $37,292.
What is Income or Wage Gap in Kooskia?
Income or Wage Gap in Kooskia is 44.9%.
Women in Kooskia earn 55.1 cents for every dollar earned by a man.
What is Inequality or Gini Index in Kooskia?
Inequality or Gini Index in Kooskia is 0.37.
What is the Total Population of Kooskia?
Total Population of Kooskia is 608.
What is the Total Male Population of Kooskia?
Total Male Population of Kooskia is 312.
What is the Total Female Population of Kooskia?
Total Female Population of Kooskia is 296.
What is the Ratio of Males per 100 Females in Kooskia?
There are 105.41 Males per 100 Females in Kooskia.
What is the Ratio of Females per 100 Males in Kooskia?
There are 94.87 Females per 100 Males in Kooskia.
What is the Median Population Age in Kooskia?
Median Population Age in Kooskia is 56.0 Years.
What is the Average Family Size in Kooskia
Average Family Size in Kooskia is 2.9 People.
What is the Average Household Size in Kooskia
Average Household Size in Kooskia is 2.4 People.
How Large is the Labor Force in Kooskia?
There are 157 People in the Labor Forcein in Kooskia.
What is the Percentage of People in the Labor Force in Kooskia?
30.9% of People are in the Labor Force in Kooskia.
What is the Unemployment Rate in Kooskia?
Unemployment Rate in Kooskia is 4.5%.