Maupin, OR Map & Demographics
Maupin Map
Maupin Overview
$37,631
PER CAPITA INCOME
$44,583
AVG HOUSEHOLD INCOME
0.53
INEQUALITY / GINI INDEX
356
TOTAL POPULATION
168
MALE POPULATION
188
FEMALE POPULATION
89.36
MALES / 100 FEMALES
111.90
FEMALES / 100 MALES
56.8
MEDIAN AGE
2.5
AVG FAMILY SIZE
2.0
AVG HOUSEHOLD SIZE
128
LABOR FORCE [ PEOPLE ]
43.0%
PERCENT IN LABOR FORCE
Maupin Zip Codes
Maupin Area Codes
Income in Maupin
Income Overview in Maupin
| Characteristic | Number | Measure |
| Per Capita Income | 356 | $37,631 |
| Median Family Income | 91 | $0 |
| Mean Family Income | 91 | $118,533 |
| Median Household Income | 163 | $44,583 |
| Mean Household Income | 163 | $81,287 |
| Income Deficit | 91 | $0 |
| Wage / Income Gap (%) | 356 | 0.00% |
| Wage / Income Gap ($) | 356 | 100.00¢ per $1 |
| Gini / Inequality Index | 356 | 0.53 |
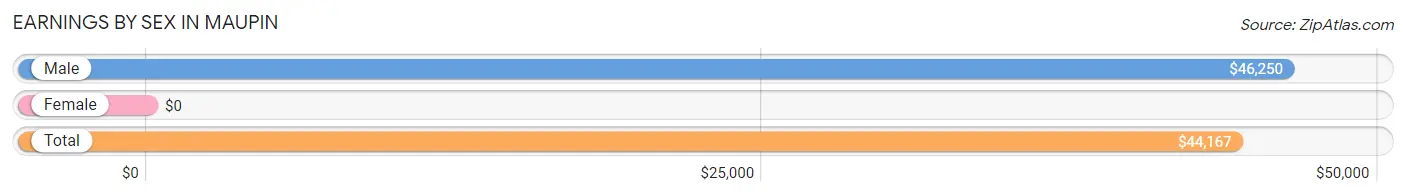
Earnings by Sex in Maupin
| Sex | Number | Average Earnings |
| Male | 75 (55.1%) | $46,250 |
| Female | 61 (44.9%) | $0 |
| Total | 136 (100.0%) | $44,167 |
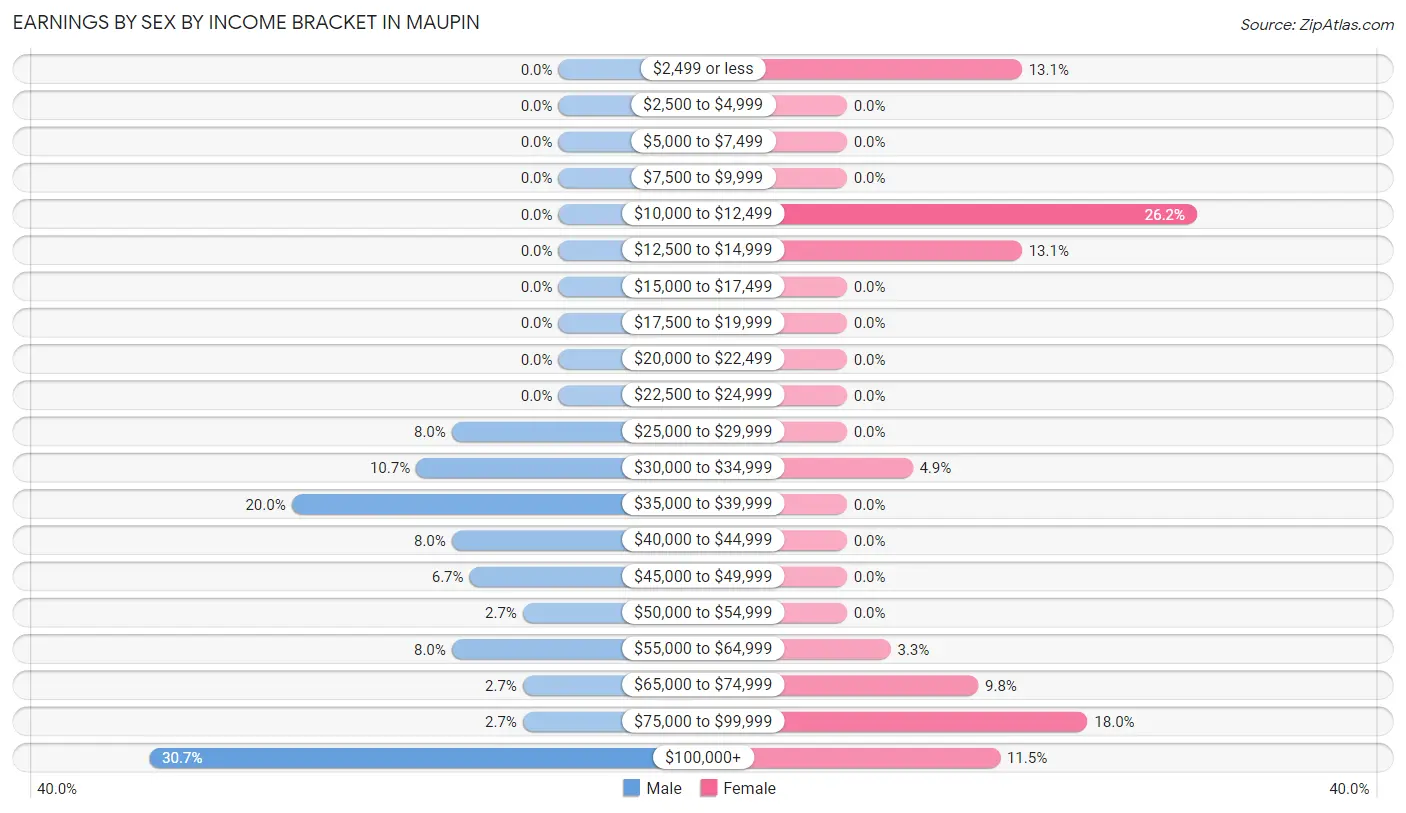
Earnings by Sex by Income Bracket in Maupin
The most common earnings brackets in Maupin are $100,000+ for men (23 | 30.7%) and $10,000 to $12,499 for women (16 | 26.2%).
| Income | Male | Female |
| $2,499 or less | 0 (0.0%) | 8 (13.1%) |
| $2,500 to $4,999 | 0 (0.0%) | 0 (0.0%) |
| $5,000 to $7,499 | 0 (0.0%) | 0 (0.0%) |
| $7,500 to $9,999 | 0 (0.0%) | 0 (0.0%) |
| $10,000 to $12,499 | 0 (0.0%) | 16 (26.2%) |
| $12,500 to $14,999 | 0 (0.0%) | 8 (13.1%) |
| $15,000 to $17,499 | 0 (0.0%) | 0 (0.0%) |
| $17,500 to $19,999 | 0 (0.0%) | 0 (0.0%) |
| $20,000 to $22,499 | 0 (0.0%) | 0 (0.0%) |
| $22,500 to $24,999 | 0 (0.0%) | 0 (0.0%) |
| $25,000 to $29,999 | 6 (8.0%) | 0 (0.0%) |
| $30,000 to $34,999 | 8 (10.7%) | 3 (4.9%) |
| $35,000 to $39,999 | 15 (20.0%) | 0 (0.0%) |
| $40,000 to $44,999 | 6 (8.0%) | 0 (0.0%) |
| $45,000 to $49,999 | 5 (6.7%) | 0 (0.0%) |
| $50,000 to $54,999 | 2 (2.7%) | 0 (0.0%) |
| $55,000 to $64,999 | 6 (8.0%) | 2 (3.3%) |
| $65,000 to $74,999 | 2 (2.7%) | 6 (9.8%) |
| $75,000 to $99,999 | 2 (2.7%) | 11 (18.0%) |
| $100,000+ | 23 (30.7%) | 7 (11.5%) |
| Total | 75 (100.0%) | 61 (100.0%) |
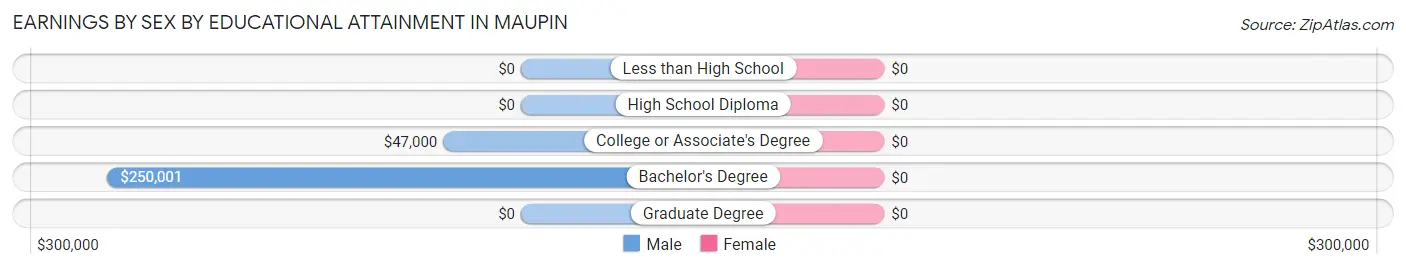
Earnings by Sex by Educational Attainment in Maupin
| Educational Attainment | Male Income | Female Income |
| Less than High School | - | - |
| High School Diploma | - | - |
| College or Associate's Degree | $47,000 | $0 |
| Bachelor's Degree | $250,001 | $0 |
| Graduate Degree | - | - |
| Total | $47,250 | $0 |
Family Income in Maupin
Family Income Brackets in Maupin
According to the Maupin family income data, there are 25 families falling into the $35,000 to $49,999 income range, which is the most common income bracket and makes up 27.5% of all families.
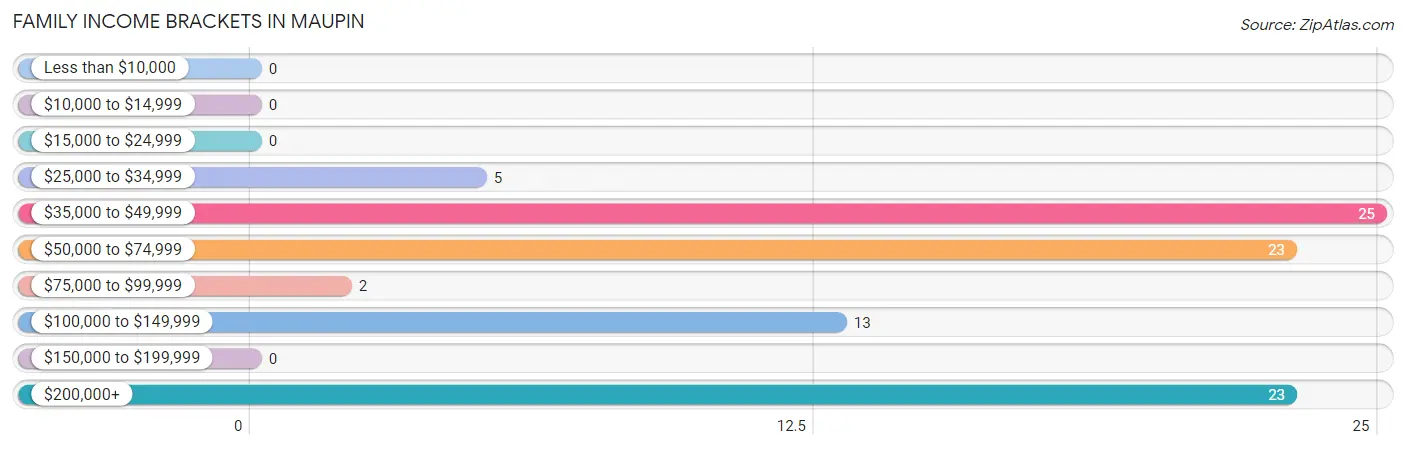
| Income Bracket | # Families | % Families |
| Less than $10,000 | 0 | 0.0% |
| $10,000 to $14,999 | 0 | 0.0% |
| $15,000 to $24,999 | 0 | 0.0% |
| $25,000 to $34,999 | 5 | 5.5% |
| $35,000 to $49,999 | 25 | 27.5% |
| $50,000 to $74,999 | 23 | 25.3% |
| $75,000 to $99,999 | 2 | 2.2% |
| $100,000 to $149,999 | 13 | 14.3% |
| $150,000 to $199,999 | 0 | 0.0% |
| $200,000+ | 23 | 25.3% |
Family Income by Famaliy Size in Maupin
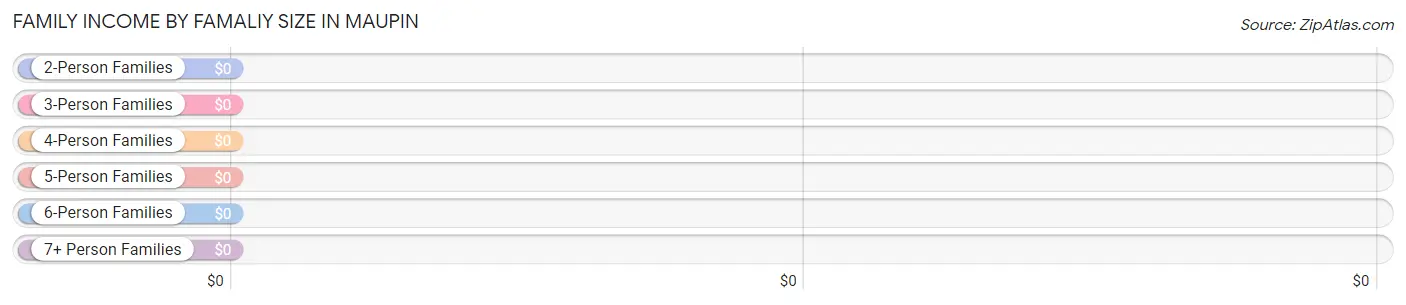
| Income Bracket | # Families | Median Income |
| 2-Person Families | 67 (73.6%) | $0 |
| 3-Person Families | 7 (7.7%) | $0 |
| 4-Person Families | 15 (16.5%) | $0 |
| 5-Person Families | 2 (2.2%) | $0 |
| 6-Person Families | 0 (0.0%) | $0 |
| 7+ Person Families | 0 (0.0%) | $0 |
| Total | 91 (100.0%) | $0 |
Family Income by Number of Earners in Maupin
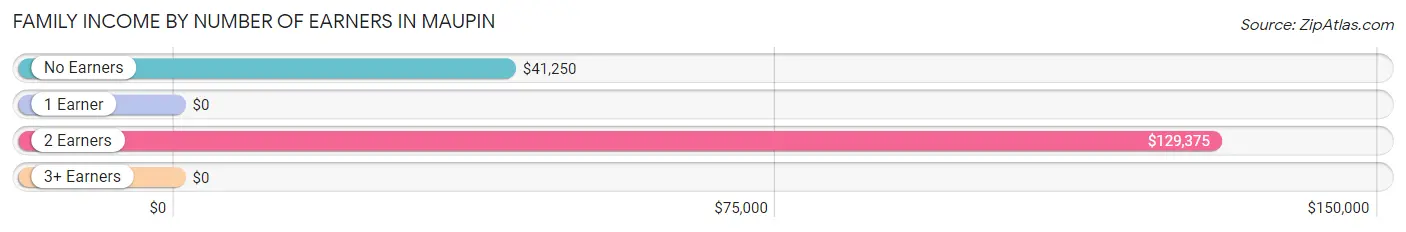
| Number of Earners | # Families | Median Income |
| No Earners | 19 (20.9%) | $41,250 |
| 1 Earner | 30 (33.0%) | $0 |
| 2 Earners | 36 (39.6%) | $129,375 |
| 3+ Earners | 6 (6.6%) | $0 |
| Total | 91 (100.0%) | $0 |
Household Income in Maupin
Household Income Brackets in Maupin
With 43 households falling in the category, the $35,000 to $49,999 income range is the most frequent in Maupin, accounting for 26.4% of all households.
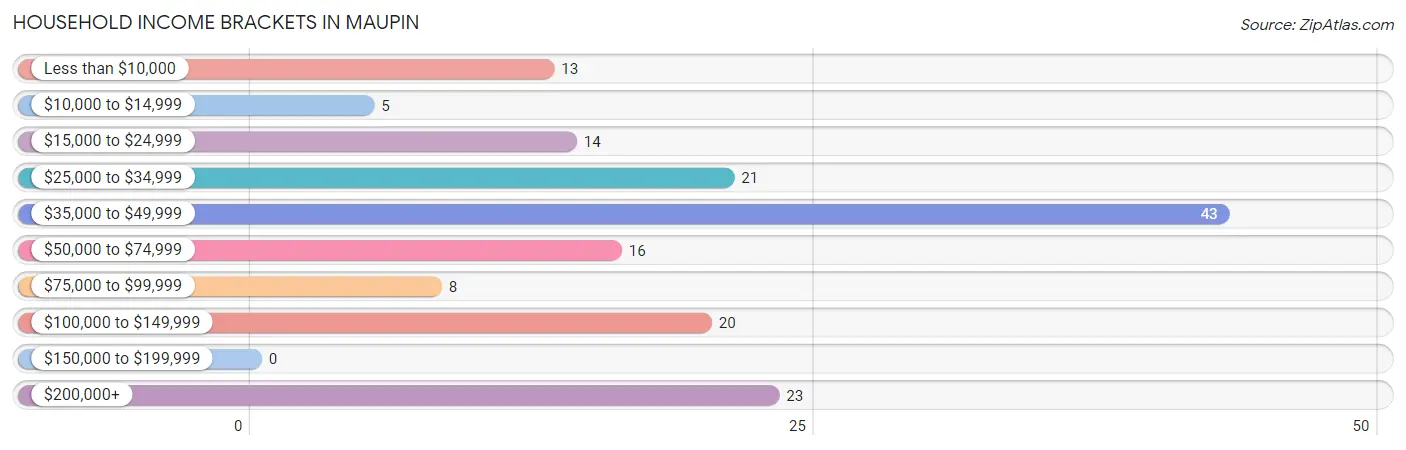
| Income Bracket | # Households | % Households |
| Less than $10,000 | 13 | 8.0% |
| $10,000 to $14,999 | 5 | 3.1% |
| $15,000 to $24,999 | 14 | 8.6% |
| $25,000 to $34,999 | 21 | 12.9% |
| $35,000 to $49,999 | 43 | 26.4% |
| $50,000 to $74,999 | 16 | 9.8% |
| $75,000 to $99,999 | 8 | 4.9% |
| $100,000 to $149,999 | 20 | 12.3% |
| $150,000 to $199,999 | 0 | 0.0% |
| $200,000+ | 23 | 14.1% |
Household Income by Householder Age in Maupin
The median household income in Maupin is $44,583, with the highest median household income of $119,107 found in the 45 to 64 years age bracket for the primary householder. A total of 43 households (26.4%) fall into this category. Meanwhile, the 15 to 24 years age bracket for the primary householder has the lowest median household income of $0, with 4 households (2.5%) in this group.
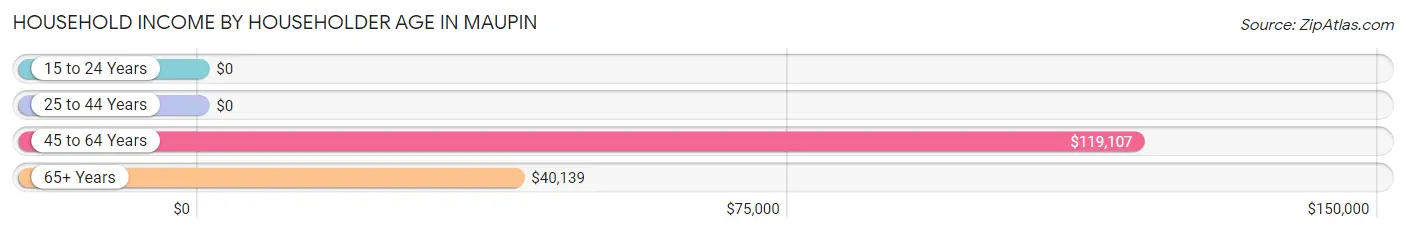
| Income Bracket | # Households | Median Income |
| 15 to 24 Years | 4 (2.5%) | $0 |
| 25 to 44 Years | 29 (17.8%) | $0 |
| 45 to 64 Years | 43 (26.4%) | $119,107 |
| 65+ Years | 87 (53.4%) | $40,139 |
| Total | 163 (100.0%) | $44,583 |
Poverty in Maupin
Income Below Poverty by Sex and Age in Maupin
With 3.5% poverty level for males and 13.6% for females among the residents of Maupin, 65 to 74 year old males and 25 to 34 year old females are the most vulnerable to poverty, with 5 males (10.4%) and 21 females (100.0%) in their respective age groups living below the poverty level.
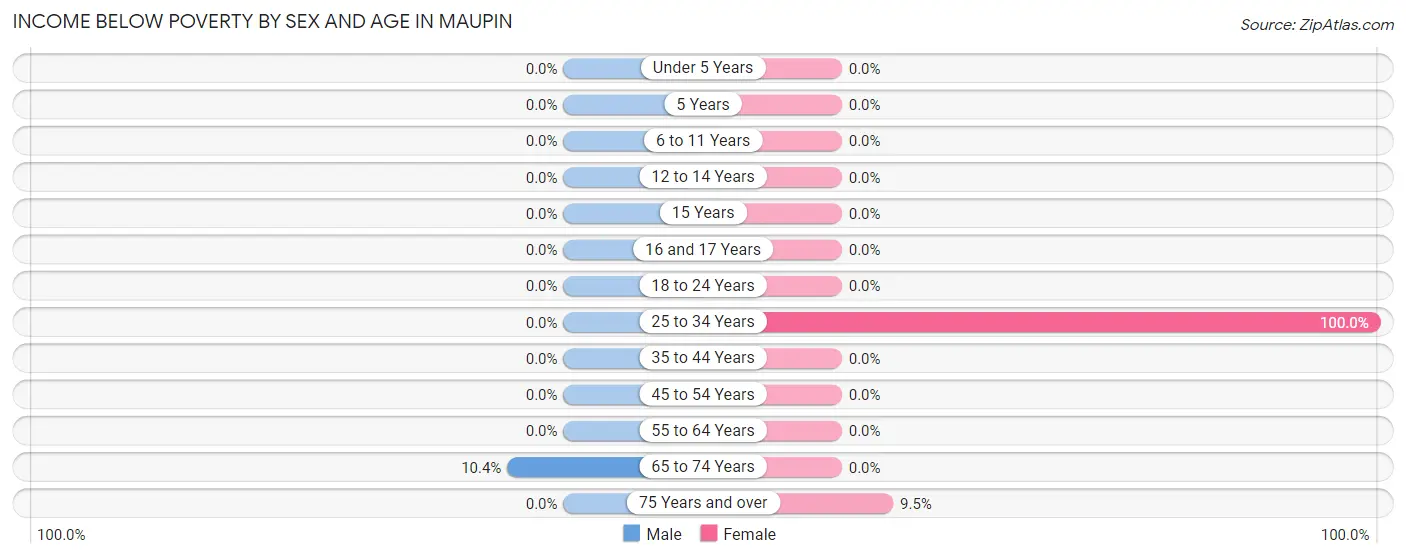
| Age Bracket | Male | Female |
| Under 5 Years | 0 (0.0%) | 0 (0.0%) |
| 5 Years | 0 (0.0%) | 0 (0.0%) |
| 6 to 11 Years | 0 (0.0%) | 0 (0.0%) |
| 12 to 14 Years | 0 (0.0%) | 0 (0.0%) |
| 15 Years | 0 (0.0%) | 0 (0.0%) |
| 16 and 17 Years | 0 (0.0%) | 0 (0.0%) |
| 18 to 24 Years | 0 (0.0%) | 0 (0.0%) |
| 25 to 34 Years | 0 (0.0%) | 21 (100.0%) |
| 35 to 44 Years | 0 (0.0%) | 0 (0.0%) |
| 45 to 54 Years | 0 (0.0%) | 0 (0.0%) |
| 55 to 64 Years | 0 (0.0%) | 0 (0.0%) |
| 65 to 74 Years | 5 (10.4%) | 0 (0.0%) |
| 75 Years and over | 0 (0.0%) | 2 (9.5%) |
| Total | 5 (3.5%) | 23 (13.6%) |
Income Above Poverty by Sex and Age in Maupin
According to the poverty statistics in Maupin, males aged under 5 years and females aged 6 to 11 years are the age groups that are most secure financially, with 100.0% of males and 100.0% of females in these age groups living above the poverty line.
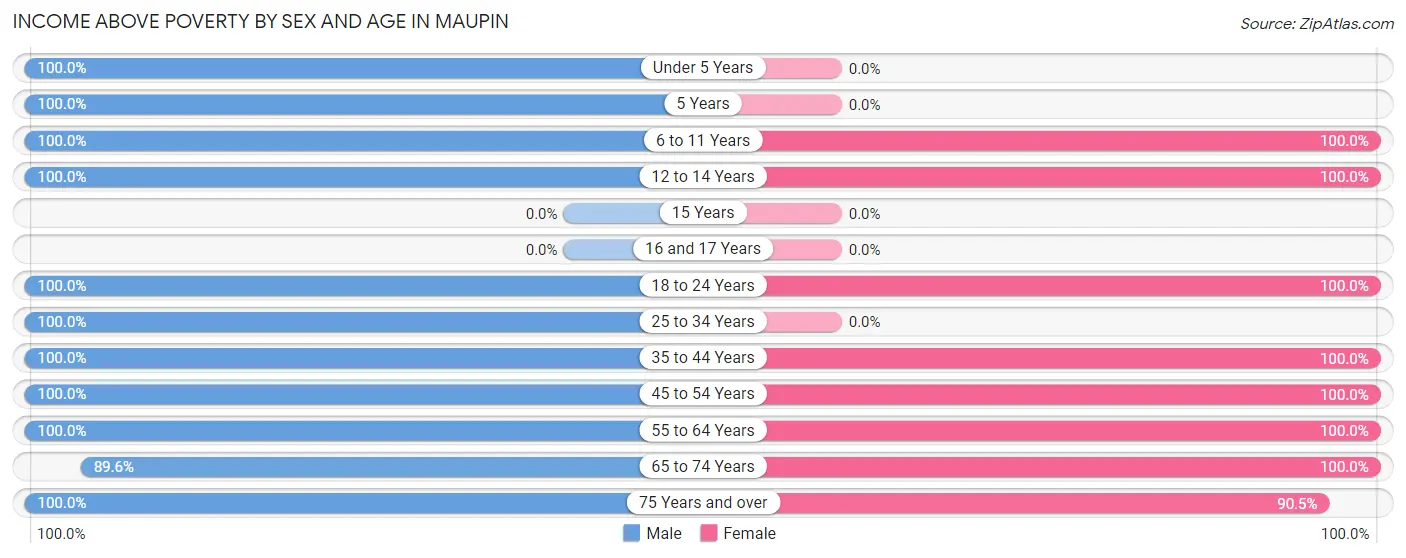
| Age Bracket | Male | Female |
| Under 5 Years | 3 (100.0%) | 0 (0.0%) |
| 5 Years | 2 (100.0%) | 0 (0.0%) |
| 6 to 11 Years | 10 (100.0%) | 8 (100.0%) |
| 12 to 14 Years | 6 (100.0%) | 8 (100.0%) |
| 15 Years | 0 (0.0%) | 0 (0.0%) |
| 16 and 17 Years | 0 (0.0%) | 0 (0.0%) |
| 18 to 24 Years | 4 (100.0%) | 7 (100.0%) |
| 25 to 34 Years | 11 (100.0%) | 0 (0.0%) |
| 35 to 44 Years | 13 (100.0%) | 14 (100.0%) |
| 45 to 54 Years | 12 (100.0%) | 23 (100.0%) |
| 55 to 64 Years | 20 (100.0%) | 16 (100.0%) |
| 65 to 74 Years | 43 (89.6%) | 51 (100.0%) |
| 75 Years and over | 13 (100.0%) | 19 (90.5%) |
| Total | 137 (96.5%) | 146 (86.4%) |
Income Below Poverty Among Married-Couple Families in Maupin
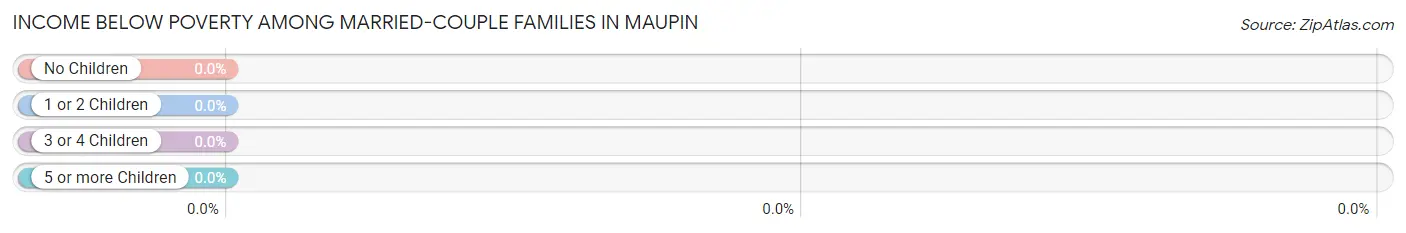
| Children | Above Poverty | Below Poverty |
| No Children | 63 (100.0%) | 0 (0.0%) |
| 1 or 2 Children | 15 (100.0%) | 0 (0.0%) |
| 3 or 4 Children | 2 (100.0%) | 0 (0.0%) |
| 5 or more Children | 0 (0.0%) | 0 (0.0%) |
| Total | 80 (100.0%) | 0 (0.0%) |
Income Below Poverty Among Single-Parent Households in Maupin
| Children | Single Father | Single Mother |
| No Children | 0 (0.0%) | 0 (0.0%) |
| 1 or 2 Children | 0 (0.0%) | 0 (0.0%) |
| 3 or 4 Children | 0 (0.0%) | 0 (0.0%) |
| 5 or more Children | 0 (0.0%) | 0 (0.0%) |
| Total | 0 (0.0%) | 0 (0.0%) |
Income Below Poverty Among Married-Couple vs Single-Parent Households in Maupin
| Children | Married-Couple Families | Single-Parent Households |
| No Children | 0 (0.0%) | 0 (0.0%) |
| 1 or 2 Children | 0 (0.0%) | 0 (0.0%) |
| 3 or 4 Children | 0 (0.0%) | 0 (0.0%) |
| 5 or more Children | 0 (0.0%) | 0 (0.0%) |
| Total | 0 (0.0%) | 0 (0.0%) |
Race in Maupin
The most populous races in Maupin are White / Caucasian (321 | 90.2%), Two or more Races (25 | 7.0%), and Asian (10 | 2.8%).
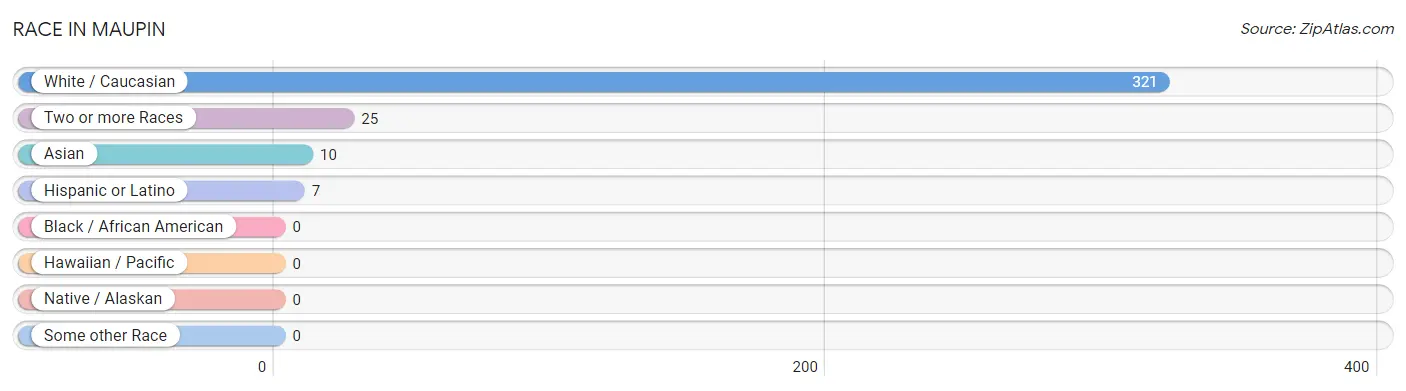
| Race | # Population | % Population |
| Asian | 10 | 2.8% |
| Black / African American | 0 | 0.0% |
| Hawaiian / Pacific | 0 | 0.0% |
| Hispanic or Latino | 7 | 2.0% |
| Native / Alaskan | 0 | 0.0% |
| White / Caucasian | 321 | 90.2% |
| Two or more Races | 25 | 7.0% |
| Some other Race | 0 | 0.0% |
| Total | 356 | 100.0% |
Ancestry in Maupin
The most populous ancestries reported in Maupin are English (76 | 21.3%), Irish (56 | 15.7%), German (44 | 12.4%), Scottish (30 | 8.4%), and Eastern European (15 | 4.2%), together accounting for 62.1% of all Maupin residents.
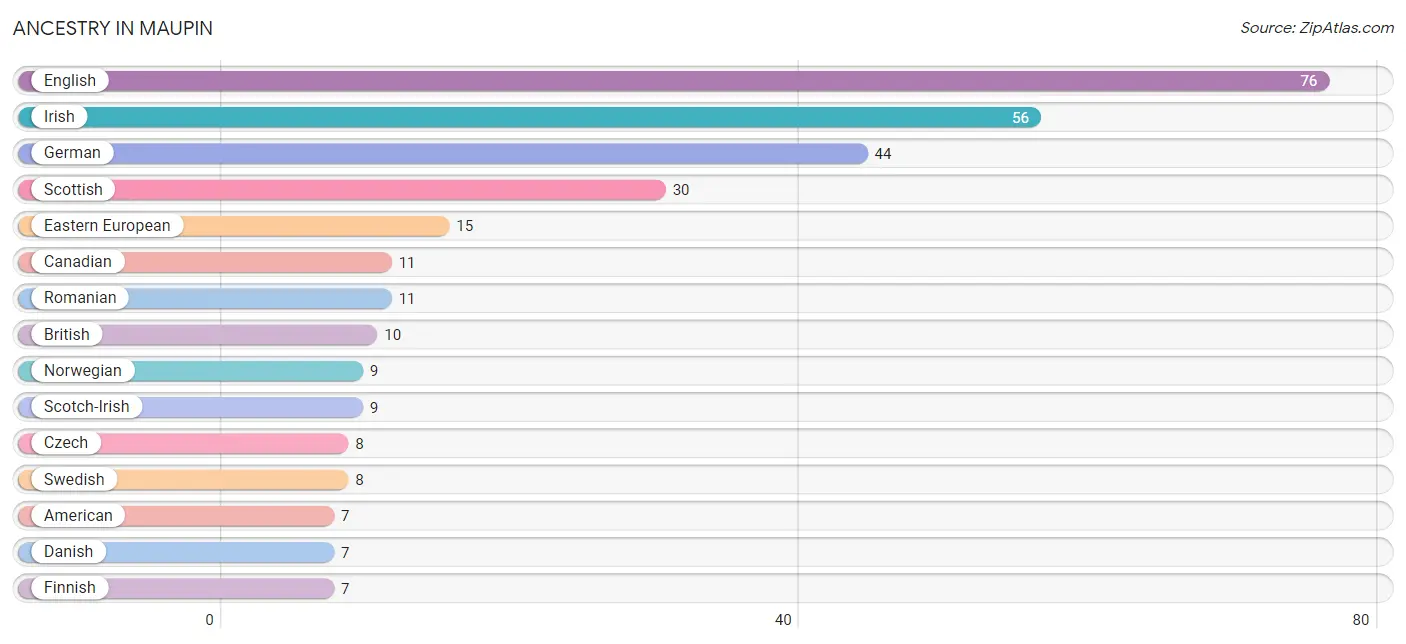
| Ancestry | # Population | % Population |
| American | 7 | 2.0% |
| Austrian | 2 | 0.6% |
| British | 10 | 2.8% |
| Canadian | 11 | 3.1% |
| Czech | 8 | 2.2% |
| Danish | 7 | 2.0% |
| Dutch | 2 | 0.6% |
| Eastern European | 15 | 4.2% |
| English | 76 | 21.3% |
| European | 6 | 1.7% |
| Finnish | 7 | 2.0% |
| French | 2 | 0.6% |
| German | 44 | 12.4% |
| Indian (Asian) | 5 | 1.4% |
| Irish | 56 | 15.7% |
| Italian | 7 | 2.0% |
| Mexican | 7 | 2.0% |
| Norwegian | 9 | 2.5% |
| Romanian | 11 | 3.1% |
| Scotch-Irish | 9 | 2.5% |
| Scottish | 30 | 8.4% |
| Swedish | 8 | 2.2% |
| Thai | 5 | 1.4% |
| Tlingit-Haida | 5 | 1.4% | View All 24 Rows |
Immigrants in Maupin
The most numerous immigrant groups reported in Maupin came from , and Canada (27 | 7.6%), together accounting for 7.6% of all Maupin residents.

| Immigration Origin | # Population | % Population |
| Canada | 27 | 7.6% | View All 1 Rows |
Sex and Age in Maupin
Sex and Age in Maupin
The most populous age groups in Maupin are 65 to 69 Years (39 | 23.2%) for men and 65 to 69 Years (32 | 17.0%) for women.
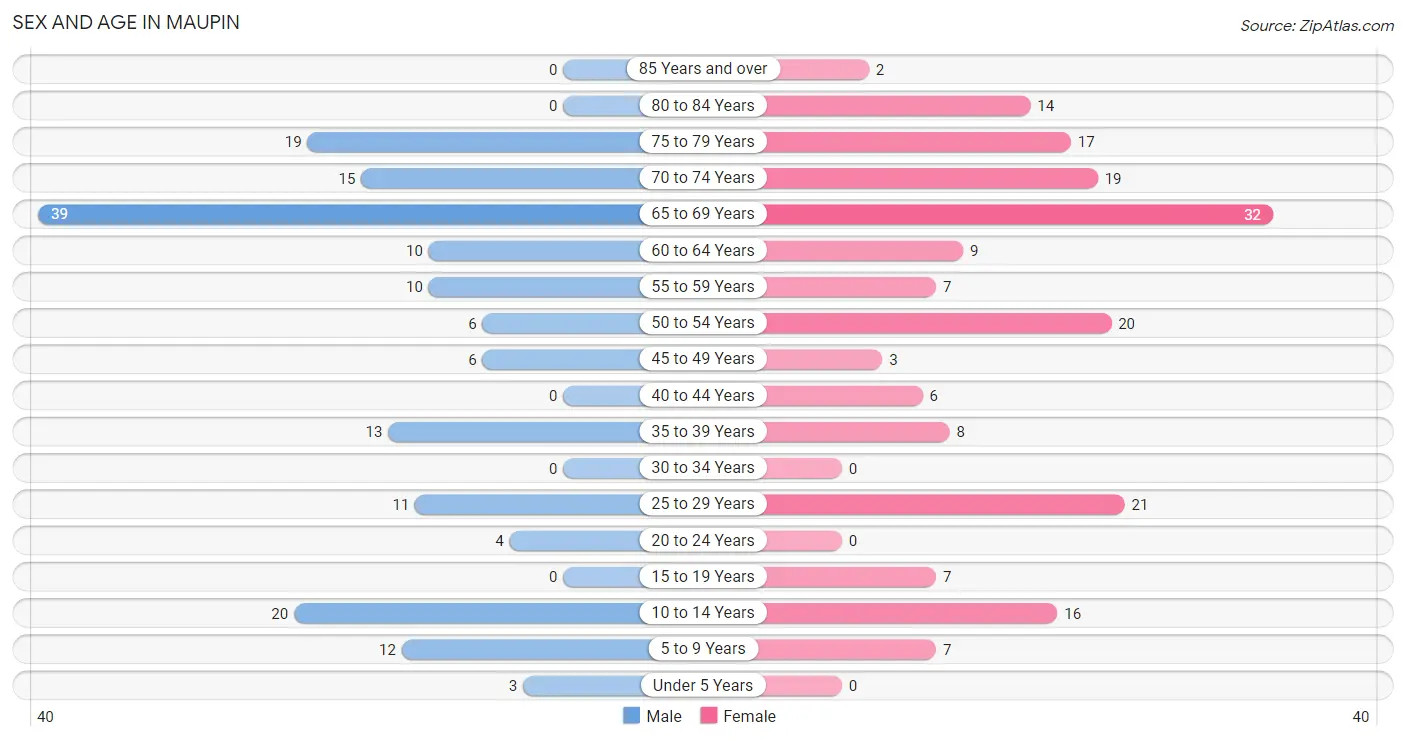
| Age Bracket | Male | Female |
| Under 5 Years | 3 (1.8%) | 0 (0.0%) |
| 5 to 9 Years | 12 (7.1%) | 7 (3.7%) |
| 10 to 14 Years | 20 (11.9%) | 16 (8.5%) |
| 15 to 19 Years | 0 (0.0%) | 7 (3.7%) |
| 20 to 24 Years | 4 (2.4%) | 0 (0.0%) |
| 25 to 29 Years | 11 (6.6%) | 21 (11.2%) |
| 30 to 34 Years | 0 (0.0%) | 0 (0.0%) |
| 35 to 39 Years | 13 (7.7%) | 8 (4.3%) |
| 40 to 44 Years | 0 (0.0%) | 6 (3.2%) |
| 45 to 49 Years | 6 (3.6%) | 3 (1.6%) |
| 50 to 54 Years | 6 (3.6%) | 20 (10.6%) |
| 55 to 59 Years | 10 (5.9%) | 7 (3.7%) |
| 60 to 64 Years | 10 (5.9%) | 9 (4.8%) |
| 65 to 69 Years | 39 (23.2%) | 32 (17.0%) |
| 70 to 74 Years | 15 (8.9%) | 19 (10.1%) |
| 75 to 79 Years | 19 (11.3%) | 17 (9.0%) |
| 80 to 84 Years | 0 (0.0%) | 14 (7.4%) |
| 85 Years and over | 0 (0.0%) | 2 (1.1%) |
| Total | 168 (100.0%) | 188 (100.0%) |
Families and Households in Maupin
Median Family Size in Maupin
The median family size in Maupin is 2.45 persons per family, with single female/mother families (7 | 7.7%) accounting for the largest median family size of 2.86 persons per family. On the other hand, single male/father families (4 | 4.4%) represent the smallest median family size with 1.75 persons per family.
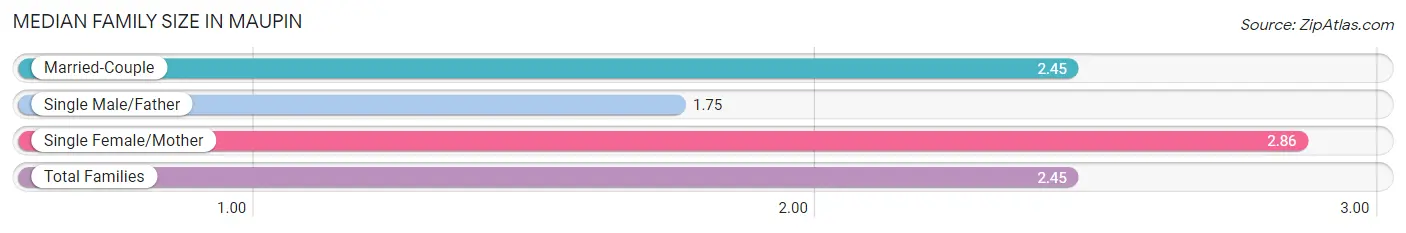
| Family Type | # Families | Family Size |
| Married-Couple | 80 (87.9%) | 2.45 |
| Single Male/Father | 4 (4.4%) | 1.75 |
| Single Female/Mother | 7 (7.7%) | 2.86 |
| Total Families | 91 (100.0%) | 2.45 |
Median Household Size in Maupin
The median household size in Maupin is 2.04 persons per household, with single female/mother households (7 | 4.3%) accounting for the largest median household size of 6.71 persons per household. non-family households (72 | 44.2%) represent the smallest median household size with 1.14 persons per household.
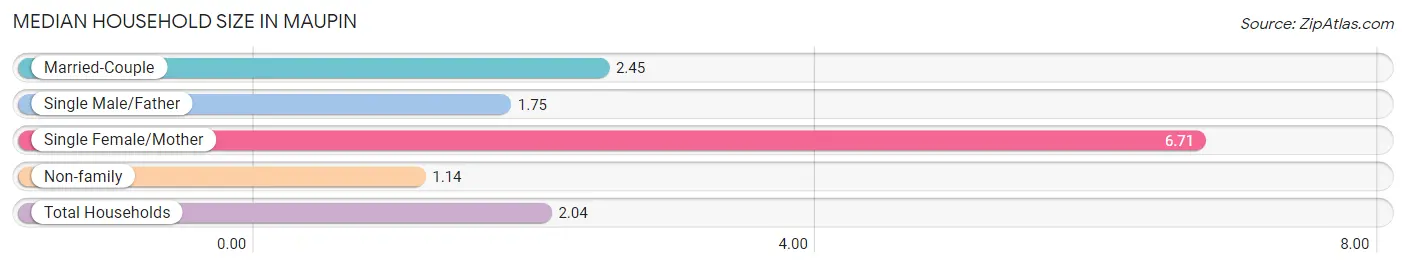
| Household Type | # Households | Household Size |
| Married-Couple | 80 (49.1%) | 2.45 |
| Single Male/Father | 4 (2.5%) | 1.75 |
| Single Female/Mother | 7 (4.3%) | 6.71 |
| Non-family | 72 (44.2%) | 1.14 |
| Total Households | 163 (100.0%) | 2.04 |
Household Size by Marriage Status in Maupin
Out of a total of 163 households in Maupin, 91 (55.8%) are family households, while 72 (44.2%) are nonfamily households. The most numerous type of family households are 2-person households, comprising 67, and the most common type of nonfamily households are 1-person households, comprising 61.
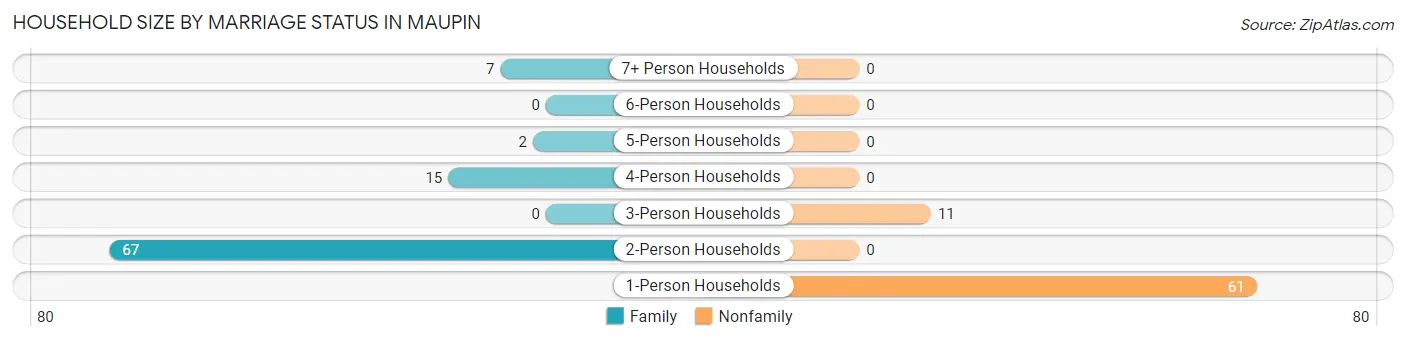
| Household Size | Family Households | Nonfamily Households |
| 1-Person Households | - | 61 (37.4%) |
| 2-Person Households | 67 (41.1%) | 0 (0.0%) |
| 3-Person Households | 0 (0.0%) | 11 (6.8%) |
| 4-Person Households | 15 (9.2%) | 0 (0.0%) |
| 5-Person Households | 2 (1.2%) | 0 (0.0%) |
| 6-Person Households | 0 (0.0%) | 0 (0.0%) |
| 7+ Person Households | 7 (4.3%) | 0 (0.0%) |
| Total | 91 (55.8%) | 72 (44.2%) |
Female Fertility in Maupin
Fertility by Age in Maupin
| Age Bracket | Women with Births | Births / 1,000 Women |
| 15 to 19 years | 0 (0.0%) | 0.0 |
| 20 to 34 years | 0 (0.0%) | 0.0 |
| 35 to 50 years | 0 (0.0%) | 0.0 |
| Total | 0 (0.0%) | 0.0 |
Fertility by Age by Marriage Status in Maupin
| Age Bracket | Married | Unmarried |
| 15 to 19 years | 0 (0.0%) | 0 (0.0%) |
| 20 to 34 years | 0 (0.0%) | 0 (0.0%) |
| 35 to 50 years | 0 (0.0%) | 0 (0.0%) |
| Total | 0 (0.0%) | 0 (0.0%) |
Fertility by Education in Maupin
| Educational Attainment | Women with Births | Births / 1,000 Women |
| Less than High School | 0 (0.0%) | 0.0 |
| High School Diploma | 0 (0.0%) | 0.0 |
| College or Associate's Degree | 0 (0.0%) | 0.0 |
| Bachelor's Degree | 0 (0.0%) | 0.0 |
| Graduate Degree | 0 (0.0%) | 0.0 |
| Total | 0 (0.0%) | 0.0 |
Fertility by Education by Marriage Status in Maupin
| Educational Attainment | Married | Unmarried |
| Less than High School | 0 (0.0%) | 0 (0.0%) |
| High School Diploma | 0 (0.0%) | 0 (0.0%) |
| College or Associate's Degree | 0 (0.0%) | 0 (0.0%) |
| Bachelor's Degree | 0 (0.0%) | 0 (0.0%) |
| Graduate Degree | 0 (0.0%) | 0 (0.0%) |
| Total | 0 (0.0%) | 0 (0.0%) |
Employment Characteristics in Maupin
Employment by Class of Employer in Maupin
Among the 113 employed individuals in Maupin, private company employees (63 | 55.7%), local government employees (21 | 18.6%), and self-employed (incorporated) (15 | 13.3%) make up the most common classes of employment.
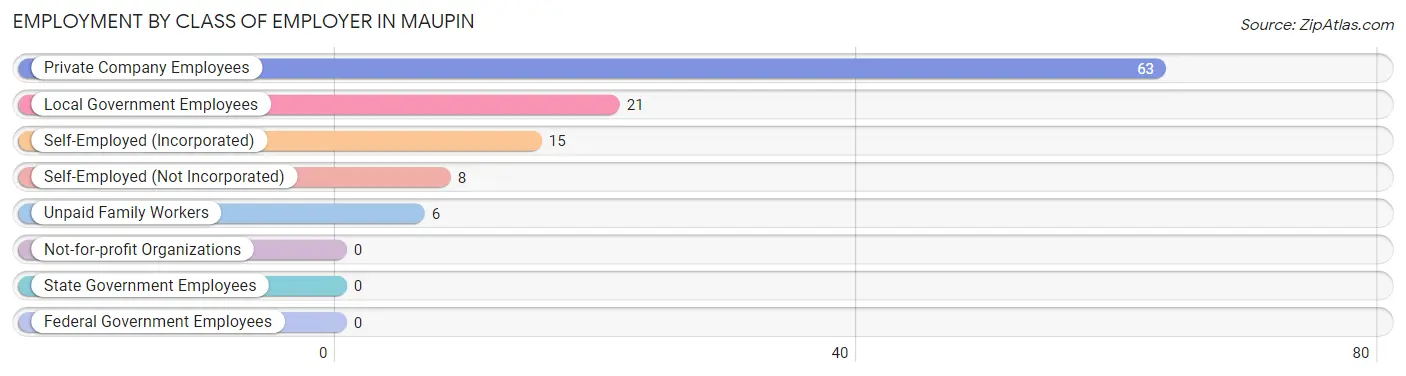
| Employer Class | # Employees | % Employees |
| Private Company Employees | 63 | 55.7% |
| Self-Employed (Incorporated) | 15 | 13.3% |
| Self-Employed (Not Incorporated) | 8 | 7.1% |
| Not-for-profit Organizations | 0 | 0.0% |
| Local Government Employees | 21 | 18.6% |
| State Government Employees | 0 | 0.0% |
| Federal Government Employees | 0 | 0.0% |
| Unpaid Family Workers | 6 | 5.3% |
| Total | 113 | 100.0% |
Employment Status by Age in Maupin
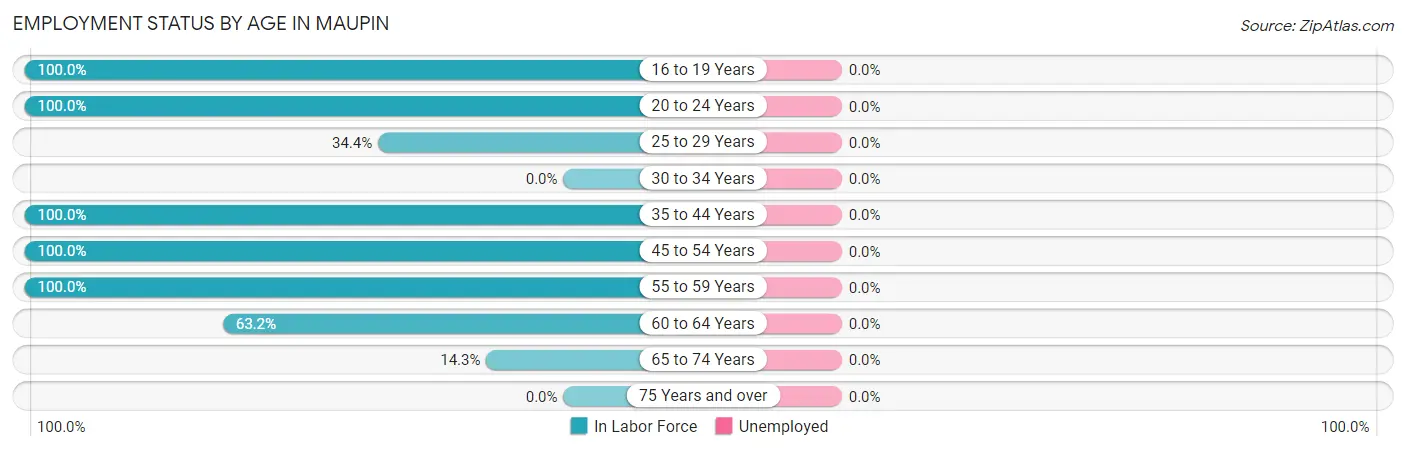
| Age Bracket | In Labor Force | Unemployed |
| 16 to 19 Years | 7 (100.0%) | 0 (0.0%) |
| 20 to 24 Years | 4 (100.0%) | 0 (0.0%) |
| 25 to 29 Years | 11 (34.4%) | 0 (0.0%) |
| 30 to 34 Years | 0 (0.0%) | 0 (0.0%) |
| 35 to 44 Years | 27 (100.0%) | 0 (0.0%) |
| 45 to 54 Years | 35 (100.0%) | 0 (0.0%) |
| 55 to 59 Years | 17 (100.0%) | 0 (0.0%) |
| 60 to 64 Years | 12 (63.2%) | 0 (0.0%) |
| 65 to 74 Years | 15 (14.3%) | 0 (0.0%) |
| 75 Years and over | 0 (0.0%) | 0 (0.0%) |
| Total | 128 (43.0%) | 0 (0.0%) |
Employment Status by Educational Attainment in Maupin
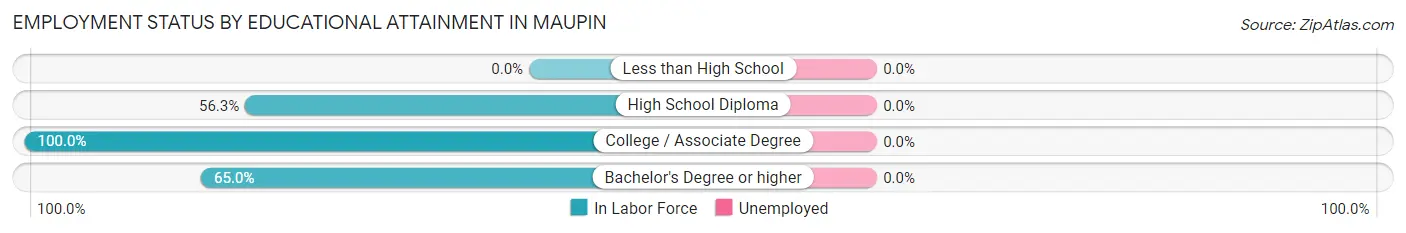
| Educational Attainment | In Labor Force | Unemployed |
| Less than High School | 0 (0.0%) | 0 (0.0%) |
| High School Diploma | 9 (56.3%) | 0 (0.0%) |
| College / Associate Degree | 54 (100.0%) | 0 (0.0%) |
| Bachelor's Degree or higher | 39 (65.0%) | 0 (0.0%) |
| Total | 102 (78.5%) | 0 (0.0%) |
Employment Occupations by Sex in Maupin
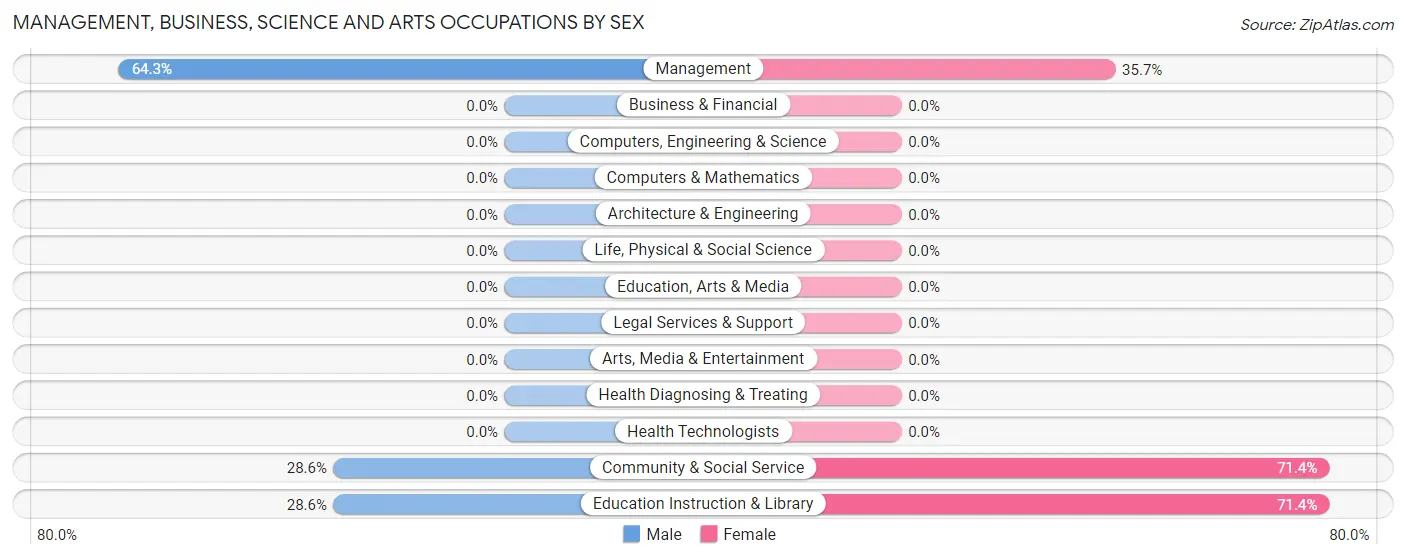
Management, Business, Science and Arts Occupations
The most common Management, Business, Science and Arts occupations in Maupin are Management (42 | 32.8%), Community & Social Service (21 | 16.4%), and Education Instruction & Library (21 | 16.4%).
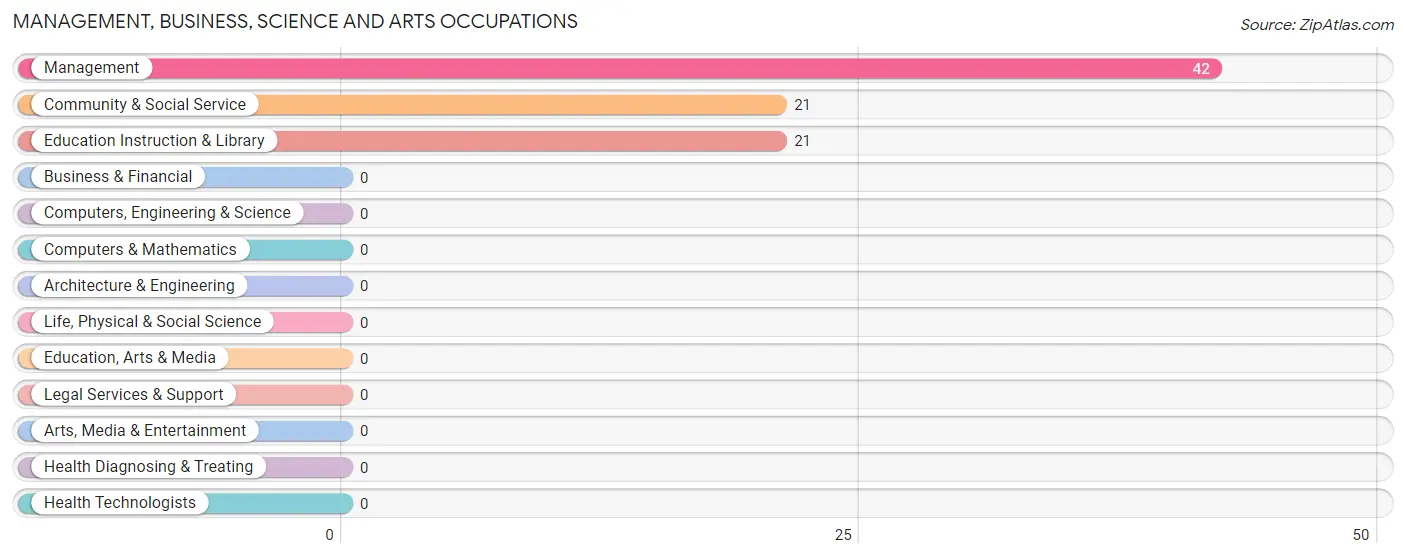
Management, Business, Science and Arts Occupations by Sex
Within the Management, Business, Science and Arts occupations in Maupin, the most male-oriented occupations are Management (64.3%), Community & Social Service (28.6%), and Education Instruction & Library (28.6%), while the most female-oriented occupations are Community & Social Service (71.4%), Education Instruction & Library (71.4%), and Management (35.7%).
| Occupation | Male | Female |
| Management | 27 (64.3%) | 15 (35.7%) |
| Business & Financial | 0 (0.0%) | 0 (0.0%) |
| Computers, Engineering & Science | 0 (0.0%) | 0 (0.0%) |
| Computers & Mathematics | 0 (0.0%) | 0 (0.0%) |
| Architecture & Engineering | 0 (0.0%) | 0 (0.0%) |
| Life, Physical & Social Science | 0 (0.0%) | 0 (0.0%) |
| Community & Social Service | 6 (28.6%) | 15 (71.4%) |
| Education, Arts & Media | 0 (0.0%) | 0 (0.0%) |
| Legal Services & Support | 0 (0.0%) | 0 (0.0%) |
| Education Instruction & Library | 6 (28.6%) | 15 (71.4%) |
| Arts, Media & Entertainment | 0 (0.0%) | 0 (0.0%) |
| Health Diagnosing & Treating | 0 (0.0%) | 0 (0.0%) |
| Health Technologists | 0 (0.0%) | 0 (0.0%) |
| Total (Category) | 33 (52.4%) | 30 (47.6%) |
| Total (Overall) | 75 (58.6%) | 53 (41.4%) |
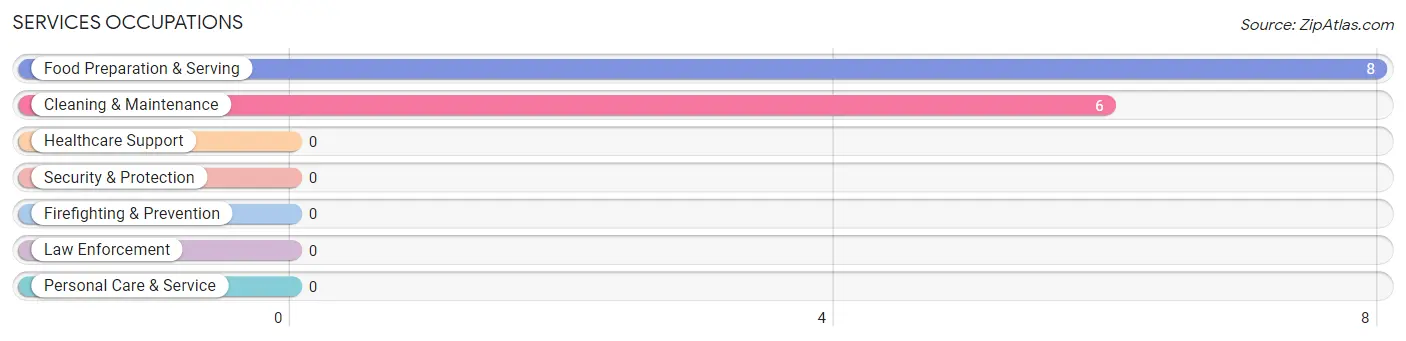
Services Occupations
The most common Services occupations in Maupin are Food Preparation & Serving (8 | 6.2%), and Cleaning & Maintenance (6 | 4.7%).
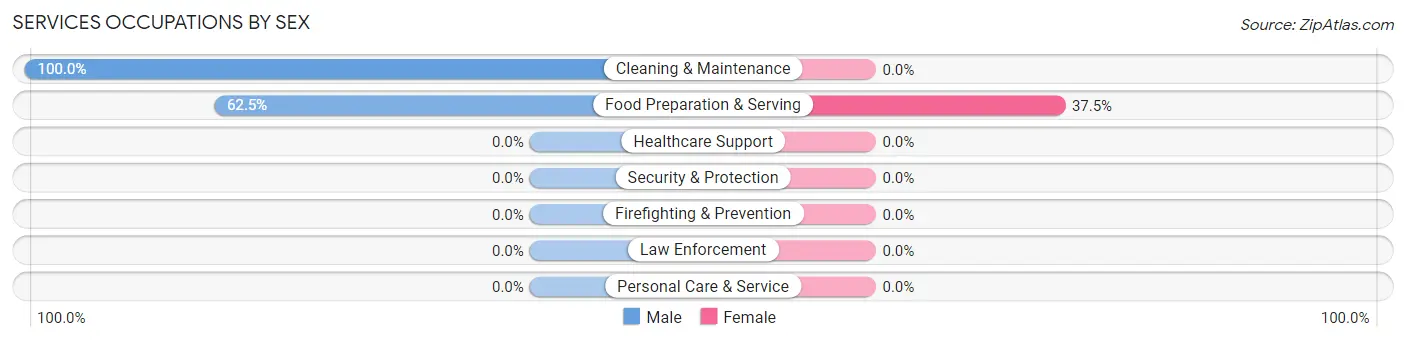
Services Occupations by Sex
| Occupation | Male | Female |
| Healthcare Support | 0 (0.0%) | 0 (0.0%) |
| Security & Protection | 0 (0.0%) | 0 (0.0%) |
| Firefighting & Prevention | 0 (0.0%) | 0 (0.0%) |
| Law Enforcement | 0 (0.0%) | 0 (0.0%) |
| Food Preparation & Serving | 5 (62.5%) | 3 (37.5%) |
| Cleaning & Maintenance | 6 (100.0%) | 0 (0.0%) |
| Personal Care & Service | 0 (0.0%) | 0 (0.0%) |
| Total (Category) | 11 (78.6%) | 3 (21.4%) |
| Total (Overall) | 75 (58.6%) | 53 (41.4%) |
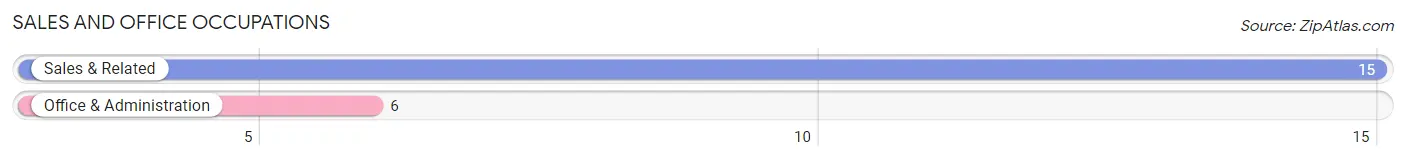
Sales and Office Occupations
The most common Sales and Office occupations in Maupin are Sales & Related (15 | 11.7%), and Office & Administration (6 | 4.7%).
Sales and Office Occupations by Sex
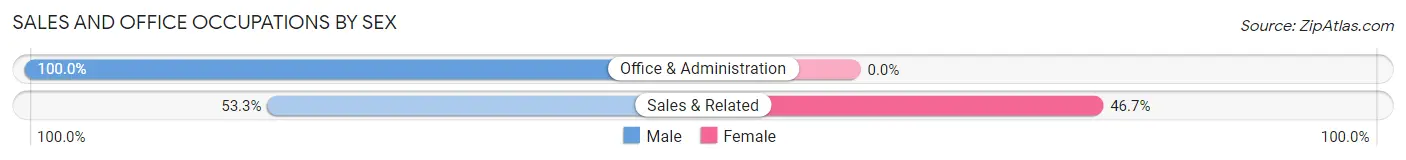
| Occupation | Male | Female |
| Sales & Related | 8 (53.3%) | 7 (46.7%) |
| Office & Administration | 6 (100.0%) | 0 (0.0%) |
| Total (Category) | 14 (66.7%) | 7 (33.3%) |
| Total (Overall) | 75 (58.6%) | 53 (41.4%) |
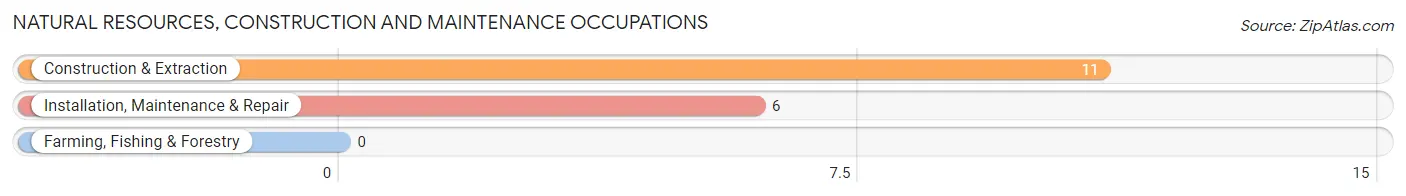
Natural Resources, Construction and Maintenance Occupations
The most common Natural Resources, Construction and Maintenance occupations in Maupin are Construction & Extraction (11 | 8.6%), and Installation, Maintenance & Repair (6 | 4.7%).
Natural Resources, Construction and Maintenance Occupations by Sex
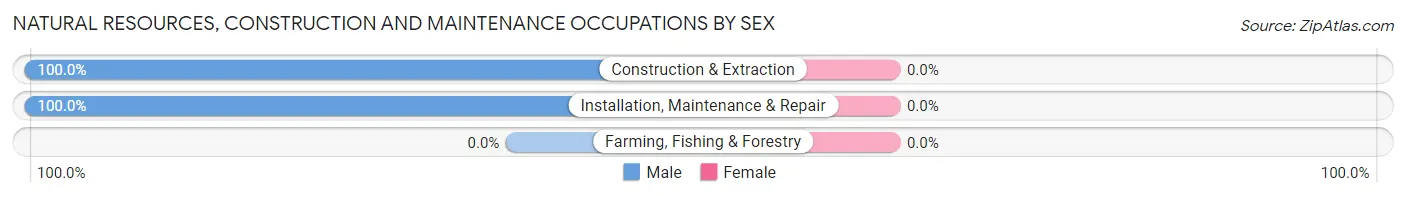
| Occupation | Male | Female |
| Farming, Fishing & Forestry | 0 (0.0%) | 0 (0.0%) |
| Construction & Extraction | 11 (100.0%) | 0 (0.0%) |
| Installation, Maintenance & Repair | 6 (100.0%) | 0 (0.0%) |
| Total (Category) | 17 (100.0%) | 0 (0.0%) |
| Total (Overall) | 75 (58.6%) | 53 (41.4%) |
Production, Transportation and Moving Occupations
The most common Production, Transportation and Moving occupations in Maupin are , and Transportation (13 | 10.2%).
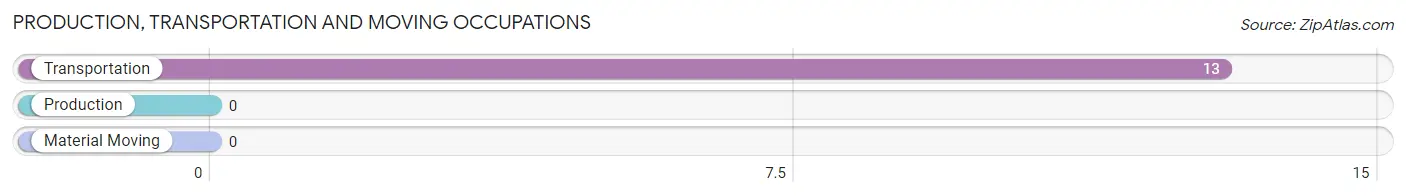
Production, Transportation and Moving Occupations by Sex
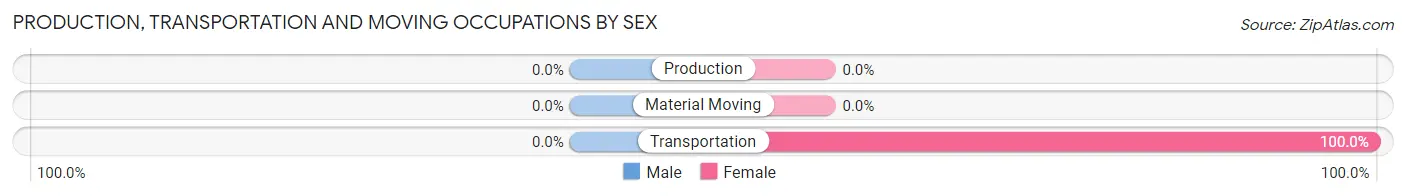
| Occupation | Male | Female |
| Production | 0 (0.0%) | 0 (0.0%) |
| Transportation | 0 (0.0%) | 13 (100.0%) |
| Material Moving | 0 (0.0%) | 0 (0.0%) |
| Total (Category) | 0 (0.0%) | 13 (100.0%) |
| Total (Overall) | 75 (58.6%) | 53 (41.4%) |
Employment Industries by Sex in Maupin
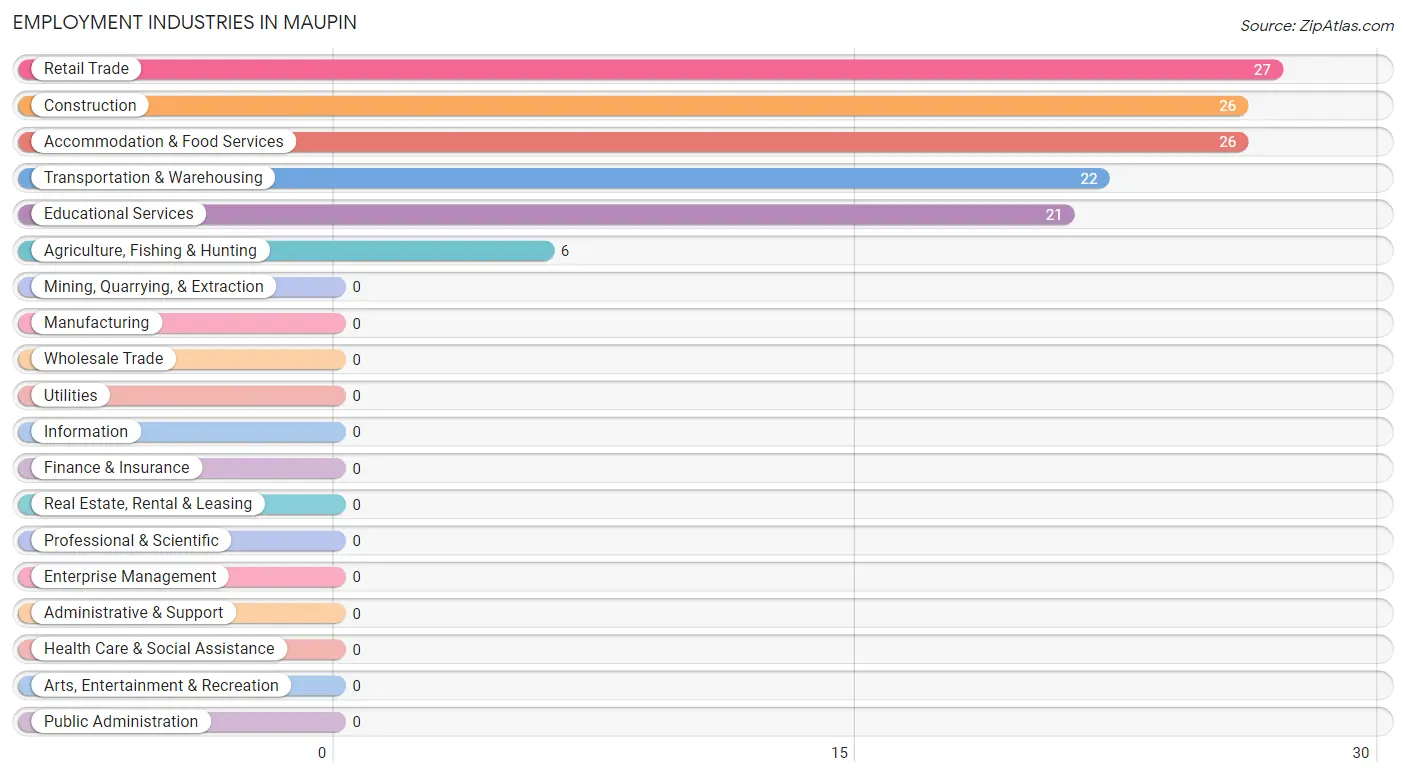
Employment Industries in Maupin
The major employment industries in Maupin include Retail Trade (27 | 21.1%), Construction (26 | 20.3%), Accommodation & Food Services (26 | 20.3%), Transportation & Warehousing (22 | 17.2%), and Educational Services (21 | 16.4%).
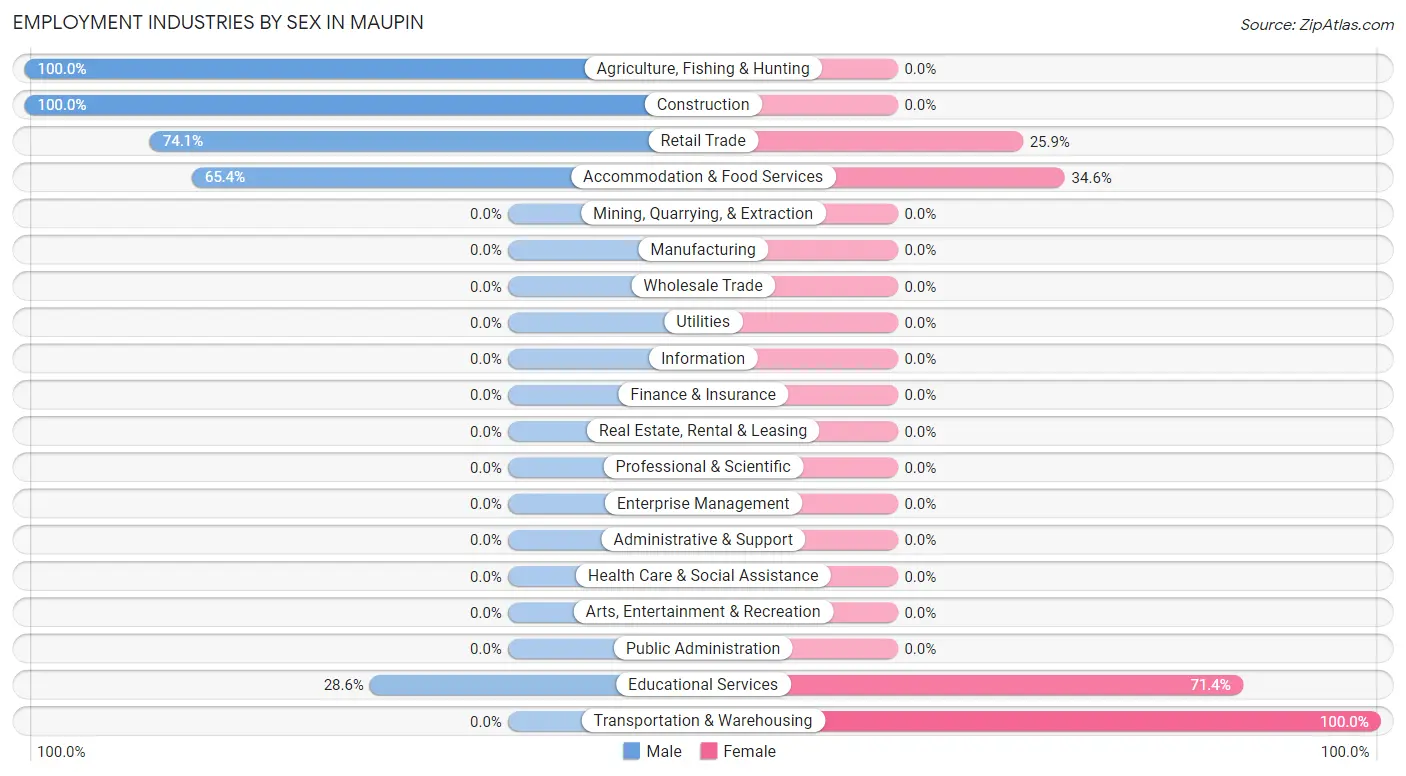
Employment Industries by Sex in Maupin
The Maupin industries that see more men than women are Agriculture, Fishing & Hunting (100.0%), Construction (100.0%), and Retail Trade (74.1%), whereas the industries that tend to have a higher number of women are Transportation & Warehousing (100.0%), Educational Services (71.4%), and Accommodation & Food Services (34.6%).
| Industry | Male | Female |
| Agriculture, Fishing & Hunting | 6 (100.0%) | 0 (0.0%) |
| Mining, Quarrying, & Extraction | 0 (0.0%) | 0 (0.0%) |
| Construction | 26 (100.0%) | 0 (0.0%) |
| Manufacturing | 0 (0.0%) | 0 (0.0%) |
| Wholesale Trade | 0 (0.0%) | 0 (0.0%) |
| Retail Trade | 20 (74.1%) | 7 (25.9%) |
| Transportation & Warehousing | 0 (0.0%) | 22 (100.0%) |
| Utilities | 0 (0.0%) | 0 (0.0%) |
| Information | 0 (0.0%) | 0 (0.0%) |
| Finance & Insurance | 0 (0.0%) | 0 (0.0%) |
| Real Estate, Rental & Leasing | 0 (0.0%) | 0 (0.0%) |
| Professional & Scientific | 0 (0.0%) | 0 (0.0%) |
| Enterprise Management | 0 (0.0%) | 0 (0.0%) |
| Administrative & Support | 0 (0.0%) | 0 (0.0%) |
| Educational Services | 6 (28.6%) | 15 (71.4%) |
| Health Care & Social Assistance | 0 (0.0%) | 0 (0.0%) |
| Arts, Entertainment & Recreation | 0 (0.0%) | 0 (0.0%) |
| Accommodation & Food Services | 17 (65.4%) | 9 (34.6%) |
| Public Administration | 0 (0.0%) | 0 (0.0%) |
| Total | 75 (58.6%) | 53 (41.4%) |
Education in Maupin
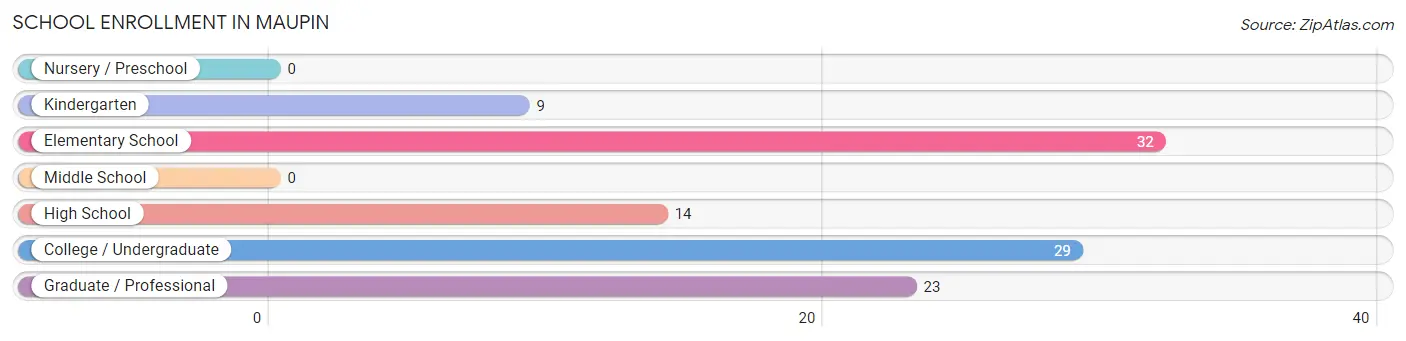
School Enrollment in Maupin
The most common levels of schooling among the 107 students in Maupin are elementary school (32 | 29.9%), college / undergraduate (29 | 27.1%), and graduate / professional (23 | 21.5%).
| School Level | # Students | % Students |
| Nursery / Preschool | 0 | 0.0% |
| Kindergarten | 9 | 8.4% |
| Elementary School | 32 | 29.9% |
| Middle School | 0 | 0.0% |
| High School | 14 | 13.1% |
| College / Undergraduate | 29 | 27.1% |
| Graduate / Professional | 23 | 21.5% |
| Total | 107 | 100.0% |
School Enrollment by Age by Funding Source in Maupin
Out of a total of 107 students who are enrolled in schools in Maupin, 41 (38.3%) attend a private institution, while the remaining 66 (61.7%) are enrolled in public schools. The age group of 25 to 34 year olds has the highest likelihood of being enrolled in private schools, with 32 (100.0% in the age bracket) enrolled. Conversely, the age group of 5 to 9 year old has the lowest likelihood of being enrolled in a private school, with 19 (100.0% in the age bracket) attending a public institution.
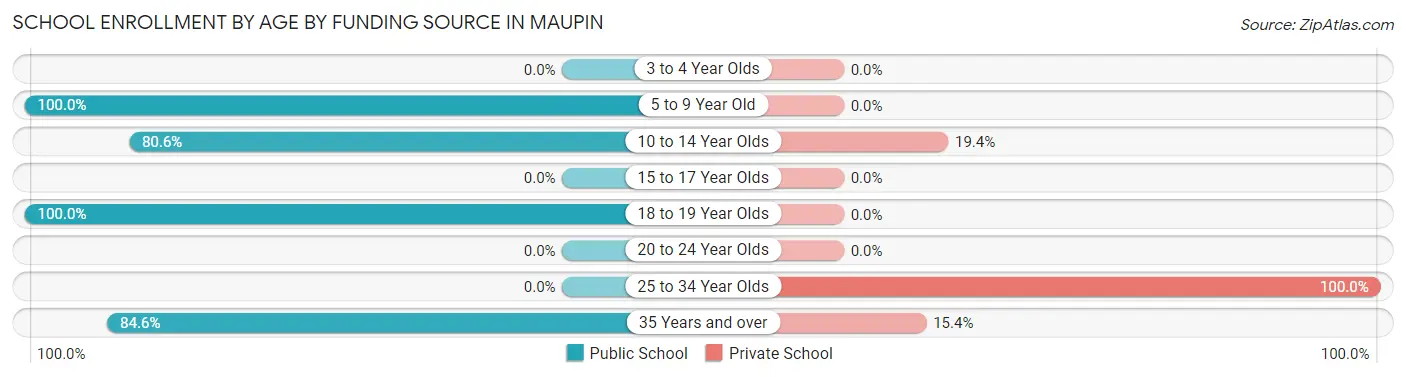
| Age Bracket | Public School | Private School |
| 3 to 4 Year Olds | 0 (0.0%) | 0 (0.0%) |
| 5 to 9 Year Old | 19 (100.0%) | 0 (0.0%) |
| 10 to 14 Year Olds | 29 (80.6%) | 7 (19.4%) |
| 15 to 17 Year Olds | 0 (0.0%) | 0 (0.0%) |
| 18 to 19 Year Olds | 7 (100.0%) | 0 (0.0%) |
| 20 to 24 Year Olds | 0 (0.0%) | 0 (0.0%) |
| 25 to 34 Year Olds | 0 (0.0%) | 32 (100.0%) |
| 35 Years and over | 11 (84.6%) | 2 (15.4%) |
| Total | 66 (61.7%) | 41 (38.3%) |
Educational Attainment by Field of Study in Maupin
Business (52 | 42.6%), physical & health sciences (23 | 18.9%), education (13 | 10.7%), social sciences (8 | 6.6%), and engineering (8 | 6.6%) are the most common fields of study among 122 individuals in Maupin who have obtained a bachelor's degree or higher.
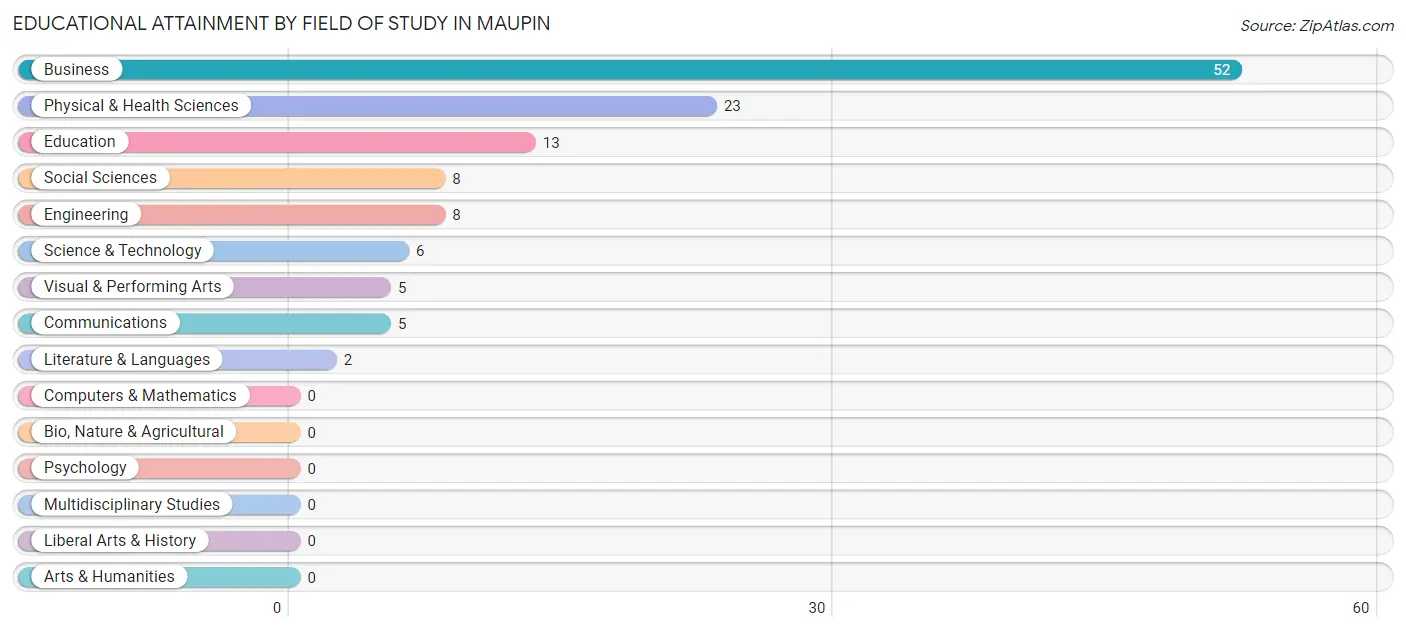
| Field of Study | # Graduates | % Graduates |
| Computers & Mathematics | 0 | 0.0% |
| Bio, Nature & Agricultural | 0 | 0.0% |
| Physical & Health Sciences | 23 | 18.9% |
| Psychology | 0 | 0.0% |
| Social Sciences | 8 | 6.6% |
| Engineering | 8 | 6.6% |
| Multidisciplinary Studies | 0 | 0.0% |
| Science & Technology | 6 | 4.9% |
| Business | 52 | 42.6% |
| Education | 13 | 10.7% |
| Literature & Languages | 2 | 1.6% |
| Liberal Arts & History | 0 | 0.0% |
| Visual & Performing Arts | 5 | 4.1% |
| Communications | 5 | 4.1% |
| Arts & Humanities | 0 | 0.0% |
| Total | 122 | 100.0% |
Transportation & Commute in Maupin
Vehicle Availability by Sex in Maupin
The most prevalent vehicle ownership categories in Maupin are males with 2 vehicles (27, accounting for 45.0%) and females with 2 vehicles (21, making up 50.9%).
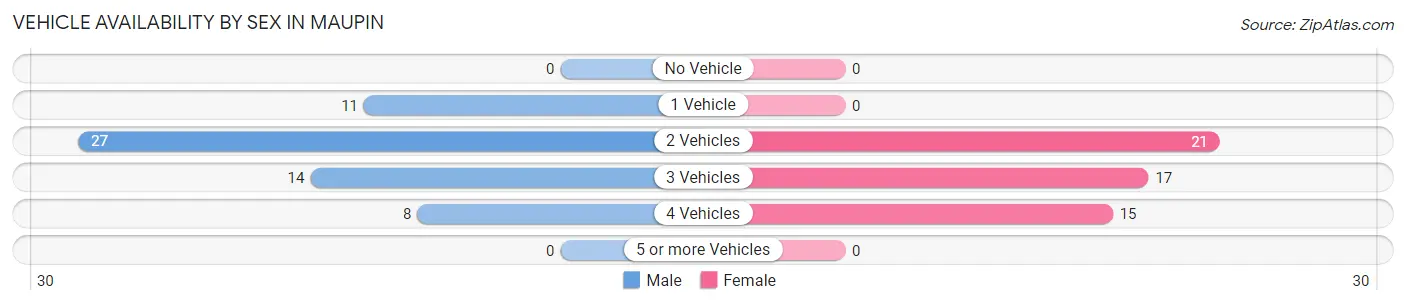
| Vehicles Available | Male | Female |
| No Vehicle | 0 (0.0%) | 0 (0.0%) |
| 1 Vehicle | 11 (18.3%) | 0 (0.0%) |
| 2 Vehicles | 27 (45.0%) | 21 (39.6%) |
| 3 Vehicles | 14 (23.3%) | 17 (32.1%) |
| 4 Vehicles | 8 (13.3%) | 15 (28.3%) |
| 5 or more Vehicles | 0 (0.0%) | 0 (0.0%) |
| Total | 60 (100.0%) | 53 (100.0%) |
Commute Time in Maupin
The most frequently occuring commute durations in Maupin are less than 5 minutes (32 commuters, 28.3%), 15 to 19 minutes (19 commuters, 16.8%), and 45 to 59 minutes (18 commuters, 15.9%).
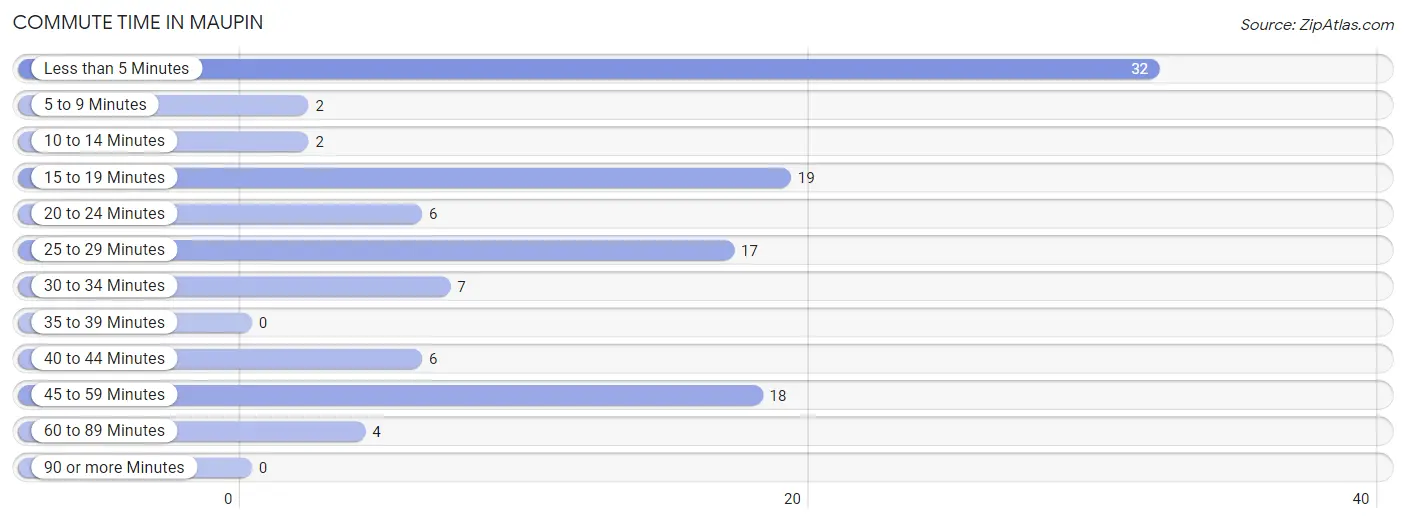
| Commute Time | # Commuters | % Commuters |
| Less than 5 Minutes | 32 | 28.3% |
| 5 to 9 Minutes | 2 | 1.8% |
| 10 to 14 Minutes | 2 | 1.8% |
| 15 to 19 Minutes | 19 | 16.8% |
| 20 to 24 Minutes | 6 | 5.3% |
| 25 to 29 Minutes | 17 | 15.0% |
| 30 to 34 Minutes | 7 | 6.2% |
| 35 to 39 Minutes | 0 | 0.0% |
| 40 to 44 Minutes | 6 | 5.3% |
| 45 to 59 Minutes | 18 | 15.9% |
| 60 to 89 Minutes | 4 | 3.5% |
| 90 or more Minutes | 0 | 0.0% |
Commute Time by Sex in Maupin
The most common commute times in Maupin are less than 5 minutes (21 commuters, 35.0%) for males and less than 5 minutes (11 commuters, 20.7%) for females.
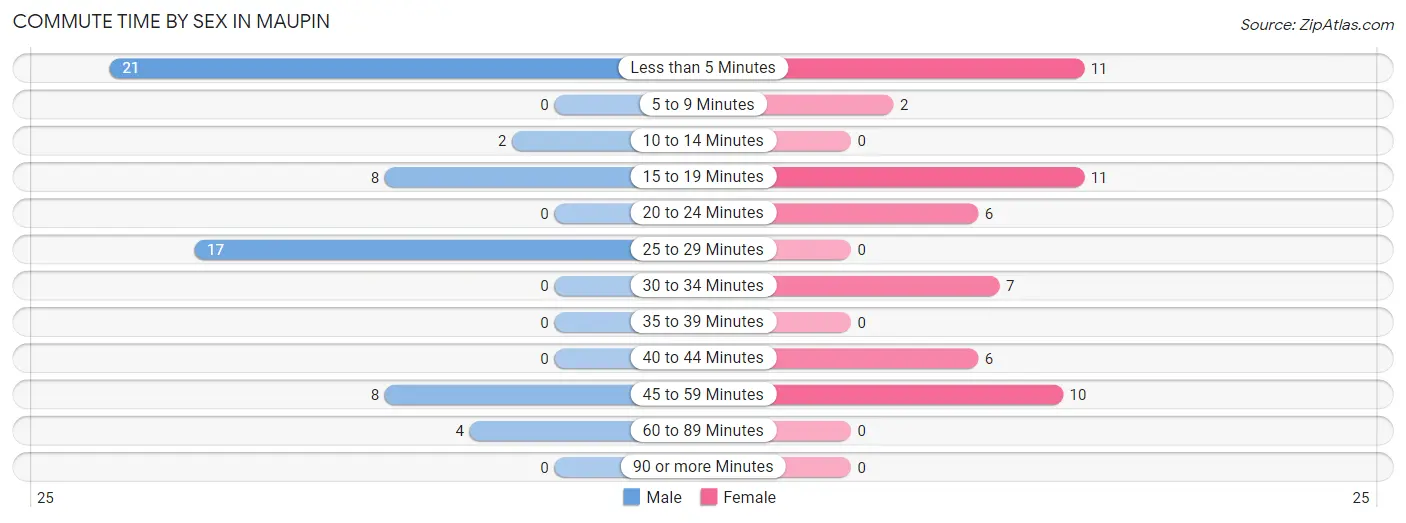
| Commute Time | Male | Female |
| Less than 5 Minutes | 21 (35.0%) | 11 (20.7%) |
| 5 to 9 Minutes | 0 (0.0%) | 2 (3.8%) |
| 10 to 14 Minutes | 2 (3.3%) | 0 (0.0%) |
| 15 to 19 Minutes | 8 (13.3%) | 11 (20.7%) |
| 20 to 24 Minutes | 0 (0.0%) | 6 (11.3%) |
| 25 to 29 Minutes | 17 (28.3%) | 0 (0.0%) |
| 30 to 34 Minutes | 0 (0.0%) | 7 (13.2%) |
| 35 to 39 Minutes | 0 (0.0%) | 0 (0.0%) |
| 40 to 44 Minutes | 0 (0.0%) | 6 (11.3%) |
| 45 to 59 Minutes | 8 (13.3%) | 10 (18.9%) |
| 60 to 89 Minutes | 4 (6.7%) | 0 (0.0%) |
| 90 or more Minutes | 0 (0.0%) | 0 (0.0%) |
Time of Departure to Work by Sex in Maupin
The most frequent times of departure to work in Maupin are 6:00 AM to 6:29 AM (11, 18.3%) for males and 7:00 AM to 7:29 AM (13, 24.5%) for females.
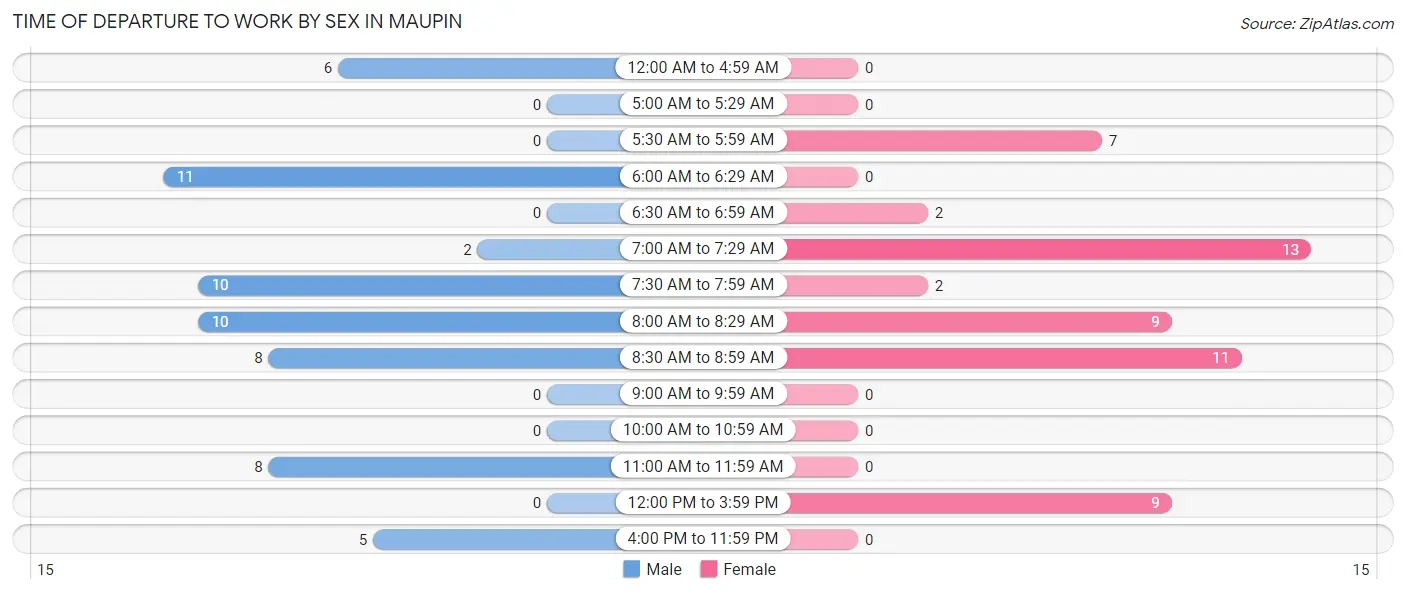
| Time of Departure | Male | Female |
| 12:00 AM to 4:59 AM | 6 (10.0%) | 0 (0.0%) |
| 5:00 AM to 5:29 AM | 0 (0.0%) | 0 (0.0%) |
| 5:30 AM to 5:59 AM | 0 (0.0%) | 7 (13.2%) |
| 6:00 AM to 6:29 AM | 11 (18.3%) | 0 (0.0%) |
| 6:30 AM to 6:59 AM | 0 (0.0%) | 2 (3.8%) |
| 7:00 AM to 7:29 AM | 2 (3.3%) | 13 (24.5%) |
| 7:30 AM to 7:59 AM | 10 (16.7%) | 2 (3.8%) |
| 8:00 AM to 8:29 AM | 10 (16.7%) | 9 (17.0%) |
| 8:30 AM to 8:59 AM | 8 (13.3%) | 11 (20.7%) |
| 9:00 AM to 9:59 AM | 0 (0.0%) | 0 (0.0%) |
| 10:00 AM to 10:59 AM | 0 (0.0%) | 0 (0.0%) |
| 11:00 AM to 11:59 AM | 8 (13.3%) | 0 (0.0%) |
| 12:00 PM to 3:59 PM | 0 (0.0%) | 9 (17.0%) |
| 4:00 PM to 11:59 PM | 5 (8.3%) | 0 (0.0%) |
| Total | 60 (100.0%) | 53 (100.0%) |
Housing Occupancy in Maupin
Occupancy by Ownership in Maupin
Of the total 163 dwellings in Maupin, owner-occupied units account for 124 (76.1%), while renter-occupied units make up 39 (23.9%).
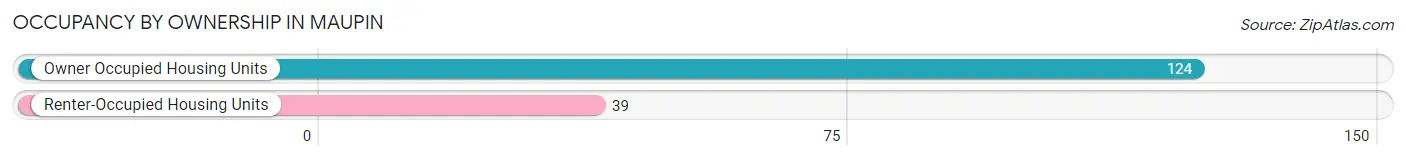
| Occupancy | # Housing Units | % Housing Units |
| Owner Occupied Housing Units | 124 | 76.1% |
| Renter-Occupied Housing Units | 39 | 23.9% |
| Total Occupied Housing Units | 163 | 100.0% |
Occupancy by Household Size in Maupin
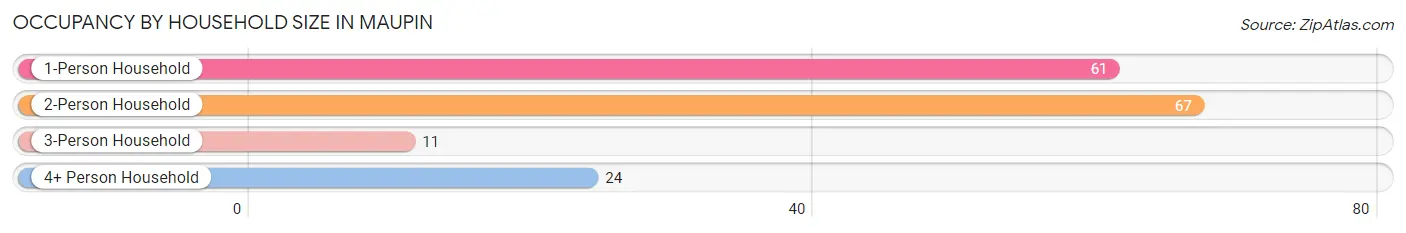
| Household Size | # Housing Units | % Housing Units |
| 1-Person Household | 61 | 37.4% |
| 2-Person Household | 67 | 41.1% |
| 3-Person Household | 11 | 6.8% |
| 4+ Person Household | 24 | 14.7% |
| Total Housing Units | 163 | 100.0% |
Occupancy by Ownership by Household Size in Maupin
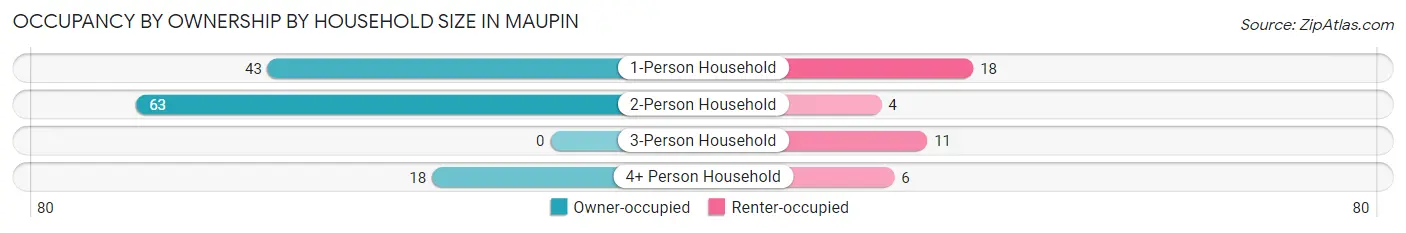
| Household Size | Owner-occupied | Renter-occupied |
| 1-Person Household | 43 (70.5%) | 18 (29.5%) |
| 2-Person Household | 63 (94.0%) | 4 (6.0%) |
| 3-Person Household | 0 (0.0%) | 11 (100.0%) |
| 4+ Person Household | 18 (75.0%) | 6 (25.0%) |
| Total Housing Units | 124 (76.1%) | 39 (23.9%) |
Occupancy by Educational Attainment in Maupin
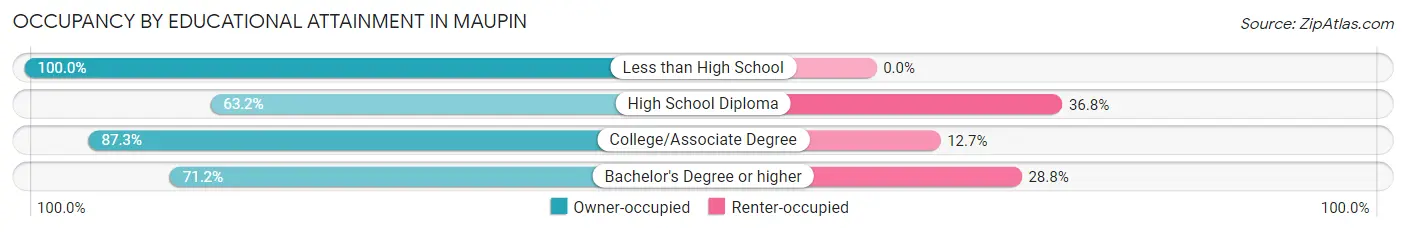
| Household Size | Owner-occupied | Renter-occupied |
| Less than High School | 3 (100.0%) | 0 (0.0%) |
| High School Diploma | 24 (63.2%) | 14 (36.8%) |
| College/Associate Degree | 55 (87.3%) | 8 (12.7%) |
| Bachelor's Degree or higher | 42 (71.2%) | 17 (28.8%) |
Occupancy by Age of Householder in Maupin
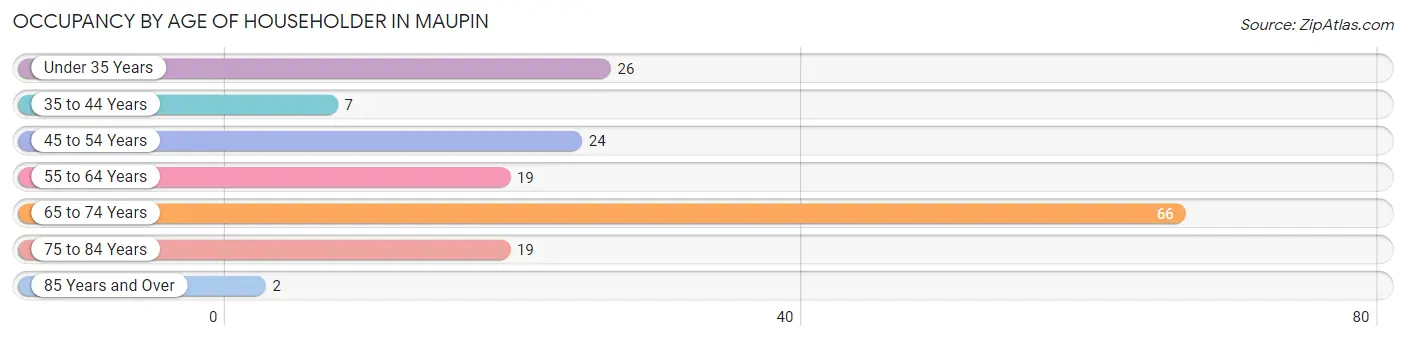
| Age Bracket | # Households | % Households |
| Under 35 Years | 26 | 16.0% |
| 35 to 44 Years | 7 | 4.3% |
| 45 to 54 Years | 24 | 14.7% |
| 55 to 64 Years | 19 | 11.7% |
| 65 to 74 Years | 66 | 40.5% |
| 75 to 84 Years | 19 | 11.7% |
| 85 Years and Over | 2 | 1.2% |
| Total | 163 | 100.0% |
Housing Finances in Maupin
Median Income by Occupancy in Maupin
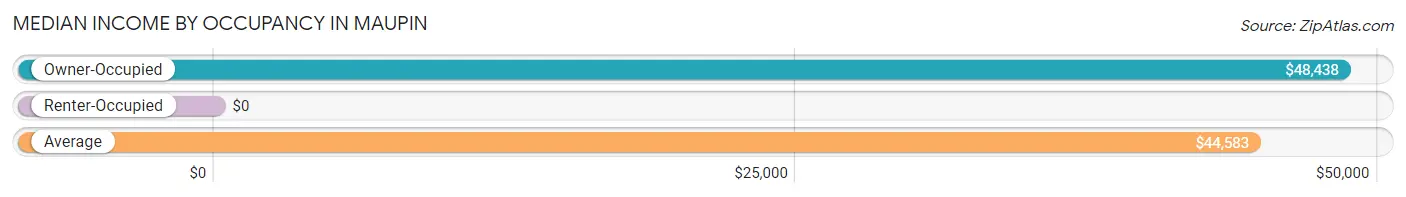
| Occupancy Type | # Households | Median Income |
| Owner-Occupied | 124 (76.1%) | $48,438 |
| Renter-Occupied | 39 (23.9%) | $0 |
| Average | 163 (100.0%) | $44,583 |
Occupancy by Householder Income Bracket in Maupin
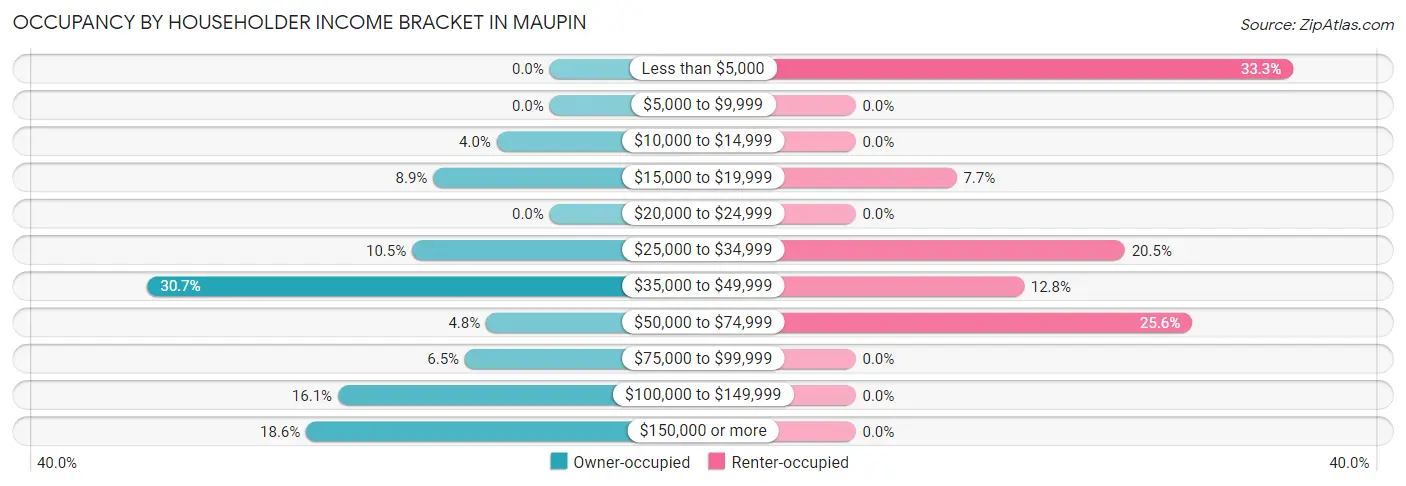
| Income Bracket | Owner-occupied | Renter-occupied |
| Less than $5,000 | 0 (0.0%) | 13 (33.3%) |
| $5,000 to $9,999 | 0 (0.0%) | 0 (0.0%) |
| $10,000 to $14,999 | 5 (4.0%) | 0 (0.0%) |
| $15,000 to $19,999 | 11 (8.9%) | 3 (7.7%) |
| $20,000 to $24,999 | 0 (0.0%) | 0 (0.0%) |
| $25,000 to $34,999 | 13 (10.5%) | 8 (20.5%) |
| $35,000 to $49,999 | 38 (30.6%) | 5 (12.8%) |
| $50,000 to $74,999 | 6 (4.8%) | 10 (25.6%) |
| $75,000 to $99,999 | 8 (6.5%) | 0 (0.0%) |
| $100,000 to $149,999 | 20 (16.1%) | 0 (0.0%) |
| $150,000 or more | 23 (18.5%) | 0 (0.0%) |
| Total | 124 (100.0%) | 39 (100.0%) |
Monthly Housing Cost Tiers in Maupin
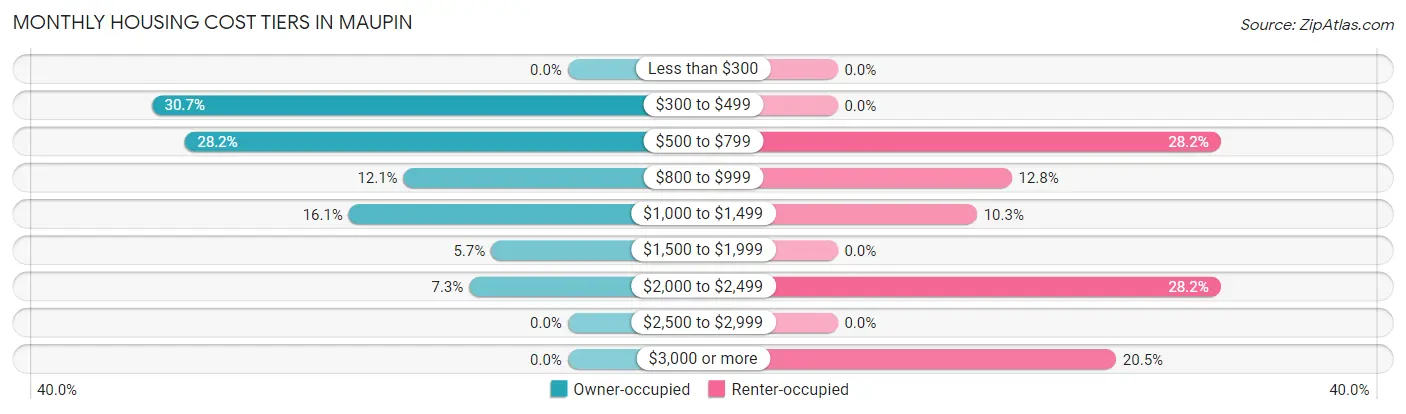
| Monthly Cost | Owner-occupied | Renter-occupied |
| Less than $300 | 0 (0.0%) | 0 (0.0%) |
| $300 to $499 | 38 (30.6%) | 0 (0.0%) |
| $500 to $799 | 35 (28.2%) | 11 (28.2%) |
| $800 to $999 | 15 (12.1%) | 5 (12.8%) |
| $1,000 to $1,499 | 20 (16.1%) | 4 (10.3%) |
| $1,500 to $1,999 | 7 (5.7%) | 0 (0.0%) |
| $2,000 to $2,499 | 9 (7.3%) | 11 (28.2%) |
| $2,500 to $2,999 | 0 (0.0%) | 0 (0.0%) |
| $3,000 or more | 0 (0.0%) | 8 (20.5%) |
| Total | 124 (100.0%) | 39 (100.0%) |
Physical Housing Characteristics in Maupin
Housing Structures in Maupin
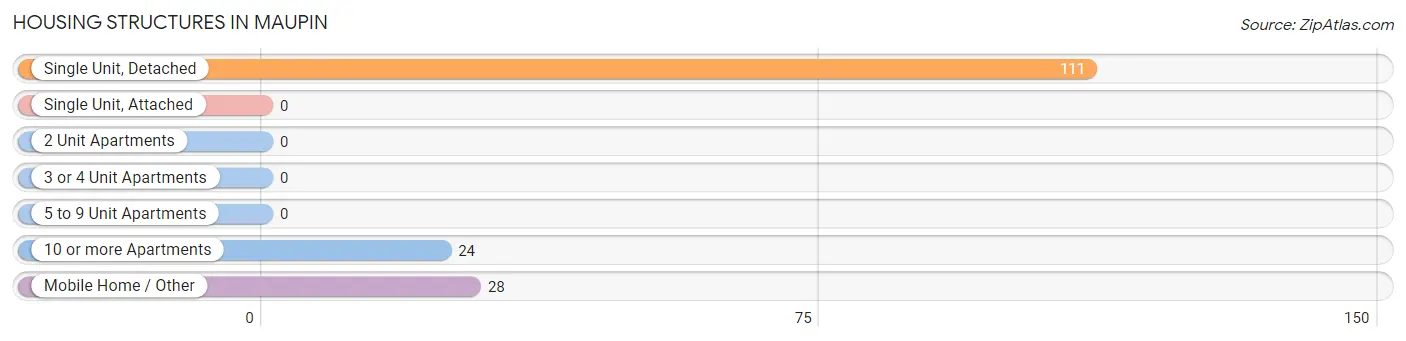
| Structure Type | # Housing Units | % Housing Units |
| Single Unit, Detached | 111 | 68.1% |
| Single Unit, Attached | 0 | 0.0% |
| 2 Unit Apartments | 0 | 0.0% |
| 3 or 4 Unit Apartments | 0 | 0.0% |
| 5 to 9 Unit Apartments | 0 | 0.0% |
| 10 or more Apartments | 24 | 14.7% |
| Mobile Home / Other | 28 | 17.2% |
| Total | 163 | 100.0% |
Housing Structures by Occupancy in Maupin
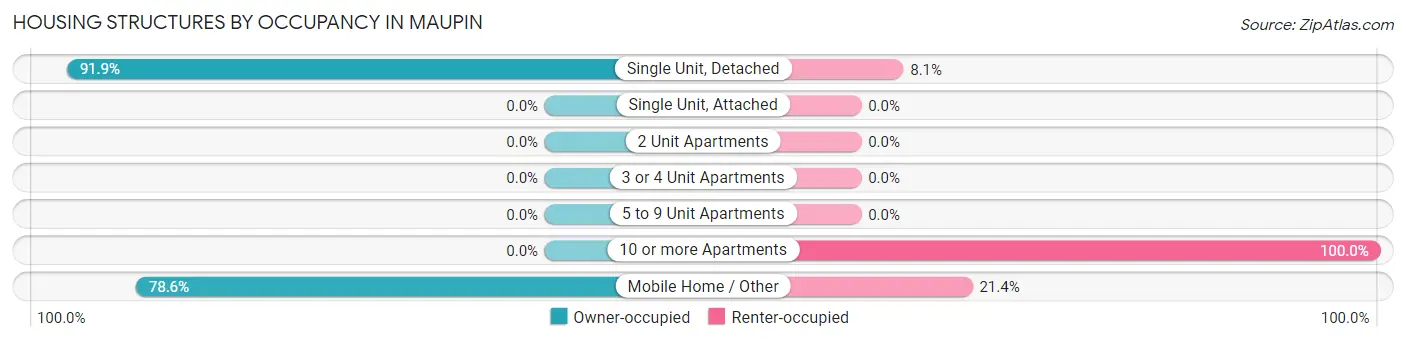
| Structure Type | Owner-occupied | Renter-occupied |
| Single Unit, Detached | 102 (91.9%) | 9 (8.1%) |
| Single Unit, Attached | 0 (0.0%) | 0 (0.0%) |
| 2 Unit Apartments | 0 (0.0%) | 0 (0.0%) |
| 3 or 4 Unit Apartments | 0 (0.0%) | 0 (0.0%) |
| 5 to 9 Unit Apartments | 0 (0.0%) | 0 (0.0%) |
| 10 or more Apartments | 0 (0.0%) | 24 (100.0%) |
| Mobile Home / Other | 22 (78.6%) | 6 (21.4%) |
| Total | 124 (76.1%) | 39 (23.9%) |
Housing Structures by Number of Rooms in Maupin
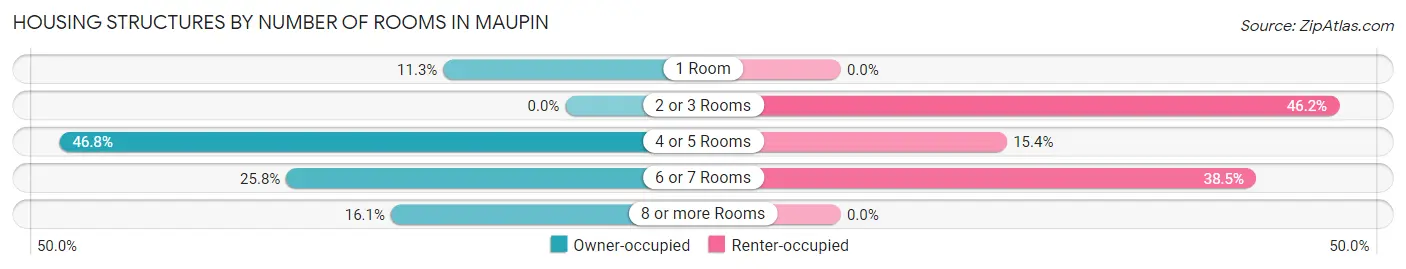
| Number of Rooms | Owner-occupied | Renter-occupied |
| 1 Room | 14 (11.3%) | 0 (0.0%) |
| 2 or 3 Rooms | 0 (0.0%) | 18 (46.2%) |
| 4 or 5 Rooms | 58 (46.8%) | 6 (15.4%) |
| 6 or 7 Rooms | 32 (25.8%) | 15 (38.5%) |
| 8 or more Rooms | 20 (16.1%) | 0 (0.0%) |
| Total | 124 (100.0%) | 39 (100.0%) |
Housing Structure by Heating Type in Maupin
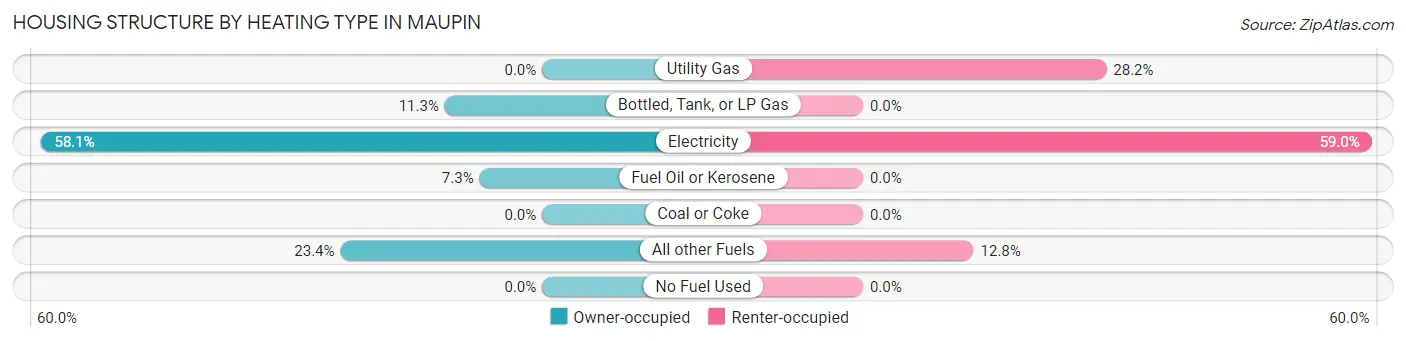
| Heating Type | Owner-occupied | Renter-occupied |
| Utility Gas | 0 (0.0%) | 11 (28.2%) |
| Bottled, Tank, or LP Gas | 14 (11.3%) | 0 (0.0%) |
| Electricity | 72 (58.1%) | 23 (59.0%) |
| Fuel Oil or Kerosene | 9 (7.3%) | 0 (0.0%) |
| Coal or Coke | 0 (0.0%) | 0 (0.0%) |
| All other Fuels | 29 (23.4%) | 5 (12.8%) |
| No Fuel Used | 0 (0.0%) | 0 (0.0%) |
| Total | 124 (100.0%) | 39 (100.0%) |
Household Vehicle Usage in Maupin
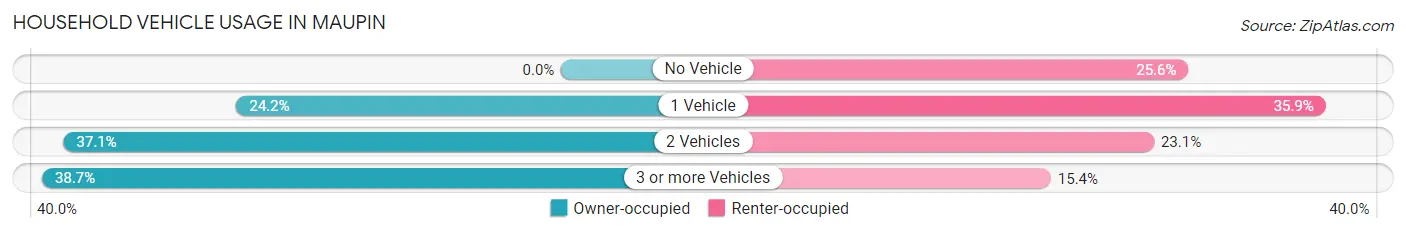
| Vehicles per Household | Owner-occupied | Renter-occupied |
| No Vehicle | 0 (0.0%) | 10 (25.6%) |
| 1 Vehicle | 30 (24.2%) | 14 (35.9%) |
| 2 Vehicles | 46 (37.1%) | 9 (23.1%) |
| 3 or more Vehicles | 48 (38.7%) | 6 (15.4%) |
| Total | 124 (100.0%) | 39 (100.0%) |
Real Estate & Mortgages in Maupin
Real Estate and Mortgage Overview in Maupin
| Characteristic | Without Mortgage | With Mortgage |
| Housing Units | 67 | 57 |
| Median Property Value | $208,300 | $307,100 |
| Median Household Income | - | - |
| Monthly Housing Costs | $499 | $0 |
| Real Estate Taxes | $2,250 | $11 |
Property Value by Mortgage Status in Maupin
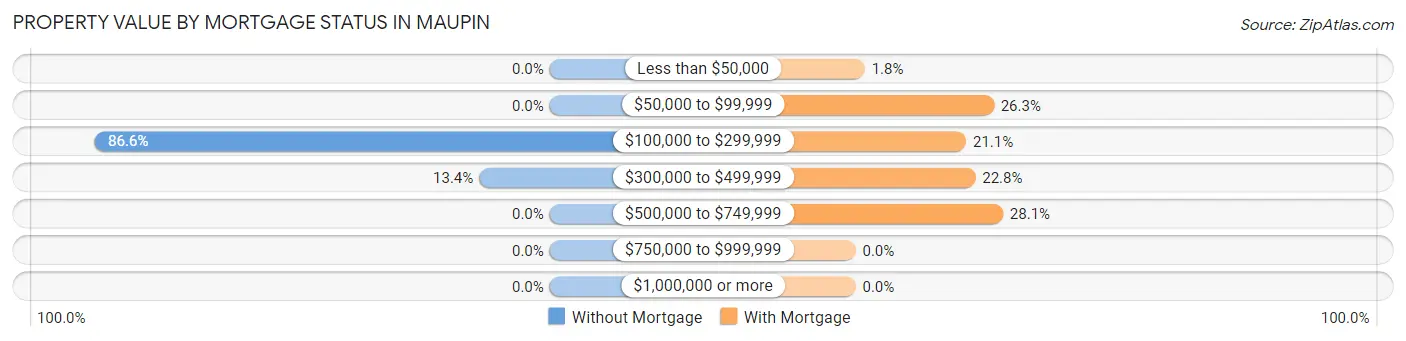
| Property Value | Without Mortgage | With Mortgage |
| Less than $50,000 | 0 (0.0%) | 1 (1.8%) |
| $50,000 to $99,999 | 0 (0.0%) | 15 (26.3%) |
| $100,000 to $299,999 | 58 (86.6%) | 12 (21.0%) |
| $300,000 to $499,999 | 9 (13.4%) | 13 (22.8%) |
| $500,000 to $749,999 | 0 (0.0%) | 16 (28.1%) |
| $750,000 to $999,999 | 0 (0.0%) | 0 (0.0%) |
| $1,000,000 or more | 0 (0.0%) | 0 (0.0%) |
| Total | 67 (100.0%) | 57 (100.0%) |
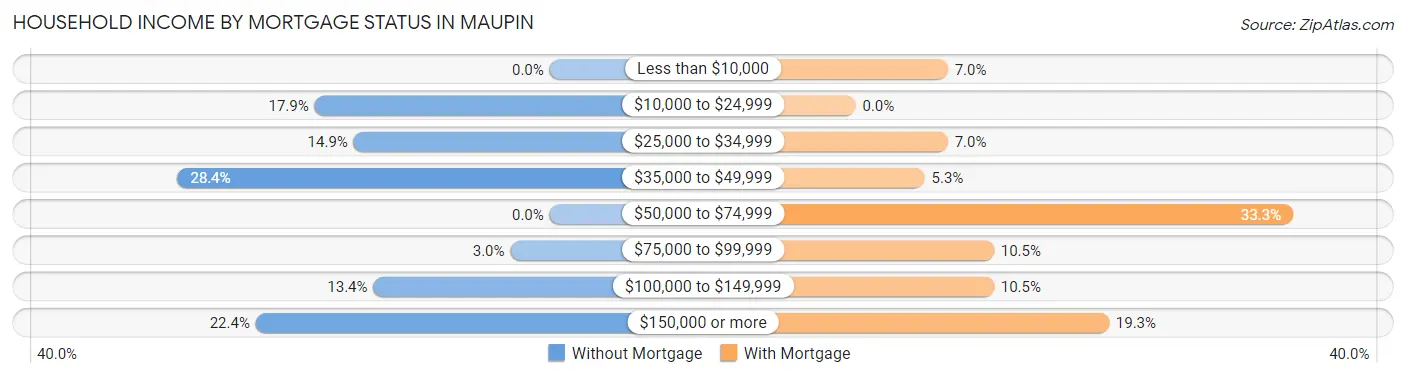
Household Income by Mortgage Status in Maupin
| Household Income | Without Mortgage | With Mortgage |
| Less than $10,000 | 0 (0.0%) | 4 (7.0%) |
| $10,000 to $24,999 | 12 (17.9%) | 0 (0.0%) |
| $25,000 to $34,999 | 10 (14.9%) | 4 (7.0%) |
| $35,000 to $49,999 | 19 (28.4%) | 3 (5.3%) |
| $50,000 to $74,999 | 0 (0.0%) | 19 (33.3%) |
| $75,000 to $99,999 | 2 (3.0%) | 6 (10.5%) |
| $100,000 to $149,999 | 9 (13.4%) | 6 (10.5%) |
| $150,000 or more | 15 (22.4%) | 11 (19.3%) |
| Total | 67 (100.0%) | 57 (100.0%) |
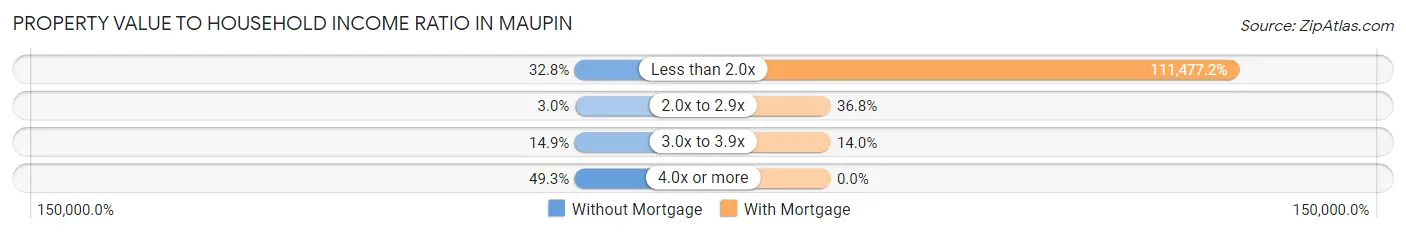
Property Value to Household Income Ratio in Maupin
| Value-to-Income Ratio | Without Mortgage | With Mortgage |
| Less than 2.0x | 22 (32.8%) | 63,542 (111,477.2%) |
| 2.0x to 2.9x | 2 (3.0%) | 21 (36.8%) |
| 3.0x to 3.9x | 10 (14.9%) | 8 (14.0%) |
| 4.0x or more | 33 (49.2%) | 0 (0.0%) |
| Total | 67 (100.0%) | 57 (100.0%) |
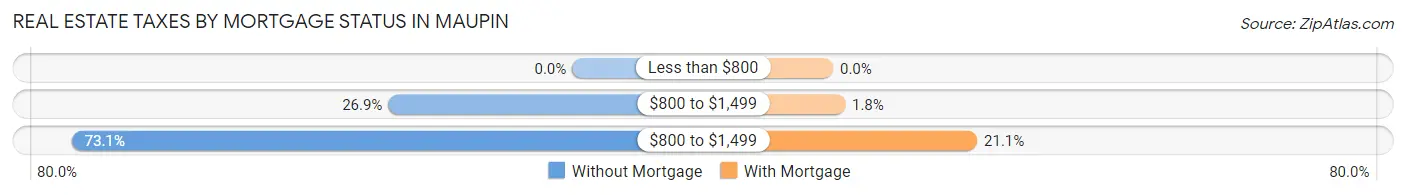
Real Estate Taxes by Mortgage Status in Maupin
| Property Taxes | Without Mortgage | With Mortgage |
| Less than $800 | 0 (0.0%) | 0 (0.0%) |
| $800 to $1,499 | 18 (26.9%) | 1 (1.8%) |
| $800 to $1,499 | 49 (73.1%) | 12 (21.0%) |
| Total | 67 (100.0%) | 57 (100.0%) |
Health & Disability in Maupin
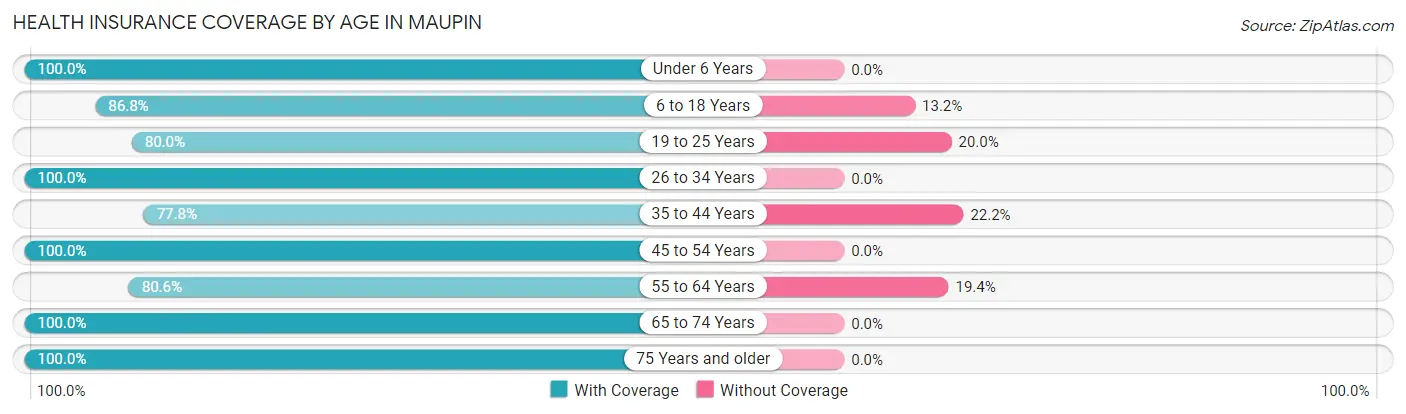
Health Insurance Coverage by Age in Maupin
| Age Bracket | With Coverage | Without Coverage |
| Under 6 Years | 12 (100.0%) | 0 (0.0%) |
| 6 to 18 Years | 46 (86.8%) | 7 (13.2%) |
| 19 to 25 Years | 16 (80.0%) | 4 (20.0%) |
| 26 to 34 Years | 16 (100.0%) | 0 (0.0%) |
| 35 to 44 Years | 21 (77.8%) | 6 (22.2%) |
| 45 to 54 Years | 35 (100.0%) | 0 (0.0%) |
| 55 to 64 Years | 29 (80.6%) | 7 (19.4%) |
| 65 to 74 Years | 99 (100.0%) | 0 (0.0%) |
| 75 Years and older | 34 (100.0%) | 0 (0.0%) |
| Total | 308 (92.8%) | 24 (7.2%) |
Health Insurance Coverage by Citizenship Status in Maupin
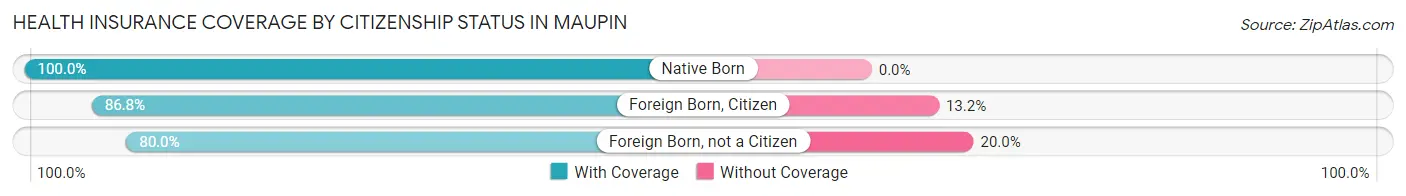
| Citizenship Status | With Coverage | Without Coverage |
| Native Born | 12 (100.0%) | 0 (0.0%) |
| Foreign Born, Citizen | 46 (86.8%) | 7 (13.2%) |
| Foreign Born, not a Citizen | 16 (80.0%) | 4 (20.0%) |
Health Insurance Coverage by Household Income in Maupin
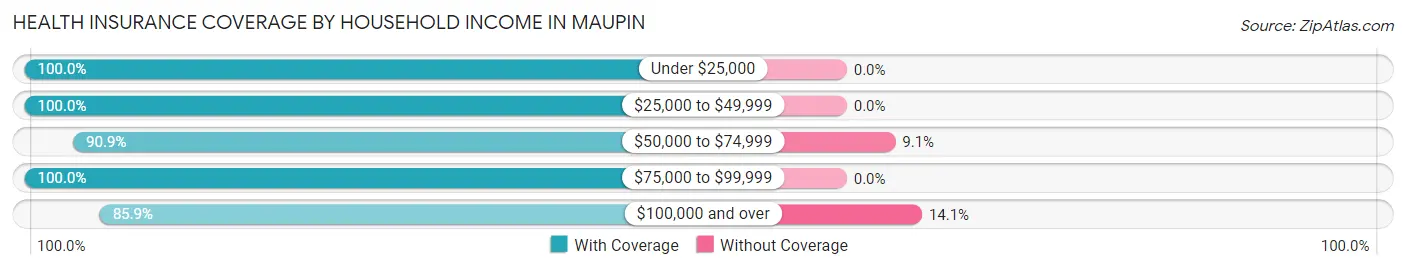
| Household Income | With Coverage | Without Coverage |
| Under $25,000 | 42 (100.0%) | 0 (0.0%) |
| $25,000 to $49,999 | 94 (100.0%) | 0 (0.0%) |
| $50,000 to $74,999 | 40 (90.9%) | 4 (9.1%) |
| $75,000 to $99,999 | 10 (100.0%) | 0 (0.0%) |
| $100,000 and over | 122 (85.9%) | 20 (14.1%) |
Public vs Private Health Insurance Coverage by Age in Maupin
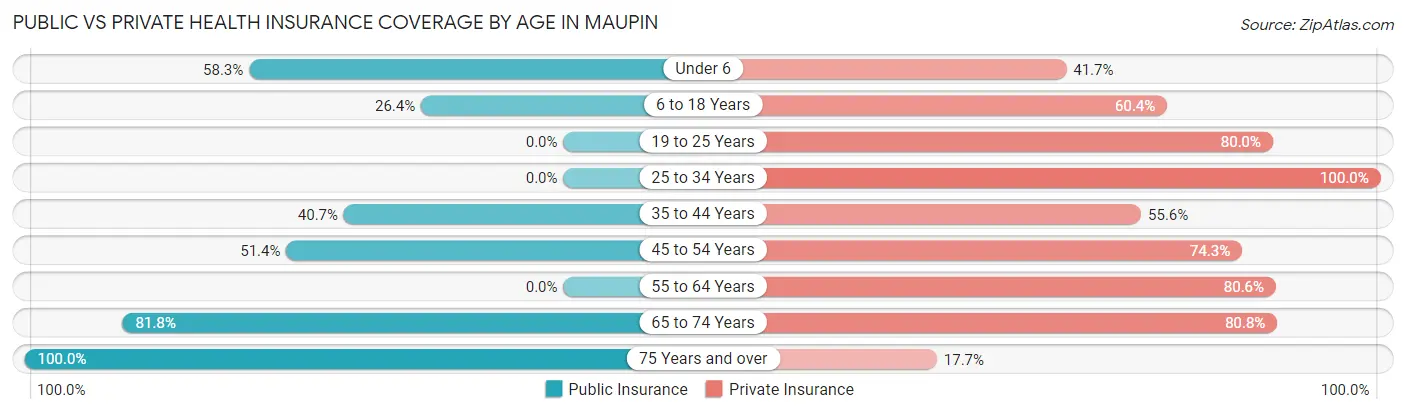
| Age Bracket | Public Insurance | Private Insurance |
| Under 6 | 7 (58.3%) | 5 (41.7%) |
| 6 to 18 Years | 14 (26.4%) | 32 (60.4%) |
| 19 to 25 Years | 0 (0.0%) | 16 (80.0%) |
| 25 to 34 Years | 0 (0.0%) | 16 (100.0%) |
| 35 to 44 Years | 11 (40.7%) | 15 (55.6%) |
| 45 to 54 Years | 18 (51.4%) | 26 (74.3%) |
| 55 to 64 Years | 0 (0.0%) | 29 (80.6%) |
| 65 to 74 Years | 81 (81.8%) | 80 (80.8%) |
| 75 Years and over | 34 (100.0%) | 6 (17.6%) |
| Total | 165 (49.7%) | 225 (67.8%) |
Disability Status by Sex by Age in Maupin
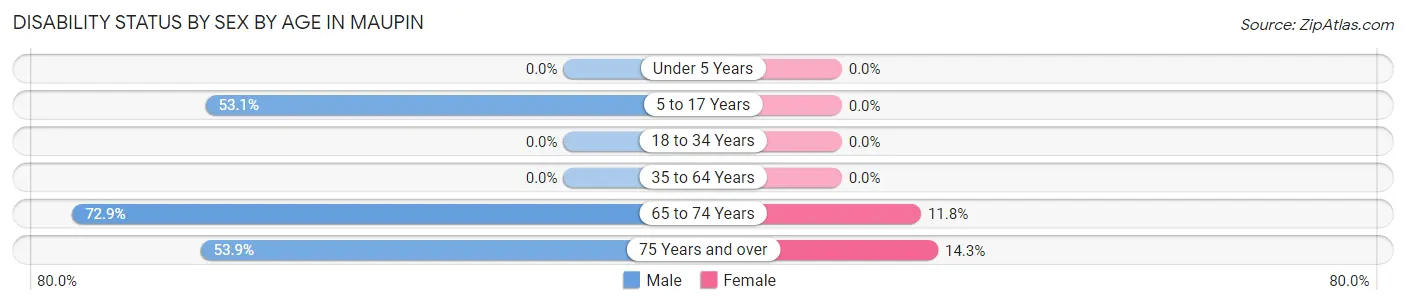
| Age Bracket | Male | Female |
| Under 5 Years | 0 (0.0%) | 0 (0.0%) |
| 5 to 17 Years | 17 (53.1%) | 0 (0.0%) |
| 18 to 34 Years | 0 (0.0%) | 0 (0.0%) |
| 35 to 64 Years | 0 (0.0%) | 0 (0.0%) |
| 65 to 74 Years | 35 (72.9%) | 6 (11.8%) |
| 75 Years and over | 7 (53.8%) | 3 (14.3%) |
Disability Class by Sex by Age in Maupin
Disability Class: Hearing Difficulty

| Age Bracket | Male | Female |
| Under 5 Years | 0 (0.0%) | 0 (0.0%) |
| 5 to 17 Years | 0 (0.0%) | 0 (0.0%) |
| 18 to 34 Years | 0 (0.0%) | 0 (0.0%) |
| 35 to 64 Years | 0 (0.0%) | 0 (0.0%) |
| 65 to 74 Years | 27 (56.2%) | 0 (0.0%) |
| 75 Years and over | 7 (53.8%) | 0 (0.0%) |
Disability Class: Vision Difficulty
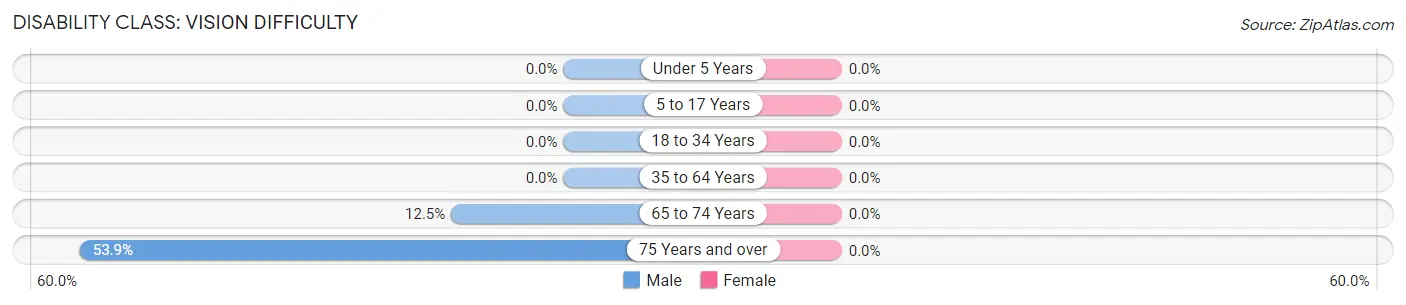
| Age Bracket | Male | Female |
| Under 5 Years | 0 (0.0%) | 0 (0.0%) |
| 5 to 17 Years | 0 (0.0%) | 0 (0.0%) |
| 18 to 34 Years | 0 (0.0%) | 0 (0.0%) |
| 35 to 64 Years | 0 (0.0%) | 0 (0.0%) |
| 65 to 74 Years | 6 (12.5%) | 0 (0.0%) |
| 75 Years and over | 7 (53.8%) | 0 (0.0%) |
Disability Class: Cognitive Difficulty
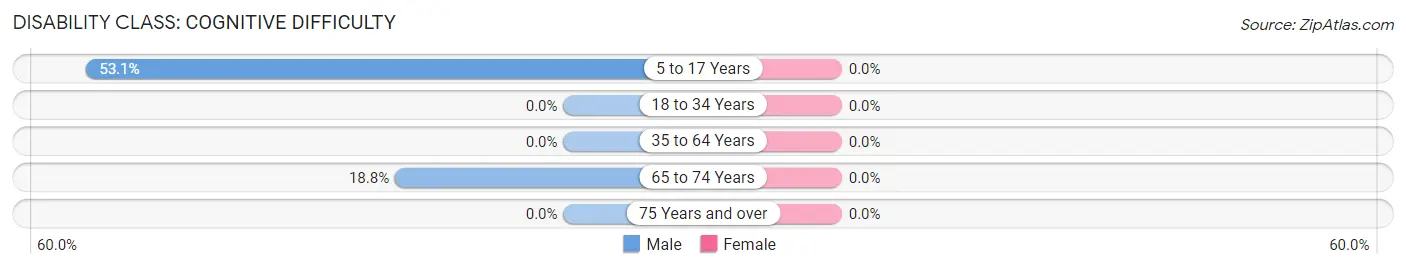
| Age Bracket | Male | Female |
| 5 to 17 Years | 17 (53.1%) | 0 (0.0%) |
| 18 to 34 Years | 0 (0.0%) | 0 (0.0%) |
| 35 to 64 Years | 0 (0.0%) | 0 (0.0%) |
| 65 to 74 Years | 9 (18.8%) | 0 (0.0%) |
| 75 Years and over | 0 (0.0%) | 0 (0.0%) |
Disability Class: Ambulatory Difficulty
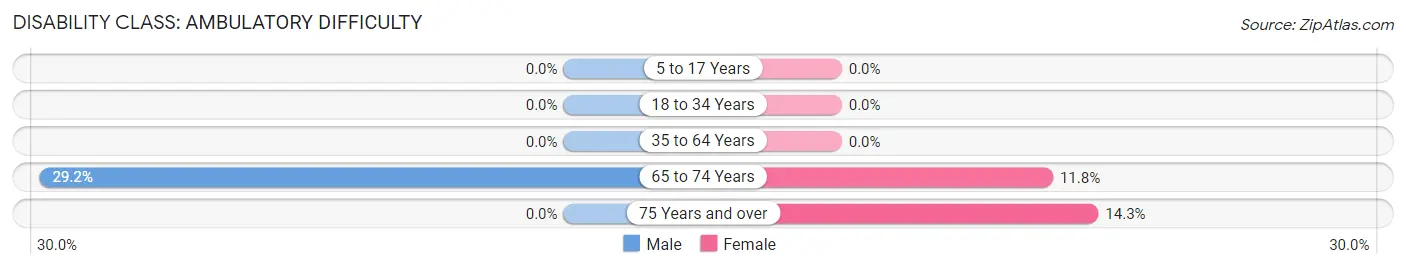
| Age Bracket | Male | Female |
| 5 to 17 Years | 0 (0.0%) | 0 (0.0%) |
| 18 to 34 Years | 0 (0.0%) | 0 (0.0%) |
| 35 to 64 Years | 0 (0.0%) | 0 (0.0%) |
| 65 to 74 Years | 14 (29.2%) | 6 (11.8%) |
| 75 Years and over | 0 (0.0%) | 3 (14.3%) |
Disability Class: Self-Care Difficulty
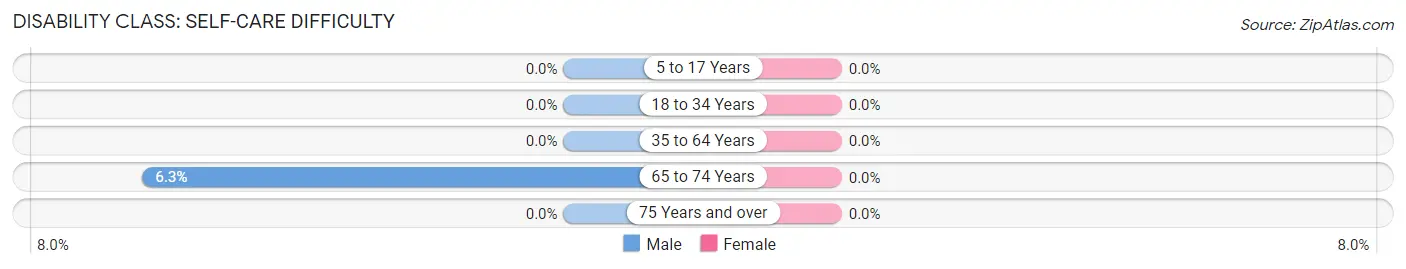
| Age Bracket | Male | Female |
| 5 to 17 Years | 0 (0.0%) | 0 (0.0%) |
| 18 to 34 Years | 0 (0.0%) | 0 (0.0%) |
| 35 to 64 Years | 0 (0.0%) | 0 (0.0%) |
| 65 to 74 Years | 3 (6.2%) | 0 (0.0%) |
| 75 Years and over | 0 (0.0%) | 0 (0.0%) |
Technology Access in Maupin
Computing Device Access in Maupin
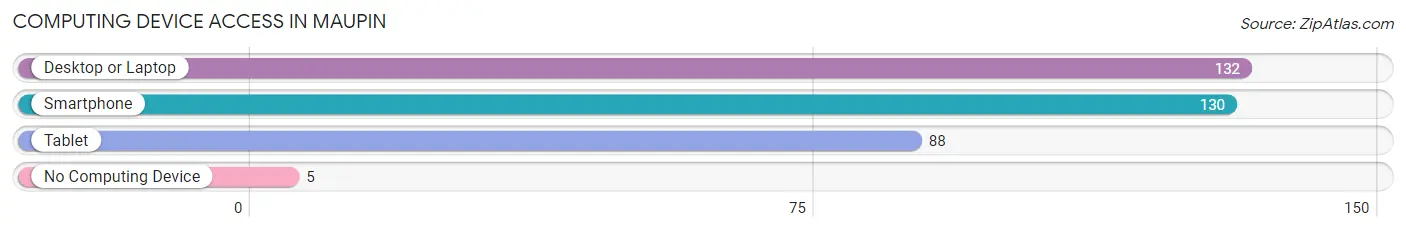
| Device Type | # Households | % Households |
| Desktop or Laptop | 132 | 81.0% |
| Smartphone | 130 | 79.7% |
| Tablet | 88 | 54.0% |
| No Computing Device | 5 | 3.1% |
| Total | 163 | 100.0% |
Internet Access in Maupin
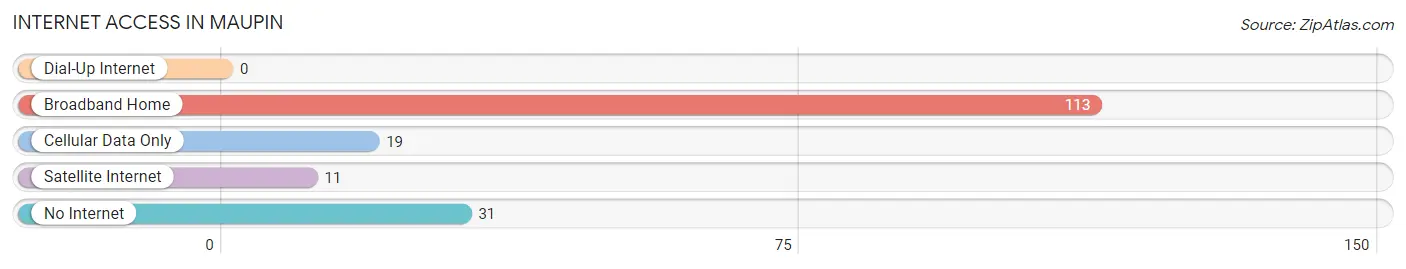
| Internet Type | # Households | % Households |
| Dial-Up Internet | 0 | 0.0% |
| Broadband Home | 113 | 69.3% |
| Cellular Data Only | 19 | 11.7% |
| Satellite Internet | 11 | 6.8% |
| No Internet | 31 | 19.0% |
| Total | 163 | 100.0% |
Maupin Summary
Maupin is a small city located in Wasco County, Oregon, United States. It is situated on the Deschutes River, approximately 80 miles east of Portland. The city has a population of approximately 600 people and is part of the larger metropolitan area of The Dalles.
Geography
Maupin is located in the Columbia River Gorge, a region of the Pacific Northwest known for its dramatic landscapes and abundant outdoor recreation opportunities. The city is situated on the banks of the Deschutes River, which flows through the city and provides a variety of recreational activities, including fishing, rafting, and kayaking. The city is surrounded by rolling hills and mountains, providing stunning views of the surrounding area.
The climate in Maupin is generally mild, with hot summers and cold winters. The average high temperature in the summer is around 90 degrees Fahrenheit, while the average low temperature in the winter is around 30 degrees Fahrenheit. The city receives an average of 16 inches of precipitation per year, with most of it falling in the winter months.
Economy
Maupin’s economy is largely based on tourism and outdoor recreation. The city is home to several popular tourist attractions, including the Deschutes River, the Deschutes National Forest, and the Columbia River Gorge National Scenic Area. The city also has several wineries and breweries, as well as a variety of restaurants and shops.
The city is also home to several businesses, including a lumber mill, a sawmill, and a variety of other small businesses. The city is also home to a number of agricultural operations, including cattle ranches, fruit orchards, and vineyards.
Demographics
As of the 2010 census, the population of Maupin was 590, with a population density of 5.3 people per square mile. The median age of the population was 44.7 years, with a gender ratio of 49.7% male and 50.3% female. The median household income was $37,500, and the median family income was $45,000.
The racial makeup of the city was 94.3% White, 0.2% African American, 0.2% Native American, 0.2% Asian, 0.2% Pacific Islander, 0.2% from other races, and 4.9% from two or more races. Hispanic or Latino of any race were 2.7% of the population.
Conclusion
Maupin is a small city located in Wasco County, Oregon, United States. It is situated on the Deschutes River, approximately 80 miles east of Portland. The city has a population of approximately 600 people and is part of the larger metropolitan area of The Dalles. The city is surrounded by rolling hills and mountains, providing stunning views of the surrounding area. The economy of Maupin is largely based on tourism and outdoor recreation, and the city is home to several popular tourist attractions. The population of Maupin is predominantly White, with a median age of 44.7 years and a median household income of $37,500.
Common Questions
What is Per Capita Income in Maupin?
Per Capita income in Maupin is $37,631.
What is the Median Household income in Maupin?
Median Household Income in Maupin is $44,583.
What is Inequality or Gini Index in Maupin?
Inequality or Gini Index in Maupin is 0.53.
What is the Total Population of Maupin?
Total Population of Maupin is 356.
What is the Total Male Population of Maupin?
Total Male Population of Maupin is 168.
What is the Total Female Population of Maupin?
Total Female Population of Maupin is 188.
What is the Ratio of Males per 100 Females in Maupin?
There are 89.36 Males per 100 Females in Maupin.
What is the Ratio of Females per 100 Males in Maupin?
There are 111.90 Females per 100 Males in Maupin.
What is the Median Population Age in Maupin?
Median Population Age in Maupin is 56.8 Years.
What is the Average Family Size in Maupin
Average Family Size in Maupin is 2.5 People.
What is the Average Household Size in Maupin
Average Household Size in Maupin is 2.0 People.
How Large is the Labor Force in Maupin?
There are 128 People in the Labor Forcein in Maupin.
What is the Percentage of People in the Labor Force in Maupin?
43.0% of People are in the Labor Force in Maupin.