Klawock, AK Map & Demographics
Klawock Map
Klawock Overview
$33,116
PER CAPITA INCOME
$75,972
AVG FAMILY INCOME
$60,625
AVG HOUSEHOLD INCOME
33.6%
WAGE / INCOME GAP [ % ]
66.4¢/ $1
WAGE / INCOME GAP [ $ ]
0.46
INEQUALITY / GINI INDEX
804
TOTAL POPULATION
485
MALE POPULATION
319
FEMALE POPULATION
152.04
MALES / 100 FEMALES
65.77
FEMALES / 100 MALES
44.2
MEDIAN AGE
3.2
AVG FAMILY SIZE
2.5
AVG HOUSEHOLD SIZE
402
LABOR FORCE [ PEOPLE ]
62.9%
PERCENT IN LABOR FORCE
10.2%
UNEMPLOYMENT RATE
Klawock Zip Codes
Klawock Area Codes
Income in Klawock
Income Overview in Klawock
Per Capita Income in Klawock is $33,116, while median incomes of families and households are $75,972 and $60,625 respectively.
| Characteristic | Number | Measure |
| Per Capita Income | 804 | $33,116 |
| Median Family Income | 181 | $75,972 |
| Mean Family Income | 181 | $86,693 |
| Median Household Income | 312 | $60,625 |
| Mean Household Income | 312 | $75,154 |
| Income Deficit | 181 | $0 |
| Wage / Income Gap (%) | 804 | 33.58% |
| Wage / Income Gap ($) | 804 | 66.42¢ per $1 |
| Gini / Inequality Index | 804 | 0.46 |
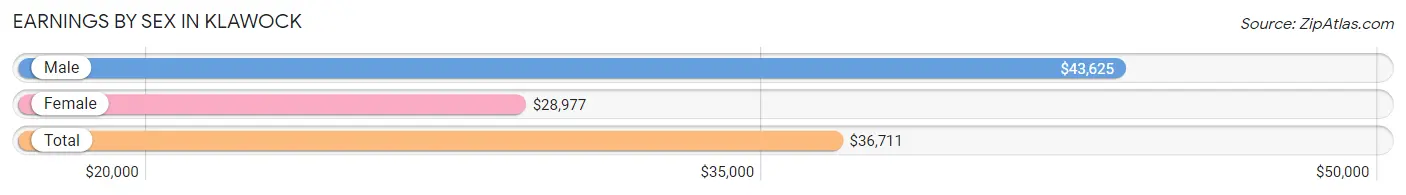
Earnings by Sex in Klawock
Average Earnings in Klawock are $36,711, $43,625 for men and $28,977 for women, a difference of 33.6%.
| Sex | Number | Average Earnings |
| Male | 235 (59.3%) | $43,625 |
| Female | 161 (40.7%) | $28,977 |
| Total | 396 (100.0%) | $36,711 |
Earnings by Sex by Income Bracket in Klawock
The most common earnings brackets in Klawock are $75,000 to $99,999 for men (34 | 14.5%) and $12,500 to $14,999 for women (16 | 9.9%).
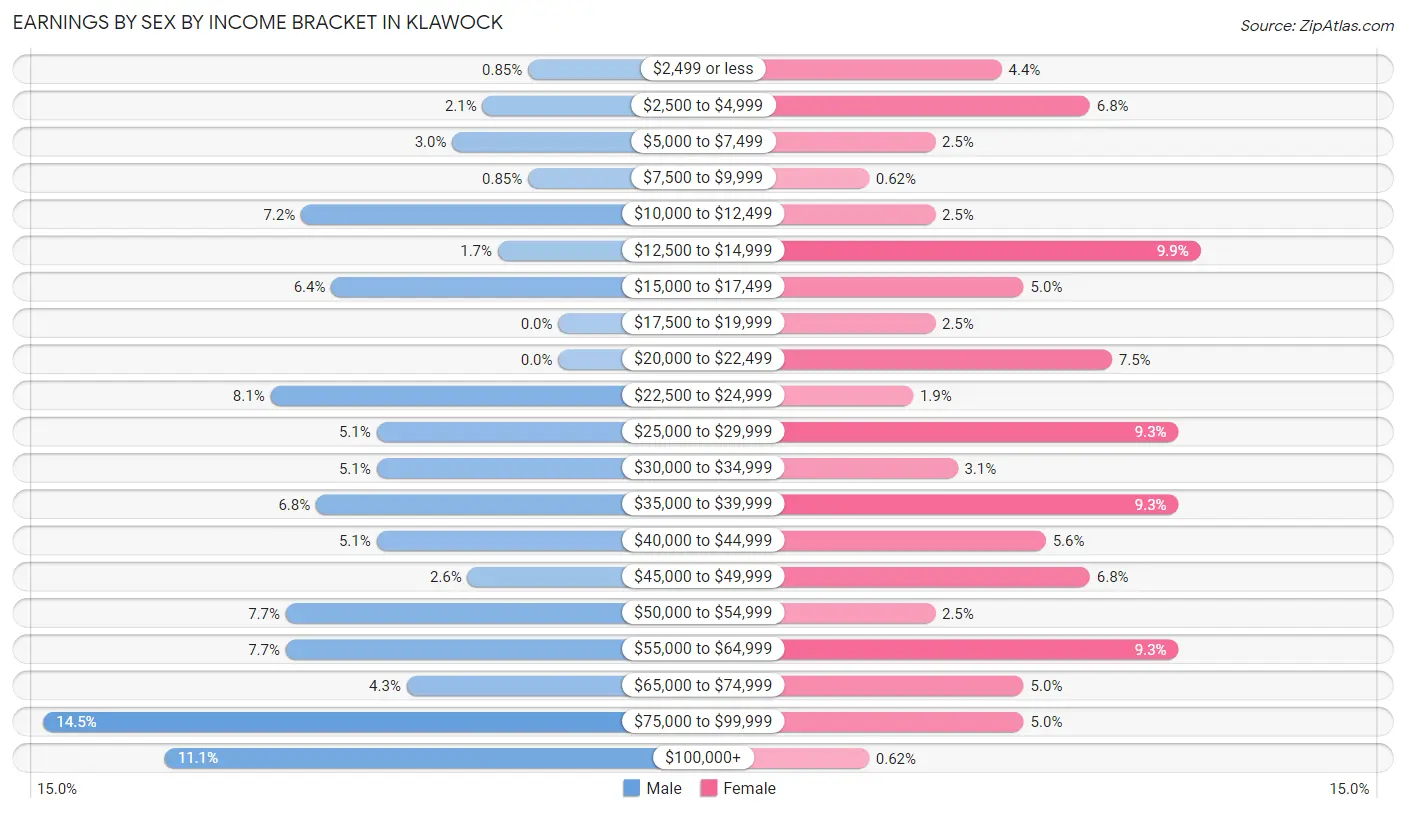
| Income | Male | Female |
| $2,499 or less | 2 (0.9%) | 7 (4.3%) |
| $2,500 to $4,999 | 5 (2.1%) | 11 (6.8%) |
| $5,000 to $7,499 | 7 (3.0%) | 4 (2.5%) |
| $7,500 to $9,999 | 2 (0.9%) | 1 (0.6%) |
| $10,000 to $12,499 | 17 (7.2%) | 4 (2.5%) |
| $12,500 to $14,999 | 4 (1.7%) | 16 (9.9%) |
| $15,000 to $17,499 | 15 (6.4%) | 8 (5.0%) |
| $17,500 to $19,999 | 0 (0.0%) | 4 (2.5%) |
| $20,000 to $22,499 | 0 (0.0%) | 12 (7.4%) |
| $22,500 to $24,999 | 19 (8.1%) | 3 (1.9%) |
| $25,000 to $29,999 | 12 (5.1%) | 15 (9.3%) |
| $30,000 to $34,999 | 12 (5.1%) | 5 (3.1%) |
| $35,000 to $39,999 | 16 (6.8%) | 15 (9.3%) |
| $40,000 to $44,999 | 12 (5.1%) | 9 (5.6%) |
| $45,000 to $49,999 | 6 (2.5%) | 11 (6.8%) |
| $50,000 to $54,999 | 18 (7.7%) | 4 (2.5%) |
| $55,000 to $64,999 | 18 (7.7%) | 15 (9.3%) |
| $65,000 to $74,999 | 10 (4.3%) | 8 (5.0%) |
| $75,000 to $99,999 | 34 (14.5%) | 8 (5.0%) |
| $100,000+ | 26 (11.1%) | 1 (0.6%) |
| Total | 235 (100.0%) | 161 (100.0%) |
Earnings by Sex by Educational Attainment in Klawock
Average earnings in Klawock are $47,917 for men and $29,205 for women, a difference of 39.1%. Men with an educational attainment of bachelor's degree enjoy the highest average annual earnings of $59,219, while those with college or associate's degree education earn the least with $33,750. Women with an educational attainment of graduate degree earn the most with the average annual earnings of $77,083, while those with bachelor's degree education have the smallest earnings of $14,886.
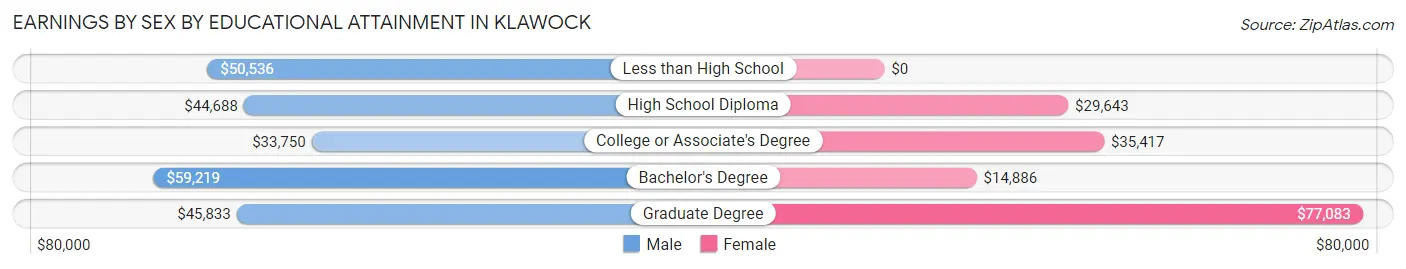
| Educational Attainment | Male Income | Female Income |
| Less than High School | $50,536 | $0 |
| High School Diploma | $44,688 | $29,643 |
| College or Associate's Degree | $33,750 | $35,417 |
| Bachelor's Degree | $59,219 | $14,886 |
| Graduate Degree | $45,833 | $77,083 |
| Total | $47,917 | $29,205 |
Family Income in Klawock
Family Income Brackets in Klawock
According to the Klawock family income data, there are 52 families falling into the $75,000 to $99,999 income range, which is the most common income bracket and makes up 28.7% of all families. Conversely, the $10,000 to $14,999 income bracket is the least frequent group with only 2 families (1.1%) belonging to this category.
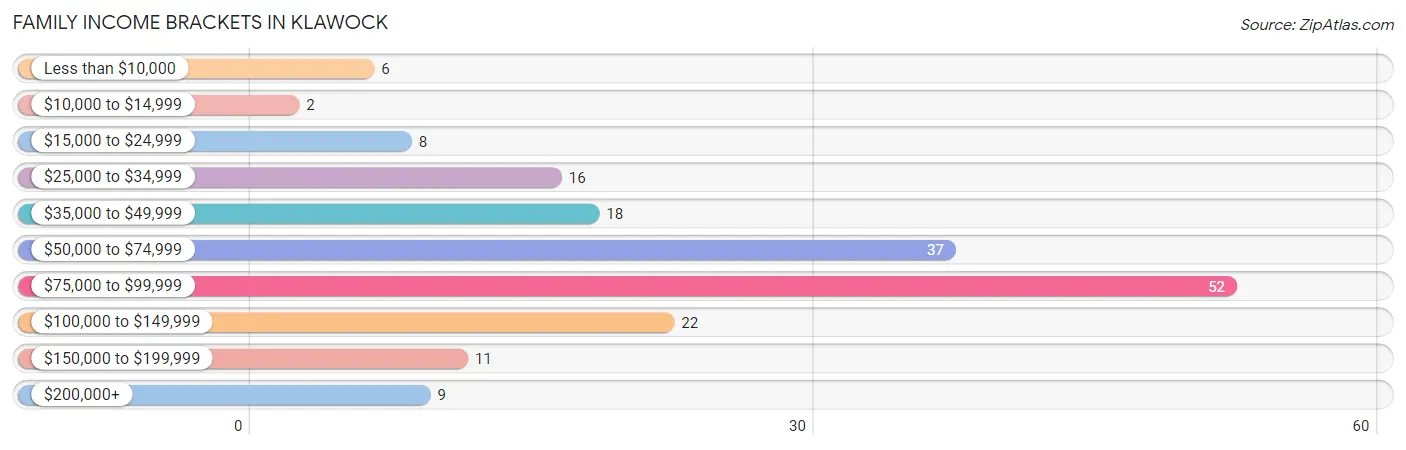
| Income Bracket | # Families | % Families |
| Less than $10,000 | 6 | 3.3% |
| $10,000 to $14,999 | 2 | 1.1% |
| $15,000 to $24,999 | 8 | 4.4% |
| $25,000 to $34,999 | 16 | 8.8% |
| $35,000 to $49,999 | 18 | 9.9% |
| $50,000 to $74,999 | 37 | 20.4% |
| $75,000 to $99,999 | 52 | 28.7% |
| $100,000 to $149,999 | 22 | 12.2% |
| $150,000 to $199,999 | 11 | 6.1% |
| $200,000+ | 9 | 5.0% |
Family Income by Famaliy Size in Klawock
4-person families (26 | 14.4%) account for the highest median family income in Klawock with $91,000 per family, while 2-person families (92 | 50.8%) have the highest median income of $31,406 per family member.
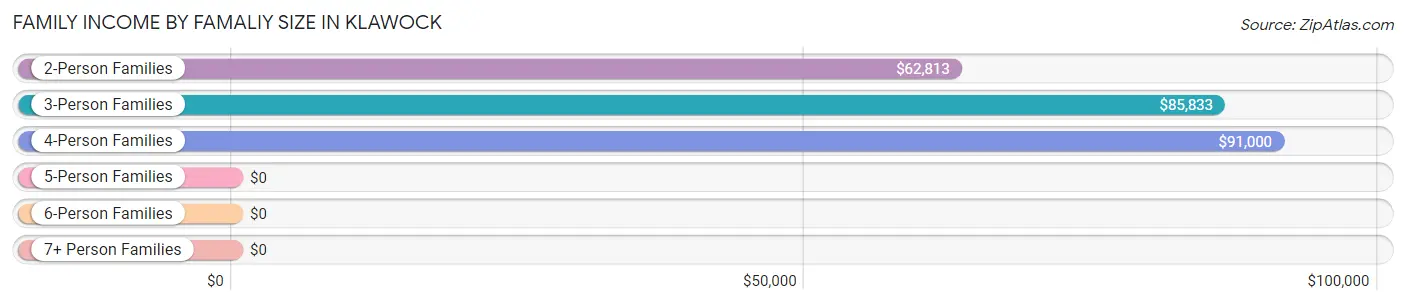
| Income Bracket | # Families | Median Income |
| 2-Person Families | 92 (50.8%) | $62,813 |
| 3-Person Families | 34 (18.8%) | $85,833 |
| 4-Person Families | 26 (14.4%) | $91,000 |
| 5-Person Families | 22 (12.1%) | $0 |
| 6-Person Families | 1 (0.5%) | $0 |
| 7+ Person Families | 6 (3.3%) | $0 |
| Total | 181 (100.0%) | $75,972 |
Family Income by Number of Earners in Klawock
The median family income in Klawock is $75,972, with families comprising 3+ earners (10) having the highest median family income of $156,250, while families with no earners (27) have the lowest median family income of $50,625, accounting for 5.5% and 14.9% of families, respectively.
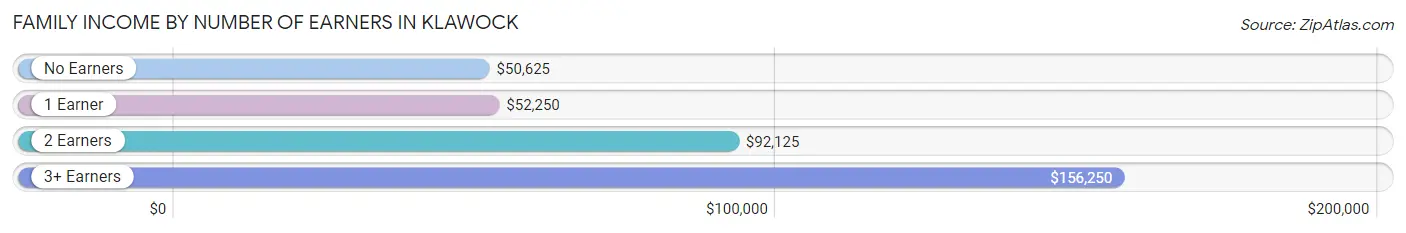
| Number of Earners | # Families | Median Income |
| No Earners | 27 (14.9%) | $50,625 |
| 1 Earner | 65 (35.9%) | $52,250 |
| 2 Earners | 79 (43.6%) | $92,125 |
| 3+ Earners | 10 (5.5%) | $156,250 |
| Total | 181 (100.0%) | $75,972 |
Household Income in Klawock
Household Income Brackets in Klawock
With 60 households falling in the category, the $75,000 to $99,999 income range is the most frequent in Klawock, accounting for 19.2% of all households. In contrast, only 10 households (3.2%) fall into the $10,000 to $14,999 income bracket, making it the least populous group.
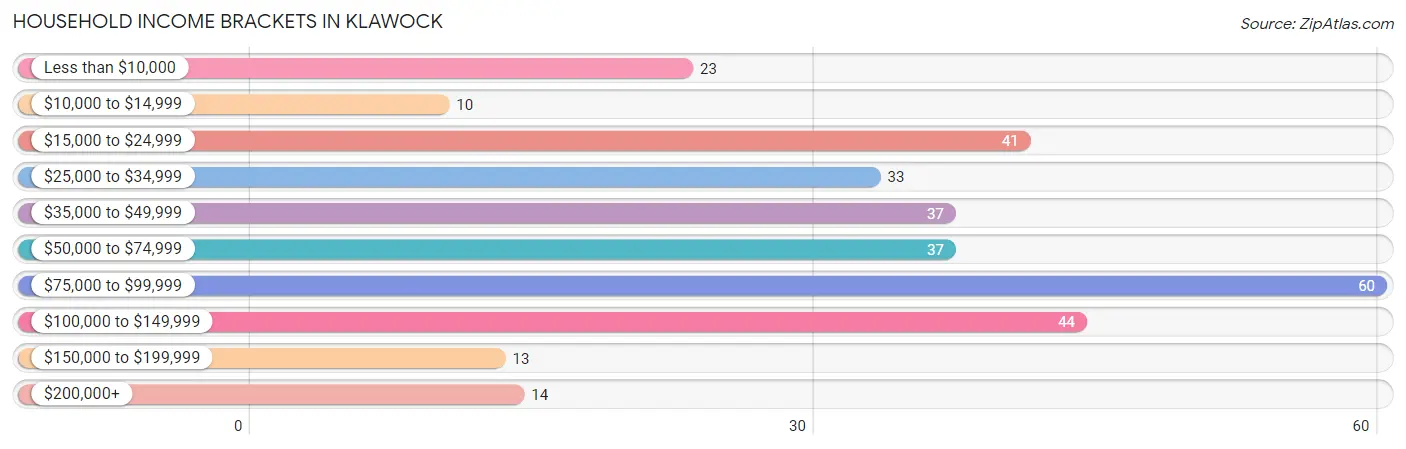
| Income Bracket | # Households | % Households |
| Less than $10,000 | 23 | 7.4% |
| $10,000 to $14,999 | 10 | 3.2% |
| $15,000 to $24,999 | 41 | 13.1% |
| $25,000 to $34,999 | 33 | 10.6% |
| $35,000 to $49,999 | 37 | 11.9% |
| $50,000 to $74,999 | 37 | 11.9% |
| $75,000 to $99,999 | 60 | 19.2% |
| $100,000 to $149,999 | 44 | 14.1% |
| $150,000 to $199,999 | 13 | 4.2% |
| $200,000+ | 14 | 4.5% |
Household Income by Householder Age in Klawock
The median household income in Klawock is $60,625, with the highest median household income of $95,536 found in the 25 to 44 years age bracket for the primary householder. A total of 68 households (21.8%) fall into this category. Meanwhile, the 15 to 24 years age bracket for the primary householder has the lowest median household income of $0, with 11 households (3.5%) in this group.
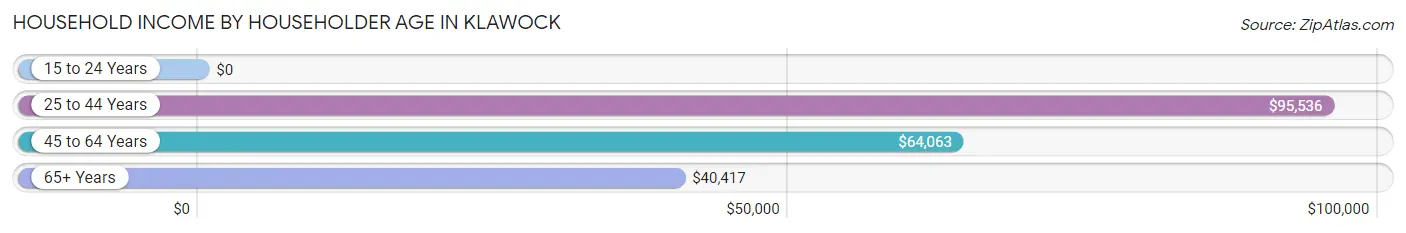
| Income Bracket | # Households | Median Income |
| 15 to 24 Years | 11 (3.5%) | $0 |
| 25 to 44 Years | 68 (21.8%) | $95,536 |
| 45 to 64 Years | 132 (42.3%) | $64,063 |
| 65+ Years | 101 (32.4%) | $40,417 |
| Total | 312 (100.0%) | $60,625 |
Poverty in Klawock
Income Below Poverty by Sex and Age in Klawock
With 17.9% poverty level for males and 17.6% for females among the residents of Klawock, under 5 year old males and under 5 year old females are the most vulnerable to poverty, with 5 males (45.5%) and 6 females (40.0%) in their respective age groups living below the poverty level.
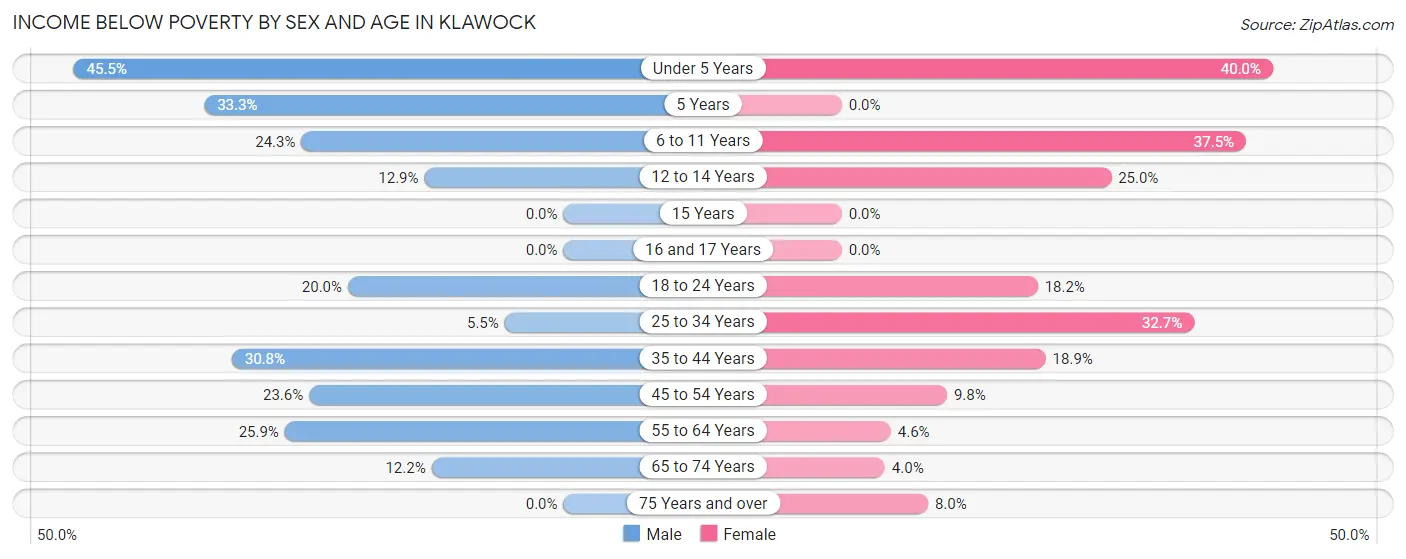
| Age Bracket | Male | Female |
| Under 5 Years | 5 (45.5%) | 6 (40.0%) |
| 5 Years | 6 (33.3%) | 0 (0.0%) |
| 6 to 11 Years | 9 (24.3%) | 12 (37.5%) |
| 12 to 14 Years | 4 (12.9%) | 2 (25.0%) |
| 15 Years | 0 (0.0%) | 0 (0.0%) |
| 16 and 17 Years | 0 (0.0%) | 0 (0.0%) |
| 18 to 24 Years | 6 (20.0%) | 2 (18.2%) |
| 25 to 34 Years | 3 (5.4%) | 17 (32.7%) |
| 35 to 44 Years | 12 (30.8%) | 7 (18.9%) |
| 45 to 54 Years | 21 (23.6%) | 4 (9.8%) |
| 55 to 64 Years | 15 (25.9%) | 2 (4.5%) |
| 65 to 74 Years | 6 (12.2%) | 2 (4.0%) |
| 75 Years and over | 0 (0.0%) | 2 (8.0%) |
| Total | 87 (17.9%) | 56 (17.6%) |
Income Above Poverty by Sex and Age in Klawock
According to the poverty statistics in Klawock, males aged 15 years and females aged 5 years are the age groups that are most secure financially, with 100.0% of males and 100.0% of females in these age groups living above the poverty line.
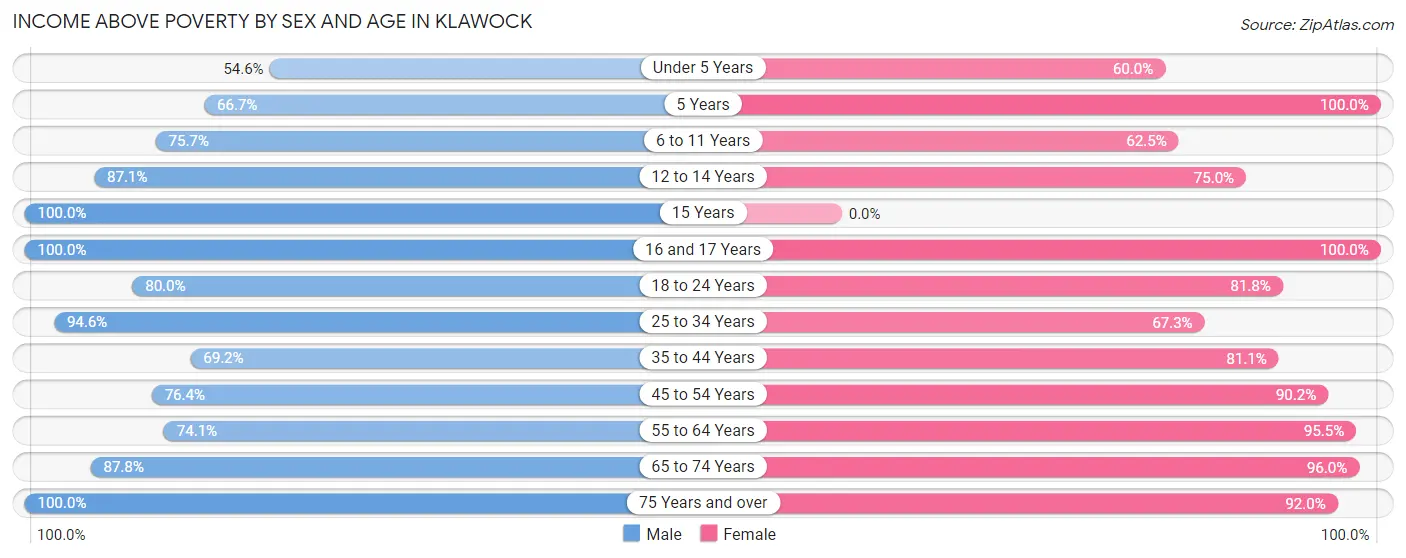
| Age Bracket | Male | Female |
| Under 5 Years | 6 (54.5%) | 9 (60.0%) |
| 5 Years | 12 (66.7%) | 1 (100.0%) |
| 6 to 11 Years | 28 (75.7%) | 20 (62.5%) |
| 12 to 14 Years | 27 (87.1%) | 6 (75.0%) |
| 15 Years | 11 (100.0%) | 0 (0.0%) |
| 16 and 17 Years | 15 (100.0%) | 2 (100.0%) |
| 18 to 24 Years | 24 (80.0%) | 9 (81.8%) |
| 25 to 34 Years | 52 (94.6%) | 35 (67.3%) |
| 35 to 44 Years | 27 (69.2%) | 30 (81.1%) |
| 45 to 54 Years | 68 (76.4%) | 37 (90.2%) |
| 55 to 64 Years | 43 (74.1%) | 42 (95.5%) |
| 65 to 74 Years | 43 (87.8%) | 48 (96.0%) |
| 75 Years and over | 42 (100.0%) | 23 (92.0%) |
| Total | 398 (82.1%) | 262 (82.4%) |
Income Below Poverty Among Married-Couple Families in Klawock
The poverty statistics for married-couple families in Klawock show that 3.6% or 4 of the total 110 families live below the poverty line. Families with 5 or more children have the highest poverty rate of 50.0%, comprising of 2 families. On the other hand, families with 1 or 2 children have the lowest poverty rate of 0.0%, which includes 0 families.
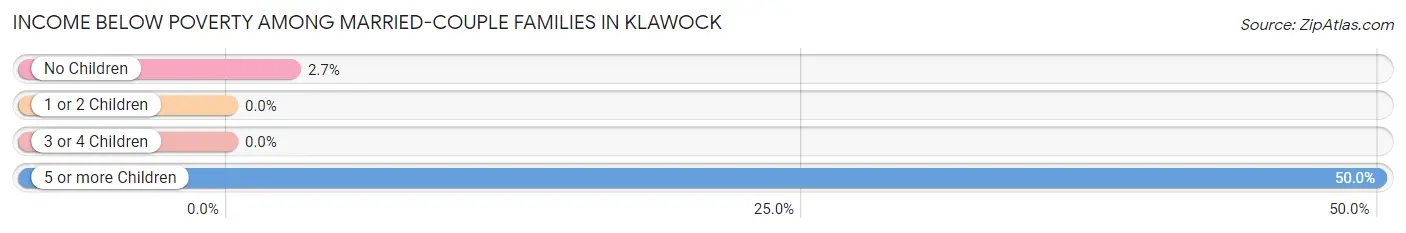
| Children | Above Poverty | Below Poverty |
| No Children | 71 (97.3%) | 2 (2.7%) |
| 1 or 2 Children | 24 (100.0%) | 0 (0.0%) |
| 3 or 4 Children | 9 (100.0%) | 0 (0.0%) |
| 5 or more Children | 2 (50.0%) | 2 (50.0%) |
| Total | 106 (96.4%) | 4 (3.6%) |
Income Below Poverty Among Single-Parent Households in Klawock
According to the poverty data in Klawock, 2.9% or 1 single-father households and 41.7% or 15 single-mother households are living below the poverty line. Among single-father households, those with no children have the highest poverty rate, with 1 households (8.3%) experiencing poverty. Likewise, among single-mother households, those with 3 or 4 children have the highest poverty rate, with 8 households (100.0%) falling below the poverty line.
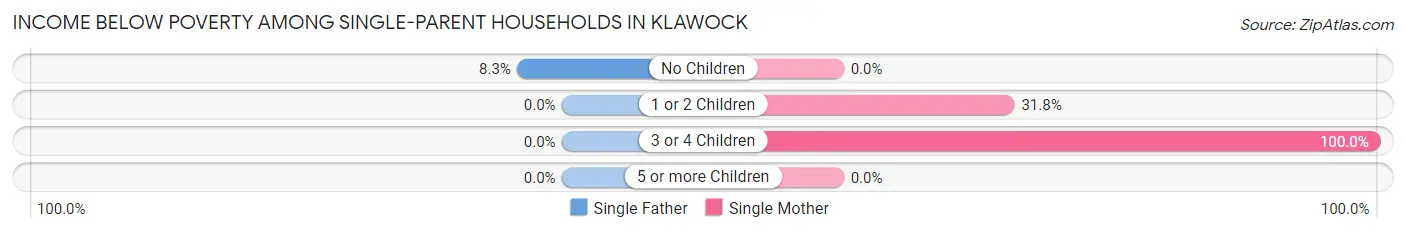
| Children | Single Father | Single Mother |
| No Children | 1 (8.3%) | 0 (0.0%) |
| 1 or 2 Children | 0 (0.0%) | 7 (31.8%) |
| 3 or 4 Children | 0 (0.0%) | 8 (100.0%) |
| 5 or more Children | 0 (0.0%) | 0 (0.0%) |
| Total | 1 (2.9%) | 15 (41.7%) |
Income Below Poverty Among Married-Couple vs Single-Parent Households in Klawock
The poverty data for Klawock shows that 4 of the married-couple family households (3.6%) and 16 of the single-parent households (22.5%) are living below the poverty level. Within the married-couple family households, those with 5 or more children have the highest poverty rate, with 2 households (50.0%) falling below the poverty line. Among the single-parent households, those with 3 or 4 children have the highest poverty rate, with 8 household (53.3%) living below poverty.
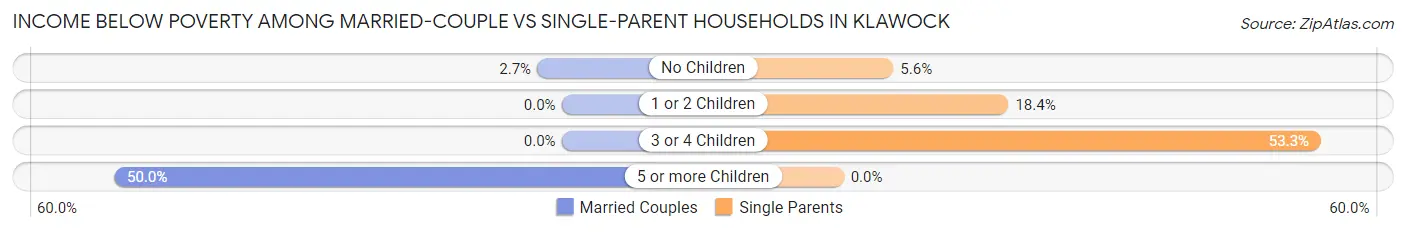
| Children | Married-Couple Families | Single-Parent Households |
| No Children | 2 (2.7%) | 1 (5.6%) |
| 1 or 2 Children | 0 (0.0%) | 7 (18.4%) |
| 3 or 4 Children | 0 (0.0%) | 8 (53.3%) |
| 5 or more Children | 2 (50.0%) | 0 (0.0%) |
| Total | 4 (3.6%) | 16 (22.5%) |
Race in Klawock
The most populous races in Klawock are White / Caucasian (297 | 36.9%), Native / Alaskan (291 | 36.2%), and Two or more Races (201 | 25.0%).
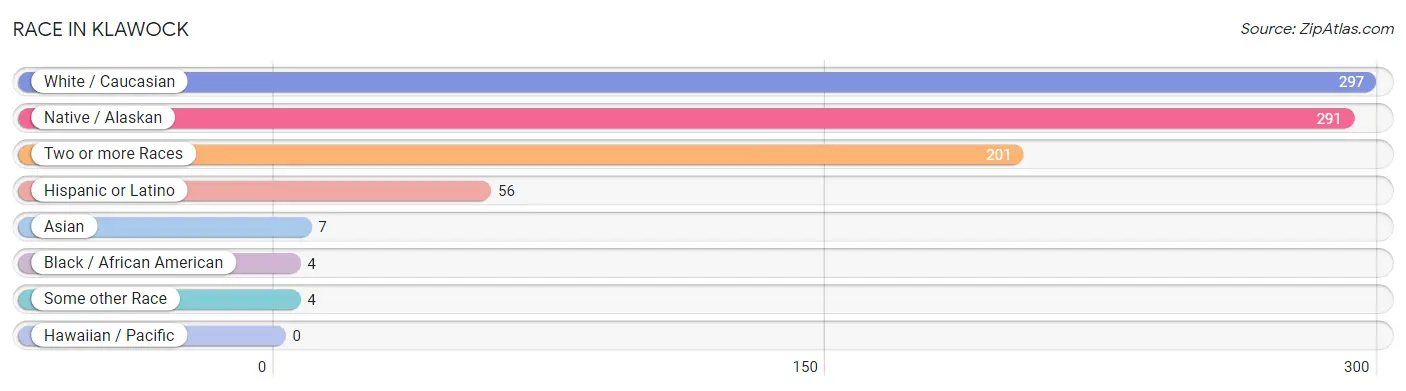
| Race | # Population | % Population |
| Asian | 7 | 0.9% |
| Black / African American | 4 | 0.5% |
| Hawaiian / Pacific | 0 | 0.0% |
| Hispanic or Latino | 56 | 7.0% |
| Native / Alaskan | 291 | 36.2% |
| White / Caucasian | 297 | 36.9% |
| Two or more Races | 201 | 25.0% |
| Some other Race | 4 | 0.5% |
| Total | 804 | 100.0% |
Ancestry in Klawock
The most populous ancestries reported in Klawock are Tlingit-Haida (412 | 51.2%), Irish (122 | 15.2%), German (105 | 13.1%), English (52 | 6.5%), and Korean (49 | 6.1%), together accounting for 92.0% of all Klawock residents.
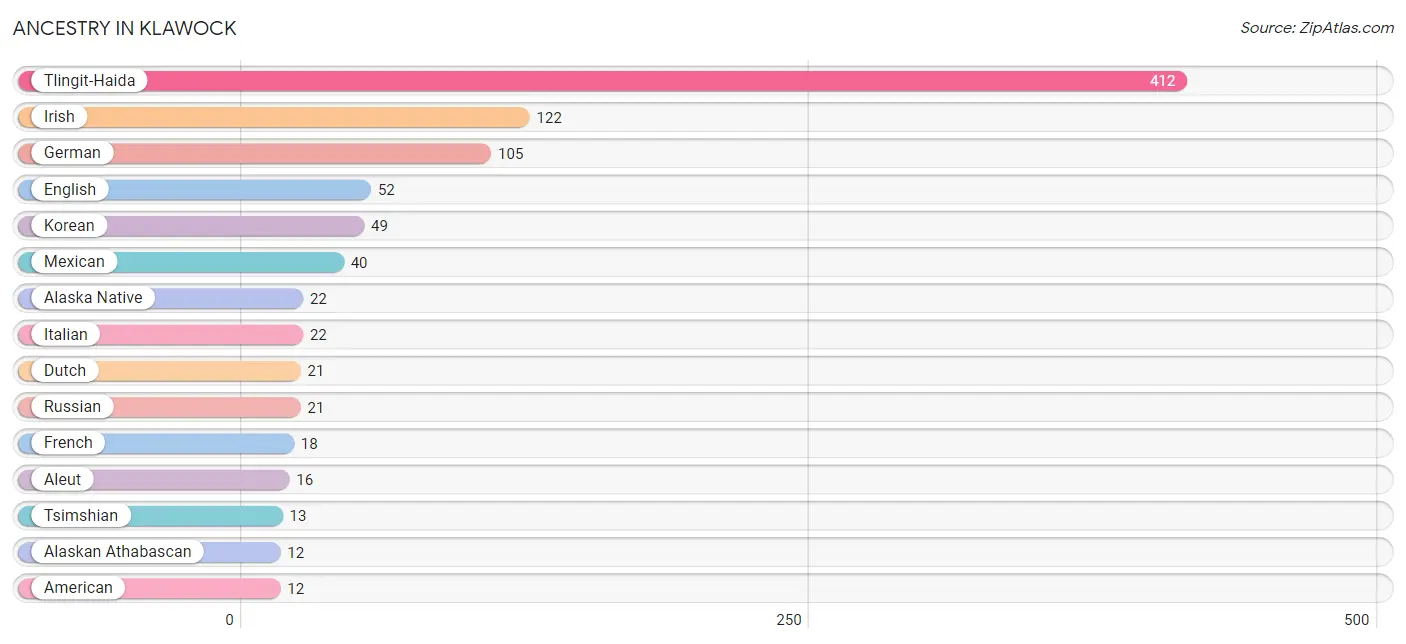
| Ancestry | # Population | % Population |
| Alaska Native | 22 | 2.7% |
| Alaskan Athabascan | 12 | 1.5% |
| Aleut | 16 | 2.0% |
| American | 12 | 1.5% |
| Apache | 5 | 0.6% |
| Austrian | 7 | 0.9% |
| Belgian | 2 | 0.3% |
| Bhutanese | 7 | 0.9% |
| British | 10 | 1.2% |
| Canadian | 9 | 1.1% |
| Central American | 8 | 1.0% |
| Cherokee | 12 | 1.5% |
| Chippewa | 1 | 0.1% |
| Choctaw | 5 | 0.6% |
| Crow | 2 | 0.3% |
| Czech | 1 | 0.1% |
| Czechoslovakian | 9 | 1.1% |
| Danish | 3 | 0.4% |
| Dutch | 21 | 2.6% |
| Eastern European | 1 | 0.1% |
| English | 52 | 6.5% |
| European | 12 | 1.5% |
| Finnish | 2 | 0.3% |
| French | 18 | 2.2% |
| French Canadian | 12 | 1.5% |
| German | 105 | 13.1% |
| Hungarian | 7 | 0.9% |
| Indian (Asian) | 1 | 0.1% |
| Inupiat | 1 | 0.1% |
| Irish | 122 | 15.2% |
| Italian | 22 | 2.7% |
| Korean | 49 | 6.1% |
| Marshallese | 3 | 0.4% |
| Mexican | 40 | 5.0% |
| Native Hawaiian | 1 | 0.1% |
| Norwegian | 3 | 0.4% |
| Panamanian | 2 | 0.3% |
| Polish | 1 | 0.1% |
| Puget Sound Salish | 1 | 0.1% |
| Russian | 21 | 2.6% |
| Salvadoran | 6 | 0.7% |
| Scandinavian | 2 | 0.3% |
| Scotch-Irish | 4 | 0.5% |
| Scottish | 11 | 1.4% |
| Sioux | 2 | 0.3% |
| Spaniard | 8 | 1.0% |
| Sri Lankan | 7 | 0.9% |
| Swedish | 6 | 0.7% |
| Tlingit-Haida | 412 | 51.2% |
| Tsimshian | 13 | 1.6% |
| Ukrainian | 2 | 0.3% |
| Welsh | 7 | 0.9% | View All 52 Rows |
Immigrants in Klawock
The most numerous immigrant groups reported in Klawock came from Canada (9 | 1.1%), Asia (7 | 0.9%), England (7 | 0.9%), Europe (7 | 0.9%), and Northern Europe (7 | 0.9%), together accounting for 4.6% of all Klawock residents.
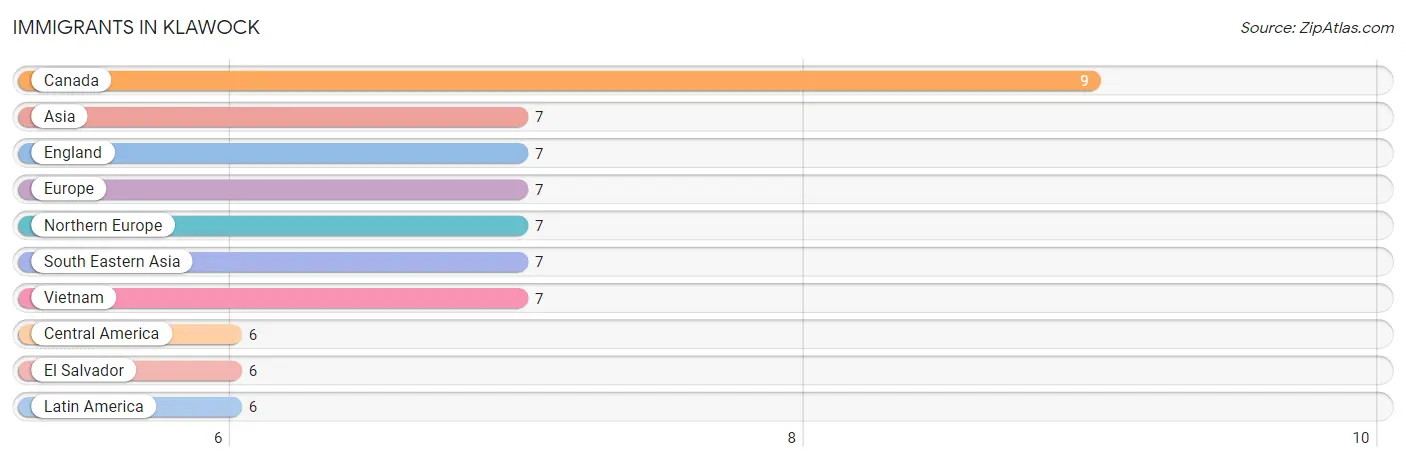
| Immigration Origin | # Population | % Population |
| Asia | 7 | 0.9% |
| Canada | 9 | 1.1% |
| Central America | 6 | 0.7% |
| El Salvador | 6 | 0.7% |
| England | 7 | 0.9% |
| Europe | 7 | 0.9% |
| Latin America | 6 | 0.7% |
| Northern Europe | 7 | 0.9% |
| South Eastern Asia | 7 | 0.9% |
| Vietnam | 7 | 0.9% | View All 10 Rows |
Sex and Age in Klawock
Sex and Age in Klawock
The most populous age groups in Klawock are 50 to 54 Years (56 | 11.6%) for men and 65 to 69 Years (31 | 9.7%) for women.
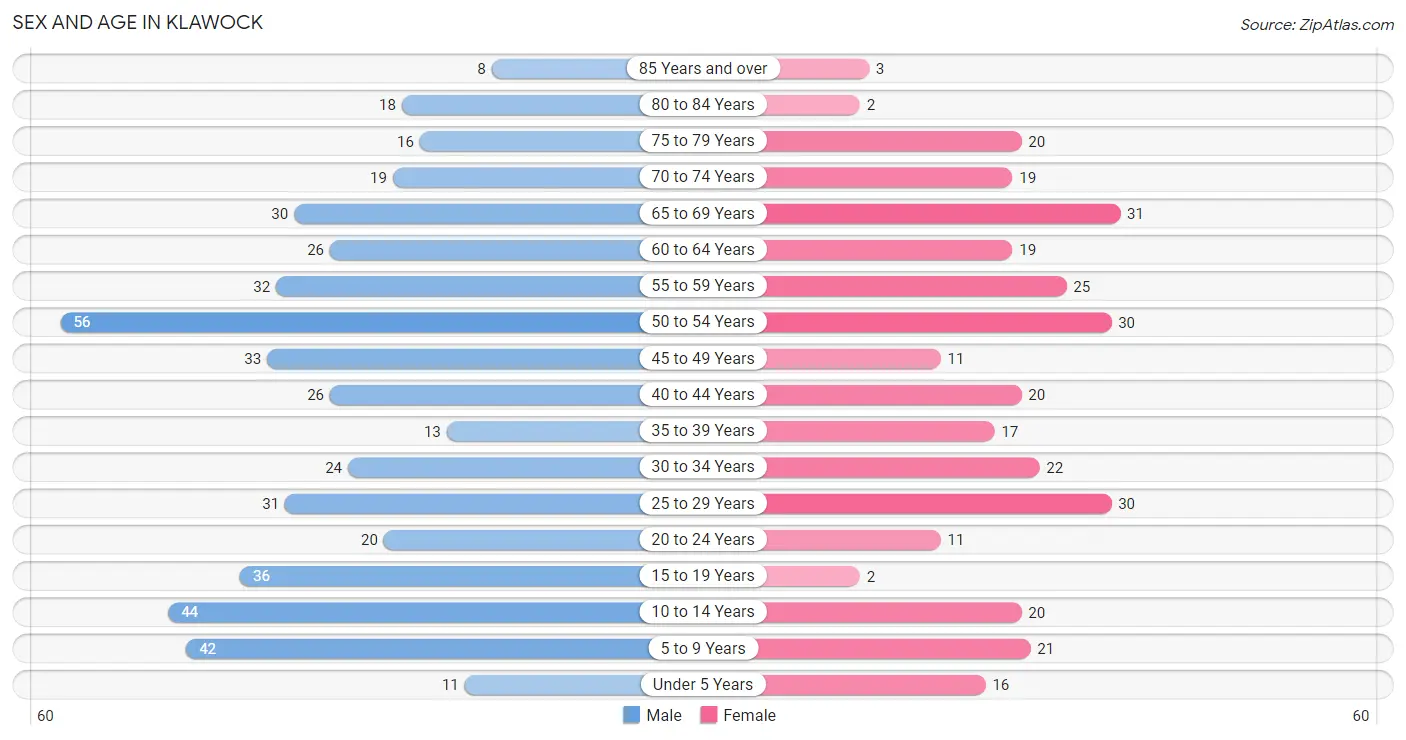
| Age Bracket | Male | Female |
| Under 5 Years | 11 (2.3%) | 16 (5.0%) |
| 5 to 9 Years | 42 (8.7%) | 21 (6.6%) |
| 10 to 14 Years | 44 (9.1%) | 20 (6.3%) |
| 15 to 19 Years | 36 (7.4%) | 2 (0.6%) |
| 20 to 24 Years | 20 (4.1%) | 11 (3.5%) |
| 25 to 29 Years | 31 (6.4%) | 30 (9.4%) |
| 30 to 34 Years | 24 (5.0%) | 22 (6.9%) |
| 35 to 39 Years | 13 (2.7%) | 17 (5.3%) |
| 40 to 44 Years | 26 (5.4%) | 20 (6.3%) |
| 45 to 49 Years | 33 (6.8%) | 11 (3.5%) |
| 50 to 54 Years | 56 (11.6%) | 30 (9.4%) |
| 55 to 59 Years | 32 (6.6%) | 25 (7.8%) |
| 60 to 64 Years | 26 (5.4%) | 19 (6.0%) |
| 65 to 69 Years | 30 (6.2%) | 31 (9.7%) |
| 70 to 74 Years | 19 (3.9%) | 19 (6.0%) |
| 75 to 79 Years | 16 (3.3%) | 20 (6.3%) |
| 80 to 84 Years | 18 (3.7%) | 2 (0.6%) |
| 85 Years and over | 8 (1.7%) | 3 (0.9%) |
| Total | 485 (100.0%) | 319 (100.0%) |
Families and Households in Klawock
Median Family Size in Klawock
The median family size in Klawock is 3.17 persons per family, with single male/father families (35 | 19.3%) accounting for the largest median family size of 3.66 persons per family. On the other hand, married-couple families (110 | 60.8%) represent the smallest median family size with 3.02 persons per family.
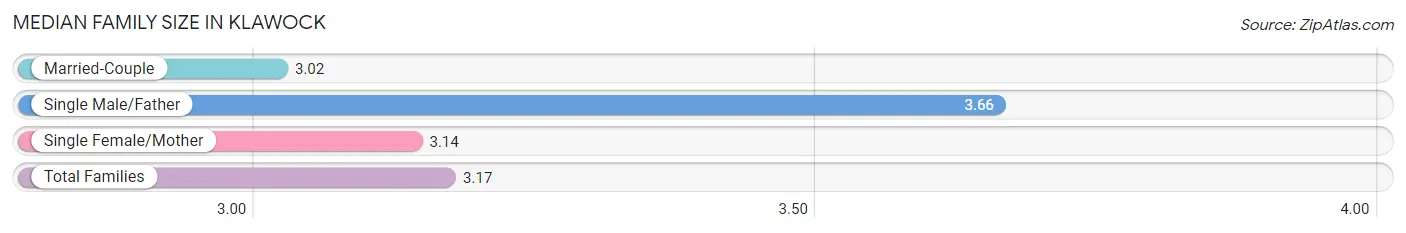
| Family Type | # Families | Family Size |
| Married-Couple | 110 (60.8%) | 3.02 |
| Single Male/Father | 35 (19.3%) | 3.66 |
| Single Female/Mother | 36 (19.9%) | 3.14 |
| Total Families | 181 (100.0%) | 3.17 |
Median Household Size in Klawock
The median household size in Klawock is 2.53 persons per household, with single male/father households (35 | 11.2%) accounting for the largest median household size of 4.57 persons per household. non-family households (131 | 42.0%) represent the smallest median household size with 1.31 persons per household.
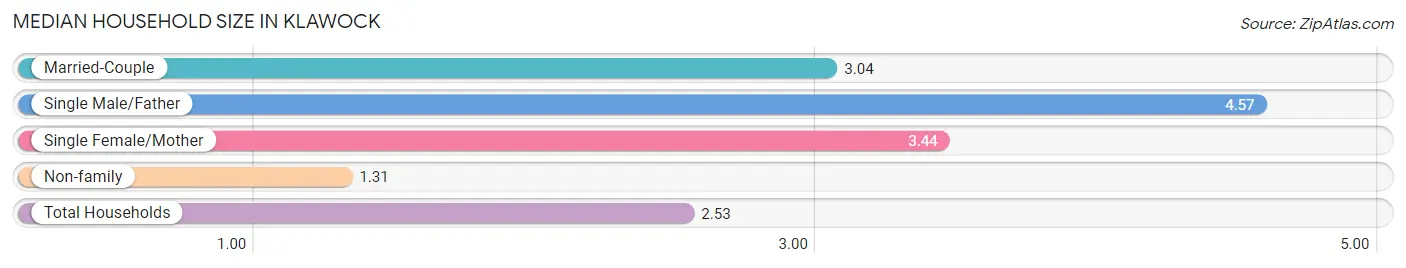
| Household Type | # Households | Household Size |
| Married-Couple | 110 (35.3%) | 3.04 |
| Single Male/Father | 35 (11.2%) | 4.57 |
| Single Female/Mother | 36 (11.5%) | 3.44 |
| Non-family | 131 (42.0%) | 1.31 |
| Total Households | 312 (100.0%) | 2.53 |
Household Size by Marriage Status in Klawock
Out of a total of 312 households in Klawock, 181 (58.0%) are family households, while 131 (42.0%) are nonfamily households. The most numerous type of family households are 2-person households, comprising 82, and the most common type of nonfamily households are 1-person households, comprising 101.
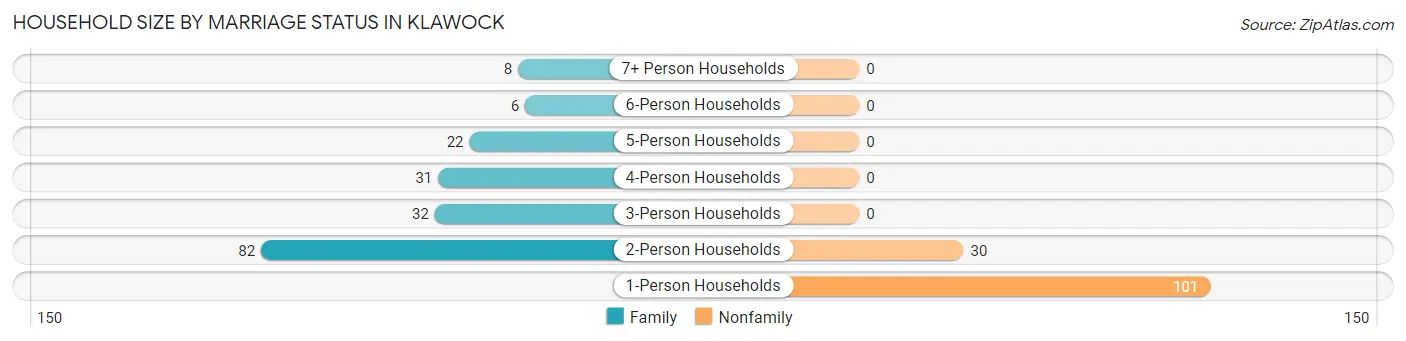
| Household Size | Family Households | Nonfamily Households |
| 1-Person Households | - | 101 (32.4%) |
| 2-Person Households | 82 (26.3%) | 30 (9.6%) |
| 3-Person Households | 32 (10.3%) | 0 (0.0%) |
| 4-Person Households | 31 (9.9%) | 0 (0.0%) |
| 5-Person Households | 22 (7.0%) | 0 (0.0%) |
| 6-Person Households | 6 (1.9%) | 0 (0.0%) |
| 7+ Person Households | 8 (2.6%) | 0 (0.0%) |
| Total | 181 (58.0%) | 131 (42.0%) |
Female Fertility in Klawock
Fertility by Age in Klawock
Average fertility rate in Klawock is 41.0 births per 1,000 women. Women in the age bracket of 20 to 34 years have the highest fertility rate with 79.0 births per 1,000 women. Women in the age bracket of 20 to 34 years acount for 100.0% of all women with births.
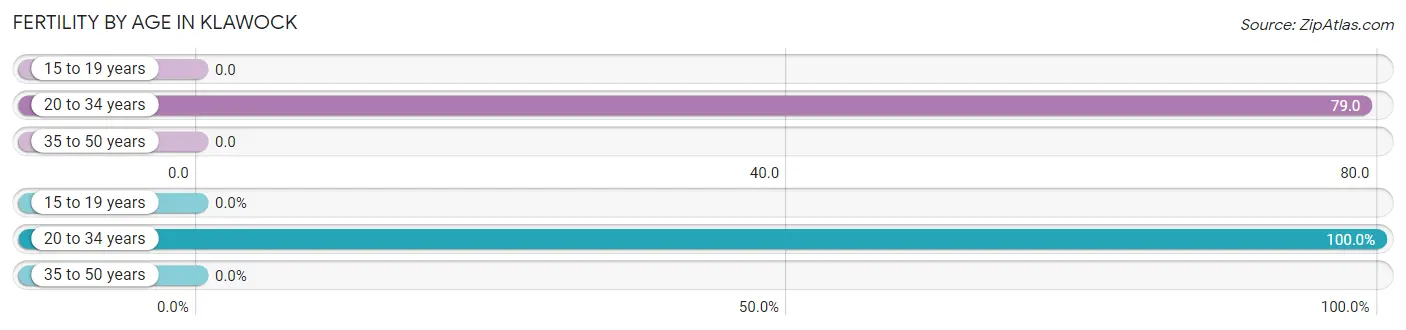
| Age Bracket | Women with Births | Births / 1,000 Women |
| 15 to 19 years | 0 (0.0%) | 0.0 |
| 20 to 34 years | 5 (100.0%) | 79.0 |
| 35 to 50 years | 0 (0.0%) | 0.0 |
| Total | 5 (100.0%) | 41.0 |
Fertility by Age by Marriage Status in Klawock
40.0% of women with births (5) in Klawock are married. The highest percentage of unmarried women with births falls into 20 to 34 years age bracket with 60.0% of them unmarried at the time of birth, while the lowest percentage of unmarried women with births belong to 20 to 34 years age bracket with 60.0% of them unmarried.

| Age Bracket | Married | Unmarried |
| 15 to 19 years | 0 (0.0%) | 0 (0.0%) |
| 20 to 34 years | 2 (40.0%) | 3 (60.0%) |
| 35 to 50 years | 0 (0.0%) | 0 (0.0%) |
| Total | 2 (40.0%) | 3 (60.0%) |
Fertility by Education in Klawock
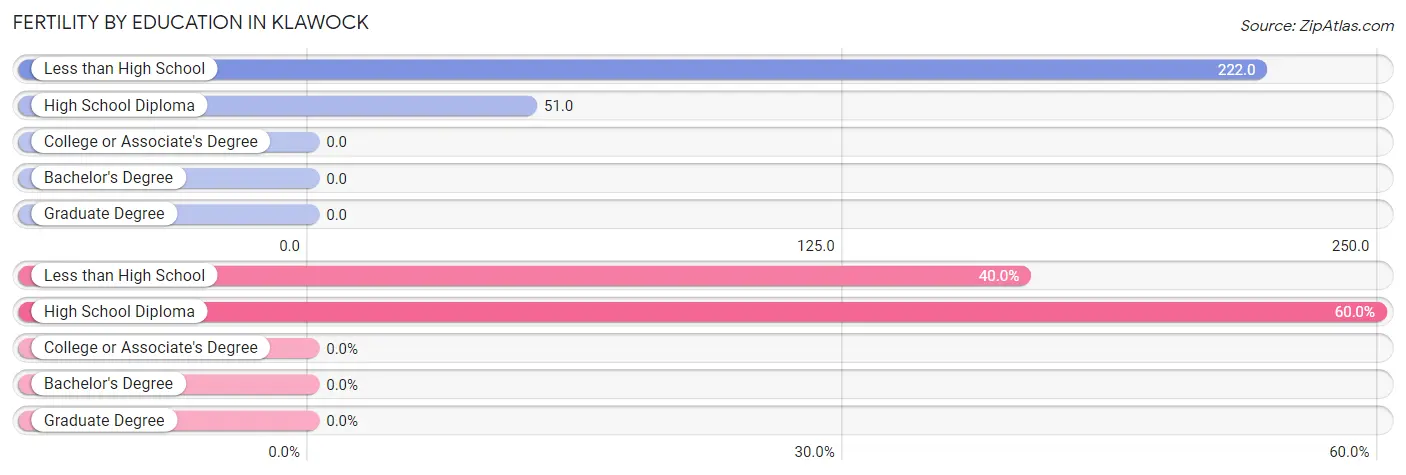
| Educational Attainment | Women with Births | Births / 1,000 Women |
| Less than High School | 2 (40.0%) | 222.0 |
| High School Diploma | 3 (60.0%) | 51.0 |
| College or Associate's Degree | 0 (0.0%) | 0.0 |
| Bachelor's Degree | 0 (0.0%) | 0.0 |
| Graduate Degree | 0 (0.0%) | 0.0 |
| Total | 5 (100.0%) | 41.0 |
Fertility by Education by Marriage Status in Klawock
60.0% of women with births in Klawock are unmarried. Women with the educational attainment of high school diploma are most likely to be married with 66.7% of them married at childbirth, while women with the educational attainment of less than high school are least likely to be married with 100.0% of them unmarried at childbirth.
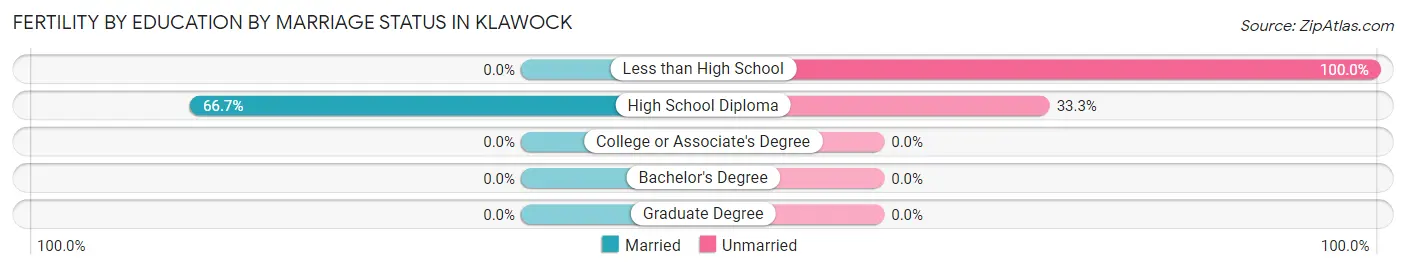
| Educational Attainment | Married | Unmarried |
| Less than High School | 0 (0.0%) | 2 (100.0%) |
| High School Diploma | 2 (66.7%) | 1 (33.3%) |
| College or Associate's Degree | 0 (0.0%) | 0 (0.0%) |
| Bachelor's Degree | 0 (0.0%) | 0 (0.0%) |
| Graduate Degree | 0 (0.0%) | 0 (0.0%) |
| Total | 2 (40.0%) | 3 (60.0%) |
Employment Characteristics in Klawock
Employment by Class of Employer in Klawock
Among the 325 employed individuals in Klawock, private company employees (151 | 46.5%), local government employees (83 | 25.5%), and not-for-profit organizations (33 | 10.2%) make up the most common classes of employment.
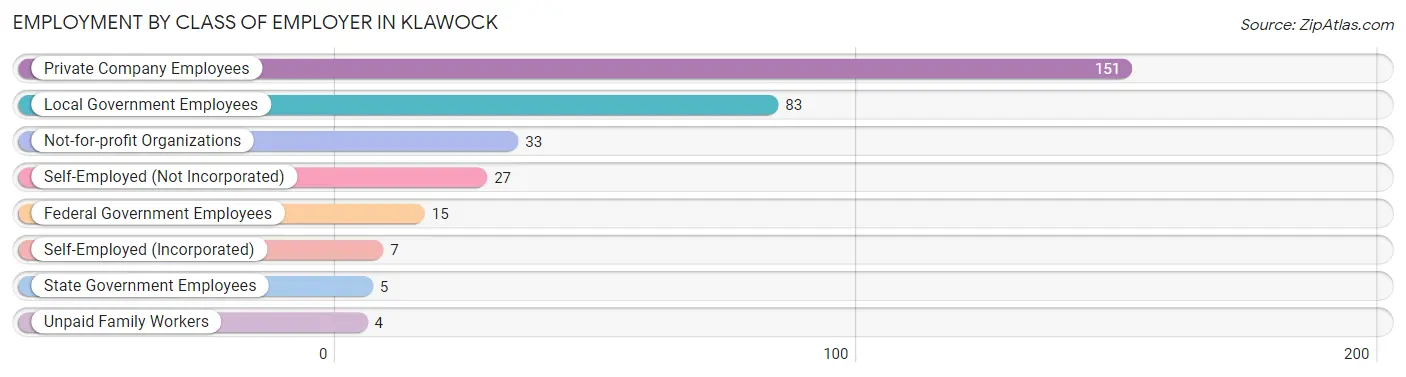
| Employer Class | # Employees | % Employees |
| Private Company Employees | 151 | 46.5% |
| Self-Employed (Incorporated) | 7 | 2.1% |
| Self-Employed (Not Incorporated) | 27 | 8.3% |
| Not-for-profit Organizations | 33 | 10.2% |
| Local Government Employees | 83 | 25.5% |
| State Government Employees | 5 | 1.5% |
| Federal Government Employees | 15 | 4.6% |
| Unpaid Family Workers | 4 | 1.2% |
| Total | 325 | 100.0% |
Employment Status by Age in Klawock
According to the labor force statistics for Klawock, out of the total population over 16 years of age (639), 62.9% or 402 individuals are in the labor force, with 10.2% or 41 of them unemployed. The age group with the highest labor force participation rate is 25 to 29 years, with 96.7% or 59 individuals in the labor force. Within the labor force, the 16 to 19 years age range has the highest percentage of unemployed individuals, with 70.6% or 12 of them being unemployed.

| Age Bracket | In Labor Force | Unemployed |
| 16 to 19 Years | 17 (63.0%) | 12 (70.6%) |
| 20 to 24 Years | 24 (77.4%) | 0 (0.0%) |
| 25 to 29 Years | 59 (96.7%) | 8 (13.6%) |
| 30 to 34 Years | 36 (78.3%) | 9 (25.0%) |
| 35 to 44 Years | 59 (77.6%) | 0 (0.0%) |
| 45 to 54 Years | 110 (84.6%) | 3 (2.7%) |
| 55 to 59 Years | 47 (82.5%) | 0 (0.0%) |
| 60 to 64 Years | 15 (33.3%) | 1 (6.7%) |
| 65 to 74 Years | 33 (33.3%) | 8 (24.2%) |
| 75 Years and over | 2 (3.0%) | 0 (0.0%) |
| Total | 402 (62.9%) | 41 (10.2%) |
Employment Status by Educational Attainment in Klawock
According to labor force statistics for Klawock, 78.6% of individuals (326) out of the total population between 25 and 64 years of age (415) are in the labor force, with 6.4% or 21 of them being unemployed. The group with the highest labor force participation rate are those with the educational attainment of bachelor's degree or higher, with 92.9% or 52 individuals in the labor force. Within the labor force, individuals with less than high school education have the highest percentage of unemployment, with 18.2% or 4 of them being unemployed.
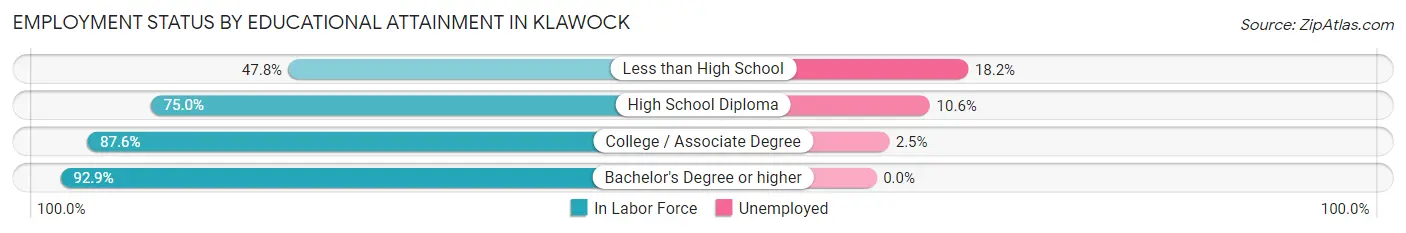
| Educational Attainment | In Labor Force | Unemployed |
| Less than High School | 22 (47.8%) | 8 (18.2%) |
| High School Diploma | 132 (75.0%) | 19 (10.6%) |
| College / Associate Degree | 120 (87.6%) | 3 (2.5%) |
| Bachelor's Degree or higher | 52 (92.9%) | 0 (0.0%) |
| Total | 326 (78.6%) | 27 (6.4%) |
Employment Occupations by Sex in Klawock
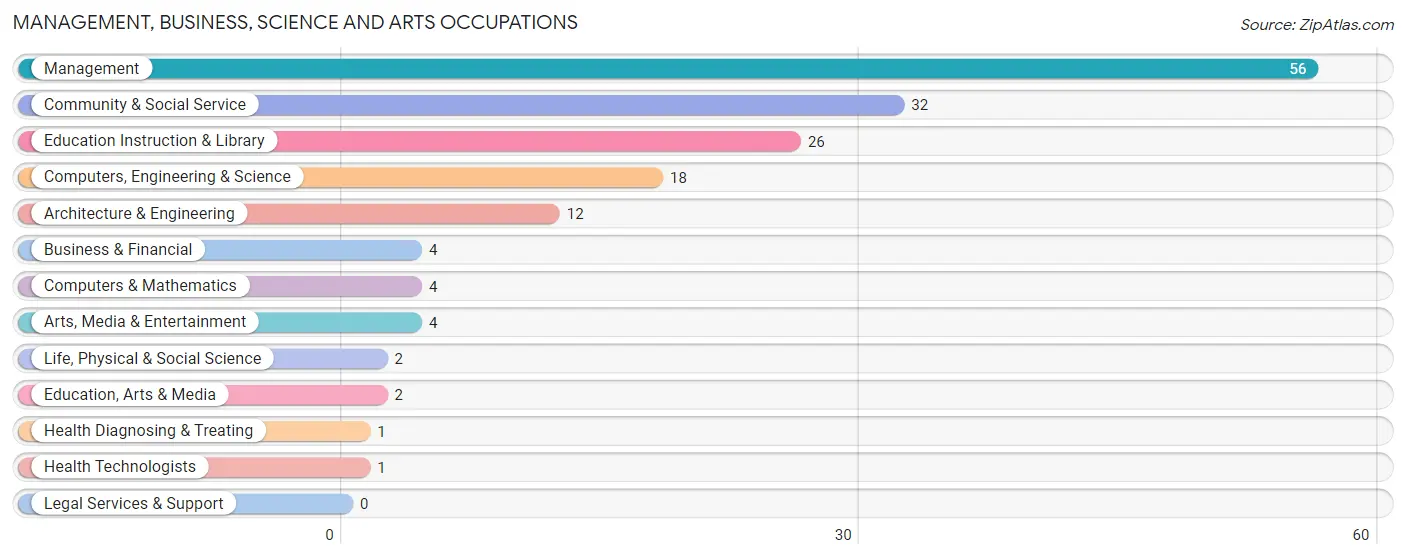
Management, Business, Science and Arts Occupations
The most common Management, Business, Science and Arts occupations in Klawock are Management (56 | 15.5%), Community & Social Service (32 | 8.9%), Education Instruction & Library (26 | 7.2%), Computers, Engineering & Science (18 | 5.0%), and Architecture & Engineering (12 | 3.3%).
Management, Business, Science and Arts Occupations by Sex
Within the Management, Business, Science and Arts occupations in Klawock, the most male-oriented occupations are Business & Financial (100.0%), Life, Physical & Social Science (100.0%), and Education, Arts & Media (100.0%), while the most female-oriented occupations are Computers & Mathematics (100.0%), Health Diagnosing & Treating (100.0%), and Health Technologists (100.0%).
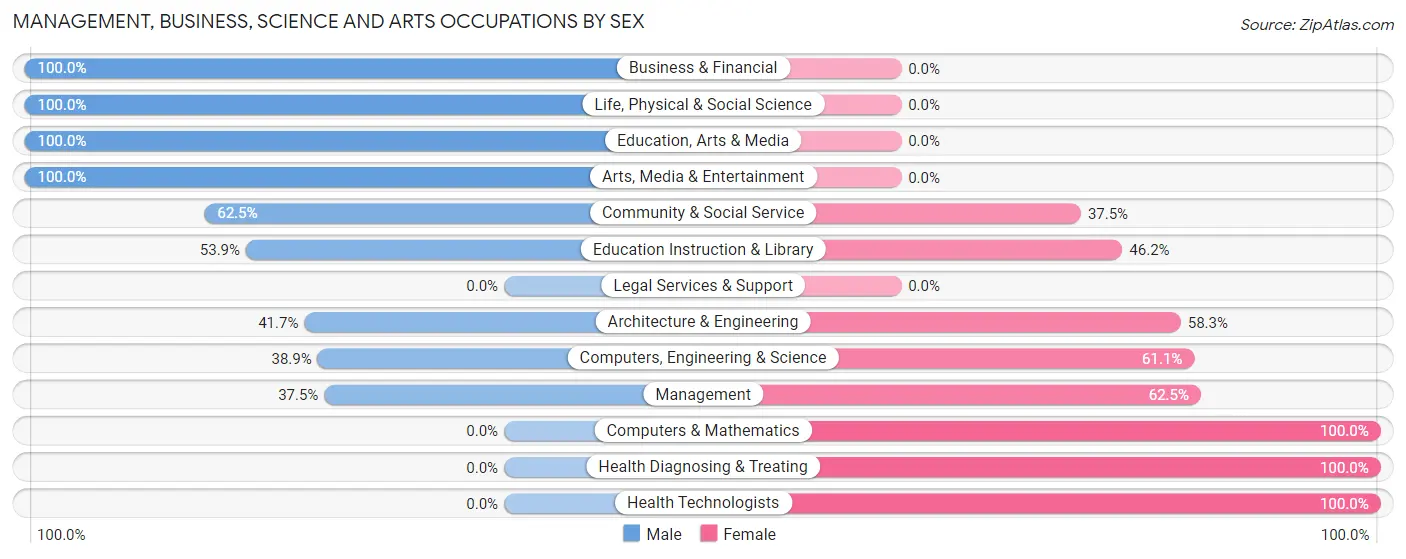
| Occupation | Male | Female |
| Management | 21 (37.5%) | 35 (62.5%) |
| Business & Financial | 4 (100.0%) | 0 (0.0%) |
| Computers, Engineering & Science | 7 (38.9%) | 11 (61.1%) |
| Computers & Mathematics | 0 (0.0%) | 4 (100.0%) |
| Architecture & Engineering | 5 (41.7%) | 7 (58.3%) |
| Life, Physical & Social Science | 2 (100.0%) | 0 (0.0%) |
| Community & Social Service | 20 (62.5%) | 12 (37.5%) |
| Education, Arts & Media | 2 (100.0%) | 0 (0.0%) |
| Legal Services & Support | 0 (0.0%) | 0 (0.0%) |
| Education Instruction & Library | 14 (53.8%) | 12 (46.2%) |
| Arts, Media & Entertainment | 4 (100.0%) | 0 (0.0%) |
| Health Diagnosing & Treating | 0 (0.0%) | 1 (100.0%) |
| Health Technologists | 0 (0.0%) | 1 (100.0%) |
| Total (Category) | 52 (46.9%) | 59 (53.1%) |
| Total (Overall) | 218 (60.4%) | 143 (39.6%) |
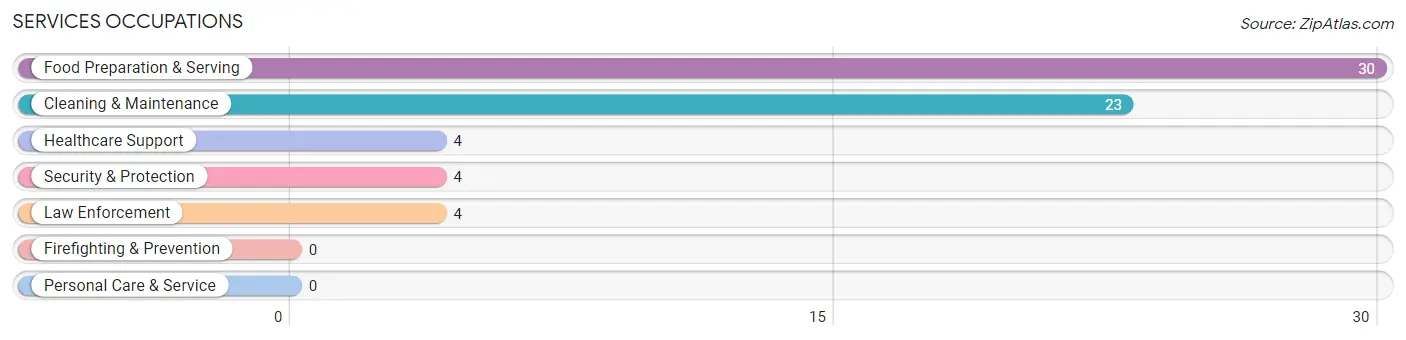
Services Occupations
The most common Services occupations in Klawock are Food Preparation & Serving (30 | 8.3%), Cleaning & Maintenance (23 | 6.4%), Healthcare Support (4 | 1.1%), Security & Protection (4 | 1.1%), and Law Enforcement (4 | 1.1%).
Services Occupations by Sex
Within the Services occupations in Klawock, the most male-oriented occupations are Security & Protection (100.0%), Law Enforcement (100.0%), and Cleaning & Maintenance (56.5%), while the most female-oriented occupations are Food Preparation & Serving (70.0%), Healthcare Support (50.0%), and Cleaning & Maintenance (43.5%).
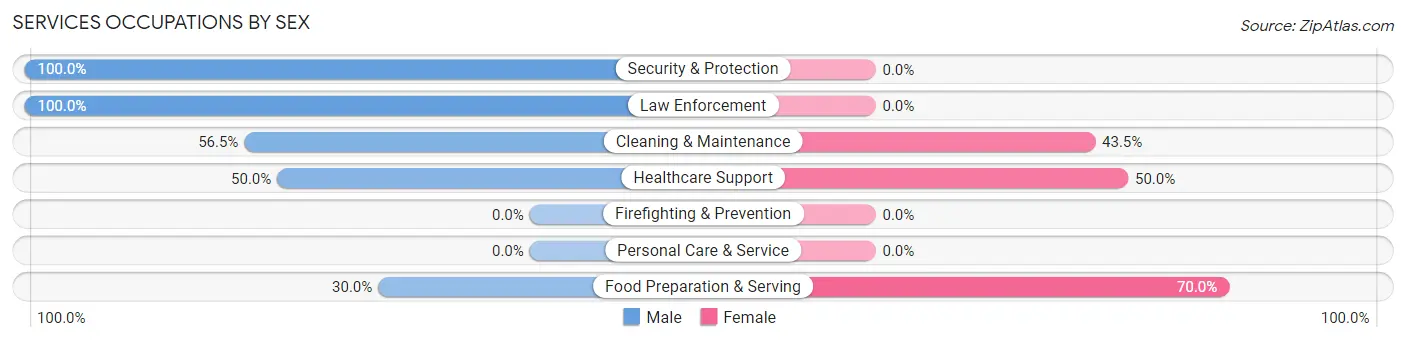
| Occupation | Male | Female |
| Healthcare Support | 2 (50.0%) | 2 (50.0%) |
| Security & Protection | 4 (100.0%) | 0 (0.0%) |
| Firefighting & Prevention | 0 (0.0%) | 0 (0.0%) |
| Law Enforcement | 4 (100.0%) | 0 (0.0%) |
| Food Preparation & Serving | 9 (30.0%) | 21 (70.0%) |
| Cleaning & Maintenance | 13 (56.5%) | 10 (43.5%) |
| Personal Care & Service | 0 (0.0%) | 0 (0.0%) |
| Total (Category) | 28 (45.9%) | 33 (54.1%) |
| Total (Overall) | 218 (60.4%) | 143 (39.6%) |
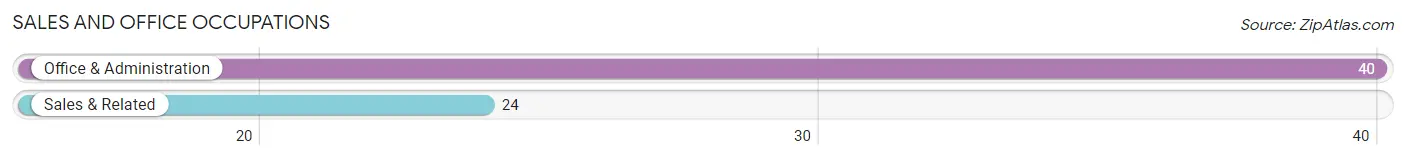
Sales and Office Occupations
The most common Sales and Office occupations in Klawock are Office & Administration (40 | 11.1%), and Sales & Related (24 | 6.7%).
Sales and Office Occupations by Sex
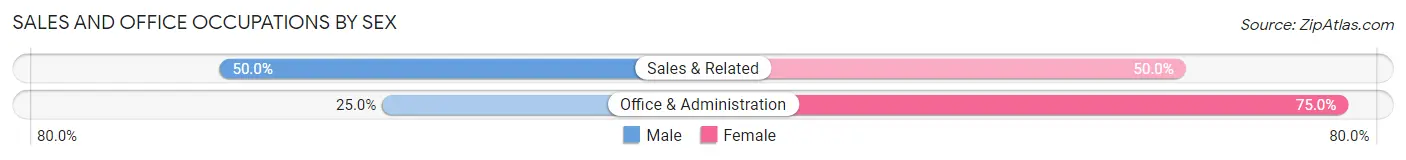
| Occupation | Male | Female |
| Sales & Related | 12 (50.0%) | 12 (50.0%) |
| Office & Administration | 10 (25.0%) | 30 (75.0%) |
| Total (Category) | 22 (34.4%) | 42 (65.6%) |
| Total (Overall) | 218 (60.4%) | 143 (39.6%) |
Natural Resources, Construction and Maintenance Occupations
The most common Natural Resources, Construction and Maintenance occupations in Klawock are Construction & Extraction (29 | 8.0%), Farming, Fishing & Forestry (22 | 6.1%), and Installation, Maintenance & Repair (11 | 3.0%).
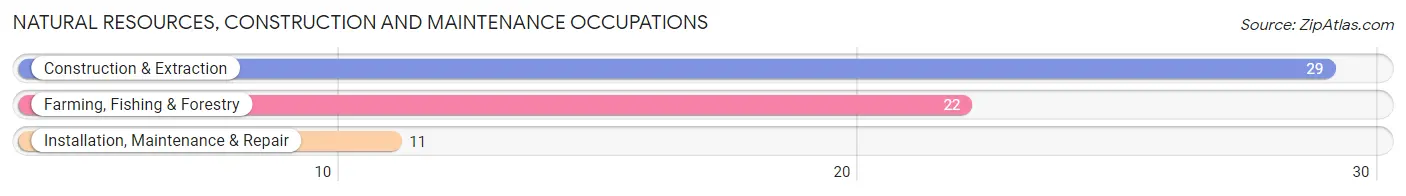
Natural Resources, Construction and Maintenance Occupations by Sex
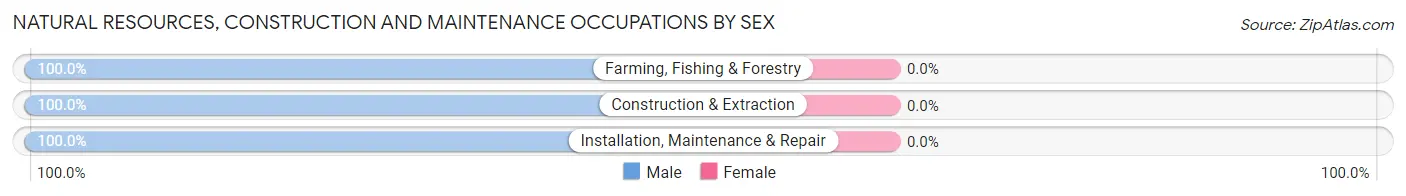
| Occupation | Male | Female |
| Farming, Fishing & Forestry | 22 (100.0%) | 0 (0.0%) |
| Construction & Extraction | 29 (100.0%) | 0 (0.0%) |
| Installation, Maintenance & Repair | 11 (100.0%) | 0 (0.0%) |
| Total (Category) | 62 (100.0%) | 0 (0.0%) |
| Total (Overall) | 218 (60.4%) | 143 (39.6%) |
Production, Transportation and Moving Occupations
The most common Production, Transportation and Moving occupations in Klawock are Material Moving (31 | 8.6%), Transportation (25 | 6.9%), and Production (7 | 1.9%).
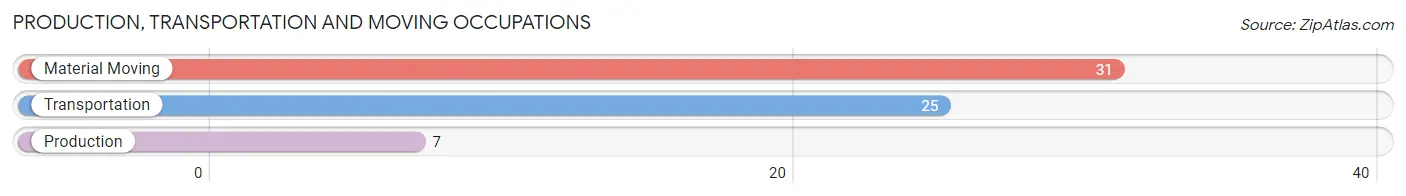
Production, Transportation and Moving Occupations by Sex
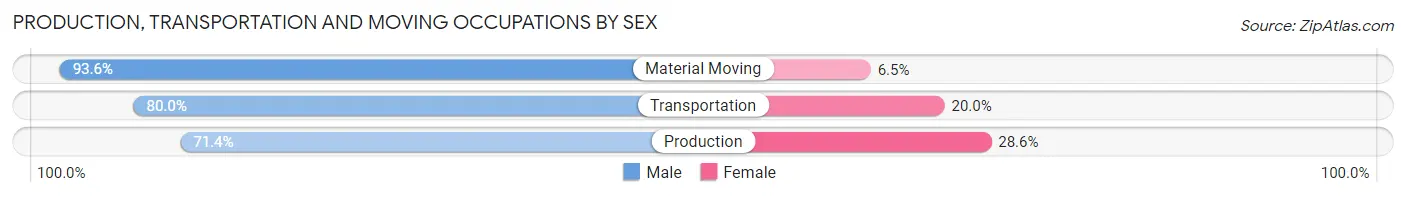
| Occupation | Male | Female |
| Production | 5 (71.4%) | 2 (28.6%) |
| Transportation | 20 (80.0%) | 5 (20.0%) |
| Material Moving | 29 (93.5%) | 2 (6.5%) |
| Total (Category) | 54 (85.7%) | 9 (14.3%) |
| Total (Overall) | 218 (60.4%) | 143 (39.6%) |
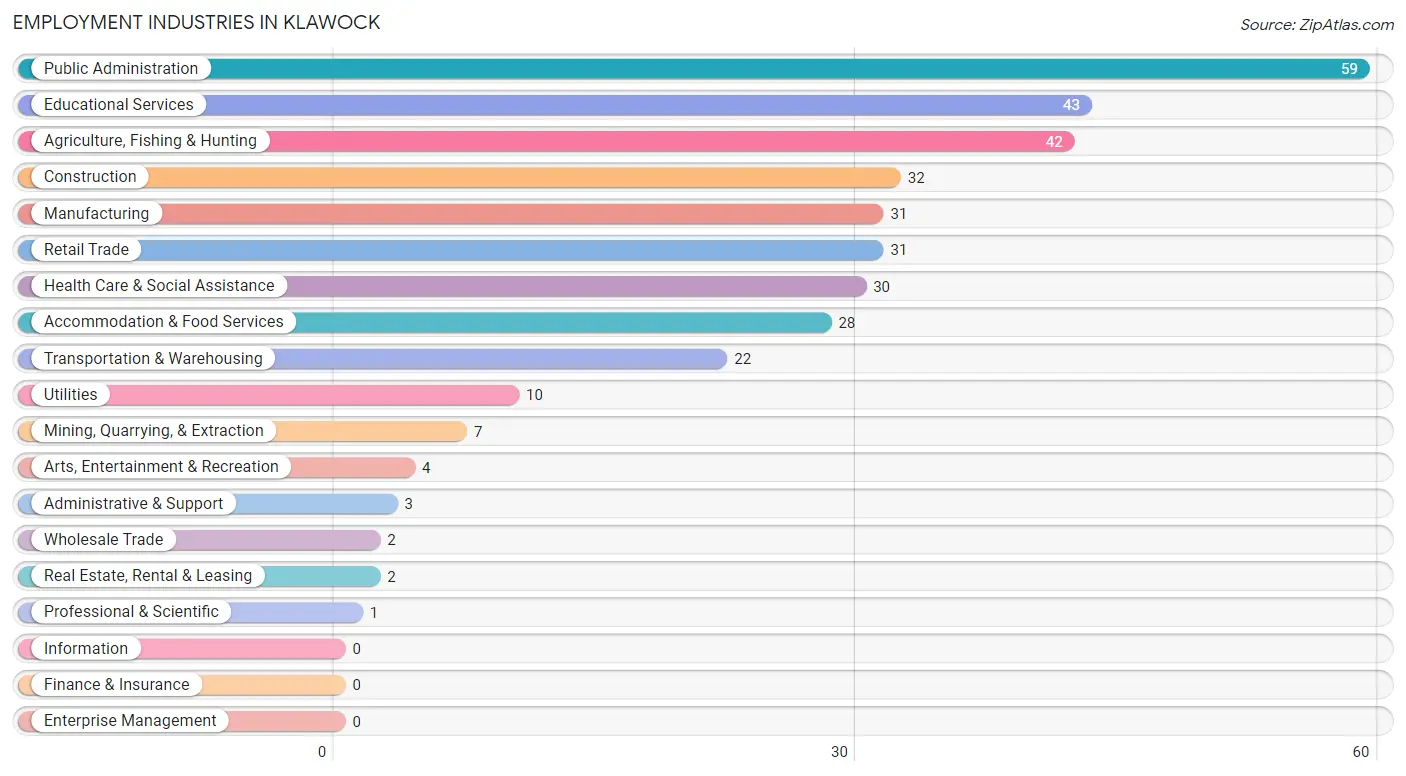
Employment Industries by Sex in Klawock
Employment Industries in Klawock
The major employment industries in Klawock include Public Administration (59 | 16.3%), Educational Services (43 | 11.9%), Agriculture, Fishing & Hunting (42 | 11.6%), Construction (32 | 8.9%), and Manufacturing (31 | 8.6%).
Employment Industries by Sex in Klawock
The Klawock industries that see more men than women are Mining, Quarrying, & Extraction (100.0%), Wholesale Trade (100.0%), and Utilities (100.0%), whereas the industries that tend to have a higher number of women are Real Estate, Rental & Leasing (100.0%), Professional & Scientific (100.0%), and Administrative & Support (100.0%).
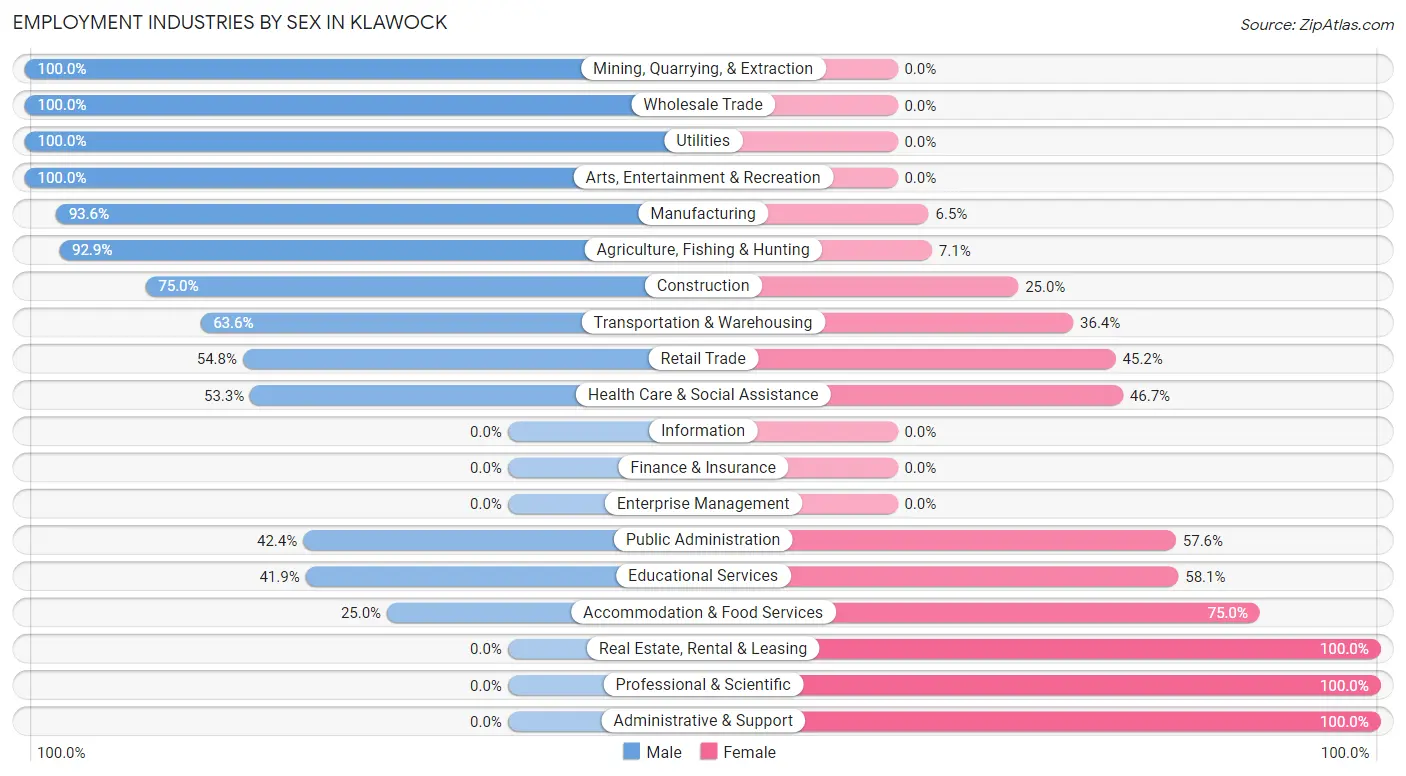
| Industry | Male | Female |
| Agriculture, Fishing & Hunting | 39 (92.9%) | 3 (7.1%) |
| Mining, Quarrying, & Extraction | 7 (100.0%) | 0 (0.0%) |
| Construction | 24 (75.0%) | 8 (25.0%) |
| Manufacturing | 29 (93.5%) | 2 (6.5%) |
| Wholesale Trade | 2 (100.0%) | 0 (0.0%) |
| Retail Trade | 17 (54.8%) | 14 (45.2%) |
| Transportation & Warehousing | 14 (63.6%) | 8 (36.4%) |
| Utilities | 10 (100.0%) | 0 (0.0%) |
| Information | 0 (0.0%) | 0 (0.0%) |
| Finance & Insurance | 0 (0.0%) | 0 (0.0%) |
| Real Estate, Rental & Leasing | 0 (0.0%) | 2 (100.0%) |
| Professional & Scientific | 0 (0.0%) | 1 (100.0%) |
| Enterprise Management | 0 (0.0%) | 0 (0.0%) |
| Administrative & Support | 0 (0.0%) | 3 (100.0%) |
| Educational Services | 18 (41.9%) | 25 (58.1%) |
| Health Care & Social Assistance | 16 (53.3%) | 14 (46.7%) |
| Arts, Entertainment & Recreation | 4 (100.0%) | 0 (0.0%) |
| Accommodation & Food Services | 7 (25.0%) | 21 (75.0%) |
| Public Administration | 25 (42.4%) | 34 (57.6%) |
| Total | 218 (60.4%) | 143 (39.6%) |
Education in Klawock
School Enrollment in Klawock
The most common levels of schooling among the 193 students in Klawock are middle school (53 | 27.5%), elementary school (51 | 26.4%), and high school (38 | 19.7%).
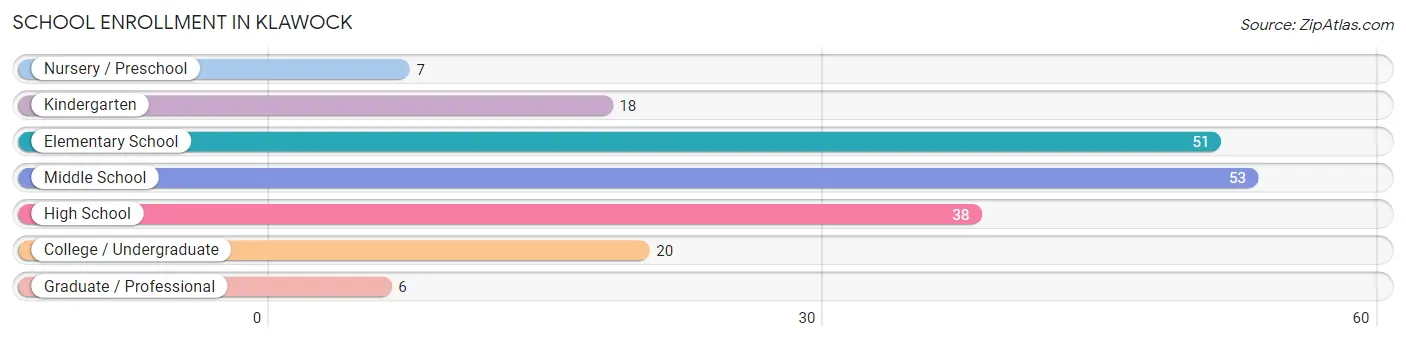
| School Level | # Students | % Students |
| Nursery / Preschool | 7 | 3.6% |
| Kindergarten | 18 | 9.3% |
| Elementary School | 51 | 26.4% |
| Middle School | 53 | 27.5% |
| High School | 38 | 19.7% |
| College / Undergraduate | 20 | 10.4% |
| Graduate / Professional | 6 | 3.1% |
| Total | 193 | 100.0% |
School Enrollment by Age by Funding Source in Klawock
Out of a total of 193 students who are enrolled in schools in Klawock, 4 (2.1%) attend a private institution, while the remaining 189 (97.9%) are enrolled in public schools. The age group of 3 to 4 year olds has the highest likelihood of being enrolled in private schools, with 2 (40.0% in the age bracket) enrolled. Conversely, the age group of 5 to 9 year old has the lowest likelihood of being enrolled in a private school, with 63 (100.0% in the age bracket) attending a public institution.
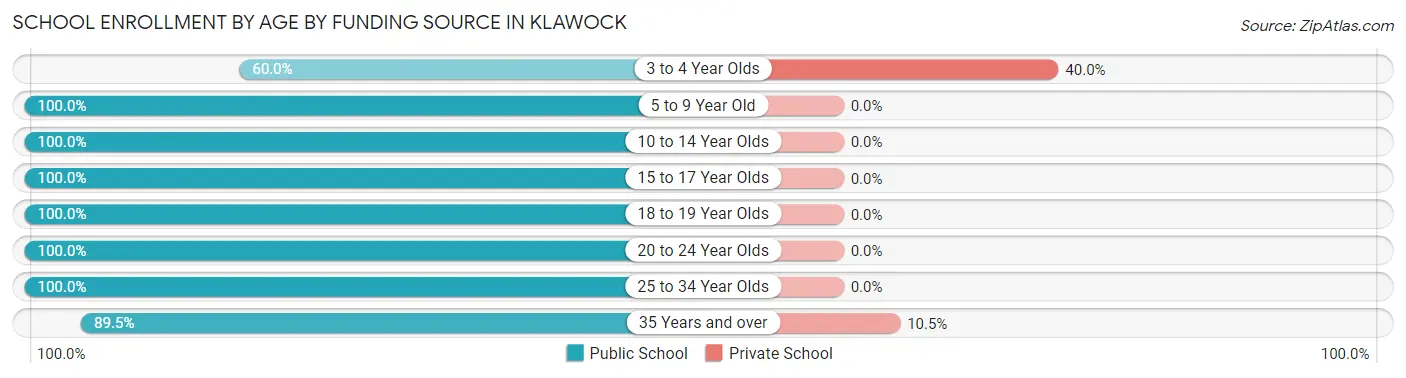
| Age Bracket | Public School | Private School |
| 3 to 4 Year Olds | 3 (60.0%) | 2 (40.0%) |
| 5 to 9 Year Old | 63 (100.0%) | 0 (0.0%) |
| 10 to 14 Year Olds | 64 (100.0%) | 0 (0.0%) |
| 15 to 17 Year Olds | 28 (100.0%) | 0 (0.0%) |
| 18 to 19 Year Olds | 5 (100.0%) | 0 (0.0%) |
| 20 to 24 Year Olds | 2 (100.0%) | 0 (0.0%) |
| 25 to 34 Year Olds | 7 (100.0%) | 0 (0.0%) |
| 35 Years and over | 17 (89.5%) | 2 (10.5%) |
| Total | 189 (97.9%) | 4 (2.1%) |
Educational Attainment by Field of Study in Klawock
Bio, nature & agricultural (16 | 19.3%), liberal arts & history (16 | 19.3%), education (11 | 13.3%), visual & performing arts (9 | 10.8%), and business (7 | 8.4%) are the most common fields of study among 83 individuals in Klawock who have obtained a bachelor's degree or higher.
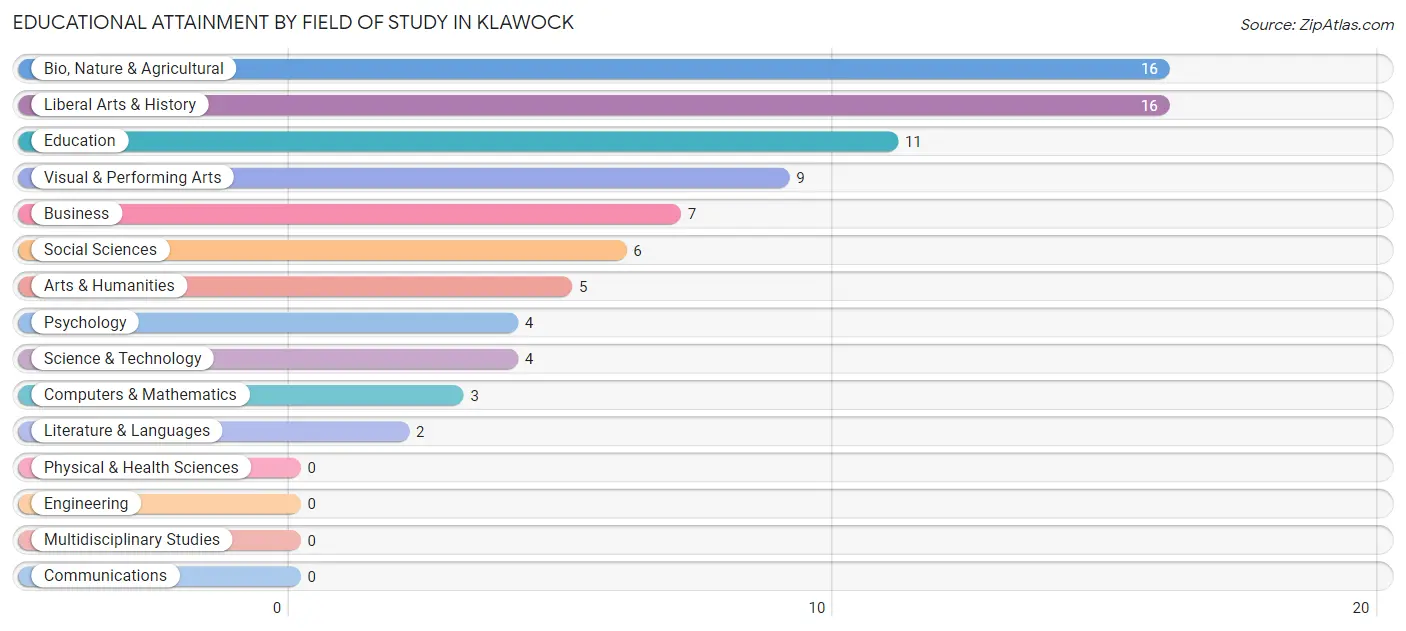
| Field of Study | # Graduates | % Graduates |
| Computers & Mathematics | 3 | 3.6% |
| Bio, Nature & Agricultural | 16 | 19.3% |
| Physical & Health Sciences | 0 | 0.0% |
| Psychology | 4 | 4.8% |
| Social Sciences | 6 | 7.2% |
| Engineering | 0 | 0.0% |
| Multidisciplinary Studies | 0 | 0.0% |
| Science & Technology | 4 | 4.8% |
| Business | 7 | 8.4% |
| Education | 11 | 13.3% |
| Literature & Languages | 2 | 2.4% |
| Liberal Arts & History | 16 | 19.3% |
| Visual & Performing Arts | 9 | 10.8% |
| Communications | 0 | 0.0% |
| Arts & Humanities | 5 | 6.0% |
| Total | 83 | 100.0% |
Transportation & Commute in Klawock
Vehicle Availability by Sex in Klawock
The most prevalent vehicle ownership categories in Klawock are males with 2 vehicles (72, accounting for 38.9%) and females with 2 vehicles (36, making up 57.1%).
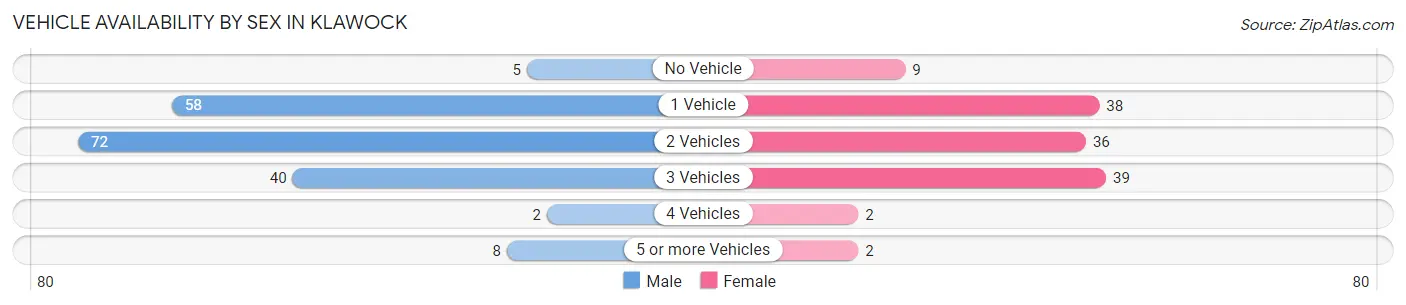
| Vehicles Available | Male | Female |
| No Vehicle | 5 (2.7%) | 9 (7.1%) |
| 1 Vehicle | 58 (31.4%) | 38 (30.2%) |
| 2 Vehicles | 72 (38.9%) | 36 (28.6%) |
| 3 Vehicles | 40 (21.6%) | 39 (30.9%) |
| 4 Vehicles | 2 (1.1%) | 2 (1.6%) |
| 5 or more Vehicles | 8 (4.3%) | 2 (1.6%) |
| Total | 185 (100.0%) | 126 (100.0%) |
Commute Time in Klawock
The most frequently occuring commute durations in Klawock are 5 to 9 minutes (109 commuters, 34.2%), less than 5 minutes (78 commuters, 24.4%), and 15 to 19 minutes (36 commuters, 11.3%).
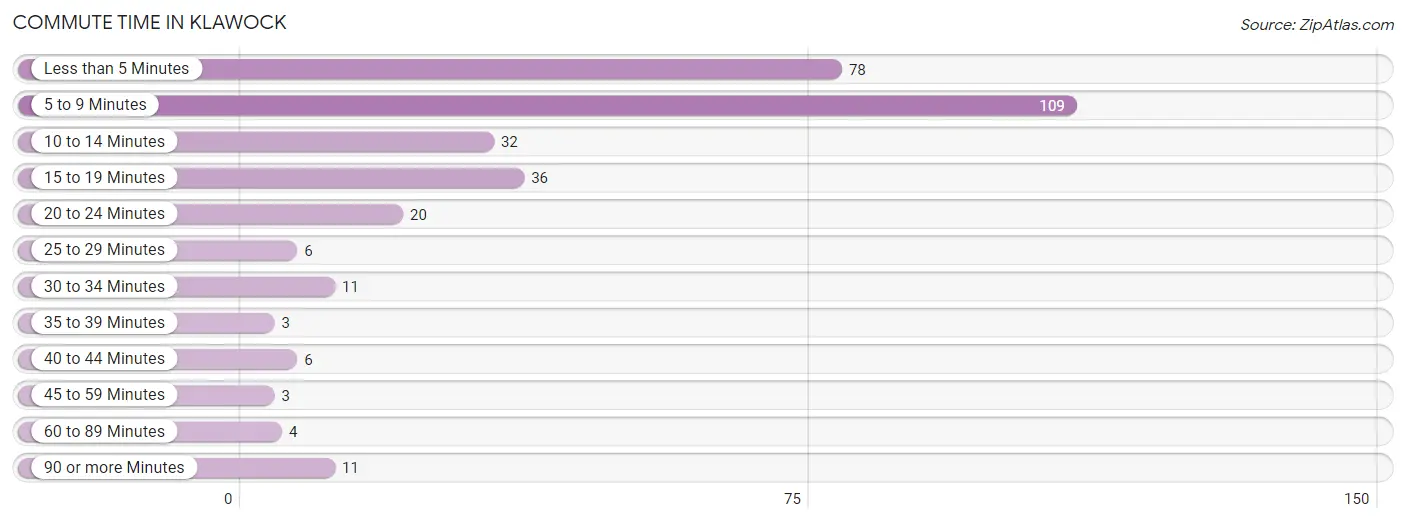
| Commute Time | # Commuters | % Commuters |
| Less than 5 Minutes | 78 | 24.4% |
| 5 to 9 Minutes | 109 | 34.2% |
| 10 to 14 Minutes | 32 | 10.0% |
| 15 to 19 Minutes | 36 | 11.3% |
| 20 to 24 Minutes | 20 | 6.3% |
| 25 to 29 Minutes | 6 | 1.9% |
| 30 to 34 Minutes | 11 | 3.5% |
| 35 to 39 Minutes | 3 | 0.9% |
| 40 to 44 Minutes | 6 | 1.9% |
| 45 to 59 Minutes | 3 | 0.9% |
| 60 to 89 Minutes | 4 | 1.3% |
| 90 or more Minutes | 11 | 3.5% |
Commute Time by Sex in Klawock
The most common commute times in Klawock are 5 to 9 minutes (76 commuters, 39.0%) for males and less than 5 minutes (36 commuters, 29.0%) for females.
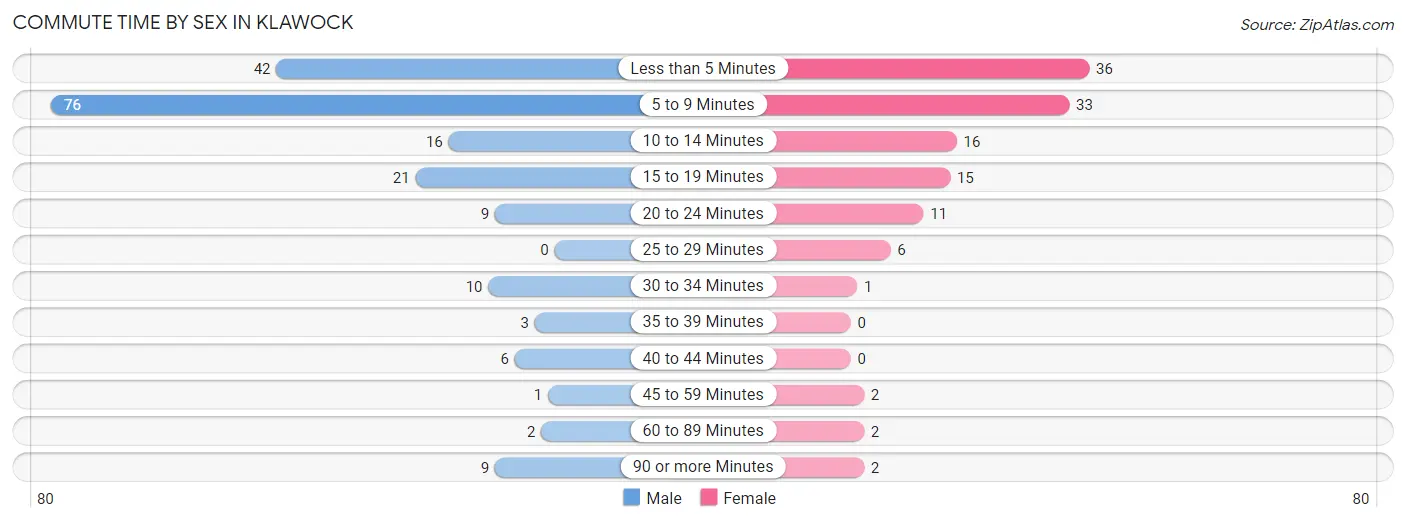
| Commute Time | Male | Female |
| Less than 5 Minutes | 42 (21.5%) | 36 (29.0%) |
| 5 to 9 Minutes | 76 (39.0%) | 33 (26.6%) |
| 10 to 14 Minutes | 16 (8.2%) | 16 (12.9%) |
| 15 to 19 Minutes | 21 (10.8%) | 15 (12.1%) |
| 20 to 24 Minutes | 9 (4.6%) | 11 (8.9%) |
| 25 to 29 Minutes | 0 (0.0%) | 6 (4.8%) |
| 30 to 34 Minutes | 10 (5.1%) | 1 (0.8%) |
| 35 to 39 Minutes | 3 (1.5%) | 0 (0.0%) |
| 40 to 44 Minutes | 6 (3.1%) | 0 (0.0%) |
| 45 to 59 Minutes | 1 (0.5%) | 2 (1.6%) |
| 60 to 89 Minutes | 2 (1.0%) | 2 (1.6%) |
| 90 or more Minutes | 9 (4.6%) | 2 (1.6%) |
Time of Departure to Work by Sex in Klawock
The most frequent times of departure to work in Klawock are 7:30 AM to 7:59 AM (34, 17.4%) for males and 7:30 AM to 7:59 AM (31, 25.0%) for females.
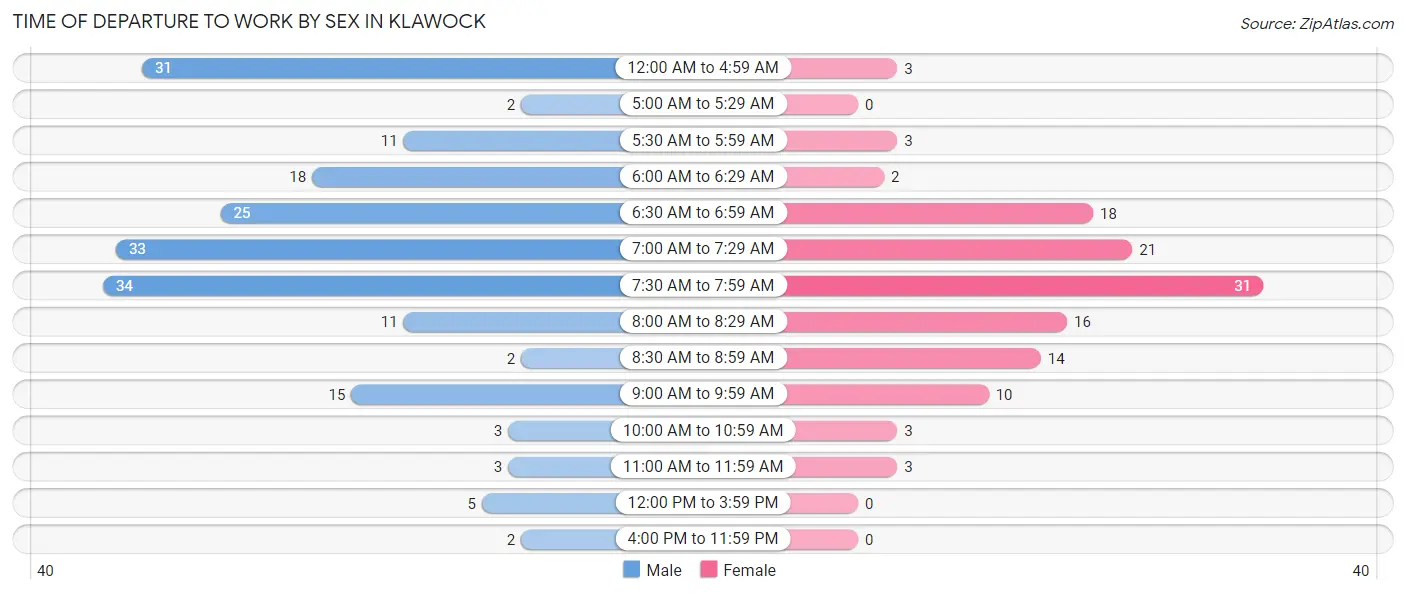
| Time of Departure | Male | Female |
| 12:00 AM to 4:59 AM | 31 (15.9%) | 3 (2.4%) |
| 5:00 AM to 5:29 AM | 2 (1.0%) | 0 (0.0%) |
| 5:30 AM to 5:59 AM | 11 (5.6%) | 3 (2.4%) |
| 6:00 AM to 6:29 AM | 18 (9.2%) | 2 (1.6%) |
| 6:30 AM to 6:59 AM | 25 (12.8%) | 18 (14.5%) |
| 7:00 AM to 7:29 AM | 33 (16.9%) | 21 (16.9%) |
| 7:30 AM to 7:59 AM | 34 (17.4%) | 31 (25.0%) |
| 8:00 AM to 8:29 AM | 11 (5.6%) | 16 (12.9%) |
| 8:30 AM to 8:59 AM | 2 (1.0%) | 14 (11.3%) |
| 9:00 AM to 9:59 AM | 15 (7.7%) | 10 (8.1%) |
| 10:00 AM to 10:59 AM | 3 (1.5%) | 3 (2.4%) |
| 11:00 AM to 11:59 AM | 3 (1.5%) | 3 (2.4%) |
| 12:00 PM to 3:59 PM | 5 (2.6%) | 0 (0.0%) |
| 4:00 PM to 11:59 PM | 2 (1.0%) | 0 (0.0%) |
| Total | 195 (100.0%) | 124 (100.0%) |
Housing Occupancy in Klawock
Occupancy by Ownership in Klawock
Of the total 312 dwellings in Klawock, owner-occupied units account for 212 (67.9%), while renter-occupied units make up 100 (32.1%).
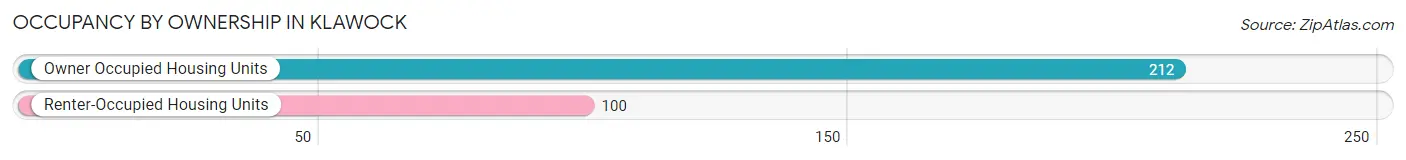
| Occupancy | # Housing Units | % Housing Units |
| Owner Occupied Housing Units | 212 | 67.9% |
| Renter-Occupied Housing Units | 100 | 32.1% |
| Total Occupied Housing Units | 312 | 100.0% |
Occupancy by Household Size in Klawock
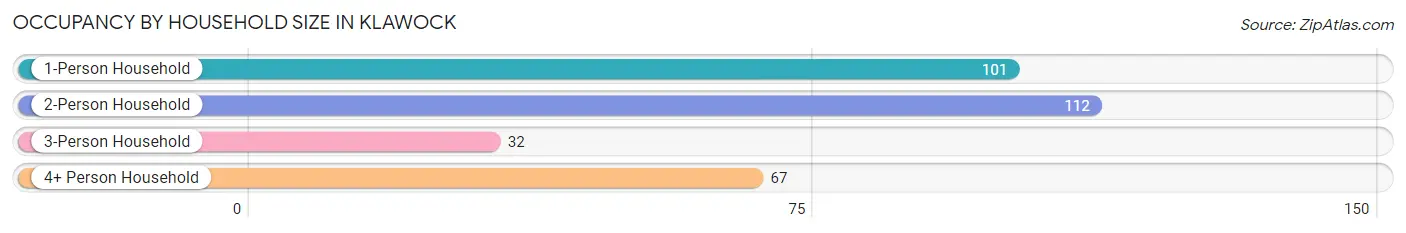
| Household Size | # Housing Units | % Housing Units |
| 1-Person Household | 101 | 32.4% |
| 2-Person Household | 112 | 35.9% |
| 3-Person Household | 32 | 10.3% |
| 4+ Person Household | 67 | 21.5% |
| Total Housing Units | 312 | 100.0% |
Occupancy by Ownership by Household Size in Klawock
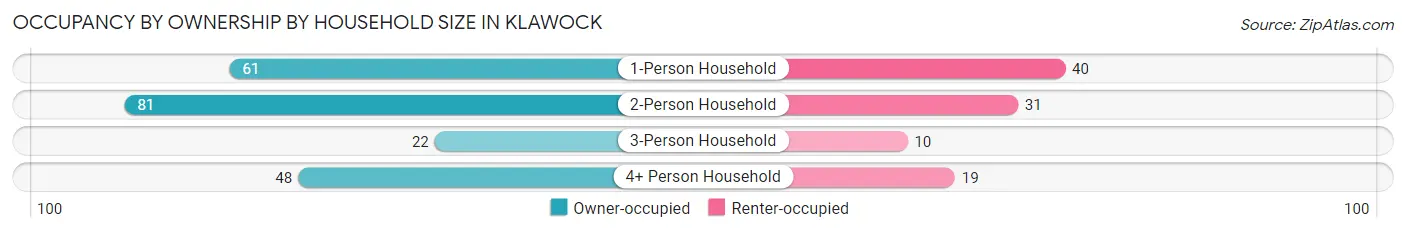
| Household Size | Owner-occupied | Renter-occupied |
| 1-Person Household | 61 (60.4%) | 40 (39.6%) |
| 2-Person Household | 81 (72.3%) | 31 (27.7%) |
| 3-Person Household | 22 (68.8%) | 10 (31.2%) |
| 4+ Person Household | 48 (71.6%) | 19 (28.4%) |
| Total Housing Units | 212 (67.9%) | 100 (32.1%) |
Occupancy by Educational Attainment in Klawock
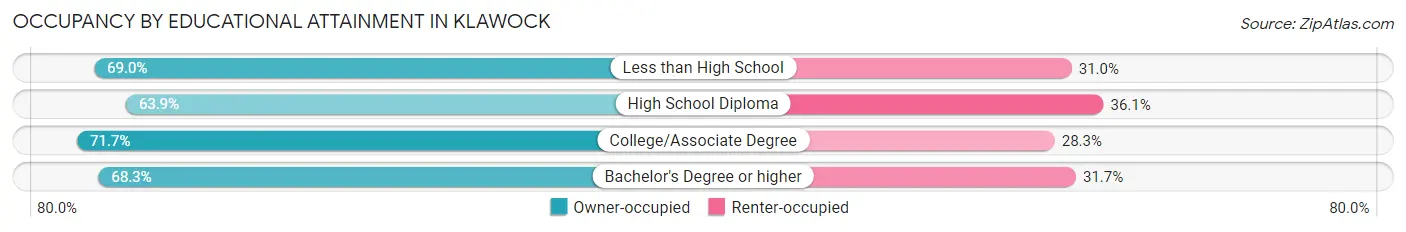
| Household Size | Owner-occupied | Renter-occupied |
| Less than High School | 20 (69.0%) | 9 (31.0%) |
| High School Diploma | 78 (63.9%) | 44 (36.1%) |
| College/Associate Degree | 86 (71.7%) | 34 (28.3%) |
| Bachelor's Degree or higher | 28 (68.3%) | 13 (31.7%) |
Occupancy by Age of Householder in Klawock
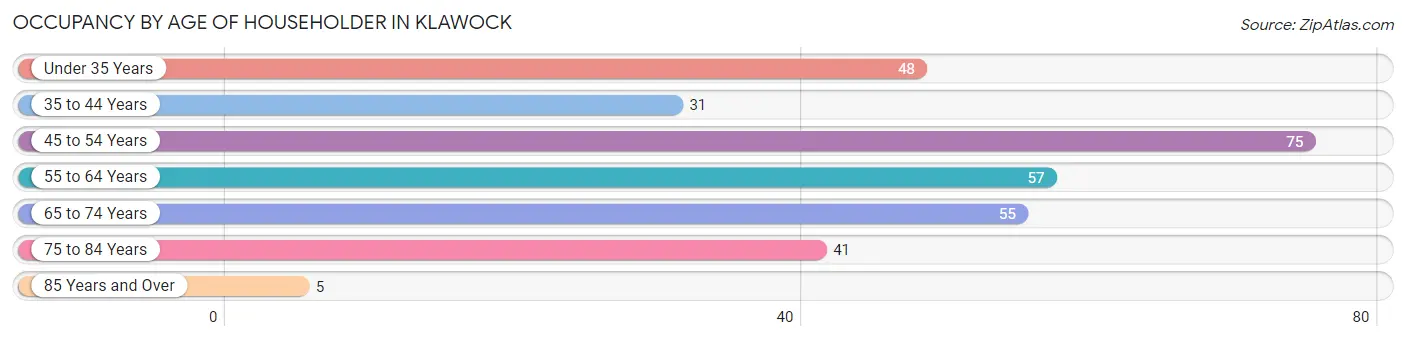
| Age Bracket | # Households | % Households |
| Under 35 Years | 48 | 15.4% |
| 35 to 44 Years | 31 | 9.9% |
| 45 to 54 Years | 75 | 24.0% |
| 55 to 64 Years | 57 | 18.3% |
| 65 to 74 Years | 55 | 17.6% |
| 75 to 84 Years | 41 | 13.1% |
| 85 Years and Over | 5 | 1.6% |
| Total | 312 | 100.0% |
Housing Finances in Klawock
Median Income by Occupancy in Klawock
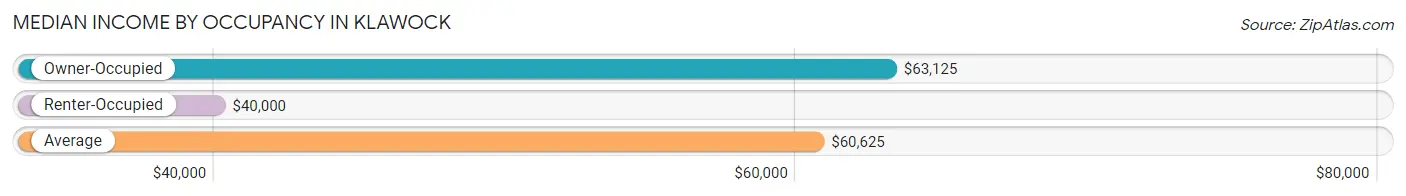
| Occupancy Type | # Households | Median Income |
| Owner-Occupied | 212 (67.9%) | $63,125 |
| Renter-Occupied | 100 (32.1%) | $40,000 |
| Average | 312 (100.0%) | $60,625 |
Occupancy by Householder Income Bracket in Klawock
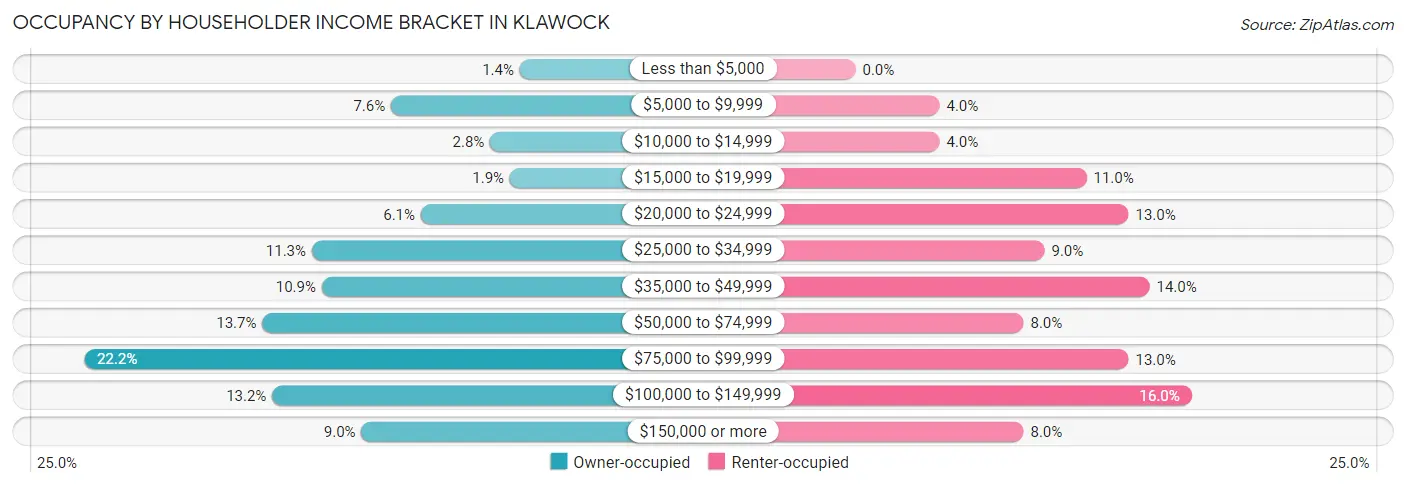
| Income Bracket | Owner-occupied | Renter-occupied |
| Less than $5,000 | 3 (1.4%) | 0 (0.0%) |
| $5,000 to $9,999 | 16 (7.5%) | 4 (4.0%) |
| $10,000 to $14,999 | 6 (2.8%) | 4 (4.0%) |
| $15,000 to $19,999 | 4 (1.9%) | 11 (11.0%) |
| $20,000 to $24,999 | 13 (6.1%) | 13 (13.0%) |
| $25,000 to $34,999 | 24 (11.3%) | 9 (9.0%) |
| $35,000 to $49,999 | 23 (10.8%) | 14 (14.0%) |
| $50,000 to $74,999 | 29 (13.7%) | 8 (8.0%) |
| $75,000 to $99,999 | 47 (22.2%) | 13 (13.0%) |
| $100,000 to $149,999 | 28 (13.2%) | 16 (16.0%) |
| $150,000 or more | 19 (9.0%) | 8 (8.0%) |
| Total | 212 (100.0%) | 100 (100.0%) |
Monthly Housing Cost Tiers in Klawock
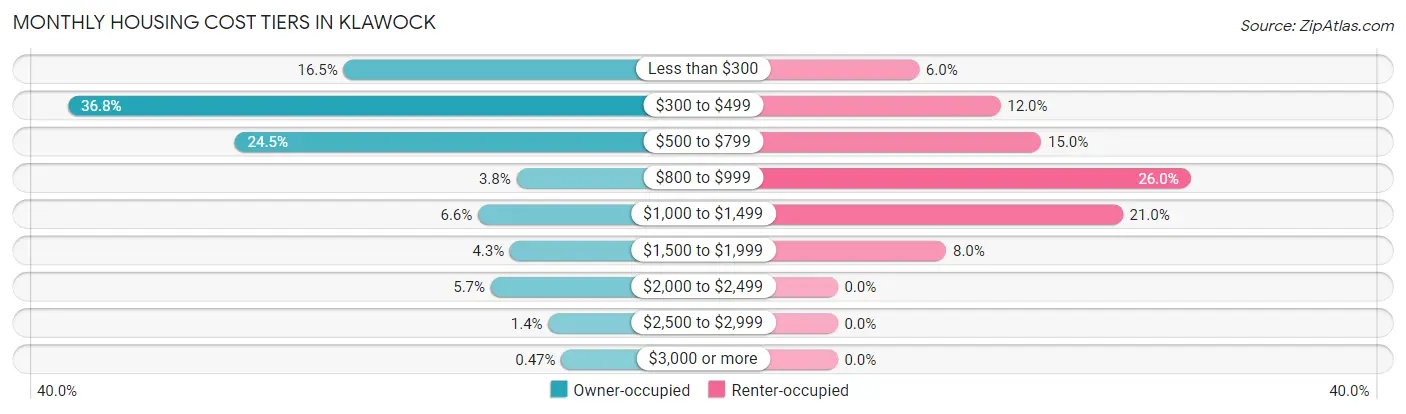
| Monthly Cost | Owner-occupied | Renter-occupied |
| Less than $300 | 35 (16.5%) | 6 (6.0%) |
| $300 to $499 | 78 (36.8%) | 12 (12.0%) |
| $500 to $799 | 52 (24.5%) | 15 (15.0%) |
| $800 to $999 | 8 (3.8%) | 26 (26.0%) |
| $1,000 to $1,499 | 14 (6.6%) | 21 (21.0%) |
| $1,500 to $1,999 | 9 (4.3%) | 8 (8.0%) |
| $2,000 to $2,499 | 12 (5.7%) | 0 (0.0%) |
| $2,500 to $2,999 | 3 (1.4%) | 0 (0.0%) |
| $3,000 or more | 1 (0.5%) | 0 (0.0%) |
| Total | 212 (100.0%) | 100 (100.0%) |
Physical Housing Characteristics in Klawock
Housing Structures in Klawock
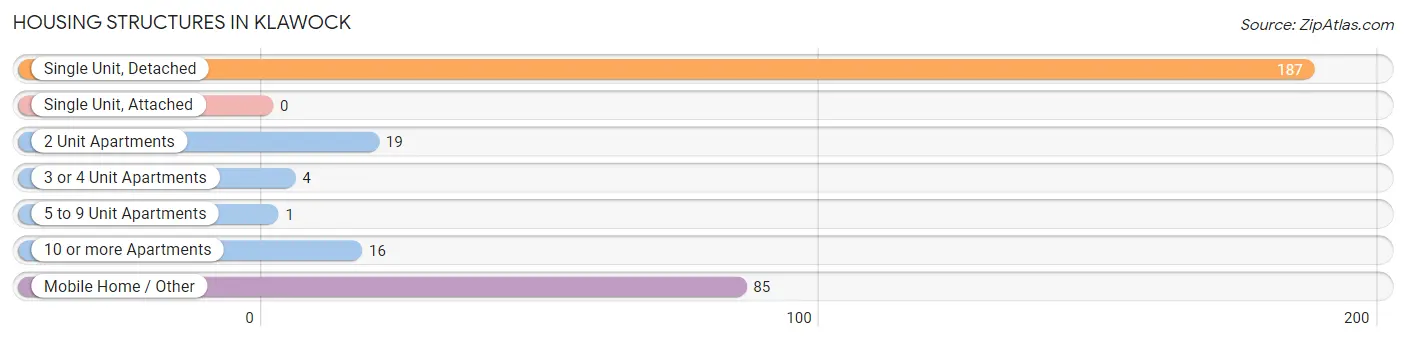
| Structure Type | # Housing Units | % Housing Units |
| Single Unit, Detached | 187 | 59.9% |
| Single Unit, Attached | 0 | 0.0% |
| 2 Unit Apartments | 19 | 6.1% |
| 3 or 4 Unit Apartments | 4 | 1.3% |
| 5 to 9 Unit Apartments | 1 | 0.3% |
| 10 or more Apartments | 16 | 5.1% |
| Mobile Home / Other | 85 | 27.2% |
| Total | 312 | 100.0% |
Housing Structures by Occupancy in Klawock
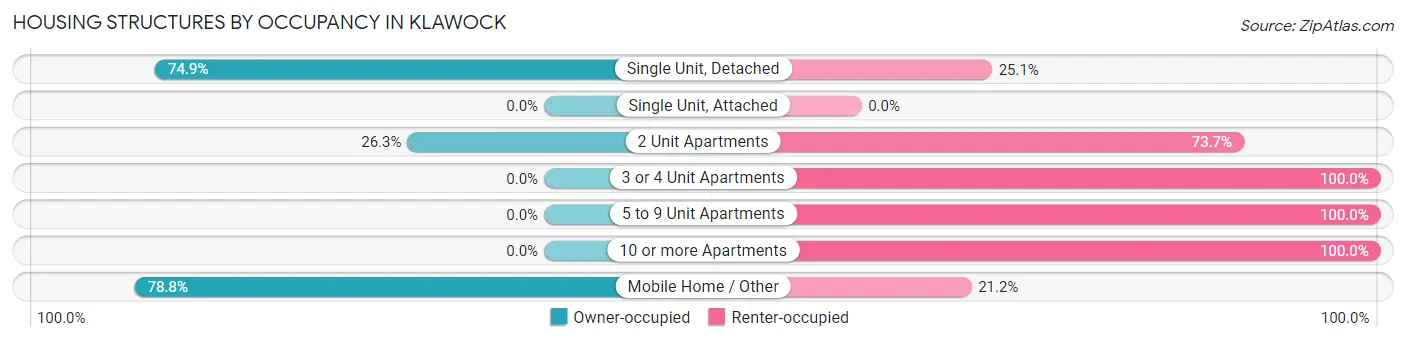
| Structure Type | Owner-occupied | Renter-occupied |
| Single Unit, Detached | 140 (74.9%) | 47 (25.1%) |
| Single Unit, Attached | 0 (0.0%) | 0 (0.0%) |
| 2 Unit Apartments | 5 (26.3%) | 14 (73.7%) |
| 3 or 4 Unit Apartments | 0 (0.0%) | 4 (100.0%) |
| 5 to 9 Unit Apartments | 0 (0.0%) | 1 (100.0%) |
| 10 or more Apartments | 0 (0.0%) | 16 (100.0%) |
| Mobile Home / Other | 67 (78.8%) | 18 (21.2%) |
| Total | 212 (67.9%) | 100 (32.1%) |
Housing Structures by Number of Rooms in Klawock
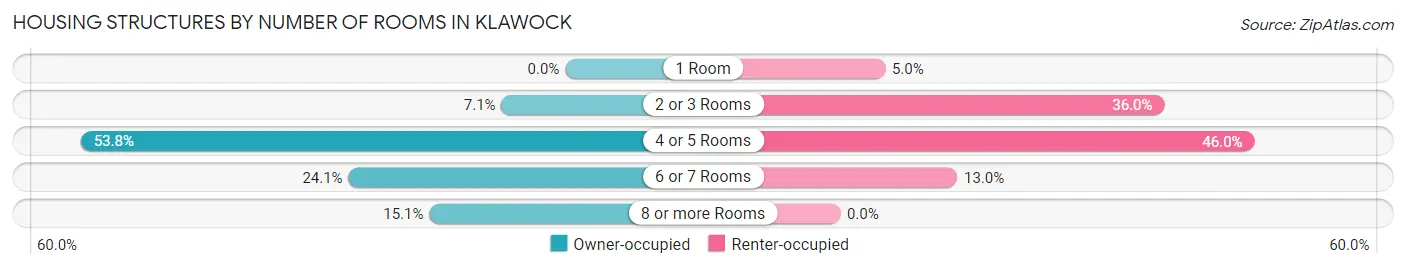
| Number of Rooms | Owner-occupied | Renter-occupied |
| 1 Room | 0 (0.0%) | 5 (5.0%) |
| 2 or 3 Rooms | 15 (7.1%) | 36 (36.0%) |
| 4 or 5 Rooms | 114 (53.8%) | 46 (46.0%) |
| 6 or 7 Rooms | 51 (24.1%) | 13 (13.0%) |
| 8 or more Rooms | 32 (15.1%) | 0 (0.0%) |
| Total | 212 (100.0%) | 100 (100.0%) |
Housing Structure by Heating Type in Klawock
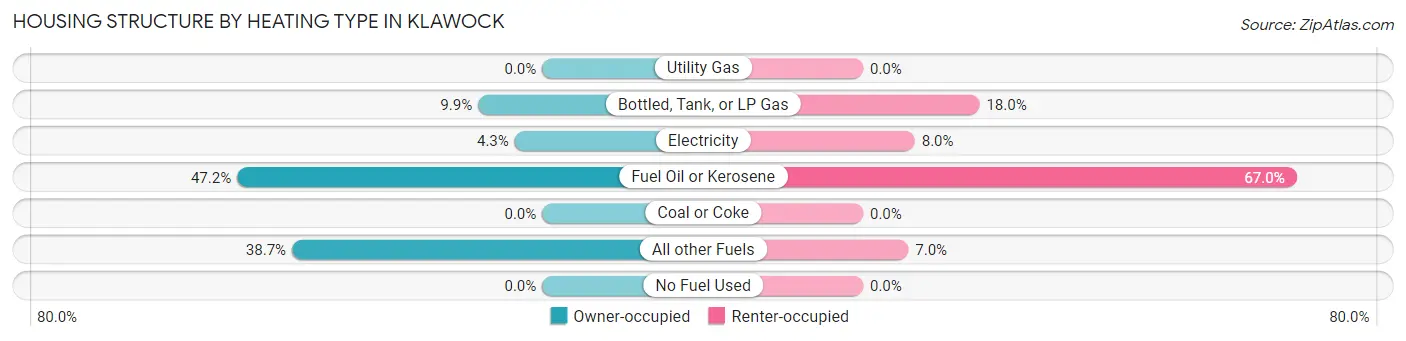
| Heating Type | Owner-occupied | Renter-occupied |
| Utility Gas | 0 (0.0%) | 0 (0.0%) |
| Bottled, Tank, or LP Gas | 21 (9.9%) | 18 (18.0%) |
| Electricity | 9 (4.3%) | 8 (8.0%) |
| Fuel Oil or Kerosene | 100 (47.2%) | 67 (67.0%) |
| Coal or Coke | 0 (0.0%) | 0 (0.0%) |
| All other Fuels | 82 (38.7%) | 7 (7.0%) |
| No Fuel Used | 0 (0.0%) | 0 (0.0%) |
| Total | 212 (100.0%) | 100 (100.0%) |
Household Vehicle Usage in Klawock
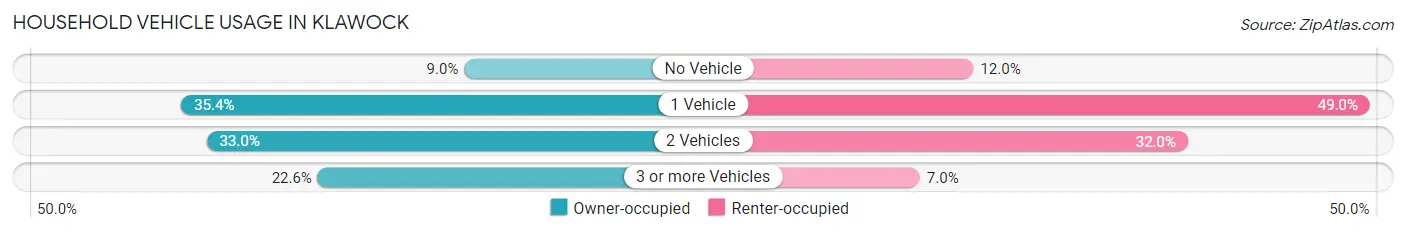
| Vehicles per Household | Owner-occupied | Renter-occupied |
| No Vehicle | 19 (9.0%) | 12 (12.0%) |
| 1 Vehicle | 75 (35.4%) | 49 (49.0%) |
| 2 Vehicles | 70 (33.0%) | 32 (32.0%) |
| 3 or more Vehicles | 48 (22.6%) | 7 (7.0%) |
| Total | 212 (100.0%) | 100 (100.0%) |
Real Estate & Mortgages in Klawock
Real Estate and Mortgage Overview in Klawock
| Characteristic | Without Mortgage | With Mortgage |
| Housing Units | 170 | 42 |
| Median Property Value | $236,100 | $260,000 |
| Median Household Income | $50,417 | $3 |
| Monthly Housing Costs | $386 | $1 |
| Real Estate Taxes | - | - |
Property Value by Mortgage Status in Klawock
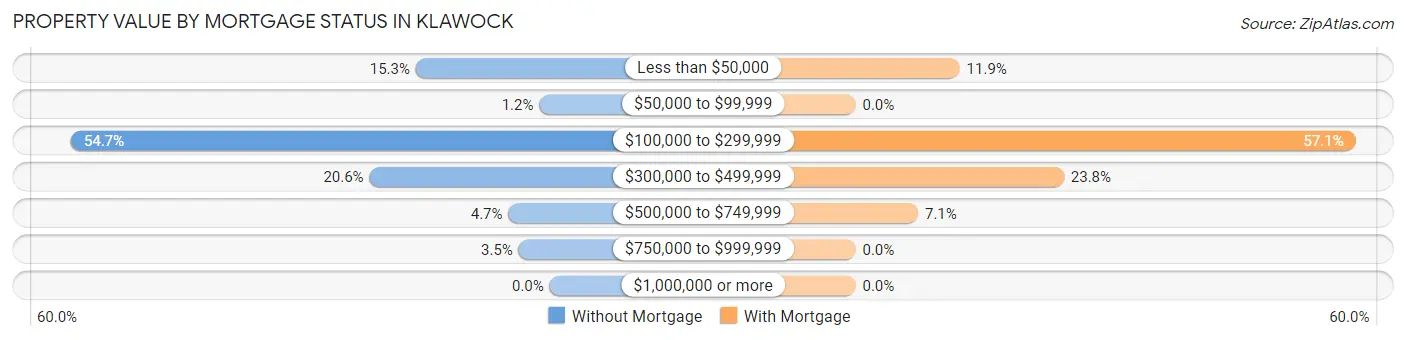
| Property Value | Without Mortgage | With Mortgage |
| Less than $50,000 | 26 (15.3%) | 5 (11.9%) |
| $50,000 to $99,999 | 2 (1.2%) | 0 (0.0%) |
| $100,000 to $299,999 | 93 (54.7%) | 24 (57.1%) |
| $300,000 to $499,999 | 35 (20.6%) | 10 (23.8%) |
| $500,000 to $749,999 | 8 (4.7%) | 3 (7.1%) |
| $750,000 to $999,999 | 6 (3.5%) | 0 (0.0%) |
| $1,000,000 or more | 0 (0.0%) | 0 (0.0%) |
| Total | 170 (100.0%) | 42 (100.0%) |
Household Income by Mortgage Status in Klawock
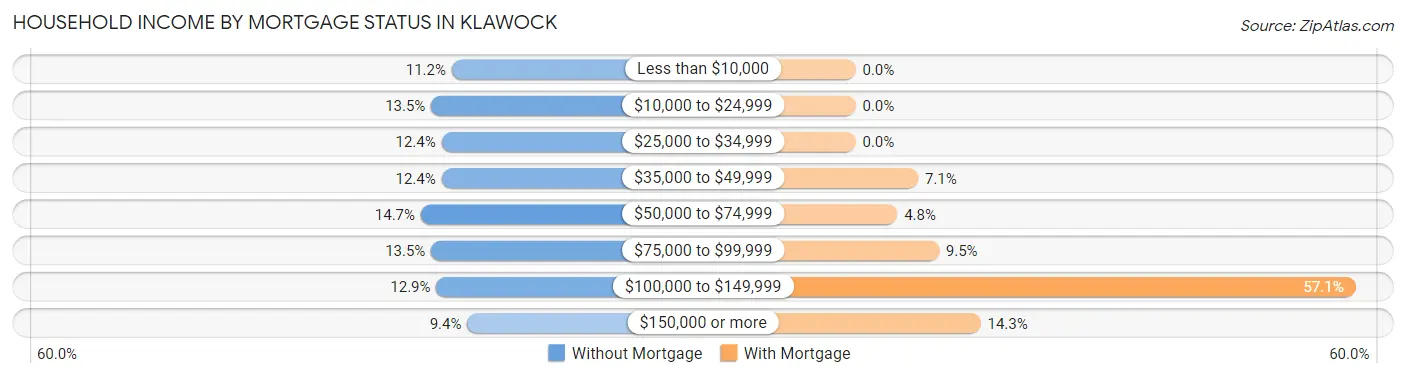
| Household Income | Without Mortgage | With Mortgage |
| Less than $10,000 | 19 (11.2%) | 0 (0.0%) |
| $10,000 to $24,999 | 23 (13.5%) | 0 (0.0%) |
| $25,000 to $34,999 | 21 (12.3%) | 0 (0.0%) |
| $35,000 to $49,999 | 21 (12.3%) | 3 (7.1%) |
| $50,000 to $74,999 | 25 (14.7%) | 2 (4.8%) |
| $75,000 to $99,999 | 23 (13.5%) | 4 (9.5%) |
| $100,000 to $149,999 | 22 (12.9%) | 24 (57.1%) |
| $150,000 or more | 16 (9.4%) | 6 (14.3%) |
| Total | 170 (100.0%) | 42 (100.0%) |
Property Value to Household Income Ratio in Klawock
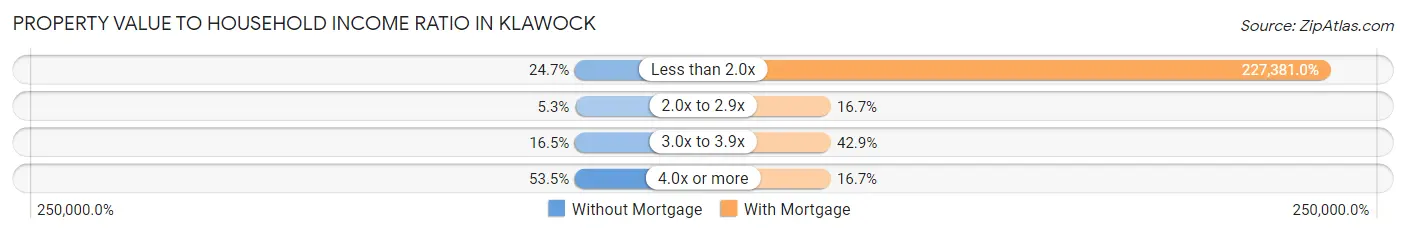
| Value-to-Income Ratio | Without Mortgage | With Mortgage |
| Less than 2.0x | 42 (24.7%) | 95,500 (227,380.9%) |
| 2.0x to 2.9x | 9 (5.3%) | 7 (16.7%) |
| 3.0x to 3.9x | 28 (16.5%) | 18 (42.9%) |
| 4.0x or more | 91 (53.5%) | 7 (16.7%) |
| Total | 170 (100.0%) | 42 (100.0%) |
Real Estate Taxes by Mortgage Status in Klawock
| Property Taxes | Without Mortgage | With Mortgage |
| Less than $800 | 0 (0.0%) | 0 (0.0%) |
| $800 to $1,499 | 0 (0.0%) | 0 (0.0%) |
| $800 to $1,499 | 0 (0.0%) | 0 (0.0%) |
| Total | 170 (100.0%) | 42 (100.0%) |
Health & Disability in Klawock
Health Insurance Coverage by Age in Klawock
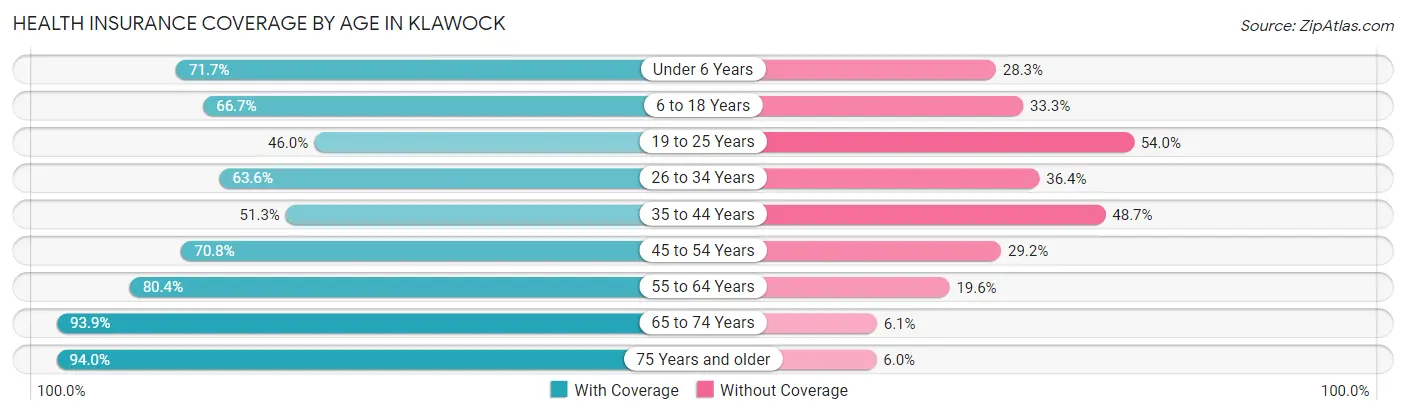
| Age Bracket | With Coverage | Without Coverage |
| Under 6 Years | 33 (71.7%) | 13 (28.3%) |
| 6 to 18 Years | 96 (66.7%) | 48 (33.3%) |
| 19 to 25 Years | 29 (46.0%) | 34 (54.0%) |
| 26 to 34 Years | 49 (63.6%) | 28 (36.4%) |
| 35 to 44 Years | 39 (51.3%) | 37 (48.7%) |
| 45 to 54 Years | 92 (70.8%) | 38 (29.2%) |
| 55 to 64 Years | 82 (80.4%) | 20 (19.6%) |
| 65 to 74 Years | 93 (93.9%) | 6 (6.1%) |
| 75 Years and older | 63 (94.0%) | 4 (6.0%) |
| Total | 576 (71.6%) | 228 (28.4%) |
Health Insurance Coverage by Citizenship Status in Klawock
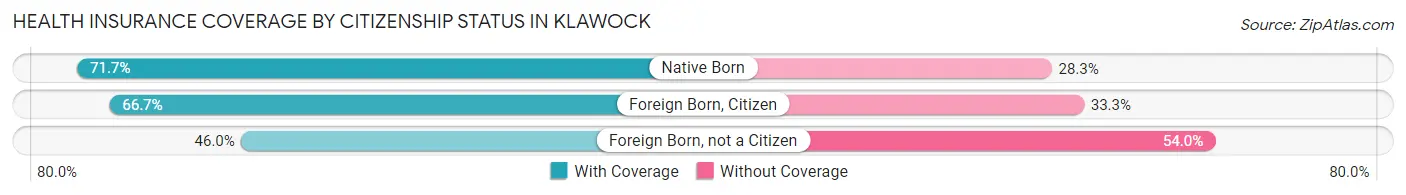
| Citizenship Status | With Coverage | Without Coverage |
| Native Born | 33 (71.7%) | 13 (28.3%) |
| Foreign Born, Citizen | 96 (66.7%) | 48 (33.3%) |
| Foreign Born, not a Citizen | 29 (46.0%) | 34 (54.0%) |
Health Insurance Coverage by Household Income in Klawock
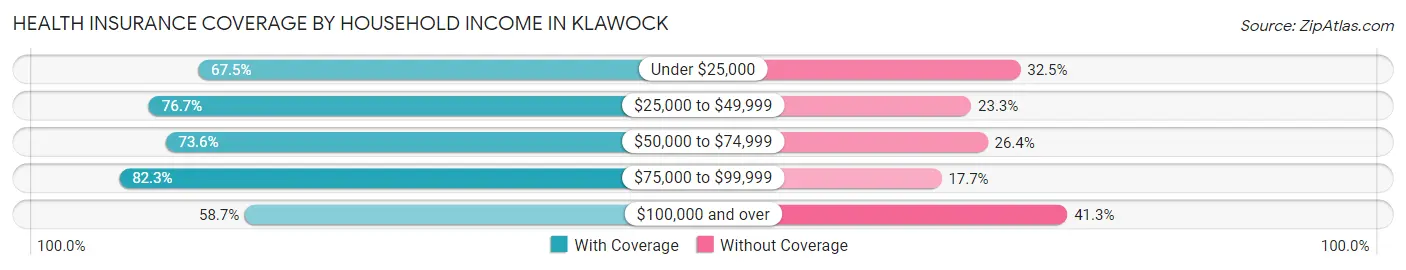
| Household Income | With Coverage | Without Coverage |
| Under $25,000 | 81 (67.5%) | 39 (32.5%) |
| $25,000 to $49,999 | 112 (76.7%) | 34 (23.3%) |
| $50,000 to $74,999 | 67 (73.6%) | 24 (26.4%) |
| $75,000 to $99,999 | 167 (82.3%) | 36 (17.7%) |
| $100,000 and over | 135 (58.7%) | 95 (41.3%) |
Public vs Private Health Insurance Coverage by Age in Klawock
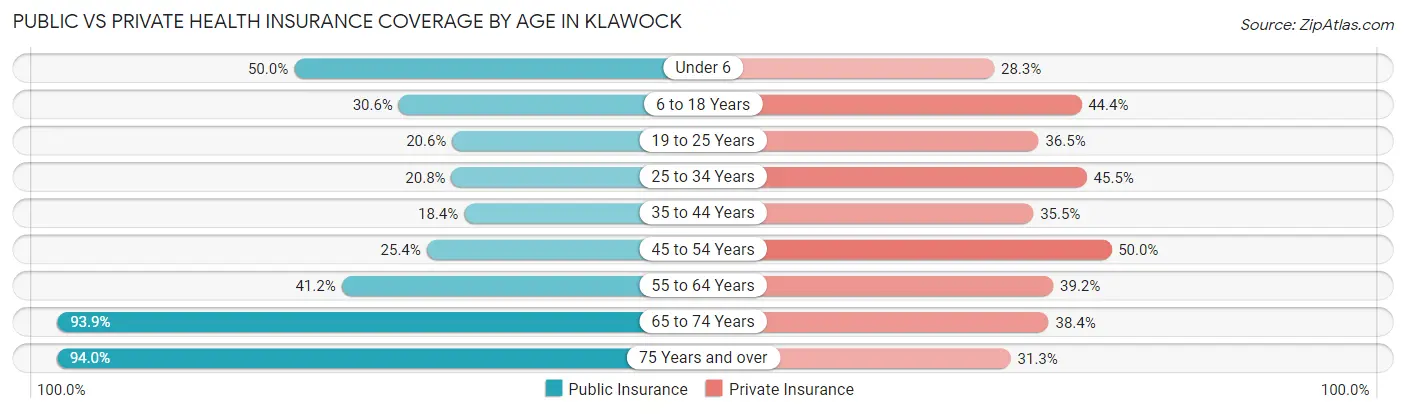
| Age Bracket | Public Insurance | Private Insurance |
| Under 6 | 23 (50.0%) | 13 (28.3%) |
| 6 to 18 Years | 44 (30.6%) | 64 (44.4%) |
| 19 to 25 Years | 13 (20.6%) | 23 (36.5%) |
| 25 to 34 Years | 16 (20.8%) | 35 (45.5%) |
| 35 to 44 Years | 14 (18.4%) | 27 (35.5%) |
| 45 to 54 Years | 33 (25.4%) | 65 (50.0%) |
| 55 to 64 Years | 42 (41.2%) | 40 (39.2%) |
| 65 to 74 Years | 93 (93.9%) | 38 (38.4%) |
| 75 Years and over | 63 (94.0%) | 21 (31.3%) |
| Total | 341 (42.4%) | 326 (40.6%) |
Disability Status by Sex by Age in Klawock
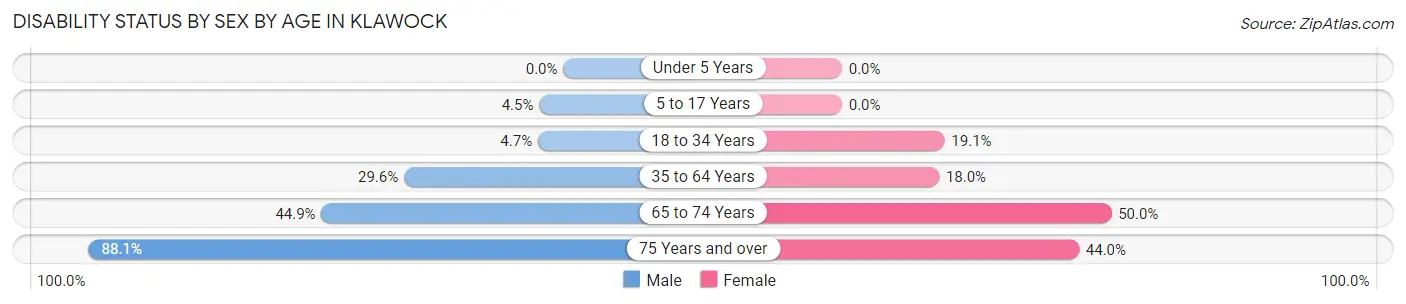
| Age Bracket | Male | Female |
| Under 5 Years | 0 (0.0%) | 0 (0.0%) |
| 5 to 17 Years | 5 (4.5%) | 0 (0.0%) |
| 18 to 34 Years | 4 (4.7%) | 12 (19.1%) |
| 35 to 64 Years | 55 (29.6%) | 22 (18.0%) |
| 65 to 74 Years | 22 (44.9%) | 25 (50.0%) |
| 75 Years and over | 37 (88.1%) | 11 (44.0%) |
Disability Class by Sex by Age in Klawock
Disability Class: Hearing Difficulty
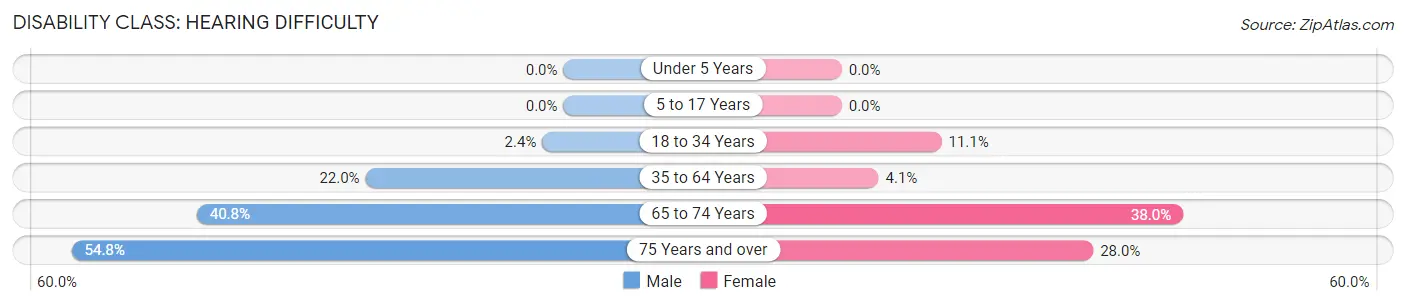
| Age Bracket | Male | Female |
| Under 5 Years | 0 (0.0%) | 0 (0.0%) |
| 5 to 17 Years | 0 (0.0%) | 0 (0.0%) |
| 18 to 34 Years | 2 (2.4%) | 7 (11.1%) |
| 35 to 64 Years | 41 (22.0%) | 5 (4.1%) |
| 65 to 74 Years | 20 (40.8%) | 19 (38.0%) |
| 75 Years and over | 23 (54.8%) | 7 (28.0%) |
Disability Class: Vision Difficulty
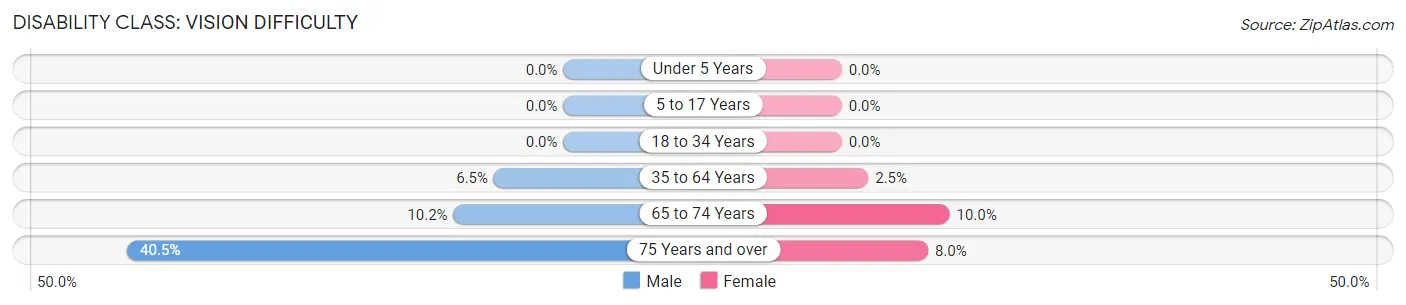
| Age Bracket | Male | Female |
| Under 5 Years | 0 (0.0%) | 0 (0.0%) |
| 5 to 17 Years | 0 (0.0%) | 0 (0.0%) |
| 18 to 34 Years | 0 (0.0%) | 0 (0.0%) |
| 35 to 64 Years | 12 (6.5%) | 3 (2.5%) |
| 65 to 74 Years | 5 (10.2%) | 5 (10.0%) |
| 75 Years and over | 17 (40.5%) | 2 (8.0%) |
Disability Class: Cognitive Difficulty
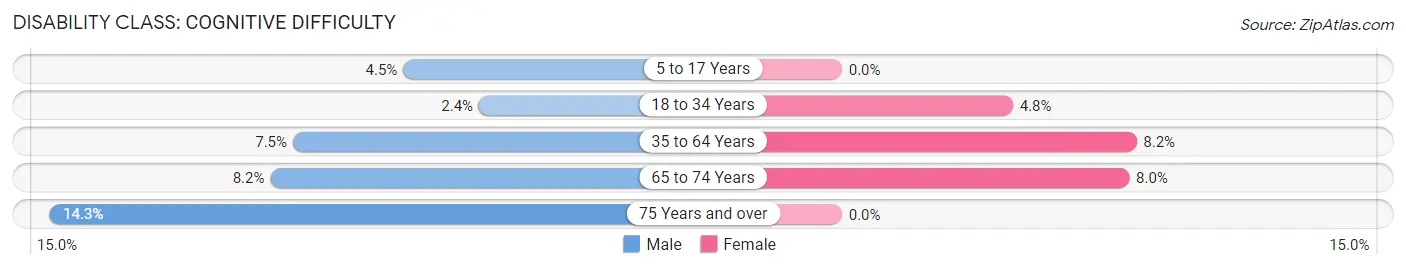
| Age Bracket | Male | Female |
| 5 to 17 Years | 5 (4.5%) | 0 (0.0%) |
| 18 to 34 Years | 2 (2.4%) | 3 (4.8%) |
| 35 to 64 Years | 14 (7.5%) | 10 (8.2%) |
| 65 to 74 Years | 4 (8.2%) | 4 (8.0%) |
| 75 Years and over | 6 (14.3%) | 0 (0.0%) |
Disability Class: Ambulatory Difficulty
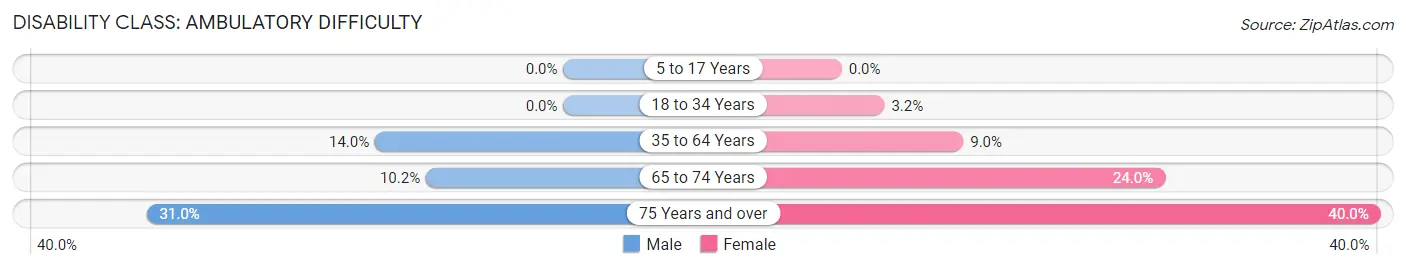
| Age Bracket | Male | Female |
| 5 to 17 Years | 0 (0.0%) | 0 (0.0%) |
| 18 to 34 Years | 0 (0.0%) | 2 (3.2%) |
| 35 to 64 Years | 26 (14.0%) | 11 (9.0%) |
| 65 to 74 Years | 5 (10.2%) | 12 (24.0%) |
| 75 Years and over | 13 (30.9%) | 10 (40.0%) |
Disability Class: Self-Care Difficulty
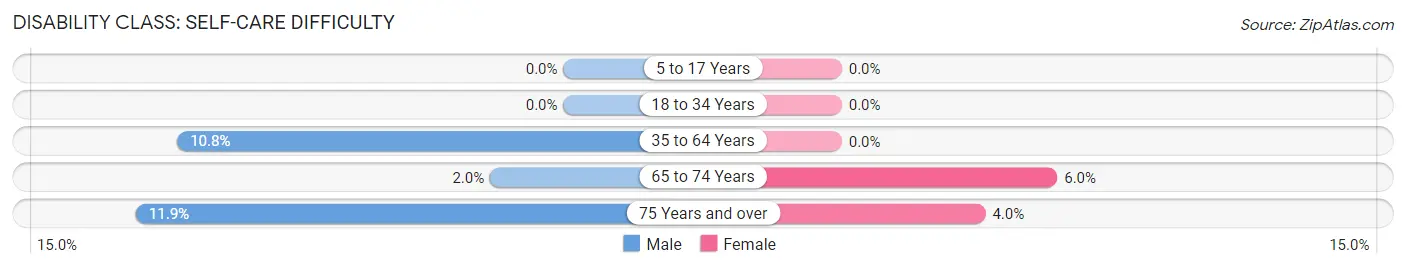
| Age Bracket | Male | Female |
| 5 to 17 Years | 0 (0.0%) | 0 (0.0%) |
| 18 to 34 Years | 0 (0.0%) | 0 (0.0%) |
| 35 to 64 Years | 20 (10.7%) | 0 (0.0%) |
| 65 to 74 Years | 1 (2.0%) | 3 (6.0%) |
| 75 Years and over | 5 (11.9%) | 1 (4.0%) |
Technology Access in Klawock
Computing Device Access in Klawock
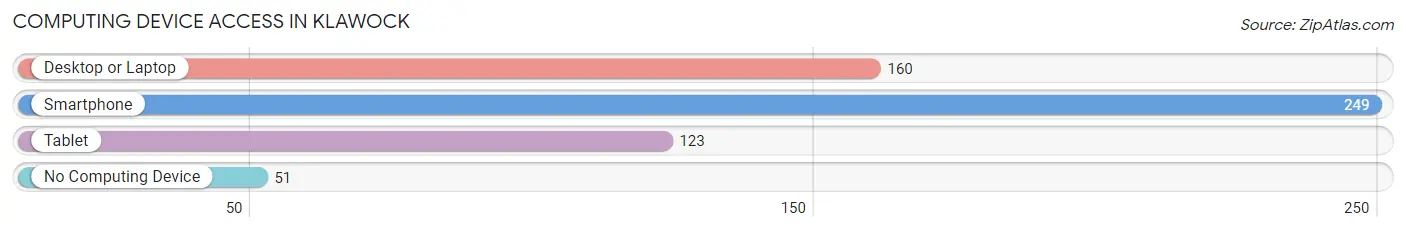
| Device Type | # Households | % Households |
| Desktop or Laptop | 160 | 51.3% |
| Smartphone | 249 | 79.8% |
| Tablet | 123 | 39.4% |
| No Computing Device | 51 | 16.4% |
| Total | 312 | 100.0% |
Internet Access in Klawock
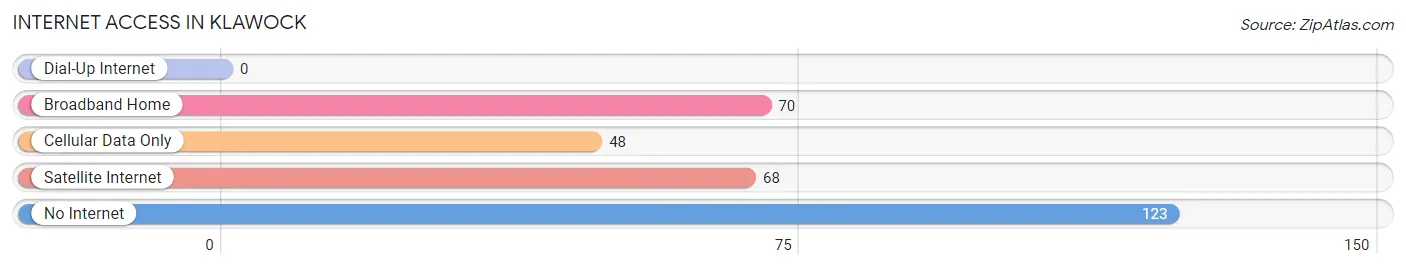
| Internet Type | # Households | % Households |
| Dial-Up Internet | 0 | 0.0% |
| Broadband Home | 70 | 22.4% |
| Cellular Data Only | 48 | 15.4% |
| Satellite Internet | 68 | 21.8% |
| No Internet | 123 | 39.4% |
| Total | 312 | 100.0% |
Klawock Summary
Klawock is a small city located on the southern tip of Prince of Wales Island in the Alexander Archipelago of Southeast Alaska. It is the largest city on the island and the second largest in the archipelago. The city is located on the north side of the island, about 25 miles from the mainland. The population of Klawock was 890 in the 2010 census, making it the second most populous city in the archipelago.
Geography
Klawock is located on the north side of Prince of Wales Island, about 25 miles from the mainland. The city is situated on a small bay, which is part of the larger Prince of Wales Island Inlet. The city is surrounded by mountains and forests, and is home to a variety of wildlife, including bald eagles, black bears, and Sitka black-tailed deer. The climate in Klawock is mild and wet, with an average annual temperature of 45°F.
Economy
Klawock’s economy is largely based on fishing and logging. The city is home to several fish processing plants, as well as a number of logging companies. Tourism is also an important part of the local economy, with visitors coming to the area to enjoy the natural beauty and wildlife. The city is also home to a number of small businesses, including restaurants, shops, and galleries.
Demographics
Klawock’s population was 890 in the 2010 census. The population is predominantly Native American, with the majority of residents being of Tlingit descent. The city also has a small population of non-Native Americans, primarily of European descent. The median household income in Klawock is $41,000, and the median age is 37.
History
Klawock was first settled by the Tlingit people in the late 1700s. The city was originally known as “Klawak,” which means “place of the eagles” in the Tlingit language. The city was officially incorporated in 1891, and was named after the nearby Klawock River. In the early 1900s, the city became a hub for the logging and fishing industries. The city was also home to a number of canneries, which processed salmon and other fish for export.
Klawock has a long history of Native American culture and traditions. The city is home to the Klawock Cooperative Association, which was established in the early 1900s to protect the rights of the Tlingit people. The association is still active today, and works to preserve the culture and traditions of the Tlingit people.
Klawock is a small city with a rich history and culture. The city is home to a variety of wildlife, and is a popular destination for tourists. The city’s economy is largely based on fishing and logging, and the population is predominantly Native American. Klawock is a unique and vibrant city, and is a great place to visit or live.
Common Questions
What is Per Capita Income in Klawock?
Per Capita income in Klawock is $33,116.
What is the Median Family Income in Klawock?
Median Family Income in Klawock is $75,972.
What is the Median Household income in Klawock?
Median Household Income in Klawock is $60,625.
What is Income or Wage Gap in Klawock?
Income or Wage Gap in Klawock is 33.6%.
Women in Klawock earn 66.4 cents for every dollar earned by a man.
What is Inequality or Gini Index in Klawock?
Inequality or Gini Index in Klawock is 0.46.
What is the Total Population of Klawock?
Total Population of Klawock is 804.
What is the Total Male Population of Klawock?
Total Male Population of Klawock is 485.
What is the Total Female Population of Klawock?
Total Female Population of Klawock is 319.
What is the Ratio of Males per 100 Females in Klawock?
There are 152.04 Males per 100 Females in Klawock.
What is the Ratio of Females per 100 Males in Klawock?
There are 65.77 Females per 100 Males in Klawock.
What is the Median Population Age in Klawock?
Median Population Age in Klawock is 44.2 Years.
What is the Average Family Size in Klawock
Average Family Size in Klawock is 3.2 People.
What is the Average Household Size in Klawock
Average Household Size in Klawock is 2.5 People.
How Large is the Labor Force in Klawock?
There are 402 People in the Labor Forcein in Klawock.
What is the Percentage of People in the Labor Force in Klawock?
62.9% of People are in the Labor Force in Klawock.
What is the Unemployment Rate in Klawock?
Unemployment Rate in Klawock is 10.2%.