Willow, AK Map & Demographics
Willow Map
Willow Overview
$35,847
PER CAPITA INCOME
$95,341
AVG FAMILY INCOME
$71,536
AVG HOUSEHOLD INCOME
50.6%
WAGE / INCOME GAP [ % ]
49.4¢/ $1
WAGE / INCOME GAP [ $ ]
0.40
INEQUALITY / GINI INDEX
1,952
TOTAL POPULATION
1,046
MALE POPULATION
906
FEMALE POPULATION
115.45
MALES / 100 FEMALES
86.62
FEMALES / 100 MALES
46.2
MEDIAN AGE
3.0
AVG FAMILY SIZE
2.3
AVG HOUSEHOLD SIZE
681
LABOR FORCE [ PEOPLE ]
45.4%
PERCENT IN LABOR FORCE
7.9%
UNEMPLOYMENT RATE
Willow Zip Codes
Willow Area Codes
Income in Willow
Income Overview in Willow
Per Capita Income in Willow is $35,847, while median incomes of families and households are $95,341 and $71,536 respectively.
| Characteristic | Number | Measure |
| Per Capita Income | 1,952 | $35,847 |
| Median Family Income | 500 | $95,341 |
| Mean Family Income | 500 | $99,443 |
| Median Household Income | 845 | $71,536 |
| Mean Household Income | 845 | $82,747 |
| Income Deficit | 500 | $0 |
| Wage / Income Gap (%) | 1,952 | 50.59% |
| Wage / Income Gap ($) | 1,952 | 49.41¢ per $1 |
| Gini / Inequality Index | 1,952 | 0.40 |
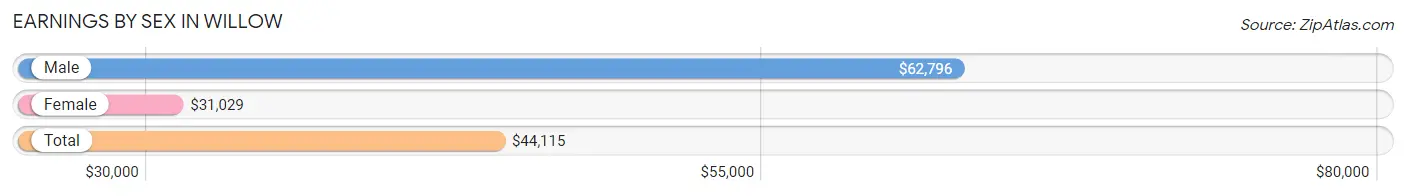
Earnings by Sex in Willow
Average Earnings in Willow are $44,115, $62,796 for men and $31,029 for women, a difference of 50.6%.
| Sex | Number | Average Earnings |
| Male | 429 (56.7%) | $62,796 |
| Female | 328 (43.3%) | $31,029 |
| Total | 757 (100.0%) | $44,115 |
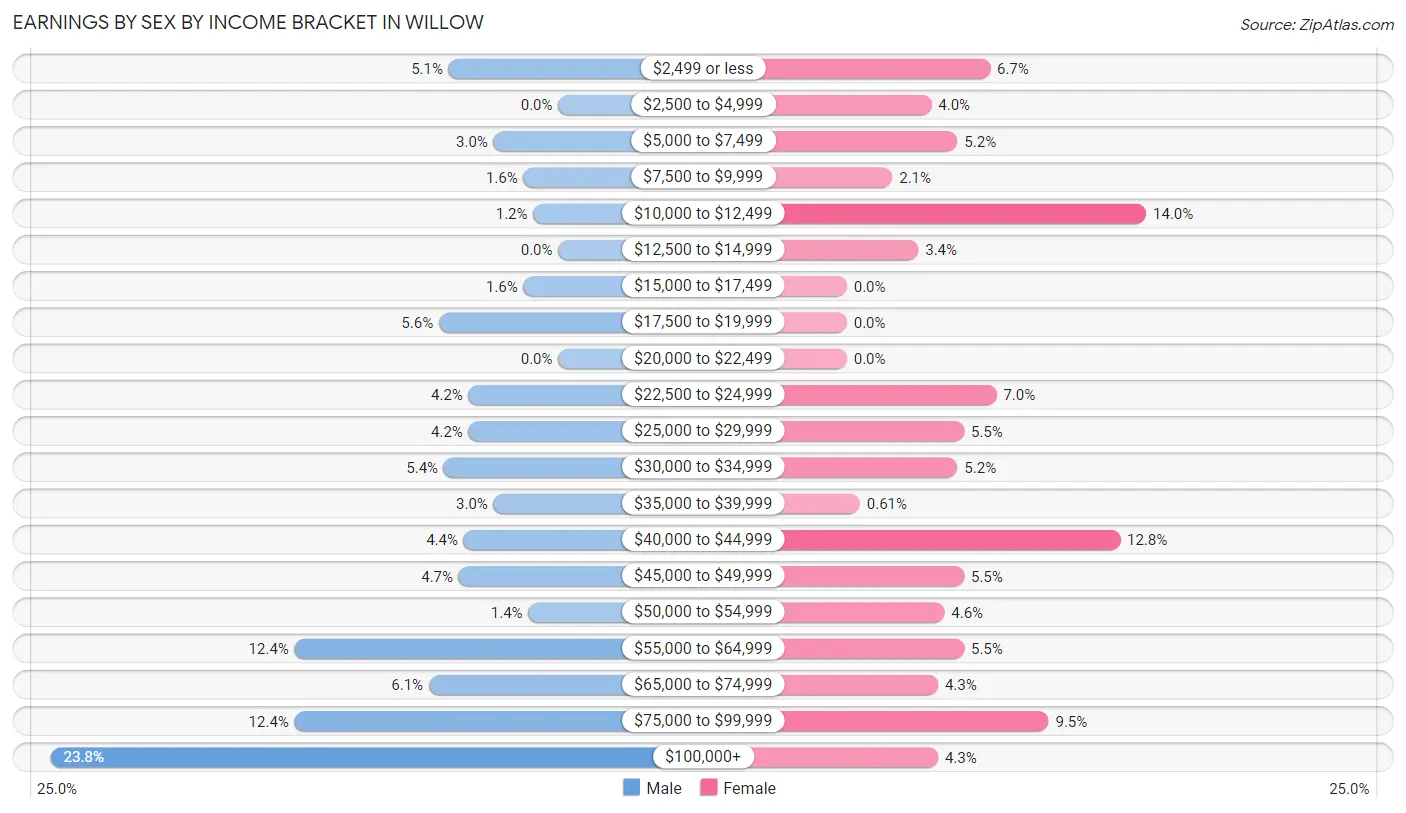
Earnings by Sex by Income Bracket in Willow
The most common earnings brackets in Willow are $100,000+ for men (102 | 23.8%) and $10,000 to $12,499 for women (46 | 14.0%).
| Income | Male | Female |
| $2,499 or less | 22 (5.1%) | 22 (6.7%) |
| $2,500 to $4,999 | 0 (0.0%) | 13 (4.0%) |
| $5,000 to $7,499 | 13 (3.0%) | 17 (5.2%) |
| $7,500 to $9,999 | 7 (1.6%) | 7 (2.1%) |
| $10,000 to $12,499 | 5 (1.2%) | 46 (14.0%) |
| $12,500 to $14,999 | 0 (0.0%) | 11 (3.4%) |
| $15,000 to $17,499 | 7 (1.6%) | 0 (0.0%) |
| $17,500 to $19,999 | 24 (5.6%) | 0 (0.0%) |
| $20,000 to $22,499 | 0 (0.0%) | 0 (0.0%) |
| $22,500 to $24,999 | 18 (4.2%) | 23 (7.0%) |
| $25,000 to $29,999 | 18 (4.2%) | 18 (5.5%) |
| $30,000 to $34,999 | 23 (5.4%) | 17 (5.2%) |
| $35,000 to $39,999 | 13 (3.0%) | 2 (0.6%) |
| $40,000 to $44,999 | 19 (4.4%) | 42 (12.8%) |
| $45,000 to $49,999 | 20 (4.7%) | 18 (5.5%) |
| $50,000 to $54,999 | 6 (1.4%) | 15 (4.6%) |
| $55,000 to $64,999 | 53 (12.3%) | 18 (5.5%) |
| $65,000 to $74,999 | 26 (6.1%) | 14 (4.3%) |
| $75,000 to $99,999 | 53 (12.3%) | 31 (9.5%) |
| $100,000+ | 102 (23.8%) | 14 (4.3%) |
| Total | 429 (100.0%) | 328 (100.0%) |
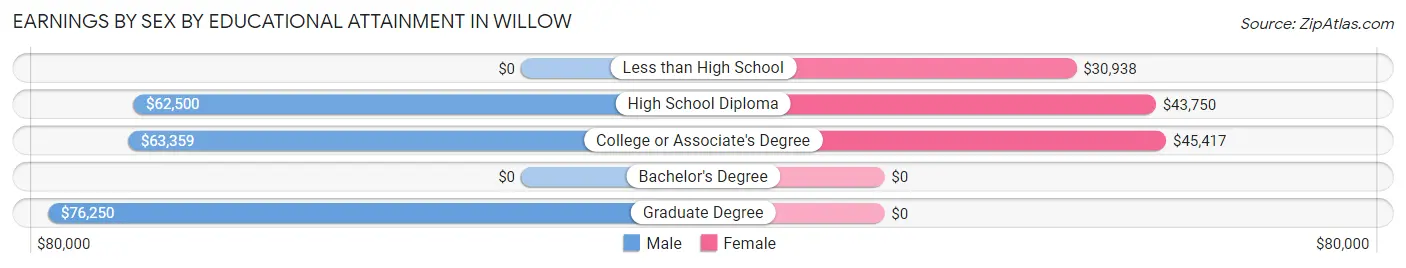
Earnings by Sex by Educational Attainment in Willow
Average earnings in Willow are $63,026 for men and $41,042 for women, a difference of 34.9%. Men with an educational attainment of graduate degree enjoy the highest average annual earnings of $76,250, while those with high school diploma education earn the least with $62,500. Women with an educational attainment of college or associate's degree earn the most with the average annual earnings of $45,417, while those with less than high school education have the smallest earnings of $30,938.
| Educational Attainment | Male Income | Female Income |
| Less than High School | - | - |
| High School Diploma | $62,500 | $43,750 |
| College or Associate's Degree | $63,359 | $45,417 |
| Bachelor's Degree | - | - |
| Graduate Degree | $76,250 | $0 |
| Total | $63,026 | $41,042 |
Family Income in Willow
Family Income Brackets in Willow
According to the Willow family income data, there are 156 families falling into the $100,000 to $149,999 income range, which is the most common income bracket and makes up 31.2% of all families.
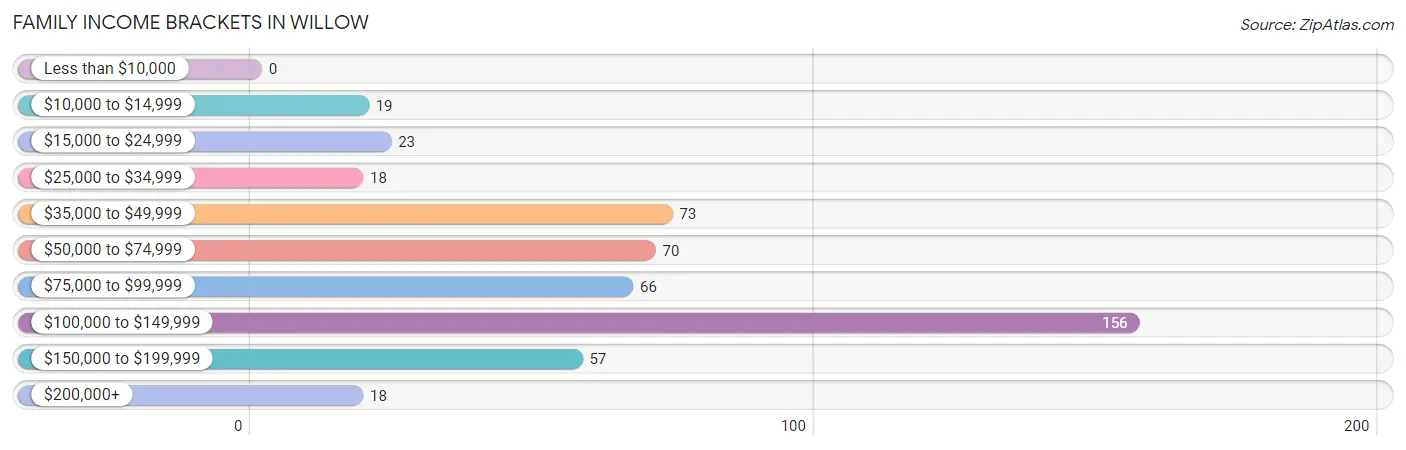
| Income Bracket | # Families | % Families |
| Less than $10,000 | 0 | 0.0% |
| $10,000 to $14,999 | 19 | 3.8% |
| $15,000 to $24,999 | 23 | 4.6% |
| $25,000 to $34,999 | 18 | 3.6% |
| $35,000 to $49,999 | 73 | 14.6% |
| $50,000 to $74,999 | 70 | 14.0% |
| $75,000 to $99,999 | 66 | 13.2% |
| $100,000 to $149,999 | 156 | 31.2% |
| $150,000 to $199,999 | 57 | 11.4% |
| $200,000+ | 18 | 3.6% |
Family Income by Famaliy Size in Willow
4-person families (74 | 14.8%) account for the highest median family income in Willow with $103,333 per family, while 2-person families (257 | 51.4%) have the highest median income of $50,446 per family member.
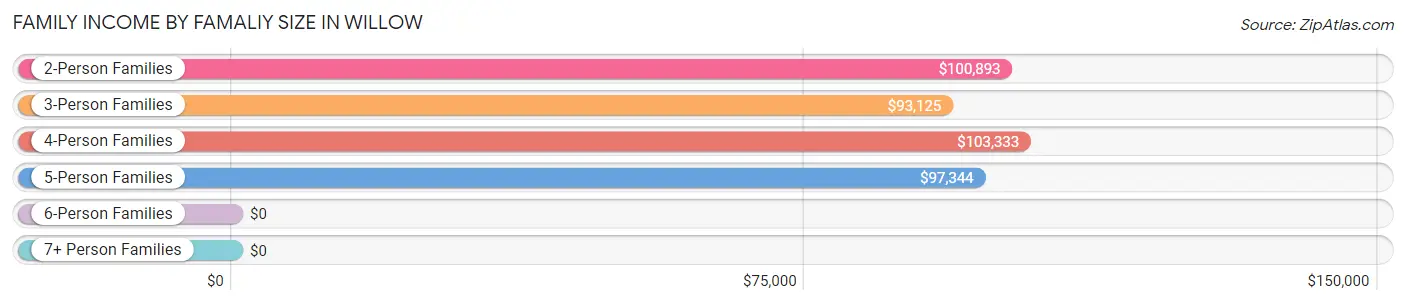
| Income Bracket | # Families | Median Income |
| 2-Person Families | 257 (51.4%) | $100,893 |
| 3-Person Families | 71 (14.2%) | $93,125 |
| 4-Person Families | 74 (14.8%) | $103,333 |
| 5-Person Families | 58 (11.6%) | $97,344 |
| 6-Person Families | 8 (1.6%) | $0 |
| 7+ Person Families | 32 (6.4%) | $0 |
| Total | 500 (100.0%) | $95,341 |
Family Income by Number of Earners in Willow
The median family income in Willow is $95,341, with families comprising 2 earners (118) having the highest median family income of $122,500, while families with 3+ earners (39) have the lowest median family income of $41,950, accounting for 23.6% and 7.8% of families, respectively.
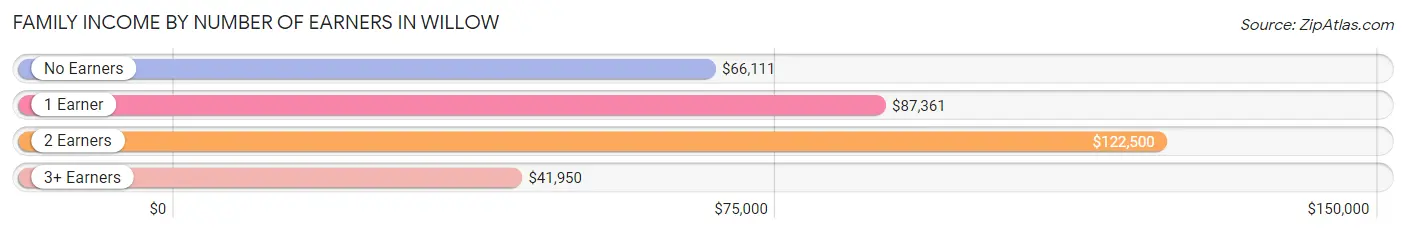
| Number of Earners | # Families | Median Income |
| No Earners | 130 (26.0%) | $66,111 |
| 1 Earner | 213 (42.6%) | $87,361 |
| 2 Earners | 118 (23.6%) | $122,500 |
| 3+ Earners | 39 (7.8%) | $41,950 |
| Total | 500 (100.0%) | $95,341 |
Household Income in Willow
Household Income Brackets in Willow
With 207 households falling in the category, the $100,000 to $149,999 income range is the most frequent in Willow, accounting for 24.5% of all households. In contrast, only 19 households (2.2%) fall into the $10,000 to $14,999 income bracket, making it the least populous group.
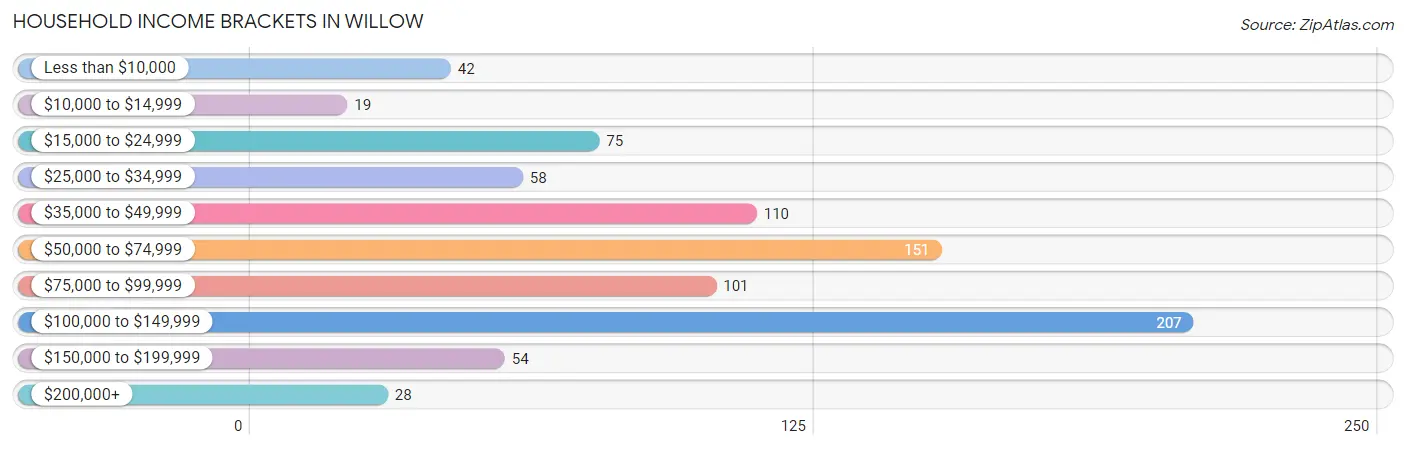
| Income Bracket | # Households | % Households |
| Less than $10,000 | 42 | 5.0% |
| $10,000 to $14,999 | 19 | 2.2% |
| $15,000 to $24,999 | 75 | 8.9% |
| $25,000 to $34,999 | 58 | 6.9% |
| $35,000 to $49,999 | 110 | 13.0% |
| $50,000 to $74,999 | 151 | 17.9% |
| $75,000 to $99,999 | 101 | 12.0% |
| $100,000 to $149,999 | 207 | 24.5% |
| $150,000 to $199,999 | 54 | 6.4% |
| $200,000+ | 28 | 3.3% |
Household Income by Householder Age in Willow
The median household income in Willow is $71,536, with the highest median household income of $95,313 found in the 25 to 44 years age bracket for the primary householder. A total of 200 households (23.7%) fall into this category. Meanwhile, the 15 to 24 years age bracket for the primary householder has the lowest median household income of $0, with 7 households (0.8%) in this group.
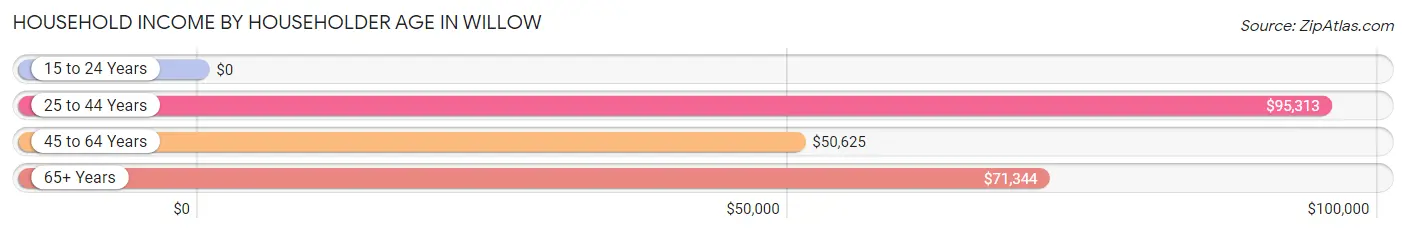
| Income Bracket | # Households | Median Income |
| 15 to 24 Years | 7 (0.8%) | $0 |
| 25 to 44 Years | 200 (23.7%) | $95,313 |
| 45 to 64 Years | 349 (41.3%) | $50,625 |
| 65+ Years | 289 (34.2%) | $71,344 |
| Total | 845 (100.0%) | $71,536 |
Poverty in Willow
Income Below Poverty by Sex and Age in Willow
With 13.1% poverty level for males and 15.7% for females among the residents of Willow, 12 to 14 year old males and 16 and 17 year old females are the most vulnerable to poverty, with 17 males (54.8%) and 16 females (69.6%) in their respective age groups living below the poverty level.
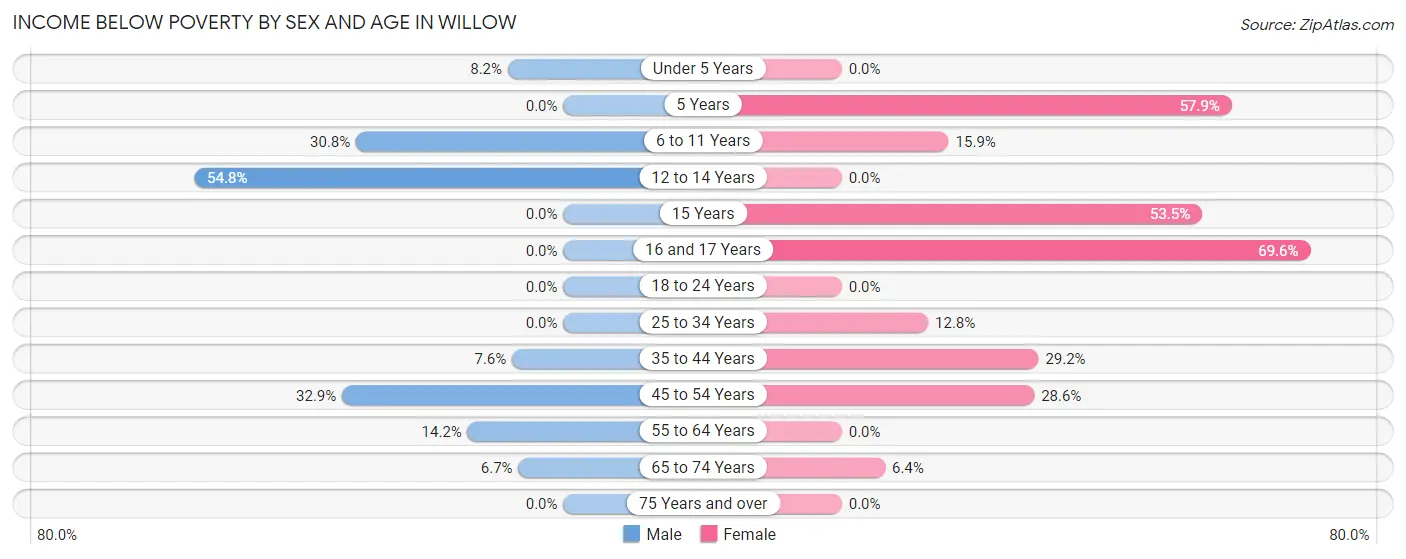
| Age Bracket | Male | Female |
| Under 5 Years | 7 (8.2%) | 0 (0.0%) |
| 5 Years | 0 (0.0%) | 11 (57.9%) |
| 6 to 11 Years | 24 (30.8%) | 10 (15.9%) |
| 12 to 14 Years | 17 (54.8%) | 0 (0.0%) |
| 15 Years | 0 (0.0%) | 23 (53.5%) |
| 16 and 17 Years | 0 (0.0%) | 16 (69.6%) |
| 18 to 24 Years | 0 (0.0%) | 0 (0.0%) |
| 25 to 34 Years | 0 (0.0%) | 10 (12.8%) |
| 35 to 44 Years | 7 (7.6%) | 33 (29.2%) |
| 45 to 54 Years | 45 (32.9%) | 32 (28.6%) |
| 55 to 64 Years | 26 (14.2%) | 0 (0.0%) |
| 65 to 74 Years | 11 (6.7%) | 7 (6.4%) |
| 75 Years and over | 0 (0.0%) | 0 (0.0%) |
| Total | 137 (13.1%) | 142 (15.7%) |
Income Above Poverty by Sex and Age in Willow
According to the poverty statistics in Willow, males aged 5 years and females aged under 5 years are the age groups that are most secure financially, with 100.0% of males and 100.0% of females in these age groups living above the poverty line.
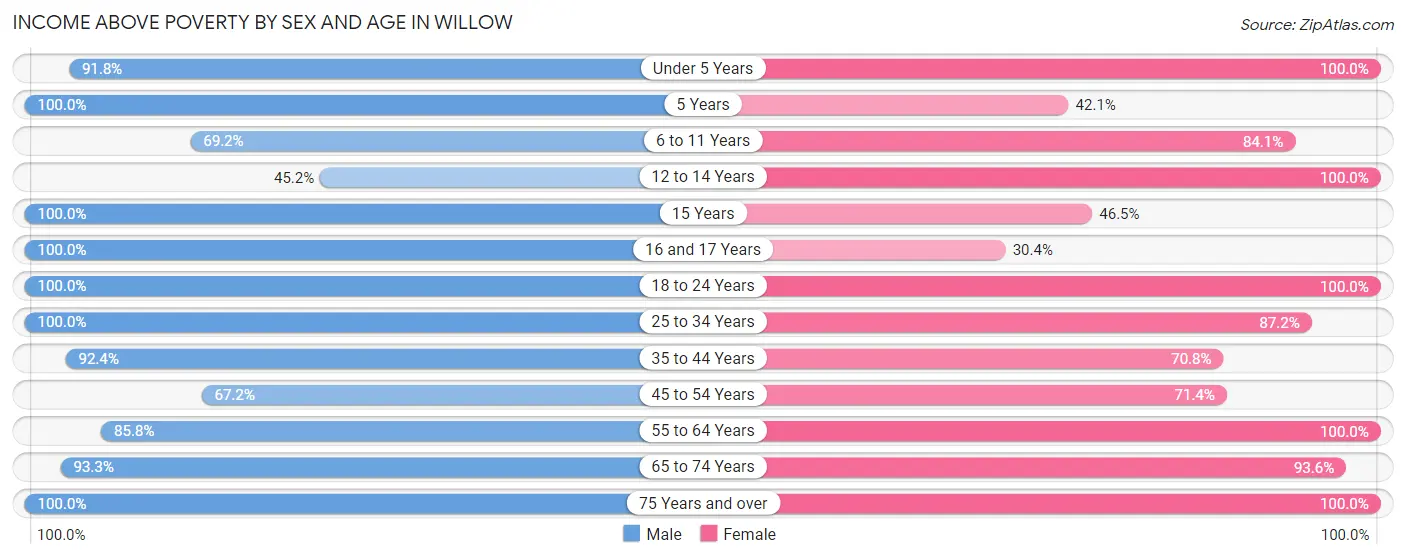
| Age Bracket | Male | Female |
| Under 5 Years | 78 (91.8%) | 69 (100.0%) |
| 5 Years | 46 (100.0%) | 8 (42.1%) |
| 6 to 11 Years | 54 (69.2%) | 53 (84.1%) |
| 12 to 14 Years | 14 (45.2%) | 9 (100.0%) |
| 15 Years | 10 (100.0%) | 20 (46.5%) |
| 16 and 17 Years | 1 (100.0%) | 7 (30.4%) |
| 18 to 24 Years | 38 (100.0%) | 42 (100.0%) |
| 25 to 34 Years | 94 (100.0%) | 68 (87.2%) |
| 35 to 44 Years | 85 (92.4%) | 80 (70.8%) |
| 45 to 54 Years | 92 (67.1%) | 80 (71.4%) |
| 55 to 64 Years | 157 (85.8%) | 145 (100.0%) |
| 65 to 74 Years | 154 (93.3%) | 102 (93.6%) |
| 75 Years and over | 86 (100.0%) | 81 (100.0%) |
| Total | 909 (86.9%) | 764 (84.3%) |
Income Below Poverty Among Married-Couple Families in Willow
The poverty statistics for married-couple families in Willow show that 10.1% or 43 of the total 428 families live below the poverty line. Families with 5 or more children have the highest poverty rate of 100.0%, comprising of 25 families. On the other hand, families with 3 or 4 children have the lowest poverty rate of 0.0%, which includes 0 families.
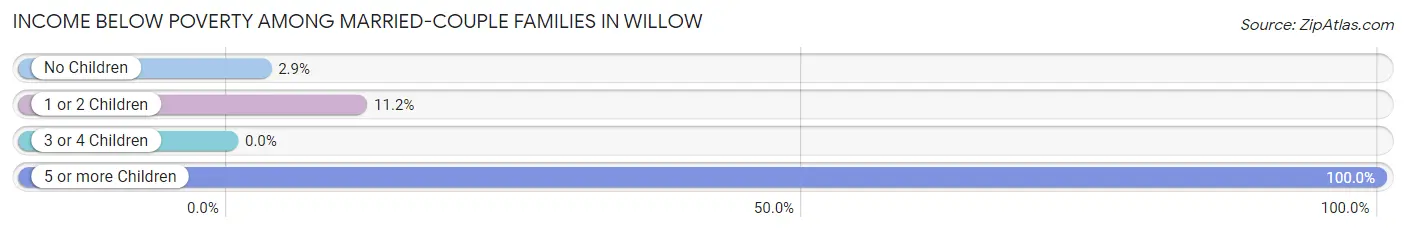
| Children | Above Poverty | Below Poverty |
| No Children | 269 (97.1%) | 8 (2.9%) |
| 1 or 2 Children | 79 (88.8%) | 10 (11.2%) |
| 3 or 4 Children | 37 (100.0%) | 0 (0.0%) |
| 5 or more Children | 0 (0.0%) | 25 (100.0%) |
| Total | 385 (89.9%) | 43 (10.1%) |
Income Below Poverty Among Single-Parent Households in Willow
According to the poverty data in Willow, 16.1% or 5 single-father households and 14.6% or 6 single-mother households are living below the poverty line. Among single-father households, those with 1 or 2 children have the highest poverty rate, with 5 households (38.5%) experiencing poverty. Likewise, among single-mother households, those with 1 or 2 children have the highest poverty rate, with 6 households (50.0%) falling below the poverty line.
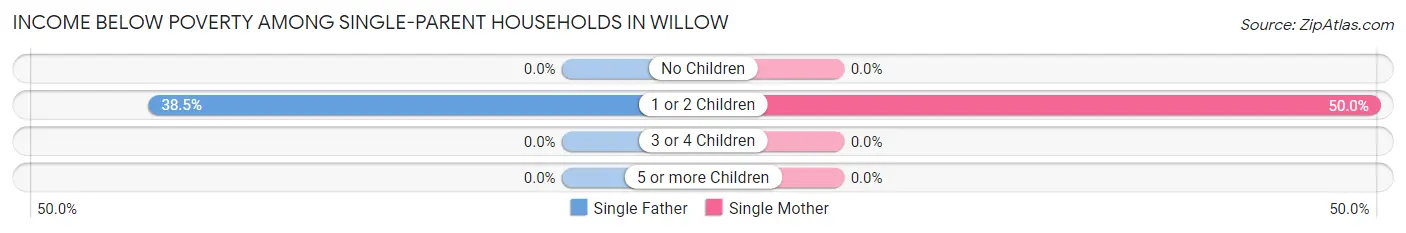
| Children | Single Father | Single Mother |
| No Children | 0 (0.0%) | 0 (0.0%) |
| 1 or 2 Children | 5 (38.5%) | 6 (50.0%) |
| 3 or 4 Children | 0 (0.0%) | 0 (0.0%) |
| 5 or more Children | 0 (0.0%) | 0 (0.0%) |
| Total | 5 (16.1%) | 6 (14.6%) |
Income Below Poverty Among Married-Couple vs Single-Parent Households in Willow
The poverty data for Willow shows that 43 of the married-couple family households (10.1%) and 11 of the single-parent households (15.3%) are living below the poverty level. Within the married-couple family households, those with 5 or more children have the highest poverty rate, with 25 households (100.0%) falling below the poverty line. Among the single-parent households, those with 1 or 2 children have the highest poverty rate, with 11 household (44.0%) living below poverty.
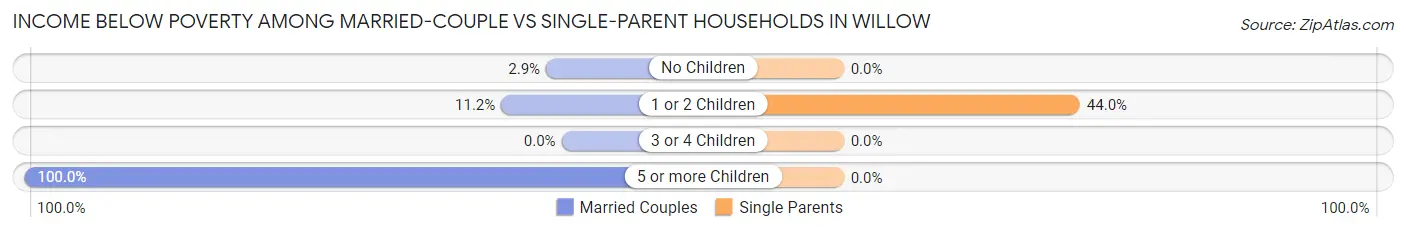
| Children | Married-Couple Families | Single-Parent Households |
| No Children | 8 (2.9%) | 0 (0.0%) |
| 1 or 2 Children | 10 (11.2%) | 11 (44.0%) |
| 3 or 4 Children | 0 (0.0%) | 0 (0.0%) |
| 5 or more Children | 25 (100.0%) | 0 (0.0%) |
| Total | 43 (10.1%) | 11 (15.3%) |
Race in Willow
The most populous races in Willow are White / Caucasian (1,689 | 86.5%), Two or more Races (158 | 8.1%), and Native / Alaskan (95 | 4.9%).
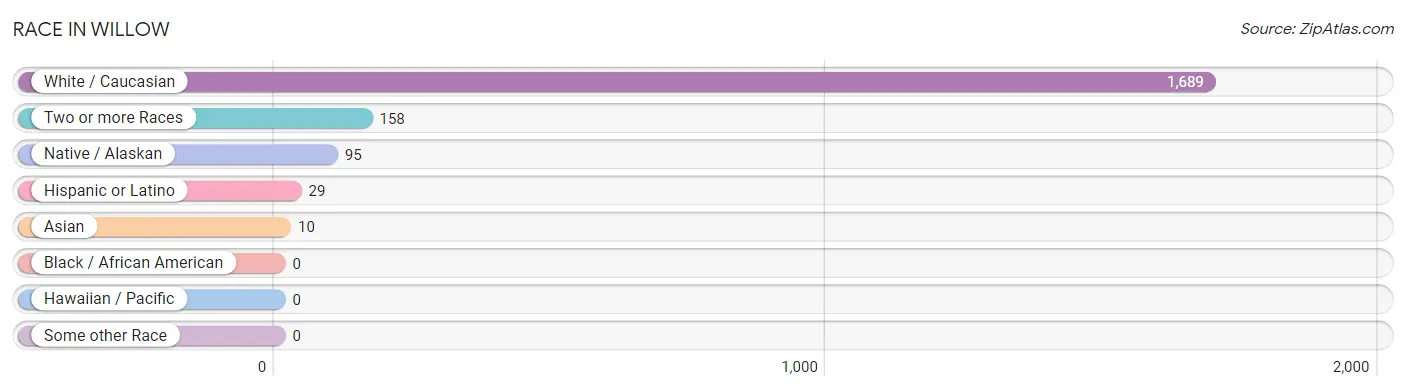
| Race | # Population | % Population |
| Asian | 10 | 0.5% |
| Black / African American | 0 | 0.0% |
| Hawaiian / Pacific | 0 | 0.0% |
| Hispanic or Latino | 29 | 1.5% |
| Native / Alaskan | 95 | 4.9% |
| White / Caucasian | 1,689 | 86.5% |
| Two or more Races | 158 | 8.1% |
| Some other Race | 0 | 0.0% |
| Total | 1,952 | 100.0% |
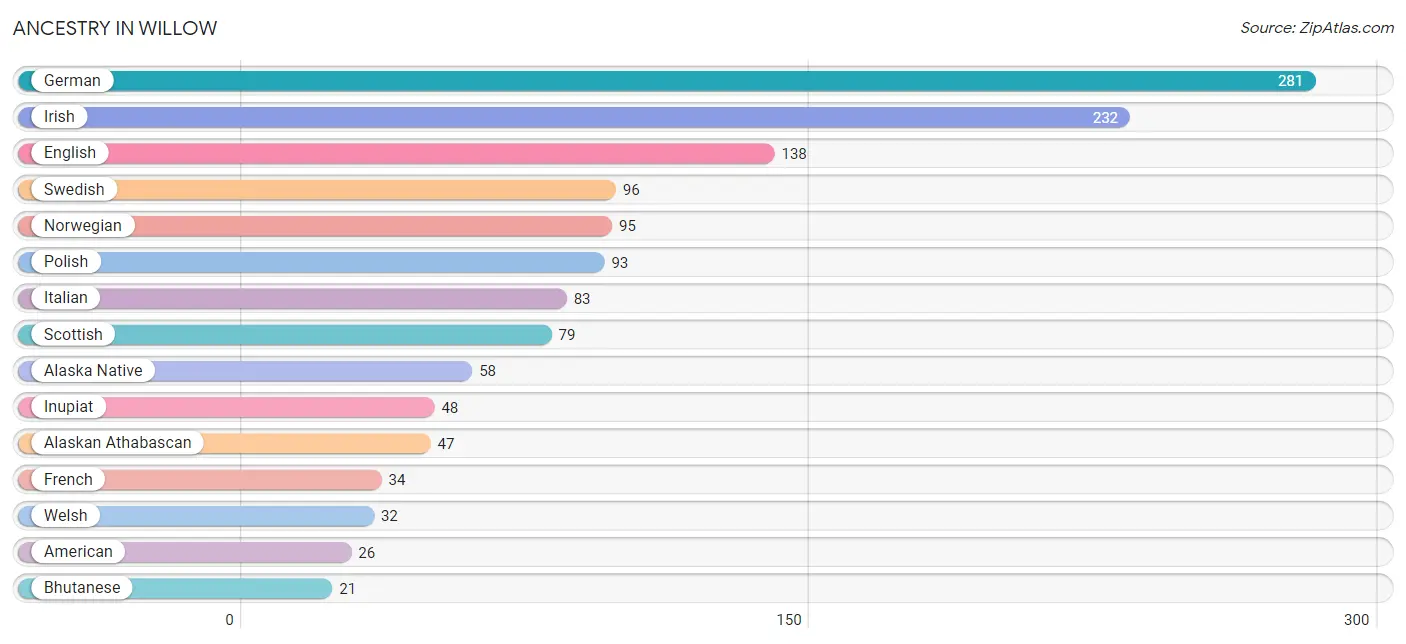
Ancestry in Willow
The most populous ancestries reported in Willow are German (281 | 14.4%), Irish (232 | 11.9%), English (138 | 7.1%), Swedish (96 | 4.9%), and Norwegian (95 | 4.9%), together accounting for 43.2% of all Willow residents.
| Ancestry | # Population | % Population |
| Alaska Native | 58 | 3.0% |
| Alaskan Athabascan | 47 | 2.4% |
| Aleut | 1 | 0.1% |
| American | 26 | 1.3% |
| Austrian | 5 | 0.3% |
| Bhutanese | 21 | 1.1% |
| British | 16 | 0.8% |
| Central American | 3 | 0.2% |
| Cherokee | 5 | 0.3% |
| Choctaw | 9 | 0.5% |
| Czech | 13 | 0.7% |
| Danish | 21 | 1.1% |
| Dutch | 21 | 1.1% |
| English | 138 | 7.1% |
| French | 34 | 1.7% |
| French Canadian | 16 | 0.8% |
| German | 281 | 14.4% |
| Indian (Asian) | 15 | 0.8% |
| Inupiat | 48 | 2.5% |
| Irish | 232 | 11.9% |
| Italian | 83 | 4.3% |
| Laotian | 5 | 0.3% |
| Lithuanian | 6 | 0.3% |
| Mexican | 17 | 0.9% |
| Norwegian | 95 | 4.9% |
| Polish | 93 | 4.8% |
| Russian | 12 | 0.6% |
| Salvadoran | 3 | 0.2% |
| Scotch-Irish | 19 | 1.0% |
| Scottish | 79 | 4.1% |
| Swedish | 96 | 4.9% |
| Swiss | 11 | 0.6% |
| Tlingit-Haida | 20 | 1.0% |
| Welsh | 32 | 1.6% |
| Yup'ik | 4 | 0.2% | View All 35 Rows |
Immigrants in Willow
The most numerous immigrant groups reported in Willow came from Europe (25 | 1.3%), Latin America (16 | 0.8%), Eastern Europe (13 | 0.7%), Asia (10 | 0.5%), and Germany (10 | 0.5%), together accounting for 3.8% of all Willow residents.
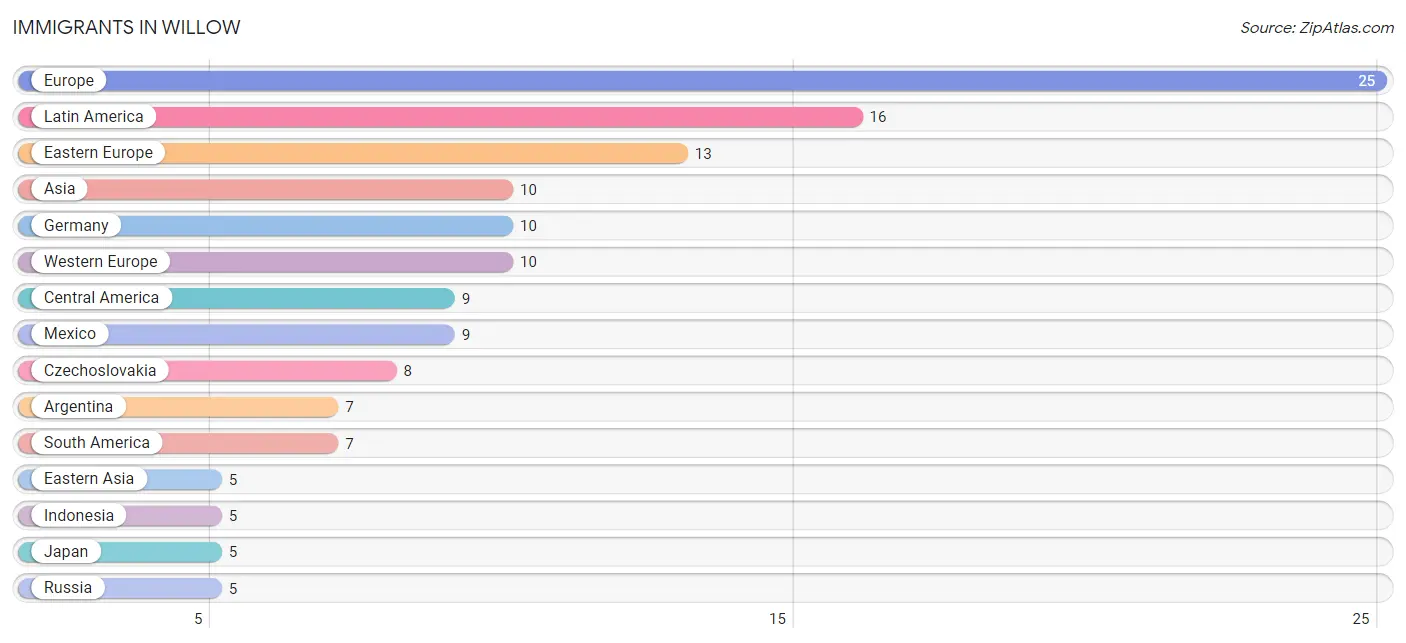
| Immigration Origin | # Population | % Population |
| Argentina | 7 | 0.4% |
| Asia | 10 | 0.5% |
| Canada | 4 | 0.2% |
| Central America | 9 | 0.5% |
| Czechoslovakia | 8 | 0.4% |
| Eastern Asia | 5 | 0.3% |
| Eastern Europe | 13 | 0.7% |
| Europe | 25 | 1.3% |
| Germany | 10 | 0.5% |
| Indonesia | 5 | 0.3% |
| Japan | 5 | 0.3% |
| Latin America | 16 | 0.8% |
| Mexico | 9 | 0.5% |
| Northern Europe | 2 | 0.1% |
| Russia | 5 | 0.3% |
| South America | 7 | 0.4% |
| South Eastern Asia | 5 | 0.3% |
| Western Europe | 10 | 0.5% | View All 18 Rows |
Sex and Age in Willow
Sex and Age in Willow
The most populous age groups in Willow are 60 to 64 Years (122 | 11.7%) for men and 15 to 19 Years (80 | 8.8%) for women.
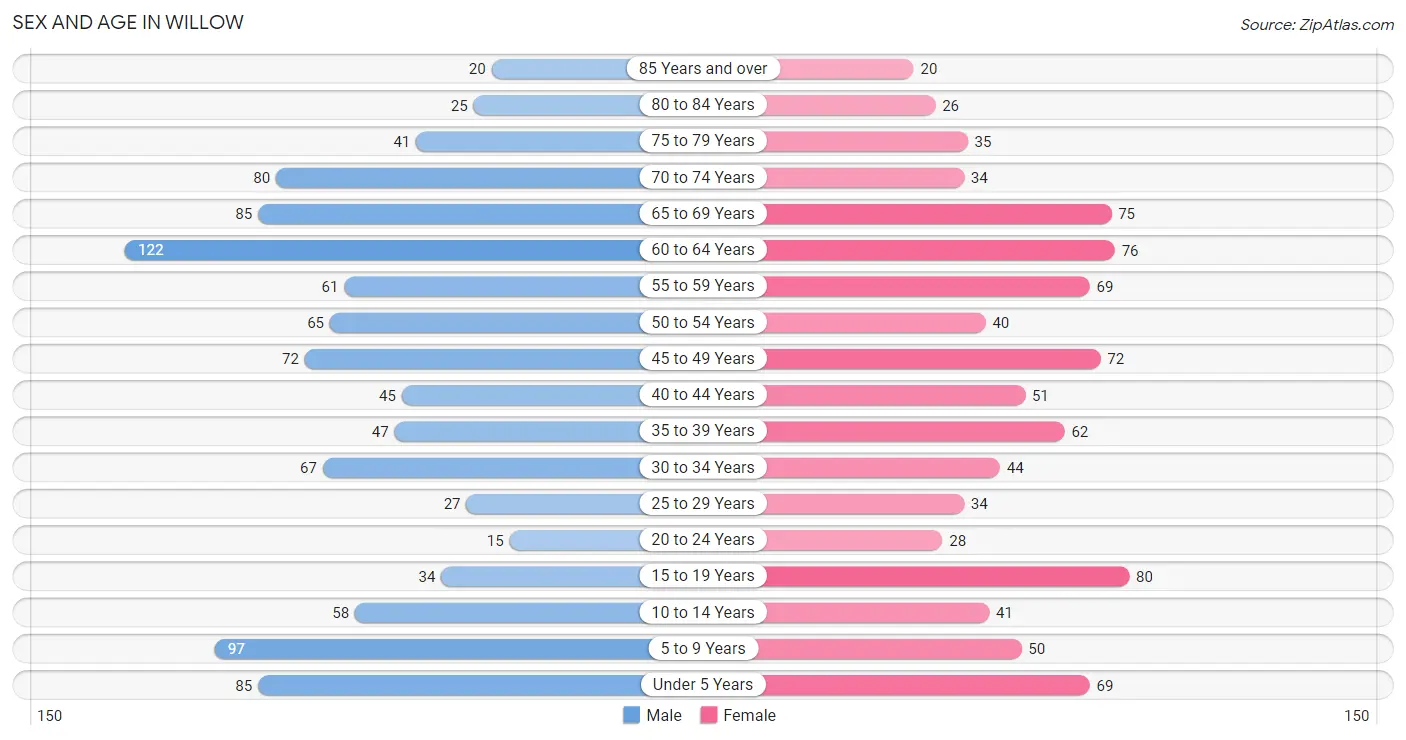
| Age Bracket | Male | Female |
| Under 5 Years | 85 (8.1%) | 69 (7.6%) |
| 5 to 9 Years | 97 (9.3%) | 50 (5.5%) |
| 10 to 14 Years | 58 (5.5%) | 41 (4.5%) |
| 15 to 19 Years | 34 (3.3%) | 80 (8.8%) |
| 20 to 24 Years | 15 (1.4%) | 28 (3.1%) |
| 25 to 29 Years | 27 (2.6%) | 34 (3.7%) |
| 30 to 34 Years | 67 (6.4%) | 44 (4.9%) |
| 35 to 39 Years | 47 (4.5%) | 62 (6.8%) |
| 40 to 44 Years | 45 (4.3%) | 51 (5.6%) |
| 45 to 49 Years | 72 (6.9%) | 72 (8.0%) |
| 50 to 54 Years | 65 (6.2%) | 40 (4.4%) |
| 55 to 59 Years | 61 (5.8%) | 69 (7.6%) |
| 60 to 64 Years | 122 (11.7%) | 76 (8.4%) |
| 65 to 69 Years | 85 (8.1%) | 75 (8.3%) |
| 70 to 74 Years | 80 (7.6%) | 34 (3.7%) |
| 75 to 79 Years | 41 (3.9%) | 35 (3.9%) |
| 80 to 84 Years | 25 (2.4%) | 26 (2.9%) |
| 85 Years and over | 20 (1.9%) | 20 (2.2%) |
| Total | 1,046 (100.0%) | 906 (100.0%) |
Families and Households in Willow
Median Family Size in Willow
The median family size in Willow is 3.00 persons per family, with single female/mother families (41 | 8.2%) accounting for the largest median family size of 4.17 persons per family. On the other hand, married-couple families (428 | 85.6%) represent the smallest median family size with 2.89 persons per family.
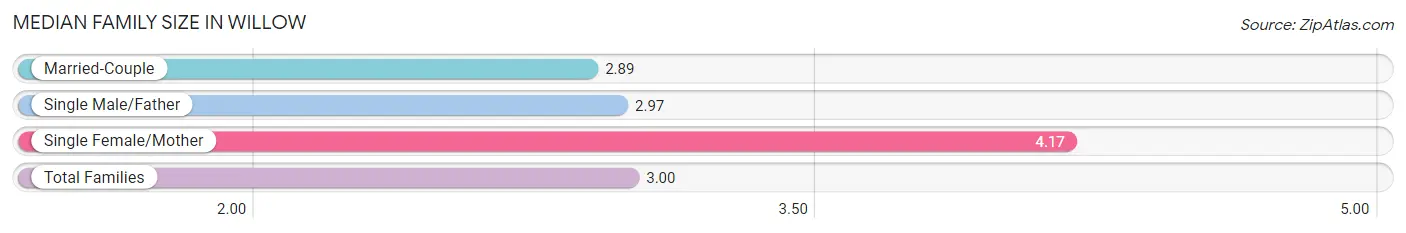
| Family Type | # Families | Family Size |
| Married-Couple | 428 (85.6%) | 2.89 |
| Single Male/Father | 31 (6.2%) | 2.97 |
| Single Female/Mother | 41 (8.2%) | 4.17 |
| Total Families | 500 (100.0%) | 3.00 |
Median Household Size in Willow
The median household size in Willow is 2.30 persons per household, with single female/mother households (41 | 4.9%) accounting for the largest median household size of 4.59 persons per household. non-family households (345 | 40.8%) represent the smallest median household size with 1.18 persons per household.
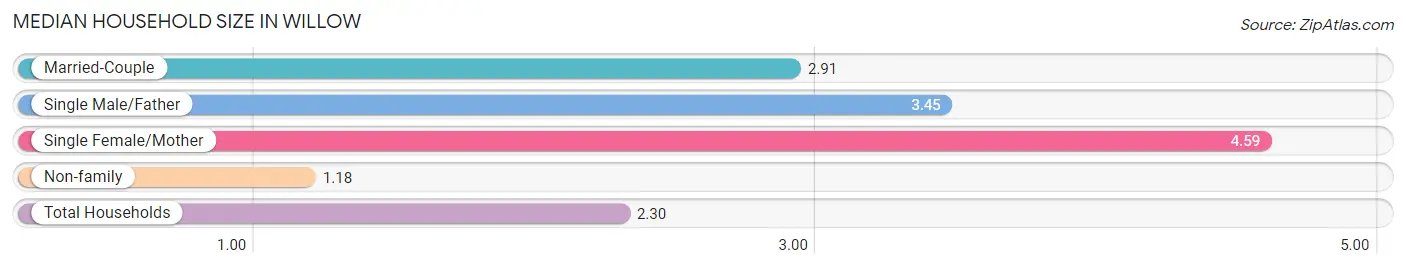
| Household Type | # Households | Household Size |
| Married-Couple | 428 (50.6%) | 2.91 |
| Single Male/Father | 31 (3.7%) | 3.45 |
| Single Female/Mother | 41 (4.9%) | 4.59 |
| Non-family | 345 (40.8%) | 1.18 |
| Total Households | 845 (100.0%) | 2.30 |
Household Size by Marriage Status in Willow
Out of a total of 845 households in Willow, 500 (59.2%) are family households, while 345 (40.8%) are nonfamily households. The most numerous type of family households are 2-person households, comprising 234, and the most common type of nonfamily households are 1-person households, comprising 293.
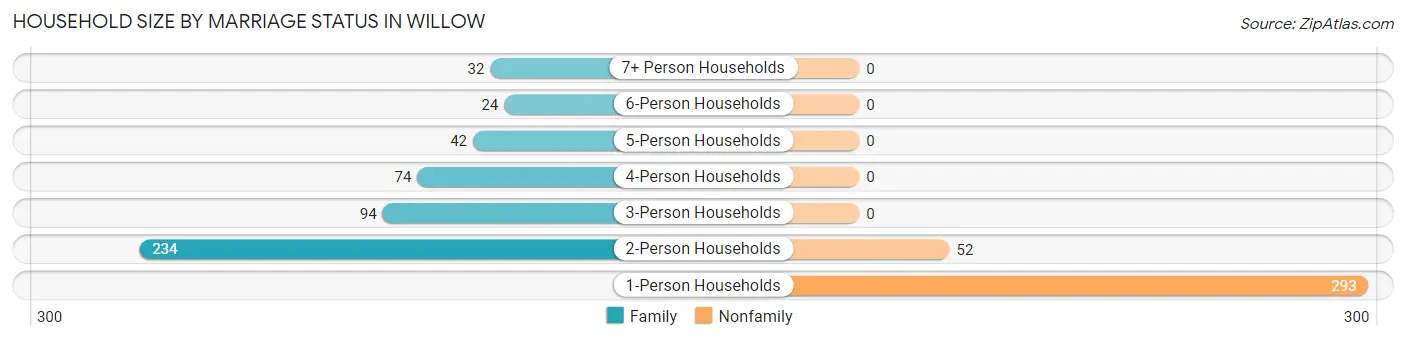
| Household Size | Family Households | Nonfamily Households |
| 1-Person Households | - | 293 (34.7%) |
| 2-Person Households | 234 (27.7%) | 52 (6.1%) |
| 3-Person Households | 94 (11.1%) | 0 (0.0%) |
| 4-Person Households | 74 (8.8%) | 0 (0.0%) |
| 5-Person Households | 42 (5.0%) | 0 (0.0%) |
| 6-Person Households | 24 (2.8%) | 0 (0.0%) |
| 7+ Person Households | 32 (3.8%) | 0 (0.0%) |
| Total | 500 (59.2%) | 345 (40.8%) |
Female Fertility in Willow
Fertility by Age in Willow
Average fertility rate in Willow is 32.0 births per 1,000 women. Women in the age bracket of 20 to 34 years have the highest fertility rate with 57.0 births per 1,000 women. Women in the age bracket of 20 to 34 years acount for 50.0% of all women with births.
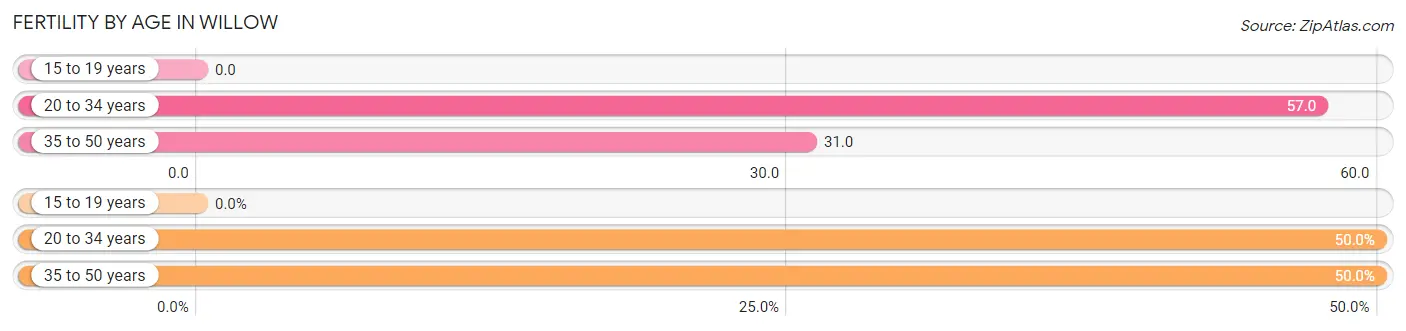
| Age Bracket | Women with Births | Births / 1,000 Women |
| 15 to 19 years | 0 (0.0%) | 0.0 |
| 20 to 34 years | 6 (50.0%) | 57.0 |
| 35 to 50 years | 6 (50.0%) | 31.0 |
| Total | 12 (100.0%) | 32.0 |
Fertility by Age by Marriage Status in Willow
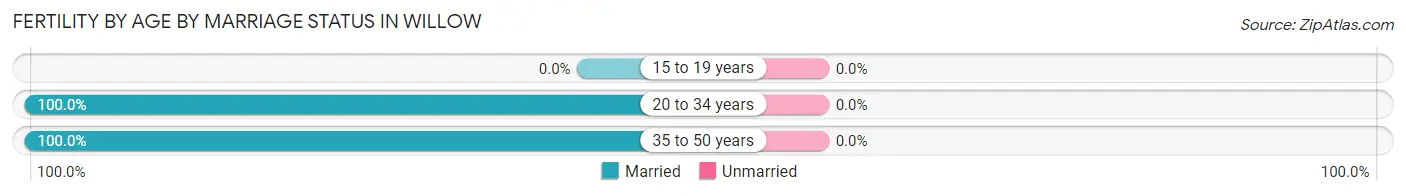
| Age Bracket | Married | Unmarried |
| 15 to 19 years | 0 (0.0%) | 0 (0.0%) |
| 20 to 34 years | 6 (100.0%) | 0 (0.0%) |
| 35 to 50 years | 6 (100.0%) | 0 (0.0%) |
| Total | 12 (100.0%) | 0 (0.0%) |
Fertility by Education in Willow
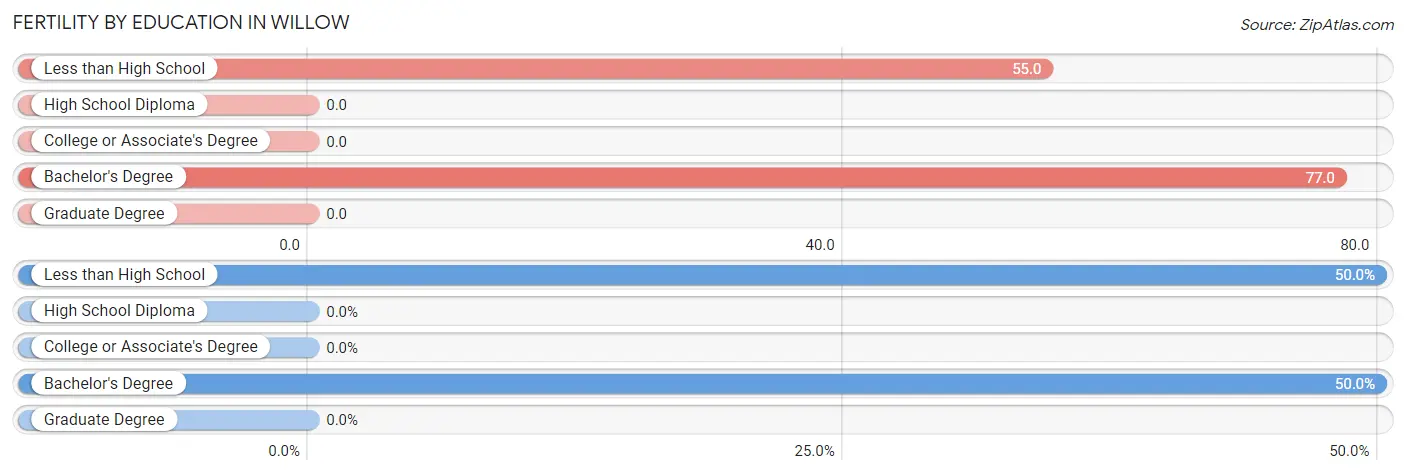
| Educational Attainment | Women with Births | Births / 1,000 Women |
| Less than High School | 6 (50.0%) | 55.0 |
| High School Diploma | 0 (0.0%) | 0.0 |
| College or Associate's Degree | 0 (0.0%) | 0.0 |
| Bachelor's Degree | 6 (50.0%) | 77.0 |
| Graduate Degree | 0 (0.0%) | 0.0 |
| Total | 12 (100.0%) | 32.0 |
Fertility by Education by Marriage Status in Willow
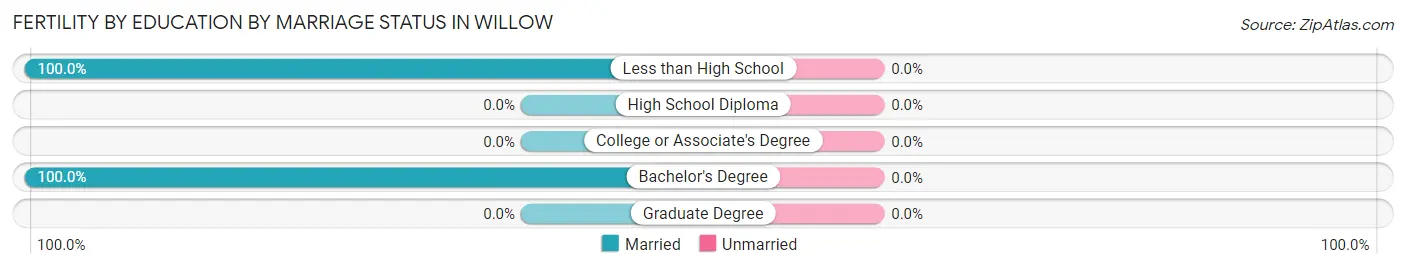
| Educational Attainment | Married | Unmarried |
| Less than High School | 6 (100.0%) | 0 (0.0%) |
| High School Diploma | 0 (0.0%) | 0 (0.0%) |
| College or Associate's Degree | 0 (0.0%) | 0 (0.0%) |
| Bachelor's Degree | 6 (100.0%) | 0 (0.0%) |
| Graduate Degree | 0 (0.0%) | 0 (0.0%) |
| Total | 12 (100.0%) | 0 (0.0%) |
Employment Characteristics in Willow
Employment by Class of Employer in Willow
Among the 597 employed individuals in Willow, private company employees (411 | 68.8%), state government employees (46 | 7.7%), and not-for-profit organizations (43 | 7.2%) make up the most common classes of employment.
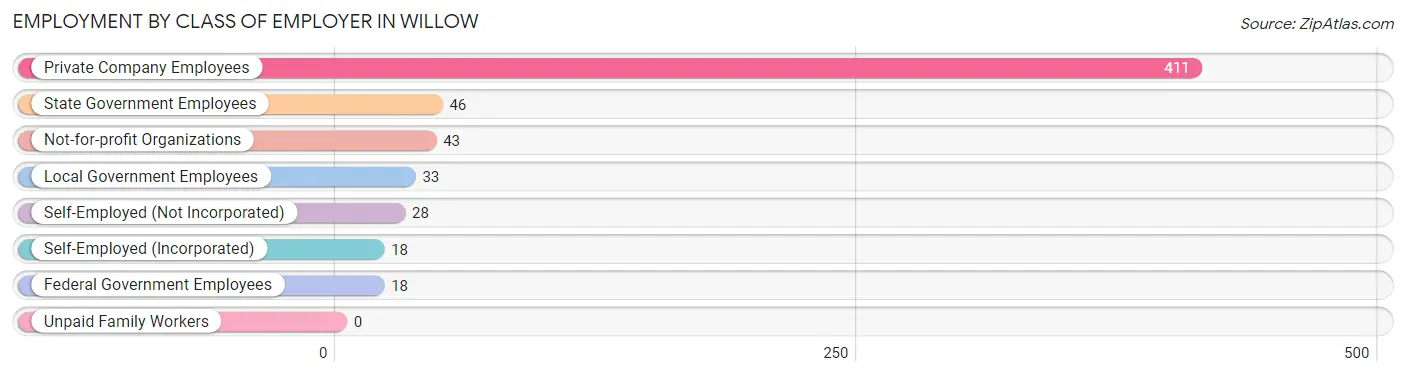
| Employer Class | # Employees | % Employees |
| Private Company Employees | 411 | 68.8% |
| Self-Employed (Incorporated) | 18 | 3.0% |
| Self-Employed (Not Incorporated) | 28 | 4.7% |
| Not-for-profit Organizations | 43 | 7.2% |
| Local Government Employees | 33 | 5.5% |
| State Government Employees | 46 | 7.7% |
| Federal Government Employees | 18 | 3.0% |
| Unpaid Family Workers | 0 | 0.0% |
| Total | 597 | 100.0% |
Employment Status by Age in Willow
According to the labor force statistics for Willow, out of the total population over 16 years of age (1,499), 45.4% or 681 individuals are in the labor force, with 7.9% or 54 of them unemployed. The age group with the highest labor force participation rate is 20 to 24 years, with 100.0% or 43 individuals in the labor force. Within the labor force, the 16 to 19 years age range has the highest percentage of unemployed individuals, with 27.3% or 6 of them being unemployed.
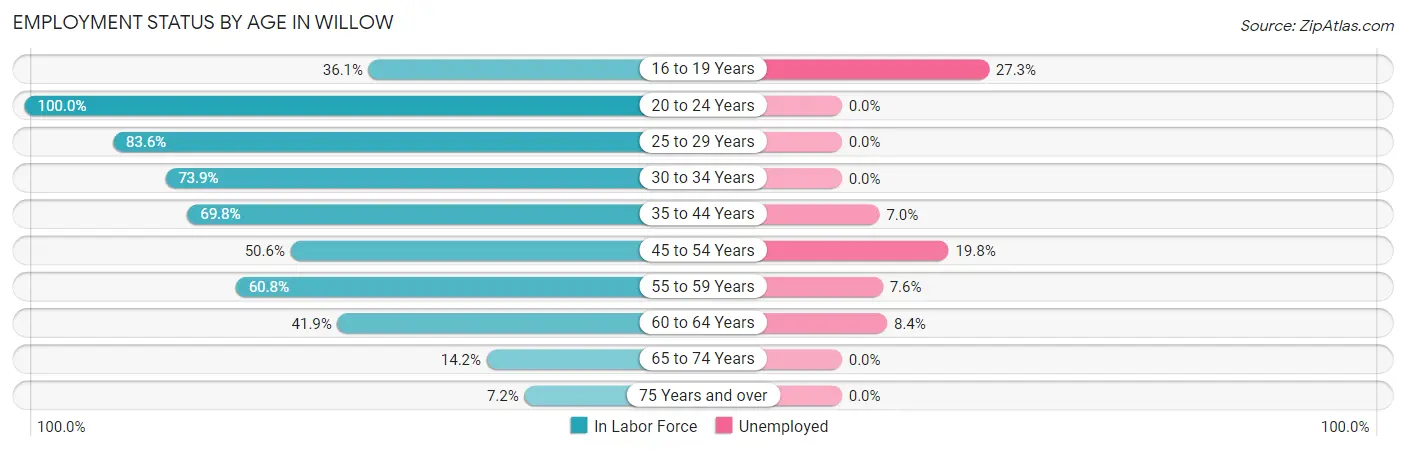
| Age Bracket | In Labor Force | Unemployed |
| 16 to 19 Years | 22 (36.1%) | 6 (27.3%) |
| 20 to 24 Years | 43 (100.0%) | 0 (0.0%) |
| 25 to 29 Years | 51 (83.6%) | 0 (0.0%) |
| 30 to 34 Years | 82 (73.9%) | 0 (0.0%) |
| 35 to 44 Years | 143 (69.8%) | 10 (7.0%) |
| 45 to 54 Years | 126 (50.6%) | 25 (19.8%) |
| 55 to 59 Years | 79 (60.8%) | 6 (7.6%) |
| 60 to 64 Years | 83 (41.9%) | 7 (8.4%) |
| 65 to 74 Years | 39 (14.2%) | 0 (0.0%) |
| 75 Years and over | 12 (7.2%) | 0 (0.0%) |
| Total | 681 (45.4%) | 54 (7.9%) |
Employment Status by Educational Attainment in Willow
According to labor force statistics for Willow, 59.1% of individuals (564) out of the total population between 25 and 64 years of age (954) are in the labor force, with 8.5% or 48 of them being unemployed. The group with the highest labor force participation rate are those with the educational attainment of high school diploma, with 65.1% or 188 individuals in the labor force. Within the labor force, individuals with bachelor's degree or higher education have the highest percentage of unemployment, with 22.6% or 30 of them being unemployed.
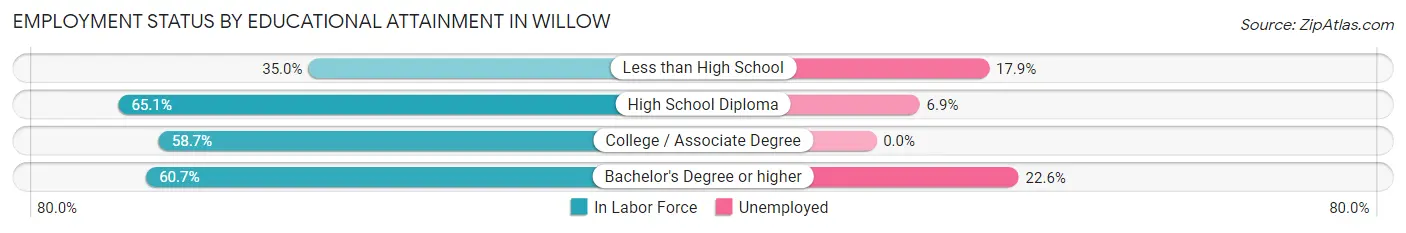
| Educational Attainment | In Labor Force | Unemployed |
| Less than High School | 28 (35.0%) | 14 (17.9%) |
| High School Diploma | 188 (65.1%) | 20 (6.9%) |
| College / Associate Degree | 215 (58.7%) | 0 (0.0%) |
| Bachelor's Degree or higher | 133 (60.7%) | 49 (22.6%) |
| Total | 564 (59.1%) | 81 (8.5%) |
Employment Occupations by Sex in Willow
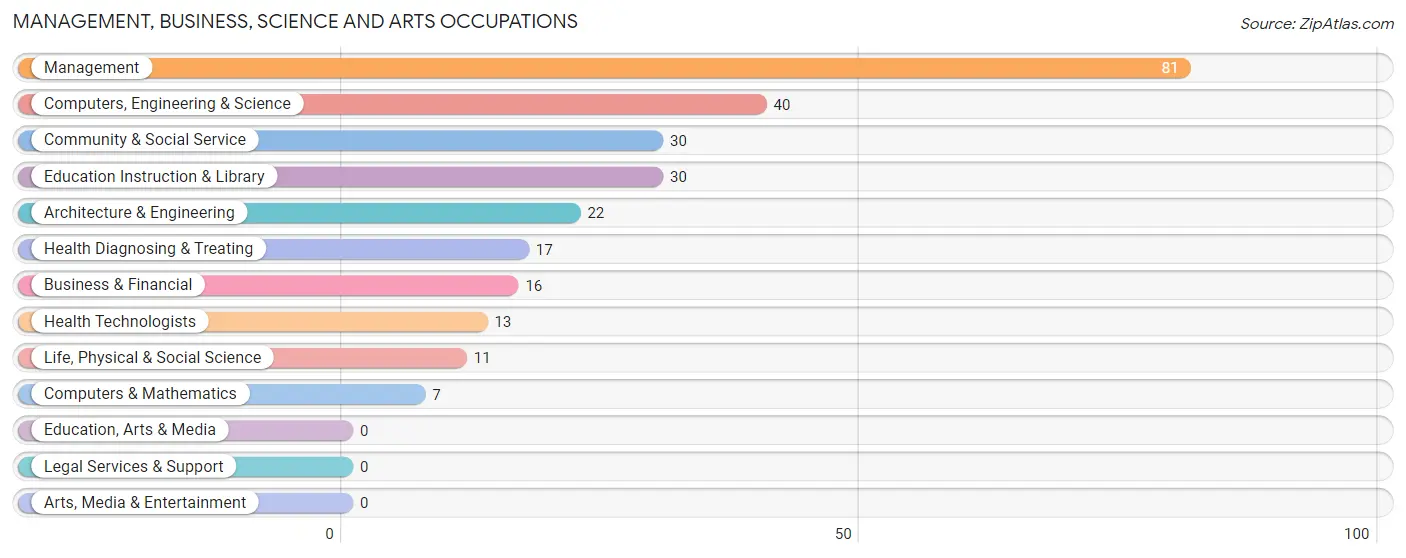
Management, Business, Science and Arts Occupations
The most common Management, Business, Science and Arts occupations in Willow are Management (81 | 12.9%), Computers, Engineering & Science (40 | 6.4%), Community & Social Service (30 | 4.8%), Education Instruction & Library (30 | 4.8%), and Architecture & Engineering (22 | 3.5%).
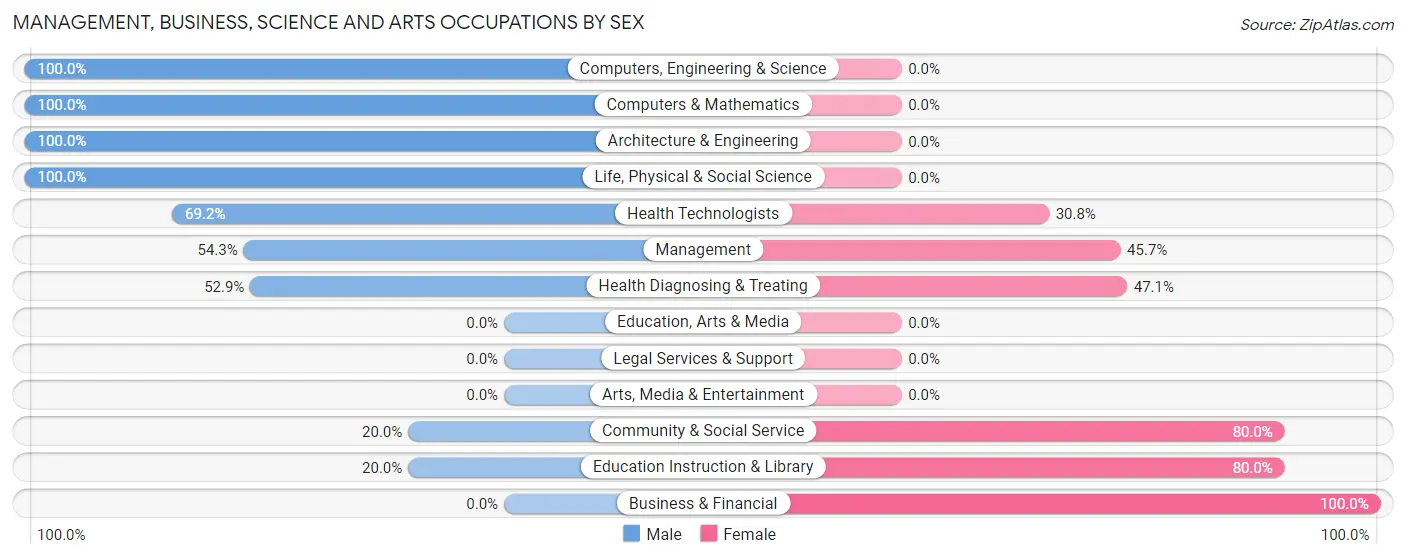
Management, Business, Science and Arts Occupations by Sex
Within the Management, Business, Science and Arts occupations in Willow, the most male-oriented occupations are Computers, Engineering & Science (100.0%), Computers & Mathematics (100.0%), and Architecture & Engineering (100.0%), while the most female-oriented occupations are Business & Financial (100.0%), Community & Social Service (80.0%), and Education Instruction & Library (80.0%).
| Occupation | Male | Female |
| Management | 44 (54.3%) | 37 (45.7%) |
| Business & Financial | 0 (0.0%) | 16 (100.0%) |
| Computers, Engineering & Science | 40 (100.0%) | 0 (0.0%) |
| Computers & Mathematics | 7 (100.0%) | 0 (0.0%) |
| Architecture & Engineering | 22 (100.0%) | 0 (0.0%) |
| Life, Physical & Social Science | 11 (100.0%) | 0 (0.0%) |
| Community & Social Service | 6 (20.0%) | 24 (80.0%) |
| Education, Arts & Media | 0 (0.0%) | 0 (0.0%) |
| Legal Services & Support | 0 (0.0%) | 0 (0.0%) |
| Education Instruction & Library | 6 (20.0%) | 24 (80.0%) |
| Arts, Media & Entertainment | 0 (0.0%) | 0 (0.0%) |
| Health Diagnosing & Treating | 9 (52.9%) | 8 (47.1%) |
| Health Technologists | 9 (69.2%) | 4 (30.8%) |
| Total (Category) | 99 (53.8%) | 85 (46.2%) |
| Total (Overall) | 376 (60.1%) | 250 (39.9%) |
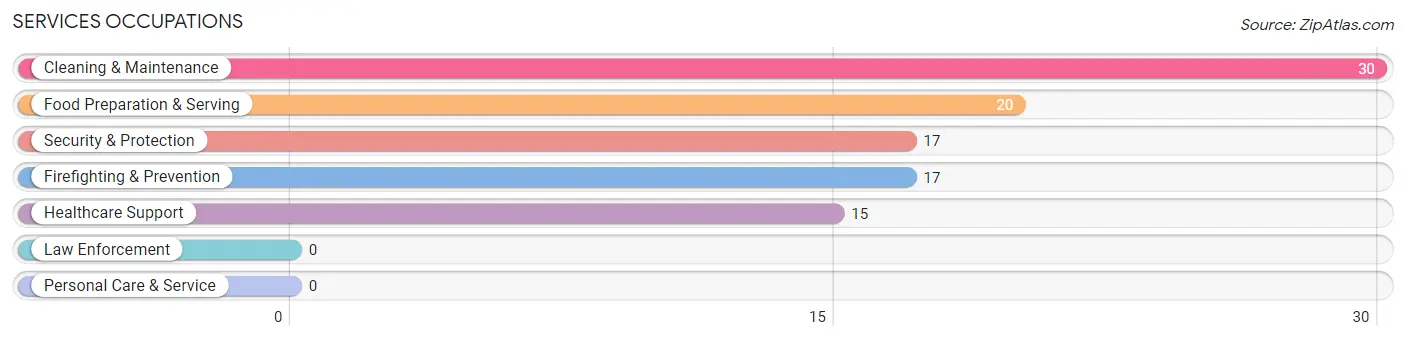
Services Occupations
The most common Services occupations in Willow are Cleaning & Maintenance (30 | 4.8%), Food Preparation & Serving (20 | 3.2%), Security & Protection (17 | 2.7%), Firefighting & Prevention (17 | 2.7%), and Healthcare Support (15 | 2.4%).
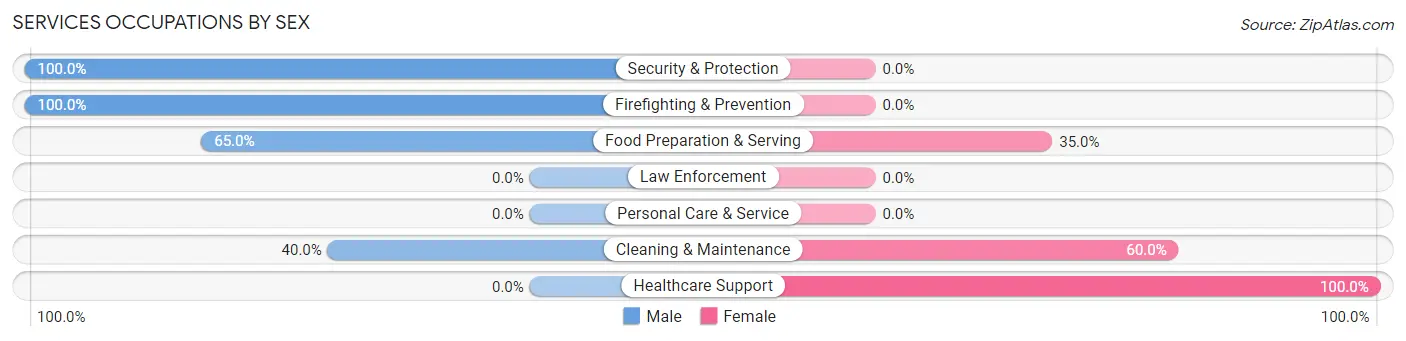
Services Occupations by Sex
Within the Services occupations in Willow, the most male-oriented occupations are Security & Protection (100.0%), Firefighting & Prevention (100.0%), and Food Preparation & Serving (65.0%), while the most female-oriented occupations are Healthcare Support (100.0%), Cleaning & Maintenance (60.0%), and Food Preparation & Serving (35.0%).
| Occupation | Male | Female |
| Healthcare Support | 0 (0.0%) | 15 (100.0%) |
| Security & Protection | 17 (100.0%) | 0 (0.0%) |
| Firefighting & Prevention | 17 (100.0%) | 0 (0.0%) |
| Law Enforcement | 0 (0.0%) | 0 (0.0%) |
| Food Preparation & Serving | 13 (65.0%) | 7 (35.0%) |
| Cleaning & Maintenance | 12 (40.0%) | 18 (60.0%) |
| Personal Care & Service | 0 (0.0%) | 0 (0.0%) |
| Total (Category) | 42 (51.2%) | 40 (48.8%) |
| Total (Overall) | 376 (60.1%) | 250 (39.9%) |
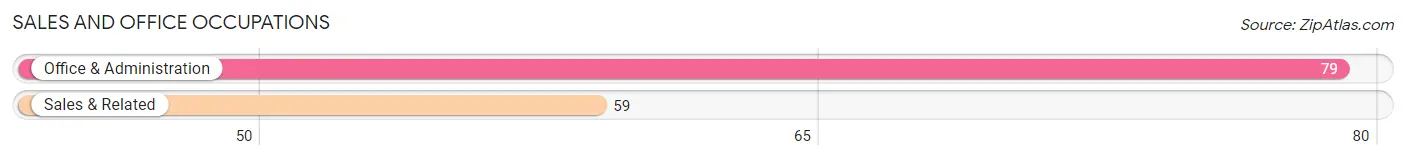
Sales and Office Occupations
The most common Sales and Office occupations in Willow are Office & Administration (79 | 12.6%), and Sales & Related (59 | 9.4%).
Sales and Office Occupations by Sex
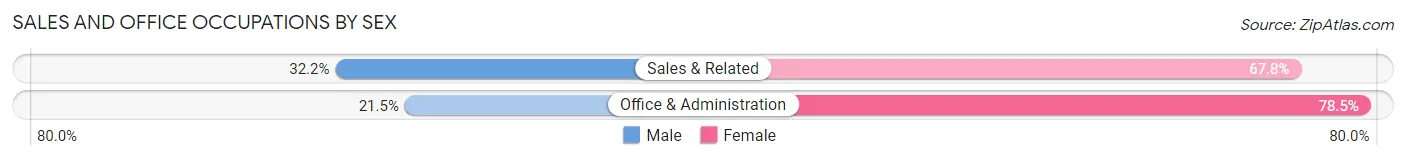
| Occupation | Male | Female |
| Sales & Related | 19 (32.2%) | 40 (67.8%) |
| Office & Administration | 17 (21.5%) | 62 (78.5%) |
| Total (Category) | 36 (26.1%) | 102 (73.9%) |
| Total (Overall) | 376 (60.1%) | 250 (39.9%) |
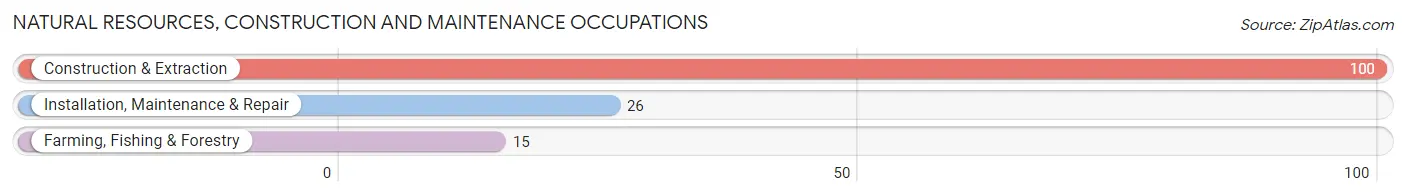
Natural Resources, Construction and Maintenance Occupations
The most common Natural Resources, Construction and Maintenance occupations in Willow are Construction & Extraction (100 | 16.0%), Installation, Maintenance & Repair (26 | 4.2%), and Farming, Fishing & Forestry (15 | 2.4%).
Natural Resources, Construction and Maintenance Occupations by Sex
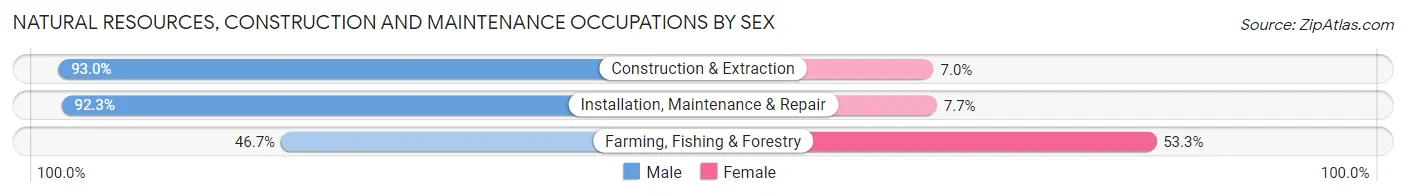
| Occupation | Male | Female |
| Farming, Fishing & Forestry | 7 (46.7%) | 8 (53.3%) |
| Construction & Extraction | 93 (93.0%) | 7 (7.0%) |
| Installation, Maintenance & Repair | 24 (92.3%) | 2 (7.7%) |
| Total (Category) | 124 (87.9%) | 17 (12.1%) |
| Total (Overall) | 376 (60.1%) | 250 (39.9%) |
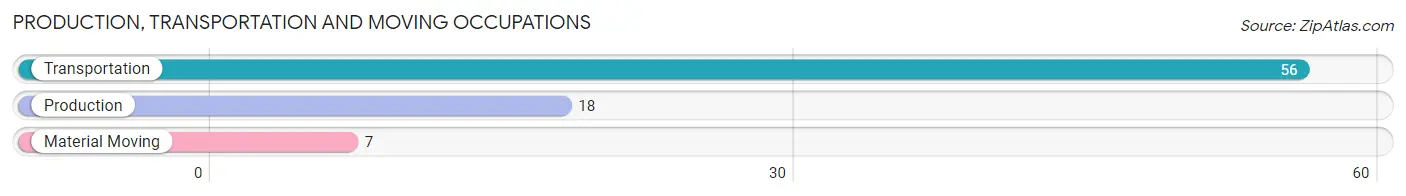
Production, Transportation and Moving Occupations
The most common Production, Transportation and Moving occupations in Willow are Transportation (56 | 8.9%), Production (18 | 2.9%), and Material Moving (7 | 1.1%).
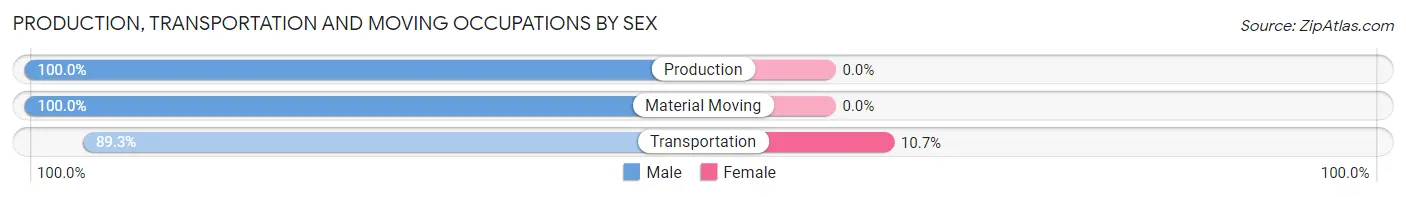
Production, Transportation and Moving Occupations by Sex
| Occupation | Male | Female |
| Production | 18 (100.0%) | 0 (0.0%) |
| Transportation | 50 (89.3%) | 6 (10.7%) |
| Material Moving | 7 (100.0%) | 0 (0.0%) |
| Total (Category) | 75 (92.6%) | 6 (7.4%) |
| Total (Overall) | 376 (60.1%) | 250 (39.9%) |
Employment Industries by Sex in Willow
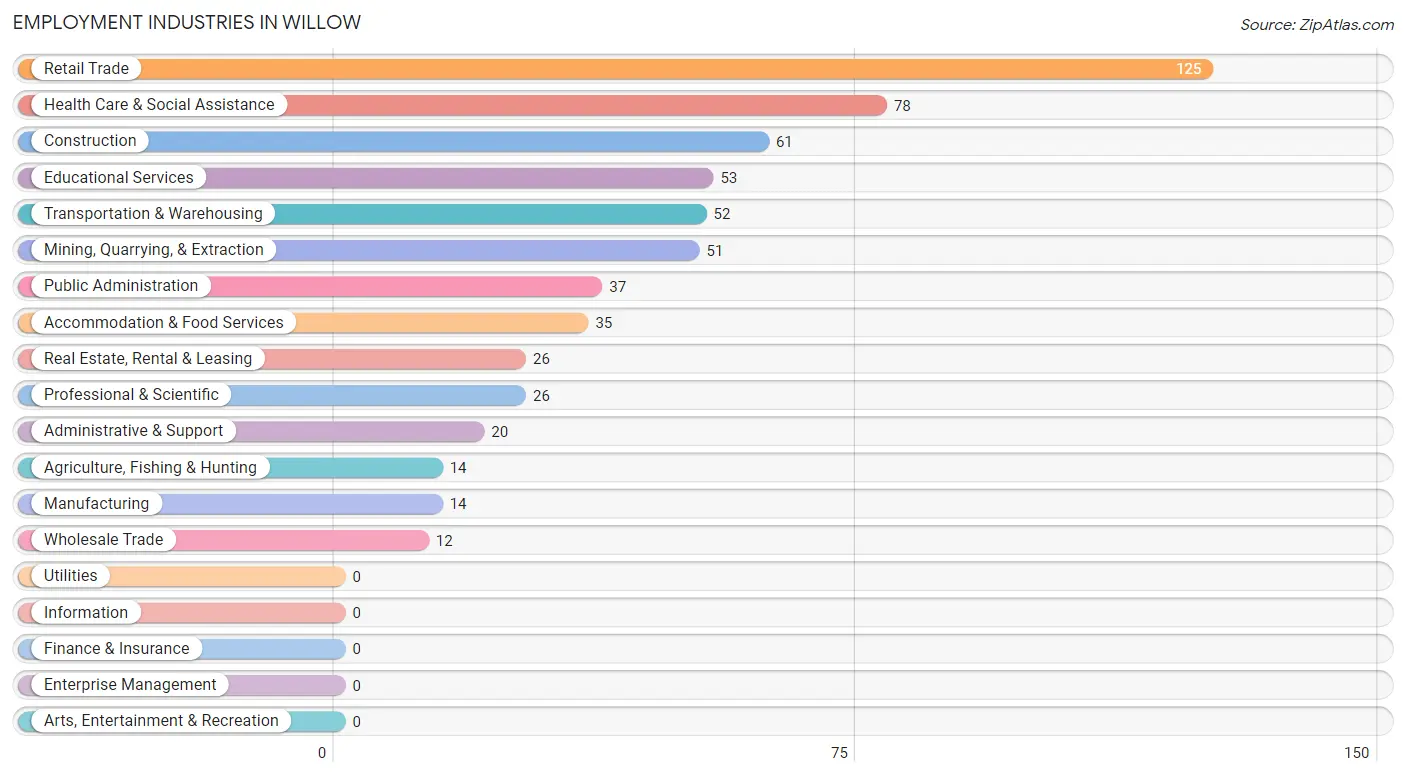
Employment Industries in Willow
The major employment industries in Willow include Retail Trade (125 | 20.0%), Health Care & Social Assistance (78 | 12.5%), Construction (61 | 9.7%), Educational Services (53 | 8.5%), and Transportation & Warehousing (52 | 8.3%).
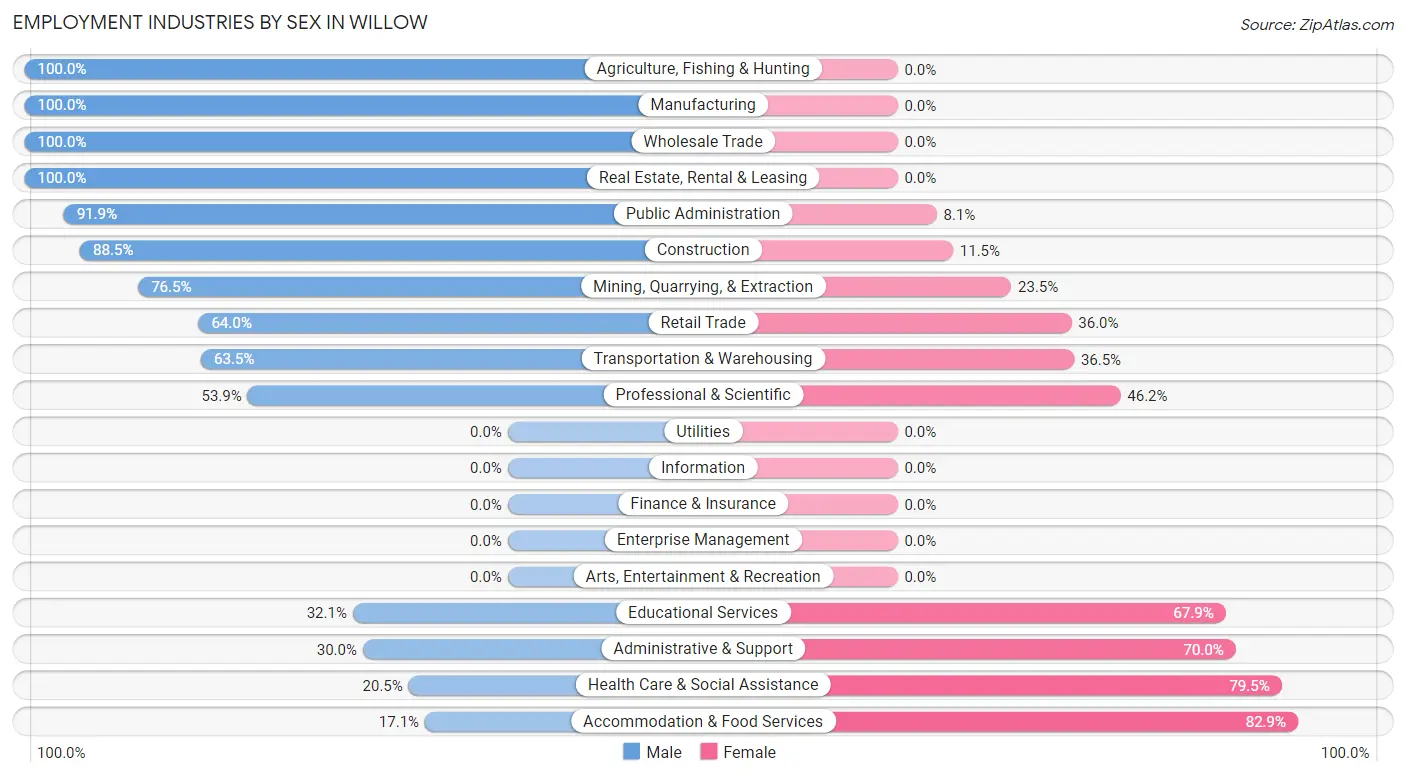
Employment Industries by Sex in Willow
The Willow industries that see more men than women are Agriculture, Fishing & Hunting (100.0%), Manufacturing (100.0%), and Wholesale Trade (100.0%), whereas the industries that tend to have a higher number of women are Accommodation & Food Services (82.9%), Health Care & Social Assistance (79.5%), and Administrative & Support (70.0%).
| Industry | Male | Female |
| Agriculture, Fishing & Hunting | 14 (100.0%) | 0 (0.0%) |
| Mining, Quarrying, & Extraction | 39 (76.5%) | 12 (23.5%) |
| Construction | 54 (88.5%) | 7 (11.5%) |
| Manufacturing | 14 (100.0%) | 0 (0.0%) |
| Wholesale Trade | 12 (100.0%) | 0 (0.0%) |
| Retail Trade | 80 (64.0%) | 45 (36.0%) |
| Transportation & Warehousing | 33 (63.5%) | 19 (36.5%) |
| Utilities | 0 (0.0%) | 0 (0.0%) |
| Information | 0 (0.0%) | 0 (0.0%) |
| Finance & Insurance | 0 (0.0%) | 0 (0.0%) |
| Real Estate, Rental & Leasing | 26 (100.0%) | 0 (0.0%) |
| Professional & Scientific | 14 (53.8%) | 12 (46.2%) |
| Enterprise Management | 0 (0.0%) | 0 (0.0%) |
| Administrative & Support | 6 (30.0%) | 14 (70.0%) |
| Educational Services | 17 (32.1%) | 36 (67.9%) |
| Health Care & Social Assistance | 16 (20.5%) | 62 (79.5%) |
| Arts, Entertainment & Recreation | 0 (0.0%) | 0 (0.0%) |
| Accommodation & Food Services | 6 (17.1%) | 29 (82.9%) |
| Public Administration | 34 (91.9%) | 3 (8.1%) |
| Total | 376 (60.1%) | 250 (39.9%) |
Education in Willow
School Enrollment in Willow
The most common levels of schooling among the 409 students in Willow are elementary school (112 | 27.4%), high school (112 | 27.4%), and middle school (71 | 17.4%).
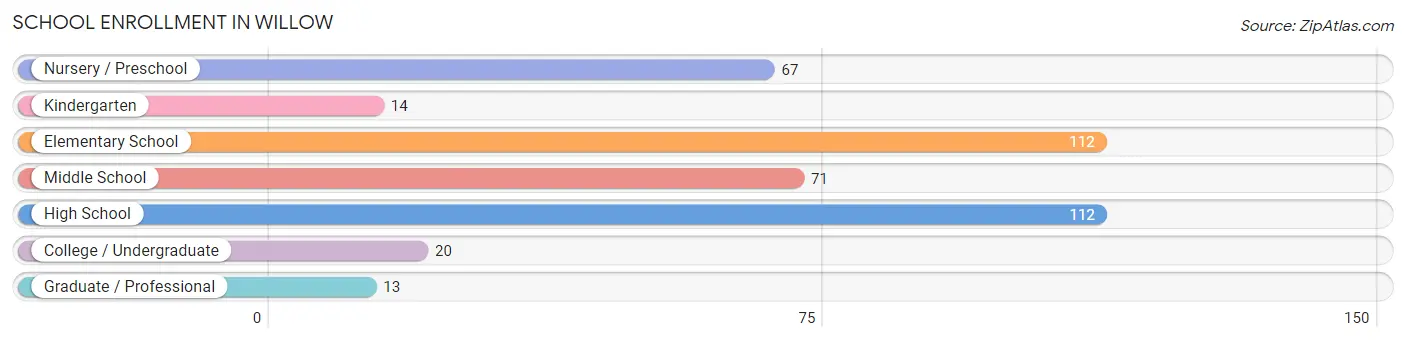
| School Level | # Students | % Students |
| Nursery / Preschool | 67 | 16.4% |
| Kindergarten | 14 | 3.4% |
| Elementary School | 112 | 27.4% |
| Middle School | 71 | 17.4% |
| High School | 112 | 27.4% |
| College / Undergraduate | 20 | 4.9% |
| Graduate / Professional | 13 | 3.2% |
| Total | 409 | 100.0% |
School Enrollment by Age by Funding Source in Willow
Out of a total of 409 students who are enrolled in schools in Willow, 36 (8.8%) attend a private institution, while the remaining 373 (91.2%) are enrolled in public schools. The age group of 35 years and over has the highest likelihood of being enrolled in private schools, with 4 (30.8% in the age bracket) enrolled. Conversely, the age group of 3 to 4 year olds has the lowest likelihood of being enrolled in a private school, with 32 (100.0% in the age bracket) attending a public institution.
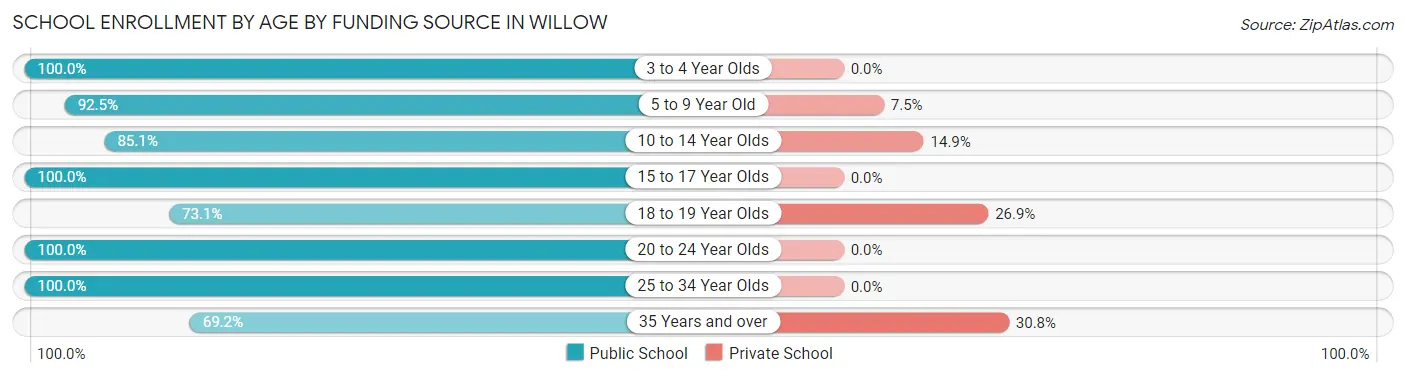
| Age Bracket | Public School | Private School |
| 3 to 4 Year Olds | 32 (100.0%) | 0 (0.0%) |
| 5 to 9 Year Old | 136 (92.5%) | 11 (7.5%) |
| 10 to 14 Year Olds | 80 (85.1%) | 14 (14.9%) |
| 15 to 17 Year Olds | 77 (100.0%) | 0 (0.0%) |
| 18 to 19 Year Olds | 19 (73.1%) | 7 (26.9%) |
| 20 to 24 Year Olds | 13 (100.0%) | 0 (0.0%) |
| 25 to 34 Year Olds | 7 (100.0%) | 0 (0.0%) |
| 35 Years and over | 9 (69.2%) | 4 (30.8%) |
| Total | 373 (91.2%) | 36 (8.8%) |
Educational Attainment by Field of Study in Willow
Education (62 | 19.1%), engineering (51 | 15.7%), bio, nature & agricultural (45 | 13.9%), literature & languages (39 | 12.0%), and science & technology (35 | 10.8%) are the most common fields of study among 324 individuals in Willow who have obtained a bachelor's degree or higher.
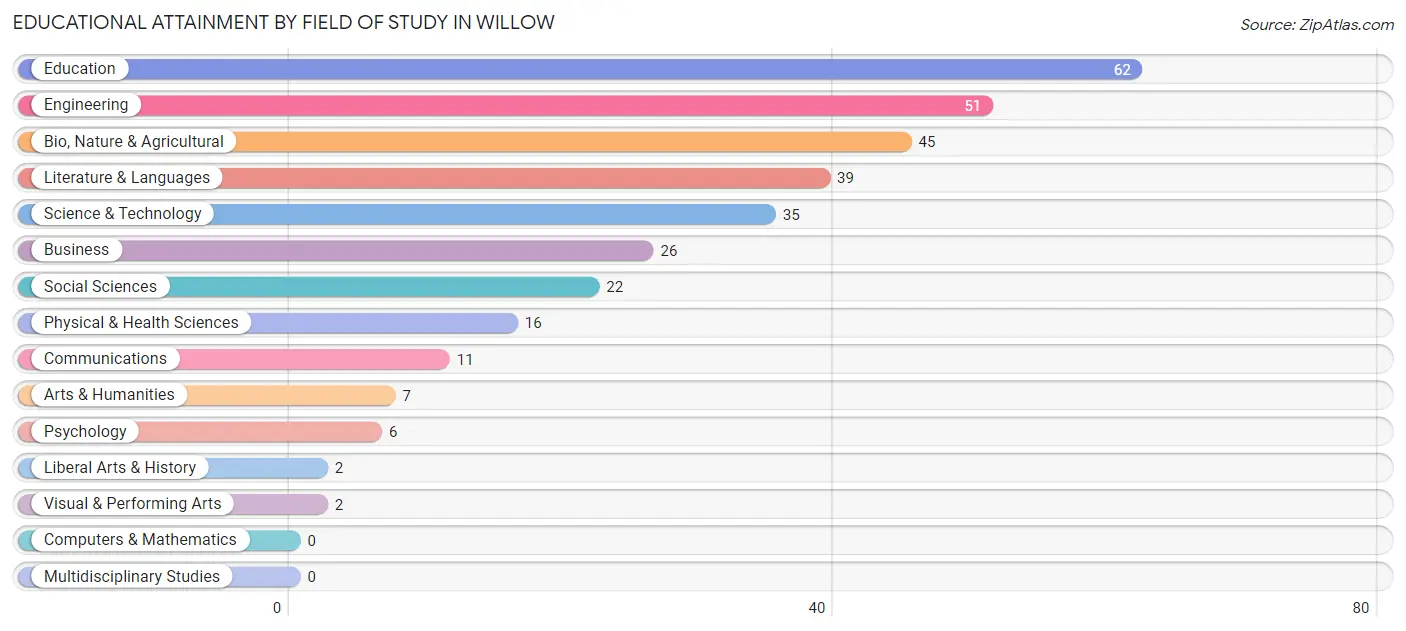
| Field of Study | # Graduates | % Graduates |
| Computers & Mathematics | 0 | 0.0% |
| Bio, Nature & Agricultural | 45 | 13.9% |
| Physical & Health Sciences | 16 | 4.9% |
| Psychology | 6 | 1.8% |
| Social Sciences | 22 | 6.8% |
| Engineering | 51 | 15.7% |
| Multidisciplinary Studies | 0 | 0.0% |
| Science & Technology | 35 | 10.8% |
| Business | 26 | 8.0% |
| Education | 62 | 19.1% |
| Literature & Languages | 39 | 12.0% |
| Liberal Arts & History | 2 | 0.6% |
| Visual & Performing Arts | 2 | 0.6% |
| Communications | 11 | 3.4% |
| Arts & Humanities | 7 | 2.2% |
| Total | 324 | 100.0% |
Transportation & Commute in Willow
Vehicle Availability by Sex in Willow
The most prevalent vehicle ownership categories in Willow are males with 2 vehicles (133, accounting for 35.9%) and females with 2 vehicles (105, making up 58.6%).
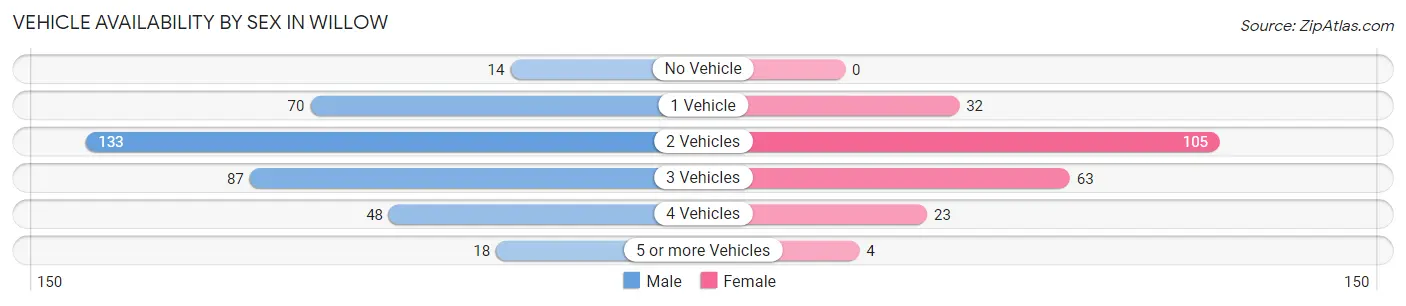
| Vehicles Available | Male | Female |
| No Vehicle | 14 (3.8%) | 0 (0.0%) |
| 1 Vehicle | 70 (18.9%) | 32 (14.1%) |
| 2 Vehicles | 133 (35.9%) | 105 (46.3%) |
| 3 Vehicles | 87 (23.5%) | 63 (27.8%) |
| 4 Vehicles | 48 (13.0%) | 23 (10.1%) |
| 5 or more Vehicles | 18 (4.9%) | 4 (1.8%) |
| Total | 370 (100.0%) | 227 (100.0%) |
Commute Time in Willow
The most frequently occuring commute durations in Willow are 90 or more minutes (117 commuters, 21.3%), 60 to 89 minutes (107 commuters, 19.5%), and 45 to 59 minutes (74 commuters, 13.5%).
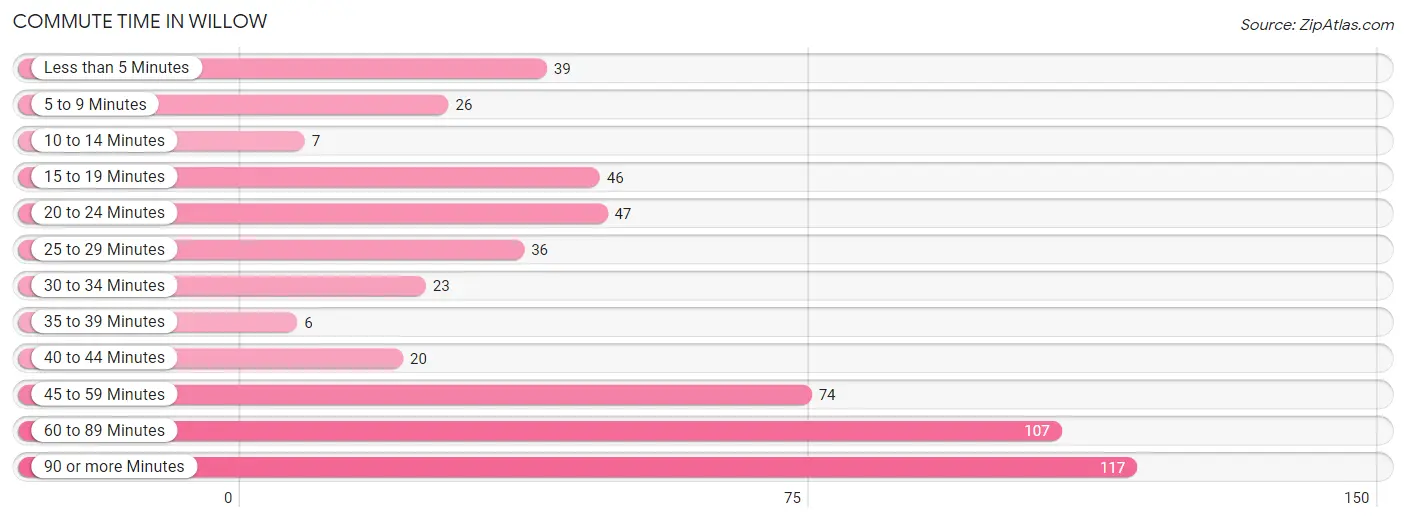
| Commute Time | # Commuters | % Commuters |
| Less than 5 Minutes | 39 | 7.1% |
| 5 to 9 Minutes | 26 | 4.7% |
| 10 to 14 Minutes | 7 | 1.3% |
| 15 to 19 Minutes | 46 | 8.4% |
| 20 to 24 Minutes | 47 | 8.6% |
| 25 to 29 Minutes | 36 | 6.6% |
| 30 to 34 Minutes | 23 | 4.2% |
| 35 to 39 Minutes | 6 | 1.1% |
| 40 to 44 Minutes | 20 | 3.6% |
| 45 to 59 Minutes | 74 | 13.5% |
| 60 to 89 Minutes | 107 | 19.5% |
| 90 or more Minutes | 117 | 21.3% |
Commute Time by Sex in Willow
The most common commute times in Willow are 60 to 89 minutes (101 commuters, 30.2%) for males and 45 to 59 minutes (39 commuters, 18.2%) for females.
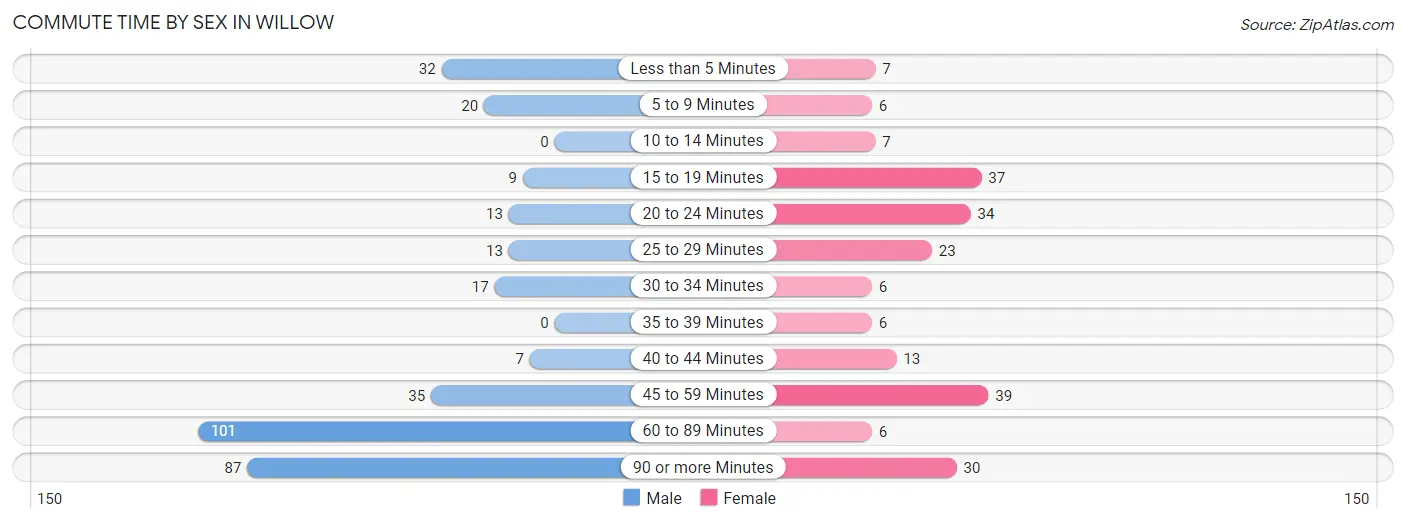
| Commute Time | Male | Female |
| Less than 5 Minutes | 32 (9.6%) | 7 (3.3%) |
| 5 to 9 Minutes | 20 (6.0%) | 6 (2.8%) |
| 10 to 14 Minutes | 0 (0.0%) | 7 (3.3%) |
| 15 to 19 Minutes | 9 (2.7%) | 37 (17.3%) |
| 20 to 24 Minutes | 13 (3.9%) | 34 (15.9%) |
| 25 to 29 Minutes | 13 (3.9%) | 23 (10.7%) |
| 30 to 34 Minutes | 17 (5.1%) | 6 (2.8%) |
| 35 to 39 Minutes | 0 (0.0%) | 6 (2.8%) |
| 40 to 44 Minutes | 7 (2.1%) | 13 (6.1%) |
| 45 to 59 Minutes | 35 (10.5%) | 39 (18.2%) |
| 60 to 89 Minutes | 101 (30.2%) | 6 (2.8%) |
| 90 or more Minutes | 87 (26.1%) | 30 (14.0%) |
Time of Departure to Work by Sex in Willow
The most frequent times of departure to work in Willow are 7:00 AM to 7:29 AM (74, 22.2%) for males and 7:30 AM to 7:59 AM (62, 29.0%) for females.
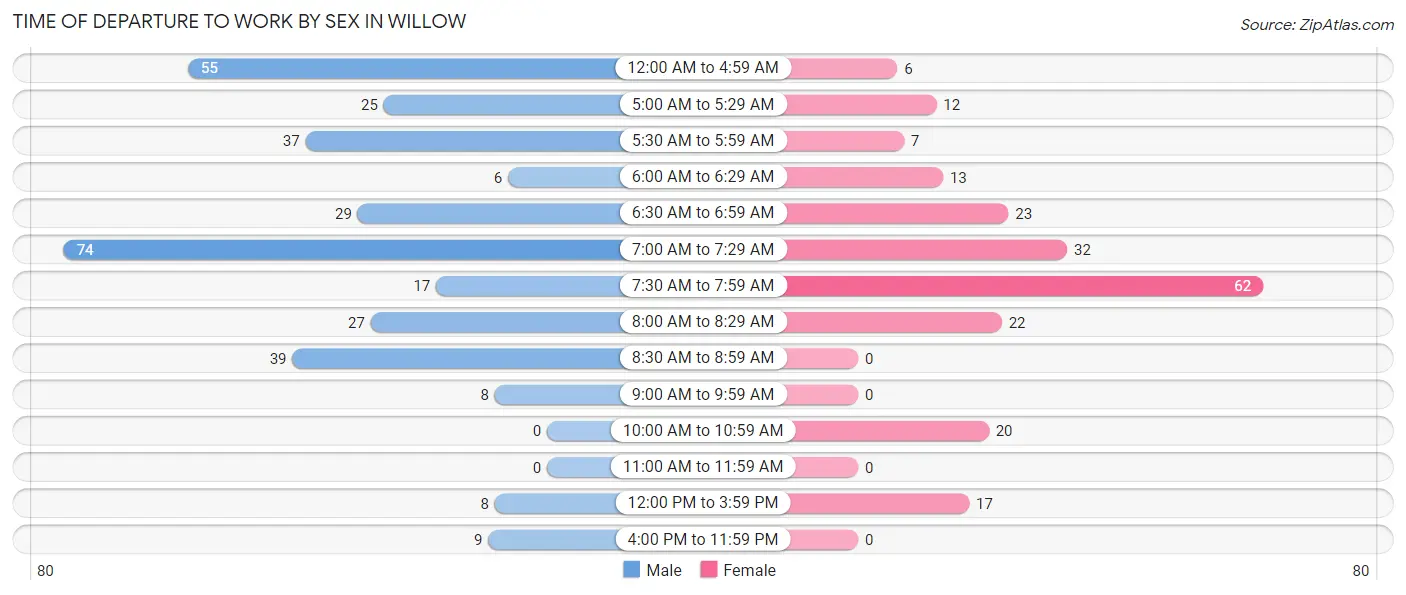
| Time of Departure | Male | Female |
| 12:00 AM to 4:59 AM | 55 (16.5%) | 6 (2.8%) |
| 5:00 AM to 5:29 AM | 25 (7.5%) | 12 (5.6%) |
| 5:30 AM to 5:59 AM | 37 (11.1%) | 7 (3.3%) |
| 6:00 AM to 6:29 AM | 6 (1.8%) | 13 (6.1%) |
| 6:30 AM to 6:59 AM | 29 (8.7%) | 23 (10.7%) |
| 7:00 AM to 7:29 AM | 74 (22.2%) | 32 (14.9%) |
| 7:30 AM to 7:59 AM | 17 (5.1%) | 62 (29.0%) |
| 8:00 AM to 8:29 AM | 27 (8.1%) | 22 (10.3%) |
| 8:30 AM to 8:59 AM | 39 (11.7%) | 0 (0.0%) |
| 9:00 AM to 9:59 AM | 8 (2.4%) | 0 (0.0%) |
| 10:00 AM to 10:59 AM | 0 (0.0%) | 20 (9.3%) |
| 11:00 AM to 11:59 AM | 0 (0.0%) | 0 (0.0%) |
| 12:00 PM to 3:59 PM | 8 (2.4%) | 17 (7.9%) |
| 4:00 PM to 11:59 PM | 9 (2.7%) | 0 (0.0%) |
| Total | 334 (100.0%) | 214 (100.0%) |
Housing Occupancy in Willow
Occupancy by Ownership in Willow
Of the total 845 dwellings in Willow, owner-occupied units account for 751 (88.9%), while renter-occupied units make up 94 (11.1%).
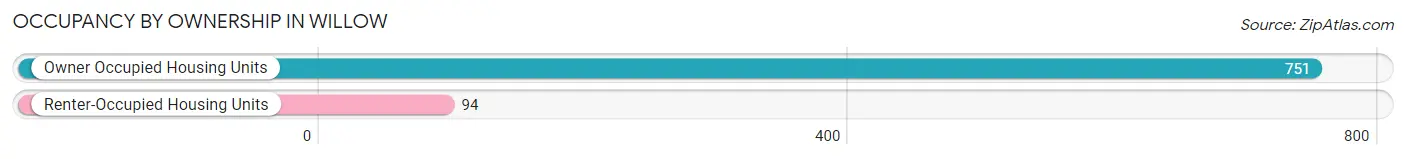
| Occupancy | # Housing Units | % Housing Units |
| Owner Occupied Housing Units | 751 | 88.9% |
| Renter-Occupied Housing Units | 94 | 11.1% |
| Total Occupied Housing Units | 845 | 100.0% |
Occupancy by Household Size in Willow
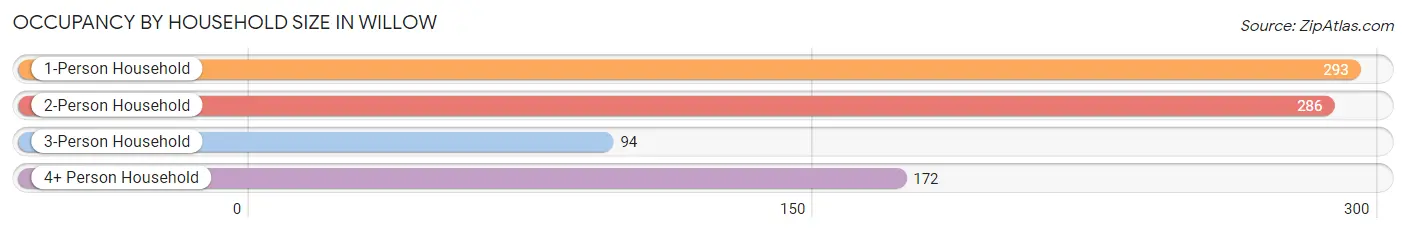
| Household Size | # Housing Units | % Housing Units |
| 1-Person Household | 293 | 34.7% |
| 2-Person Household | 286 | 33.9% |
| 3-Person Household | 94 | 11.1% |
| 4+ Person Household | 172 | 20.4% |
| Total Housing Units | 845 | 100.0% |
Occupancy by Ownership by Household Size in Willow
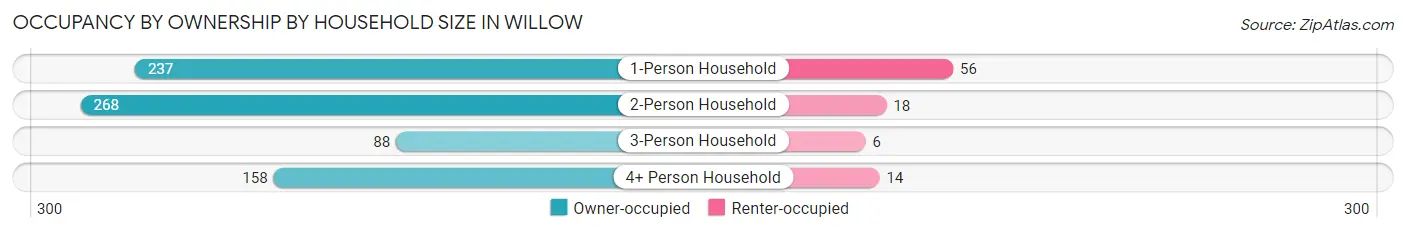
| Household Size | Owner-occupied | Renter-occupied |
| 1-Person Household | 237 (80.9%) | 56 (19.1%) |
| 2-Person Household | 268 (93.7%) | 18 (6.3%) |
| 3-Person Household | 88 (93.6%) | 6 (6.4%) |
| 4+ Person Household | 158 (91.9%) | 14 (8.1%) |
| Total Housing Units | 751 (88.9%) | 94 (11.1%) |
Occupancy by Educational Attainment in Willow
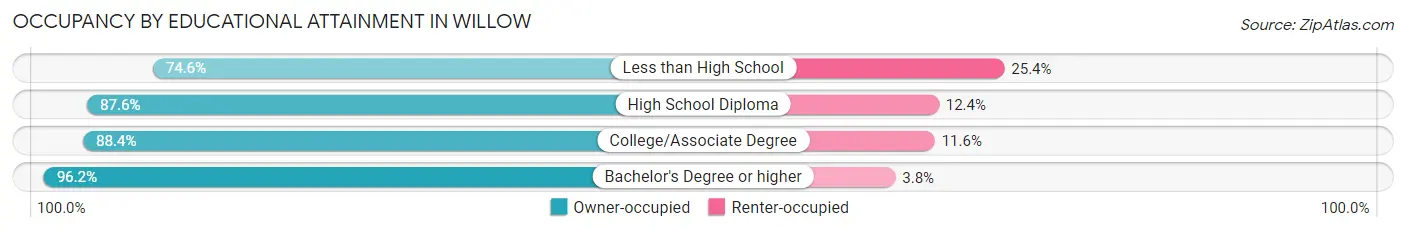
| Household Size | Owner-occupied | Renter-occupied |
| Less than High School | 44 (74.6%) | 15 (25.4%) |
| High School Diploma | 233 (87.6%) | 33 (12.4%) |
| College/Associate Degree | 297 (88.4%) | 39 (11.6%) |
| Bachelor's Degree or higher | 177 (96.2%) | 7 (3.8%) |
Occupancy by Age of Householder in Willow
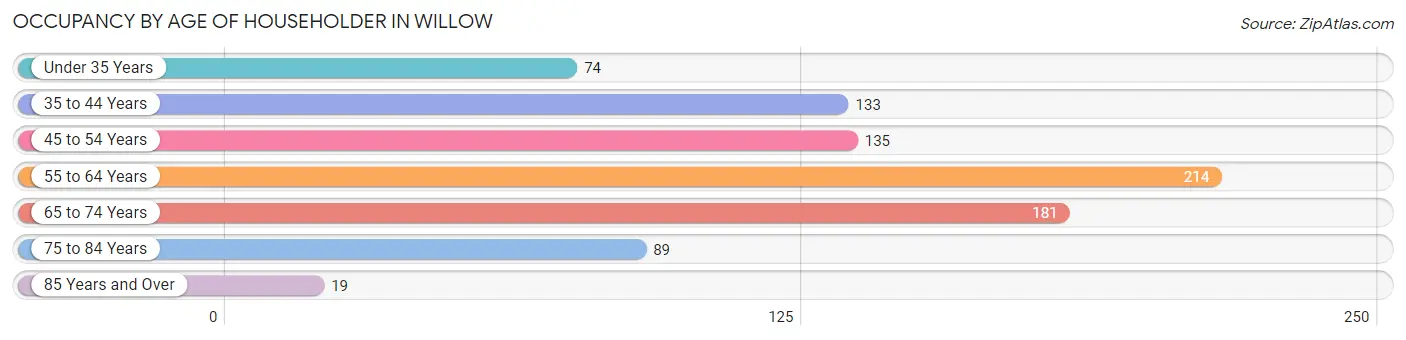
| Age Bracket | # Households | % Households |
| Under 35 Years | 74 | 8.8% |
| 35 to 44 Years | 133 | 15.7% |
| 45 to 54 Years | 135 | 16.0% |
| 55 to 64 Years | 214 | 25.3% |
| 65 to 74 Years | 181 | 21.4% |
| 75 to 84 Years | 89 | 10.5% |
| 85 Years and Over | 19 | 2.2% |
| Total | 845 | 100.0% |
Housing Finances in Willow
Median Income by Occupancy in Willow
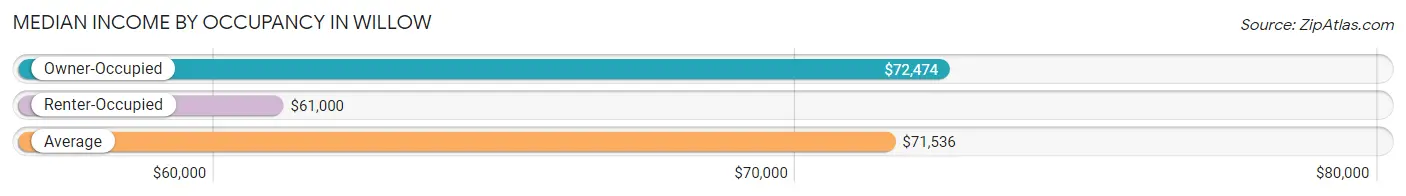
| Occupancy Type | # Households | Median Income |
| Owner-Occupied | 751 (88.9%) | $72,474 |
| Renter-Occupied | 94 (11.1%) | $61,000 |
| Average | 845 (100.0%) | $71,536 |
Occupancy by Householder Income Bracket in Willow
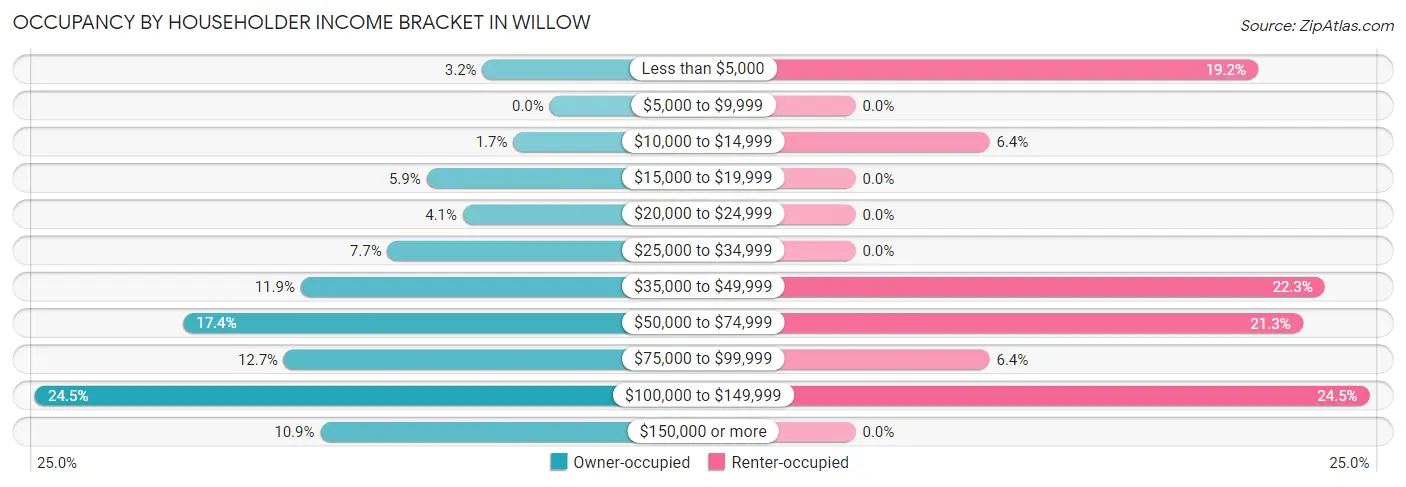
| Income Bracket | Owner-occupied | Renter-occupied |
| Less than $5,000 | 24 (3.2%) | 18 (19.2%) |
| $5,000 to $9,999 | 0 (0.0%) | 0 (0.0%) |
| $10,000 to $14,999 | 13 (1.7%) | 6 (6.4%) |
| $15,000 to $19,999 | 44 (5.9%) | 0 (0.0%) |
| $20,000 to $24,999 | 31 (4.1%) | 0 (0.0%) |
| $25,000 to $34,999 | 58 (7.7%) | 0 (0.0%) |
| $35,000 to $49,999 | 89 (11.8%) | 21 (22.3%) |
| $50,000 to $74,999 | 131 (17.4%) | 20 (21.3%) |
| $75,000 to $99,999 | 95 (12.7%) | 6 (6.4%) |
| $100,000 to $149,999 | 184 (24.5%) | 23 (24.5%) |
| $150,000 or more | 82 (10.9%) | 0 (0.0%) |
| Total | 751 (100.0%) | 94 (100.0%) |
Monthly Housing Cost Tiers in Willow
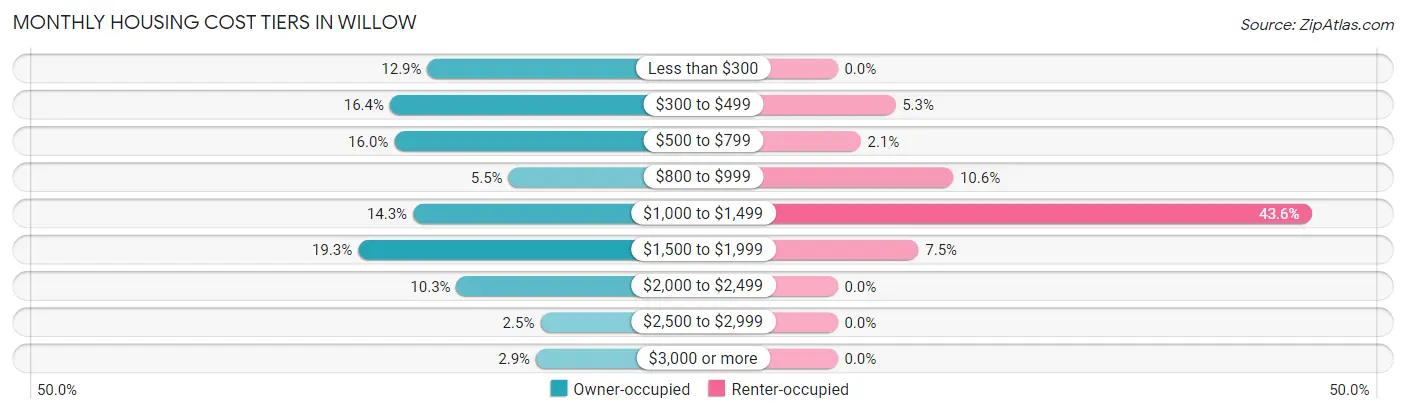
| Monthly Cost | Owner-occupied | Renter-occupied |
| Less than $300 | 97 (12.9%) | 0 (0.0%) |
| $300 to $499 | 123 (16.4%) | 5 (5.3%) |
| $500 to $799 | 120 (16.0%) | 2 (2.1%) |
| $800 to $999 | 41 (5.5%) | 10 (10.6%) |
| $1,000 to $1,499 | 107 (14.2%) | 41 (43.6%) |
| $1,500 to $1,999 | 145 (19.3%) | 7 (7.4%) |
| $2,000 to $2,499 | 77 (10.2%) | 0 (0.0%) |
| $2,500 to $2,999 | 19 (2.5%) | 0 (0.0%) |
| $3,000 or more | 22 (2.9%) | 0 (0.0%) |
| Total | 751 (100.0%) | 94 (100.0%) |
Physical Housing Characteristics in Willow
Housing Structures in Willow
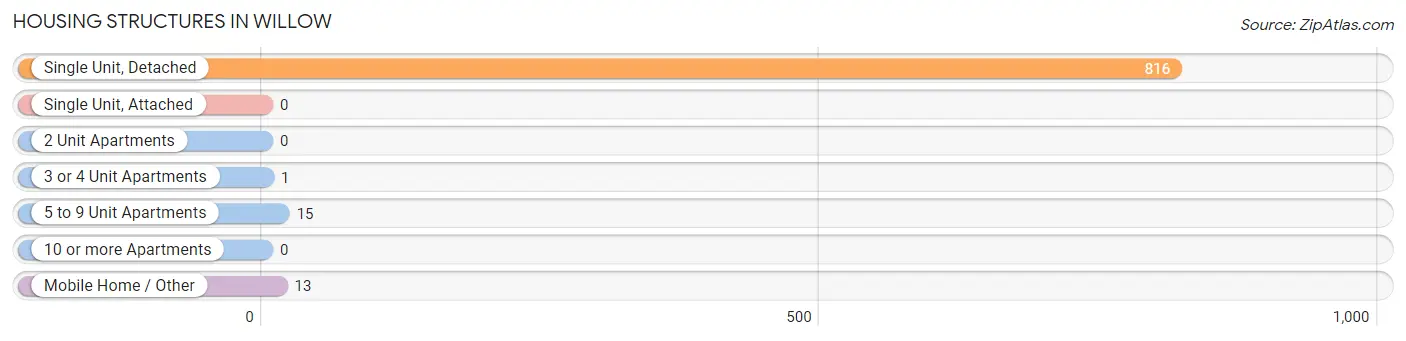
| Structure Type | # Housing Units | % Housing Units |
| Single Unit, Detached | 816 | 96.6% |
| Single Unit, Attached | 0 | 0.0% |
| 2 Unit Apartments | 0 | 0.0% |
| 3 or 4 Unit Apartments | 1 | 0.1% |
| 5 to 9 Unit Apartments | 15 | 1.8% |
| 10 or more Apartments | 0 | 0.0% |
| Mobile Home / Other | 13 | 1.5% |
| Total | 845 | 100.0% |
Housing Structures by Occupancy in Willow
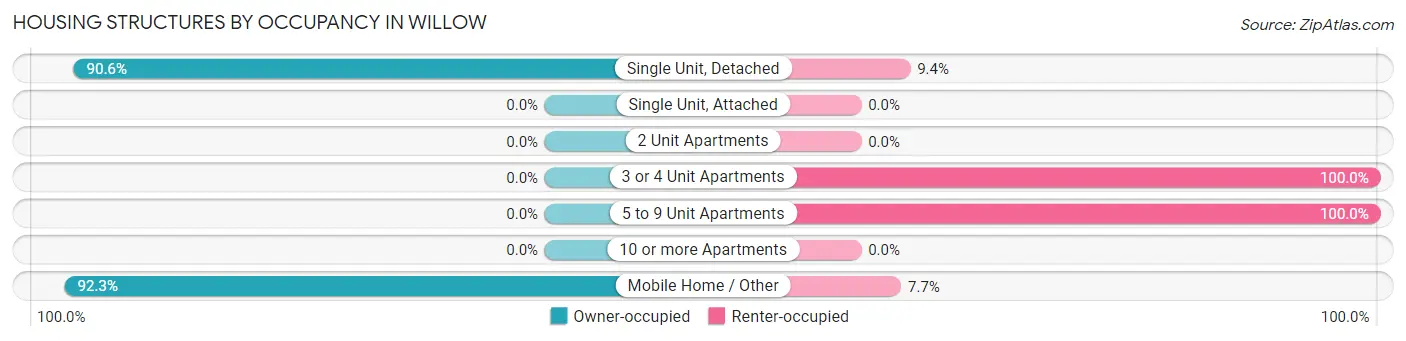
| Structure Type | Owner-occupied | Renter-occupied |
| Single Unit, Detached | 739 (90.6%) | 77 (9.4%) |
| Single Unit, Attached | 0 (0.0%) | 0 (0.0%) |
| 2 Unit Apartments | 0 (0.0%) | 0 (0.0%) |
| 3 or 4 Unit Apartments | 0 (0.0%) | 1 (100.0%) |
| 5 to 9 Unit Apartments | 0 (0.0%) | 15 (100.0%) |
| 10 or more Apartments | 0 (0.0%) | 0 (0.0%) |
| Mobile Home / Other | 12 (92.3%) | 1 (7.7%) |
| Total | 751 (88.9%) | 94 (11.1%) |
Housing Structures by Number of Rooms in Willow
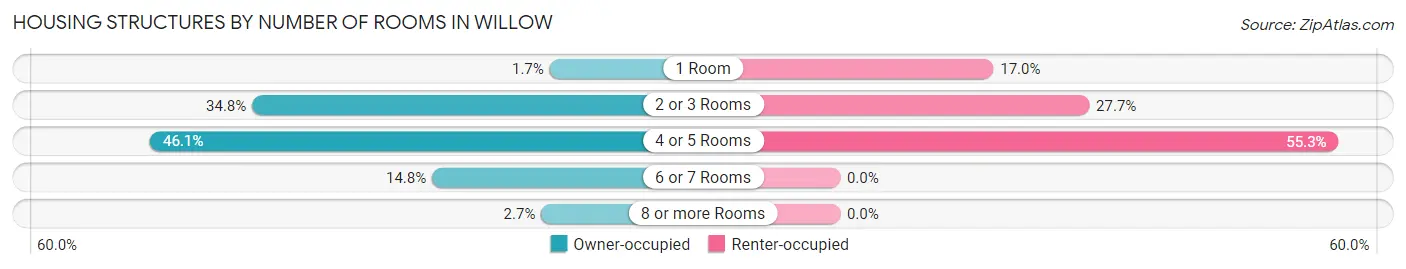
| Number of Rooms | Owner-occupied | Renter-occupied |
| 1 Room | 13 (1.7%) | 16 (17.0%) |
| 2 or 3 Rooms | 261 (34.7%) | 26 (27.7%) |
| 4 or 5 Rooms | 346 (46.1%) | 52 (55.3%) |
| 6 or 7 Rooms | 111 (14.8%) | 0 (0.0%) |
| 8 or more Rooms | 20 (2.7%) | 0 (0.0%) |
| Total | 751 (100.0%) | 94 (100.0%) |
Housing Structure by Heating Type in Willow
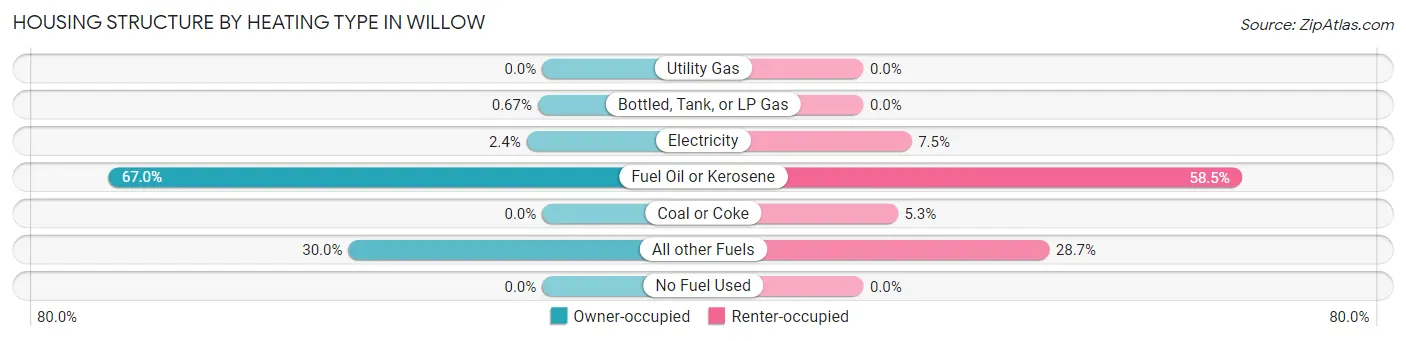
| Heating Type | Owner-occupied | Renter-occupied |
| Utility Gas | 0 (0.0%) | 0 (0.0%) |
| Bottled, Tank, or LP Gas | 5 (0.7%) | 0 (0.0%) |
| Electricity | 18 (2.4%) | 7 (7.4%) |
| Fuel Oil or Kerosene | 503 (67.0%) | 55 (58.5%) |
| Coal or Coke | 0 (0.0%) | 5 (5.3%) |
| All other Fuels | 225 (30.0%) | 27 (28.7%) |
| No Fuel Used | 0 (0.0%) | 0 (0.0%) |
| Total | 751 (100.0%) | 94 (100.0%) |
Household Vehicle Usage in Willow
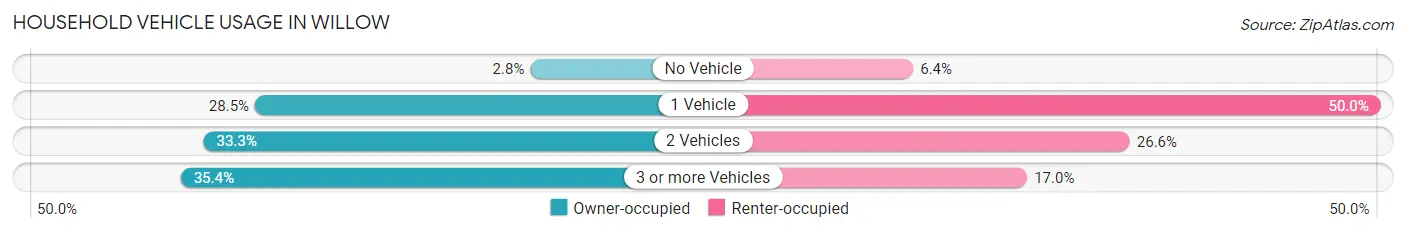
| Vehicles per Household | Owner-occupied | Renter-occupied |
| No Vehicle | 21 (2.8%) | 6 (6.4%) |
| 1 Vehicle | 214 (28.5%) | 47 (50.0%) |
| 2 Vehicles | 250 (33.3%) | 25 (26.6%) |
| 3 or more Vehicles | 266 (35.4%) | 16 (17.0%) |
| Total | 751 (100.0%) | 94 (100.0%) |
Real Estate & Mortgages in Willow
Real Estate and Mortgage Overview in Willow
| Characteristic | Without Mortgage | With Mortgage |
| Housing Units | 372 | 379 |
| Median Property Value | $239,200 | $274,400 |
| Median Household Income | $66,667 | $55 |
| Monthly Housing Costs | $438 | $22 |
| Real Estate Taxes | $1,443 | $51 |
Property Value by Mortgage Status in Willow
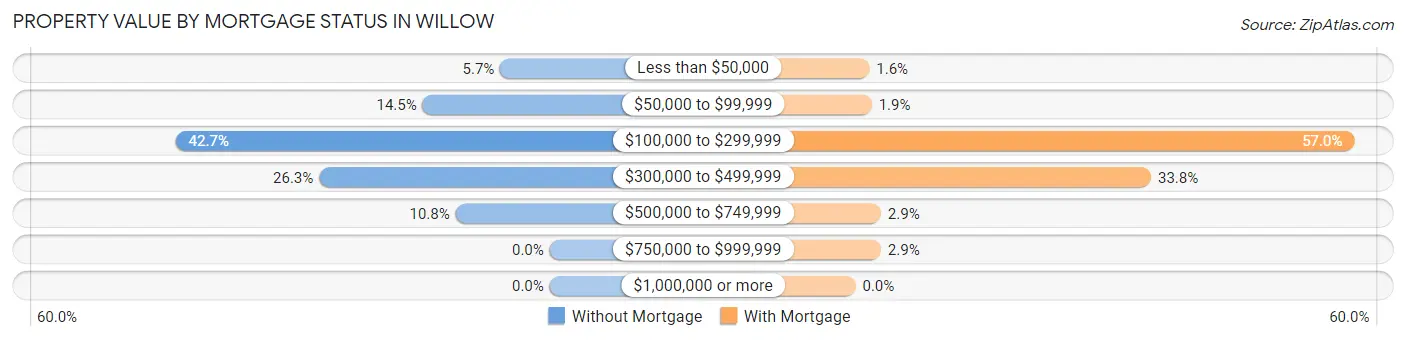
| Property Value | Without Mortgage | With Mortgage |
| Less than $50,000 | 21 (5.7%) | 6 (1.6%) |
| $50,000 to $99,999 | 54 (14.5%) | 7 (1.8%) |
| $100,000 to $299,999 | 159 (42.7%) | 216 (57.0%) |
| $300,000 to $499,999 | 98 (26.3%) | 128 (33.8%) |
| $500,000 to $749,999 | 40 (10.7%) | 11 (2.9%) |
| $750,000 to $999,999 | 0 (0.0%) | 11 (2.9%) |
| $1,000,000 or more | 0 (0.0%) | 0 (0.0%) |
| Total | 372 (100.0%) | 379 (100.0%) |
Household Income by Mortgage Status in Willow
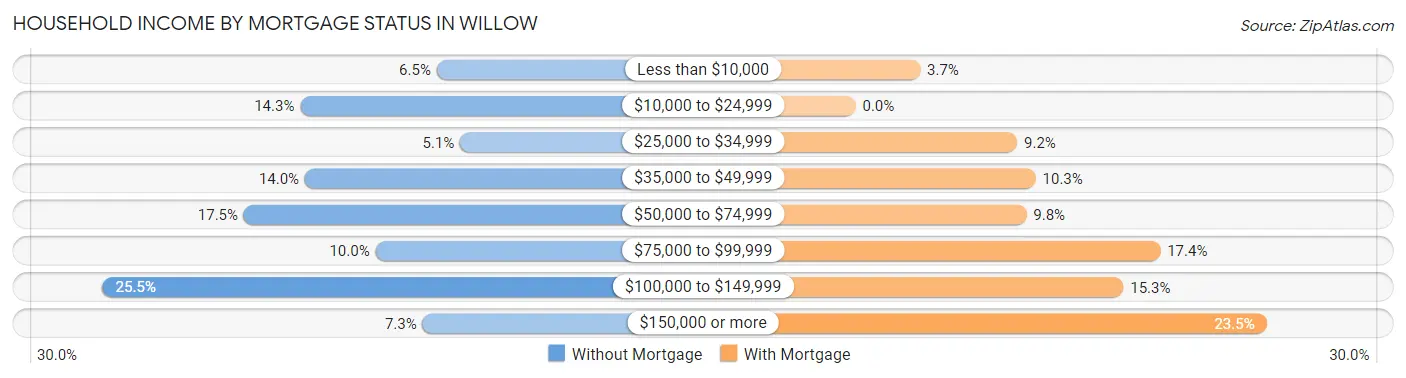
| Household Income | Without Mortgage | With Mortgage |
| Less than $10,000 | 24 (6.5%) | 14 (3.7%) |
| $10,000 to $24,999 | 53 (14.2%) | 0 (0.0%) |
| $25,000 to $34,999 | 19 (5.1%) | 35 (9.2%) |
| $35,000 to $49,999 | 52 (14.0%) | 39 (10.3%) |
| $50,000 to $74,999 | 65 (17.5%) | 37 (9.8%) |
| $75,000 to $99,999 | 37 (10.0%) | 66 (17.4%) |
| $100,000 to $149,999 | 95 (25.5%) | 58 (15.3%) |
| $150,000 or more | 27 (7.3%) | 89 (23.5%) |
| Total | 372 (100.0%) | 379 (100.0%) |
Property Value to Household Income Ratio in Willow
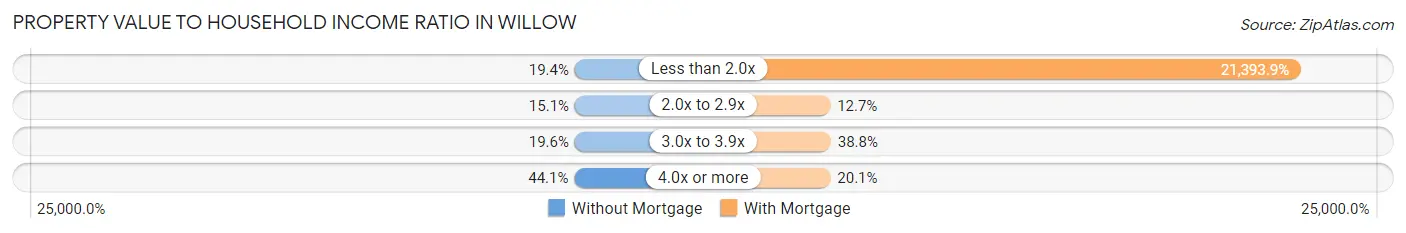
| Value-to-Income Ratio | Without Mortgage | With Mortgage |
| Less than 2.0x | 72 (19.4%) | 81,083 (21,393.9%) |
| 2.0x to 2.9x | 56 (15.0%) | 48 (12.7%) |
| 3.0x to 3.9x | 73 (19.6%) | 147 (38.8%) |
| 4.0x or more | 164 (44.1%) | 76 (20.1%) |
| Total | 372 (100.0%) | 379 (100.0%) |
Real Estate Taxes by Mortgage Status in Willow
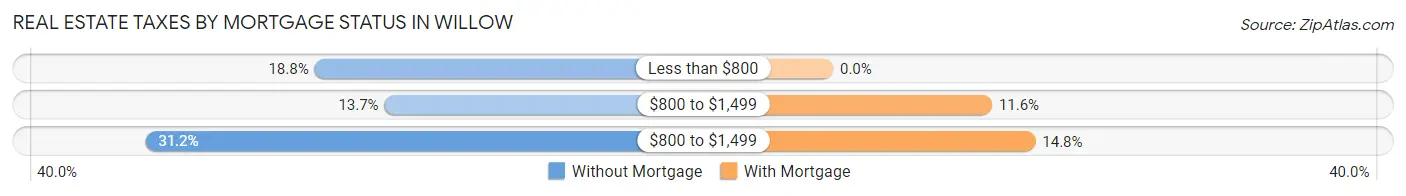
| Property Taxes | Without Mortgage | With Mortgage |
| Less than $800 | 70 (18.8%) | 0 (0.0%) |
| $800 to $1,499 | 51 (13.7%) | 44 (11.6%) |
| $800 to $1,499 | 116 (31.2%) | 56 (14.8%) |
| Total | 372 (100.0%) | 379 (100.0%) |
Health & Disability in Willow
Health Insurance Coverage by Age in Willow
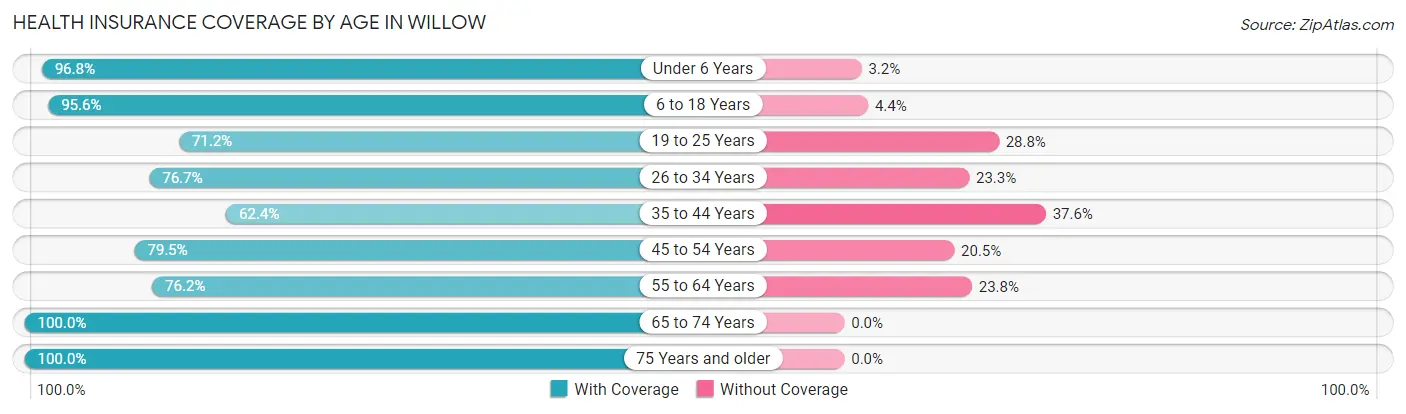
| Age Bracket | With Coverage | Without Coverage |
| Under 6 Years | 212 (96.8%) | 7 (3.2%) |
| 6 to 18 Years | 260 (95.6%) | 12 (4.4%) |
| 19 to 25 Years | 47 (71.2%) | 19 (28.8%) |
| 26 to 34 Years | 132 (76.7%) | 40 (23.3%) |
| 35 to 44 Years | 128 (62.4%) | 77 (37.6%) |
| 45 to 54 Years | 198 (79.5%) | 51 (20.5%) |
| 55 to 64 Years | 250 (76.2%) | 78 (23.8%) |
| 65 to 74 Years | 274 (100.0%) | 0 (0.0%) |
| 75 Years and older | 167 (100.0%) | 0 (0.0%) |
| Total | 1,668 (85.5%) | 284 (14.5%) |
Health Insurance Coverage by Citizenship Status in Willow
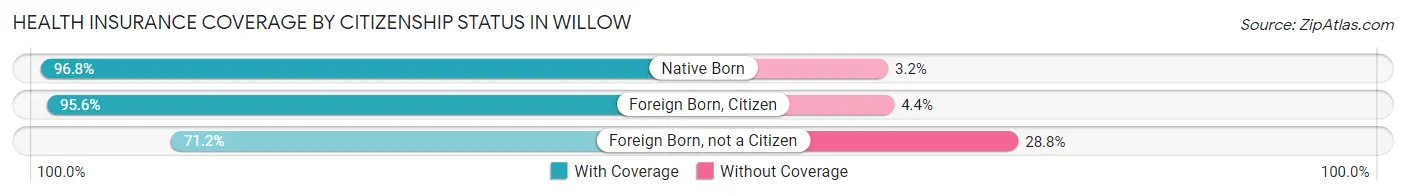
| Citizenship Status | With Coverage | Without Coverage |
| Native Born | 212 (96.8%) | 7 (3.2%) |
| Foreign Born, Citizen | 260 (95.6%) | 12 (4.4%) |
| Foreign Born, not a Citizen | 47 (71.2%) | 19 (28.8%) |
Health Insurance Coverage by Household Income in Willow
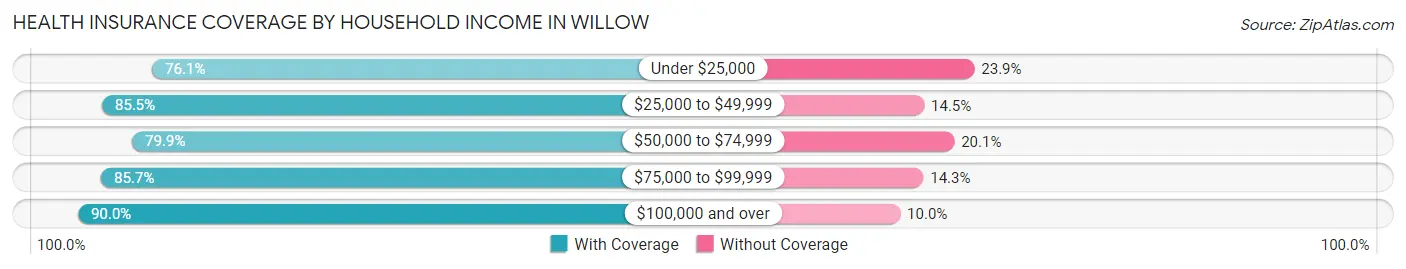
| Household Income | With Coverage | Without Coverage |
| Under $25,000 | 156 (76.1%) | 49 (23.9%) |
| $25,000 to $49,999 | 313 (85.5%) | 53 (14.5%) |
| $50,000 to $74,999 | 250 (79.9%) | 63 (20.1%) |
| $75,000 to $99,999 | 251 (85.7%) | 42 (14.3%) |
| $100,000 and over | 693 (90.0%) | 77 (10.0%) |
Public vs Private Health Insurance Coverage by Age in Willow
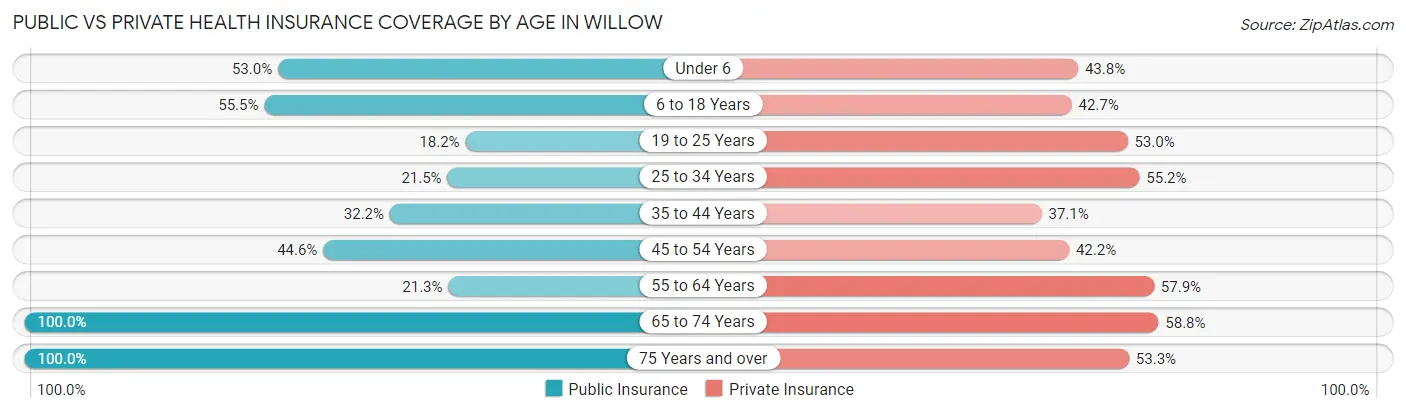
| Age Bracket | Public Insurance | Private Insurance |
| Under 6 | 116 (53.0%) | 96 (43.8%) |
| 6 to 18 Years | 151 (55.5%) | 116 (42.6%) |
| 19 to 25 Years | 12 (18.2%) | 35 (53.0%) |
| 25 to 34 Years | 37 (21.5%) | 95 (55.2%) |
| 35 to 44 Years | 66 (32.2%) | 76 (37.1%) |
| 45 to 54 Years | 111 (44.6%) | 105 (42.2%) |
| 55 to 64 Years | 70 (21.3%) | 190 (57.9%) |
| 65 to 74 Years | 274 (100.0%) | 161 (58.8%) |
| 75 Years and over | 167 (100.0%) | 89 (53.3%) |
| Total | 1,004 (51.4%) | 963 (49.3%) |
Disability Status by Sex by Age in Willow
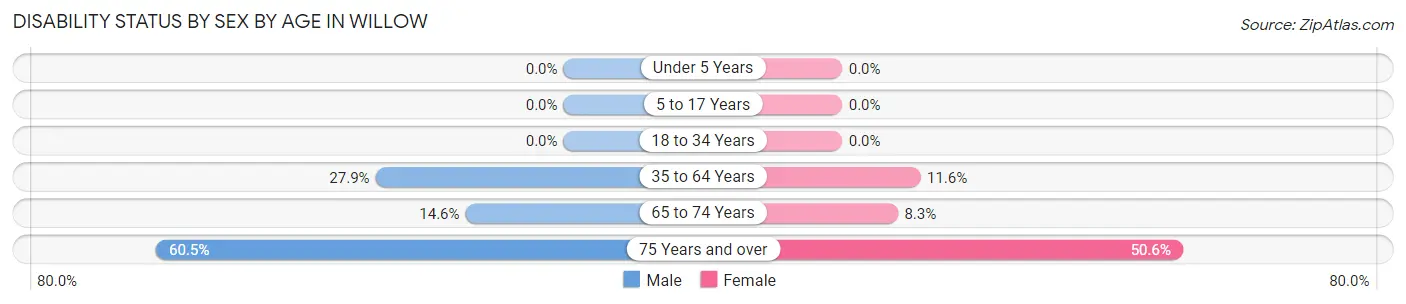
| Age Bracket | Male | Female |
| Under 5 Years | 0 (0.0%) | 0 (0.0%) |
| 5 to 17 Years | 0 (0.0%) | 0 (0.0%) |
| 18 to 34 Years | 0 (0.0%) | 0 (0.0%) |
| 35 to 64 Years | 115 (27.9%) | 43 (11.6%) |
| 65 to 74 Years | 24 (14.5%) | 9 (8.3%) |
| 75 Years and over | 52 (60.5%) | 41 (50.6%) |
Disability Class by Sex by Age in Willow
Disability Class: Hearing Difficulty
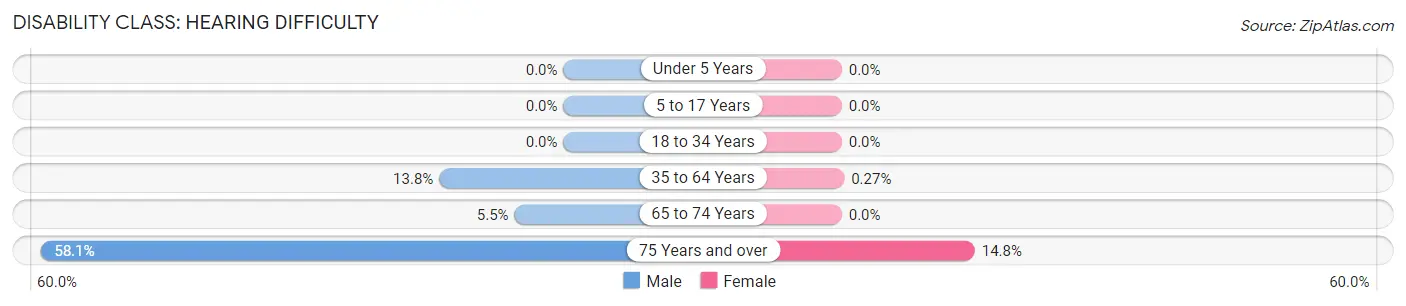
| Age Bracket | Male | Female |
| Under 5 Years | 0 (0.0%) | 0 (0.0%) |
| 5 to 17 Years | 0 (0.0%) | 0 (0.0%) |
| 18 to 34 Years | 0 (0.0%) | 0 (0.0%) |
| 35 to 64 Years | 57 (13.8%) | 1 (0.3%) |
| 65 to 74 Years | 9 (5.4%) | 0 (0.0%) |
| 75 Years and over | 50 (58.1%) | 12 (14.8%) |
Disability Class: Vision Difficulty
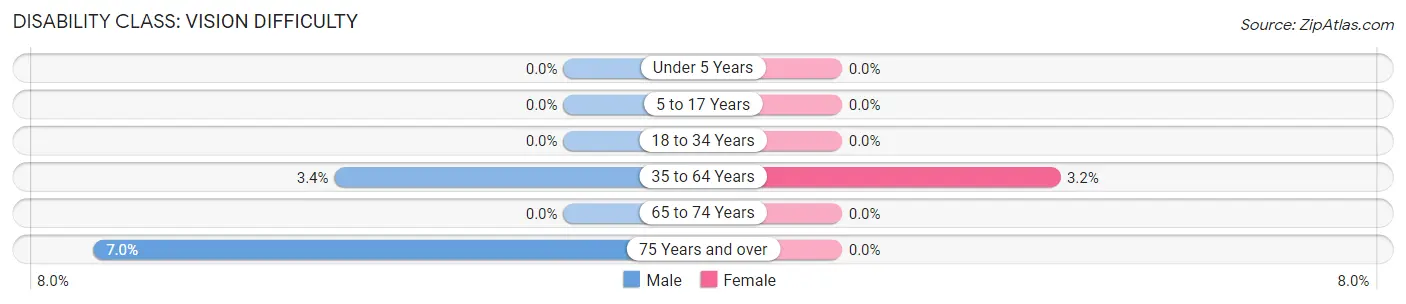
| Age Bracket | Male | Female |
| Under 5 Years | 0 (0.0%) | 0 (0.0%) |
| 5 to 17 Years | 0 (0.0%) | 0 (0.0%) |
| 18 to 34 Years | 0 (0.0%) | 0 (0.0%) |
| 35 to 64 Years | 14 (3.4%) | 12 (3.2%) |
| 65 to 74 Years | 0 (0.0%) | 0 (0.0%) |
| 75 Years and over | 6 (7.0%) | 0 (0.0%) |
Disability Class: Cognitive Difficulty
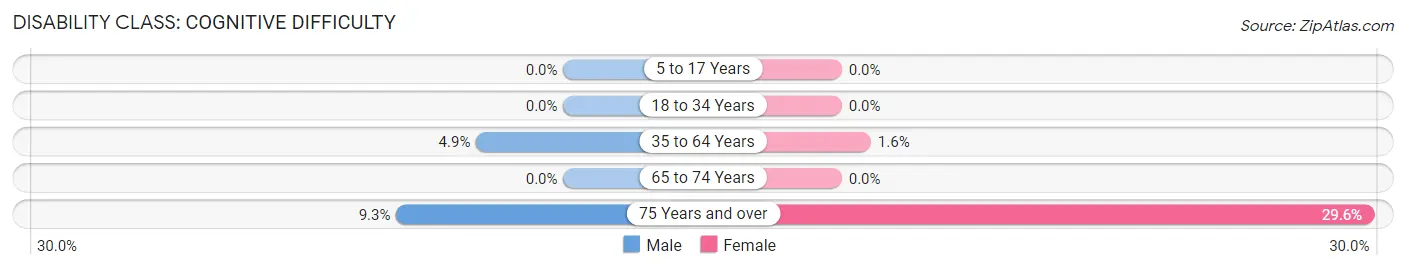
| Age Bracket | Male | Female |
| 5 to 17 Years | 0 (0.0%) | 0 (0.0%) |
| 18 to 34 Years | 0 (0.0%) | 0 (0.0%) |
| 35 to 64 Years | 20 (4.9%) | 6 (1.6%) |
| 65 to 74 Years | 0 (0.0%) | 0 (0.0%) |
| 75 Years and over | 8 (9.3%) | 24 (29.6%) |
Disability Class: Ambulatory Difficulty
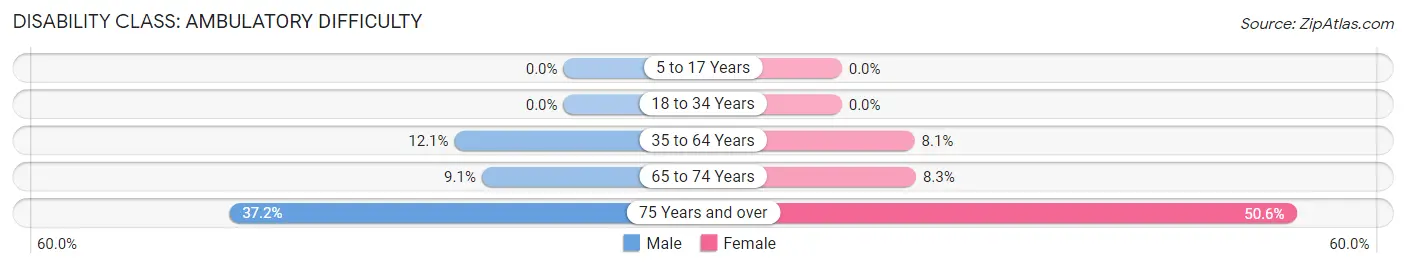
| Age Bracket | Male | Female |
| 5 to 17 Years | 0 (0.0%) | 0 (0.0%) |
| 18 to 34 Years | 0 (0.0%) | 0 (0.0%) |
| 35 to 64 Years | 50 (12.1%) | 30 (8.1%) |
| 65 to 74 Years | 15 (9.1%) | 9 (8.3%) |
| 75 Years and over | 32 (37.2%) | 41 (50.6%) |
Disability Class: Self-Care Difficulty
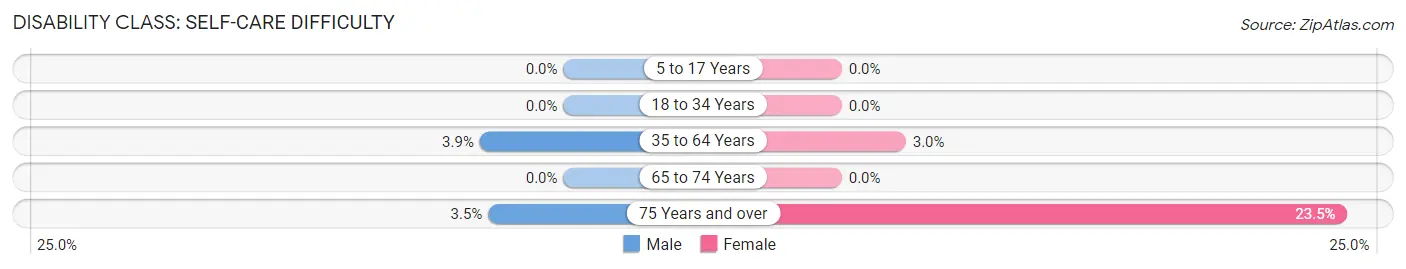
| Age Bracket | Male | Female |
| 5 to 17 Years | 0 (0.0%) | 0 (0.0%) |
| 18 to 34 Years | 0 (0.0%) | 0 (0.0%) |
| 35 to 64 Years | 16 (3.9%) | 11 (3.0%) |
| 65 to 74 Years | 0 (0.0%) | 0 (0.0%) |
| 75 Years and over | 3 (3.5%) | 19 (23.5%) |
Technology Access in Willow
Computing Device Access in Willow
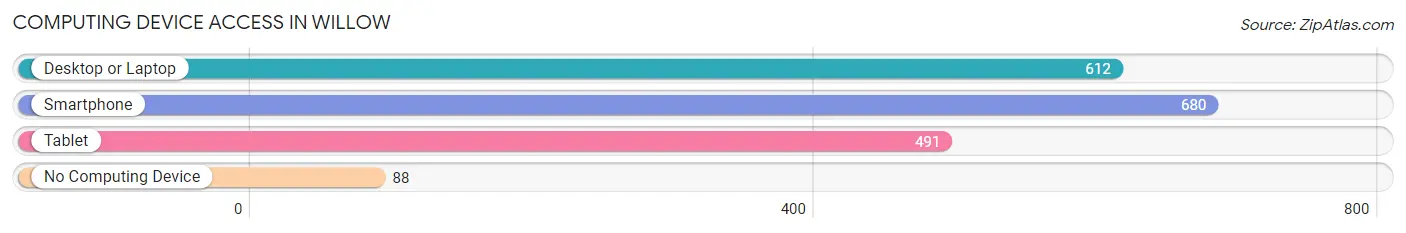
| Device Type | # Households | % Households |
| Desktop or Laptop | 612 | 72.4% |
| Smartphone | 680 | 80.5% |
| Tablet | 491 | 58.1% |
| No Computing Device | 88 | 10.4% |
| Total | 845 | 100.0% |
Internet Access in Willow
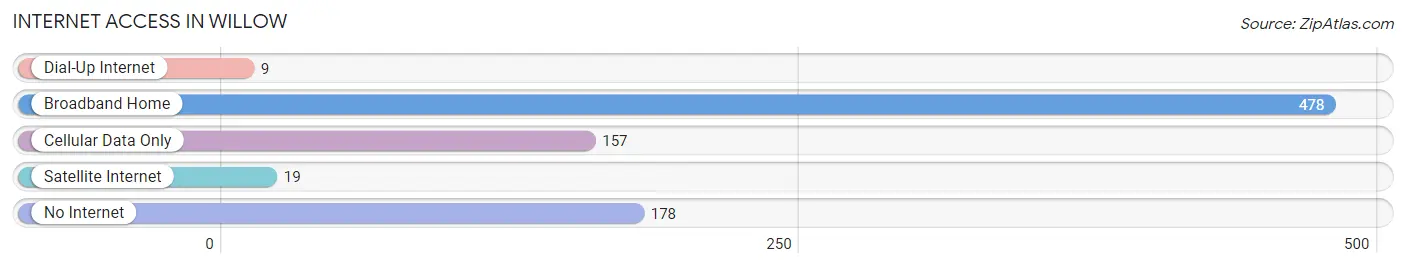
| Internet Type | # Households | % Households |
| Dial-Up Internet | 9 | 1.1% |
| Broadband Home | 478 | 56.6% |
| Cellular Data Only | 157 | 18.6% |
| Satellite Internet | 19 | 2.2% |
| No Internet | 178 | 21.1% |
| Total | 845 | 100.0% |
Willow Summary
Willow is a small unincorporated community located in the Matanuska-Susitna Borough of Alaska. It is located about 50 miles north of Anchorage and is home to about 1,700 people. The community is located in the Matanuska Valley, which is known for its agricultural production and is the largest agricultural producing area in Alaska.
History
Willow was first settled in the early 1900s by homesteaders who were attracted to the area by its fertile soil and abundant wildlife. The first settlers were mostly of Scandinavian descent, and the community was named after the willow trees that grew in the area. The first post office was established in 1915, and the first school was built in 1916.
In the 1920s, the Alaska Railroad was built through the area, and the community began to grow. The railroad brought more settlers to the area, and the population increased to over 500 by the 1930s. During this time, the community was known for its agricultural production, and the area was home to several dairy farms.
In the 1950s, the Alaska Highway was built through the area, and the community began to grow again. The highway brought more tourists to the area, and the population increased to over 1,000 by the 1960s. During this time, the community was known for its recreational activities, and the area was home to several fishing lodges.
Geography
Willow is located in the Matanuska Valley, which is known for its fertile soil and abundant wildlife. The valley is surrounded by mountains, and the community is located at the base of the Chugach Mountains. The area is known for its mild climate, and the average temperature in the summer is around 60 degrees Fahrenheit.
The community is located on the banks of the Matanuska River, which is a popular destination for fishing and rafting. The area is also home to several lakes, including Lake Lucille, which is a popular destination for swimming and boating.
Economy
Willow is a small community, and the economy is largely based on agriculture and tourism. The area is known for its agricultural production, and the community is home to several dairy farms and other agricultural businesses. The area is also home to several fishing lodges, which attract tourists from all over the world.
The community is also home to several small businesses, including restaurants, stores, and other services. The area is also home to several small manufacturing businesses, which produce items such as furniture and clothing.
Demographics
As of the 2010 census, the population of Willow was 1,711. The racial makeup of the community was 95.3% White, 0.7% Native American, 0.3% Asian, 0.2% Pacific Islander, 0.1% Black or African American, and 3.4% from other races. The median household income was $50,938, and the median family income was $58,938. The per capita income was $22,938.
Willow is a small community, and the population is largely made up of families. The community is home to several churches, and the area is known for its strong sense of community. The area is also home to several schools, including Willow Elementary School and Willow High School.
Common Questions
What is Per Capita Income in Willow?
Per Capita income in Willow is $35,847.
What is the Median Family Income in Willow?
Median Family Income in Willow is $95,341.
What is the Median Household income in Willow?
Median Household Income in Willow is $71,536.
What is Income or Wage Gap in Willow?
Income or Wage Gap in Willow is 50.6%.
Women in Willow earn 49.4 cents for every dollar earned by a man.
What is Inequality or Gini Index in Willow?
Inequality or Gini Index in Willow is 0.40.
What is the Total Population of Willow?
Total Population of Willow is 1,952.
What is the Total Male Population of Willow?
Total Male Population of Willow is 1,046.
What is the Total Female Population of Willow?
Total Female Population of Willow is 906.
What is the Ratio of Males per 100 Females in Willow?
There are 115.45 Males per 100 Females in Willow.
What is the Ratio of Females per 100 Males in Willow?
There are 86.62 Females per 100 Males in Willow.
What is the Median Population Age in Willow?
Median Population Age in Willow is 46.2 Years.
What is the Average Family Size in Willow
Average Family Size in Willow is 3.0 People.
What is the Average Household Size in Willow
Average Household Size in Willow is 2.3 People.
How Large is the Labor Force in Willow?
There are 681 People in the Labor Forcein in Willow.
What is the Percentage of People in the Labor Force in Willow?
45.4% of People are in the Labor Force in Willow.
What is the Unemployment Rate in Willow?
Unemployment Rate in Willow is 7.9%.