Nuiqsut, AK Map & Demographics
Nuiqsut Map
Nuiqsut Overview
$27,135
PER CAPITA INCOME
$79,063
AVG FAMILY INCOME
$76,250
AVG HOUSEHOLD INCOME
0.39
INEQUALITY / GINI INDEX
564
TOTAL POPULATION
235
MALE POPULATION
329
FEMALE POPULATION
71.43
MALES / 100 FEMALES
140.00
FEMALES / 100 MALES
23.5
MEDIAN AGE
5.0
AVG FAMILY SIZE
4.5
AVG HOUSEHOLD SIZE
251
LABOR FORCE [ PEOPLE ]
74.0%
PERCENT IN LABOR FORCE
22.7%
UNEMPLOYMENT RATE
Nuiqsut Zip Codes
Nuiqsut Area Codes
Income in Nuiqsut
Income Overview in Nuiqsut
Per Capita Income in Nuiqsut is $27,135, while median incomes of families and households are $79,063 and $76,250 respectively.
| Characteristic | Number | Measure |
| Per Capita Income | 564 | $27,135 |
| Median Family Income | 91 | $79,063 |
| Mean Family Income | 91 | $93,390 |
| Median Household Income | 107 | $76,250 |
| Mean Household Income | 107 | $95,001 |
| Income Deficit | 91 | $0 |
| Wage / Income Gap (%) | 564 | 0.00% |
| Wage / Income Gap ($) | 564 | 100.00¢ per $1 |
| Gini / Inequality Index | 564 | 0.39 |
Earnings by Sex in Nuiqsut
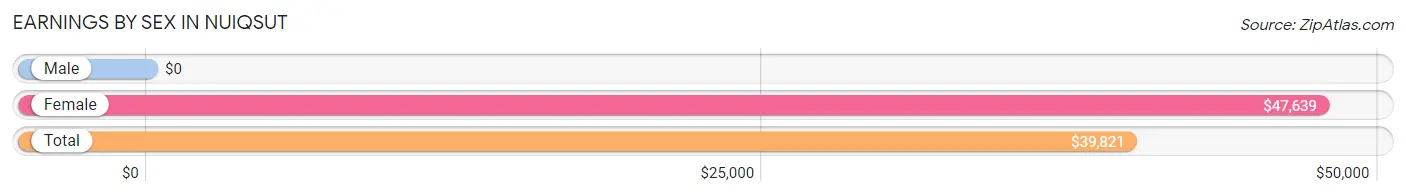
| Sex | Number | Average Earnings |
| Male | 92 (40.2%) | $0 |
| Female | 137 (59.8%) | $47,639 |
| Total | 229 (100.0%) | $39,821 |
Earnings by Sex by Income Bracket in Nuiqsut
The most common earnings brackets in Nuiqsut are $75,000 to $99,999 for men (16 | 17.4%) and $75,000 to $99,999 for women (22 | 16.1%).
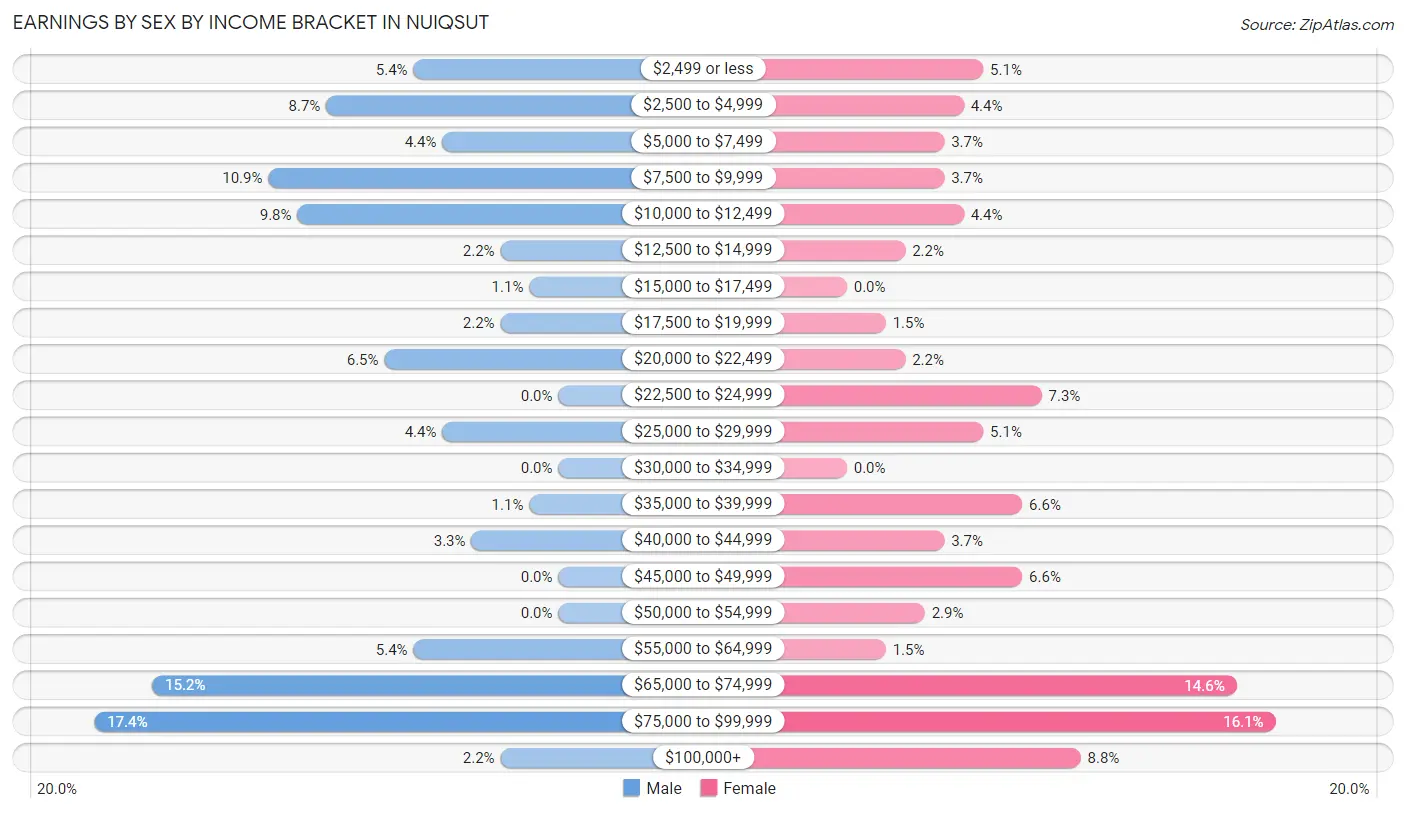
| Income | Male | Female |
| $2,499 or less | 5 (5.4%) | 7 (5.1%) |
| $2,500 to $4,999 | 8 (8.7%) | 6 (4.4%) |
| $5,000 to $7,499 | 4 (4.3%) | 5 (3.6%) |
| $7,500 to $9,999 | 10 (10.9%) | 5 (3.6%) |
| $10,000 to $12,499 | 9 (9.8%) | 6 (4.4%) |
| $12,500 to $14,999 | 2 (2.2%) | 3 (2.2%) |
| $15,000 to $17,499 | 1 (1.1%) | 0 (0.0%) |
| $17,500 to $19,999 | 2 (2.2%) | 2 (1.5%) |
| $20,000 to $22,499 | 6 (6.5%) | 3 (2.2%) |
| $22,500 to $24,999 | 0 (0.0%) | 10 (7.3%) |
| $25,000 to $29,999 | 4 (4.3%) | 7 (5.1%) |
| $30,000 to $34,999 | 0 (0.0%) | 0 (0.0%) |
| $35,000 to $39,999 | 1 (1.1%) | 9 (6.6%) |
| $40,000 to $44,999 | 3 (3.3%) | 5 (3.6%) |
| $45,000 to $49,999 | 0 (0.0%) | 9 (6.6%) |
| $50,000 to $54,999 | 0 (0.0%) | 4 (2.9%) |
| $55,000 to $64,999 | 5 (5.4%) | 2 (1.5%) |
| $65,000 to $74,999 | 14 (15.2%) | 20 (14.6%) |
| $75,000 to $99,999 | 16 (17.4%) | 22 (16.1%) |
| $100,000+ | 2 (2.2%) | 12 (8.8%) |
| Total | 92 (100.0%) | 137 (100.0%) |
Earnings by Sex by Educational Attainment in Nuiqsut
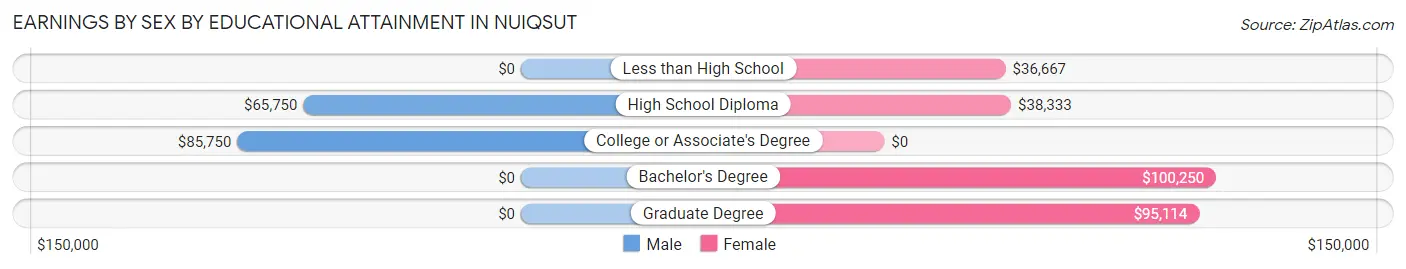
| Educational Attainment | Male Income | Female Income |
| Less than High School | - | - |
| High School Diploma | $65,750 | $38,333 |
| College or Associate's Degree | $85,750 | $0 |
| Bachelor's Degree | - | - |
| Graduate Degree | - | - |
| Total | - | - |
Family Income in Nuiqsut
Family Income Brackets in Nuiqsut
According to the Nuiqsut family income data, there are 24 families falling into the $100,000 to $149,999 income range, which is the most common income bracket and makes up 26.4% of all families.
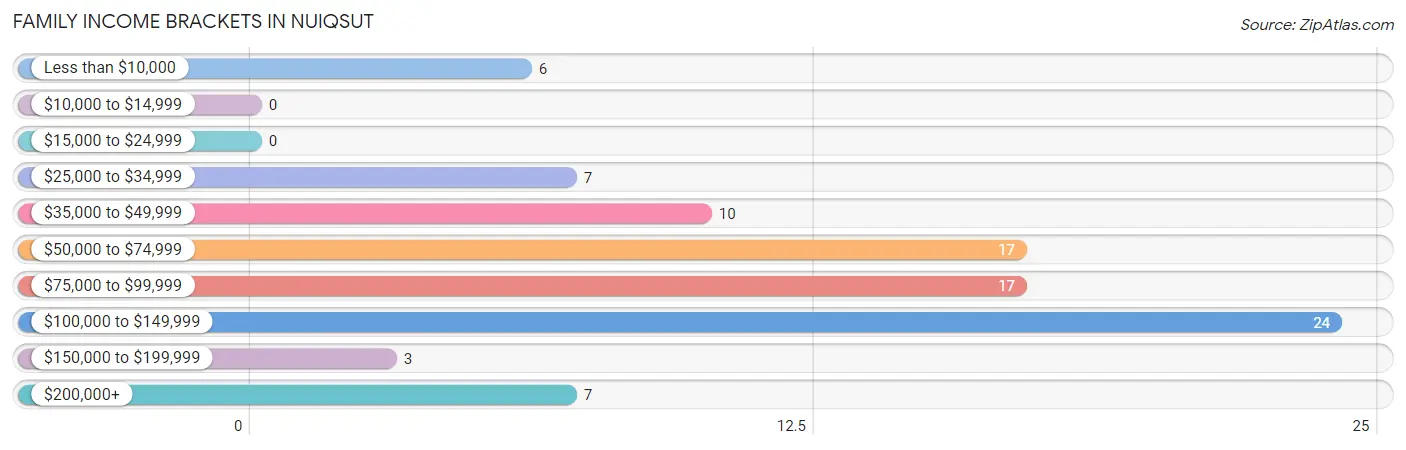
| Income Bracket | # Families | % Families |
| Less than $10,000 | 6 | 6.6% |
| $10,000 to $14,999 | 0 | 0.0% |
| $15,000 to $24,999 | 0 | 0.0% |
| $25,000 to $34,999 | 7 | 7.7% |
| $35,000 to $49,999 | 10 | 11.0% |
| $50,000 to $74,999 | 17 | 18.7% |
| $75,000 to $99,999 | 17 | 18.7% |
| $100,000 to $149,999 | 24 | 26.4% |
| $150,000 to $199,999 | 3 | 3.3% |
| $200,000+ | 7 | 7.7% |
Family Income by Famaliy Size in Nuiqsut
4-person families (19 | 20.9%) account for the highest median family income in Nuiqsut with $117,917 per family, while 4-person families (19 | 20.9%) have the highest median income of $29,479 per family member.
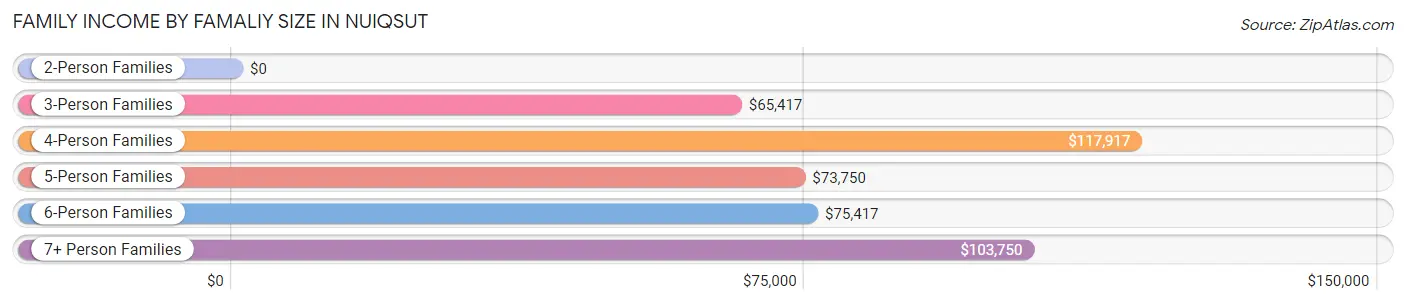
| Income Bracket | # Families | Median Income |
| 2-Person Families | 18 (19.8%) | $0 |
| 3-Person Families | 11 (12.1%) | $65,417 |
| 4-Person Families | 19 (20.9%) | $117,917 |
| 5-Person Families | 11 (12.1%) | $73,750 |
| 6-Person Families | 15 (16.5%) | $75,417 |
| 7+ Person Families | 17 (18.7%) | $103,750 |
| Total | 91 (100.0%) | $79,063 |
Family Income by Number of Earners in Nuiqsut
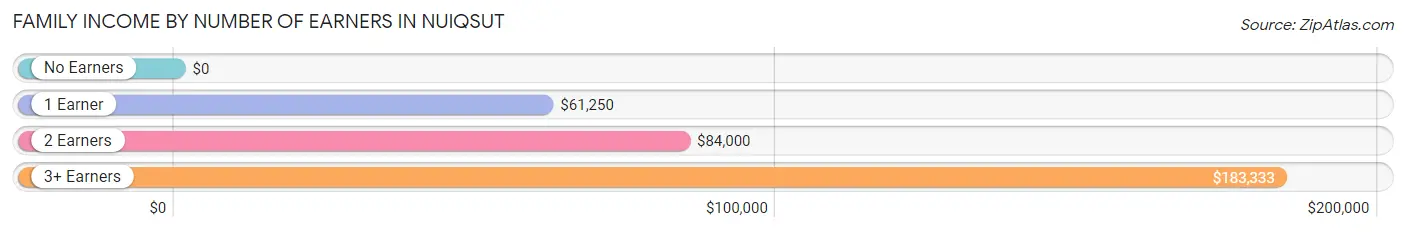
| Number of Earners | # Families | Median Income |
| No Earners | 13 (14.3%) | $0 |
| 1 Earner | 24 (26.4%) | $61,250 |
| 2 Earners | 42 (46.2%) | $84,000 |
| 3+ Earners | 12 (13.2%) | $183,333 |
| Total | 91 (100.0%) | $79,063 |
Household Income in Nuiqsut
Household Income Brackets in Nuiqsut
With 22 households falling in the category, the $100,000 to $149,999 income range is the most frequent in Nuiqsut, accounting for 20.6% of all households. In contrast, only 1 households (0.9%) fall into the $15,000 to $24,999 income bracket, making it the least populous group.
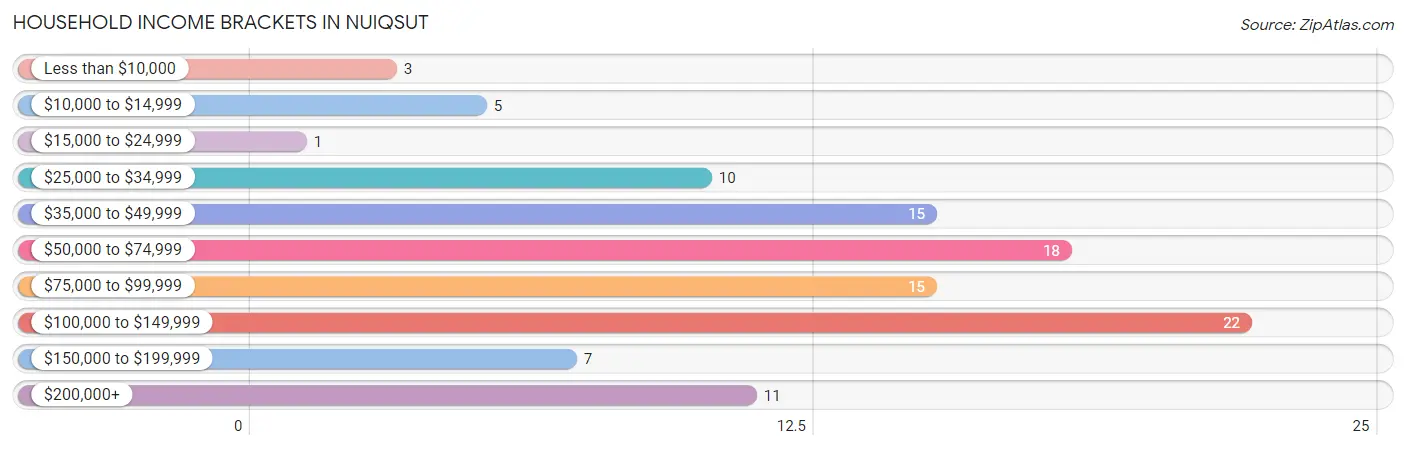
| Income Bracket | # Households | % Households |
| Less than $10,000 | 3 | 2.8% |
| $10,000 to $14,999 | 5 | 4.7% |
| $15,000 to $24,999 | 1 | 0.9% |
| $25,000 to $34,999 | 10 | 9.3% |
| $35,000 to $49,999 | 15 | 14.0% |
| $50,000 to $74,999 | 18 | 16.8% |
| $75,000 to $99,999 | 15 | 14.0% |
| $100,000 to $149,999 | 22 | 20.6% |
| $150,000 to $199,999 | 7 | 6.5% |
| $200,000+ | 11 | 10.3% |
Household Income by Householder Age in Nuiqsut
The median household income in Nuiqsut is $76,250, with the highest median household income of $103,500 found in the 25 to 44 years age bracket for the primary householder. A total of 44 households (41.1%) fall into this category. Meanwhile, the 15 to 24 years age bracket for the primary householder has the lowest median household income of $0, with 7 households (6.5%) in this group.
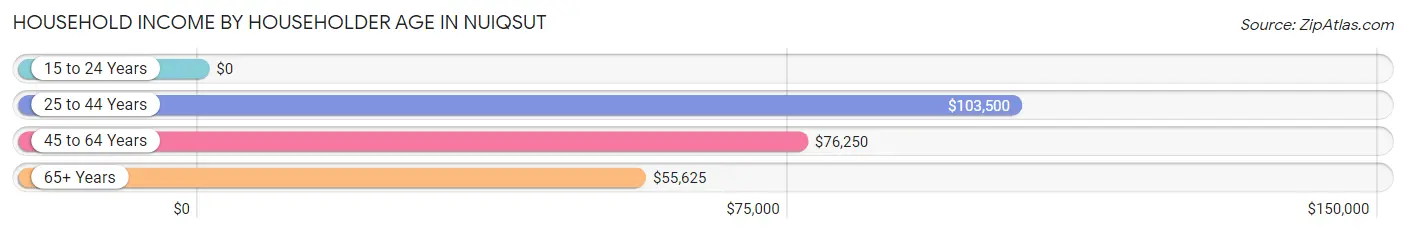
| Income Bracket | # Households | Median Income |
| 15 to 24 Years | 7 (6.5%) | $0 |
| 25 to 44 Years | 44 (41.1%) | $103,500 |
| 45 to 64 Years | 29 (27.1%) | $76,250 |
| 65+ Years | 27 (25.2%) | $55,625 |
| Total | 107 (100.0%) | $76,250 |
Poverty in Nuiqsut
Income Below Poverty by Sex and Age in Nuiqsut
With 8.1% poverty level for males and 11.6% for females among the residents of Nuiqsut, 12 to 14 year old males and 65 to 74 year old females are the most vulnerable to poverty, with 2 males (25.0%) and 15 females (65.2%) in their respective age groups living below the poverty level.
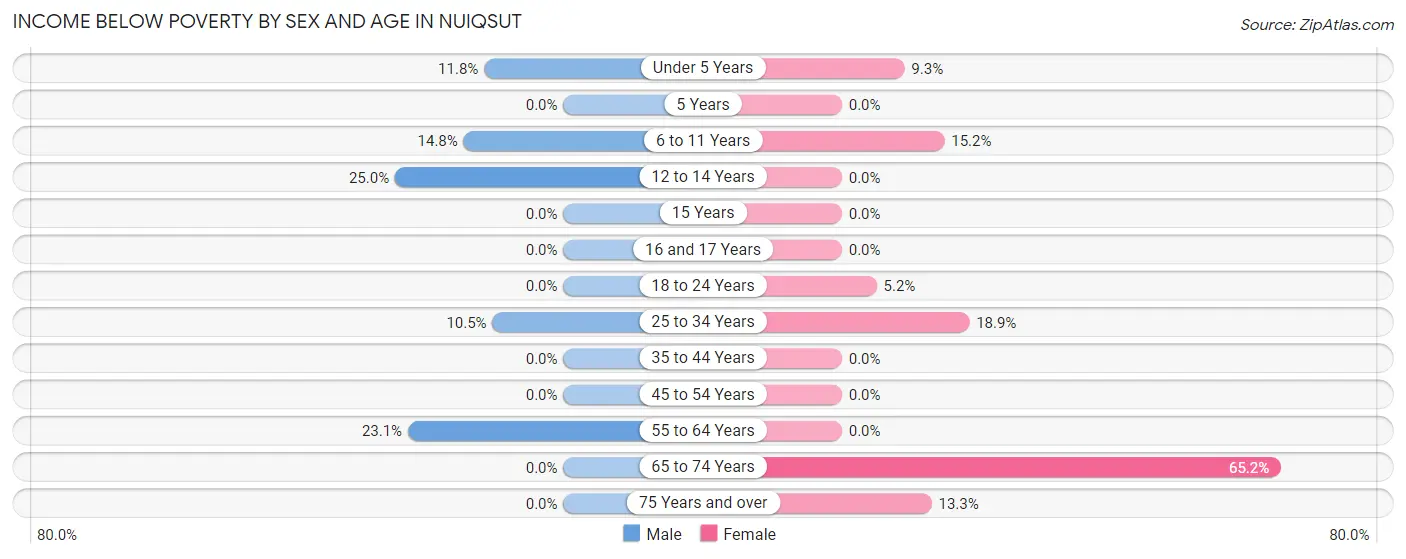
| Age Bracket | Male | Female |
| Under 5 Years | 6 (11.8%) | 4 (9.3%) |
| 5 Years | 0 (0.0%) | 0 (0.0%) |
| 6 to 11 Years | 4 (14.8%) | 7 (15.2%) |
| 12 to 14 Years | 2 (25.0%) | 0 (0.0%) |
| 15 Years | 0 (0.0%) | 0 (0.0%) |
| 16 and 17 Years | 0 (0.0%) | 0 (0.0%) |
| 18 to 24 Years | 0 (0.0%) | 3 (5.2%) |
| 25 to 34 Years | 4 (10.5%) | 7 (18.9%) |
| 35 to 44 Years | 0 (0.0%) | 0 (0.0%) |
| 45 to 54 Years | 0 (0.0%) | 0 (0.0%) |
| 55 to 64 Years | 3 (23.1%) | 0 (0.0%) |
| 65 to 74 Years | 0 (0.0%) | 15 (65.2%) |
| 75 Years and over | 0 (0.0%) | 2 (13.3%) |
| Total | 19 (8.1%) | 38 (11.6%) |
Income Above Poverty by Sex and Age in Nuiqsut
According to the poverty statistics in Nuiqsut, males aged 5 years and females aged 5 years are the age groups that are most secure financially, with 100.0% of males and 100.0% of females in these age groups living above the poverty line.
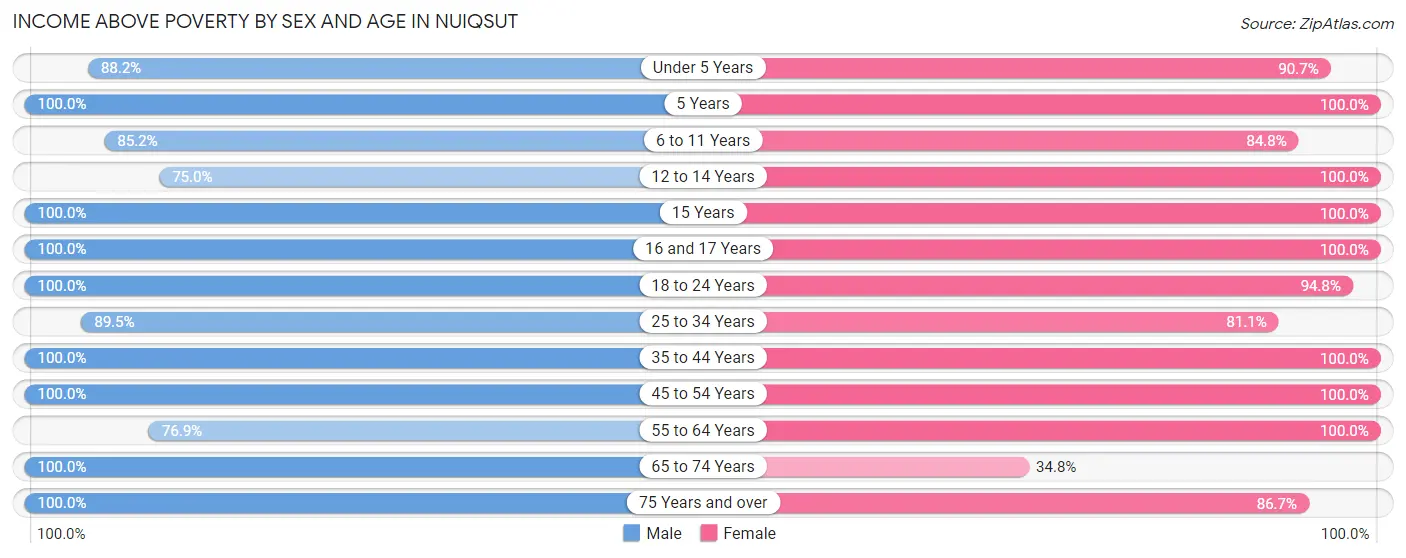
| Age Bracket | Male | Female |
| Under 5 Years | 45 (88.2%) | 39 (90.7%) |
| 5 Years | 3 (100.0%) | 27 (100.0%) |
| 6 to 11 Years | 23 (85.2%) | 39 (84.8%) |
| 12 to 14 Years | 6 (75.0%) | 4 (100.0%) |
| 15 Years | 14 (100.0%) | 2 (100.0%) |
| 16 and 17 Years | 3 (100.0%) | 7 (100.0%) |
| 18 to 24 Years | 21 (100.0%) | 55 (94.8%) |
| 25 to 34 Years | 34 (89.5%) | 30 (81.1%) |
| 35 to 44 Years | 16 (100.0%) | 43 (100.0%) |
| 45 to 54 Years | 19 (100.0%) | 10 (100.0%) |
| 55 to 64 Years | 10 (76.9%) | 14 (100.0%) |
| 65 to 74 Years | 19 (100.0%) | 8 (34.8%) |
| 75 Years and over | 3 (100.0%) | 13 (86.7%) |
| Total | 216 (91.9%) | 291 (88.4%) |
Income Below Poverty Among Married-Couple Families in Nuiqsut
The poverty statistics for married-couple families in Nuiqsut show that 5.4% or 2 of the total 37 families live below the poverty line. Families with 3 or 4 children have the highest poverty rate of 13.3%, comprising of 2 families. On the other hand, families with no children have the lowest poverty rate of 0.0%, which includes 0 families.
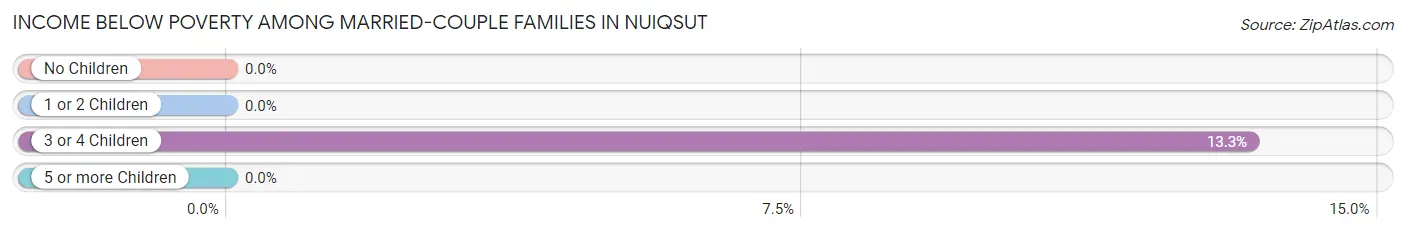
| Children | Above Poverty | Below Poverty |
| No Children | 6 (100.0%) | 0 (0.0%) |
| 1 or 2 Children | 9 (100.0%) | 0 (0.0%) |
| 3 or 4 Children | 13 (86.7%) | 2 (13.3%) |
| 5 or more Children | 7 (100.0%) | 0 (0.0%) |
| Total | 35 (94.6%) | 2 (5.4%) |
Income Below Poverty Among Single-Parent Households in Nuiqsut
According to the poverty data in Nuiqsut, 15.8% or 3 single-father households and 8.6% or 3 single-mother households are living below the poverty line. Among single-father households, those with no children have the highest poverty rate, with 3 households (23.1%) experiencing poverty. Likewise, among single-mother households, those with 5 or more children have the highest poverty rate, with 3 households (50.0%) falling below the poverty line.
| Children | Single Father | Single Mother |
| No Children | 3 (23.1%) | 0 (0.0%) |
| 1 or 2 Children | 0 (0.0%) | 0 (0.0%) |
| 3 or 4 Children | 0 (0.0%) | 0 (0.0%) |
| 5 or more Children | 0 (0.0%) | 3 (50.0%) |
| Total | 3 (15.8%) | 3 (8.6%) |
Income Below Poverty Among Married-Couple vs Single-Parent Households in Nuiqsut
The poverty data for Nuiqsut shows that 2 of the married-couple family households (5.4%) and 6 of the single-parent households (11.1%) are living below the poverty level. Within the married-couple family households, those with 3 or 4 children have the highest poverty rate, with 2 households (13.3%) falling below the poverty line. Among the single-parent households, those with 5 or more children have the highest poverty rate, with 3 household (33.3%) living below poverty.
| Children | Married-Couple Families | Single-Parent Households |
| No Children | 0 (0.0%) | 3 (21.4%) |
| 1 or 2 Children | 0 (0.0%) | 0 (0.0%) |
| 3 or 4 Children | 2 (13.3%) | 0 (0.0%) |
| 5 or more Children | 0 (0.0%) | 3 (33.3%) |
| Total | 2 (5.4%) | 6 (11.1%) |
Race in Nuiqsut
The most populous races in Nuiqsut are Native / Alaskan (450 | 79.8%), White / Caucasian (87 | 15.4%), and Two or more Races (27 | 4.8%).
| Race | # Population | % Population |
| Asian | 0 | 0.0% |
| Black / African American | 0 | 0.0% |
| Hawaiian / Pacific | 0 | 0.0% |
| Hispanic or Latino | 0 | 0.0% |
| Native / Alaskan | 450 | 79.8% |
| White / Caucasian | 87 | 15.4% |
| Two or more Races | 27 | 4.8% |
| Some other Race | 0 | 0.0% |
| Total | 564 | 100.0% |
Ancestry in Nuiqsut
The most populous ancestries reported in Nuiqsut are Inupiat (418 | 74.1%), Alaska Native (49 | 8.7%), Irish (12 | 2.1%), European (11 | 1.9%), and American (10 | 1.8%), together accounting for 88.6% of all Nuiqsut residents.
| Ancestry | # Population | % Population |
| Alaska Native | 49 | 8.7% |
| Alaskan Athabascan | 1 | 0.2% |
| American | 10 | 1.8% |
| Bulgarian | 9 | 1.6% |
| Cajun | 1 | 0.2% |
| Canadian | 9 | 1.6% |
| Cherokee | 1 | 0.2% |
| English | 1 | 0.2% |
| European | 11 | 1.9% |
| French | 9 | 1.6% |
| Inupiat | 418 | 74.1% |
| Irish | 12 | 2.1% |
| Swedish | 1 | 0.2% |
| Tlingit-Haida | 6 | 1.1% |
| Yup'ik | 6 | 1.1% | View All 15 Rows |
Immigrants in Nuiqsut
The most numerous immigrant groups reported in Nuiqsut came from , and Canada (9 | 1.6%), together accounting for 1.6% of all Nuiqsut residents.

| Immigration Origin | # Population | % Population |
| Canada | 9 | 1.6% | View All 1 Rows |
Sex and Age in Nuiqsut
Sex and Age in Nuiqsut
The most populous age groups in Nuiqsut are Under 5 Years (51 | 21.7%) for men and 5 to 9 Years (62 | 18.8%) for women.
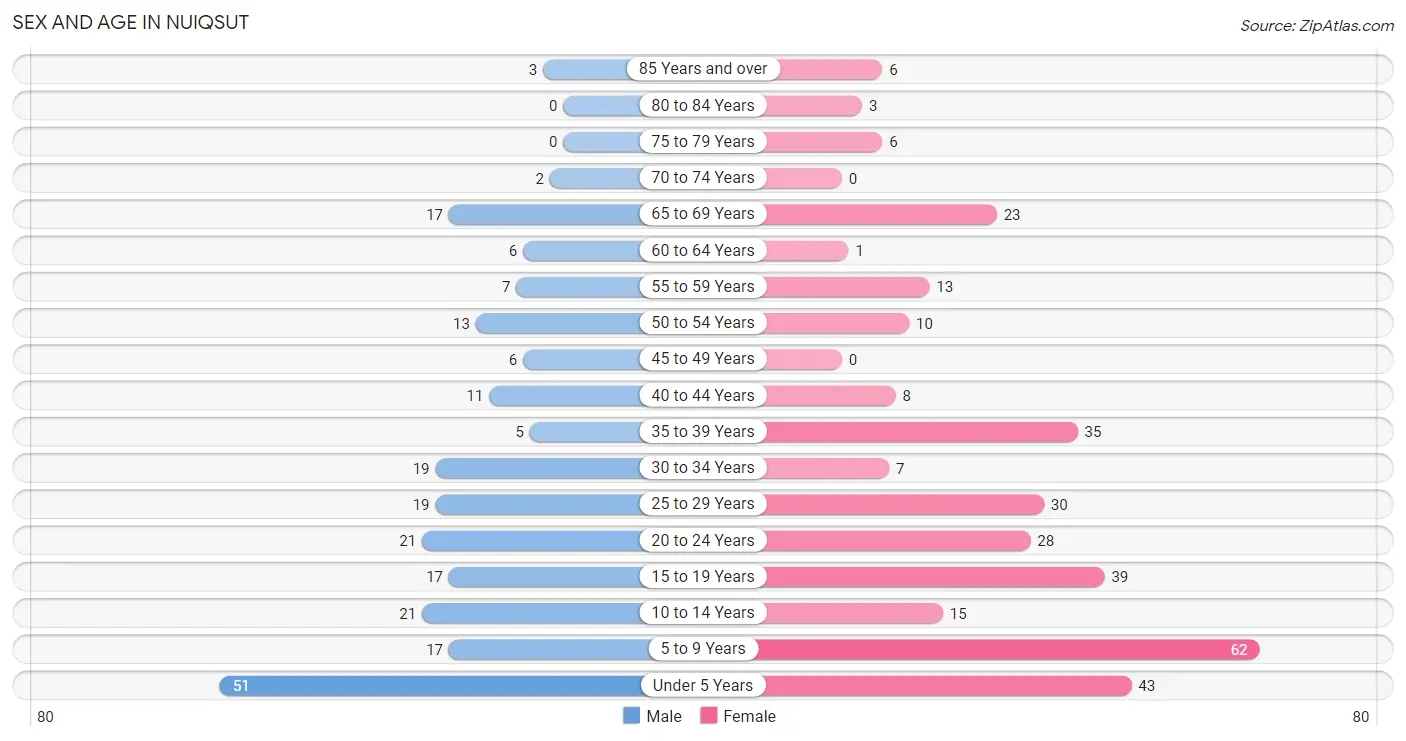
| Age Bracket | Male | Female |
| Under 5 Years | 51 (21.7%) | 43 (13.1%) |
| 5 to 9 Years | 17 (7.2%) | 62 (18.8%) |
| 10 to 14 Years | 21 (8.9%) | 15 (4.6%) |
| 15 to 19 Years | 17 (7.2%) | 39 (11.8%) |
| 20 to 24 Years | 21 (8.9%) | 28 (8.5%) |
| 25 to 29 Years | 19 (8.1%) | 30 (9.1%) |
| 30 to 34 Years | 19 (8.1%) | 7 (2.1%) |
| 35 to 39 Years | 5 (2.1%) | 35 (10.6%) |
| 40 to 44 Years | 11 (4.7%) | 8 (2.4%) |
| 45 to 49 Years | 6 (2.5%) | 0 (0.0%) |
| 50 to 54 Years | 13 (5.5%) | 10 (3.0%) |
| 55 to 59 Years | 7 (3.0%) | 13 (4.0%) |
| 60 to 64 Years | 6 (2.5%) | 1 (0.3%) |
| 65 to 69 Years | 17 (7.2%) | 23 (7.0%) |
| 70 to 74 Years | 2 (0.9%) | 0 (0.0%) |
| 75 to 79 Years | 0 (0.0%) | 6 (1.8%) |
| 80 to 84 Years | 0 (0.0%) | 3 (0.9%) |
| 85 Years and over | 3 (1.3%) | 6 (1.8%) |
| Total | 235 (100.0%) | 329 (100.0%) |
Families and Households in Nuiqsut
Median Family Size in Nuiqsut
The median family size in Nuiqsut is 4.95 persons per family, with married-couple families (37 | 40.7%) accounting for the largest median family size of 5.41 persons per family. On the other hand, single male/father families (19 | 20.9%) represent the smallest median family size with 3.47 persons per family.
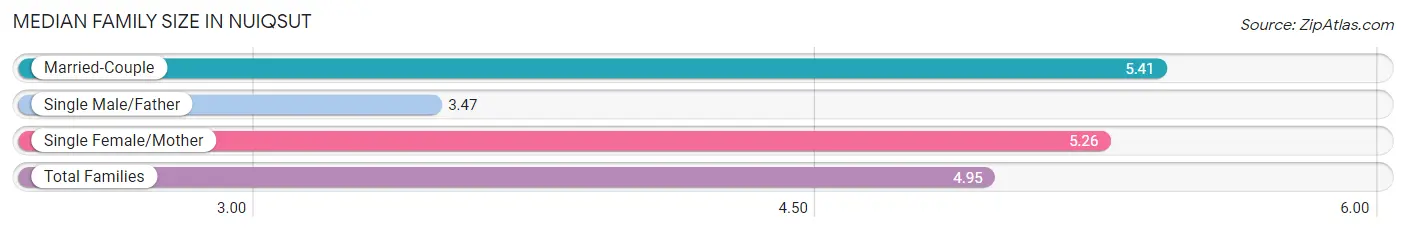
| Family Type | # Families | Family Size |
| Married-Couple | 37 (40.7%) | 5.41 |
| Single Male/Father | 19 (20.9%) | 3.47 |
| Single Female/Mother | 35 (38.5%) | 5.26 |
| Total Families | 91 (100.0%) | 4.95 |
Median Household Size in Nuiqsut
The median household size in Nuiqsut is 4.51 persons per household, with married-couple households (37 | 34.6%) accounting for the largest median household size of 5.54 persons per household. non-family households (16 | 14.9%) represent the smallest median household size with 1.06 persons per household.
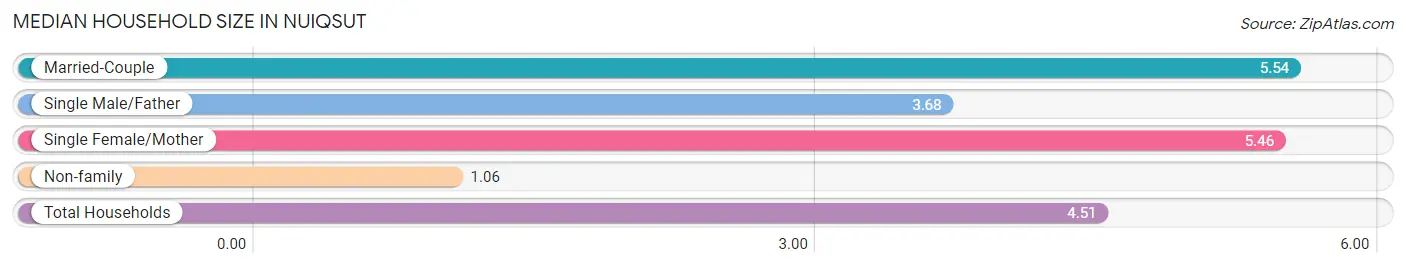
| Household Type | # Households | Household Size |
| Married-Couple | 37 (34.6%) | 5.54 |
| Single Male/Father | 19 (17.8%) | 3.68 |
| Single Female/Mother | 35 (32.7%) | 5.46 |
| Non-family | 16 (14.9%) | 1.06 |
| Total Households | 107 (100.0%) | 4.51 |
Household Size by Marriage Status in Nuiqsut
Out of a total of 107 households in Nuiqsut, 91 (85.1%) are family households, while 16 (14.9%) are nonfamily households. The most numerous type of family households are 7+ person households, comprising 20, and the most common type of nonfamily households are 1-person households, comprising 15.
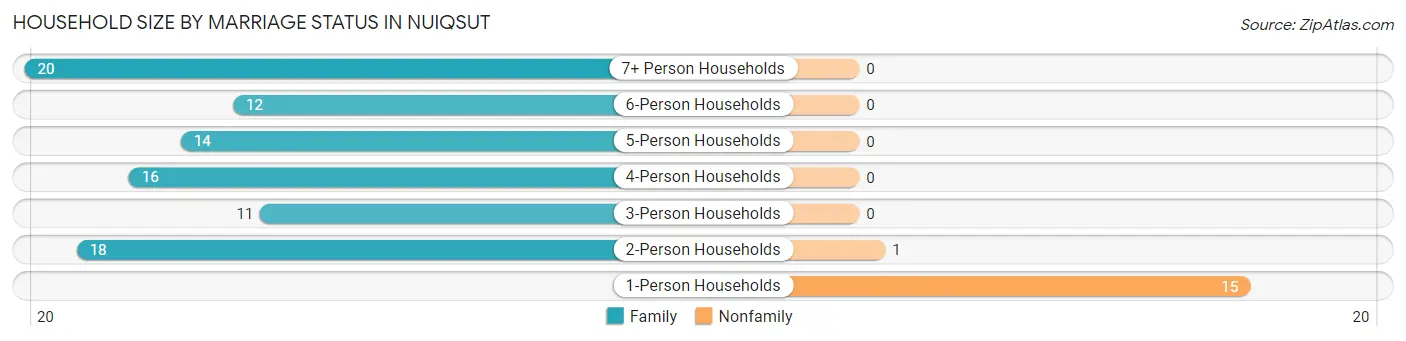
| Household Size | Family Households | Nonfamily Households |
| 1-Person Households | - | 15 (14.0%) |
| 2-Person Households | 18 (16.8%) | 1 (0.9%) |
| 3-Person Households | 11 (10.3%) | 0 (0.0%) |
| 4-Person Households | 16 (14.9%) | 0 (0.0%) |
| 5-Person Households | 14 (13.1%) | 0 (0.0%) |
| 6-Person Households | 12 (11.2%) | 0 (0.0%) |
| 7+ Person Households | 20 (18.7%) | 0 (0.0%) |
| Total | 91 (85.1%) | 16 (14.9%) |
Female Fertility in Nuiqsut
Fertility by Age in Nuiqsut
Average fertility rate in Nuiqsut is 128.0 births per 1,000 women. Women in the age bracket of 20 to 34 years have the highest fertility rate with 185.0 births per 1,000 women. Women in the age bracket of 20 to 34 years acount for 63.2% of all women with births.
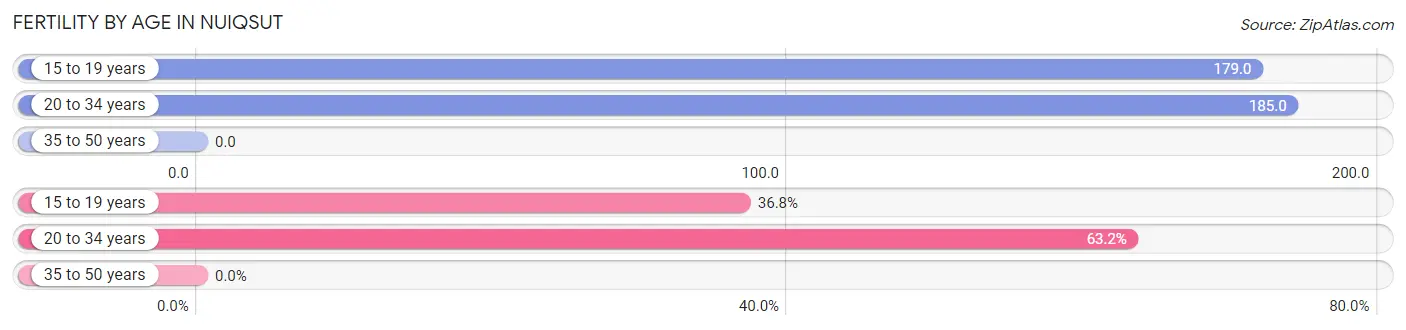
| Age Bracket | Women with Births | Births / 1,000 Women |
| 15 to 19 years | 7 (36.8%) | 179.0 |
| 20 to 34 years | 12 (63.2%) | 185.0 |
| 35 to 50 years | 0 (0.0%) | 0.0 |
| Total | 19 (100.0%) | 128.0 |
Fertility by Age by Marriage Status in Nuiqsut
26.3% of women with births (19) in Nuiqsut are married. The highest percentage of unmarried women with births falls into 15 to 19 years age bracket with 100.0% of them unmarried at the time of birth, while the lowest percentage of unmarried women with births belong to 20 to 34 years age bracket with 58.3% of them unmarried.
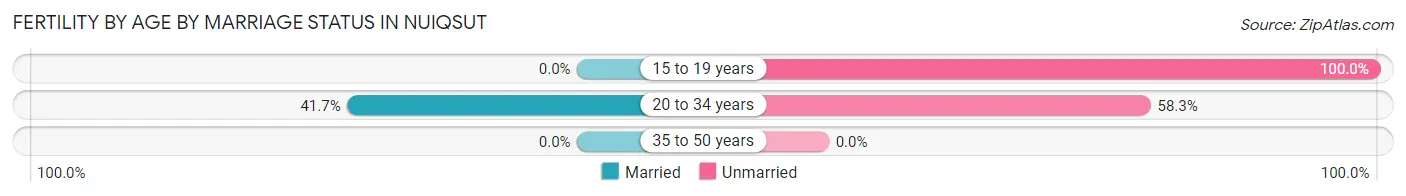
| Age Bracket | Married | Unmarried |
| 15 to 19 years | 0 (0.0%) | 7 (100.0%) |
| 20 to 34 years | 5 (41.7%) | 7 (58.3%) |
| 35 to 50 years | 0 (0.0%) | 0 (0.0%) |
| Total | 5 (26.3%) | 14 (73.7%) |
Fertility by Education in Nuiqsut
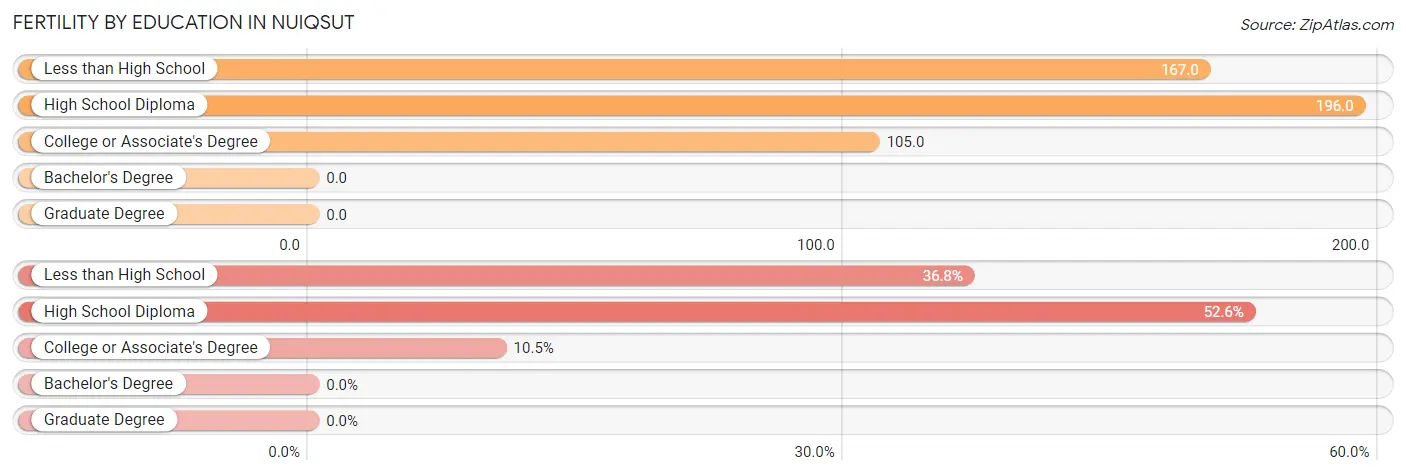
| Educational Attainment | Women with Births | Births / 1,000 Women |
| Less than High School | 7 (36.8%) | 167.0 |
| High School Diploma | 10 (52.6%) | 196.0 |
| College or Associate's Degree | 2 (10.5%) | 105.0 |
| Bachelor's Degree | 0 (0.0%) | 0.0 |
| Graduate Degree | 0 (0.0%) | 0.0 |
| Total | 19 (100.0%) | 128.0 |
Fertility by Education by Marriage Status in Nuiqsut
73.7% of women with births in Nuiqsut are unmarried. Women with the educational attainment of high school diploma are most likely to be married with 50.0% of them married at childbirth, while women with the educational attainment of less than high school are least likely to be married with 100.0% of them unmarried at childbirth.
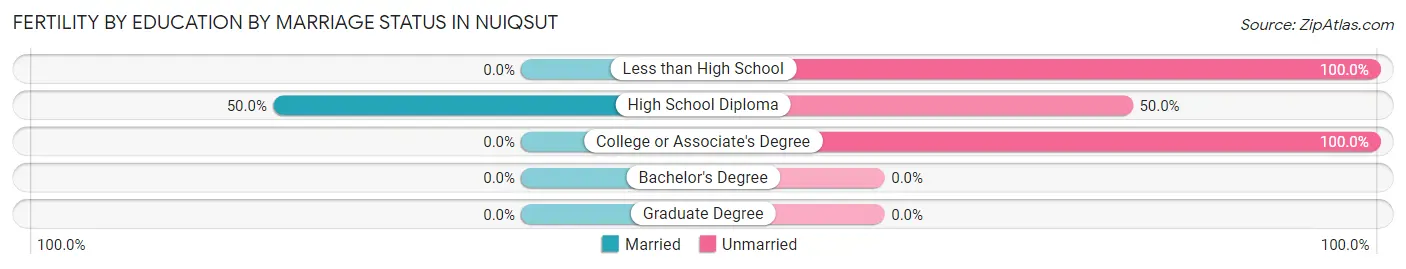
| Educational Attainment | Married | Unmarried |
| Less than High School | 0 (0.0%) | 7 (100.0%) |
| High School Diploma | 5 (50.0%) | 5 (50.0%) |
| College or Associate's Degree | 0 (0.0%) | 2 (100.0%) |
| Bachelor's Degree | 0 (0.0%) | 0 (0.0%) |
| Graduate Degree | 0 (0.0%) | 0 (0.0%) |
| Total | 5 (26.3%) | 14 (73.7%) |
Employment Characteristics in Nuiqsut
Employment by Class of Employer in Nuiqsut
Among the 187 employed individuals in Nuiqsut, state government employees (57 | 30.5%), private company employees (52 | 27.8%), and local government employees (49 | 26.2%) make up the most common classes of employment.
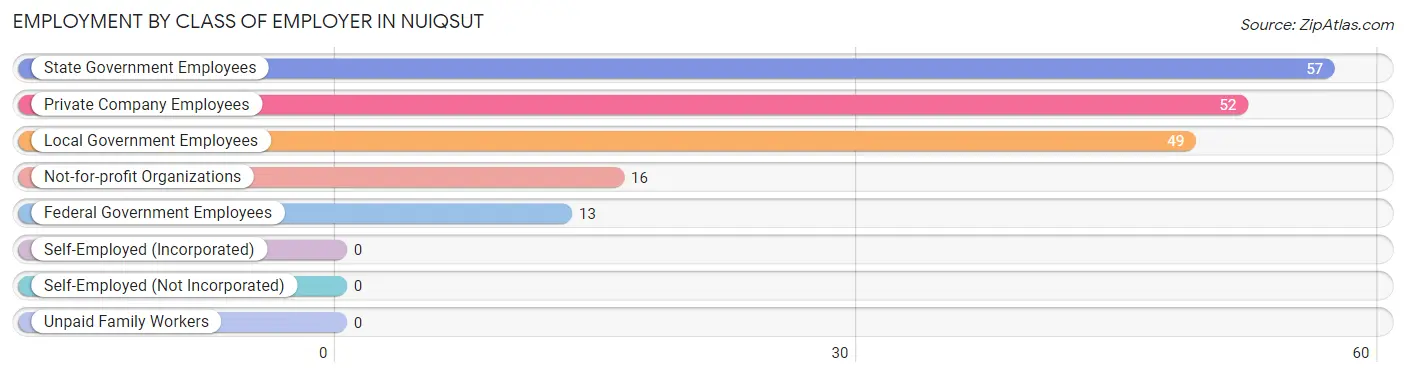
| Employer Class | # Employees | % Employees |
| Private Company Employees | 52 | 27.8% |
| Self-Employed (Incorporated) | 0 | 0.0% |
| Self-Employed (Not Incorporated) | 0 | 0.0% |
| Not-for-profit Organizations | 16 | 8.6% |
| Local Government Employees | 49 | 26.2% |
| State Government Employees | 57 | 30.5% |
| Federal Government Employees | 13 | 7.0% |
| Unpaid Family Workers | 0 | 0.0% |
| Total | 187 | 100.0% |
Employment Status by Age in Nuiqsut
According to the labor force statistics for Nuiqsut, out of the total population over 16 years of age (339), 74.0% or 251 individuals are in the labor force, with 22.7% or 57 of them unemployed. The age group with the highest labor force participation rate is 20 to 24 years, with 100.0% or 49 individuals in the labor force. Within the labor force, the 16 to 19 years age range has the highest percentage of unemployed individuals, with 75.0% or 24 of them being unemployed.
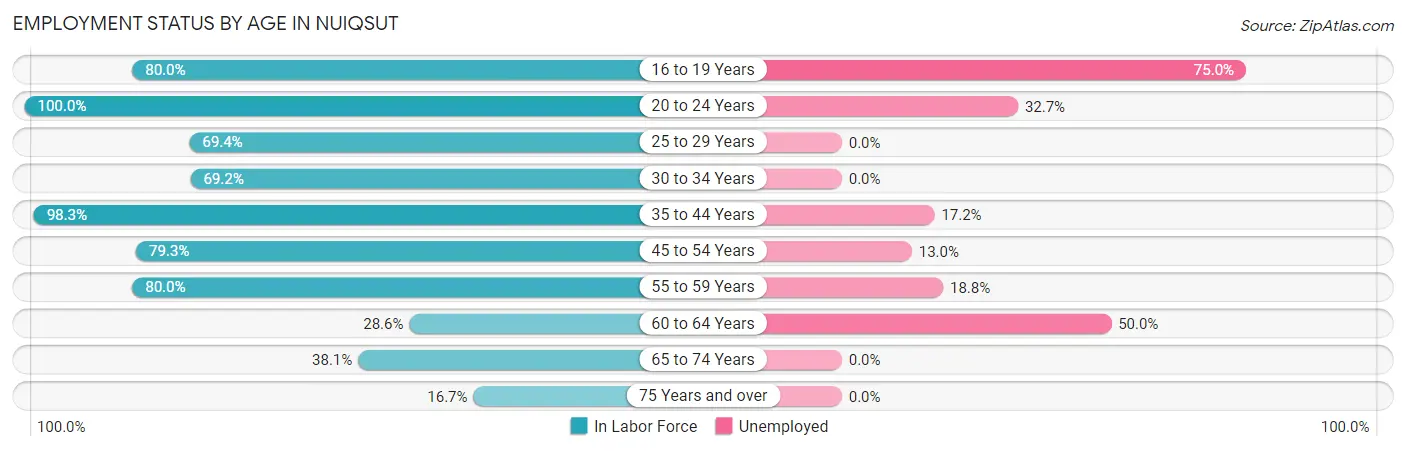
| Age Bracket | In Labor Force | Unemployed |
| 16 to 19 Years | 32 (80.0%) | 24 (75.0%) |
| 20 to 24 Years | 49 (100.0%) | 16 (32.7%) |
| 25 to 29 Years | 34 (69.4%) | 0 (0.0%) |
| 30 to 34 Years | 18 (69.2%) | 0 (0.0%) |
| 35 to 44 Years | 58 (98.3%) | 10 (17.2%) |
| 45 to 54 Years | 23 (79.3%) | 3 (13.0%) |
| 55 to 59 Years | 16 (80.0%) | 3 (18.8%) |
| 60 to 64 Years | 2 (28.6%) | 1 (50.0%) |
| 65 to 74 Years | 16 (38.1%) | 0 (0.0%) |
| 75 Years and over | 3 (16.7%) | 0 (0.0%) |
| Total | 251 (74.0%) | 57 (22.7%) |
Employment Status by Educational Attainment in Nuiqsut
According to labor force statistics for Nuiqsut, 79.5% of individuals (151) out of the total population between 25 and 64 years of age (190) are in the labor force, with 11.3% or 17 of them being unemployed. The group with the highest labor force participation rate are those with the educational attainment of bachelor's degree or higher, with 100.0% or 41 individuals in the labor force. Within the labor force, individuals with less than high school education have the highest percentage of unemployment, with 24.1% or 7 of them being unemployed.
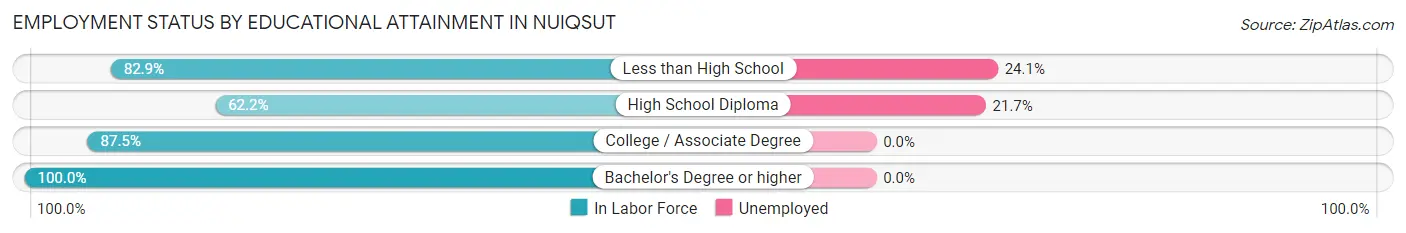
| Educational Attainment | In Labor Force | Unemployed |
| Less than High School | 29 (82.9%) | 8 (24.1%) |
| High School Diploma | 46 (62.2%) | 16 (21.7%) |
| College / Associate Degree | 35 (87.5%) | 0 (0.0%) |
| Bachelor's Degree or higher | 41 (100.0%) | 0 (0.0%) |
| Total | 151 (79.5%) | 21 (11.3%) |
Employment Occupations by Sex in Nuiqsut
Management, Business, Science and Arts Occupations
The most common Management, Business, Science and Arts occupations in Nuiqsut are Community & Social Service (68 | 35.0%), Education Instruction & Library (59 | 30.4%), Management (22 | 11.3%), Education, Arts & Media (9 | 4.6%), and Business & Financial (5 | 2.6%).
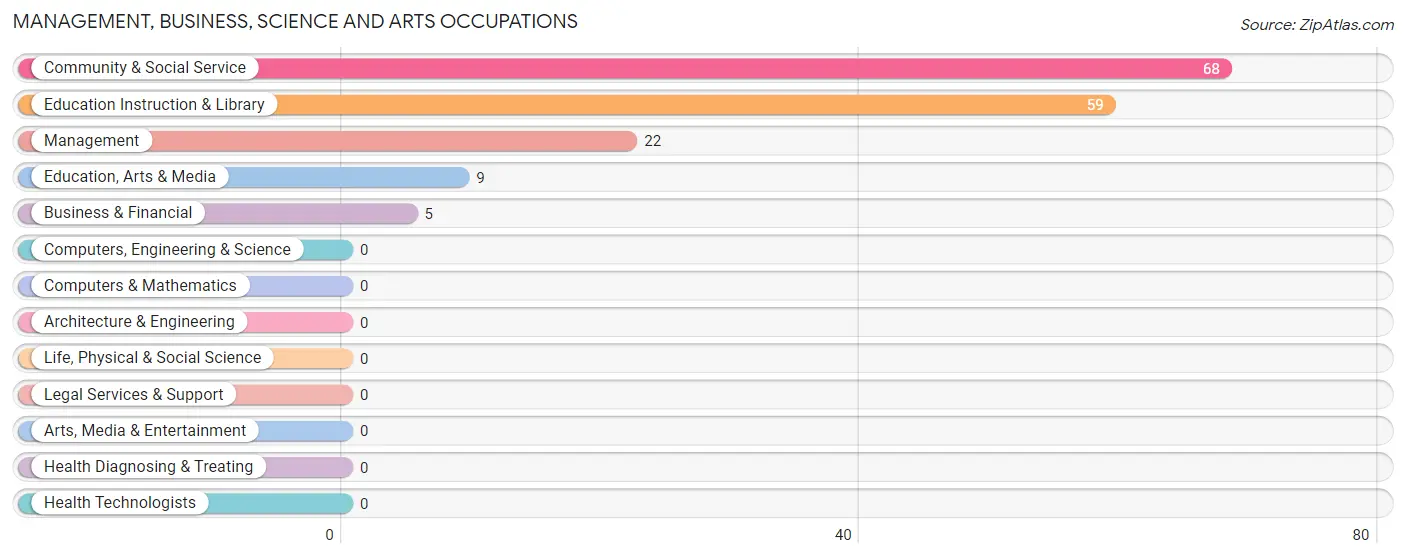
Management, Business, Science and Arts Occupations by Sex
Within the Management, Business, Science and Arts occupations in Nuiqsut, the most male-oriented occupations are Management (40.9%), Education Instruction & Library (32.2%), and Community & Social Service (27.9%), while the most female-oriented occupations are Business & Financial (100.0%), Education, Arts & Media (100.0%), and Community & Social Service (72.1%).
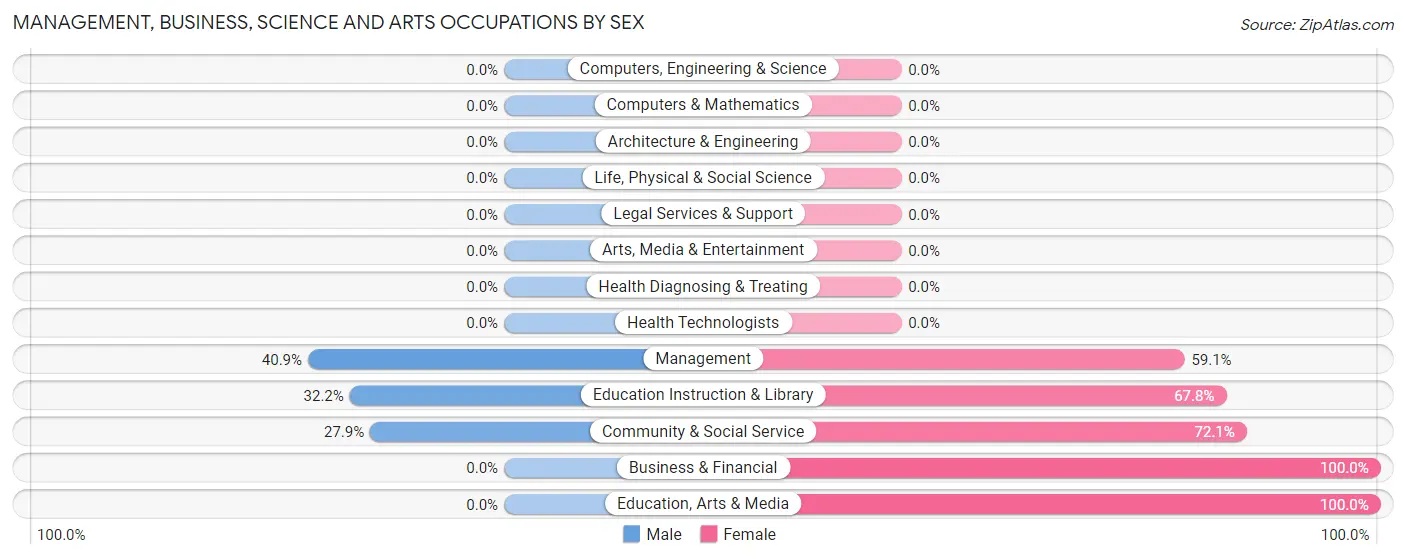
| Occupation | Male | Female |
| Management | 9 (40.9%) | 13 (59.1%) |
| Business & Financial | 0 (0.0%) | 5 (100.0%) |
| Computers, Engineering & Science | 0 (0.0%) | 0 (0.0%) |
| Computers & Mathematics | 0 (0.0%) | 0 (0.0%) |
| Architecture & Engineering | 0 (0.0%) | 0 (0.0%) |
| Life, Physical & Social Science | 0 (0.0%) | 0 (0.0%) |
| Community & Social Service | 19 (27.9%) | 49 (72.1%) |
| Education, Arts & Media | 0 (0.0%) | 9 (100.0%) |
| Legal Services & Support | 0 (0.0%) | 0 (0.0%) |
| Education Instruction & Library | 19 (32.2%) | 40 (67.8%) |
| Arts, Media & Entertainment | 0 (0.0%) | 0 (0.0%) |
| Health Diagnosing & Treating | 0 (0.0%) | 0 (0.0%) |
| Health Technologists | 0 (0.0%) | 0 (0.0%) |
| Total (Category) | 28 (29.5%) | 67 (70.5%) |
| Total (Overall) | 80 (41.2%) | 114 (58.8%) |
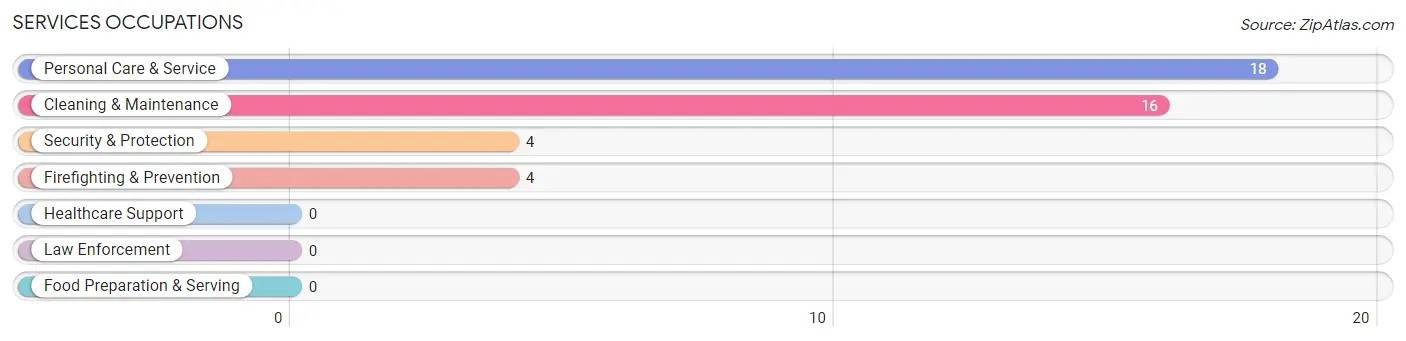
Services Occupations
The most common Services occupations in Nuiqsut are Personal Care & Service (18 | 9.3%), Cleaning & Maintenance (16 | 8.3%), Security & Protection (4 | 2.1%), and Firefighting & Prevention (4 | 2.1%).
Services Occupations by Sex
Within the Services occupations in Nuiqsut, the most male-oriented occupations are Personal Care & Service (38.9%), and Cleaning & Maintenance (37.5%), while the most female-oriented occupations are Security & Protection (100.0%), Firefighting & Prevention (100.0%), and Cleaning & Maintenance (62.5%).
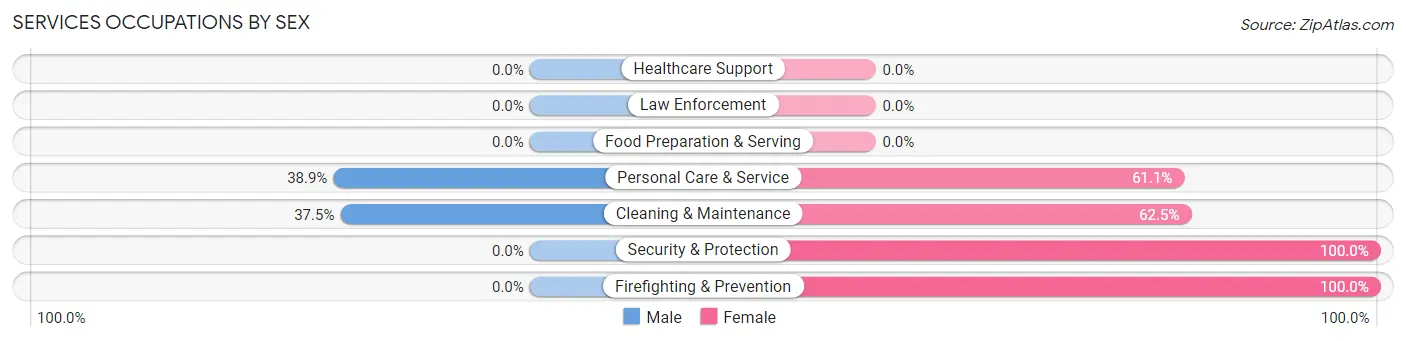
| Occupation | Male | Female |
| Healthcare Support | 0 (0.0%) | 0 (0.0%) |
| Security & Protection | 0 (0.0%) | 4 (100.0%) |
| Firefighting & Prevention | 0 (0.0%) | 4 (100.0%) |
| Law Enforcement | 0 (0.0%) | 0 (0.0%) |
| Food Preparation & Serving | 0 (0.0%) | 0 (0.0%) |
| Cleaning & Maintenance | 6 (37.5%) | 10 (62.5%) |
| Personal Care & Service | 7 (38.9%) | 11 (61.1%) |
| Total (Category) | 13 (34.2%) | 25 (65.8%) |
| Total (Overall) | 80 (41.2%) | 114 (58.8%) |
Sales and Office Occupations
The most common Sales and Office occupations in Nuiqsut are Office & Administration (18 | 9.3%), and Sales & Related (1 | 0.5%).
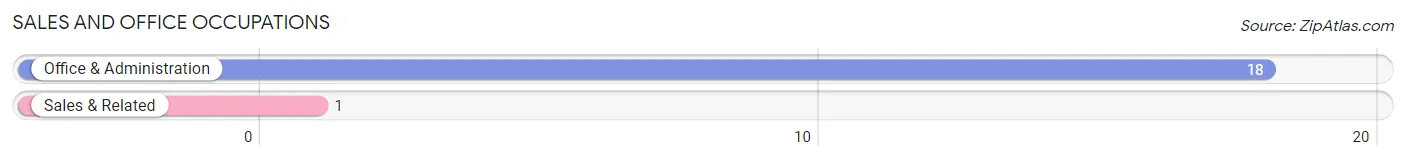
Sales and Office Occupations by Sex
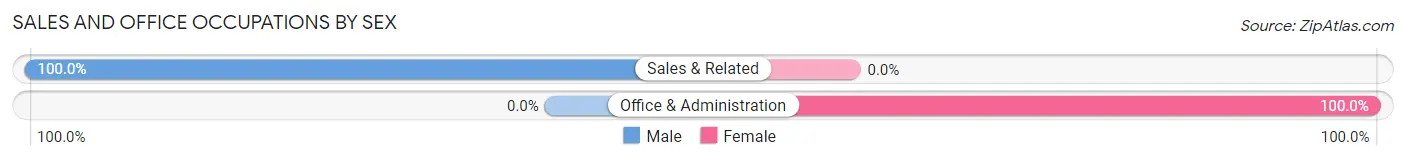
| Occupation | Male | Female |
| Sales & Related | 1 (100.0%) | 0 (0.0%) |
| Office & Administration | 0 (0.0%) | 18 (100.0%) |
| Total (Category) | 1 (5.3%) | 18 (94.7%) |
| Total (Overall) | 80 (41.2%) | 114 (58.8%) |
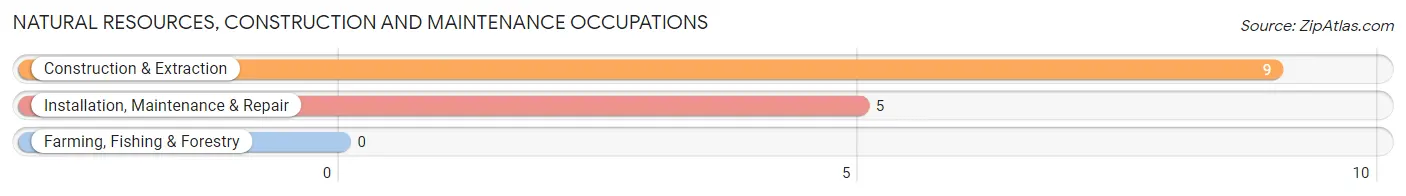
Natural Resources, Construction and Maintenance Occupations
The most common Natural Resources, Construction and Maintenance occupations in Nuiqsut are Construction & Extraction (9 | 4.6%), and Installation, Maintenance & Repair (5 | 2.6%).
Natural Resources, Construction and Maintenance Occupations by Sex
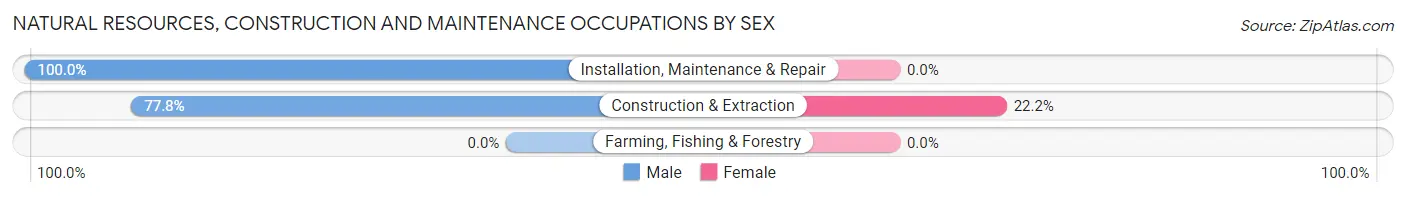
| Occupation | Male | Female |
| Farming, Fishing & Forestry | 0 (0.0%) | 0 (0.0%) |
| Construction & Extraction | 7 (77.8%) | 2 (22.2%) |
| Installation, Maintenance & Repair | 5 (100.0%) | 0 (0.0%) |
| Total (Category) | 12 (85.7%) | 2 (14.3%) |
| Total (Overall) | 80 (41.2%) | 114 (58.8%) |
Production, Transportation and Moving Occupations
The most common Production, Transportation and Moving occupations in Nuiqsut are Material Moving (12 | 6.2%), Production (8 | 4.1%), and Transportation (8 | 4.1%).
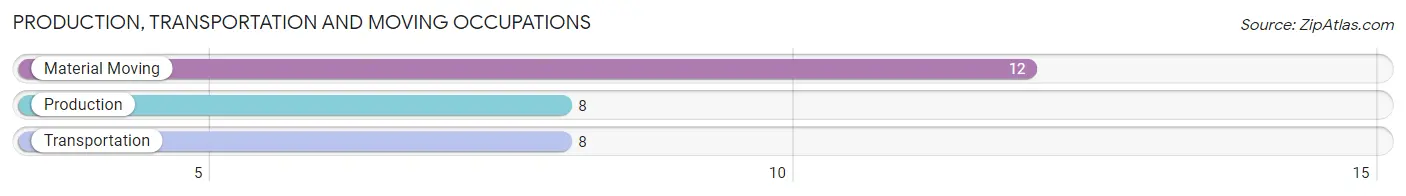
Production, Transportation and Moving Occupations by Sex
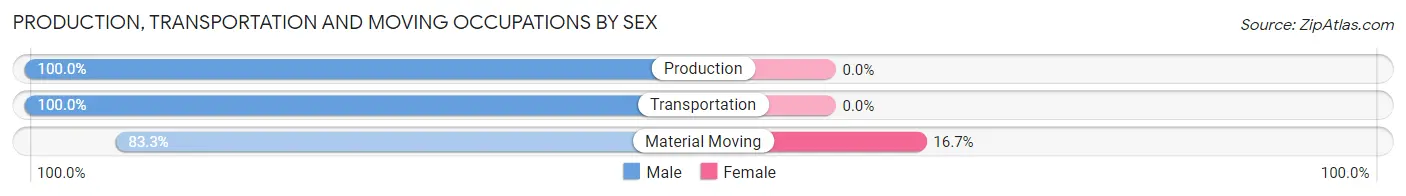
| Occupation | Male | Female |
| Production | 8 (100.0%) | 0 (0.0%) |
| Transportation | 8 (100.0%) | 0 (0.0%) |
| Material Moving | 10 (83.3%) | 2 (16.7%) |
| Total (Category) | 26 (92.9%) | 2 (7.1%) |
| Total (Overall) | 80 (41.2%) | 114 (58.8%) |
Employment Industries by Sex in Nuiqsut
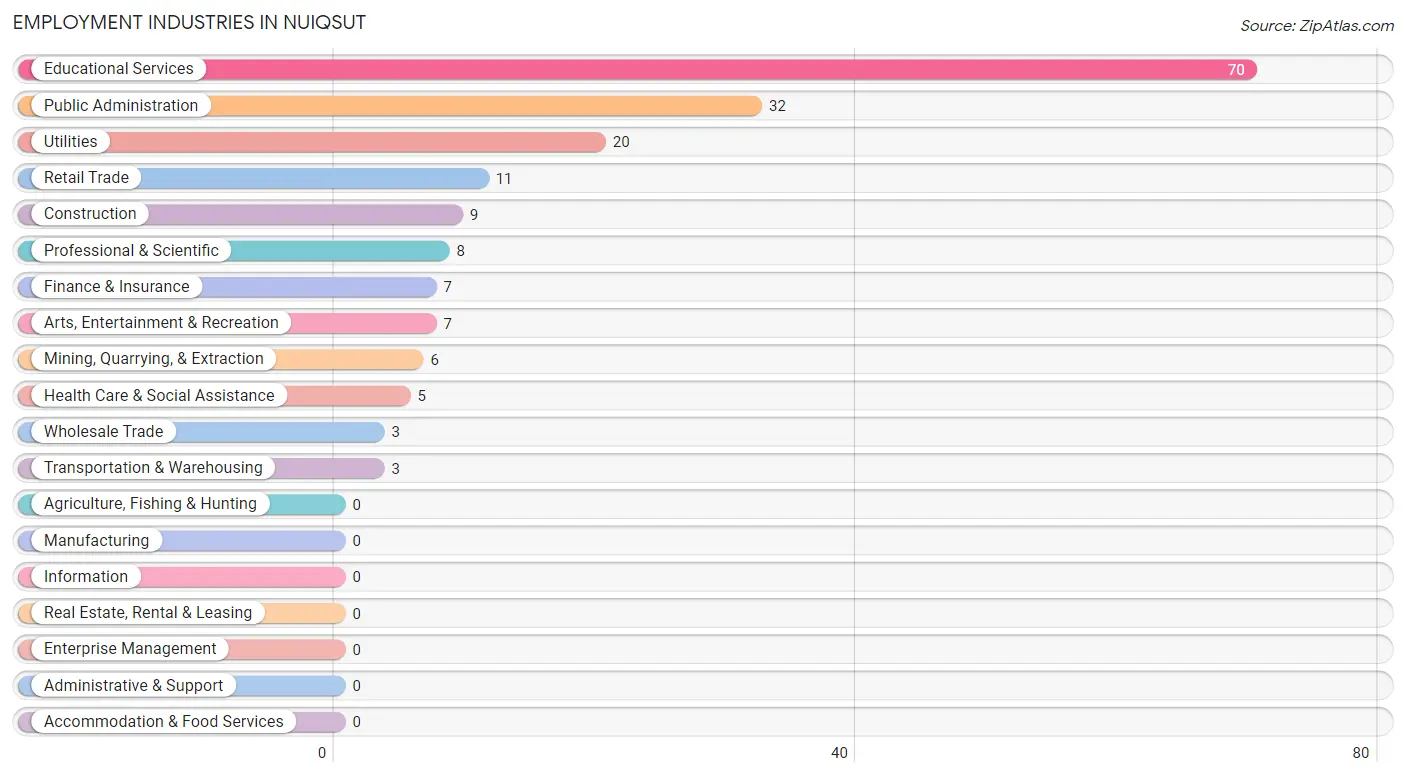
Employment Industries in Nuiqsut
The major employment industries in Nuiqsut include Educational Services (70 | 36.1%), Public Administration (32 | 16.5%), Utilities (20 | 10.3%), Retail Trade (11 | 5.7%), and Construction (9 | 4.6%).
Employment Industries by Sex in Nuiqsut
The Nuiqsut industries that see more men than women are Wholesale Trade (100.0%), Professional & Scientific (100.0%), and Retail Trade (81.8%), whereas the industries that tend to have a higher number of women are Health Care & Social Assistance (100.0%), Public Administration (71.9%), and Educational Services (71.4%).
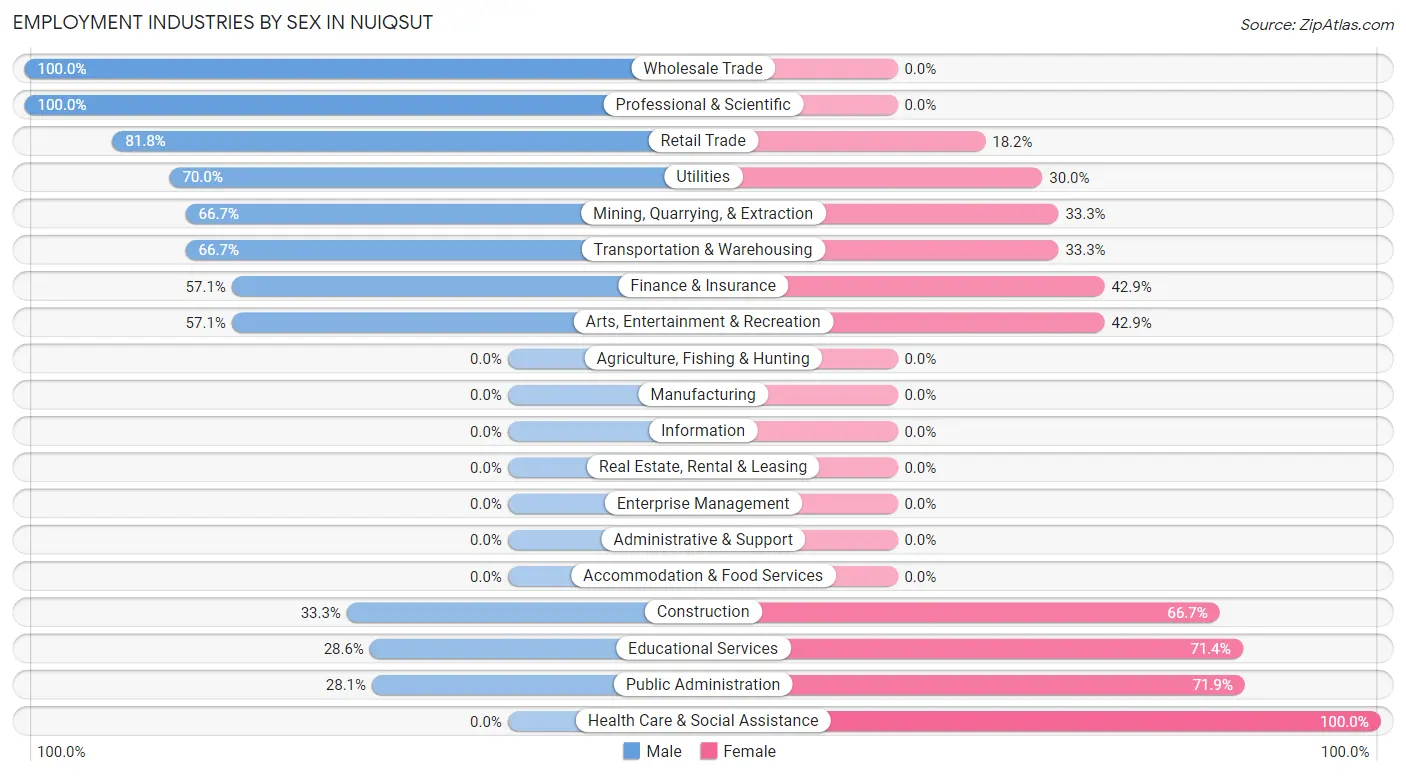
| Industry | Male | Female |
| Agriculture, Fishing & Hunting | 0 (0.0%) | 0 (0.0%) |
| Mining, Quarrying, & Extraction | 4 (66.7%) | 2 (33.3%) |
| Construction | 3 (33.3%) | 6 (66.7%) |
| Manufacturing | 0 (0.0%) | 0 (0.0%) |
| Wholesale Trade | 3 (100.0%) | 0 (0.0%) |
| Retail Trade | 9 (81.8%) | 2 (18.2%) |
| Transportation & Warehousing | 2 (66.7%) | 1 (33.3%) |
| Utilities | 14 (70.0%) | 6 (30.0%) |
| Information | 0 (0.0%) | 0 (0.0%) |
| Finance & Insurance | 4 (57.1%) | 3 (42.9%) |
| Real Estate, Rental & Leasing | 0 (0.0%) | 0 (0.0%) |
| Professional & Scientific | 8 (100.0%) | 0 (0.0%) |
| Enterprise Management | 0 (0.0%) | 0 (0.0%) |
| Administrative & Support | 0 (0.0%) | 0 (0.0%) |
| Educational Services | 20 (28.6%) | 50 (71.4%) |
| Health Care & Social Assistance | 0 (0.0%) | 5 (100.0%) |
| Arts, Entertainment & Recreation | 4 (57.1%) | 3 (42.9%) |
| Accommodation & Food Services | 0 (0.0%) | 0 (0.0%) |
| Public Administration | 9 (28.1%) | 23 (71.9%) |
| Total | 80 (41.2%) | 114 (58.8%) |
Education in Nuiqsut
School Enrollment in Nuiqsut
The most common levels of schooling among the 224 students in Nuiqsut are elementary school (53 | 23.7%), high school (45 | 20.1%), and middle school (31 | 13.8%).
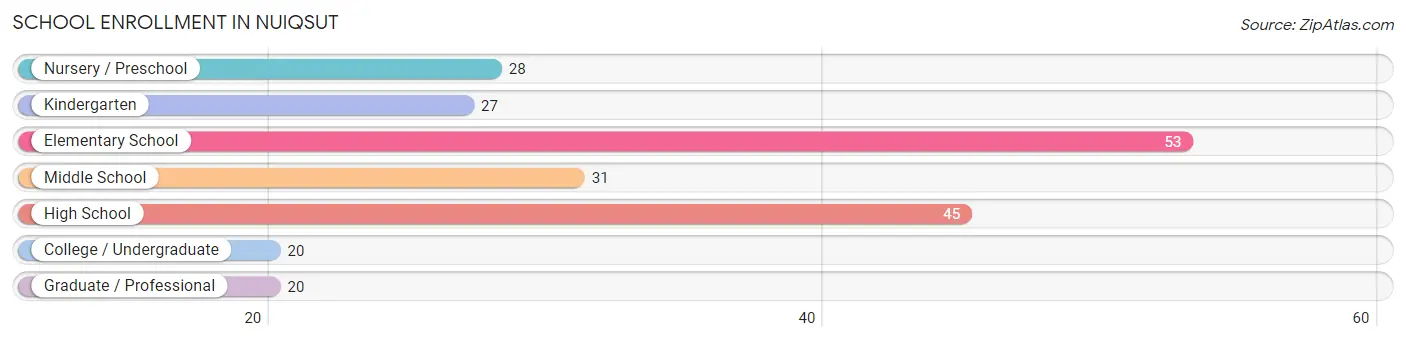
| School Level | # Students | % Students |
| Nursery / Preschool | 28 | 12.5% |
| Kindergarten | 27 | 12.0% |
| Elementary School | 53 | 23.7% |
| Middle School | 31 | 13.8% |
| High School | 45 | 20.1% |
| College / Undergraduate | 20 | 8.9% |
| Graduate / Professional | 20 | 8.9% |
| Total | 224 | 100.0% |
School Enrollment by Age by Funding Source in Nuiqsut
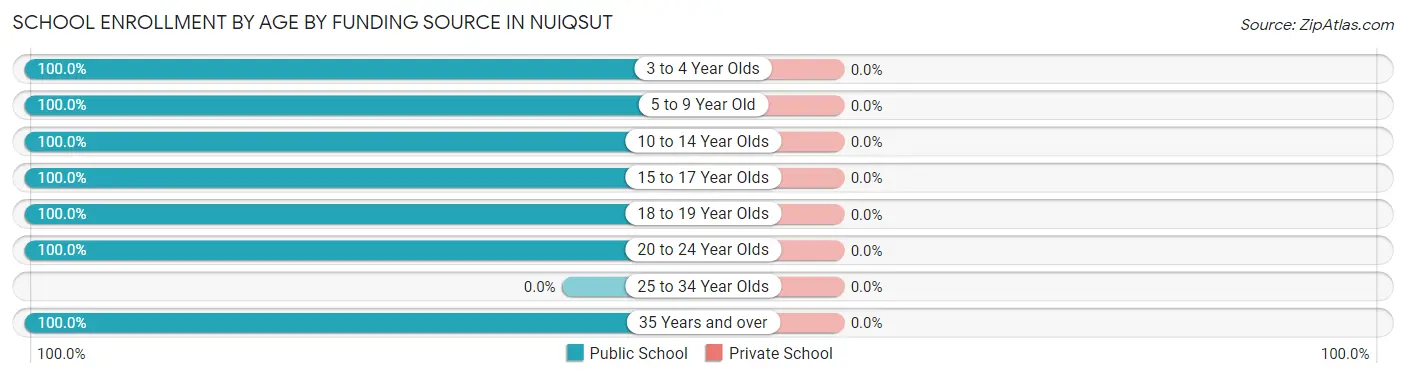
| Age Bracket | Public School | Private School |
| 3 to 4 Year Olds | 25 (100.0%) | 0 (0.0%) |
| 5 to 9 Year Old | 79 (100.0%) | 0 (0.0%) |
| 10 to 14 Year Olds | 36 (100.0%) | 0 (0.0%) |
| 15 to 17 Year Olds | 26 (100.0%) | 0 (0.0%) |
| 18 to 19 Year Olds | 15 (100.0%) | 0 (0.0%) |
| 20 to 24 Year Olds | 12 (100.0%) | 0 (0.0%) |
| 25 to 34 Year Olds | 0 (0.0%) | 0 (0.0%) |
| 35 Years and over | 31 (100.0%) | 0 (0.0%) |
| Total | 224 (100.0%) | 0 (0.0%) |
Educational Attainment by Field of Study in Nuiqsut
Social sciences (20 | 27.4%), education (19 | 26.0%), liberal arts & history (11 | 15.1%), literature & languages (10 | 13.7%), and visual & performing arts (9 | 12.3%) are the most common fields of study among 73 individuals in Nuiqsut who have obtained a bachelor's degree or higher.
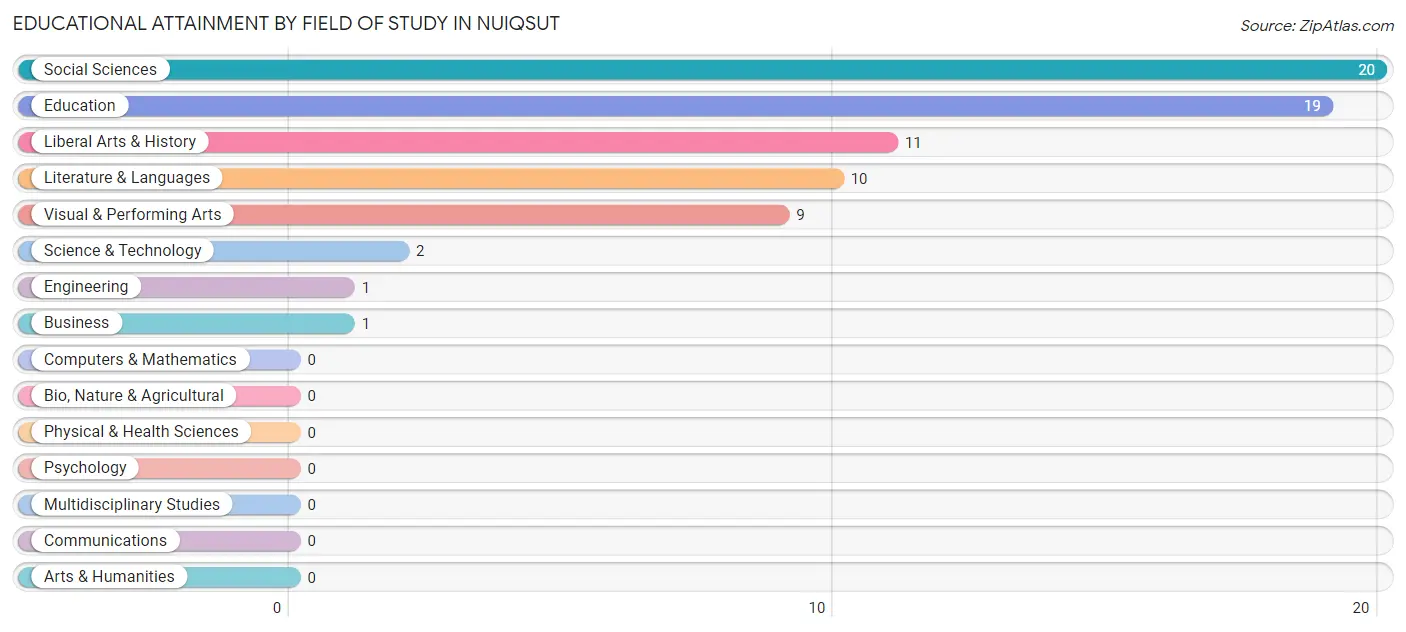
| Field of Study | # Graduates | % Graduates |
| Computers & Mathematics | 0 | 0.0% |
| Bio, Nature & Agricultural | 0 | 0.0% |
| Physical & Health Sciences | 0 | 0.0% |
| Psychology | 0 | 0.0% |
| Social Sciences | 20 | 27.4% |
| Engineering | 1 | 1.4% |
| Multidisciplinary Studies | 0 | 0.0% |
| Science & Technology | 2 | 2.7% |
| Business | 1 | 1.4% |
| Education | 19 | 26.0% |
| Literature & Languages | 10 | 13.7% |
| Liberal Arts & History | 11 | 15.1% |
| Visual & Performing Arts | 9 | 12.3% |
| Communications | 0 | 0.0% |
| Arts & Humanities | 0 | 0.0% |
| Total | 73 | 100.0% |
Transportation & Commute in Nuiqsut
Vehicle Availability by Sex in Nuiqsut
The most prevalent vehicle ownership categories in Nuiqsut are males with 1 vehicle (23, accounting for 38.3%) and females with 1 vehicle (31, making up 37.7%).
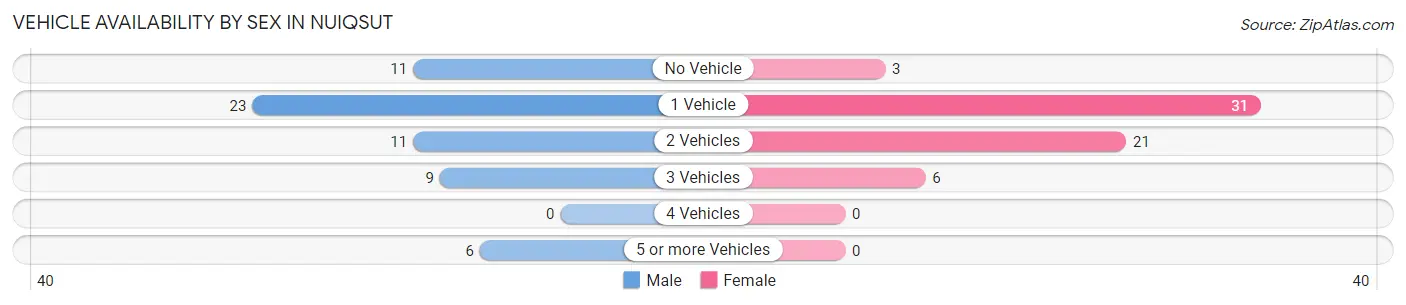
| Vehicles Available | Male | Female |
| No Vehicle | 11 (18.3%) | 3 (4.9%) |
| 1 Vehicle | 23 (38.3%) | 31 (50.8%) |
| 2 Vehicles | 11 (18.3%) | 21 (34.4%) |
| 3 Vehicles | 9 (15.0%) | 6 (9.8%) |
| 4 Vehicles | 0 (0.0%) | 0 (0.0%) |
| 5 or more Vehicles | 6 (10.0%) | 0 (0.0%) |
| Total | 60 (100.0%) | 61 (100.0%) |
Commute Time in Nuiqsut
The most frequently occuring commute durations in Nuiqsut are less than 5 minutes (91 commuters, 49.7%), 10 to 14 minutes (57 commuters, 31.1%), and 5 to 9 minutes (20 commuters, 10.9%).
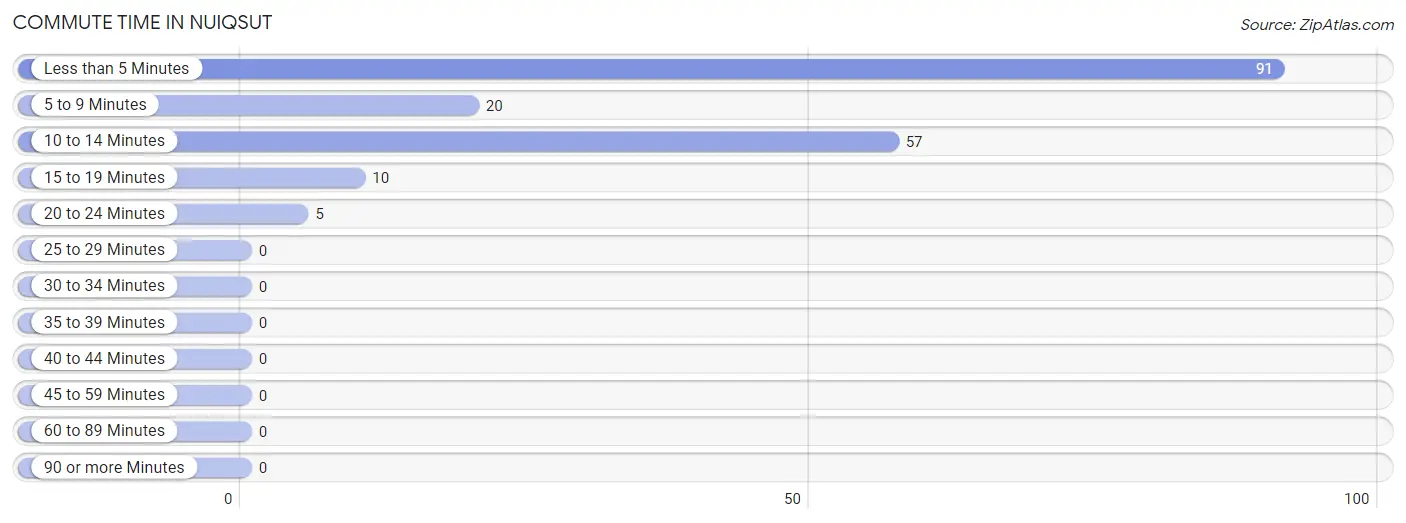
| Commute Time | # Commuters | % Commuters |
| Less than 5 Minutes | 91 | 49.7% |
| 5 to 9 Minutes | 20 | 10.9% |
| 10 to 14 Minutes | 57 | 31.1% |
| 15 to 19 Minutes | 10 | 5.5% |
| 20 to 24 Minutes | 5 | 2.7% |
| 25 to 29 Minutes | 0 | 0.0% |
| 30 to 34 Minutes | 0 | 0.0% |
| 35 to 39 Minutes | 0 | 0.0% |
| 40 to 44 Minutes | 0 | 0.0% |
| 45 to 59 Minutes | 0 | 0.0% |
| 60 to 89 Minutes | 0 | 0.0% |
| 90 or more Minutes | 0 | 0.0% |
Commute Time by Sex in Nuiqsut
The most common commute times in Nuiqsut are less than 5 minutes (37 commuters, 46.8%) for males and less than 5 minutes (54 commuters, 51.9%) for females.
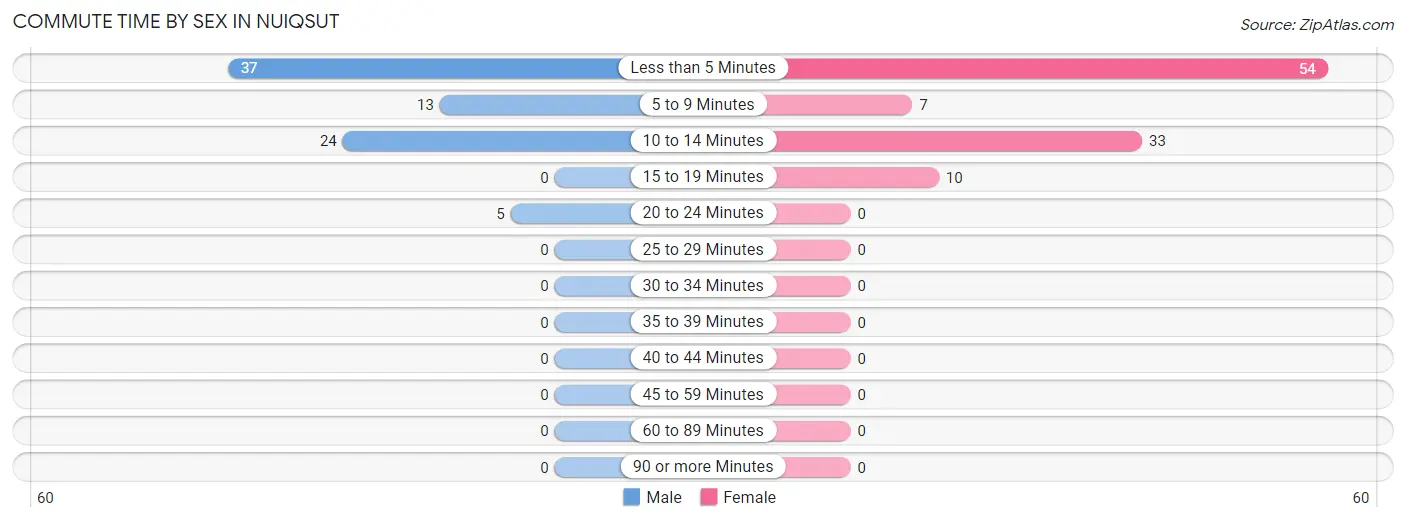
| Commute Time | Male | Female |
| Less than 5 Minutes | 37 (46.8%) | 54 (51.9%) |
| 5 to 9 Minutes | 13 (16.5%) | 7 (6.7%) |
| 10 to 14 Minutes | 24 (30.4%) | 33 (31.7%) |
| 15 to 19 Minutes | 0 (0.0%) | 10 (9.6%) |
| 20 to 24 Minutes | 5 (6.3%) | 0 (0.0%) |
| 25 to 29 Minutes | 0 (0.0%) | 0 (0.0%) |
| 30 to 34 Minutes | 0 (0.0%) | 0 (0.0%) |
| 35 to 39 Minutes | 0 (0.0%) | 0 (0.0%) |
| 40 to 44 Minutes | 0 (0.0%) | 0 (0.0%) |
| 45 to 59 Minutes | 0 (0.0%) | 0 (0.0%) |
| 60 to 89 Minutes | 0 (0.0%) | 0 (0.0%) |
| 90 or more Minutes | 0 (0.0%) | 0 (0.0%) |
Time of Departure to Work by Sex in Nuiqsut
The most frequent times of departure to work in Nuiqsut are 7:30 AM to 7:59 AM (11, 13.9%) for males and 7:30 AM to 7:59 AM (31, 29.8%) for females.
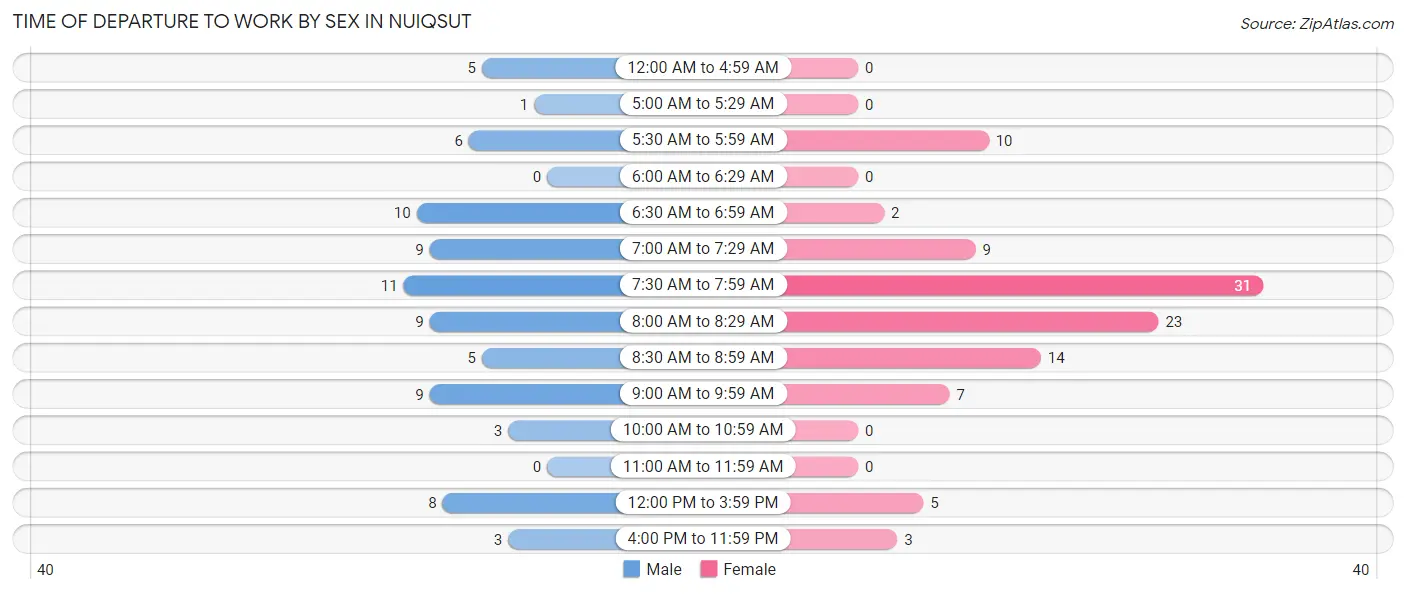
| Time of Departure | Male | Female |
| 12:00 AM to 4:59 AM | 5 (6.3%) | 0 (0.0%) |
| 5:00 AM to 5:29 AM | 1 (1.3%) | 0 (0.0%) |
| 5:30 AM to 5:59 AM | 6 (7.6%) | 10 (9.6%) |
| 6:00 AM to 6:29 AM | 0 (0.0%) | 0 (0.0%) |
| 6:30 AM to 6:59 AM | 10 (12.7%) | 2 (1.9%) |
| 7:00 AM to 7:29 AM | 9 (11.4%) | 9 (8.6%) |
| 7:30 AM to 7:59 AM | 11 (13.9%) | 31 (29.8%) |
| 8:00 AM to 8:29 AM | 9 (11.4%) | 23 (22.1%) |
| 8:30 AM to 8:59 AM | 5 (6.3%) | 14 (13.5%) |
| 9:00 AM to 9:59 AM | 9 (11.4%) | 7 (6.7%) |
| 10:00 AM to 10:59 AM | 3 (3.8%) | 0 (0.0%) |
| 11:00 AM to 11:59 AM | 0 (0.0%) | 0 (0.0%) |
| 12:00 PM to 3:59 PM | 8 (10.1%) | 5 (4.8%) |
| 4:00 PM to 11:59 PM | 3 (3.8%) | 3 (2.9%) |
| Total | 79 (100.0%) | 104 (100.0%) |
Housing Occupancy in Nuiqsut
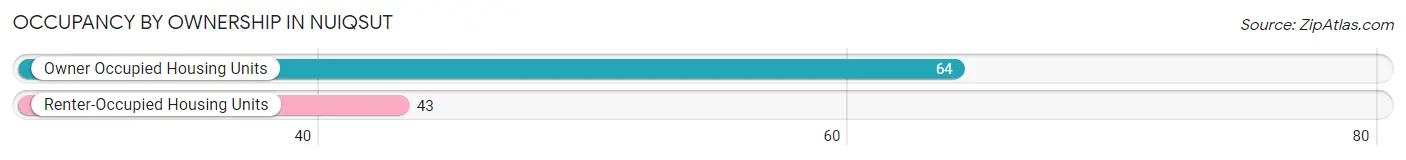
Occupancy by Ownership in Nuiqsut
Of the total 107 dwellings in Nuiqsut, owner-occupied units account for 64 (59.8%), while renter-occupied units make up 43 (40.2%).
| Occupancy | # Housing Units | % Housing Units |
| Owner Occupied Housing Units | 64 | 59.8% |
| Renter-Occupied Housing Units | 43 | 40.2% |
| Total Occupied Housing Units | 107 | 100.0% |
Occupancy by Household Size in Nuiqsut
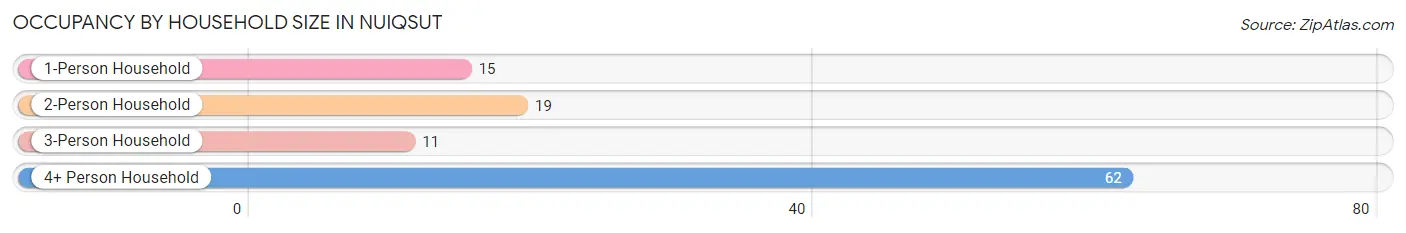
| Household Size | # Housing Units | % Housing Units |
| 1-Person Household | 15 | 14.0% |
| 2-Person Household | 19 | 17.8% |
| 3-Person Household | 11 | 10.3% |
| 4+ Person Household | 62 | 57.9% |
| Total Housing Units | 107 | 100.0% |
Occupancy by Ownership by Household Size in Nuiqsut
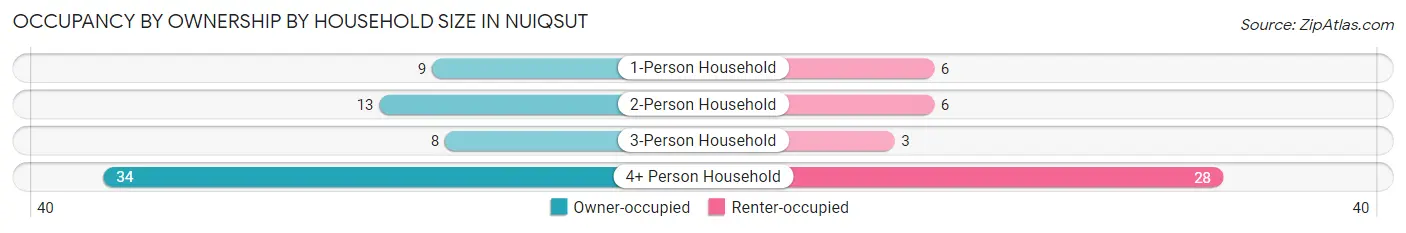
| Household Size | Owner-occupied | Renter-occupied |
| 1-Person Household | 9 (60.0%) | 6 (40.0%) |
| 2-Person Household | 13 (68.4%) | 6 (31.6%) |
| 3-Person Household | 8 (72.7%) | 3 (27.3%) |
| 4+ Person Household | 34 (54.8%) | 28 (45.2%) |
| Total Housing Units | 64 (59.8%) | 43 (40.2%) |
Occupancy by Educational Attainment in Nuiqsut
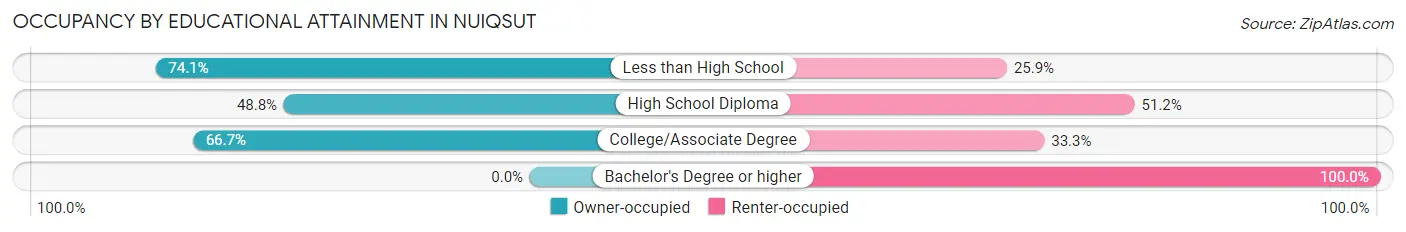
| Household Size | Owner-occupied | Renter-occupied |
| Less than High School | 20 (74.1%) | 7 (25.9%) |
| High School Diploma | 20 (48.8%) | 21 (51.2%) |
| College/Associate Degree | 24 (66.7%) | 12 (33.3%) |
| Bachelor's Degree or higher | 0 (0.0%) | 3 (100.0%) |
Occupancy by Age of Householder in Nuiqsut
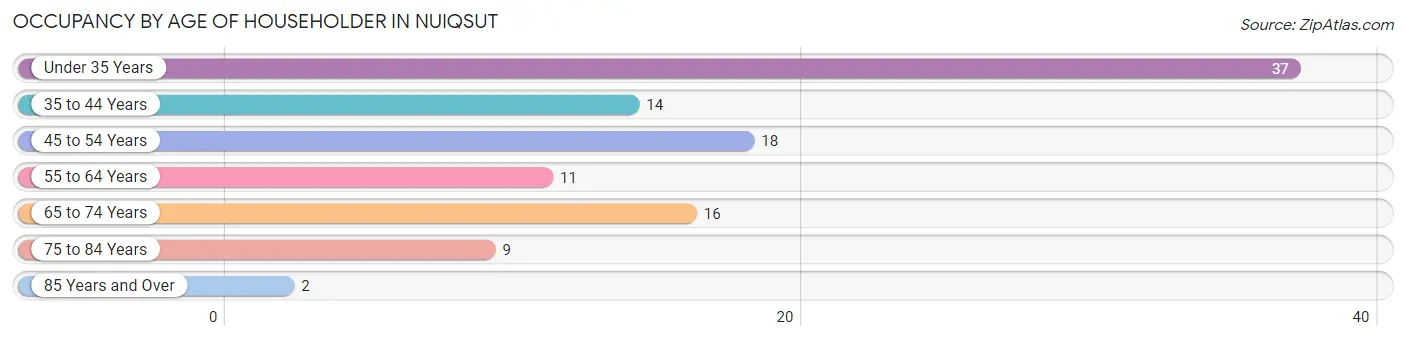
| Age Bracket | # Households | % Households |
| Under 35 Years | 37 | 34.6% |
| 35 to 44 Years | 14 | 13.1% |
| 45 to 54 Years | 18 | 16.8% |
| 55 to 64 Years | 11 | 10.3% |
| 65 to 74 Years | 16 | 14.9% |
| 75 to 84 Years | 9 | 8.4% |
| 85 Years and Over | 2 | 1.9% |
| Total | 107 | 100.0% |
Housing Finances in Nuiqsut
Median Income by Occupancy in Nuiqsut
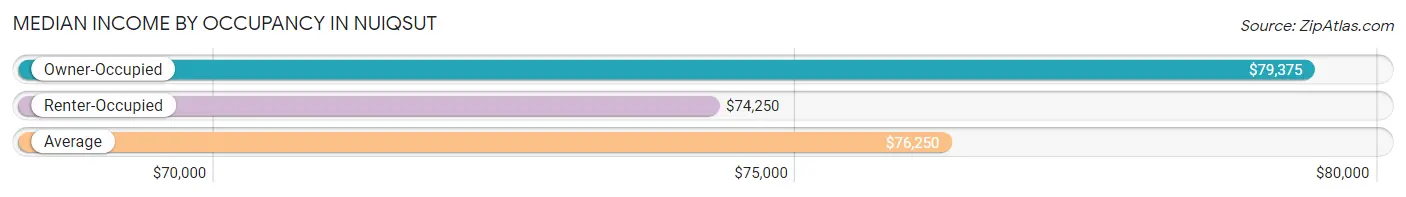
| Occupancy Type | # Households | Median Income |
| Owner-Occupied | 64 (59.8%) | $79,375 |
| Renter-Occupied | 43 (40.2%) | $74,250 |
| Average | 107 (100.0%) | $76,250 |
Occupancy by Householder Income Bracket in Nuiqsut
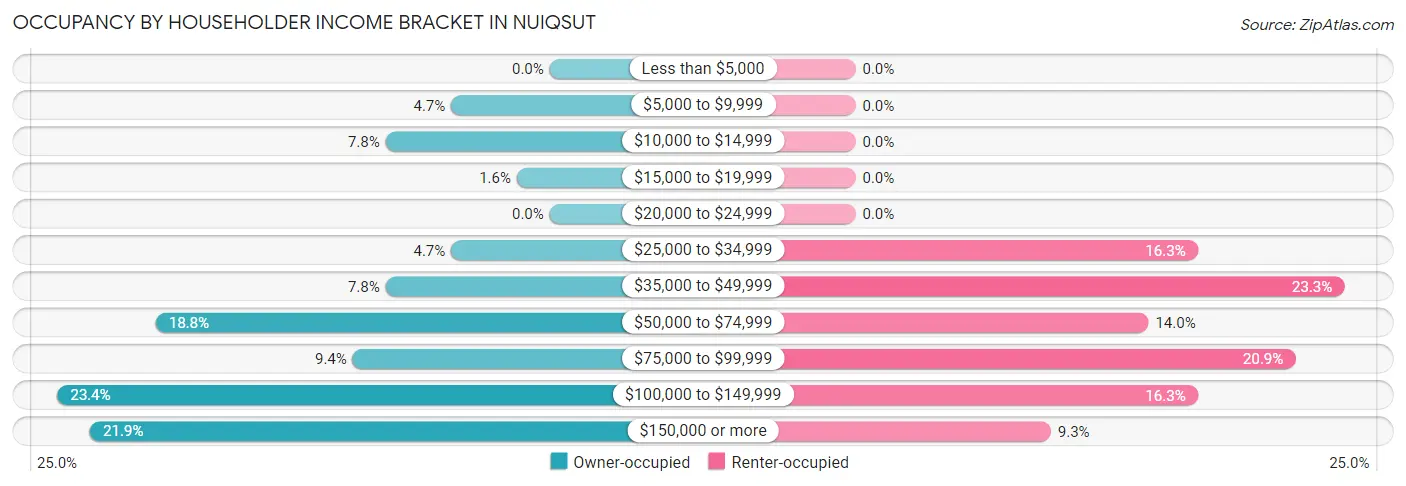
| Income Bracket | Owner-occupied | Renter-occupied |
| Less than $5,000 | 0 (0.0%) | 0 (0.0%) |
| $5,000 to $9,999 | 3 (4.7%) | 0 (0.0%) |
| $10,000 to $14,999 | 5 (7.8%) | 0 (0.0%) |
| $15,000 to $19,999 | 1 (1.6%) | 0 (0.0%) |
| $20,000 to $24,999 | 0 (0.0%) | 0 (0.0%) |
| $25,000 to $34,999 | 3 (4.7%) | 7 (16.3%) |
| $35,000 to $49,999 | 5 (7.8%) | 10 (23.3%) |
| $50,000 to $74,999 | 12 (18.8%) | 6 (14.0%) |
| $75,000 to $99,999 | 6 (9.4%) | 9 (20.9%) |
| $100,000 to $149,999 | 15 (23.4%) | 7 (16.3%) |
| $150,000 or more | 14 (21.9%) | 4 (9.3%) |
| Total | 64 (100.0%) | 43 (100.0%) |
Monthly Housing Cost Tiers in Nuiqsut
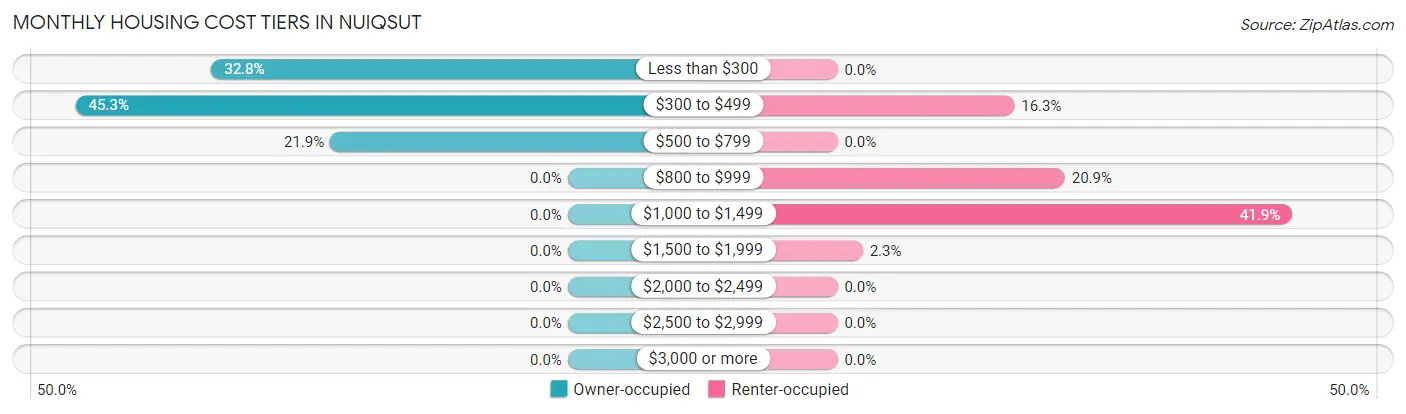
| Monthly Cost | Owner-occupied | Renter-occupied |
| Less than $300 | 21 (32.8%) | 0 (0.0%) |
| $300 to $499 | 29 (45.3%) | 7 (16.3%) |
| $500 to $799 | 14 (21.9%) | 0 (0.0%) |
| $800 to $999 | 0 (0.0%) | 9 (20.9%) |
| $1,000 to $1,499 | 0 (0.0%) | 18 (41.9%) |
| $1,500 to $1,999 | 0 (0.0%) | 1 (2.3%) |
| $2,000 to $2,499 | 0 (0.0%) | 0 (0.0%) |
| $2,500 to $2,999 | 0 (0.0%) | 0 (0.0%) |
| $3,000 or more | 0 (0.0%) | 0 (0.0%) |
| Total | 64 (100.0%) | 43 (100.0%) |
Physical Housing Characteristics in Nuiqsut
Housing Structures in Nuiqsut
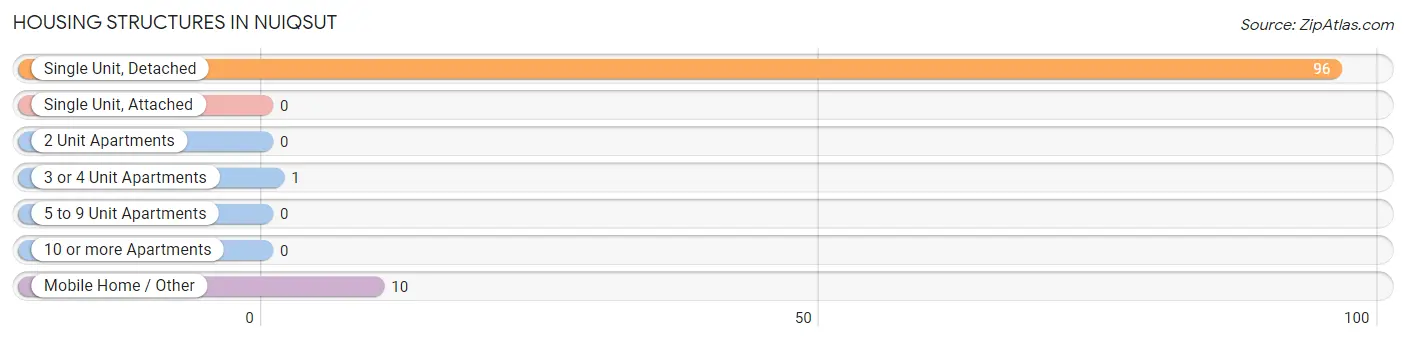
| Structure Type | # Housing Units | % Housing Units |
| Single Unit, Detached | 96 | 89.7% |
| Single Unit, Attached | 0 | 0.0% |
| 2 Unit Apartments | 0 | 0.0% |
| 3 or 4 Unit Apartments | 1 | 0.9% |
| 5 to 9 Unit Apartments | 0 | 0.0% |
| 10 or more Apartments | 0 | 0.0% |
| Mobile Home / Other | 10 | 9.3% |
| Total | 107 | 100.0% |
Housing Structures by Occupancy in Nuiqsut
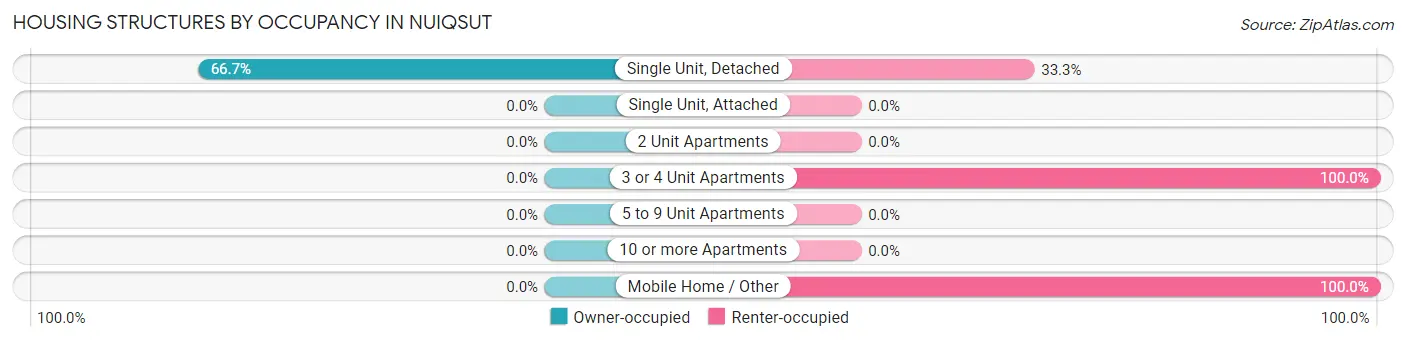
| Structure Type | Owner-occupied | Renter-occupied |
| Single Unit, Detached | 64 (66.7%) | 32 (33.3%) |
| Single Unit, Attached | 0 (0.0%) | 0 (0.0%) |
| 2 Unit Apartments | 0 (0.0%) | 0 (0.0%) |
| 3 or 4 Unit Apartments | 0 (0.0%) | 1 (100.0%) |
| 5 to 9 Unit Apartments | 0 (0.0%) | 0 (0.0%) |
| 10 or more Apartments | 0 (0.0%) | 0 (0.0%) |
| Mobile Home / Other | 0 (0.0%) | 10 (100.0%) |
| Total | 64 (59.8%) | 43 (40.2%) |
Housing Structures by Number of Rooms in Nuiqsut
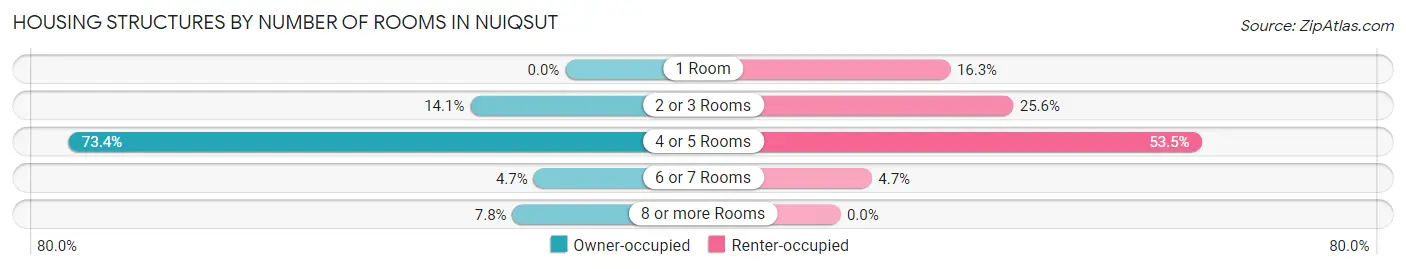
| Number of Rooms | Owner-occupied | Renter-occupied |
| 1 Room | 0 (0.0%) | 7 (16.3%) |
| 2 or 3 Rooms | 9 (14.1%) | 11 (25.6%) |
| 4 or 5 Rooms | 47 (73.4%) | 23 (53.5%) |
| 6 or 7 Rooms | 3 (4.7%) | 2 (4.6%) |
| 8 or more Rooms | 5 (7.8%) | 0 (0.0%) |
| Total | 64 (100.0%) | 43 (100.0%) |
Housing Structure by Heating Type in Nuiqsut
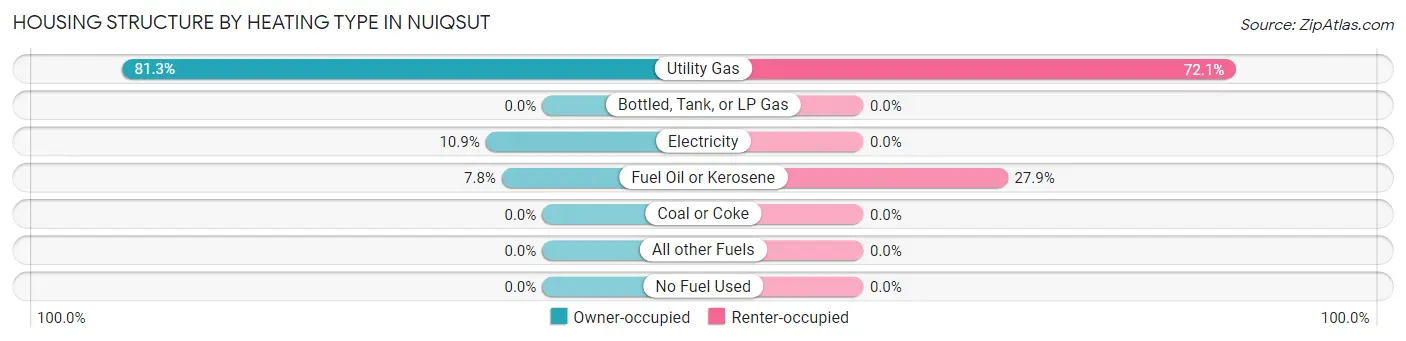
| Heating Type | Owner-occupied | Renter-occupied |
| Utility Gas | 52 (81.2%) | 31 (72.1%) |
| Bottled, Tank, or LP Gas | 0 (0.0%) | 0 (0.0%) |
| Electricity | 7 (10.9%) | 0 (0.0%) |
| Fuel Oil or Kerosene | 5 (7.8%) | 12 (27.9%) |
| Coal or Coke | 0 (0.0%) | 0 (0.0%) |
| All other Fuels | 0 (0.0%) | 0 (0.0%) |
| No Fuel Used | 0 (0.0%) | 0 (0.0%) |
| Total | 64 (100.0%) | 43 (100.0%) |
Household Vehicle Usage in Nuiqsut
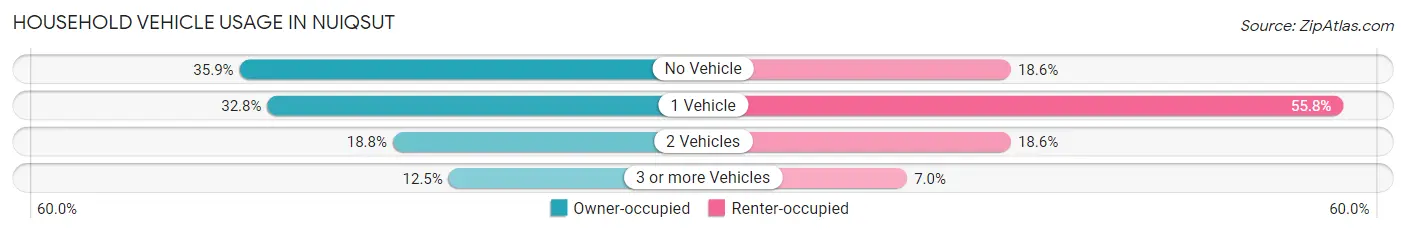
| Vehicles per Household | Owner-occupied | Renter-occupied |
| No Vehicle | 23 (35.9%) | 8 (18.6%) |
| 1 Vehicle | 21 (32.8%) | 24 (55.8%) |
| 2 Vehicles | 12 (18.8%) | 8 (18.6%) |
| 3 or more Vehicles | 8 (12.5%) | 3 (7.0%) |
| Total | 64 (100.0%) | 43 (100.0%) |
Real Estate & Mortgages in Nuiqsut
Real Estate and Mortgage Overview in Nuiqsut
| Characteristic | Without Mortgage | With Mortgage |
| Housing Units | 57 | 7 |
| Median Property Value | $99,800 | $193,800 |
| Median Household Income | $78,438 | $0 |
| Monthly Housing Costs | $347 | $0 |
| Real Estate Taxes | $2,306 | $7 |
Property Value by Mortgage Status in Nuiqsut
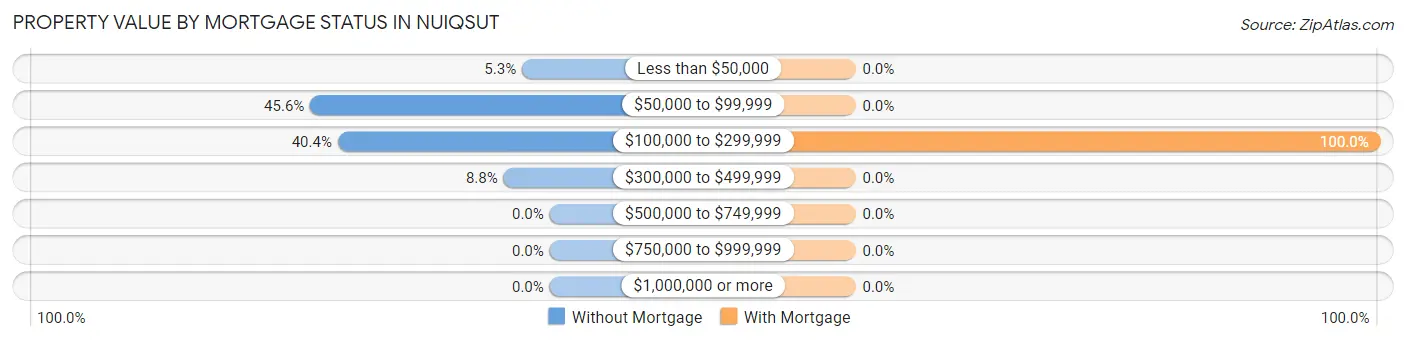
| Property Value | Without Mortgage | With Mortgage |
| Less than $50,000 | 3 (5.3%) | 0 (0.0%) |
| $50,000 to $99,999 | 26 (45.6%) | 0 (0.0%) |
| $100,000 to $299,999 | 23 (40.4%) | 7 (100.0%) |
| $300,000 to $499,999 | 5 (8.8%) | 0 (0.0%) |
| $500,000 to $749,999 | 0 (0.0%) | 0 (0.0%) |
| $750,000 to $999,999 | 0 (0.0%) | 0 (0.0%) |
| $1,000,000 or more | 0 (0.0%) | 0 (0.0%) |
| Total | 57 (100.0%) | 7 (100.0%) |
Household Income by Mortgage Status in Nuiqsut
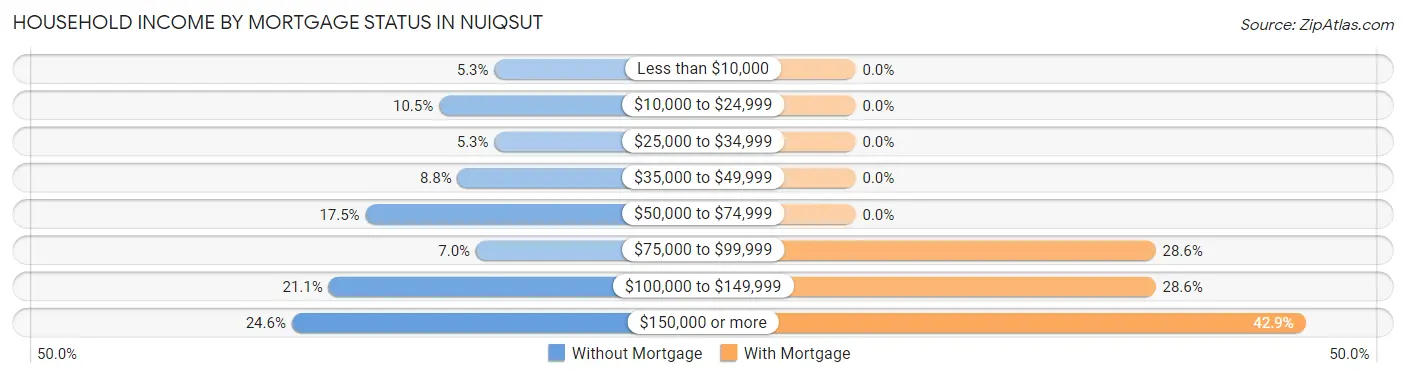
| Household Income | Without Mortgage | With Mortgage |
| Less than $10,000 | 3 (5.3%) | 0 (0.0%) |
| $10,000 to $24,999 | 6 (10.5%) | 0 (0.0%) |
| $25,000 to $34,999 | 3 (5.3%) | 0 (0.0%) |
| $35,000 to $49,999 | 5 (8.8%) | 0 (0.0%) |
| $50,000 to $74,999 | 10 (17.5%) | 0 (0.0%) |
| $75,000 to $99,999 | 4 (7.0%) | 2 (28.6%) |
| $100,000 to $149,999 | 12 (21.0%) | 2 (28.6%) |
| $150,000 or more | 14 (24.6%) | 3 (42.9%) |
| Total | 57 (100.0%) | 7 (100.0%) |
Property Value to Household Income Ratio in Nuiqsut
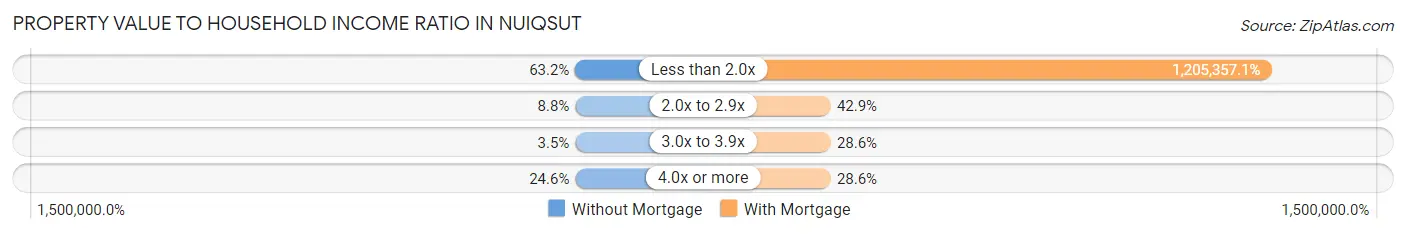
| Value-to-Income Ratio | Without Mortgage | With Mortgage |
| Less than 2.0x | 36 (63.2%) | 84,375 (1,205,357.1%) |
| 2.0x to 2.9x | 5 (8.8%) | 3 (42.9%) |
| 3.0x to 3.9x | 2 (3.5%) | 2 (28.6%) |
| 4.0x or more | 14 (24.6%) | 2 (28.6%) |
| Total | 57 (100.0%) | 7 (100.0%) |
Real Estate Taxes by Mortgage Status in Nuiqsut
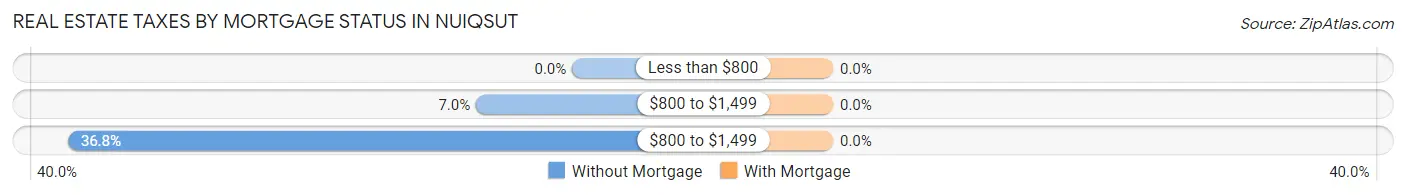
| Property Taxes | Without Mortgage | With Mortgage |
| Less than $800 | 0 (0.0%) | 0 (0.0%) |
| $800 to $1,499 | 4 (7.0%) | 0 (0.0%) |
| $800 to $1,499 | 21 (36.8%) | 0 (0.0%) |
| Total | 57 (100.0%) | 7 (100.0%) |
Health & Disability in Nuiqsut
Health Insurance Coverage by Age in Nuiqsut
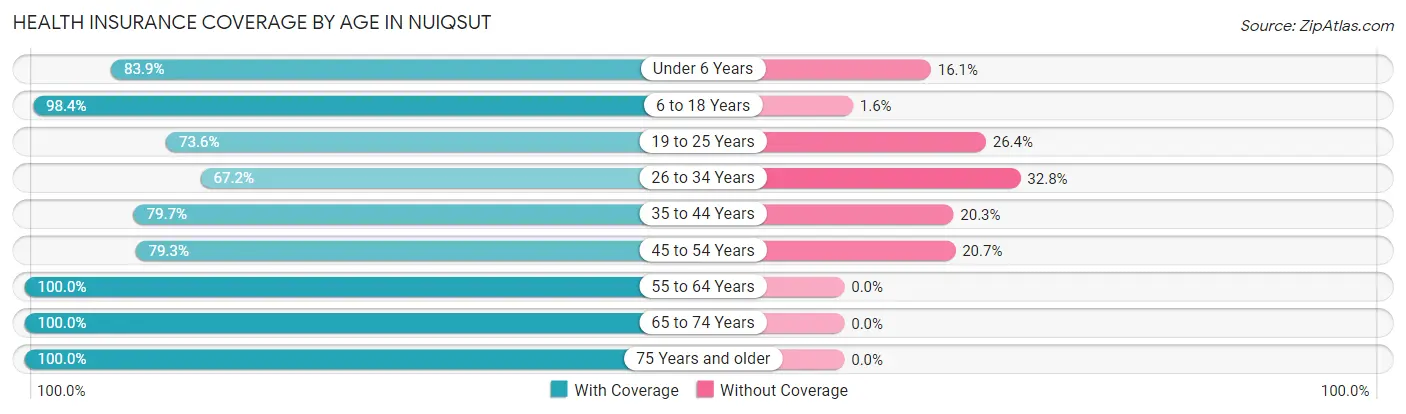
| Age Bracket | With Coverage | Without Coverage |
| Under 6 Years | 104 (83.9%) | 20 (16.1%) |
| 6 to 18 Years | 124 (98.4%) | 2 (1.6%) |
| 19 to 25 Years | 53 (73.6%) | 19 (26.4%) |
| 26 to 34 Years | 45 (67.2%) | 22 (32.8%) |
| 35 to 44 Years | 47 (79.7%) | 12 (20.3%) |
| 45 to 54 Years | 23 (79.3%) | 6 (20.7%) |
| 55 to 64 Years | 27 (100.0%) | 0 (0.0%) |
| 65 to 74 Years | 42 (100.0%) | 0 (0.0%) |
| 75 Years and older | 18 (100.0%) | 0 (0.0%) |
| Total | 483 (85.6%) | 81 (14.4%) |
Health Insurance Coverage by Citizenship Status in Nuiqsut
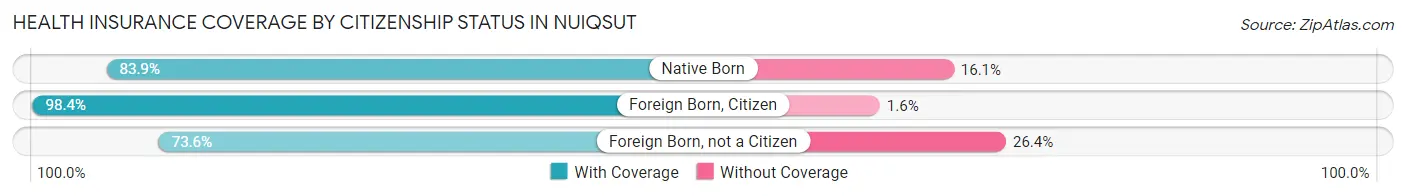
| Citizenship Status | With Coverage | Without Coverage |
| Native Born | 104 (83.9%) | 20 (16.1%) |
| Foreign Born, Citizen | 124 (98.4%) | 2 (1.6%) |
| Foreign Born, not a Citizen | 53 (73.6%) | 19 (26.4%) |
Health Insurance Coverage by Household Income in Nuiqsut
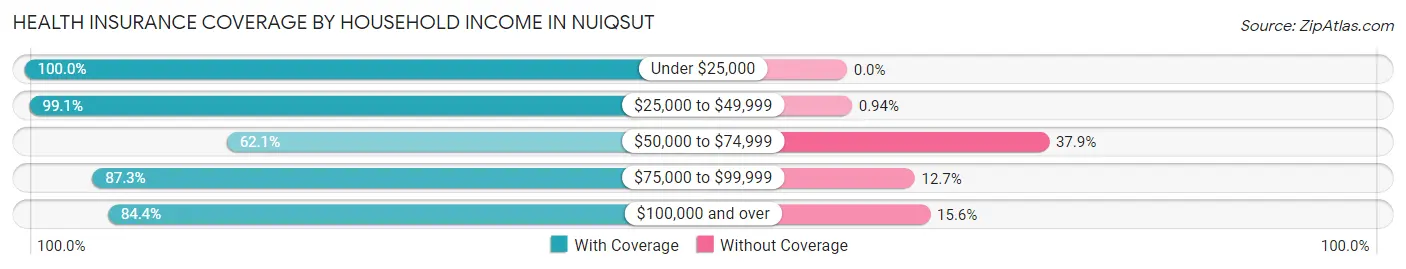
| Household Income | With Coverage | Without Coverage |
| Under $25,000 | 11 (100.0%) | 0 (0.0%) |
| $25,000 to $49,999 | 105 (99.1%) | 1 (0.9%) |
| $50,000 to $74,999 | 41 (62.1%) | 25 (37.9%) |
| $75,000 to $99,999 | 55 (87.3%) | 8 (12.7%) |
| $100,000 and over | 200 (84.4%) | 37 (15.6%) |
Public vs Private Health Insurance Coverage by Age in Nuiqsut
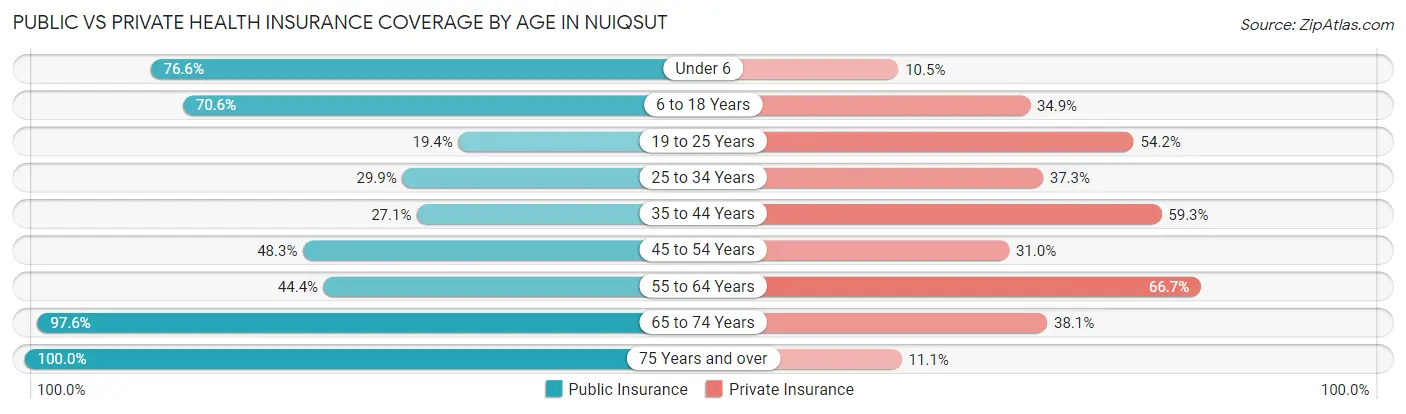
| Age Bracket | Public Insurance | Private Insurance |
| Under 6 | 95 (76.6%) | 13 (10.5%) |
| 6 to 18 Years | 89 (70.6%) | 44 (34.9%) |
| 19 to 25 Years | 14 (19.4%) | 39 (54.2%) |
| 25 to 34 Years | 20 (29.8%) | 25 (37.3%) |
| 35 to 44 Years | 16 (27.1%) | 35 (59.3%) |
| 45 to 54 Years | 14 (48.3%) | 9 (31.0%) |
| 55 to 64 Years | 12 (44.4%) | 18 (66.7%) |
| 65 to 74 Years | 41 (97.6%) | 16 (38.1%) |
| 75 Years and over | 18 (100.0%) | 2 (11.1%) |
| Total | 319 (56.6%) | 201 (35.6%) |
Disability Status by Sex by Age in Nuiqsut
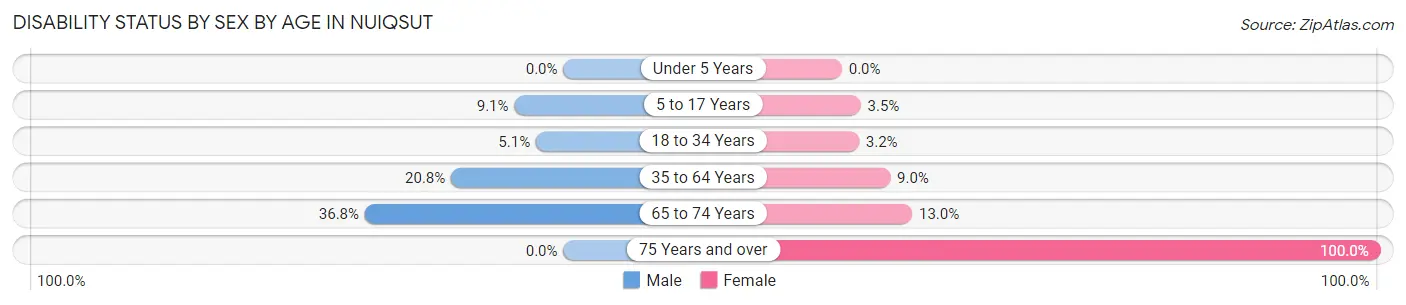
| Age Bracket | Male | Female |
| Under 5 Years | 0 (0.0%) | 0 (0.0%) |
| 5 to 17 Years | 5 (9.1%) | 3 (3.5%) |
| 18 to 34 Years | 3 (5.1%) | 3 (3.2%) |
| 35 to 64 Years | 10 (20.8%) | 6 (9.0%) |
| 65 to 74 Years | 7 (36.8%) | 3 (13.0%) |
| 75 Years and over | 0 (0.0%) | 15 (100.0%) |
Disability Class by Sex by Age in Nuiqsut
Disability Class: Hearing Difficulty
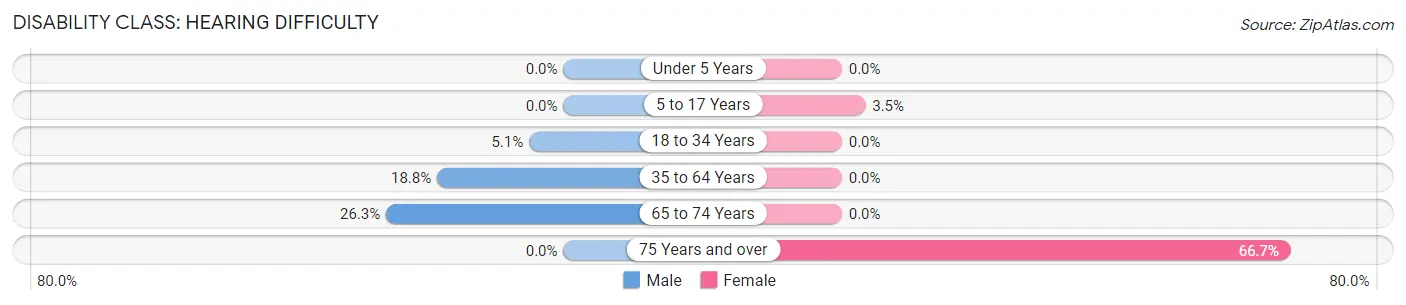
| Age Bracket | Male | Female |
| Under 5 Years | 0 (0.0%) | 0 (0.0%) |
| 5 to 17 Years | 0 (0.0%) | 3 (3.5%) |
| 18 to 34 Years | 3 (5.1%) | 0 (0.0%) |
| 35 to 64 Years | 9 (18.8%) | 0 (0.0%) |
| 65 to 74 Years | 5 (26.3%) | 0 (0.0%) |
| 75 Years and over | 0 (0.0%) | 10 (66.7%) |
Disability Class: Vision Difficulty
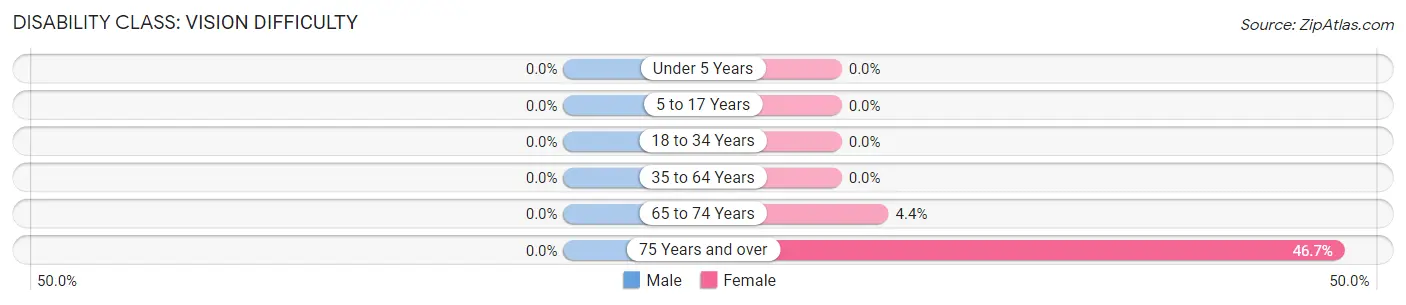
| Age Bracket | Male | Female |
| Under 5 Years | 0 (0.0%) | 0 (0.0%) |
| 5 to 17 Years | 0 (0.0%) | 0 (0.0%) |
| 18 to 34 Years | 0 (0.0%) | 0 (0.0%) |
| 35 to 64 Years | 0 (0.0%) | 0 (0.0%) |
| 65 to 74 Years | 0 (0.0%) | 1 (4.3%) |
| 75 Years and over | 0 (0.0%) | 7 (46.7%) |
Disability Class: Cognitive Difficulty
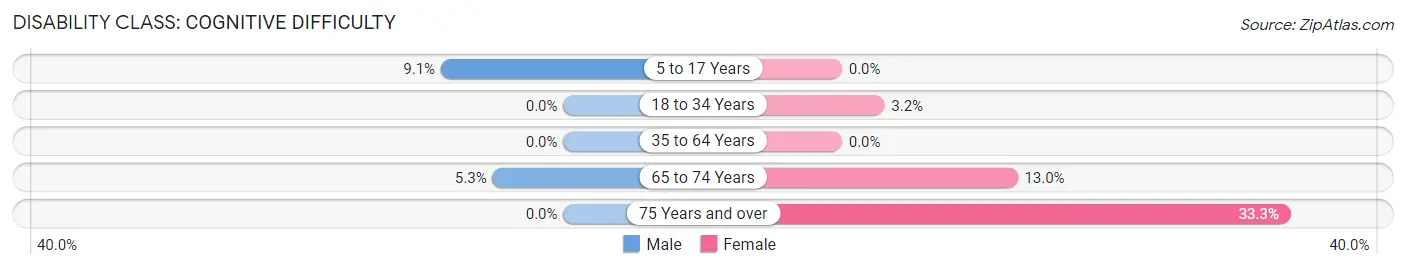
| Age Bracket | Male | Female |
| 5 to 17 Years | 5 (9.1%) | 0 (0.0%) |
| 18 to 34 Years | 0 (0.0%) | 3 (3.2%) |
| 35 to 64 Years | 0 (0.0%) | 0 (0.0%) |
| 65 to 74 Years | 1 (5.3%) | 3 (13.0%) |
| 75 Years and over | 0 (0.0%) | 5 (33.3%) |
Disability Class: Ambulatory Difficulty
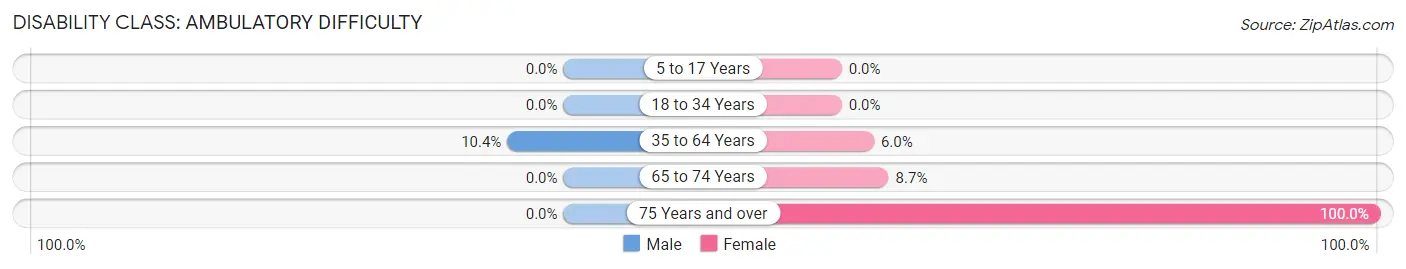
| Age Bracket | Male | Female |
| 5 to 17 Years | 0 (0.0%) | 0 (0.0%) |
| 18 to 34 Years | 0 (0.0%) | 0 (0.0%) |
| 35 to 64 Years | 5 (10.4%) | 4 (6.0%) |
| 65 to 74 Years | 0 (0.0%) | 2 (8.7%) |
| 75 Years and over | 0 (0.0%) | 15 (100.0%) |
Disability Class: Self-Care Difficulty
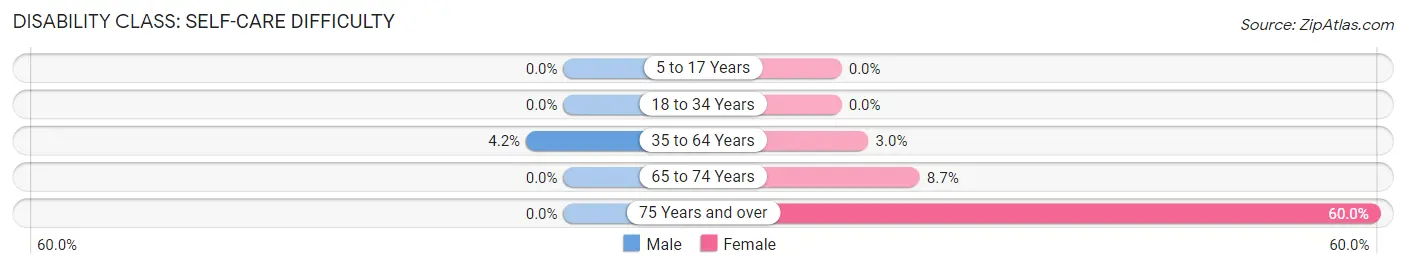
| Age Bracket | Male | Female |
| 5 to 17 Years | 0 (0.0%) | 0 (0.0%) |
| 18 to 34 Years | 0 (0.0%) | 0 (0.0%) |
| 35 to 64 Years | 2 (4.2%) | 2 (3.0%) |
| 65 to 74 Years | 0 (0.0%) | 2 (8.7%) |
| 75 Years and over | 0 (0.0%) | 9 (60.0%) |
Technology Access in Nuiqsut
Computing Device Access in Nuiqsut
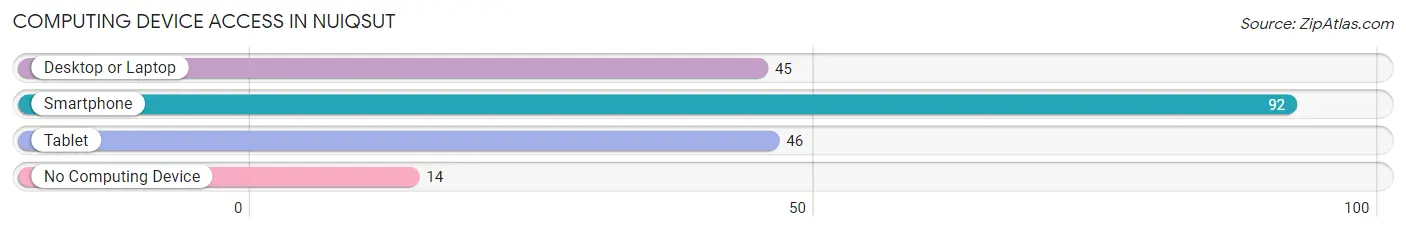
| Device Type | # Households | % Households |
| Desktop or Laptop | 45 | 42.1% |
| Smartphone | 92 | 86.0% |
| Tablet | 46 | 43.0% |
| No Computing Device | 14 | 13.1% |
| Total | 107 | 100.0% |
Internet Access in Nuiqsut
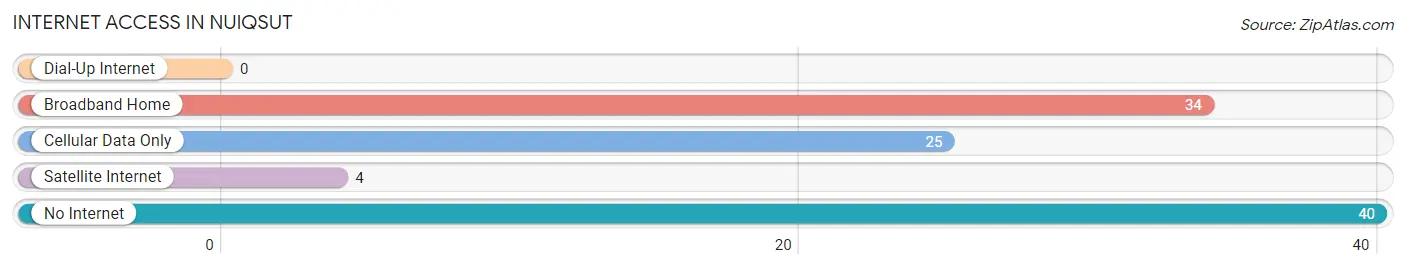
| Internet Type | # Households | % Households |
| Dial-Up Internet | 0 | 0.0% |
| Broadband Home | 34 | 31.8% |
| Cellular Data Only | 25 | 23.4% |
| Satellite Internet | 4 | 3.7% |
| No Internet | 40 | 37.4% |
| Total | 107 | 100.0% |
Nuiqsut Summary
Nuiqsut is a small Inupiat Eskimo village located in the North Slope Borough of Alaska. It is situated on the Colville River, approximately 25 miles east of the Arctic Ocean and 30 miles west of Prudhoe Bay. The village is home to approximately 400 people, most of whom are of Inupiat Eskimo descent.
History
The area around Nuiqsut has been inhabited by the Inupiat Eskimos for centuries. The first recorded contact with Europeans was in 1778, when the British explorer Captain James Cook visited the area. In the late 19th century, whalers and fur traders began to frequent the area, and by the early 20th century, the area had become a popular fishing and hunting destination.
In the 1950s, the discovery of oil in the area led to the establishment of the Trans-Alaska Pipeline System, which runs through Nuiqsut. This brought an influx of workers to the area, and the village was incorporated in 1972.
Geography
Nuiqsut is located in the North Slope Borough of Alaska, approximately 25 miles east of the Arctic Ocean and 30 miles west of Prudhoe Bay. The village is situated on the Colville River, which is a major tributary of the Kuparuk River. The area is characterized by rolling hills, tundra, and wetlands. The climate is subarctic, with long, cold winters and short, cool summers.
Economy
The economy of Nuiqsut is largely based on subsistence activities such as fishing, hunting, and trapping. The village is also home to a number of small businesses, including a general store, a post office, and a gas station.
The Trans-Alaska Pipeline System runs through Nuiqsut, and the village is home to a number of oil-related businesses, including a pipeline maintenance facility and a fuel storage facility. The village also receives royalties from oil production in the area.
Demographics
As of the 2010 census, the population of Nuiqsut was 393, of which 97.3% were of Inupiat Eskimo descent. The median age was 28.7 years, and the median household income was $50,000.
The village is served by the Nuiqsut School District, which operates a K-12 school. The village also has a health clinic, a library, and a community center.
Conclusion
Nuiqsut is a small Inupiat Eskimo village located in the North Slope Borough of Alaska. It is situated on the Colville River, approximately 25 miles east of the Arctic Ocean and 30 miles west of Prudhoe Bay. The village is home to approximately 400 people, most of whom are of Inupiat Eskimo descent. The economy of Nuiqsut is largely based on subsistence activities such as fishing, hunting, and trapping, as well as oil-related businesses. The village is served by the Nuiqsut School District, and has a health clinic, a library, and a community center.
Common Questions
What is Per Capita Income in Nuiqsut?
Per Capita income in Nuiqsut is $27,135.
What is the Median Family Income in Nuiqsut?
Median Family Income in Nuiqsut is $79,063.
What is the Median Household income in Nuiqsut?
Median Household Income in Nuiqsut is $76,250.
What is Inequality or Gini Index in Nuiqsut?
Inequality or Gini Index in Nuiqsut is 0.39.
What is the Total Population of Nuiqsut?
Total Population of Nuiqsut is 564.
What is the Total Male Population of Nuiqsut?
Total Male Population of Nuiqsut is 235.
What is the Total Female Population of Nuiqsut?
Total Female Population of Nuiqsut is 329.
What is the Ratio of Males per 100 Females in Nuiqsut?
There are 71.43 Males per 100 Females in Nuiqsut.
What is the Ratio of Females per 100 Males in Nuiqsut?
There are 140.00 Females per 100 Males in Nuiqsut.
What is the Median Population Age in Nuiqsut?
Median Population Age in Nuiqsut is 23.5 Years.
What is the Average Family Size in Nuiqsut
Average Family Size in Nuiqsut is 5.0 People.
What is the Average Household Size in Nuiqsut
Average Household Size in Nuiqsut is 4.5 People.
How Large is the Labor Force in Nuiqsut?
There are 251 People in the Labor Forcein in Nuiqsut.
What is the Percentage of People in the Labor Force in Nuiqsut?
74.0% of People are in the Labor Force in Nuiqsut.
What is the Unemployment Rate in Nuiqsut?
Unemployment Rate in Nuiqsut is 22.7%.