Craig, AK Map & Demographics
Craig Map
Craig Overview
$41,566
PER CAPITA INCOME
$84,000
AVG FAMILY INCOME
$66,146
AVG HOUSEHOLD INCOME
14.7%
WAGE / INCOME GAP [ % ]
85.2¢/ $1
WAGE / INCOME GAP [ $ ]
0.40
INEQUALITY / GINI INDEX
1,073
TOTAL POPULATION
569
MALE POPULATION
504
FEMALE POPULATION
112.90
MALES / 100 FEMALES
88.58
FEMALES / 100 MALES
38.5
MEDIAN AGE
2.7
AVG FAMILY SIZE
2.1
AVG HOUSEHOLD SIZE
663
LABOR FORCE [ PEOPLE ]
74.2%
PERCENT IN LABOR FORCE
5.7%
UNEMPLOYMENT RATE
Craig Zip Codes
Craig Area Codes
Income in Craig
Income Overview in Craig
Per Capita Income in Craig is $41,566, while median incomes of families and households are $84,000 and $66,146 respectively.
| Characteristic | Number | Measure |
| Per Capita Income | 1,073 | $41,566 |
| Median Family Income | 258 | $84,000 |
| Mean Family Income | 258 | $103,996 |
| Median Household Income | 489 | $66,146 |
| Mean Household Income | 489 | $85,720 |
| Income Deficit | 258 | $0 |
| Wage / Income Gap (%) | 1,073 | 14.75% |
| Wage / Income Gap ($) | 1,073 | 85.25¢ per $1 |
| Gini / Inequality Index | 1,073 | 0.40 |
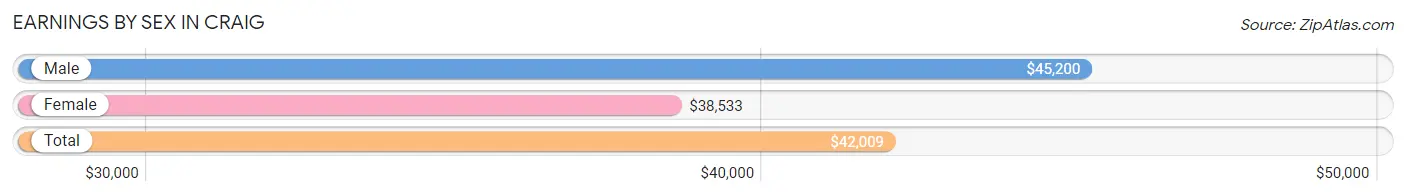
Earnings by Sex in Craig
Average Earnings in Craig are $42,009, $45,200 for men and $38,533 for women, a difference of 14.7%.
| Sex | Number | Average Earnings |
| Male | 418 (58.0%) | $45,200 |
| Female | 303 (42.0%) | $38,533 |
| Total | 721 (100.0%) | $42,009 |
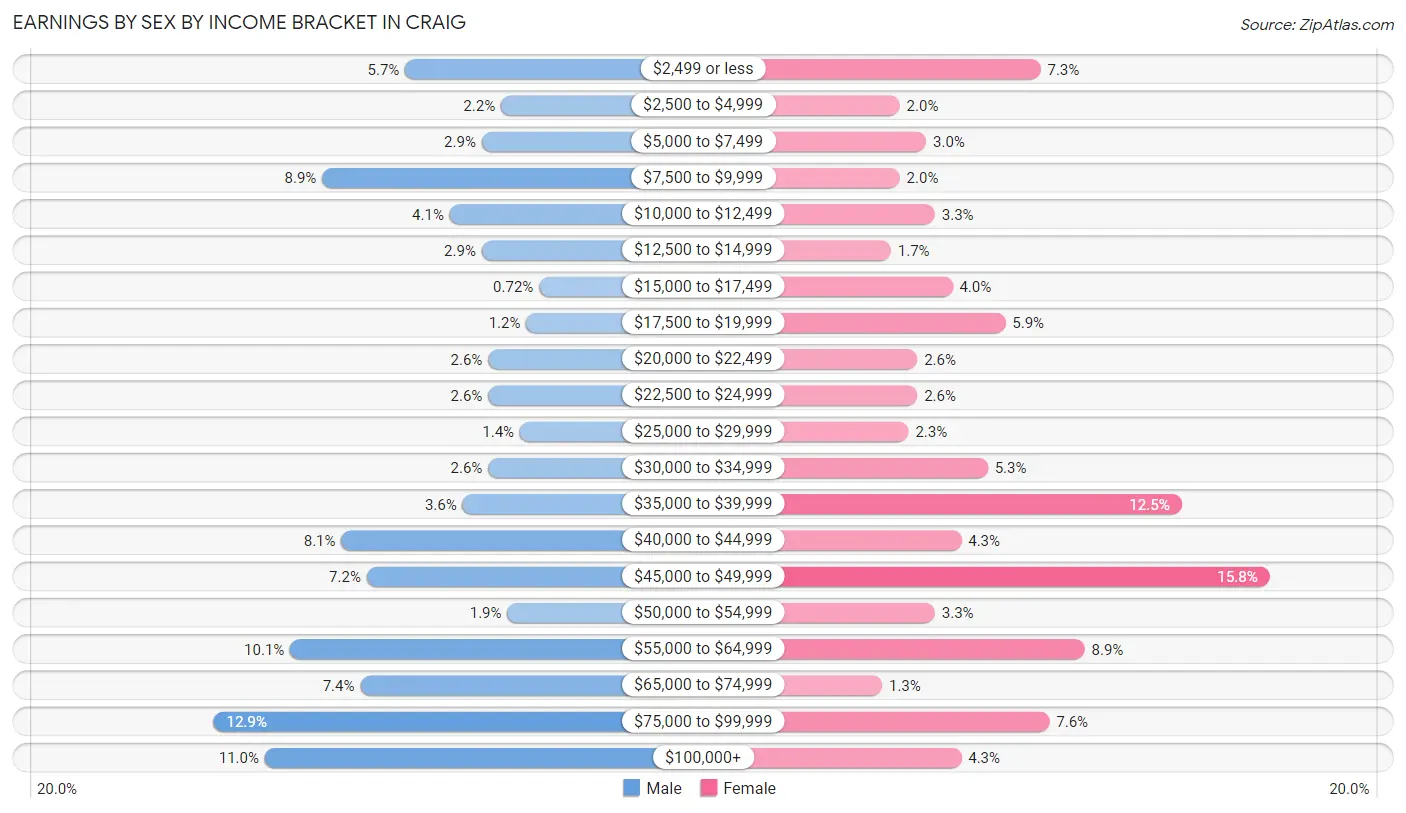
Earnings by Sex by Income Bracket in Craig
The most common earnings brackets in Craig are $75,000 to $99,999 for men (54 | 12.9%) and $45,000 to $49,999 for women (48 | 15.8%).
| Income | Male | Female |
| $2,499 or less | 24 (5.7%) | 22 (7.3%) |
| $2,500 to $4,999 | 9 (2.1%) | 6 (2.0%) |
| $5,000 to $7,499 | 12 (2.9%) | 9 (3.0%) |
| $7,500 to $9,999 | 37 (8.8%) | 6 (2.0%) |
| $10,000 to $12,499 | 17 (4.1%) | 10 (3.3%) |
| $12,500 to $14,999 | 12 (2.9%) | 5 (1.7%) |
| $15,000 to $17,499 | 3 (0.7%) | 12 (4.0%) |
| $17,500 to $19,999 | 5 (1.2%) | 18 (5.9%) |
| $20,000 to $22,499 | 11 (2.6%) | 8 (2.6%) |
| $22,500 to $24,999 | 11 (2.6%) | 8 (2.6%) |
| $25,000 to $29,999 | 6 (1.4%) | 7 (2.3%) |
| $30,000 to $34,999 | 11 (2.6%) | 16 (5.3%) |
| $35,000 to $39,999 | 15 (3.6%) | 38 (12.5%) |
| $40,000 to $44,999 | 34 (8.1%) | 13 (4.3%) |
| $45,000 to $49,999 | 30 (7.2%) | 48 (15.8%) |
| $50,000 to $54,999 | 8 (1.9%) | 10 (3.3%) |
| $55,000 to $64,999 | 42 (10.1%) | 27 (8.9%) |
| $65,000 to $74,999 | 31 (7.4%) | 4 (1.3%) |
| $75,000 to $99,999 | 54 (12.9%) | 23 (7.6%) |
| $100,000+ | 46 (11.0%) | 13 (4.3%) |
| Total | 418 (100.0%) | 303 (100.0%) |
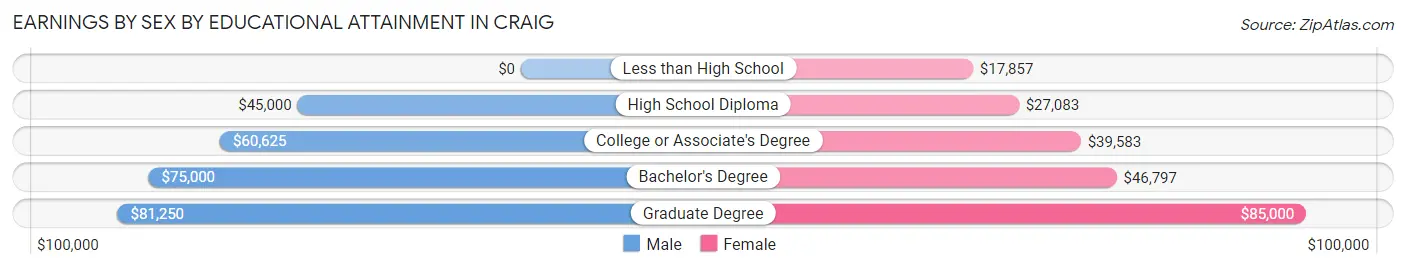
Earnings by Sex by Educational Attainment in Craig
Average earnings in Craig are $52,500 for men and $39,565 for women, a difference of 24.6%. Men with an educational attainment of graduate degree enjoy the highest average annual earnings of $81,250, while those with high school diploma education earn the least with $45,000. Women with an educational attainment of graduate degree earn the most with the average annual earnings of $85,000, while those with less than high school education have the smallest earnings of $17,857.
| Educational Attainment | Male Income | Female Income |
| Less than High School | - | - |
| High School Diploma | $45,000 | $27,083 |
| College or Associate's Degree | $60,625 | $39,583 |
| Bachelor's Degree | $75,000 | $46,797 |
| Graduate Degree | $81,250 | $85,000 |
| Total | $52,500 | $39,565 |
Family Income in Craig
Family Income Brackets in Craig
According to the Craig family income data, there are 67 families falling into the $100,000 to $149,999 income range, which is the most common income bracket and makes up 26.0% of all families. Conversely, the less than $10,000 income bracket is the least frequent group with only 5 families (1.9%) belonging to this category.
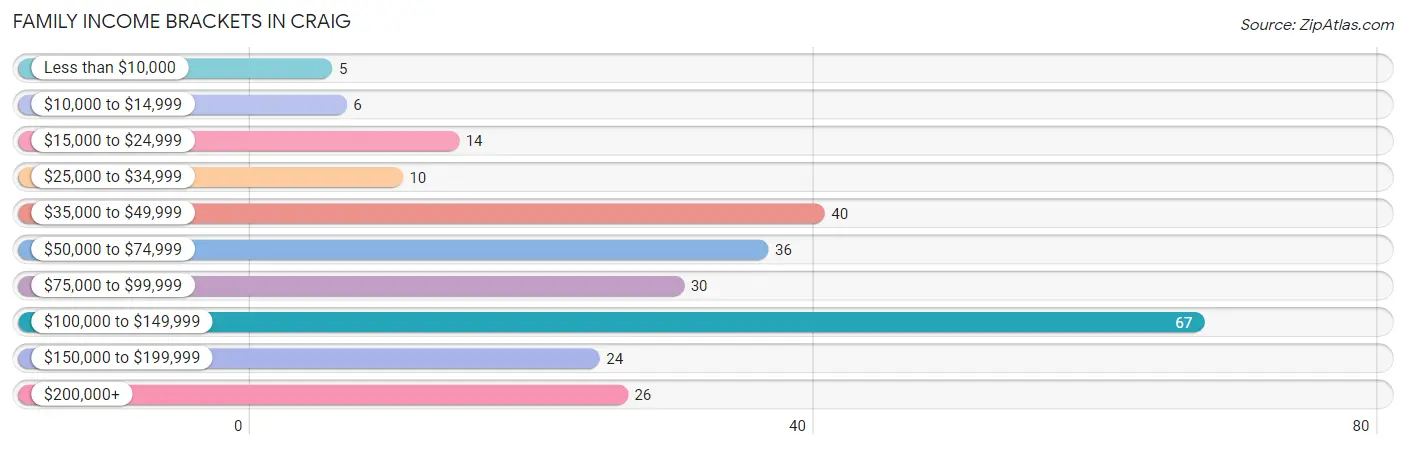
| Income Bracket | # Families | % Families |
| Less than $10,000 | 5 | 1.9% |
| $10,000 to $14,999 | 6 | 2.3% |
| $15,000 to $24,999 | 14 | 5.4% |
| $25,000 to $34,999 | 10 | 3.9% |
| $35,000 to $49,999 | 40 | 15.5% |
| $50,000 to $74,999 | 36 | 14.0% |
| $75,000 to $99,999 | 30 | 11.6% |
| $100,000 to $149,999 | 67 | 26.0% |
| $150,000 to $199,999 | 24 | 9.3% |
| $200,000+ | 26 | 10.1% |
Family Income by Famaliy Size in Craig
3-person families (67 | 26.0%) account for the highest median family income in Craig with $121,250 per family, while 2-person families (136 | 52.7%) have the highest median income of $40,625 per family member.
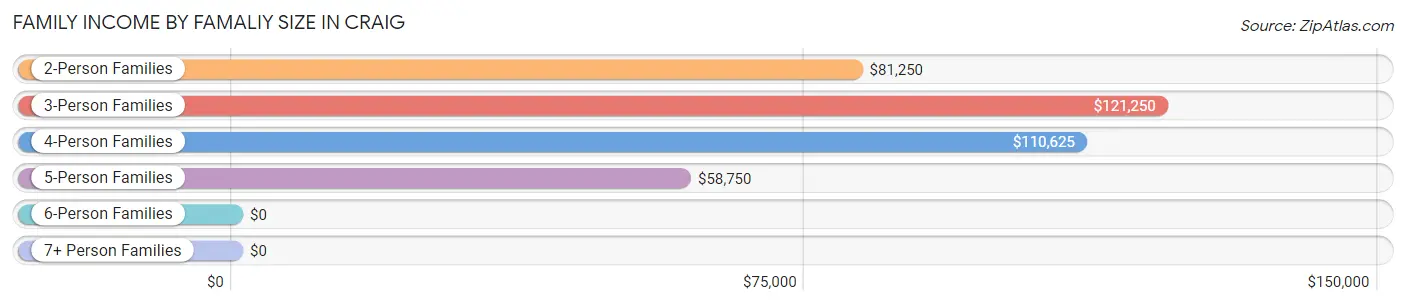
| Income Bracket | # Families | Median Income |
| 2-Person Families | 136 (52.7%) | $81,250 |
| 3-Person Families | 67 (26.0%) | $121,250 |
| 4-Person Families | 34 (13.2%) | $110,625 |
| 5-Person Families | 18 (7.0%) | $58,750 |
| 6-Person Families | 3 (1.2%) | $0 |
| 7+ Person Families | 0 (0.0%) | $0 |
| Total | 258 (100.0%) | $84,000 |
Family Income by Number of Earners in Craig
The median family income in Craig is $84,000, with families comprising 3+ earners (32) having the highest median family income of $125,625, while families with no earners (24) have the lowest median family income of $37,500, accounting for 12.4% and 9.3% of families, respectively.
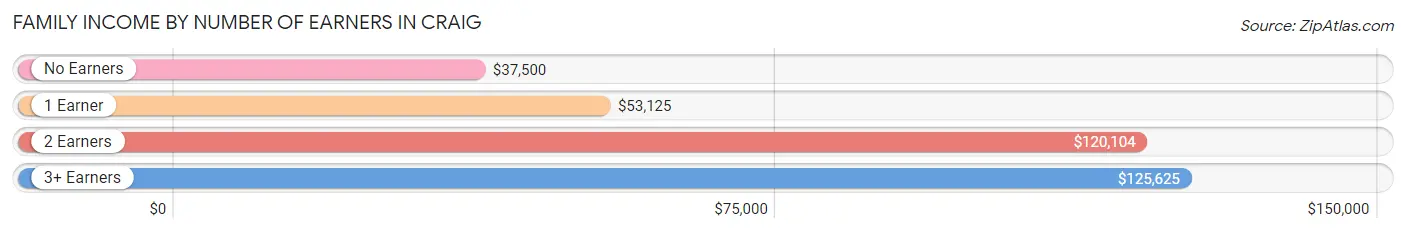
| Number of Earners | # Families | Median Income |
| No Earners | 24 (9.3%) | $37,500 |
| 1 Earner | 85 (33.0%) | $53,125 |
| 2 Earners | 117 (45.4%) | $120,104 |
| 3+ Earners | 32 (12.4%) | $125,625 |
| Total | 258 (100.0%) | $84,000 |
Household Income in Craig
Household Income Brackets in Craig
With 97 households falling in the category, the $50,000 to $74,999 income range is the most frequent in Craig, accounting for 19.8% of all households. In contrast, only 15 households (3.1%) fall into the $10,000 to $14,999 income bracket, making it the least populous group.
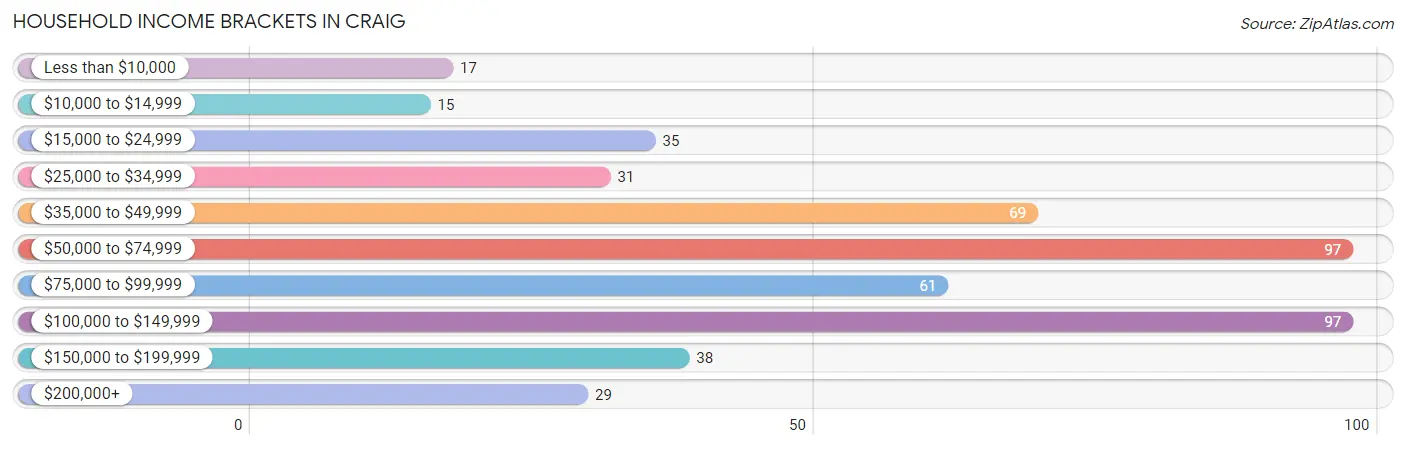
| Income Bracket | # Households | % Households |
| Less than $10,000 | 17 | 3.5% |
| $10,000 to $14,999 | 15 | 3.1% |
| $15,000 to $24,999 | 35 | 7.2% |
| $25,000 to $34,999 | 31 | 6.3% |
| $35,000 to $49,999 | 69 | 14.1% |
| $50,000 to $74,999 | 97 | 19.8% |
| $75,000 to $99,999 | 61 | 12.5% |
| $100,000 to $149,999 | 97 | 19.8% |
| $150,000 to $199,999 | 38 | 7.8% |
| $200,000+ | 29 | 5.9% |
Household Income by Householder Age in Craig
The median household income in Craig is $66,146, with the highest median household income of $88,750 found in the 45 to 64 years age bracket for the primary householder. A total of 176 households (36.0%) fall into this category. Meanwhile, the 15 to 24 years age bracket for the primary householder has the lowest median household income of $43,125, with 38 households (7.8%) in this group.
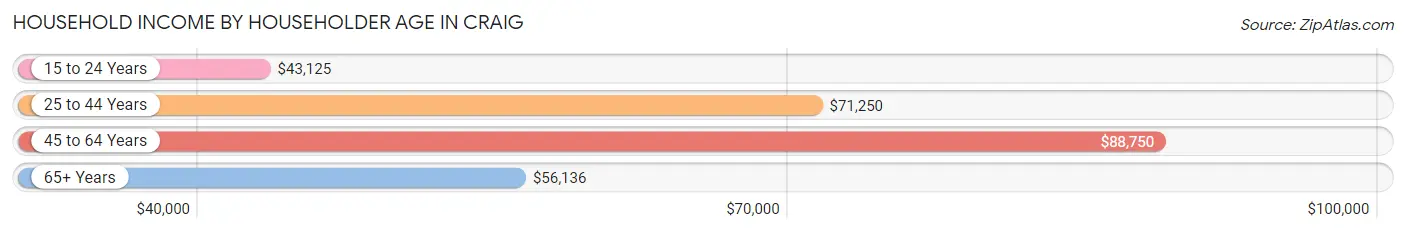
| Income Bracket | # Households | Median Income |
| 15 to 24 Years | 38 (7.8%) | $43,125 |
| 25 to 44 Years | 147 (30.1%) | $71,250 |
| 45 to 64 Years | 176 (36.0%) | $88,750 |
| 65+ Years | 128 (26.2%) | $56,136 |
| Total | 489 (100.0%) | $66,146 |
Poverty in Craig
Income Below Poverty by Sex and Age in Craig
With 10.0% poverty level for males and 14.7% for females among the residents of Craig, 6 to 11 year old males and under 5 year old females are the most vulnerable to poverty, with 9 males (31.0%) and 10 females (37.0%) in their respective age groups living below the poverty level.
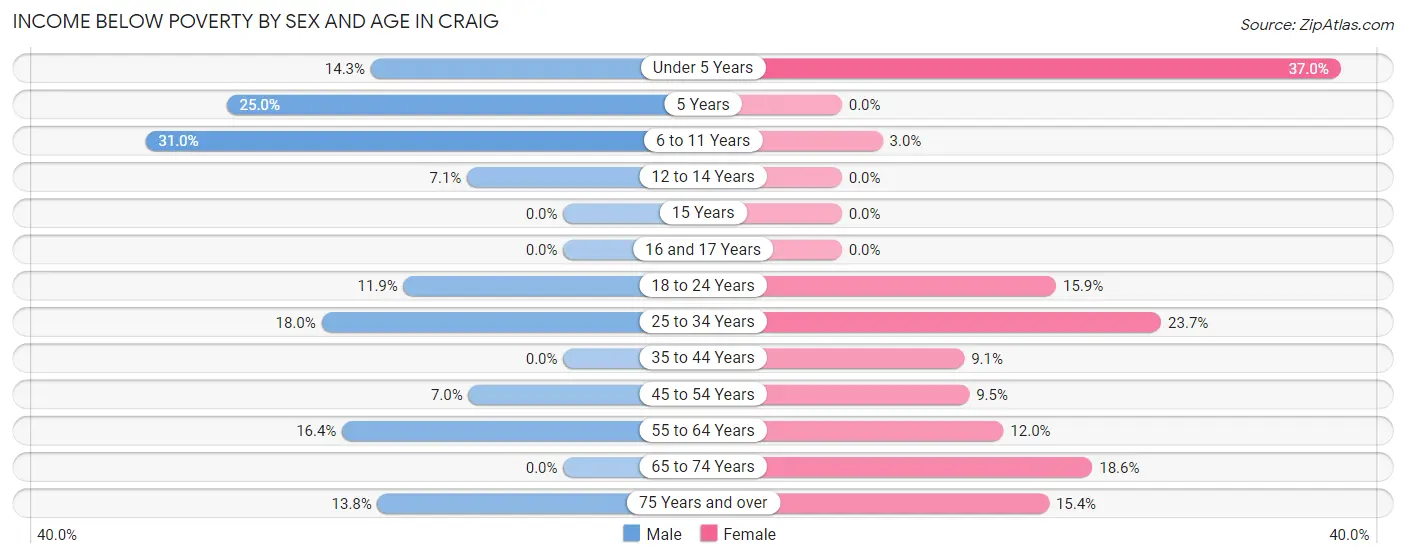
| Age Bracket | Male | Female |
| Under 5 Years | 4 (14.3%) | 10 (37.0%) |
| 5 Years | 1 (25.0%) | 0 (0.0%) |
| 6 to 11 Years | 9 (31.0%) | 1 (3.0%) |
| 12 to 14 Years | 1 (7.1%) | 0 (0.0%) |
| 15 Years | 0 (0.0%) | 0 (0.0%) |
| 16 and 17 Years | 0 (0.0%) | 0 (0.0%) |
| 18 to 24 Years | 7 (11.9%) | 7 (15.9%) |
| 25 to 34 Years | 14 (17.9%) | 23 (23.7%) |
| 35 to 44 Years | 0 (0.0%) | 5 (9.1%) |
| 45 to 54 Years | 5 (7.0%) | 7 (9.5%) |
| 55 to 64 Years | 11 (16.4%) | 9 (12.0%) |
| 65 to 74 Years | 0 (0.0%) | 8 (18.6%) |
| 75 Years and over | 4 (13.8%) | 2 (15.4%) |
| Total | 56 (10.0%) | 72 (14.7%) |
Income Above Poverty by Sex and Age in Craig
According to the poverty statistics in Craig, males aged 15 years and females aged 5 years are the age groups that are most secure financially, with 100.0% of males and 100.0% of females in these age groups living above the poverty line.
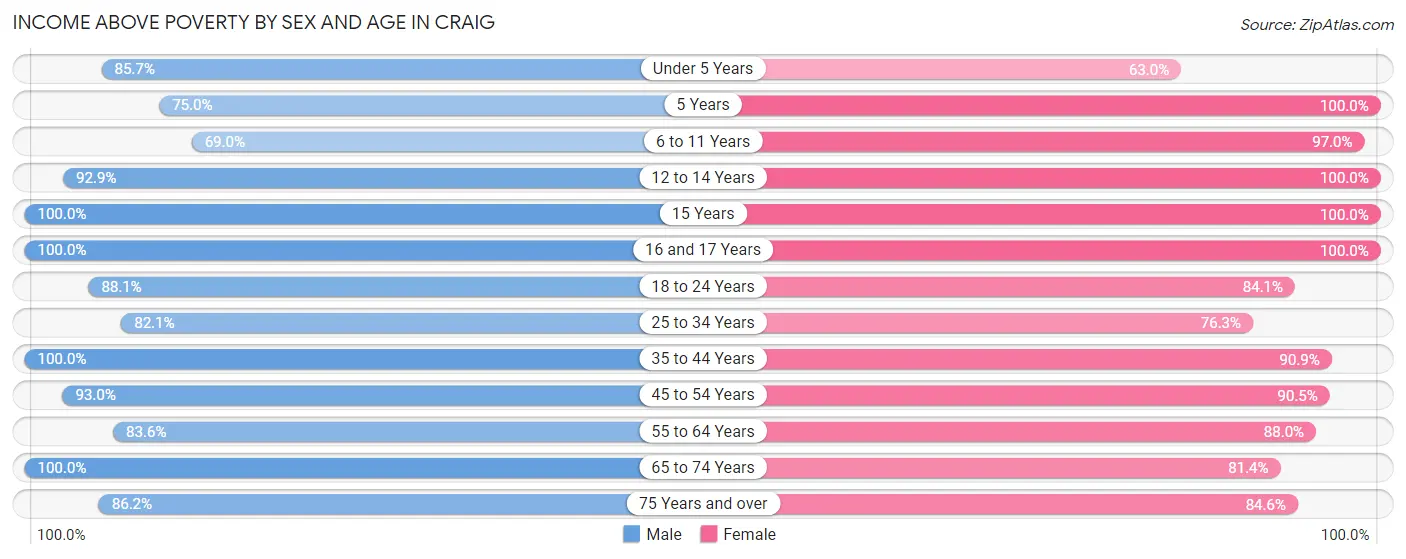
| Age Bracket | Male | Female |
| Under 5 Years | 24 (85.7%) | 17 (63.0%) |
| 5 Years | 3 (75.0%) | 5 (100.0%) |
| 6 to 11 Years | 20 (69.0%) | 32 (97.0%) |
| 12 to 14 Years | 13 (92.9%) | 6 (100.0%) |
| 15 Years | 8 (100.0%) | 8 (100.0%) |
| 16 and 17 Years | 19 (100.0%) | 9 (100.0%) |
| 18 to 24 Years | 52 (88.1%) | 37 (84.1%) |
| 25 to 34 Years | 64 (82.1%) | 74 (76.3%) |
| 35 to 44 Years | 75 (100.0%) | 50 (90.9%) |
| 45 to 54 Years | 66 (93.0%) | 67 (90.5%) |
| 55 to 64 Years | 56 (83.6%) | 66 (88.0%) |
| 65 to 74 Years | 81 (100.0%) | 35 (81.4%) |
| 75 Years and over | 25 (86.2%) | 11 (84.6%) |
| Total | 506 (90.0%) | 417 (85.3%) |
Income Below Poverty Among Married-Couple Families in Craig
The poverty statistics for married-couple families in Craig show that 1.3% or 2 of the total 159 families live below the poverty line. Families with 1 or 2 children have the highest poverty rate of 3.3%, comprising of 2 families. On the other hand, families with no children have the lowest poverty rate of 0.0%, which includes 0 families.
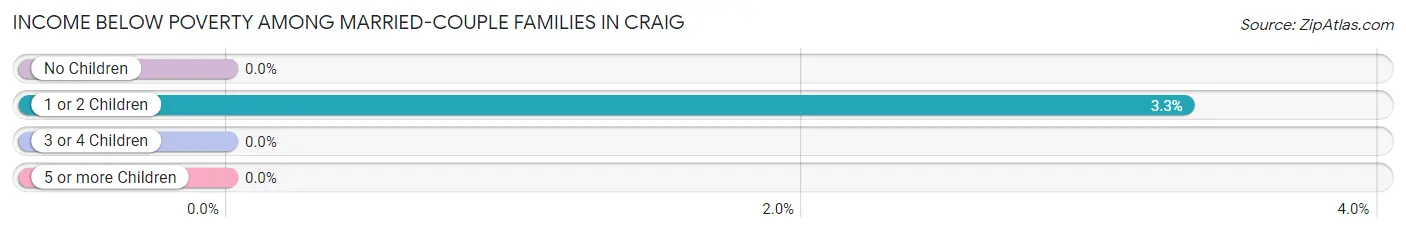
| Children | Above Poverty | Below Poverty |
| No Children | 90 (100.0%) | 0 (0.0%) |
| 1 or 2 Children | 58 (96.7%) | 2 (3.3%) |
| 3 or 4 Children | 9 (100.0%) | 0 (0.0%) |
| 5 or more Children | 0 (0.0%) | 0 (0.0%) |
| Total | 157 (98.7%) | 2 (1.3%) |
Income Below Poverty Among Single-Parent Households in Craig
According to the poverty data in Craig, 7.8% or 4 single-father households and 29.2% or 14 single-mother households are living below the poverty line. Among single-father households, those with 3 or 4 children have the highest poverty rate, with 1 households (25.0%) experiencing poverty. Likewise, among single-mother households, those with 3 or 4 children have the highest poverty rate, with 5 households (62.5%) falling below the poverty line.
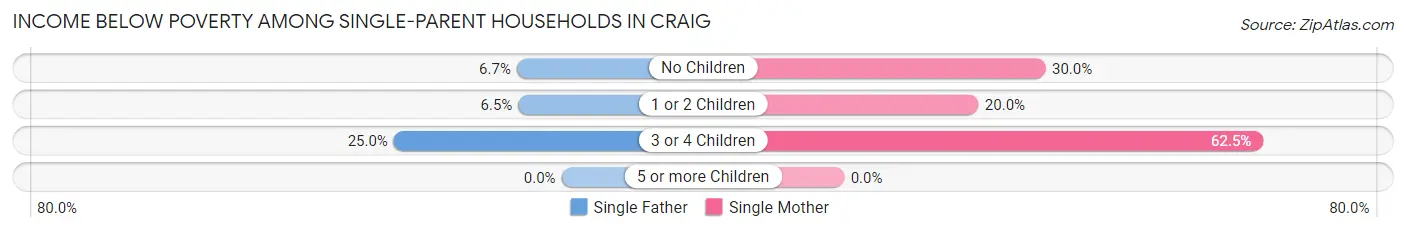
| Children | Single Father | Single Mother |
| No Children | 1 (6.7%) | 3 (30.0%) |
| 1 or 2 Children | 2 (6.5%) | 6 (20.0%) |
| 3 or 4 Children | 1 (25.0%) | 5 (62.5%) |
| 5 or more Children | 0 (0.0%) | 0 (0.0%) |
| Total | 4 (7.8%) | 14 (29.2%) |
Income Below Poverty Among Married-Couple vs Single-Parent Households in Craig
The poverty data for Craig shows that 2 of the married-couple family households (1.3%) and 18 of the single-parent households (18.2%) are living below the poverty level. Within the married-couple family households, those with 1 or 2 children have the highest poverty rate, with 2 households (3.3%) falling below the poverty line. Among the single-parent households, those with 3 or 4 children have the highest poverty rate, with 6 household (50.0%) living below poverty.
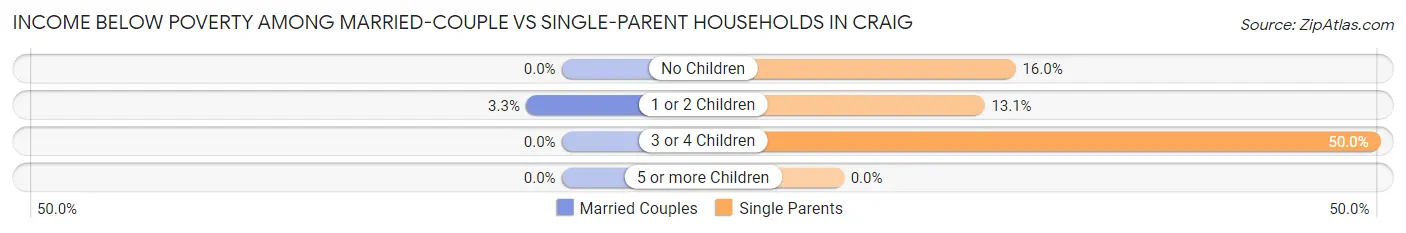
| Children | Married-Couple Families | Single-Parent Households |
| No Children | 0 (0.0%) | 4 (16.0%) |
| 1 or 2 Children | 2 (3.3%) | 8 (13.1%) |
| 3 or 4 Children | 0 (0.0%) | 6 (50.0%) |
| 5 or more Children | 0 (0.0%) | 0 (0.0%) |
| Total | 2 (1.3%) | 18 (18.2%) |
Race in Craig
The most populous races in Craig are White / Caucasian (611 | 56.9%), Two or more Races (231 | 21.5%), and Native / Alaskan (184 | 17.2%).
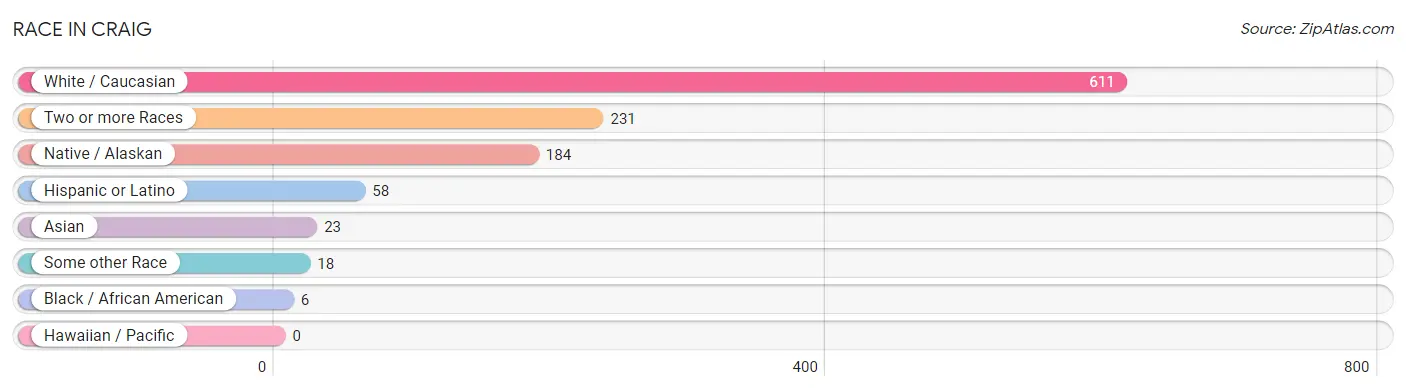
| Race | # Population | % Population |
| Asian | 23 | 2.1% |
| Black / African American | 6 | 0.6% |
| Hawaiian / Pacific | 0 | 0.0% |
| Hispanic or Latino | 58 | 5.4% |
| Native / Alaskan | 184 | 17.2% |
| White / Caucasian | 611 | 56.9% |
| Two or more Races | 231 | 21.5% |
| Some other Race | 18 | 1.7% |
| Total | 1,073 | 100.0% |
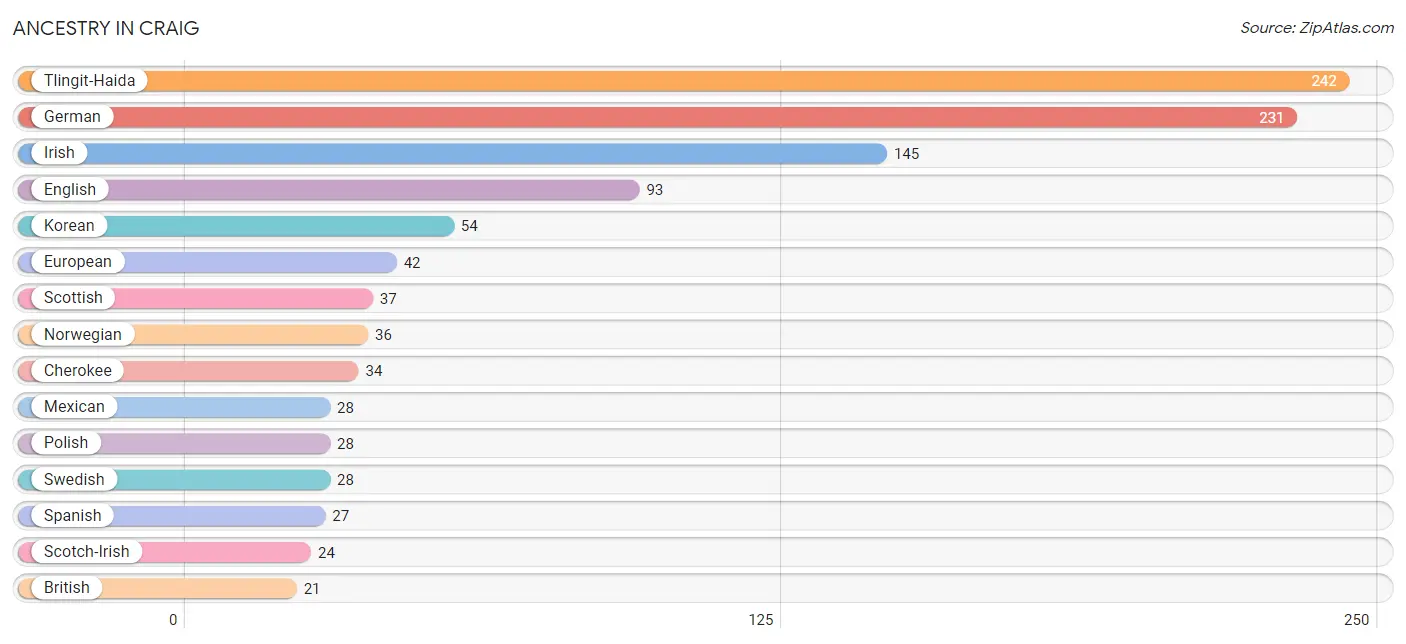
Ancestry in Craig
The most populous ancestries reported in Craig are Tlingit-Haida (242 | 22.6%), German (231 | 21.5%), Irish (145 | 13.5%), English (93 | 8.7%), and Korean (54 | 5.0%), together accounting for 71.3% of all Craig residents.
| Ancestry | # Population | % Population |
| African | 2 | 0.2% |
| Alaska Native | 16 | 1.5% |
| Alaskan Athabascan | 14 | 1.3% |
| Aleut | 5 | 0.5% |
| American | 9 | 0.8% |
| Australian | 10 | 0.9% |
| Austrian | 7 | 0.6% |
| Bhutanese | 11 | 1.0% |
| British | 21 | 2.0% |
| Cajun | 1 | 0.1% |
| Canadian | 4 | 0.4% |
| Cherokee | 34 | 3.2% |
| Chippewa | 7 | 0.6% |
| Choctaw | 3 | 0.3% |
| Croatian | 2 | 0.2% |
| Czech | 14 | 1.3% |
| Danish | 4 | 0.4% |
| Dutch | 5 | 0.5% |
| English | 93 | 8.7% |
| European | 42 | 3.9% |
| Finnish | 3 | 0.3% |
| French | 11 | 1.0% |
| French Canadian | 3 | 0.3% |
| German | 231 | 21.5% |
| Greek | 1 | 0.1% |
| Haitian | 5 | 0.5% |
| Hungarian | 6 | 0.6% |
| Inupiat | 15 | 1.4% |
| Irish | 145 | 13.5% |
| Italian | 11 | 1.0% |
| Korean | 54 | 5.0% |
| Lithuanian | 6 | 0.6% |
| Mexican | 28 | 2.6% |
| Native Hawaiian | 1 | 0.1% |
| Navajo | 2 | 0.2% |
| Norwegian | 36 | 3.4% |
| Polish | 28 | 2.6% |
| Romanian | 5 | 0.5% |
| Russian | 17 | 1.6% |
| Scandinavian | 14 | 1.3% |
| Scotch-Irish | 24 | 2.2% |
| Scottish | 37 | 3.5% |
| Sioux | 2 | 0.2% |
| Slavic | 3 | 0.3% |
| Spaniard | 3 | 0.3% |
| Spanish | 27 | 2.5% |
| Subsaharan African | 2 | 0.2% |
| Swedish | 28 | 2.6% |
| Swiss | 5 | 0.5% |
| Tlingit-Haida | 242 | 22.6% |
| Tsimshian | 16 | 1.5% |
| Welsh | 13 | 1.2% |
| Yup'ik | 9 | 0.8% | View All 53 Rows |
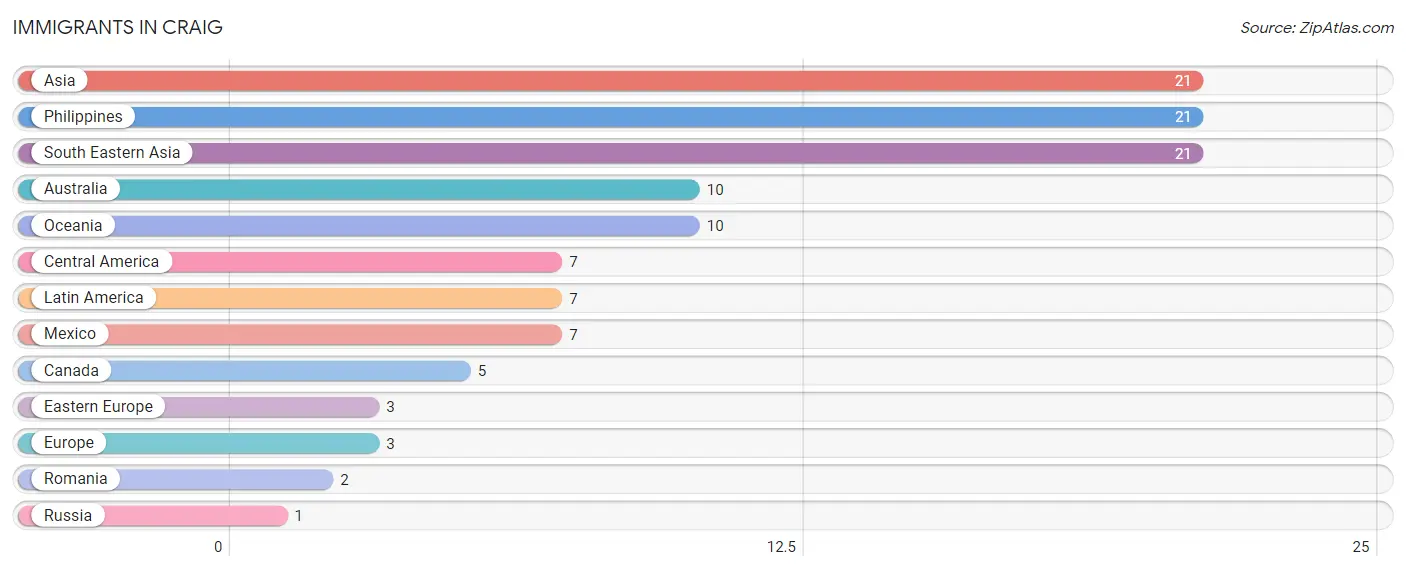
Immigrants in Craig
The most numerous immigrant groups reported in Craig came from Asia (21 | 2.0%), Philippines (21 | 2.0%), South Eastern Asia (21 | 2.0%), Australia (10 | 0.9%), and Oceania (10 | 0.9%), together accounting for 7.7% of all Craig residents.
| Immigration Origin | # Population | % Population |
| Asia | 21 | 2.0% |
| Australia | 10 | 0.9% |
| Canada | 5 | 0.5% |
| Central America | 7 | 0.6% |
| Eastern Europe | 3 | 0.3% |
| Europe | 3 | 0.3% |
| Latin America | 7 | 0.6% |
| Mexico | 7 | 0.6% |
| Oceania | 10 | 0.9% |
| Philippines | 21 | 2.0% |
| Romania | 2 | 0.2% |
| Russia | 1 | 0.1% |
| South Eastern Asia | 21 | 2.0% | View All 13 Rows |
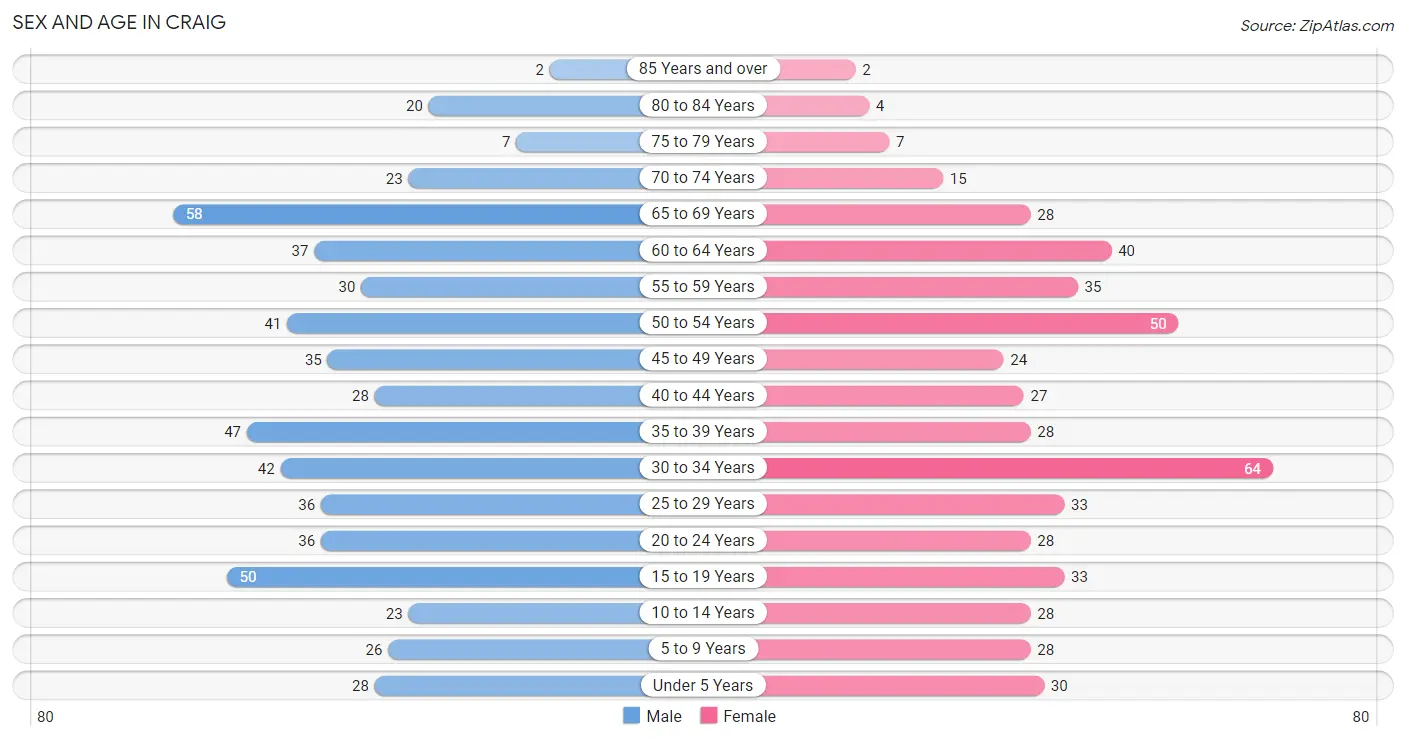
Sex and Age in Craig
Sex and Age in Craig
The most populous age groups in Craig are 65 to 69 Years (58 | 10.2%) for men and 30 to 34 Years (64 | 12.7%) for women.
| Age Bracket | Male | Female |
| Under 5 Years | 28 (4.9%) | 30 (5.9%) |
| 5 to 9 Years | 26 (4.6%) | 28 (5.6%) |
| 10 to 14 Years | 23 (4.0%) | 28 (5.6%) |
| 15 to 19 Years | 50 (8.8%) | 33 (6.6%) |
| 20 to 24 Years | 36 (6.3%) | 28 (5.6%) |
| 25 to 29 Years | 36 (6.3%) | 33 (6.6%) |
| 30 to 34 Years | 42 (7.4%) | 64 (12.7%) |
| 35 to 39 Years | 47 (8.3%) | 28 (5.6%) |
| 40 to 44 Years | 28 (4.9%) | 27 (5.4%) |
| 45 to 49 Years | 35 (6.1%) | 24 (4.8%) |
| 50 to 54 Years | 41 (7.2%) | 50 (9.9%) |
| 55 to 59 Years | 30 (5.3%) | 35 (6.9%) |
| 60 to 64 Years | 37 (6.5%) | 40 (7.9%) |
| 65 to 69 Years | 58 (10.2%) | 28 (5.6%) |
| 70 to 74 Years | 23 (4.0%) | 15 (3.0%) |
| 75 to 79 Years | 7 (1.2%) | 7 (1.4%) |
| 80 to 84 Years | 20 (3.5%) | 4 (0.8%) |
| 85 Years and over | 2 (0.4%) | 2 (0.4%) |
| Total | 569 (100.0%) | 504 (100.0%) |
Families and Households in Craig
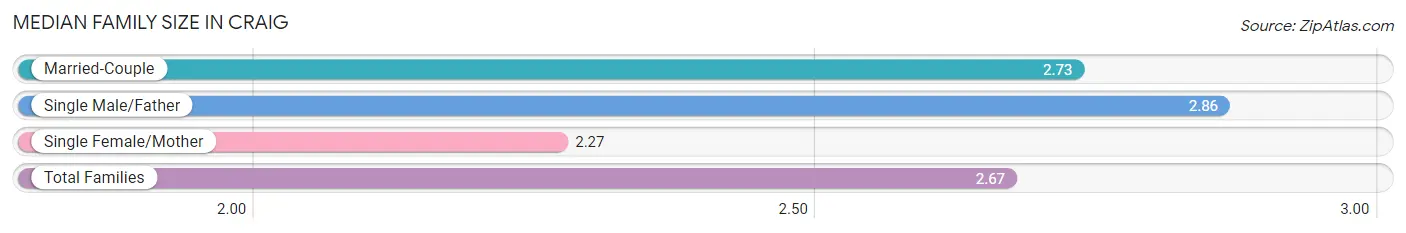
Median Family Size in Craig
The median family size in Craig is 2.67 persons per family, with single male/father families (51 | 19.8%) accounting for the largest median family size of 2.86 persons per family. On the other hand, single female/mother families (48 | 18.6%) represent the smallest median family size with 2.27 persons per family.
| Family Type | # Families | Family Size |
| Married-Couple | 159 (61.6%) | 2.73 |
| Single Male/Father | 51 (19.8%) | 2.86 |
| Single Female/Mother | 48 (18.6%) | 2.27 |
| Total Families | 258 (100.0%) | 2.67 |
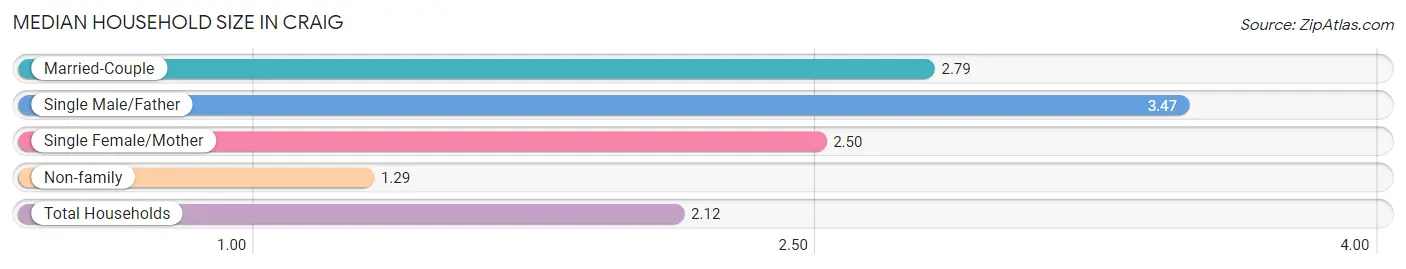
Median Household Size in Craig
The median household size in Craig is 2.12 persons per household, with single male/father households (51 | 10.4%) accounting for the largest median household size of 3.47 persons per household. non-family households (231 | 47.2%) represent the smallest median household size with 1.29 persons per household.
| Household Type | # Households | Household Size |
| Married-Couple | 159 (32.5%) | 2.79 |
| Single Male/Father | 51 (10.4%) | 3.47 |
| Single Female/Mother | 48 (9.8%) | 2.50 |
| Non-family | 231 (47.2%) | 1.29 |
| Total Households | 489 (100.0%) | 2.12 |
Household Size by Marriage Status in Craig
Out of a total of 489 households in Craig, 258 (52.8%) are family households, while 231 (47.2%) are nonfamily households. The most numerous type of family households are 2-person households, comprising 117, and the most common type of nonfamily households are 1-person households, comprising 189.
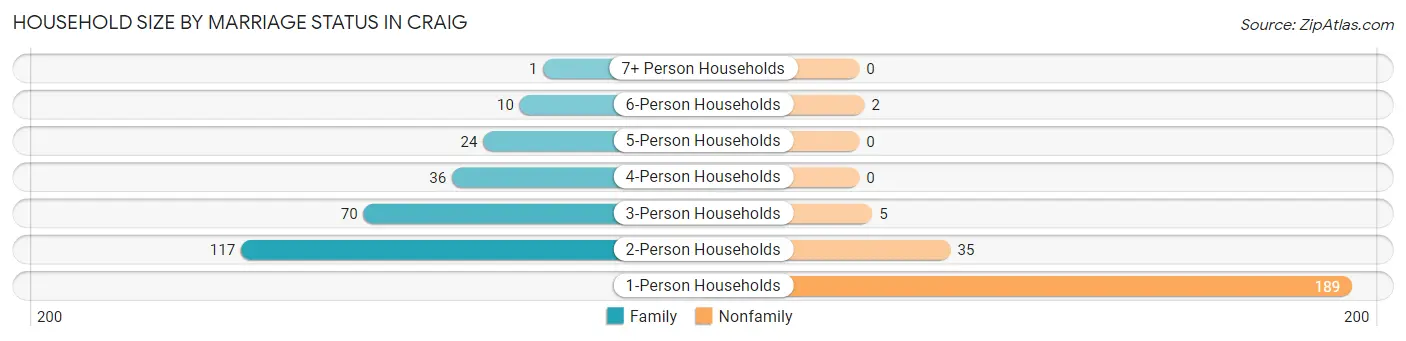
| Household Size | Family Households | Nonfamily Households |
| 1-Person Households | - | 189 (38.7%) |
| 2-Person Households | 117 (23.9%) | 35 (7.2%) |
| 3-Person Households | 70 (14.3%) | 5 (1.0%) |
| 4-Person Households | 36 (7.4%) | 0 (0.0%) |
| 5-Person Households | 24 (4.9%) | 0 (0.0%) |
| 6-Person Households | 10 (2.0%) | 2 (0.4%) |
| 7+ Person Households | 1 (0.2%) | 0 (0.0%) |
| Total | 258 (52.8%) | 231 (47.2%) |
Female Fertility in Craig
Fertility by Age in Craig
Average fertility rate in Craig is 88.0 births per 1,000 women. Women in the age bracket of 20 to 34 years have the highest fertility rate with 176.0 births per 1,000 women. Women in the age bracket of 20 to 34 years acount for 100.0% of all women with births.
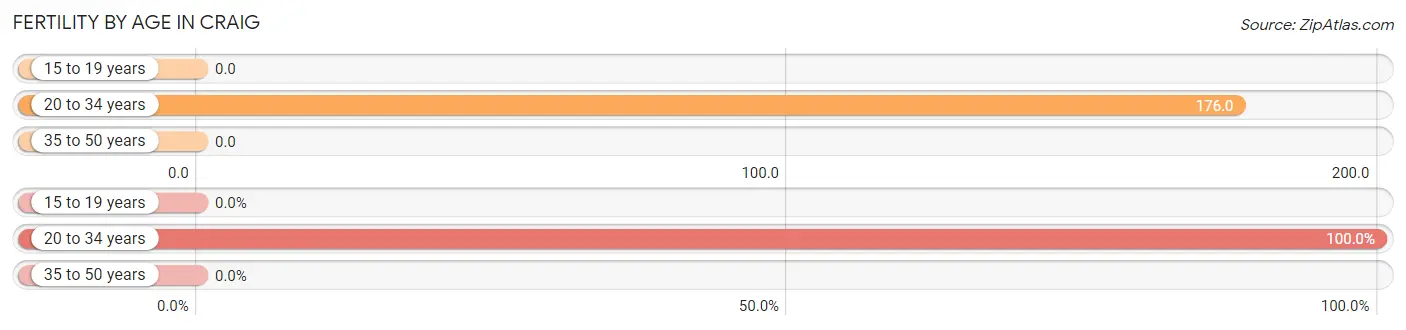
| Age Bracket | Women with Births | Births / 1,000 Women |
| 15 to 19 years | 0 (0.0%) | 0.0 |
| 20 to 34 years | 22 (100.0%) | 176.0 |
| 35 to 50 years | 0 (0.0%) | 0.0 |
| Total | 22 (100.0%) | 88.0 |
Fertility by Age by Marriage Status in Craig
45.5% of women with births (22) in Craig are married. The highest percentage of unmarried women with births falls into 20 to 34 years age bracket with 54.5% of them unmarried at the time of birth, while the lowest percentage of unmarried women with births belong to 20 to 34 years age bracket with 54.5% of them unmarried.
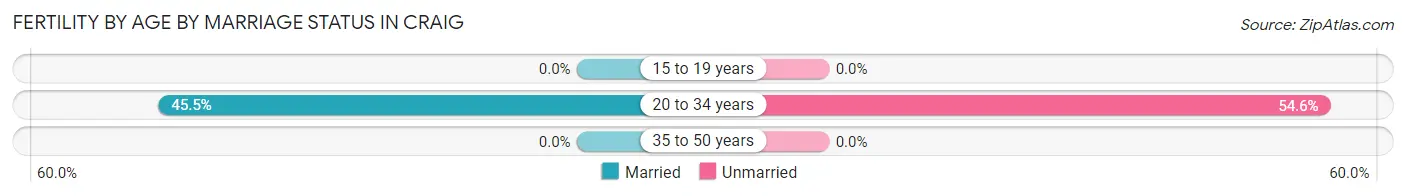
| Age Bracket | Married | Unmarried |
| 15 to 19 years | 0 (0.0%) | 0 (0.0%) |
| 20 to 34 years | 10 (45.5%) | 12 (54.5%) |
| 35 to 50 years | 0 (0.0%) | 0 (0.0%) |
| Total | 10 (45.5%) | 12 (54.5%) |
Fertility by Education in Craig
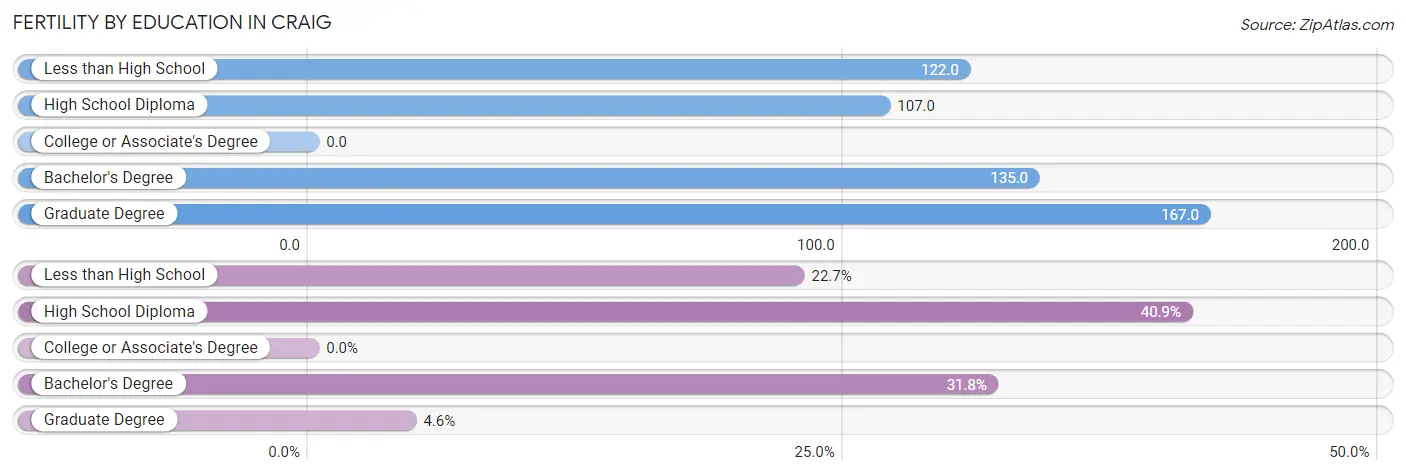
| Educational Attainment | Women with Births | Births / 1,000 Women |
| Less than High School | 5 (22.7%) | 122.0 |
| High School Diploma | 9 (40.9%) | 107.0 |
| College or Associate's Degree | 0 (0.0%) | 0.0 |
| Bachelor's Degree | 7 (31.8%) | 135.0 |
| Graduate Degree | 1 (4.5%) | 167.0 |
| Total | 22 (100.0%) | 88.0 |
Fertility by Education by Marriage Status in Craig
54.5% of women with births in Craig are unmarried. Women with the educational attainment of bachelor's degree are most likely to be married with 100.0% of them married at childbirth, while women with the educational attainment of high school diploma are least likely to be married with 100.0% of them unmarried at childbirth.
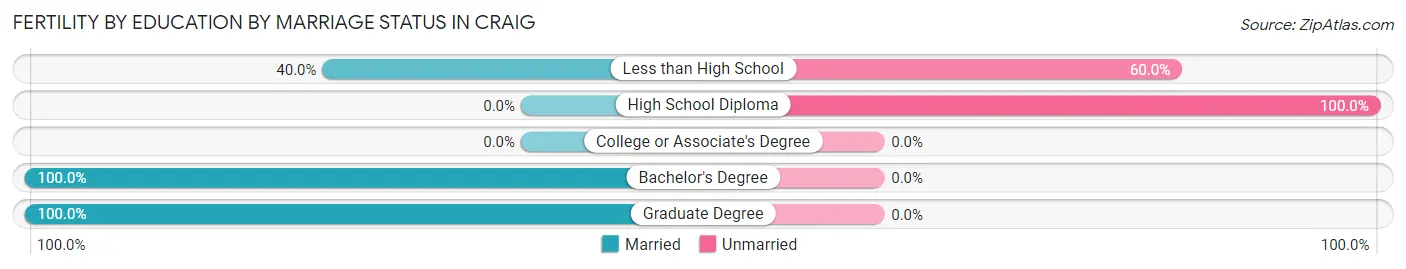
| Educational Attainment | Married | Unmarried |
| Less than High School | 2 (40.0%) | 3 (60.0%) |
| High School Diploma | 0 (0.0%) | 9 (100.0%) |
| College or Associate's Degree | 0 (0.0%) | 0 (0.0%) |
| Bachelor's Degree | 7 (100.0%) | 0 (0.0%) |
| Graduate Degree | 1 (100.0%) | 0 (0.0%) |
| Total | 10 (45.5%) | 12 (54.5%) |
Employment Characteristics in Craig
Employment by Class of Employer in Craig
Among the 597 employed individuals in Craig, private company employees (308 | 51.6%), local government employees (87 | 14.6%), and not-for-profit organizations (57 | 9.6%) make up the most common classes of employment.
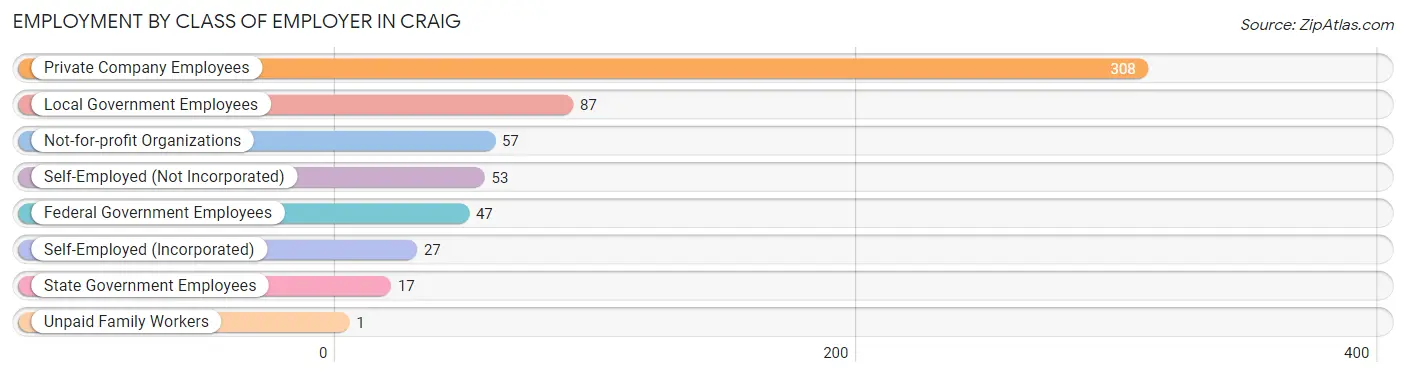
| Employer Class | # Employees | % Employees |
| Private Company Employees | 308 | 51.6% |
| Self-Employed (Incorporated) | 27 | 4.5% |
| Self-Employed (Not Incorporated) | 53 | 8.9% |
| Not-for-profit Organizations | 57 | 9.6% |
| Local Government Employees | 87 | 14.6% |
| State Government Employees | 17 | 2.9% |
| Federal Government Employees | 47 | 7.9% |
| Unpaid Family Workers | 1 | 0.2% |
| Total | 597 | 100.0% |
Employment Status by Age in Craig
According to the labor force statistics for Craig, out of the total population over 16 years of age (894), 74.2% or 663 individuals are in the labor force, with 5.7% or 38 of them unemployed. The age group with the highest labor force participation rate is 55 to 59 years, with 95.4% or 62 individuals in the labor force. Within the labor force, the 16 to 19 years age range has the highest percentage of unemployed individuals, with 14.5% or 8 of them being unemployed.
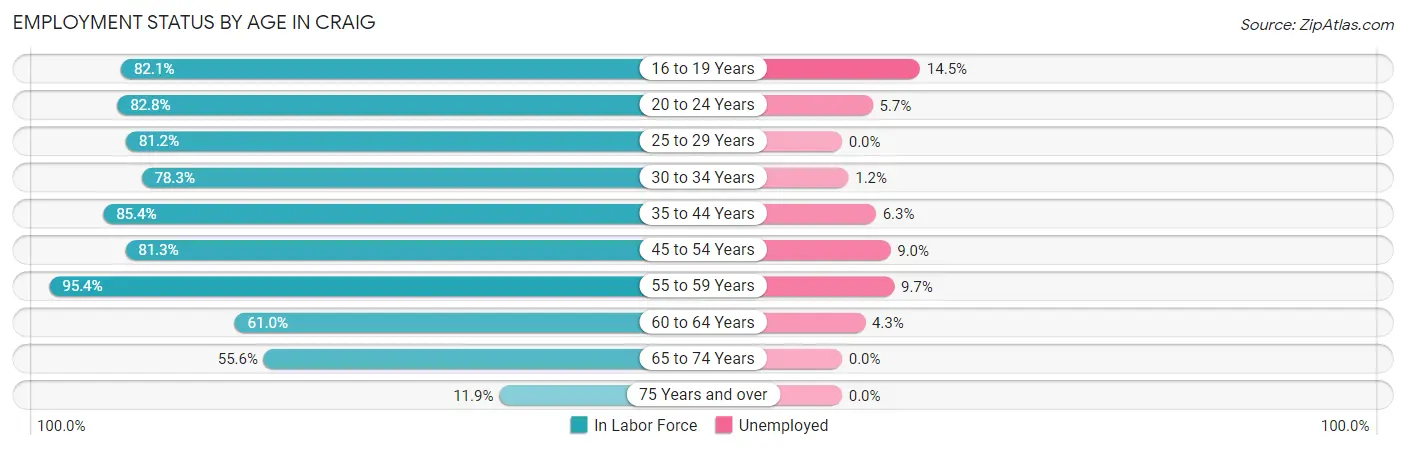
| Age Bracket | In Labor Force | Unemployed |
| 16 to 19 Years | 55 (82.1%) | 8 (14.5%) |
| 20 to 24 Years | 53 (82.8%) | 3 (5.7%) |
| 25 to 29 Years | 56 (81.2%) | 0 (0.0%) |
| 30 to 34 Years | 83 (78.3%) | 1 (1.2%) |
| 35 to 44 Years | 111 (85.4%) | 7 (6.3%) |
| 45 to 54 Years | 122 (81.3%) | 11 (9.0%) |
| 55 to 59 Years | 62 (95.4%) | 6 (9.7%) |
| 60 to 64 Years | 47 (61.0%) | 2 (4.3%) |
| 65 to 74 Years | 69 (55.6%) | 0 (0.0%) |
| 75 Years and over | 5 (11.9%) | 0 (0.0%) |
| Total | 663 (74.2%) | 38 (5.7%) |
Employment Status by Educational Attainment in Craig
According to labor force statistics for Craig, 80.6% of individuals (481) out of the total population between 25 and 64 years of age (597) are in the labor force, with 5.6% or 27 of them being unemployed. The group with the highest labor force participation rate are those with the educational attainment of college / associate degree, with 92.9% or 157 individuals in the labor force. Within the labor force, individuals with bachelor's degree or higher education have the highest percentage of unemployment, with 10.1% or 11 of them being unemployed.
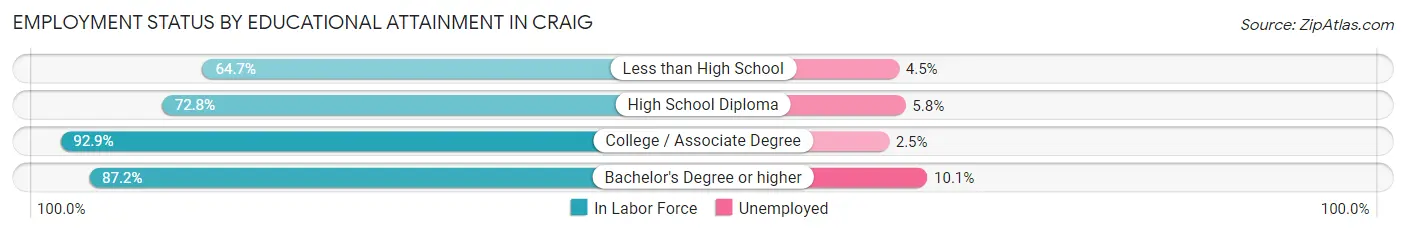
| Educational Attainment | In Labor Force | Unemployed |
| Less than High School | 44 (64.7%) | 3 (4.5%) |
| High School Diploma | 171 (72.8%) | 14 (5.8%) |
| College / Associate Degree | 157 (92.9%) | 4 (2.5%) |
| Bachelor's Degree or higher | 109 (87.2%) | 13 (10.1%) |
| Total | 481 (80.6%) | 33 (5.6%) |
Employment Occupations by Sex in Craig
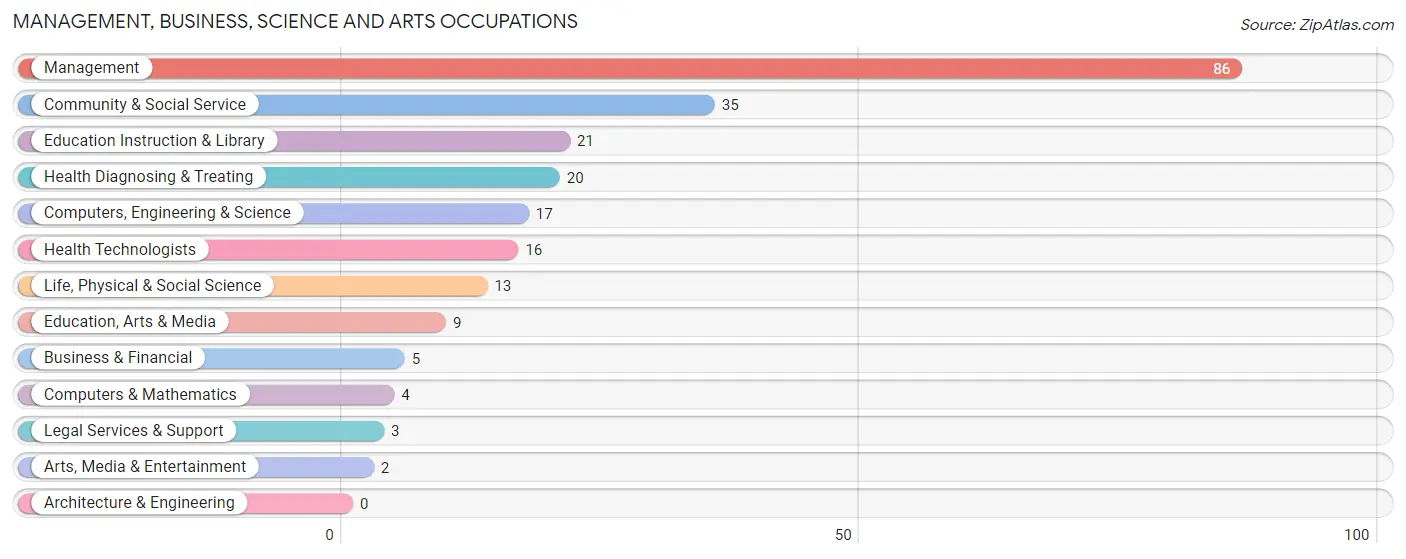
Management, Business, Science and Arts Occupations
The most common Management, Business, Science and Arts occupations in Craig are Management (86 | 13.8%), Community & Social Service (35 | 5.6%), Education Instruction & Library (21 | 3.4%), Health Diagnosing & Treating (20 | 3.2%), and Computers, Engineering & Science (17 | 2.7%).
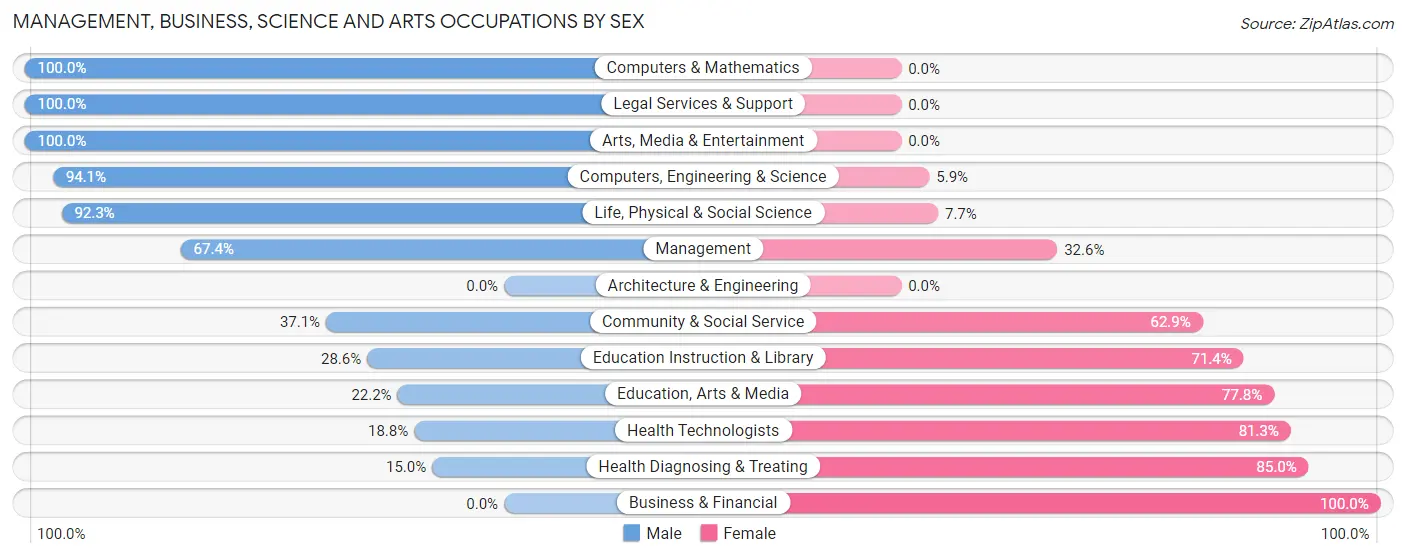
Management, Business, Science and Arts Occupations by Sex
Within the Management, Business, Science and Arts occupations in Craig, the most male-oriented occupations are Computers & Mathematics (100.0%), Legal Services & Support (100.0%), and Arts, Media & Entertainment (100.0%), while the most female-oriented occupations are Business & Financial (100.0%), Health Diagnosing & Treating (85.0%), and Health Technologists (81.2%).
| Occupation | Male | Female |
| Management | 58 (67.4%) | 28 (32.6%) |
| Business & Financial | 0 (0.0%) | 5 (100.0%) |
| Computers, Engineering & Science | 16 (94.1%) | 1 (5.9%) |
| Computers & Mathematics | 4 (100.0%) | 0 (0.0%) |
| Architecture & Engineering | 0 (0.0%) | 0 (0.0%) |
| Life, Physical & Social Science | 12 (92.3%) | 1 (7.7%) |
| Community & Social Service | 13 (37.1%) | 22 (62.9%) |
| Education, Arts & Media | 2 (22.2%) | 7 (77.8%) |
| Legal Services & Support | 3 (100.0%) | 0 (0.0%) |
| Education Instruction & Library | 6 (28.6%) | 15 (71.4%) |
| Arts, Media & Entertainment | 2 (100.0%) | 0 (0.0%) |
| Health Diagnosing & Treating | 3 (15.0%) | 17 (85.0%) |
| Health Technologists | 3 (18.8%) | 13 (81.2%) |
| Total (Category) | 90 (55.2%) | 73 (44.8%) |
| Total (Overall) | 366 (58.6%) | 259 (41.4%) |
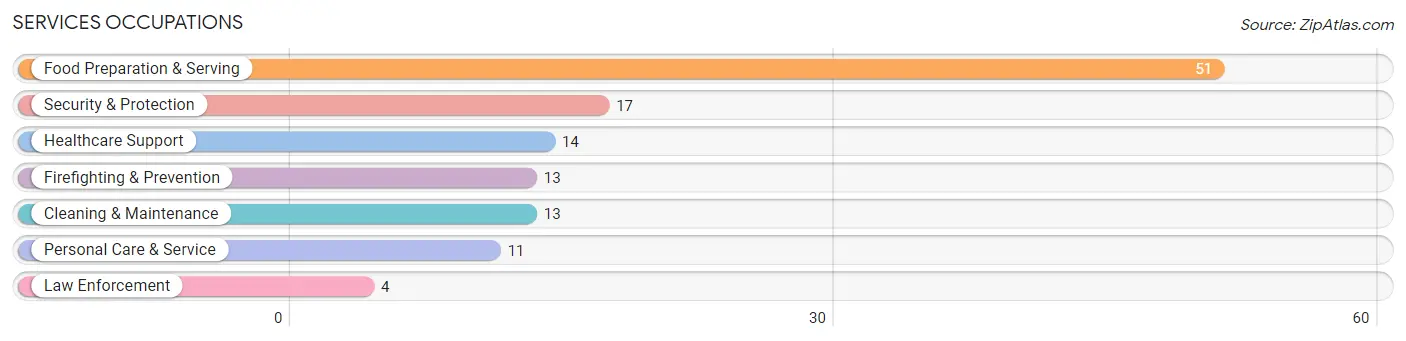
Services Occupations
The most common Services occupations in Craig are Food Preparation & Serving (51 | 8.2%), Security & Protection (17 | 2.7%), Healthcare Support (14 | 2.2%), Firefighting & Prevention (13 | 2.1%), and Cleaning & Maintenance (13 | 2.1%).
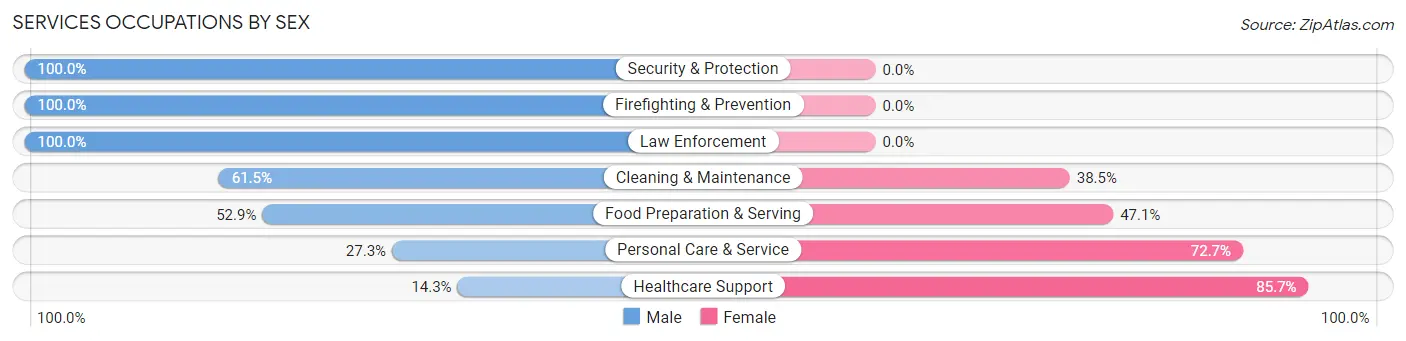
Services Occupations by Sex
Within the Services occupations in Craig, the most male-oriented occupations are Security & Protection (100.0%), Firefighting & Prevention (100.0%), and Law Enforcement (100.0%), while the most female-oriented occupations are Healthcare Support (85.7%), Personal Care & Service (72.7%), and Food Preparation & Serving (47.1%).
| Occupation | Male | Female |
| Healthcare Support | 2 (14.3%) | 12 (85.7%) |
| Security & Protection | 17 (100.0%) | 0 (0.0%) |
| Firefighting & Prevention | 13 (100.0%) | 0 (0.0%) |
| Law Enforcement | 4 (100.0%) | 0 (0.0%) |
| Food Preparation & Serving | 27 (52.9%) | 24 (47.1%) |
| Cleaning & Maintenance | 8 (61.5%) | 5 (38.5%) |
| Personal Care & Service | 3 (27.3%) | 8 (72.7%) |
| Total (Category) | 57 (53.8%) | 49 (46.2%) |
| Total (Overall) | 366 (58.6%) | 259 (41.4%) |
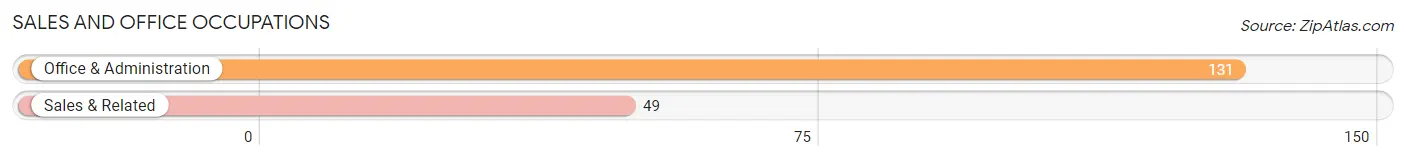
Sales and Office Occupations
The most common Sales and Office occupations in Craig are Office & Administration (131 | 21.0%), and Sales & Related (49 | 7.8%).
Sales and Office Occupations by Sex
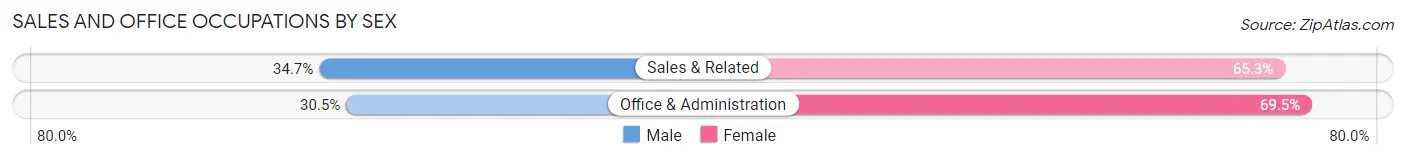
| Occupation | Male | Female |
| Sales & Related | 17 (34.7%) | 32 (65.3%) |
| Office & Administration | 40 (30.5%) | 91 (69.5%) |
| Total (Category) | 57 (31.7%) | 123 (68.3%) |
| Total (Overall) | 366 (58.6%) | 259 (41.4%) |
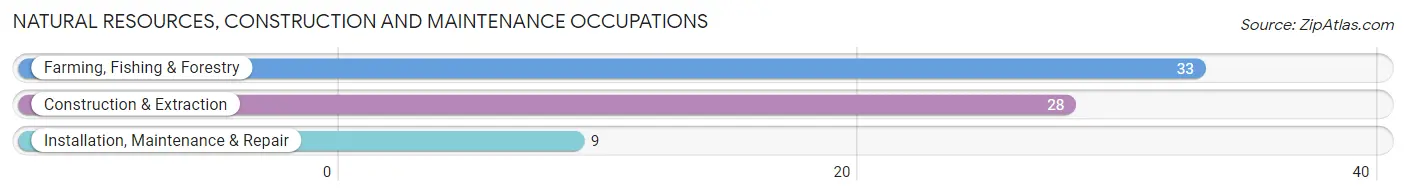
Natural Resources, Construction and Maintenance Occupations
The most common Natural Resources, Construction and Maintenance occupations in Craig are Farming, Fishing & Forestry (33 | 5.3%), Construction & Extraction (28 | 4.5%), and Installation, Maintenance & Repair (9 | 1.4%).
Natural Resources, Construction and Maintenance Occupations by Sex
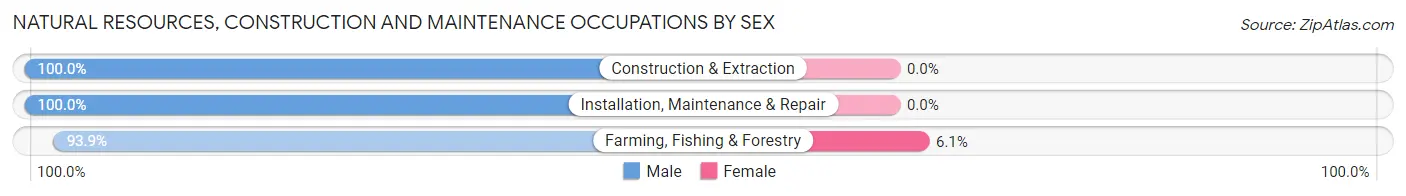
| Occupation | Male | Female |
| Farming, Fishing & Forestry | 31 (93.9%) | 2 (6.1%) |
| Construction & Extraction | 28 (100.0%) | 0 (0.0%) |
| Installation, Maintenance & Repair | 9 (100.0%) | 0 (0.0%) |
| Total (Category) | 68 (97.1%) | 2 (2.9%) |
| Total (Overall) | 366 (58.6%) | 259 (41.4%) |
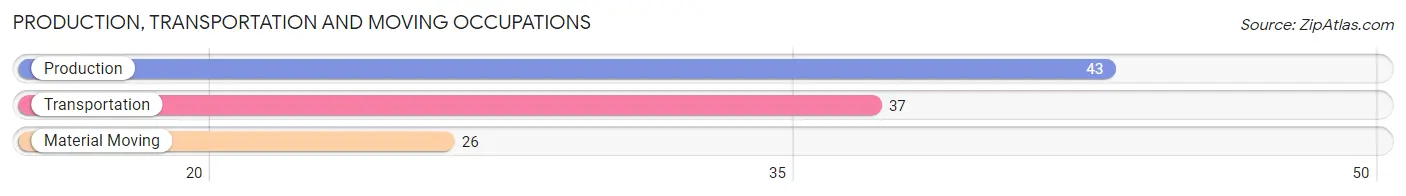
Production, Transportation and Moving Occupations
The most common Production, Transportation and Moving occupations in Craig are Production (43 | 6.9%), Transportation (37 | 5.9%), and Material Moving (26 | 4.2%).
Production, Transportation and Moving Occupations by Sex
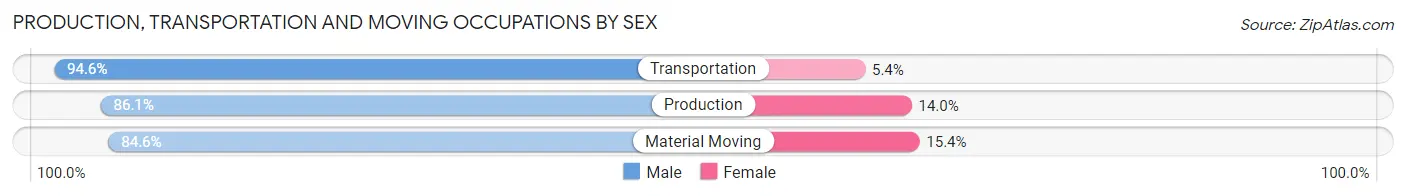
| Occupation | Male | Female |
| Production | 37 (86.1%) | 6 (14.0%) |
| Transportation | 35 (94.6%) | 2 (5.4%) |
| Material Moving | 22 (84.6%) | 4 (15.4%) |
| Total (Category) | 94 (88.7%) | 12 (11.3%) |
| Total (Overall) | 366 (58.6%) | 259 (41.4%) |
Employment Industries by Sex in Craig
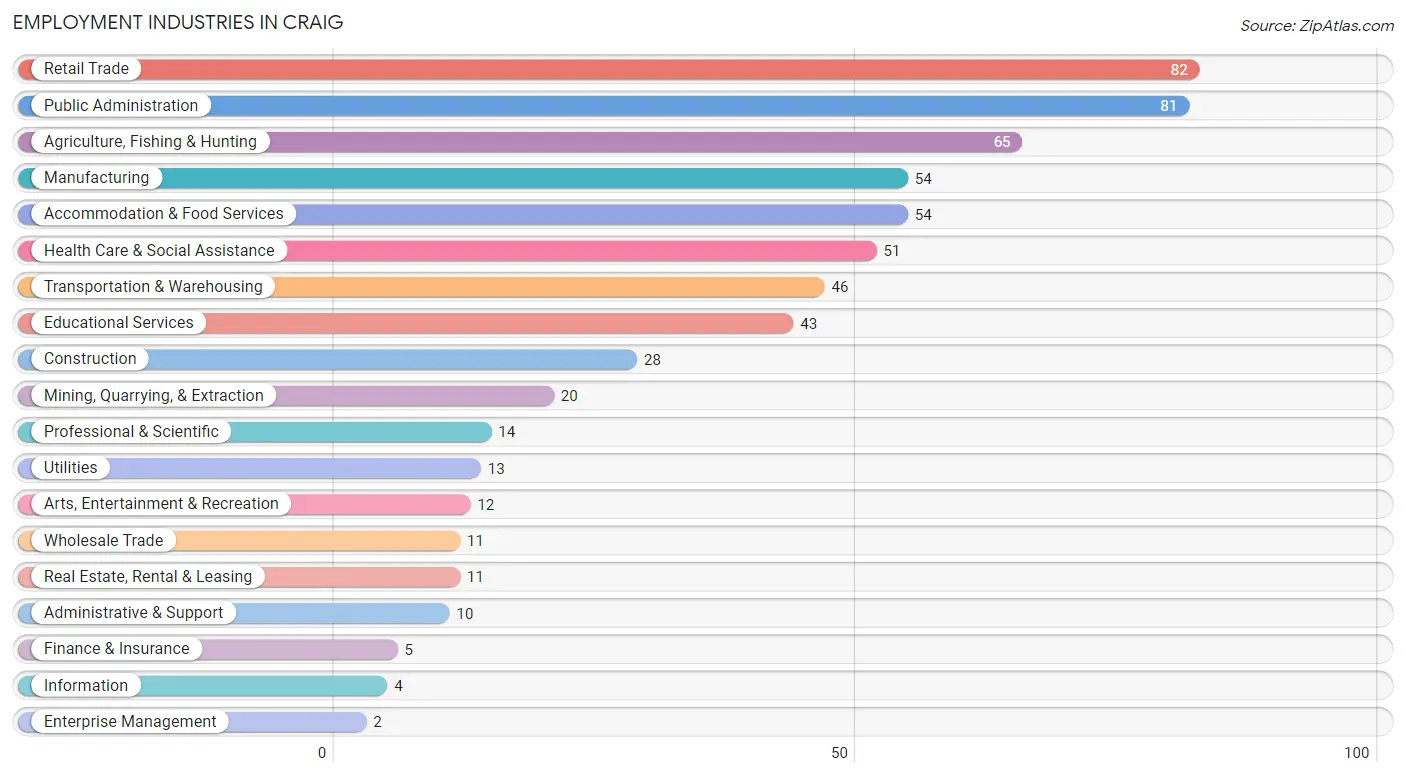
Employment Industries in Craig
The major employment industries in Craig include Retail Trade (82 | 13.1%), Public Administration (81 | 13.0%), Agriculture, Fishing & Hunting (65 | 10.4%), Manufacturing (54 | 8.6%), and Accommodation & Food Services (54 | 8.6%).
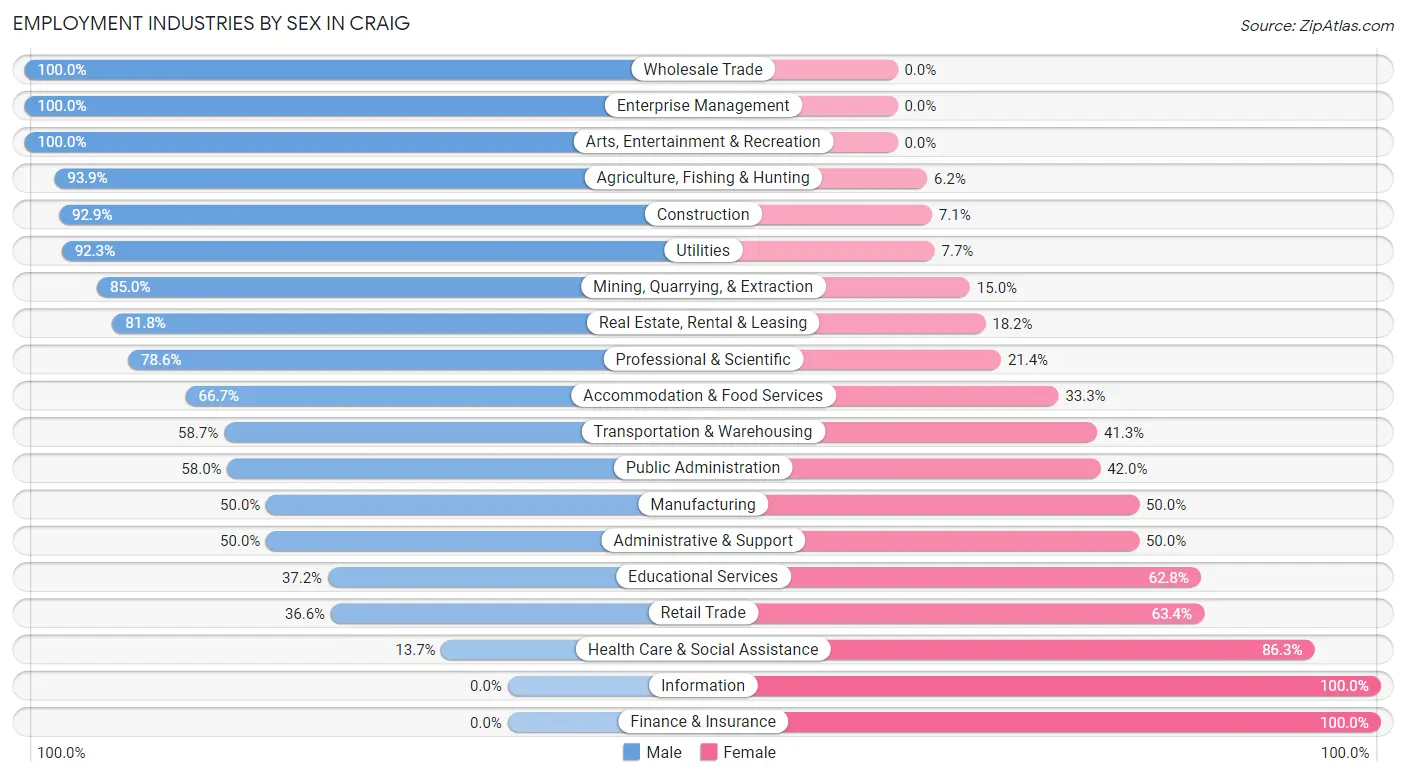
Employment Industries by Sex in Craig
The Craig industries that see more men than women are Wholesale Trade (100.0%), Enterprise Management (100.0%), and Arts, Entertainment & Recreation (100.0%), whereas the industries that tend to have a higher number of women are Information (100.0%), Finance & Insurance (100.0%), and Health Care & Social Assistance (86.3%).
| Industry | Male | Female |
| Agriculture, Fishing & Hunting | 61 (93.9%) | 4 (6.1%) |
| Mining, Quarrying, & Extraction | 17 (85.0%) | 3 (15.0%) |
| Construction | 26 (92.9%) | 2 (7.1%) |
| Manufacturing | 27 (50.0%) | 27 (50.0%) |
| Wholesale Trade | 11 (100.0%) | 0 (0.0%) |
| Retail Trade | 30 (36.6%) | 52 (63.4%) |
| Transportation & Warehousing | 27 (58.7%) | 19 (41.3%) |
| Utilities | 12 (92.3%) | 1 (7.7%) |
| Information | 0 (0.0%) | 4 (100.0%) |
| Finance & Insurance | 0 (0.0%) | 5 (100.0%) |
| Real Estate, Rental & Leasing | 9 (81.8%) | 2 (18.2%) |
| Professional & Scientific | 11 (78.6%) | 3 (21.4%) |
| Enterprise Management | 2 (100.0%) | 0 (0.0%) |
| Administrative & Support | 5 (50.0%) | 5 (50.0%) |
| Educational Services | 16 (37.2%) | 27 (62.8%) |
| Health Care & Social Assistance | 7 (13.7%) | 44 (86.3%) |
| Arts, Entertainment & Recreation | 12 (100.0%) | 0 (0.0%) |
| Accommodation & Food Services | 36 (66.7%) | 18 (33.3%) |
| Public Administration | 47 (58.0%) | 34 (42.0%) |
| Total | 366 (58.6%) | 259 (41.4%) |
Education in Craig
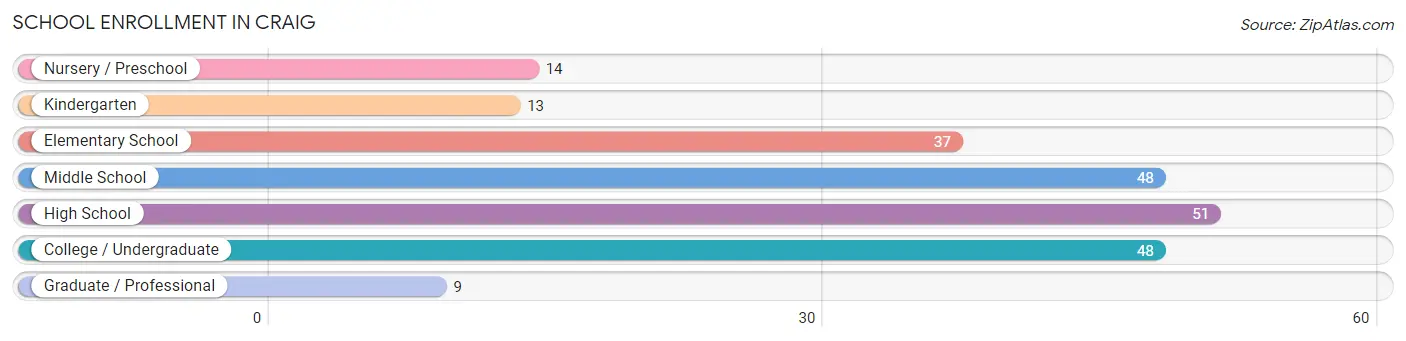
School Enrollment in Craig
The most common levels of schooling among the 220 students in Craig are high school (51 | 23.2%), middle school (48 | 21.8%), and college / undergraduate (48 | 21.8%).
| School Level | # Students | % Students |
| Nursery / Preschool | 14 | 6.4% |
| Kindergarten | 13 | 5.9% |
| Elementary School | 37 | 16.8% |
| Middle School | 48 | 21.8% |
| High School | 51 | 23.2% |
| College / Undergraduate | 48 | 21.8% |
| Graduate / Professional | 9 | 4.1% |
| Total | 220 | 100.0% |
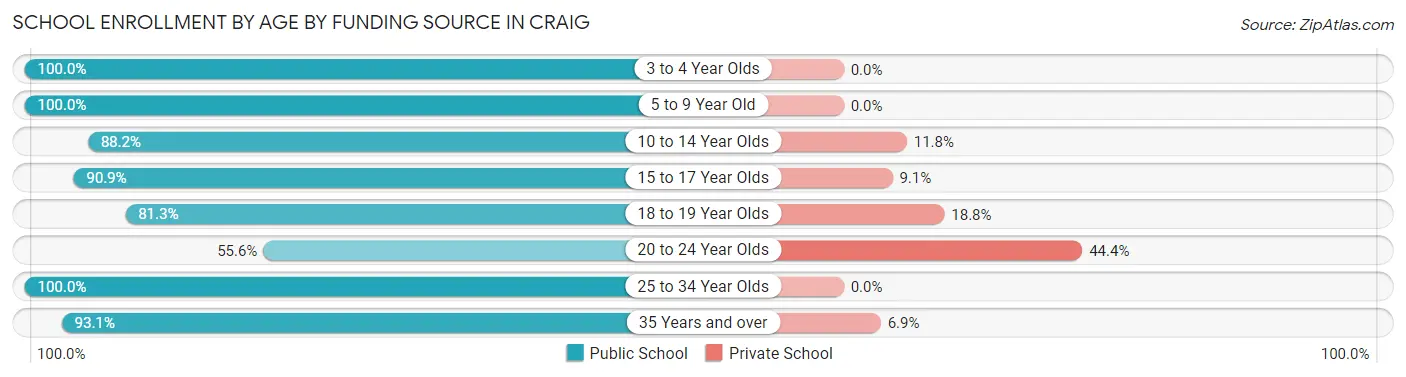
School Enrollment by Age by Funding Source in Craig
Out of a total of 220 students who are enrolled in schools in Craig, 19 (8.6%) attend a private institution, while the remaining 201 (91.4%) are enrolled in public schools. The age group of 20 to 24 year olds has the highest likelihood of being enrolled in private schools, with 4 (44.4% in the age bracket) enrolled. Conversely, the age group of 3 to 4 year olds has the lowest likelihood of being enrolled in a private school, with 10 (100.0% in the age bracket) attending a public institution.
| Age Bracket | Public School | Private School |
| 3 to 4 Year Olds | 10 (100.0%) | 0 (0.0%) |
| 5 to 9 Year Old | 54 (100.0%) | 0 (0.0%) |
| 10 to 14 Year Olds | 45 (88.2%) | 6 (11.8%) |
| 15 to 17 Year Olds | 40 (90.9%) | 4 (9.1%) |
| 18 to 19 Year Olds | 13 (81.2%) | 3 (18.8%) |
| 20 to 24 Year Olds | 5 (55.6%) | 4 (44.4%) |
| 25 to 34 Year Olds | 7 (100.0%) | 0 (0.0%) |
| 35 Years and over | 27 (93.1%) | 2 (6.9%) |
| Total | 201 (91.4%) | 19 (8.6%) |
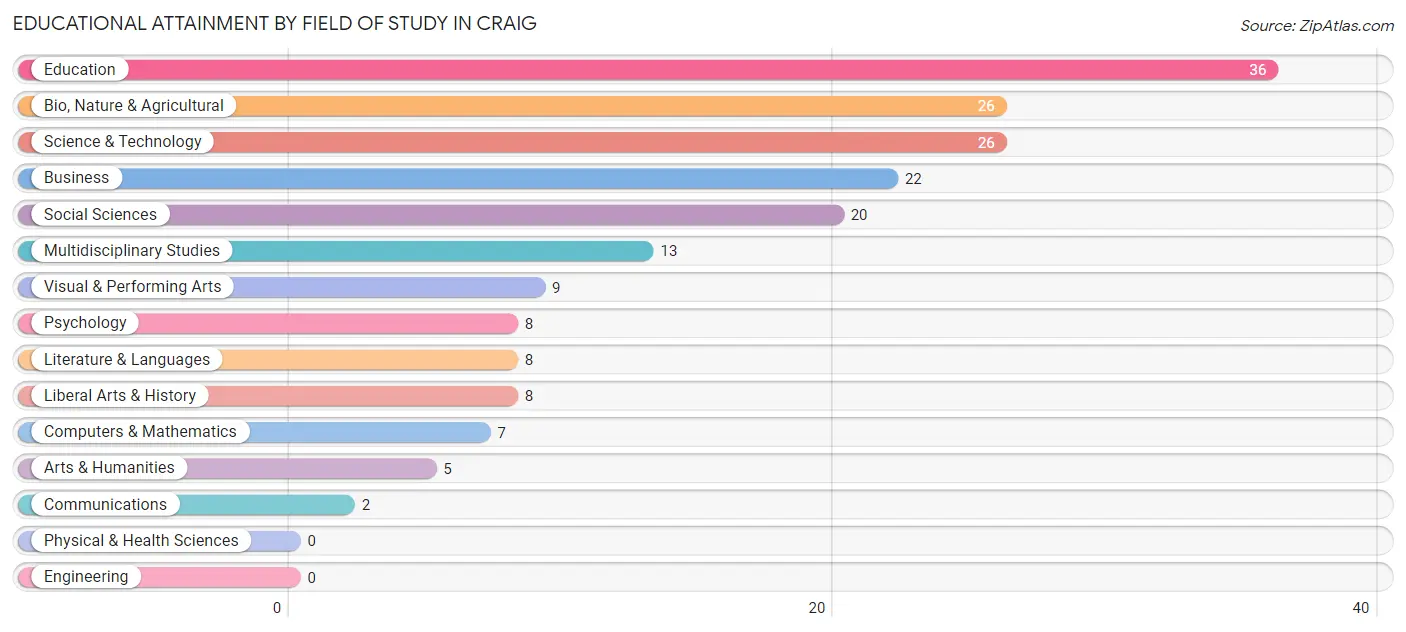
Educational Attainment by Field of Study in Craig
Education (36 | 19.0%), bio, nature & agricultural (26 | 13.7%), science & technology (26 | 13.7%), business (22 | 11.6%), and social sciences (20 | 10.5%) are the most common fields of study among 190 individuals in Craig who have obtained a bachelor's degree or higher.
| Field of Study | # Graduates | % Graduates |
| Computers & Mathematics | 7 | 3.7% |
| Bio, Nature & Agricultural | 26 | 13.7% |
| Physical & Health Sciences | 0 | 0.0% |
| Psychology | 8 | 4.2% |
| Social Sciences | 20 | 10.5% |
| Engineering | 0 | 0.0% |
| Multidisciplinary Studies | 13 | 6.8% |
| Science & Technology | 26 | 13.7% |
| Business | 22 | 11.6% |
| Education | 36 | 19.0% |
| Literature & Languages | 8 | 4.2% |
| Liberal Arts & History | 8 | 4.2% |
| Visual & Performing Arts | 9 | 4.7% |
| Communications | 2 | 1.1% |
| Arts & Humanities | 5 | 2.6% |
| Total | 190 | 100.0% |
Transportation & Commute in Craig
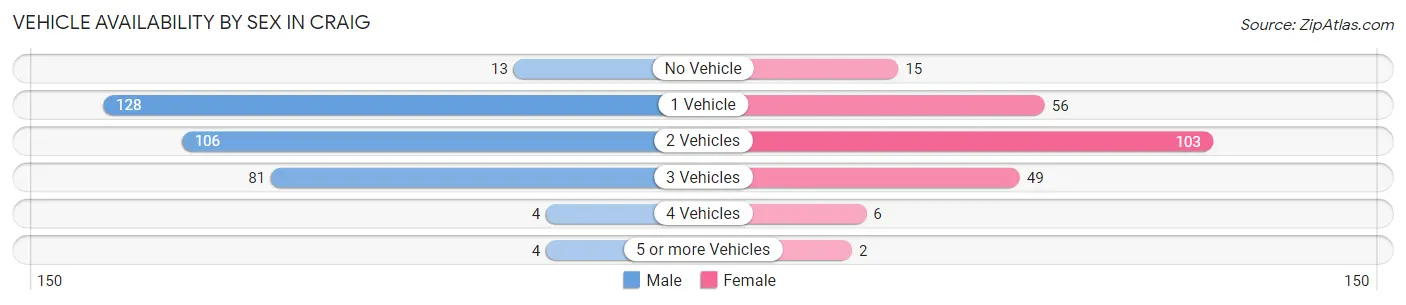
Vehicle Availability by Sex in Craig
The most prevalent vehicle ownership categories in Craig are males with 1 vehicle (128, accounting for 38.1%) and females with 1 vehicle (56, making up 55.4%).
| Vehicles Available | Male | Female |
| No Vehicle | 13 (3.9%) | 15 (6.5%) |
| 1 Vehicle | 128 (38.1%) | 56 (24.2%) |
| 2 Vehicles | 106 (31.6%) | 103 (44.6%) |
| 3 Vehicles | 81 (24.1%) | 49 (21.2%) |
| 4 Vehicles | 4 (1.2%) | 6 (2.6%) |
| 5 or more Vehicles | 4 (1.2%) | 2 (0.9%) |
| Total | 336 (100.0%) | 231 (100.0%) |
Commute Time in Craig
The most frequently occuring commute durations in Craig are less than 5 minutes (234 commuters, 40.1%), 5 to 9 minutes (146 commuters, 25.0%), and 15 to 19 minutes (94 commuters, 16.1%).
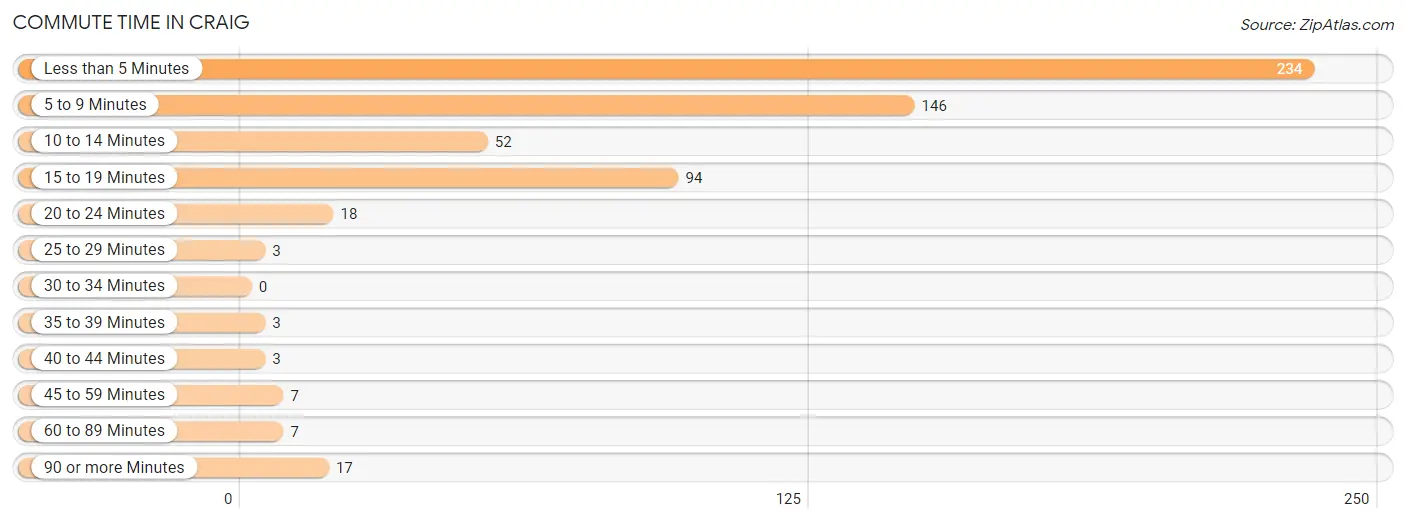
| Commute Time | # Commuters | % Commuters |
| Less than 5 Minutes | 234 | 40.1% |
| 5 to 9 Minutes | 146 | 25.0% |
| 10 to 14 Minutes | 52 | 8.9% |
| 15 to 19 Minutes | 94 | 16.1% |
| 20 to 24 Minutes | 18 | 3.1% |
| 25 to 29 Minutes | 3 | 0.5% |
| 30 to 34 Minutes | 0 | 0.0% |
| 35 to 39 Minutes | 3 | 0.5% |
| 40 to 44 Minutes | 3 | 0.5% |
| 45 to 59 Minutes | 7 | 1.2% |
| 60 to 89 Minutes | 7 | 1.2% |
| 90 or more Minutes | 17 | 2.9% |
Commute Time by Sex in Craig
The most common commute times in Craig are less than 5 minutes (149 commuters, 43.1%) for males and less than 5 minutes (85 commuters, 35.7%) for females.
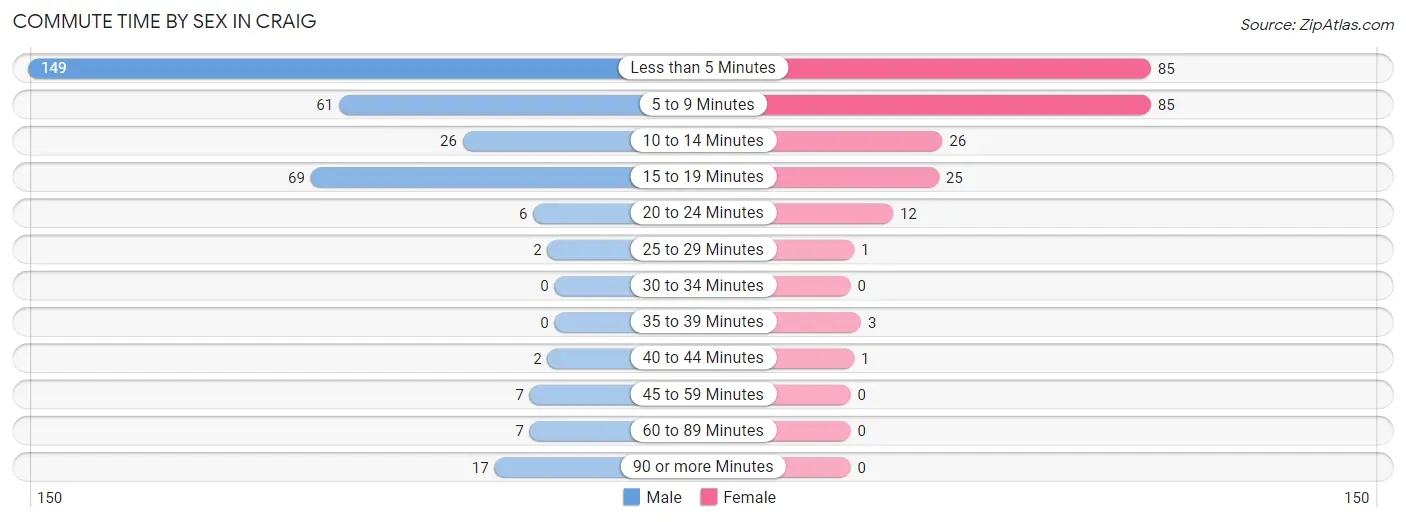
| Commute Time | Male | Female |
| Less than 5 Minutes | 149 (43.1%) | 85 (35.7%) |
| 5 to 9 Minutes | 61 (17.6%) | 85 (35.7%) |
| 10 to 14 Minutes | 26 (7.5%) | 26 (10.9%) |
| 15 to 19 Minutes | 69 (19.9%) | 25 (10.5%) |
| 20 to 24 Minutes | 6 (1.7%) | 12 (5.0%) |
| 25 to 29 Minutes | 2 (0.6%) | 1 (0.4%) |
| 30 to 34 Minutes | 0 (0.0%) | 0 (0.0%) |
| 35 to 39 Minutes | 0 (0.0%) | 3 (1.3%) |
| 40 to 44 Minutes | 2 (0.6%) | 1 (0.4%) |
| 45 to 59 Minutes | 7 (2.0%) | 0 (0.0%) |
| 60 to 89 Minutes | 7 (2.0%) | 0 (0.0%) |
| 90 or more Minutes | 17 (4.9%) | 0 (0.0%) |
Time of Departure to Work by Sex in Craig
The most frequent times of departure to work in Craig are 12:00 AM to 4:59 AM (54, 15.6%) for males and 7:30 AM to 7:59 AM (95, 39.9%) for females.
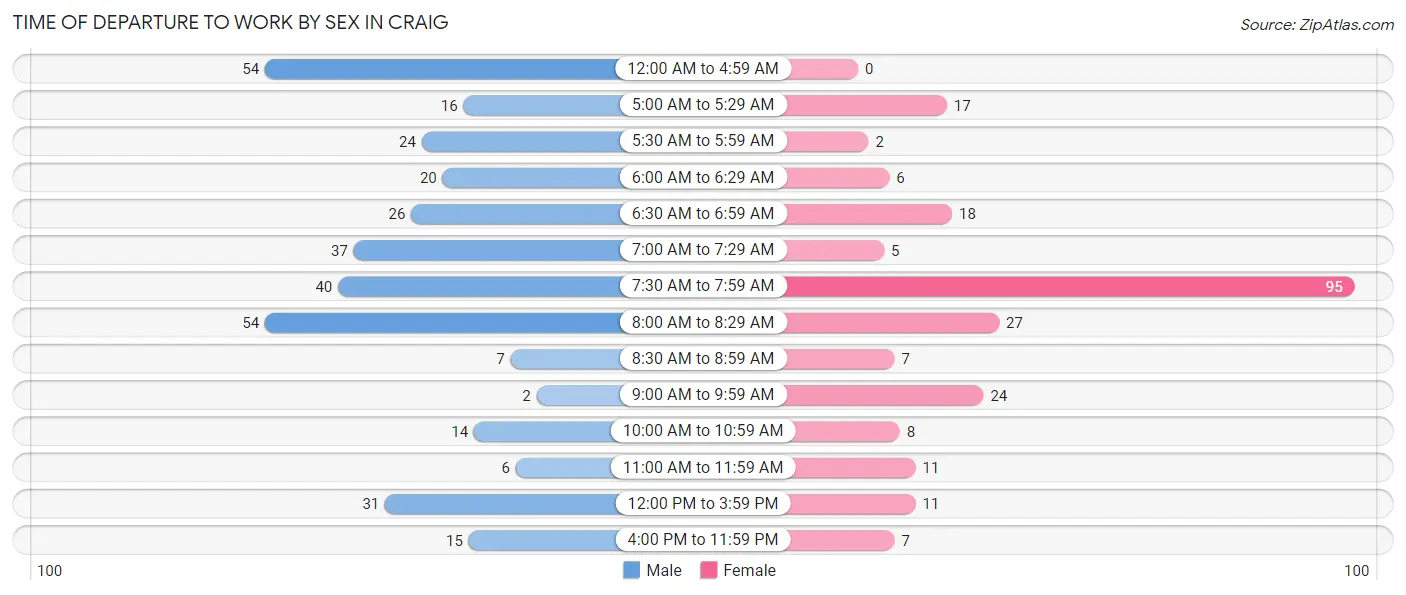
| Time of Departure | Male | Female |
| 12:00 AM to 4:59 AM | 54 (15.6%) | 0 (0.0%) |
| 5:00 AM to 5:29 AM | 16 (4.6%) | 17 (7.1%) |
| 5:30 AM to 5:59 AM | 24 (6.9%) | 2 (0.8%) |
| 6:00 AM to 6:29 AM | 20 (5.8%) | 6 (2.5%) |
| 6:30 AM to 6:59 AM | 26 (7.5%) | 18 (7.6%) |
| 7:00 AM to 7:29 AM | 37 (10.7%) | 5 (2.1%) |
| 7:30 AM to 7:59 AM | 40 (11.6%) | 95 (39.9%) |
| 8:00 AM to 8:29 AM | 54 (15.6%) | 27 (11.3%) |
| 8:30 AM to 8:59 AM | 7 (2.0%) | 7 (2.9%) |
| 9:00 AM to 9:59 AM | 2 (0.6%) | 24 (10.1%) |
| 10:00 AM to 10:59 AM | 14 (4.1%) | 8 (3.4%) |
| 11:00 AM to 11:59 AM | 6 (1.7%) | 11 (4.6%) |
| 12:00 PM to 3:59 PM | 31 (9.0%) | 11 (4.6%) |
| 4:00 PM to 11:59 PM | 15 (4.3%) | 7 (2.9%) |
| Total | 346 (100.0%) | 238 (100.0%) |
Housing Occupancy in Craig
Occupancy by Ownership in Craig
Of the total 489 dwellings in Craig, owner-occupied units account for 313 (64.0%), while renter-occupied units make up 176 (36.0%).
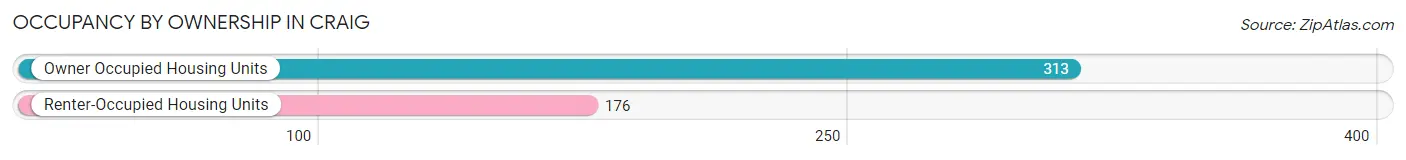
| Occupancy | # Housing Units | % Housing Units |
| Owner Occupied Housing Units | 313 | 64.0% |
| Renter-Occupied Housing Units | 176 | 36.0% |
| Total Occupied Housing Units | 489 | 100.0% |
Occupancy by Household Size in Craig

| Household Size | # Housing Units | % Housing Units |
| 1-Person Household | 189 | 38.7% |
| 2-Person Household | 152 | 31.1% |
| 3-Person Household | 75 | 15.3% |
| 4+ Person Household | 73 | 14.9% |
| Total Housing Units | 489 | 100.0% |
Occupancy by Ownership by Household Size in Craig
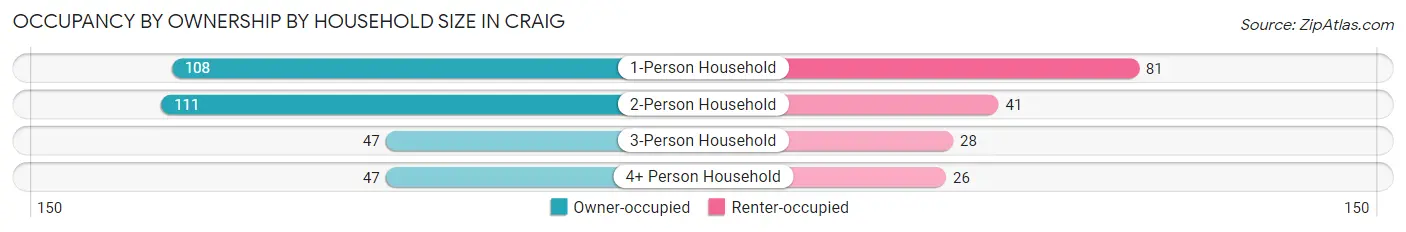
| Household Size | Owner-occupied | Renter-occupied |
| 1-Person Household | 108 (57.1%) | 81 (42.9%) |
| 2-Person Household | 111 (73.0%) | 41 (27.0%) |
| 3-Person Household | 47 (62.7%) | 28 (37.3%) |
| 4+ Person Household | 47 (64.4%) | 26 (35.6%) |
| Total Housing Units | 313 (64.0%) | 176 (36.0%) |
Occupancy by Educational Attainment in Craig
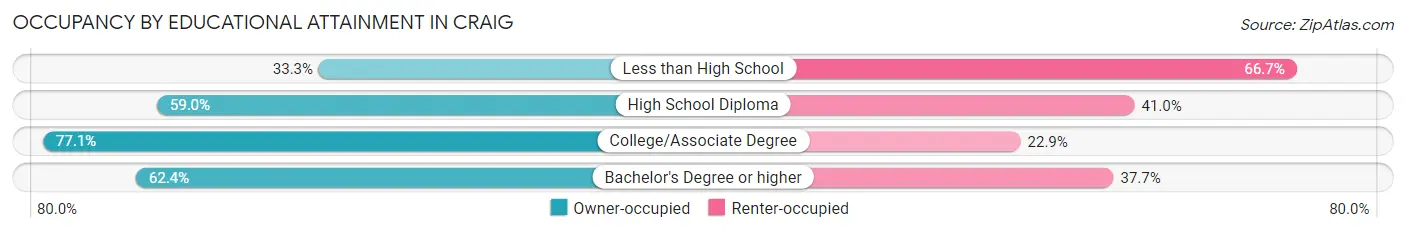
| Household Size | Owner-occupied | Renter-occupied |
| Less than High School | 14 (33.3%) | 28 (66.7%) |
| High School Diploma | 108 (59.0%) | 75 (41.0%) |
| College/Associate Degree | 138 (77.1%) | 41 (22.9%) |
| Bachelor's Degree or higher | 53 (62.4%) | 32 (37.7%) |
Occupancy by Age of Householder in Craig
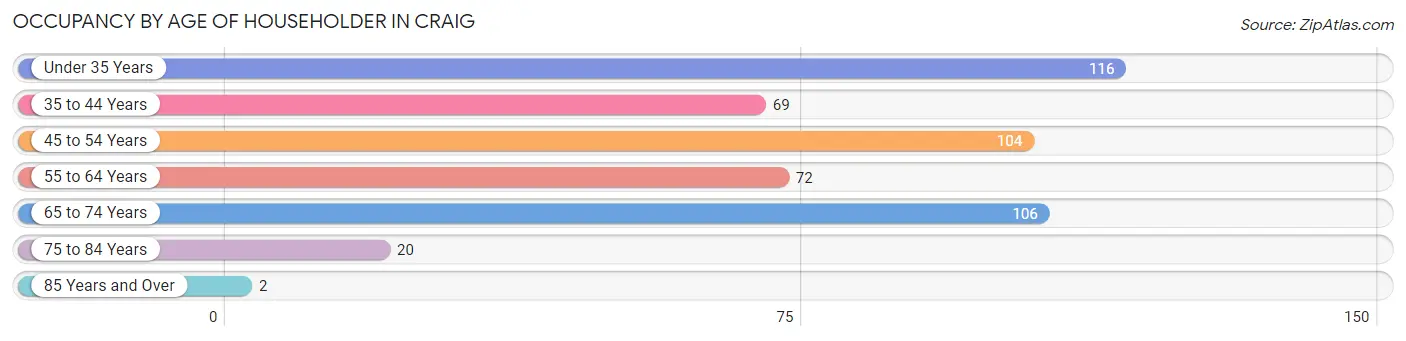
| Age Bracket | # Households | % Households |
| Under 35 Years | 116 | 23.7% |
| 35 to 44 Years | 69 | 14.1% |
| 45 to 54 Years | 104 | 21.3% |
| 55 to 64 Years | 72 | 14.7% |
| 65 to 74 Years | 106 | 21.7% |
| 75 to 84 Years | 20 | 4.1% |
| 85 Years and Over | 2 | 0.4% |
| Total | 489 | 100.0% |
Housing Finances in Craig
Median Income by Occupancy in Craig
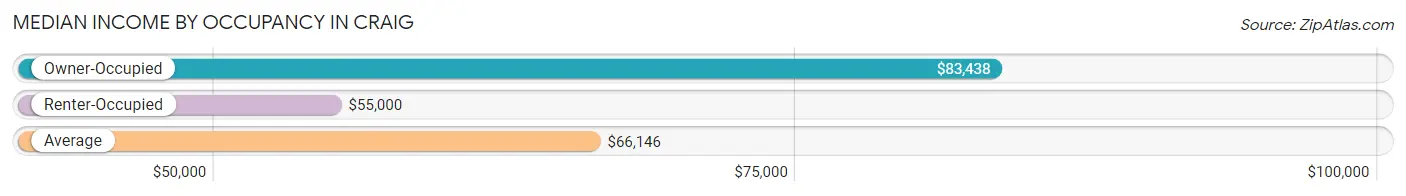
| Occupancy Type | # Households | Median Income |
| Owner-Occupied | 313 (64.0%) | $83,438 |
| Renter-Occupied | 176 (36.0%) | $55,000 |
| Average | 489 (100.0%) | $66,146 |
Occupancy by Householder Income Bracket in Craig
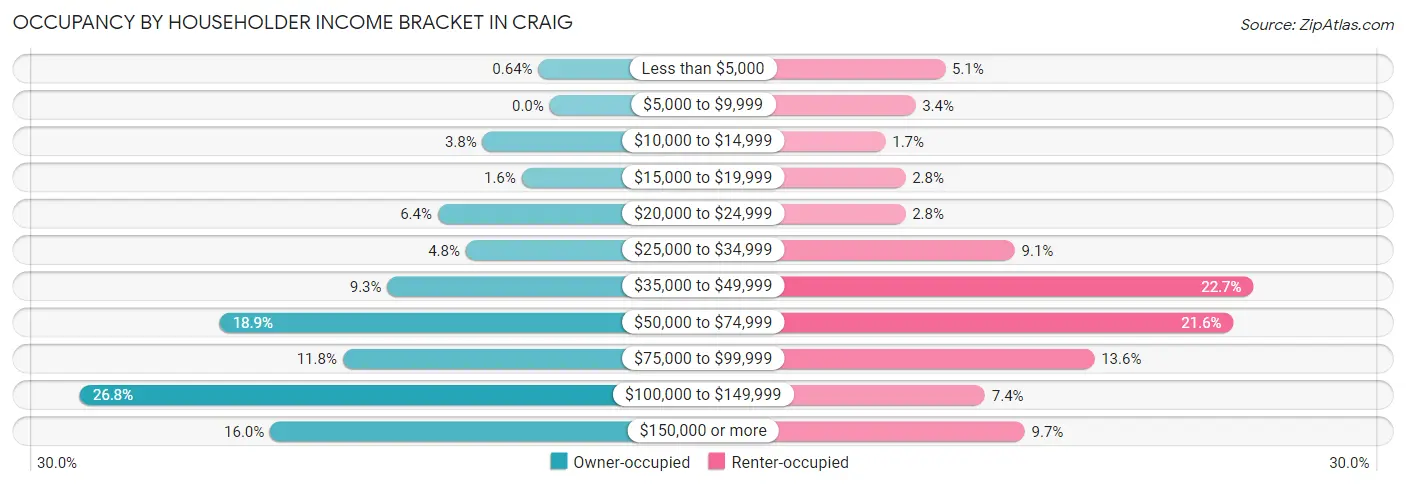
| Income Bracket | Owner-occupied | Renter-occupied |
| Less than $5,000 | 2 (0.6%) | 9 (5.1%) |
| $5,000 to $9,999 | 0 (0.0%) | 6 (3.4%) |
| $10,000 to $14,999 | 12 (3.8%) | 3 (1.7%) |
| $15,000 to $19,999 | 5 (1.6%) | 5 (2.8%) |
| $20,000 to $24,999 | 20 (6.4%) | 5 (2.8%) |
| $25,000 to $34,999 | 15 (4.8%) | 16 (9.1%) |
| $35,000 to $49,999 | 29 (9.3%) | 40 (22.7%) |
| $50,000 to $74,999 | 59 (18.9%) | 38 (21.6%) |
| $75,000 to $99,999 | 37 (11.8%) | 24 (13.6%) |
| $100,000 to $149,999 | 84 (26.8%) | 13 (7.4%) |
| $150,000 or more | 50 (16.0%) | 17 (9.7%) |
| Total | 313 (100.0%) | 176 (100.0%) |
Monthly Housing Cost Tiers in Craig
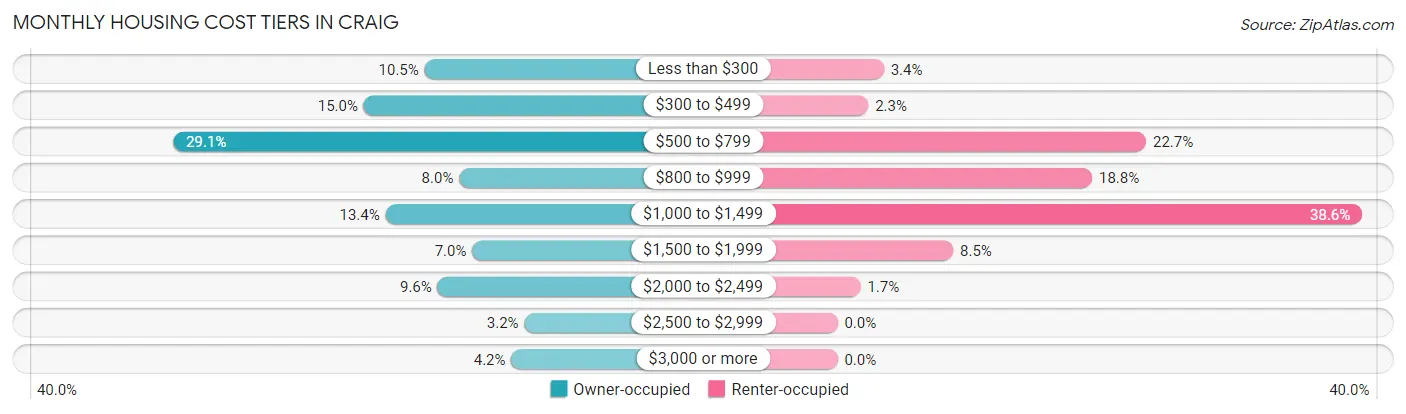
| Monthly Cost | Owner-occupied | Renter-occupied |
| Less than $300 | 33 (10.5%) | 6 (3.4%) |
| $300 to $499 | 47 (15.0%) | 4 (2.3%) |
| $500 to $799 | 91 (29.1%) | 40 (22.7%) |
| $800 to $999 | 25 (8.0%) | 33 (18.8%) |
| $1,000 to $1,499 | 42 (13.4%) | 68 (38.6%) |
| $1,500 to $1,999 | 22 (7.0%) | 15 (8.5%) |
| $2,000 to $2,499 | 30 (9.6%) | 3 (1.7%) |
| $2,500 to $2,999 | 10 (3.2%) | 0 (0.0%) |
| $3,000 or more | 13 (4.2%) | 0 (0.0%) |
| Total | 313 (100.0%) | 176 (100.0%) |
Physical Housing Characteristics in Craig
Housing Structures in Craig
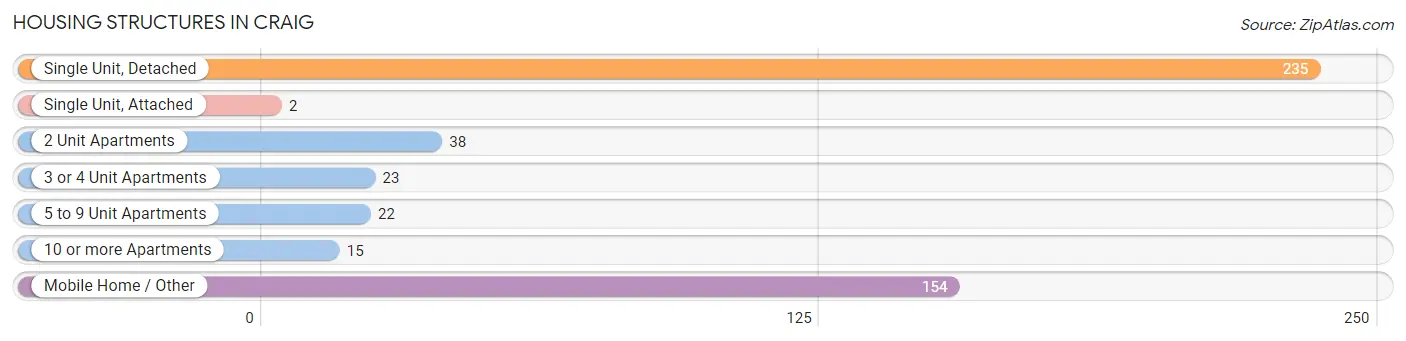
| Structure Type | # Housing Units | % Housing Units |
| Single Unit, Detached | 235 | 48.1% |
| Single Unit, Attached | 2 | 0.4% |
| 2 Unit Apartments | 38 | 7.8% |
| 3 or 4 Unit Apartments | 23 | 4.7% |
| 5 to 9 Unit Apartments | 22 | 4.5% |
| 10 or more Apartments | 15 | 3.1% |
| Mobile Home / Other | 154 | 31.5% |
| Total | 489 | 100.0% |
Housing Structures by Occupancy in Craig
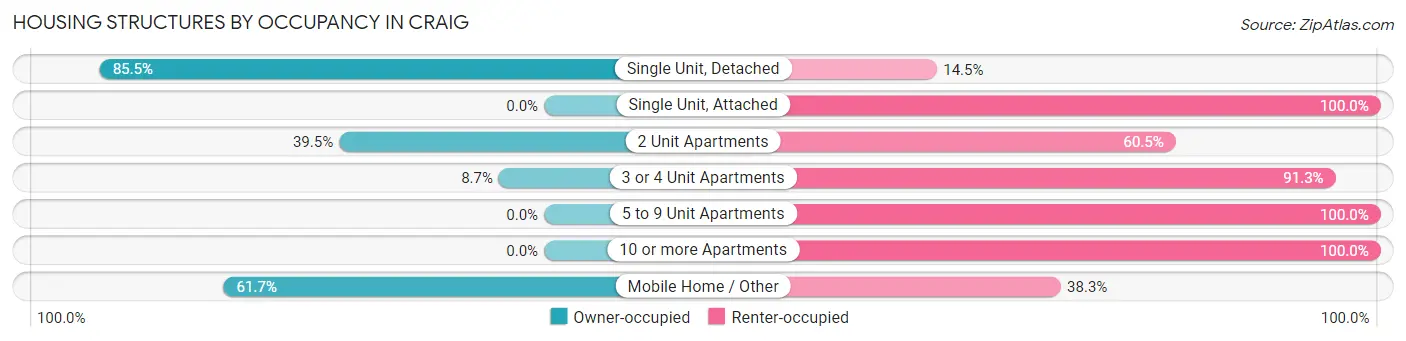
| Structure Type | Owner-occupied | Renter-occupied |
| Single Unit, Detached | 201 (85.5%) | 34 (14.5%) |
| Single Unit, Attached | 0 (0.0%) | 2 (100.0%) |
| 2 Unit Apartments | 15 (39.5%) | 23 (60.5%) |
| 3 or 4 Unit Apartments | 2 (8.7%) | 21 (91.3%) |
| 5 to 9 Unit Apartments | 0 (0.0%) | 22 (100.0%) |
| 10 or more Apartments | 0 (0.0%) | 15 (100.0%) |
| Mobile Home / Other | 95 (61.7%) | 59 (38.3%) |
| Total | 313 (64.0%) | 176 (36.0%) |
Housing Structures by Number of Rooms in Craig
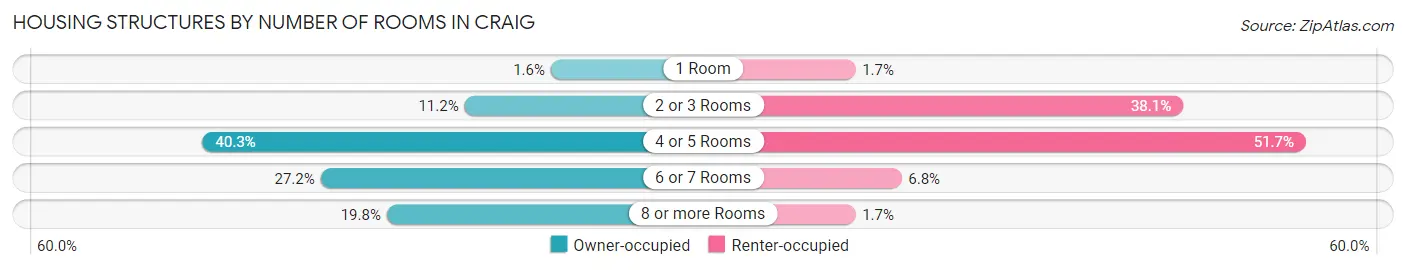
| Number of Rooms | Owner-occupied | Renter-occupied |
| 1 Room | 5 (1.6%) | 3 (1.7%) |
| 2 or 3 Rooms | 35 (11.2%) | 67 (38.1%) |
| 4 or 5 Rooms | 126 (40.3%) | 91 (51.7%) |
| 6 or 7 Rooms | 85 (27.2%) | 12 (6.8%) |
| 8 or more Rooms | 62 (19.8%) | 3 (1.7%) |
| Total | 313 (100.0%) | 176 (100.0%) |
Housing Structure by Heating Type in Craig
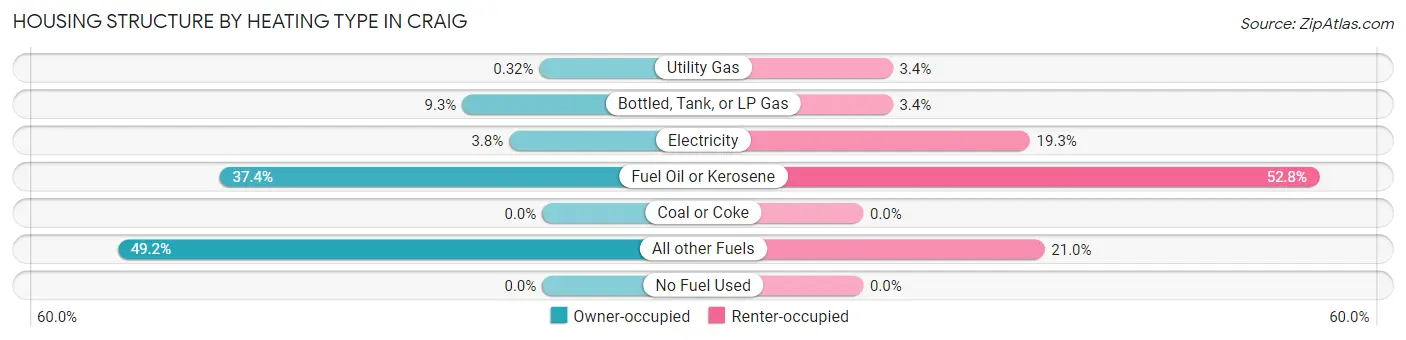
| Heating Type | Owner-occupied | Renter-occupied |
| Utility Gas | 1 (0.3%) | 6 (3.4%) |
| Bottled, Tank, or LP Gas | 29 (9.3%) | 6 (3.4%) |
| Electricity | 12 (3.8%) | 34 (19.3%) |
| Fuel Oil or Kerosene | 117 (37.4%) | 93 (52.8%) |
| Coal or Coke | 0 (0.0%) | 0 (0.0%) |
| All other Fuels | 154 (49.2%) | 37 (21.0%) |
| No Fuel Used | 0 (0.0%) | 0 (0.0%) |
| Total | 313 (100.0%) | 176 (100.0%) |
Household Vehicle Usage in Craig
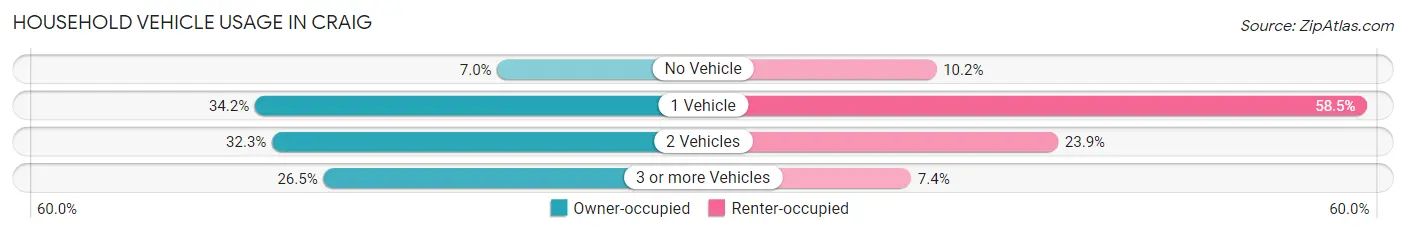
| Vehicles per Household | Owner-occupied | Renter-occupied |
| No Vehicle | 22 (7.0%) | 18 (10.2%) |
| 1 Vehicle | 107 (34.2%) | 103 (58.5%) |
| 2 Vehicles | 101 (32.3%) | 42 (23.9%) |
| 3 or more Vehicles | 83 (26.5%) | 13 (7.4%) |
| Total | 313 (100.0%) | 176 (100.0%) |
Real Estate & Mortgages in Craig
Real Estate and Mortgage Overview in Craig
| Characteristic | Without Mortgage | With Mortgage |
| Housing Units | 194 | 119 |
| Median Property Value | $139,300 | $321,400 |
| Median Household Income | $57,037 | $40 |
| Monthly Housing Costs | $533 | $13 |
| Real Estate Taxes | $900 | $21 |
Property Value by Mortgage Status in Craig
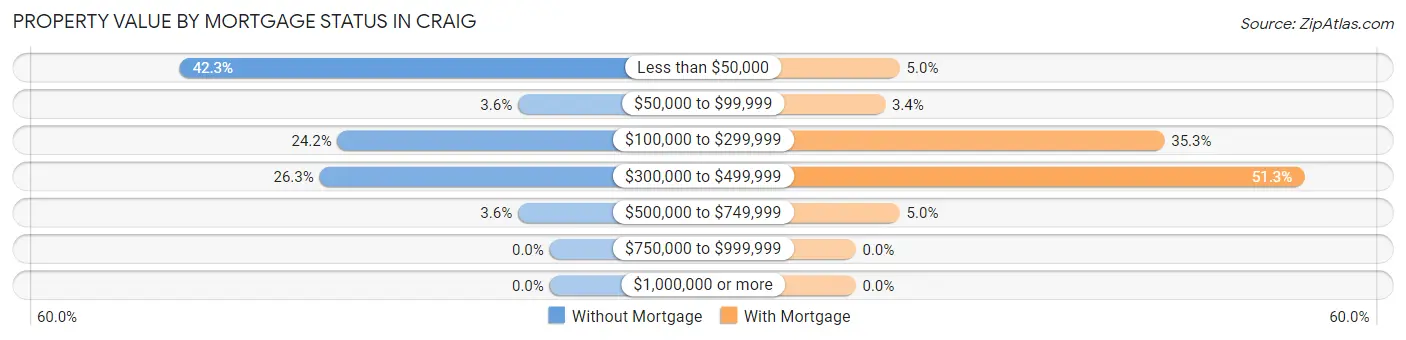
| Property Value | Without Mortgage | With Mortgage |
| Less than $50,000 | 82 (42.3%) | 6 (5.0%) |
| $50,000 to $99,999 | 7 (3.6%) | 4 (3.4%) |
| $100,000 to $299,999 | 47 (24.2%) | 42 (35.3%) |
| $300,000 to $499,999 | 51 (26.3%) | 61 (51.3%) |
| $500,000 to $749,999 | 7 (3.6%) | 6 (5.0%) |
| $750,000 to $999,999 | 0 (0.0%) | 0 (0.0%) |
| $1,000,000 or more | 0 (0.0%) | 0 (0.0%) |
| Total | 194 (100.0%) | 119 (100.0%) |
Household Income by Mortgage Status in Craig
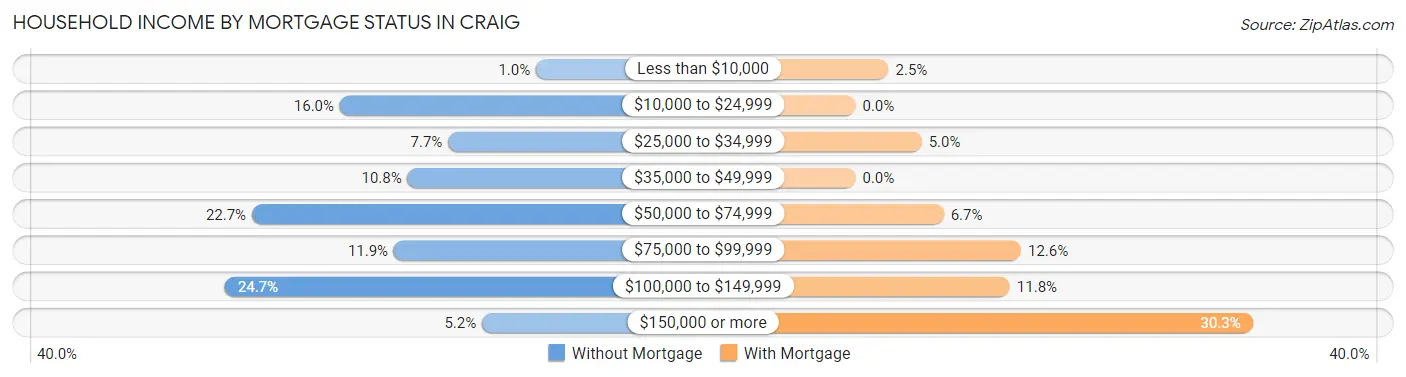
| Household Income | Without Mortgage | With Mortgage |
| Less than $10,000 | 2 (1.0%) | 3 (2.5%) |
| $10,000 to $24,999 | 31 (16.0%) | 0 (0.0%) |
| $25,000 to $34,999 | 15 (7.7%) | 6 (5.0%) |
| $35,000 to $49,999 | 21 (10.8%) | 0 (0.0%) |
| $50,000 to $74,999 | 44 (22.7%) | 8 (6.7%) |
| $75,000 to $99,999 | 23 (11.9%) | 15 (12.6%) |
| $100,000 to $149,999 | 48 (24.7%) | 14 (11.8%) |
| $150,000 or more | 10 (5.1%) | 36 (30.2%) |
| Total | 194 (100.0%) | 119 (100.0%) |
Property Value to Household Income Ratio in Craig
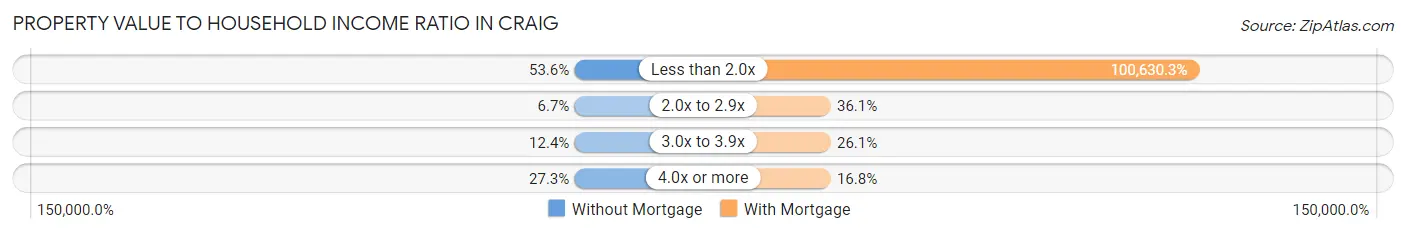
| Value-to-Income Ratio | Without Mortgage | With Mortgage |
| Less than 2.0x | 104 (53.6%) | 119,750 (100,630.3%) |
| 2.0x to 2.9x | 13 (6.7%) | 43 (36.1%) |
| 3.0x to 3.9x | 24 (12.4%) | 31 (26.1%) |
| 4.0x or more | 53 (27.3%) | 20 (16.8%) |
| Total | 194 (100.0%) | 119 (100.0%) |
Real Estate Taxes by Mortgage Status in Craig
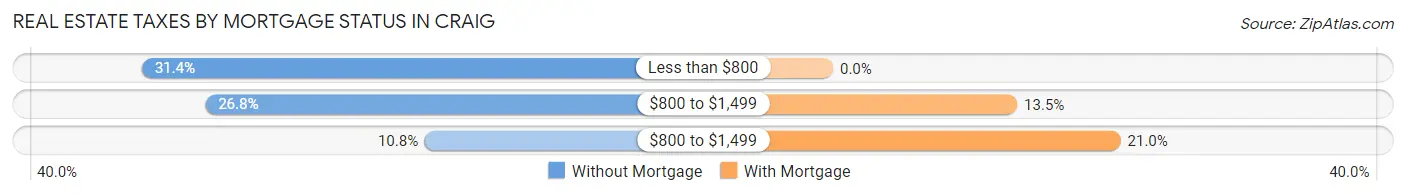
| Property Taxes | Without Mortgage | With Mortgage |
| Less than $800 | 61 (31.4%) | 0 (0.0%) |
| $800 to $1,499 | 52 (26.8%) | 16 (13.5%) |
| $800 to $1,499 | 21 (10.8%) | 25 (21.0%) |
| Total | 194 (100.0%) | 119 (100.0%) |
Health & Disability in Craig
Health Insurance Coverage by Age in Craig
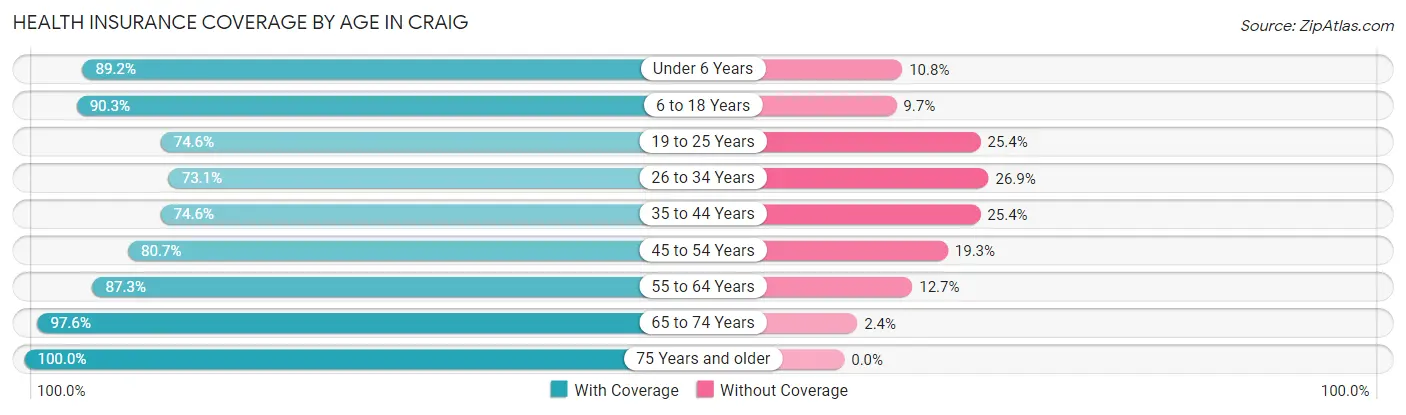
| Age Bracket | With Coverage | Without Coverage |
| Under 6 Years | 66 (89.2%) | 8 (10.8%) |
| 6 to 18 Years | 130 (90.3%) | 14 (9.7%) |
| 19 to 25 Years | 91 (74.6%) | 31 (25.4%) |
| 26 to 34 Years | 106 (73.1%) | 39 (26.9%) |
| 35 to 44 Years | 97 (74.6%) | 33 (25.4%) |
| 45 to 54 Years | 117 (80.7%) | 28 (19.3%) |
| 55 to 64 Years | 124 (87.3%) | 18 (12.7%) |
| 65 to 74 Years | 121 (97.6%) | 3 (2.4%) |
| 75 Years and older | 42 (100.0%) | 0 (0.0%) |
| Total | 894 (83.7%) | 174 (16.3%) |
Health Insurance Coverage by Citizenship Status in Craig
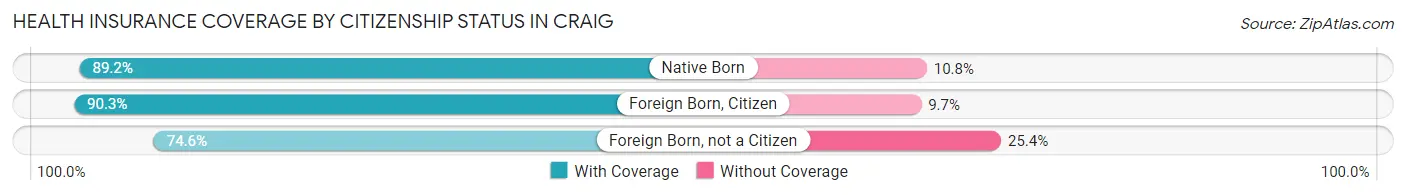
| Citizenship Status | With Coverage | Without Coverage |
| Native Born | 66 (89.2%) | 8 (10.8%) |
| Foreign Born, Citizen | 130 (90.3%) | 14 (9.7%) |
| Foreign Born, not a Citizen | 91 (74.6%) | 31 (25.4%) |
Health Insurance Coverage by Household Income in Craig
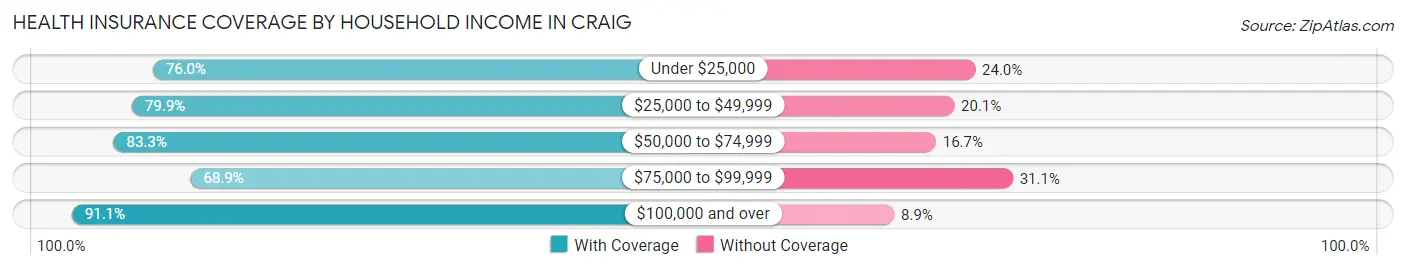
| Household Income | With Coverage | Without Coverage |
| Under $25,000 | 79 (76.0%) | 25 (24.0%) |
| $25,000 to $49,999 | 147 (79.9%) | 37 (20.1%) |
| $50,000 to $74,999 | 135 (83.3%) | 27 (16.7%) |
| $75,000 to $99,999 | 102 (68.9%) | 46 (31.1%) |
| $100,000 and over | 401 (91.1%) | 39 (8.9%) |
Public vs Private Health Insurance Coverage by Age in Craig
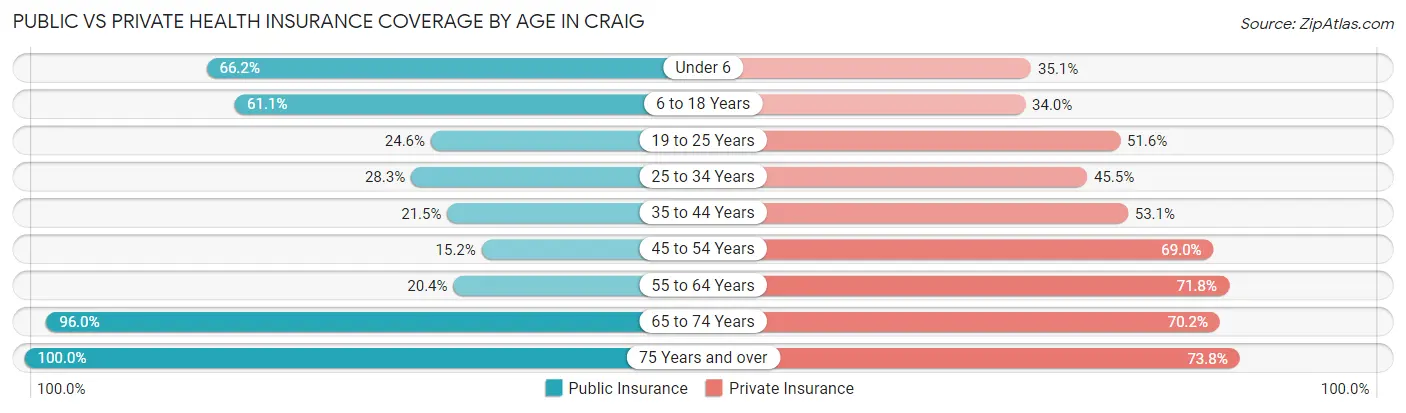
| Age Bracket | Public Insurance | Private Insurance |
| Under 6 | 49 (66.2%) | 26 (35.1%) |
| 6 to 18 Years | 88 (61.1%) | 49 (34.0%) |
| 19 to 25 Years | 30 (24.6%) | 63 (51.6%) |
| 25 to 34 Years | 41 (28.3%) | 66 (45.5%) |
| 35 to 44 Years | 28 (21.5%) | 69 (53.1%) |
| 45 to 54 Years | 22 (15.2%) | 100 (69.0%) |
| 55 to 64 Years | 29 (20.4%) | 102 (71.8%) |
| 65 to 74 Years | 119 (96.0%) | 87 (70.2%) |
| 75 Years and over | 42 (100.0%) | 31 (73.8%) |
| Total | 448 (41.9%) | 593 (55.5%) |
Disability Status by Sex by Age in Craig
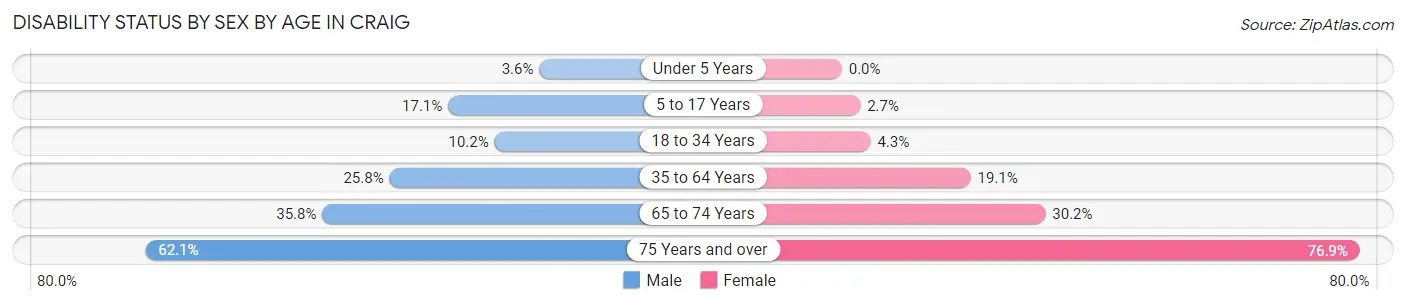
| Age Bracket | Male | Female |
| Under 5 Years | 1 (3.6%) | 0 (0.0%) |
| 5 to 17 Years | 13 (17.1%) | 2 (2.7%) |
| 18 to 34 Years | 14 (10.2%) | 6 (4.3%) |
| 35 to 64 Years | 55 (25.8%) | 39 (19.1%) |
| 65 to 74 Years | 29 (35.8%) | 13 (30.2%) |
| 75 Years and over | 18 (62.1%) | 10 (76.9%) |
Disability Class by Sex by Age in Craig
Disability Class: Hearing Difficulty
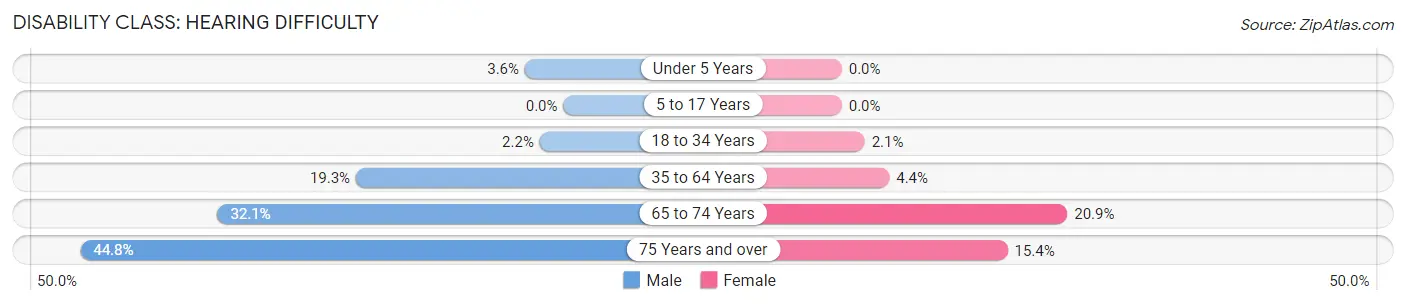
| Age Bracket | Male | Female |
| Under 5 Years | 1 (3.6%) | 0 (0.0%) |
| 5 to 17 Years | 0 (0.0%) | 0 (0.0%) |
| 18 to 34 Years | 3 (2.2%) | 3 (2.1%) |
| 35 to 64 Years | 41 (19.3%) | 9 (4.4%) |
| 65 to 74 Years | 26 (32.1%) | 9 (20.9%) |
| 75 Years and over | 13 (44.8%) | 2 (15.4%) |
Disability Class: Vision Difficulty
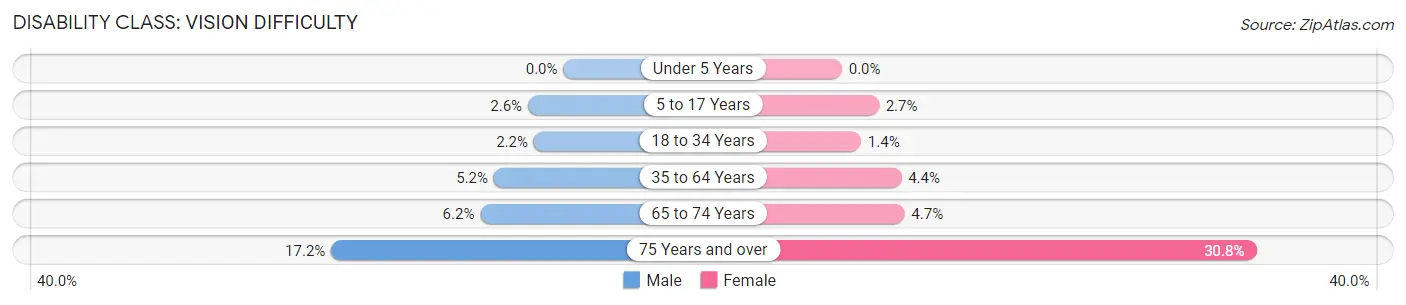
| Age Bracket | Male | Female |
| Under 5 Years | 0 (0.0%) | 0 (0.0%) |
| 5 to 17 Years | 2 (2.6%) | 2 (2.7%) |
| 18 to 34 Years | 3 (2.2%) | 2 (1.4%) |
| 35 to 64 Years | 11 (5.2%) | 9 (4.4%) |
| 65 to 74 Years | 5 (6.2%) | 2 (4.6%) |
| 75 Years and over | 5 (17.2%) | 4 (30.8%) |
Disability Class: Cognitive Difficulty
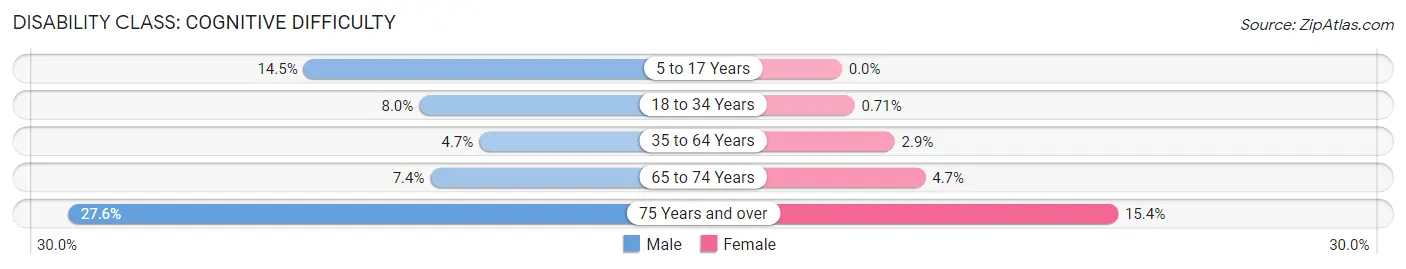
| Age Bracket | Male | Female |
| 5 to 17 Years | 11 (14.5%) | 0 (0.0%) |
| 18 to 34 Years | 11 (8.0%) | 1 (0.7%) |
| 35 to 64 Years | 10 (4.7%) | 6 (2.9%) |
| 65 to 74 Years | 6 (7.4%) | 2 (4.6%) |
| 75 Years and over | 8 (27.6%) | 2 (15.4%) |
Disability Class: Ambulatory Difficulty
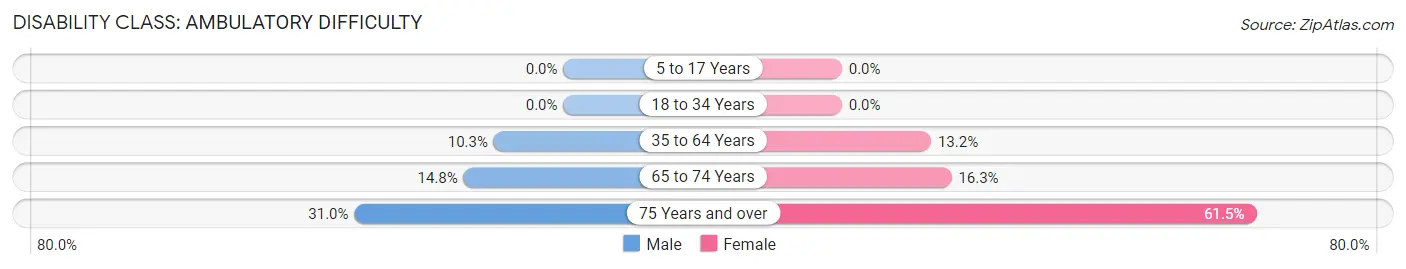
| Age Bracket | Male | Female |
| 5 to 17 Years | 0 (0.0%) | 0 (0.0%) |
| 18 to 34 Years | 0 (0.0%) | 0 (0.0%) |
| 35 to 64 Years | 22 (10.3%) | 27 (13.2%) |
| 65 to 74 Years | 12 (14.8%) | 7 (16.3%) |
| 75 Years and over | 9 (31.0%) | 8 (61.5%) |
Disability Class: Self-Care Difficulty
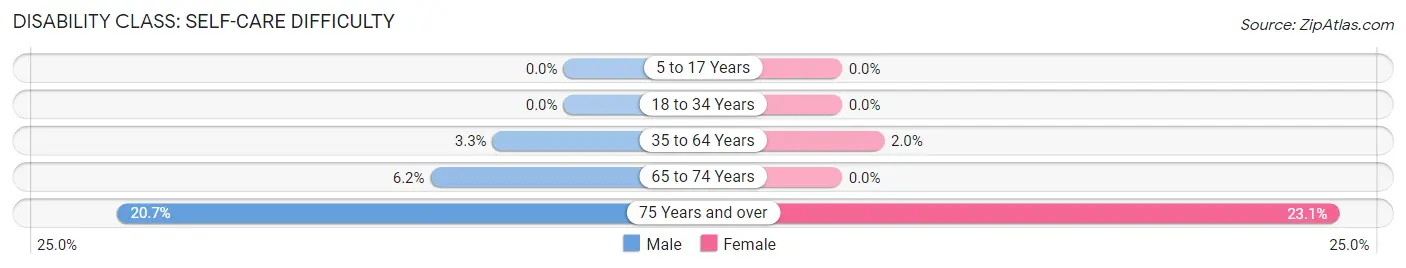
| Age Bracket | Male | Female |
| 5 to 17 Years | 0 (0.0%) | 0 (0.0%) |
| 18 to 34 Years | 0 (0.0%) | 0 (0.0%) |
| 35 to 64 Years | 7 (3.3%) | 4 (2.0%) |
| 65 to 74 Years | 5 (6.2%) | 0 (0.0%) |
| 75 Years and over | 6 (20.7%) | 3 (23.1%) |
Technology Access in Craig
Computing Device Access in Craig
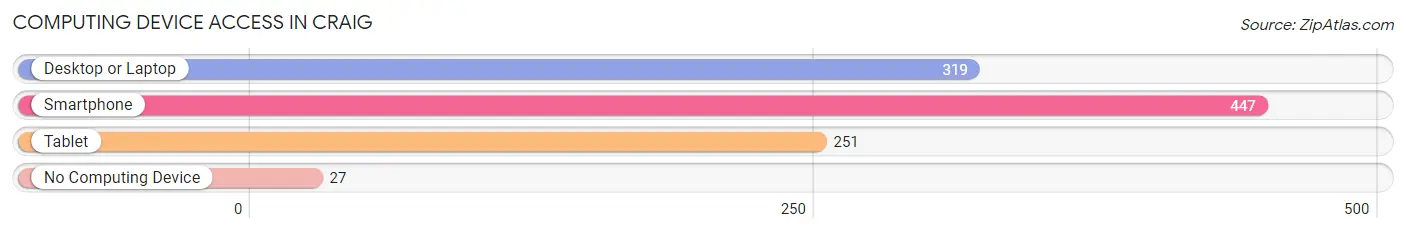
| Device Type | # Households | % Households |
| Desktop or Laptop | 319 | 65.2% |
| Smartphone | 447 | 91.4% |
| Tablet | 251 | 51.3% |
| No Computing Device | 27 | 5.5% |
| Total | 489 | 100.0% |
Internet Access in Craig
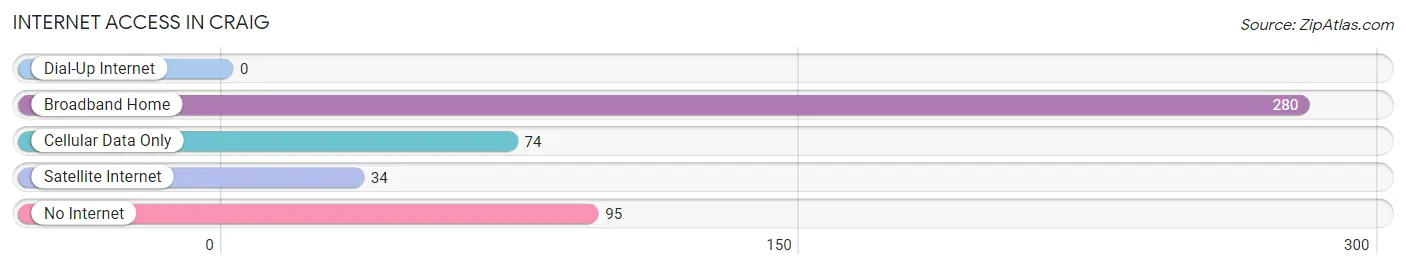
| Internet Type | # Households | % Households |
| Dial-Up Internet | 0 | 0.0% |
| Broadband Home | 280 | 57.3% |
| Cellular Data Only | 74 | 15.1% |
| Satellite Internet | 34 | 7.0% |
| No Internet | 95 | 19.4% |
| Total | 489 | 100.0% |
Craig Summary
History
The history of Alaska is a long and varied one, stretching back thousands of years. The first inhabitants of the region were the indigenous peoples of Alaska, who have lived in the area for thousands of years. The first Europeans to explore the region were Russian explorers, who arrived in the late 18th century. The Russians established trading posts and settlements in the region, and eventually claimed the entire area as part of the Russian Empire.
In 1867, the United States purchased Alaska from Russia in a deal known as the Alaska Purchase. The purchase was controversial at the time, but it was eventually ratified by the United States Senate. After the purchase, Alaska was organized as a territory of the United States, and was administered by the federal government.
In 1912, Alaska was granted statehood, becoming the 49th state in the Union. Since then, Alaska has grown and developed into a modern state, with a thriving economy and a diverse population.
Geography
Alaska is the largest state in the United States, covering an area of 663,268 square miles. It is bordered by Canada to the east, the Arctic Ocean to the north, the Pacific Ocean to the west, and the Bering Sea and Gulf of Alaska to the south.
Alaska is home to a wide variety of landscapes, from the rugged mountains of the Alaska Range to the vast tundra of the Arctic. The state is also home to numerous glaciers, rivers, and lakes, as well as the largest national park in the United States, Denali National Park.
Economy
The economy of Alaska is largely based on natural resources, such as oil, gas, timber, and fisheries. Oil and gas production account for the majority of the state’s economic activity, and Alaska is one of the top oil-producing states in the country.
The state also has a thriving tourism industry, with visitors coming to experience the state’s natural beauty and outdoor activities. Additionally, Alaska is home to a number of military bases, which provide jobs and economic activity to the state.
Demographics
As of the 2010 census, Alaska had a population of 710,231. The state is home to a diverse population, with the largest ethnic groups being White (66.7%), Native American (15.7%), and Asian (5.2%).
The state’s largest cities are Anchorage, Fairbanks, and Juneau. Anchorage is the largest city in the state, with a population of 291,826. Fairbanks is the second largest city, with a population of 31,535, and Juneau is the state capital, with a population of 31,275.
Alaska is also home to a number of Native American tribes, including the Tlingit, Haida, Tsimshian, and Inupiat. These tribes have a long history in the region, and continue to play an important role in the state’s culture and economy.
Common Questions
What is Per Capita Income in Craig?
Per Capita income in Craig is $41,566.
What is the Median Family Income in Craig?
Median Family Income in Craig is $84,000.
What is the Median Household income in Craig?
Median Household Income in Craig is $66,146.
What is Income or Wage Gap in Craig?
Income or Wage Gap in Craig is 14.7%.
Women in Craig earn 85.2 cents for every dollar earned by a man.
What is Inequality or Gini Index in Craig?
Inequality or Gini Index in Craig is 0.40.
What is the Total Population of Craig?
Total Population of Craig is 1,073.
What is the Total Male Population of Craig?
Total Male Population of Craig is 569.
What is the Total Female Population of Craig?
Total Female Population of Craig is 504.
What is the Ratio of Males per 100 Females in Craig?
There are 112.90 Males per 100 Females in Craig.
What is the Ratio of Females per 100 Males in Craig?
There are 88.58 Females per 100 Males in Craig.
What is the Median Population Age in Craig?
Median Population Age in Craig is 38.5 Years.
What is the Average Family Size in Craig
Average Family Size in Craig is 2.7 People.
What is the Average Household Size in Craig
Average Household Size in Craig is 2.1 People.
How Large is the Labor Force in Craig?
There are 663 People in the Labor Forcein in Craig.
What is the Percentage of People in the Labor Force in Craig?
74.2% of People are in the Labor Force in Craig.
What is the Unemployment Rate in Craig?
Unemployment Rate in Craig is 5.7%.