Butte, AK Map & Demographics
Butte Map
Butte Overview
$43,498
PER CAPITA INCOME
$110,227
AVG FAMILY INCOME
$102,171
AVG HOUSEHOLD INCOME
26.4%
WAGE / INCOME GAP [ % ]
73.6¢/ $1
WAGE / INCOME GAP [ $ ]
0.36
INEQUALITY / GINI INDEX
3,752
TOTAL POPULATION
1,954
MALE POPULATION
1,798
FEMALE POPULATION
108.68
MALES / 100 FEMALES
92.02
FEMALES / 100 MALES
42.3
MEDIAN AGE
3.1
AVG FAMILY SIZE
2.8
AVG HOUSEHOLD SIZE
1,929
LABOR FORCE [ PEOPLE ]
64.4%
PERCENT IN LABOR FORCE
4.4%
UNEMPLOYMENT RATE
Income in Butte
Income Overview in Butte
Per Capita Income in Butte is $43,498, while median incomes of families and households are $110,227 and $102,171 respectively.
| Characteristic | Number | Measure |
| Per Capita Income | 3,752 | $43,498 |
| Median Family Income | 1,056 | $110,227 |
| Mean Family Income | 1,056 | $126,331 |
| Median Household Income | 1,329 | $102,171 |
| Mean Household Income | 1,329 | $118,195 |
| Income Deficit | 1,056 | $0 |
| Wage / Income Gap (%) | 3,752 | 26.41% |
| Wage / Income Gap ($) | 3,752 | 73.59¢ per $1 |
| Gini / Inequality Index | 3,752 | 0.36 |
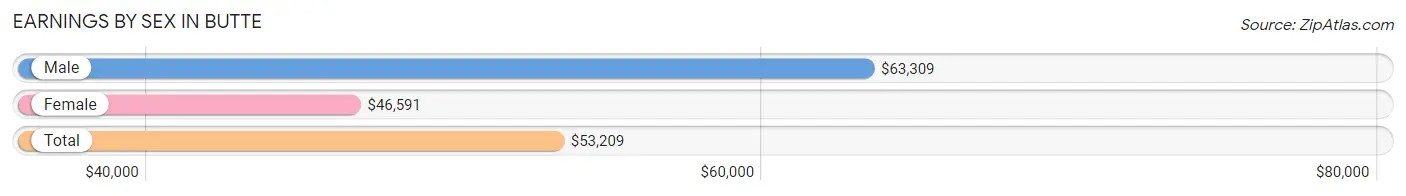
Earnings by Sex in Butte
Average Earnings in Butte are $53,209, $63,309 for men and $46,591 for women, a difference of 26.4%.
| Sex | Number | Average Earnings |
| Male | 1,199 (59.2%) | $63,309 |
| Female | 826 (40.8%) | $46,591 |
| Total | 2,025 (100.0%) | $53,209 |
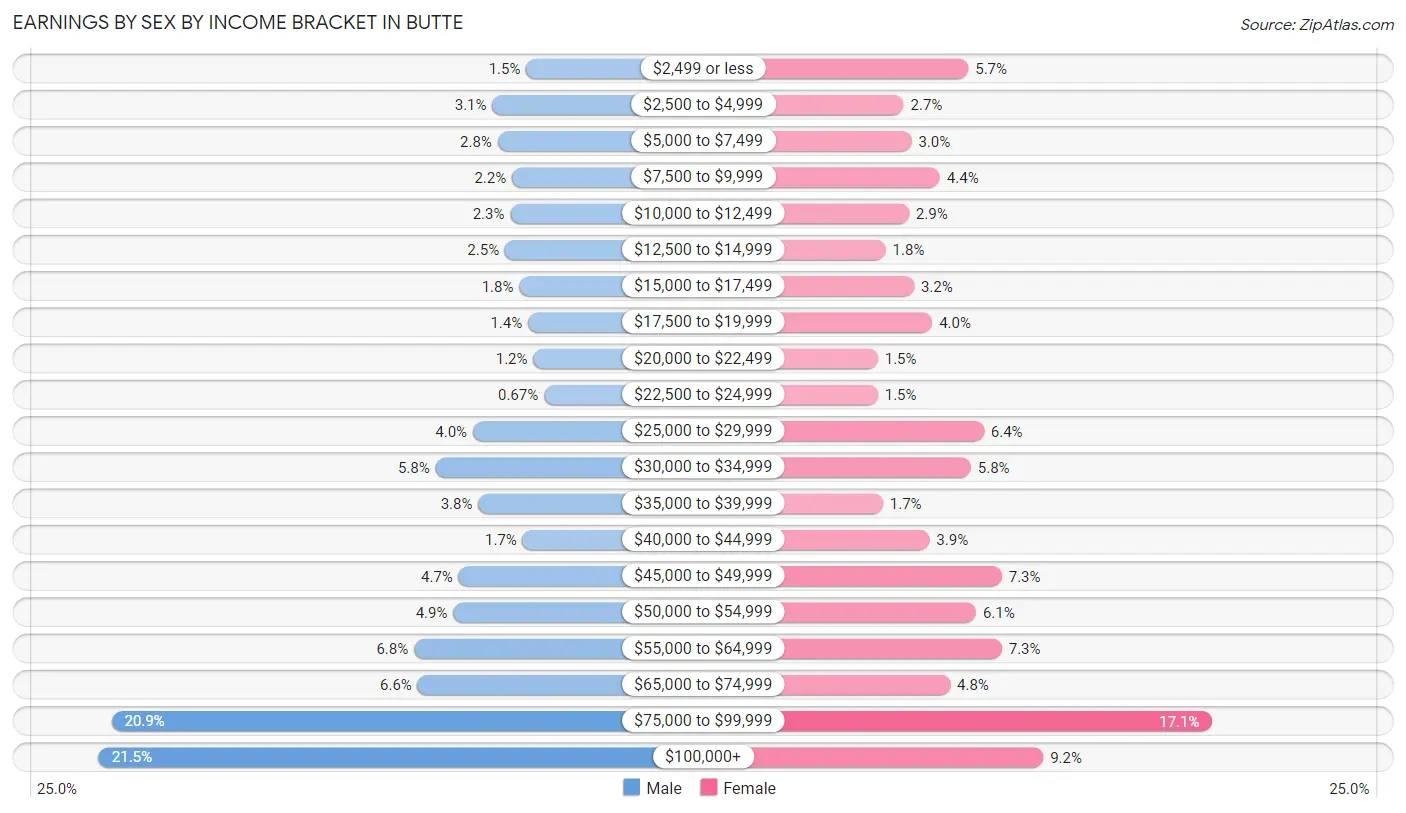
Earnings by Sex by Income Bracket in Butte
The most common earnings brackets in Butte are $100,000+ for men (258 | 21.5%) and $75,000 to $99,999 for women (141 | 17.1%).
| Income | Male | Female |
| $2,499 or less | 18 (1.5%) | 47 (5.7%) |
| $2,500 to $4,999 | 37 (3.1%) | 22 (2.7%) |
| $5,000 to $7,499 | 34 (2.8%) | 25 (3.0%) |
| $7,500 to $9,999 | 26 (2.2%) | 36 (4.4%) |
| $10,000 to $12,499 | 27 (2.2%) | 24 (2.9%) |
| $12,500 to $14,999 | 30 (2.5%) | 15 (1.8%) |
| $15,000 to $17,499 | 22 (1.8%) | 26 (3.2%) |
| $17,500 to $19,999 | 17 (1.4%) | 33 (4.0%) |
| $20,000 to $22,499 | 14 (1.2%) | 12 (1.5%) |
| $22,500 to $24,999 | 8 (0.7%) | 12 (1.5%) |
| $25,000 to $29,999 | 48 (4.0%) | 53 (6.4%) |
| $30,000 to $34,999 | 69 (5.8%) | 48 (5.8%) |
| $35,000 to $39,999 | 45 (3.7%) | 14 (1.7%) |
| $40,000 to $44,999 | 20 (1.7%) | 32 (3.9%) |
| $45,000 to $49,999 | 56 (4.7%) | 60 (7.3%) |
| $50,000 to $54,999 | 59 (4.9%) | 50 (6.0%) |
| $55,000 to $64,999 | 81 (6.8%) | 60 (7.3%) |
| $65,000 to $74,999 | 79 (6.6%) | 40 (4.8%) |
| $75,000 to $99,999 | 251 (20.9%) | 141 (17.1%) |
| $100,000+ | 258 (21.5%) | 76 (9.2%) |
| Total | 1,199 (100.0%) | 826 (100.0%) |
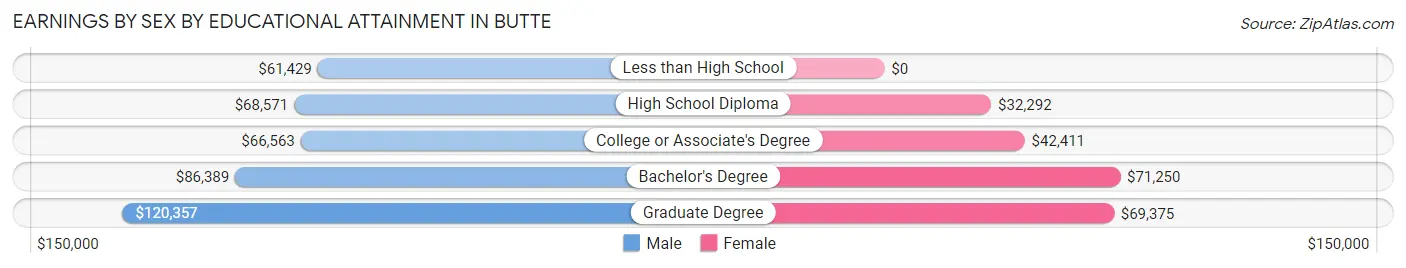
Earnings by Sex by Educational Attainment in Butte
Average earnings in Butte are $71,979 for men and $50,552 for women, a difference of 29.8%. Men with an educational attainment of graduate degree enjoy the highest average annual earnings of $120,357, while those with less than high school education earn the least with $61,429. Women with an educational attainment of bachelor's degree earn the most with the average annual earnings of $71,250, while those with high school diploma education have the smallest earnings of $32,292.
| Educational Attainment | Male Income | Female Income |
| Less than High School | $61,429 | $0 |
| High School Diploma | $68,571 | $32,292 |
| College or Associate's Degree | $66,563 | $42,411 |
| Bachelor's Degree | $86,389 | $71,250 |
| Graduate Degree | $120,357 | $69,375 |
| Total | $71,979 | $50,552 |
Family Income in Butte
Family Income Brackets in Butte
According to the Butte family income data, there are 249 families falling into the $100,000 to $149,999 income range, which is the most common income bracket and makes up 23.6% of all families. Conversely, the less than $10,000 income bracket is the least frequent group with only 11 families (1.0%) belonging to this category.
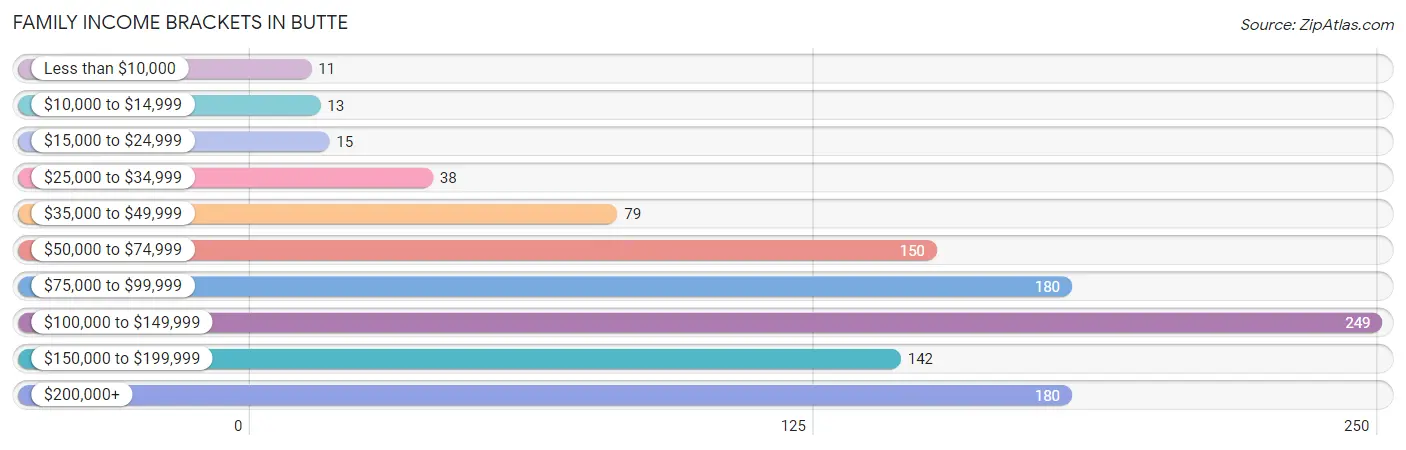
| Income Bracket | # Families | % Families |
| Less than $10,000 | 11 | 1.0% |
| $10,000 to $14,999 | 13 | 1.2% |
| $15,000 to $24,999 | 15 | 1.4% |
| $25,000 to $34,999 | 38 | 3.6% |
| $35,000 to $49,999 | 79 | 7.5% |
| $50,000 to $74,999 | 150 | 14.2% |
| $75,000 to $99,999 | 180 | 17.0% |
| $100,000 to $149,999 | 249 | 23.6% |
| $150,000 to $199,999 | 142 | 13.4% |
| $200,000+ | 180 | 17.0% |
Family Income by Famaliy Size in Butte
4-person families (147 | 13.9%) account for the highest median family income in Butte with $161,563 per family, while 3-person families (177 | 16.8%) have the highest median income of $44,345 per family member.
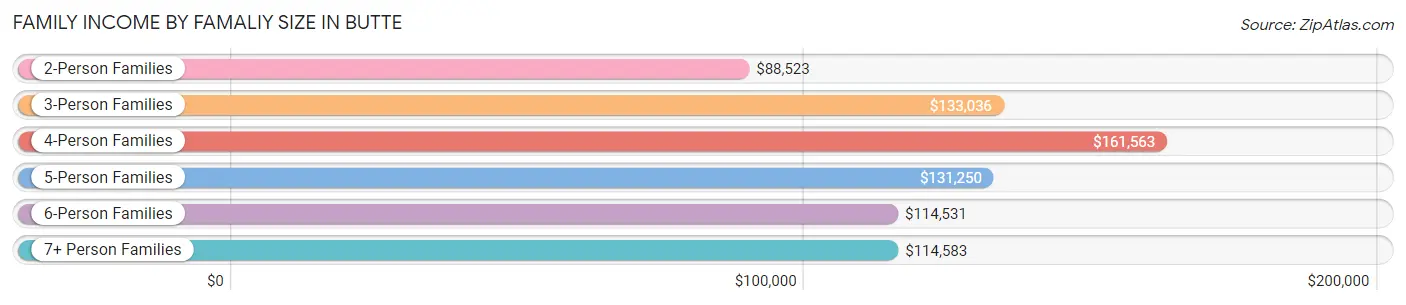
| Income Bracket | # Families | Median Income |
| 2-Person Families | 585 (55.4%) | $88,523 |
| 3-Person Families | 177 (16.8%) | $133,036 |
| 4-Person Families | 147 (13.9%) | $161,563 |
| 5-Person Families | 68 (6.4%) | $131,250 |
| 6-Person Families | 21 (2.0%) | $114,531 |
| 7+ Person Families | 58 (5.5%) | $114,583 |
| Total | 1,056 (100.0%) | $110,227 |
Family Income by Number of Earners in Butte
The median family income in Butte is $110,227, with families comprising 3+ earners (137) having the highest median family income of $218,438, while families with no earners (168) have the lowest median family income of $65,000, accounting for 13.0% and 15.9% of families, respectively.
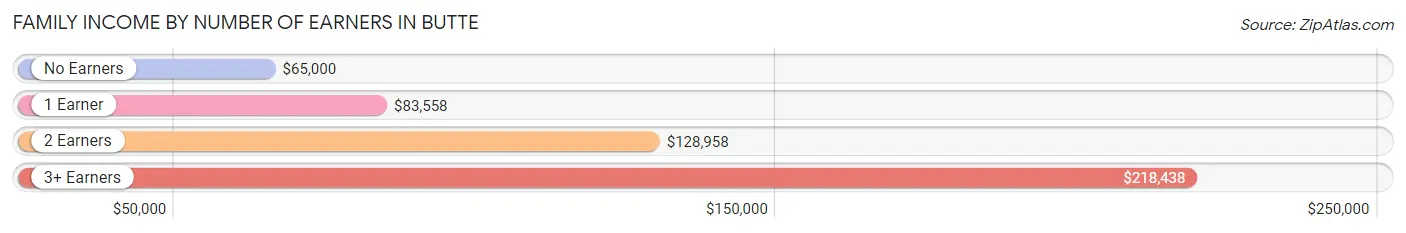
| Number of Earners | # Families | Median Income |
| No Earners | 168 (15.9%) | $65,000 |
| 1 Earner | 367 (34.7%) | $83,558 |
| 2 Earners | 384 (36.4%) | $128,958 |
| 3+ Earners | 137 (13.0%) | $218,438 |
| Total | 1,056 (100.0%) | $110,227 |
Household Income in Butte
Household Income Brackets in Butte
With 322 households falling in the category, the $100,000 to $149,999 income range is the most frequent in Butte, accounting for 24.2% of all households. In contrast, only 19 households (1.4%) fall into the less than $10,000 income bracket, making it the least populous group.
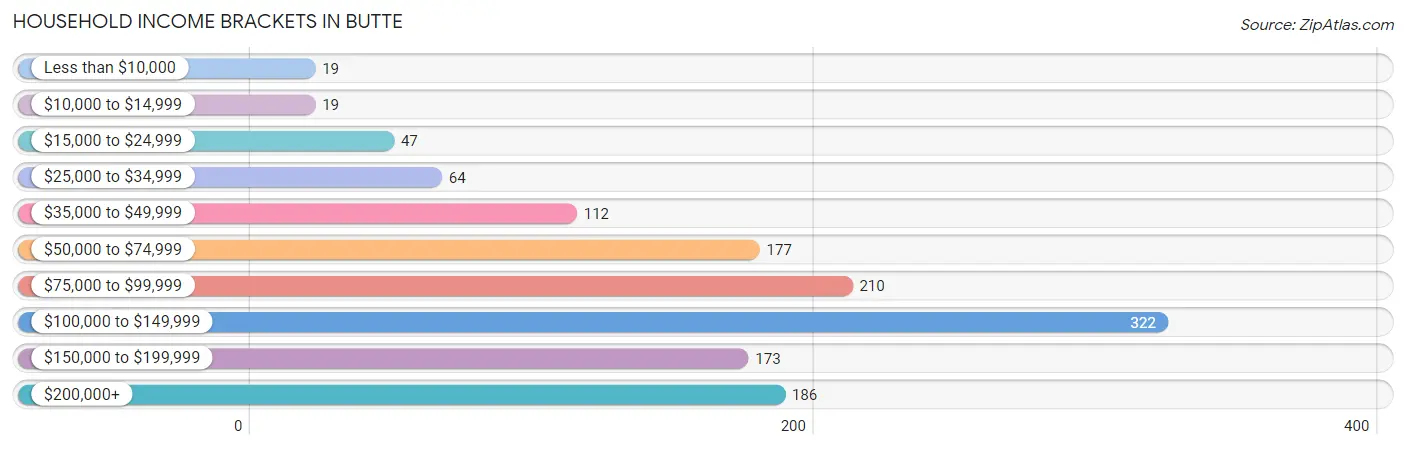
| Income Bracket | # Households | % Households |
| Less than $10,000 | 19 | 1.4% |
| $10,000 to $14,999 | 19 | 1.4% |
| $15,000 to $24,999 | 47 | 3.5% |
| $25,000 to $34,999 | 64 | 4.8% |
| $35,000 to $49,999 | 112 | 8.4% |
| $50,000 to $74,999 | 177 | 13.3% |
| $75,000 to $99,999 | 210 | 15.8% |
| $100,000 to $149,999 | 322 | 24.2% |
| $150,000 to $199,999 | 173 | 13.0% |
| $200,000+ | 186 | 14.0% |
Household Income by Householder Age in Butte
The median household income in Butte is $102,171, with the highest median household income of $120,000 found in the 45 to 64 years age bracket for the primary householder. A total of 596 households (44.9%) fall into this category. Meanwhile, the 15 to 24 years age bracket for the primary householder has the lowest median household income of $0, with 19 households (1.4%) in this group.
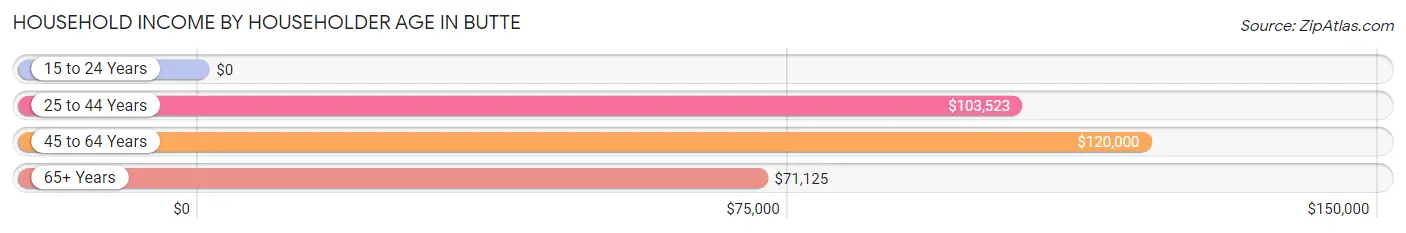
| Income Bracket | # Households | Median Income |
| 15 to 24 Years | 19 (1.4%) | $0 |
| 25 to 44 Years | 383 (28.8%) | $103,523 |
| 45 to 64 Years | 596 (44.9%) | $120,000 |
| 65+ Years | 331 (24.9%) | $71,125 |
| Total | 1,329 (100.0%) | $102,171 |
Poverty in Butte
Income Below Poverty by Sex and Age in Butte
With 4.3% poverty level for males and 7.2% for females among the residents of Butte, 16 and 17 year old males and 18 to 24 year old females are the most vulnerable to poverty, with 5 males (7.9%) and 53 females (37.3%) in their respective age groups living below the poverty level.
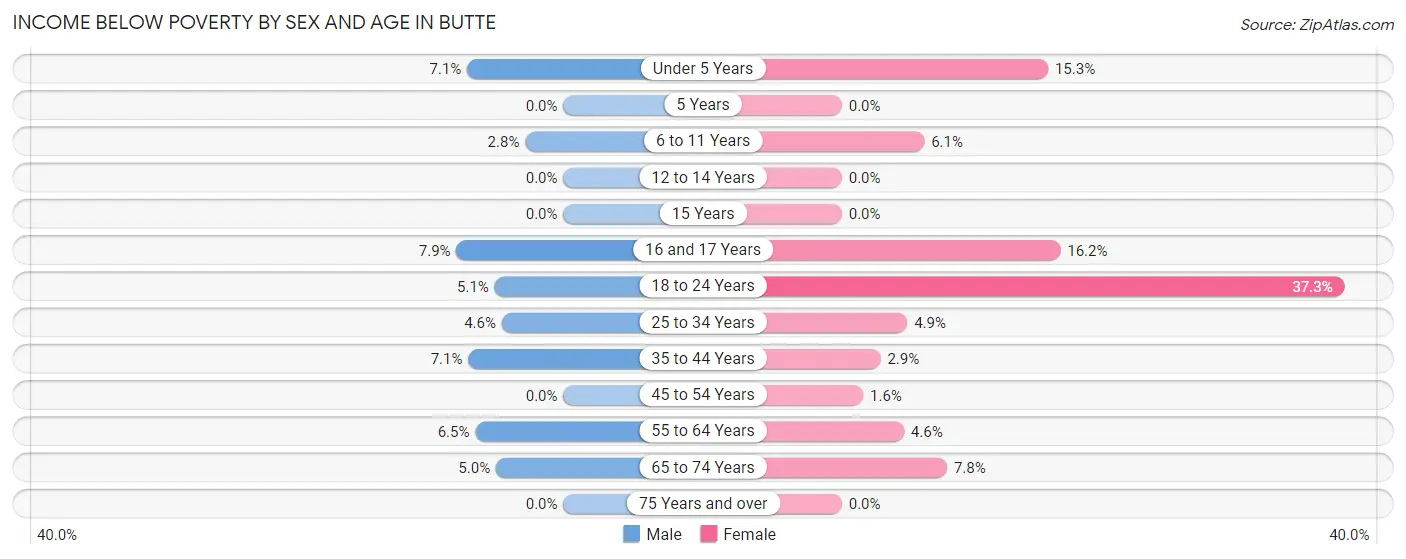
| Age Bracket | Male | Female |
| Under 5 Years | 6 (7.1%) | 15 (15.3%) |
| 5 Years | 0 (0.0%) | 0 (0.0%) |
| 6 to 11 Years | 3 (2.8%) | 9 (6.1%) |
| 12 to 14 Years | 0 (0.0%) | 0 (0.0%) |
| 15 Years | 0 (0.0%) | 0 (0.0%) |
| 16 and 17 Years | 5 (7.9%) | 6 (16.2%) |
| 18 to 24 Years | 8 (5.1%) | 53 (37.3%) |
| 25 to 34 Years | 10 (4.6%) | 7 (4.9%) |
| 35 to 44 Years | 19 (7.1%) | 7 (2.9%) |
| 45 to 54 Years | 0 (0.0%) | 4 (1.6%) |
| 55 to 64 Years | 24 (6.5%) | 13 (4.6%) |
| 65 to 74 Years | 8 (5.0%) | 15 (7.8%) |
| 75 Years and over | 0 (0.0%) | 0 (0.0%) |
| Total | 83 (4.3%) | 129 (7.2%) |
Income Above Poverty by Sex and Age in Butte
According to the poverty statistics in Butte, males aged 5 years and females aged 5 years are the age groups that are most secure financially, with 100.0% of males and 100.0% of females in these age groups living above the poverty line.
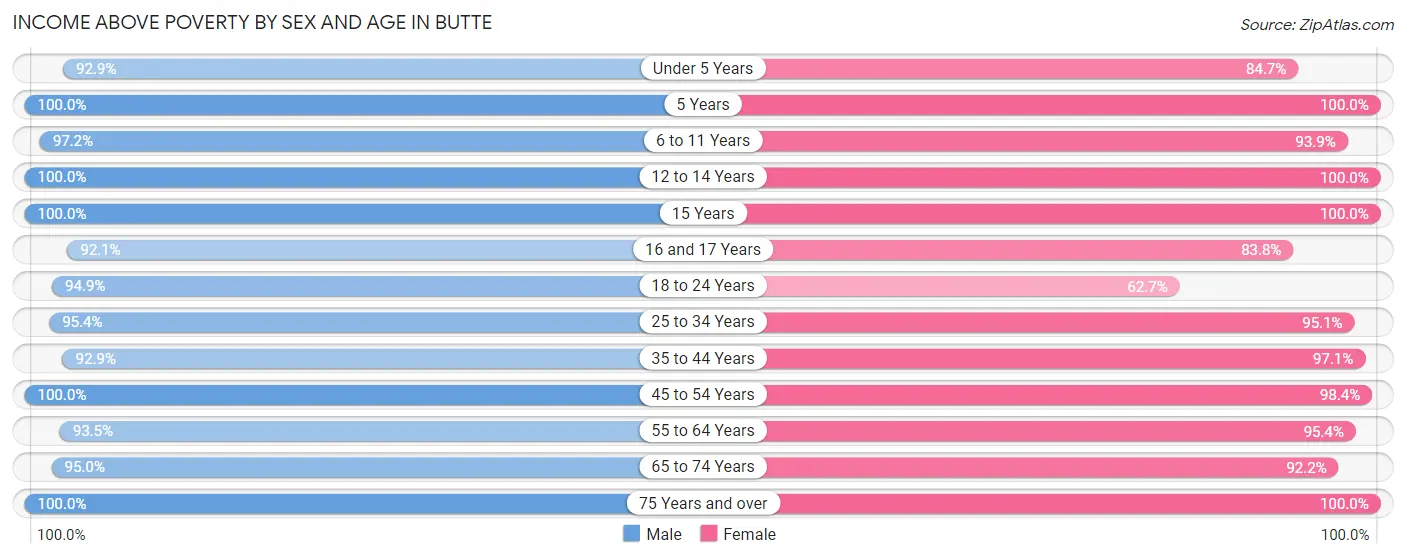
| Age Bracket | Male | Female |
| Under 5 Years | 78 (92.9%) | 83 (84.7%) |
| 5 Years | 28 (100.0%) | 7 (100.0%) |
| 6 to 11 Years | 103 (97.2%) | 138 (93.9%) |
| 12 to 14 Years | 100 (100.0%) | 101 (100.0%) |
| 15 Years | 40 (100.0%) | 33 (100.0%) |
| 16 and 17 Years | 58 (92.1%) | 31 (83.8%) |
| 18 to 24 Years | 149 (94.9%) | 89 (62.7%) |
| 25 to 34 Years | 209 (95.4%) | 137 (95.1%) |
| 35 to 44 Years | 250 (92.9%) | 237 (97.1%) |
| 45 to 54 Years | 238 (100.0%) | 249 (98.4%) |
| 55 to 64 Years | 343 (93.5%) | 269 (95.4%) |
| 65 to 74 Years | 152 (95.0%) | 177 (92.2%) |
| 75 Years and over | 111 (100.0%) | 118 (100.0%) |
| Total | 1,859 (95.7%) | 1,669 (92.8%) |
Income Below Poverty Among Married-Couple Families in Butte
The poverty statistics for married-couple families in Butte show that 2.6% or 23 of the total 887 families live below the poverty line. Families with no children have the highest poverty rate of 3.4%, comprising of 20 families. On the other hand, families with 3 or 4 children have the lowest poverty rate of 0.0%, which includes 0 families.
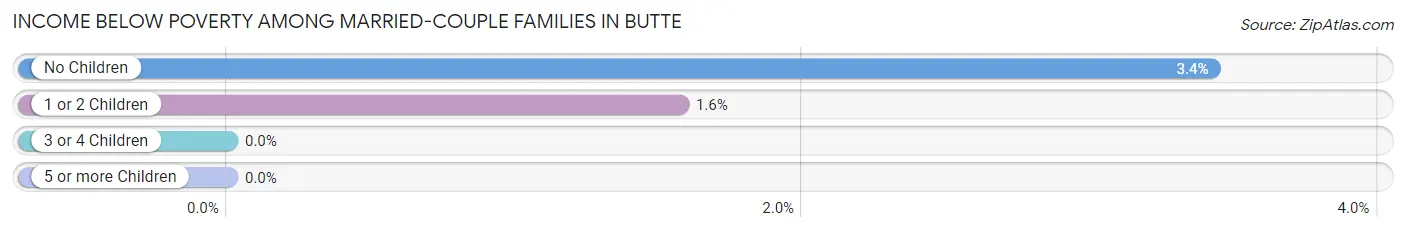
| Children | Above Poverty | Below Poverty |
| No Children | 565 (96.6%) | 20 (3.4%) |
| 1 or 2 Children | 188 (98.4%) | 3 (1.6%) |
| 3 or 4 Children | 77 (100.0%) | 0 (0.0%) |
| 5 or more Children | 34 (100.0%) | 0 (0.0%) |
| Total | 864 (97.4%) | 23 (2.6%) |
Income Below Poverty Among Single-Parent Households in Butte
According to the poverty data in Butte, 5.5% or 4 single-father households and 15.6% or 15 single-mother households are living below the poverty line. Among single-father households, those with 3 or 4 children have the highest poverty rate, with 4 households (22.2%) experiencing poverty. Likewise, among single-mother households, those with 1 or 2 children have the highest poverty rate, with 11 households (26.8%) falling below the poverty line.
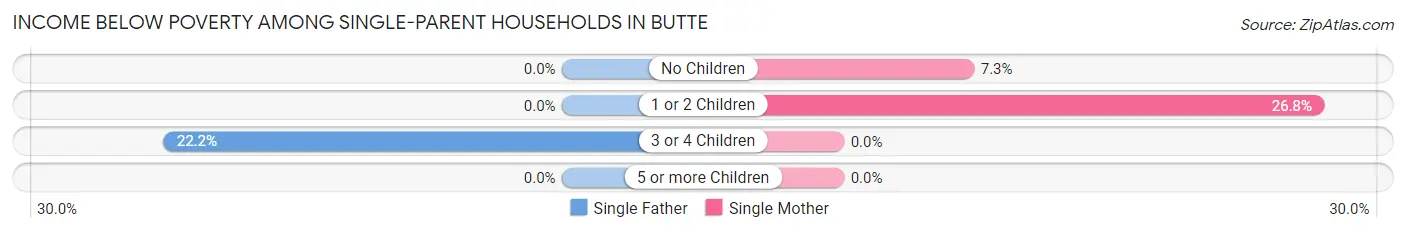
| Children | Single Father | Single Mother |
| No Children | 0 (0.0%) | 4 (7.3%) |
| 1 or 2 Children | 0 (0.0%) | 11 (26.8%) |
| 3 or 4 Children | 4 (22.2%) | 0 (0.0%) |
| 5 or more Children | 0 (0.0%) | 0 (0.0%) |
| Total | 4 (5.5%) | 15 (15.6%) |
Income Below Poverty Among Married-Couple vs Single-Parent Households in Butte
The poverty data for Butte shows that 23 of the married-couple family households (2.6%) and 19 of the single-parent households (11.2%) are living below the poverty level. Within the married-couple family households, those with no children have the highest poverty rate, with 20 households (3.4%) falling below the poverty line. Among the single-parent households, those with 3 or 4 children have the highest poverty rate, with 4 household (22.2%) living below poverty.
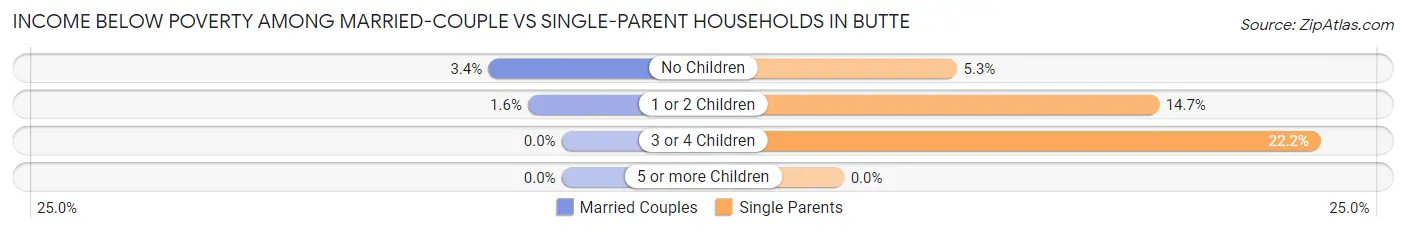
| Children | Married-Couple Families | Single-Parent Households |
| No Children | 20 (3.4%) | 4 (5.3%) |
| 1 or 2 Children | 3 (1.6%) | 11 (14.7%) |
| 3 or 4 Children | 0 (0.0%) | 4 (22.2%) |
| 5 or more Children | 0 (0.0%) | 0 (0.0%) |
| Total | 23 (2.6%) | 19 (11.2%) |
Race in Butte
The most populous races in Butte are White / Caucasian (3,123 | 83.2%), Two or more Races (345 | 9.2%), and Native / Alaskan (161 | 4.3%).
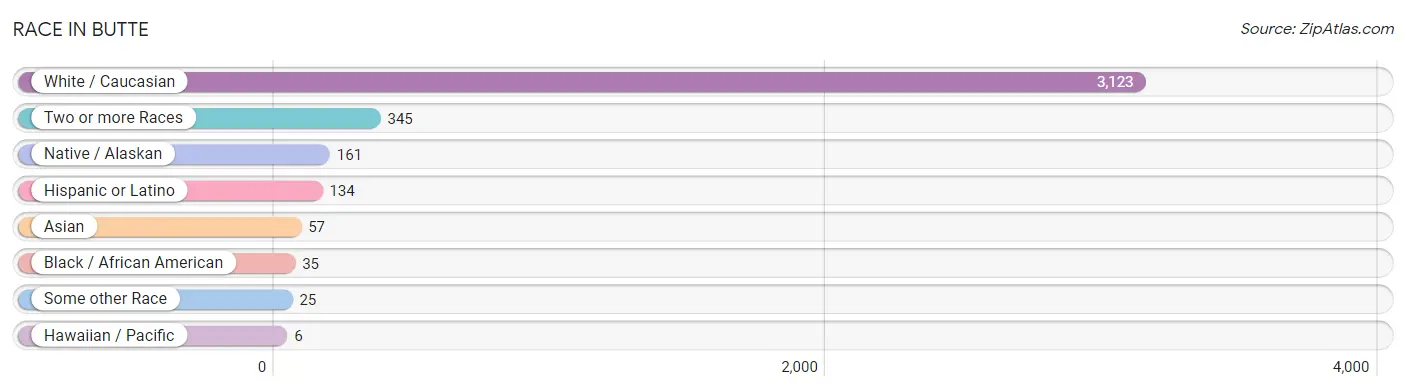
| Race | # Population | % Population |
| Asian | 57 | 1.5% |
| Black / African American | 35 | 0.9% |
| Hawaiian / Pacific | 6 | 0.2% |
| Hispanic or Latino | 134 | 3.6% |
| Native / Alaskan | 161 | 4.3% |
| White / Caucasian | 3,123 | 83.2% |
| Two or more Races | 345 | 9.2% |
| Some other Race | 25 | 0.7% |
| Total | 3,752 | 100.0% |
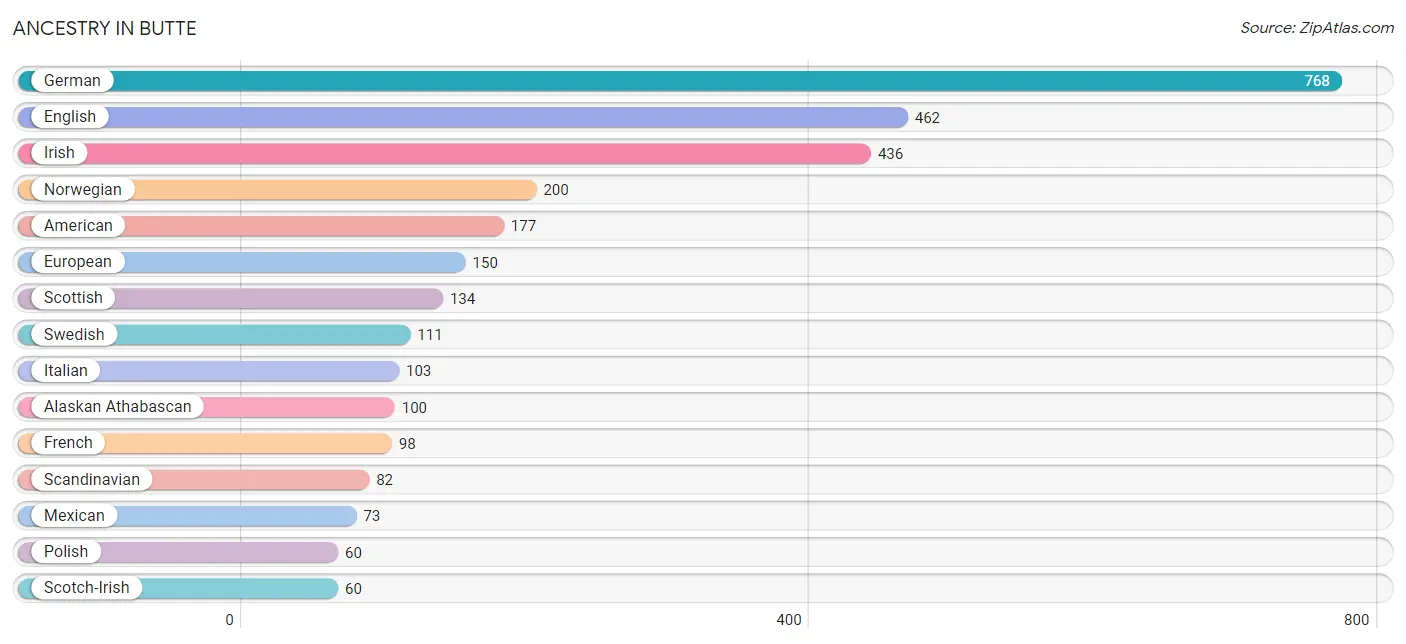
Ancestry in Butte
The most populous ancestries reported in Butte are German (768 | 20.5%), English (462 | 12.3%), Irish (436 | 11.6%), Norwegian (200 | 5.3%), and American (177 | 4.7%), together accounting for 54.4% of all Butte residents.
| Ancestry | # Population | % Population |
| African | 15 | 0.4% |
| Alaska Native | 56 | 1.5% |
| Alaskan Athabascan | 100 | 2.7% |
| Aleut | 7 | 0.2% |
| American | 177 | 4.7% |
| Apache | 16 | 0.4% |
| Arab | 6 | 0.2% |
| Bangladeshi | 12 | 0.3% |
| Bhutanese | 3 | 0.1% |
| Blackfeet | 3 | 0.1% |
| British | 11 | 0.3% |
| Burmese | 41 | 1.1% |
| Canadian | 20 | 0.5% |
| Central American | 4 | 0.1% |
| Central American Indian | 4 | 0.1% |
| Cherokee | 39 | 1.0% |
| Chippewa | 1 | 0.0% |
| Colombian | 7 | 0.2% |
| Croatian | 5 | 0.1% |
| Czech | 15 | 0.4% |
| Danish | 41 | 1.1% |
| Dutch | 51 | 1.4% |
| English | 462 | 12.3% |
| European | 150 | 4.0% |
| Finnish | 11 | 0.3% |
| French | 98 | 2.6% |
| French Canadian | 45 | 1.2% |
| German | 768 | 20.5% |
| Greek | 3 | 0.1% |
| Guatemalan | 4 | 0.1% |
| Hungarian | 4 | 0.1% |
| Indian (Asian) | 3 | 0.1% |
| Inupiat | 42 | 1.1% |
| Irish | 436 | 11.6% |
| Iroquois | 4 | 0.1% |
| Italian | 103 | 2.8% |
| Korean | 11 | 0.3% |
| Mexican | 73 | 1.9% |
| Native Hawaiian | 7 | 0.2% |
| Navajo | 2 | 0.1% |
| Northern European | 13 | 0.4% |
| Norwegian | 200 | 5.3% |
| Polish | 60 | 1.6% |
| Puerto Rican | 7 | 0.2% |
| Romanian | 8 | 0.2% |
| Russian | 22 | 0.6% |
| Scandinavian | 82 | 2.2% |
| Scotch-Irish | 60 | 1.6% |
| Scottish | 134 | 3.6% |
| Slovak | 26 | 0.7% |
| South American | 7 | 0.2% |
| Spaniard | 8 | 0.2% |
| Spanish | 24 | 0.6% |
| Sri Lankan | 20 | 0.5% |
| Subsaharan African | 15 | 0.4% |
| Swedish | 111 | 3.0% |
| Swiss | 19 | 0.5% |
| Syrian | 6 | 0.2% |
| Thai | 7 | 0.2% |
| Tlingit-Haida | 44 | 1.2% |
| Ukrainian | 6 | 0.2% |
| Welsh | 12 | 0.3% |
| Yup'ik | 59 | 1.6% | View All 63 Rows |
Immigrants in Butte
The most numerous immigrant groups reported in Butte came from Asia (41 | 1.1%), Eastern Asia (35 | 0.9%), Korea (32 | 0.9%), Central America (11 | 0.3%), and Latin America (11 | 0.3%), together accounting for 3.5% of all Butte residents.
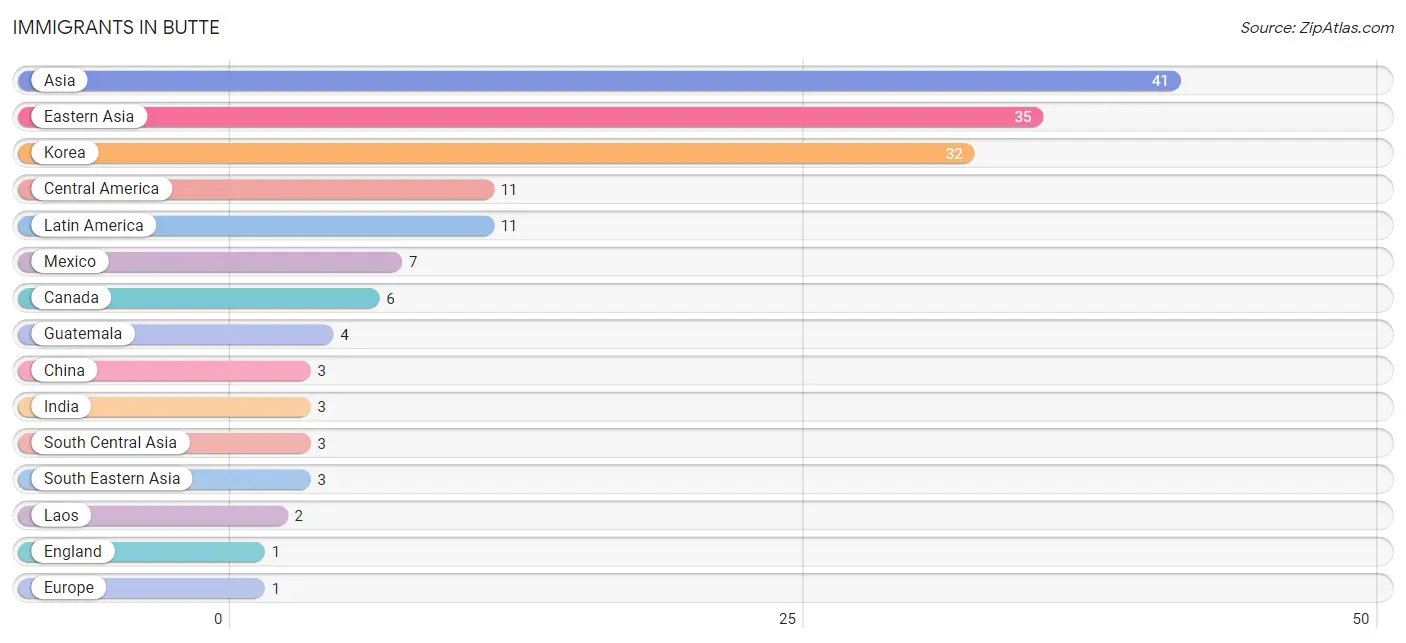
| Immigration Origin | # Population | % Population |
| Asia | 41 | 1.1% |
| Canada | 6 | 0.2% |
| Central America | 11 | 0.3% |
| China | 3 | 0.1% |
| Eastern Asia | 35 | 0.9% |
| England | 1 | 0.0% |
| Europe | 1 | 0.0% |
| Guatemala | 4 | 0.1% |
| India | 3 | 0.1% |
| Korea | 32 | 0.9% |
| Laos | 2 | 0.1% |
| Latin America | 11 | 0.3% |
| Mexico | 7 | 0.2% |
| Northern Europe | 1 | 0.0% |
| Philippines | 1 | 0.0% |
| South Central Asia | 3 | 0.1% |
| South Eastern Asia | 3 | 0.1% | View All 17 Rows |
Sex and Age in Butte
Sex and Age in Butte
The most populous age groups in Butte are 55 to 59 Years (206 | 10.5%) for men and 50 to 54 Years (162 | 9.0%) for women.
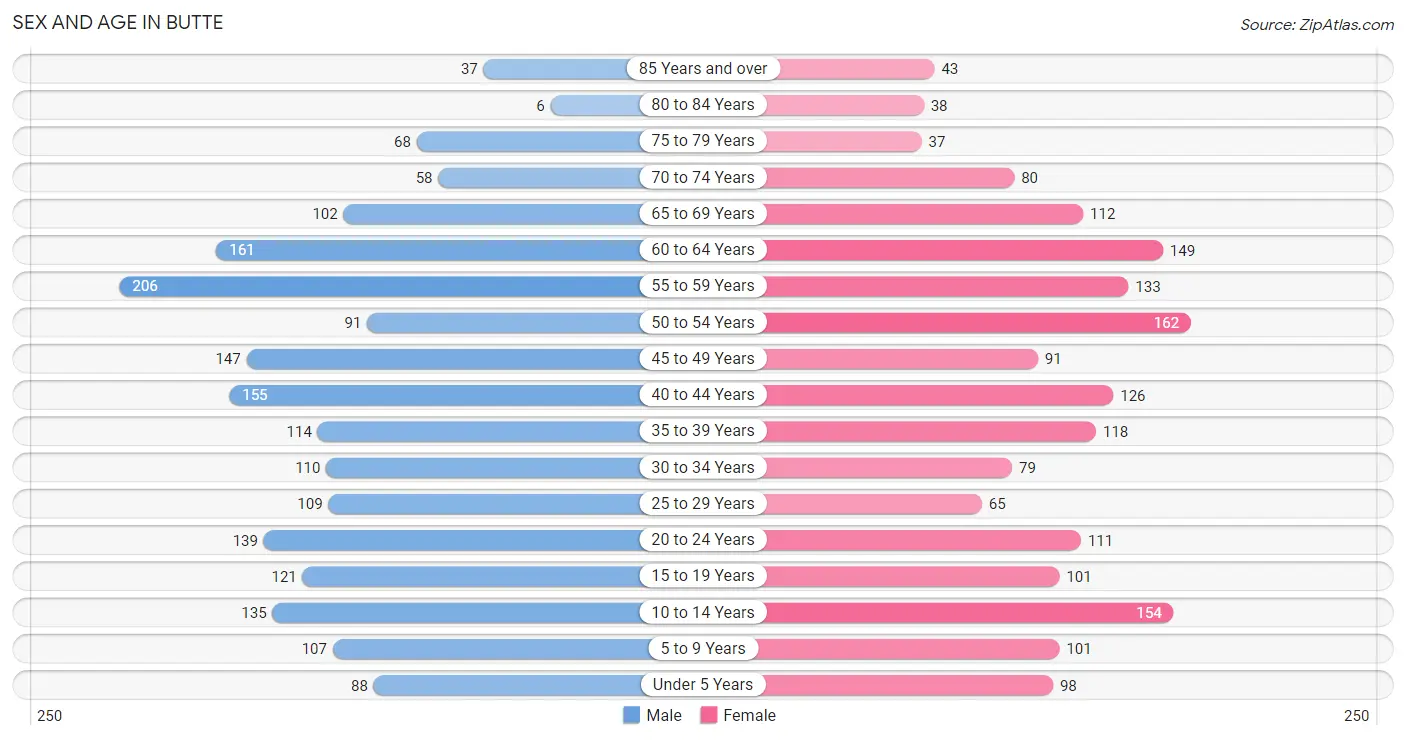
| Age Bracket | Male | Female |
| Under 5 Years | 88 (4.5%) | 98 (5.4%) |
| 5 to 9 Years | 107 (5.5%) | 101 (5.6%) |
| 10 to 14 Years | 135 (6.9%) | 154 (8.6%) |
| 15 to 19 Years | 121 (6.2%) | 101 (5.6%) |
| 20 to 24 Years | 139 (7.1%) | 111 (6.2%) |
| 25 to 29 Years | 109 (5.6%) | 65 (3.6%) |
| 30 to 34 Years | 110 (5.6%) | 79 (4.4%) |
| 35 to 39 Years | 114 (5.8%) | 118 (6.6%) |
| 40 to 44 Years | 155 (7.9%) | 126 (7.0%) |
| 45 to 49 Years | 147 (7.5%) | 91 (5.1%) |
| 50 to 54 Years | 91 (4.7%) | 162 (9.0%) |
| 55 to 59 Years | 206 (10.5%) | 133 (7.4%) |
| 60 to 64 Years | 161 (8.2%) | 149 (8.3%) |
| 65 to 69 Years | 102 (5.2%) | 112 (6.2%) |
| 70 to 74 Years | 58 (3.0%) | 80 (4.4%) |
| 75 to 79 Years | 68 (3.5%) | 37 (2.1%) |
| 80 to 84 Years | 6 (0.3%) | 38 (2.1%) |
| 85 Years and over | 37 (1.9%) | 43 (2.4%) |
| Total | 1,954 (100.0%) | 1,798 (100.0%) |
Families and Households in Butte
Median Family Size in Butte
The median family size in Butte is 3.09 persons per family, with married-couple families (887 | 84.0%) accounting for the largest median family size of 3.17 persons per family. On the other hand, single female/mother families (96 | 9.1%) represent the smallest median family size with 2.55 persons per family.
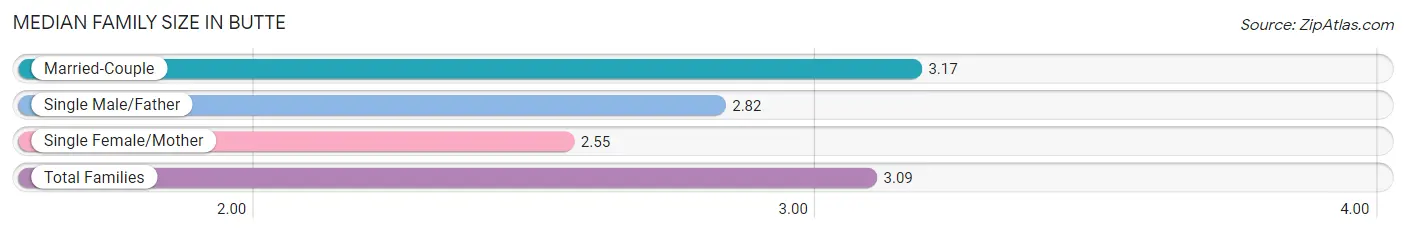
| Family Type | # Families | Family Size |
| Married-Couple | 887 (84.0%) | 3.17 |
| Single Male/Father | 73 (6.9%) | 2.82 |
| Single Female/Mother | 96 (9.1%) | 2.55 |
| Total Families | 1,056 (100.0%) | 3.09 |
Median Household Size in Butte
The median household size in Butte is 2.82 persons per household, with single male/father households (73 | 5.5%) accounting for the largest median household size of 3.68 persons per household. non-family households (273 | 20.5%) represent the smallest median household size with 1.26 persons per household.
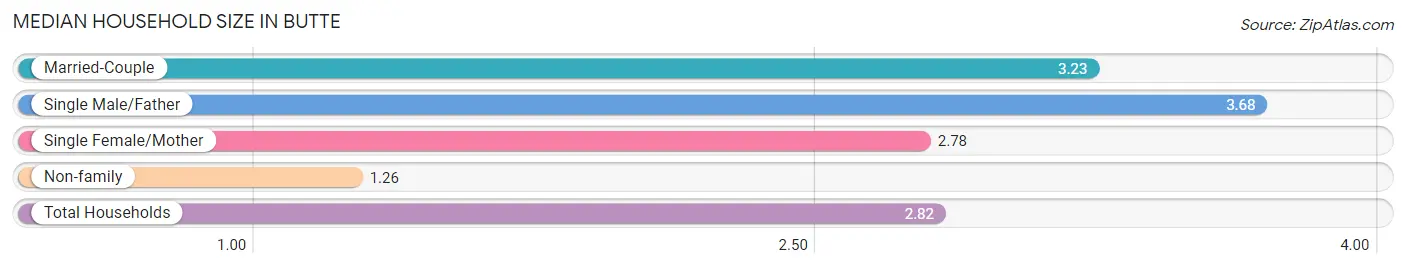
| Household Type | # Households | Household Size |
| Married-Couple | 887 (66.7%) | 3.23 |
| Single Male/Father | 73 (5.5%) | 3.68 |
| Single Female/Mother | 96 (7.2%) | 2.78 |
| Non-family | 273 (20.5%) | 1.26 |
| Total Households | 1,329 (100.0%) | 2.82 |
Household Size by Marriage Status in Butte
Out of a total of 1,329 households in Butte, 1,056 (79.5%) are family households, while 273 (20.5%) are nonfamily households. The most numerous type of family households are 2-person households, comprising 549, and the most common type of nonfamily households are 1-person households, comprising 225.
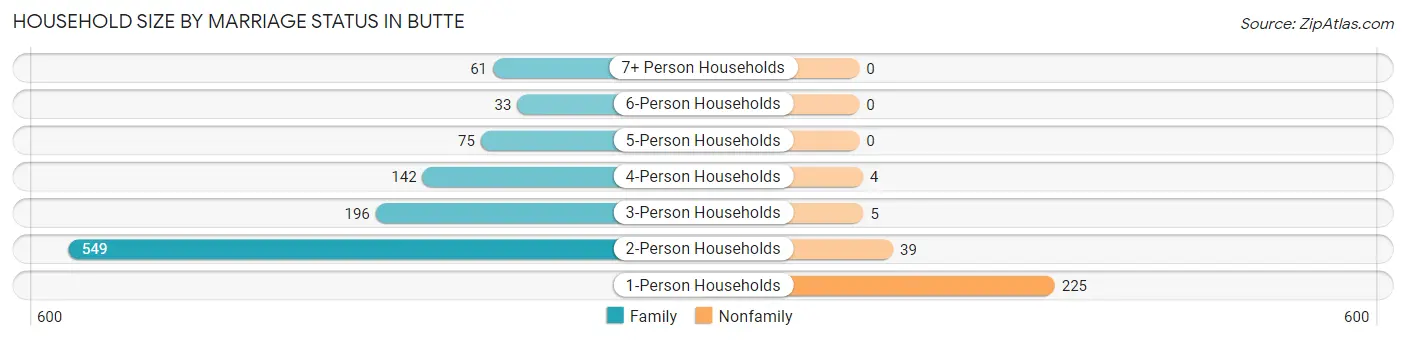
| Household Size | Family Households | Nonfamily Households |
| 1-Person Households | - | 225 (16.9%) |
| 2-Person Households | 549 (41.3%) | 39 (2.9%) |
| 3-Person Households | 196 (14.7%) | 5 (0.4%) |
| 4-Person Households | 142 (10.7%) | 4 (0.3%) |
| 5-Person Households | 75 (5.6%) | 0 (0.0%) |
| 6-Person Households | 33 (2.5%) | 0 (0.0%) |
| 7+ Person Households | 61 (4.6%) | 0 (0.0%) |
| Total | 1,056 (79.5%) | 273 (20.5%) |
Female Fertility in Butte
Fertility by Age in Butte
Average fertility rate in Butte is 50.0 births per 1,000 women. Women in the age bracket of 20 to 34 years have the highest fertility rate with 71.0 births per 1,000 women. Women in the age bracket of 20 to 34 years acount for 50.0% of all women with births.
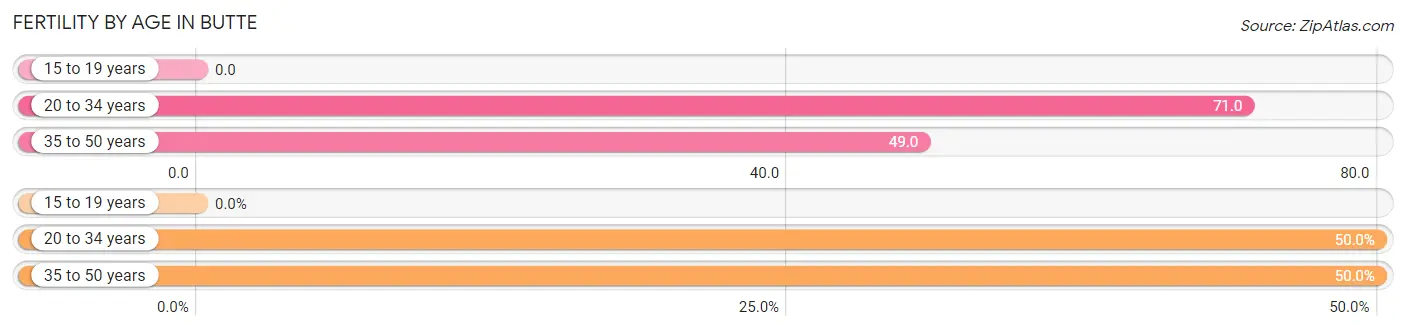
| Age Bracket | Women with Births | Births / 1,000 Women |
| 15 to 19 years | 0 (0.0%) | 0.0 |
| 20 to 34 years | 18 (50.0%) | 71.0 |
| 35 to 50 years | 18 (50.0%) | 49.0 |
| Total | 36 (100.0%) | 50.0 |
Fertility by Age by Marriage Status in Butte
86.1% of women with births (36) in Butte are married. The highest percentage of unmarried women with births falls into 20 to 34 years age bracket with 27.8% of them unmarried at the time of birth, while the lowest percentage of unmarried women with births belong to 35 to 50 years age bracket with 0.0% of them unmarried.
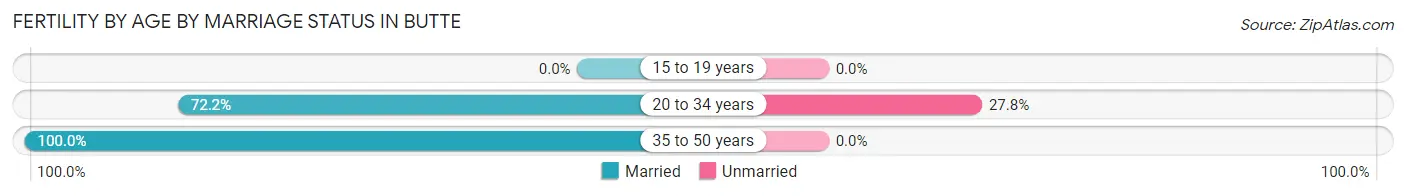
| Age Bracket | Married | Unmarried |
| 15 to 19 years | 0 (0.0%) | 0 (0.0%) |
| 20 to 34 years | 13 (72.2%) | 5 (27.8%) |
| 35 to 50 years | 18 (100.0%) | 0 (0.0%) |
| Total | 31 (86.1%) | 5 (13.9%) |
Fertility by Education in Butte
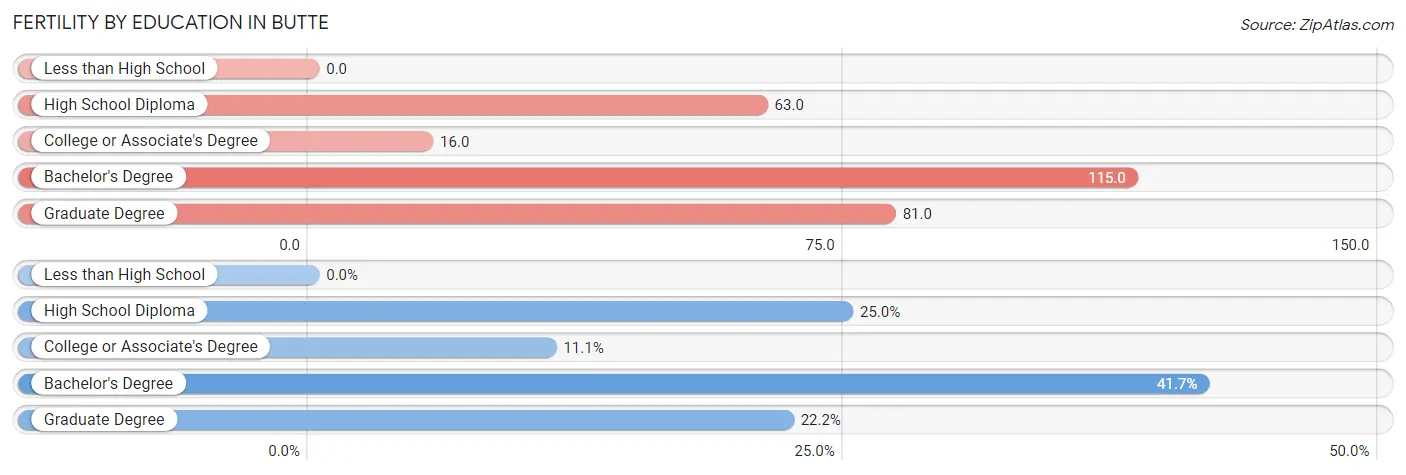
| Educational Attainment | Women with Births | Births / 1,000 Women |
| Less than High School | 0 (0.0%) | 0.0 |
| High School Diploma | 9 (25.0%) | 63.0 |
| College or Associate's Degree | 4 (11.1%) | 16.0 |
| Bachelor's Degree | 15 (41.7%) | 115.0 |
| Graduate Degree | 8 (22.2%) | 81.0 |
| Total | 36 (100.0%) | 50.0 |
Fertility by Education by Marriage Status in Butte
13.9% of women with births in Butte are unmarried. Women with the educational attainment of high school diploma are most likely to be married with 100.0% of them married at childbirth, while women with the educational attainment of graduate degree are least likely to be married with 62.5% of them unmarried at childbirth.
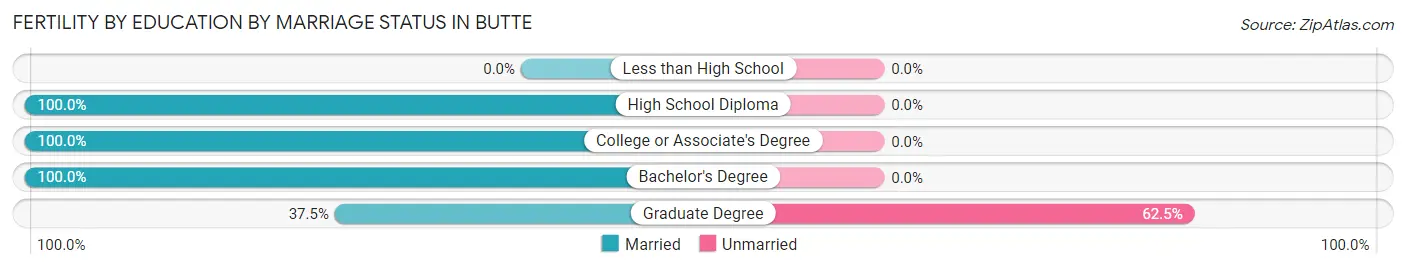
| Educational Attainment | Married | Unmarried |
| Less than High School | 0 (0.0%) | 0 (0.0%) |
| High School Diploma | 9 (100.0%) | 0 (0.0%) |
| College or Associate's Degree | 4 (100.0%) | 0 (0.0%) |
| Bachelor's Degree | 15 (100.0%) | 0 (0.0%) |
| Graduate Degree | 3 (37.5%) | 5 (62.5%) |
| Total | 31 (86.1%) | 5 (13.9%) |
Employment Characteristics in Butte
Employment by Class of Employer in Butte
Among the 1,827 employed individuals in Butte, private company employees (987 | 54.0%), local government employees (200 | 11.0%), and self-employed (not incorporated) (171 | 9.4%) make up the most common classes of employment.
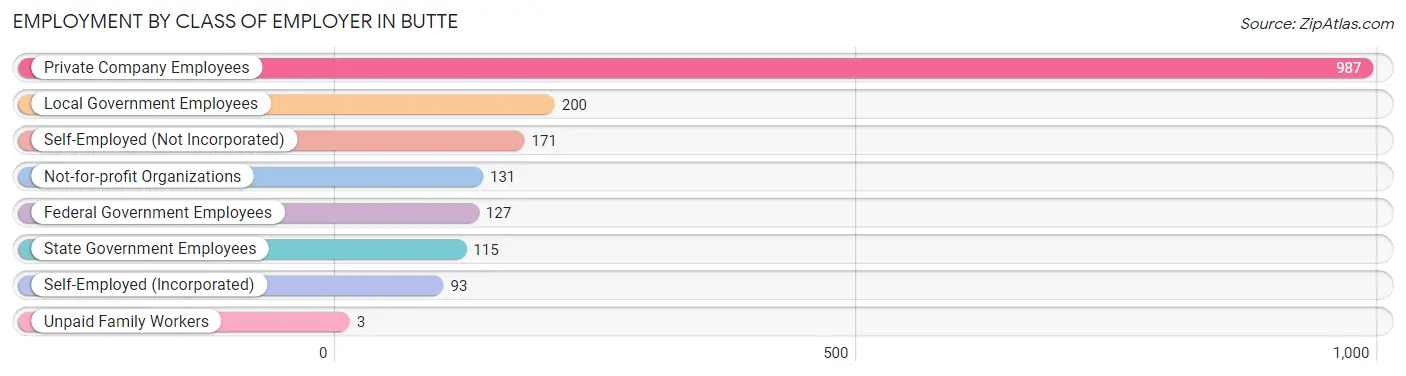
| Employer Class | # Employees | % Employees |
| Private Company Employees | 987 | 54.0% |
| Self-Employed (Incorporated) | 93 | 5.1% |
| Self-Employed (Not Incorporated) | 171 | 9.4% |
| Not-for-profit Organizations | 131 | 7.2% |
| Local Government Employees | 200 | 11.0% |
| State Government Employees | 115 | 6.3% |
| Federal Government Employees | 127 | 7.0% |
| Unpaid Family Workers | 3 | 0.2% |
| Total | 1,827 | 100.0% |
Employment Status by Age in Butte
According to the labor force statistics for Butte, out of the total population over 16 years of age (2,996), 64.4% or 1,929 individuals are in the labor force, with 4.4% or 85 of them unemployed. The age group with the highest labor force participation rate is 45 to 54 years, with 87.2% or 428 individuals in the labor force. Within the labor force, the 16 to 19 years age range has the highest percentage of unemployed individuals, with 16.2% or 11 of them being unemployed.
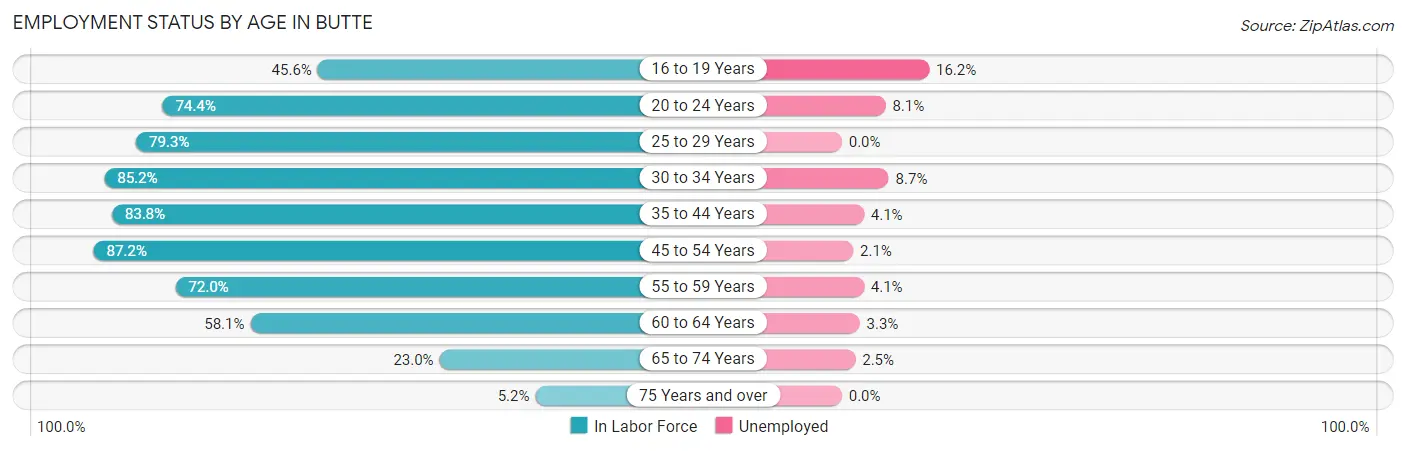
| Age Bracket | In Labor Force | Unemployed |
| 16 to 19 Years | 68 (45.6%) | 11 (16.2%) |
| 20 to 24 Years | 186 (74.4%) | 15 (8.1%) |
| 25 to 29 Years | 138 (79.3%) | 0 (0.0%) |
| 30 to 34 Years | 161 (85.2%) | 14 (8.7%) |
| 35 to 44 Years | 430 (83.8%) | 18 (4.1%) |
| 45 to 54 Years | 428 (87.2%) | 9 (2.1%) |
| 55 to 59 Years | 244 (72.0%) | 10 (4.1%) |
| 60 to 64 Years | 180 (58.1%) | 6 (3.3%) |
| 65 to 74 Years | 81 (23.0%) | 2 (2.5%) |
| 75 Years and over | 12 (5.2%) | 0 (0.0%) |
| Total | 1,929 (64.4%) | 85 (4.4%) |
Employment Status by Educational Attainment in Butte
According to labor force statistics for Butte, 78.4% of individuals (1,581) out of the total population between 25 and 64 years of age (2,016) are in the labor force, with 3.6% or 57 of them being unemployed. The group with the highest labor force participation rate are those with the educational attainment of bachelor's degree or higher, with 91.0% or 539 individuals in the labor force. Within the labor force, individuals with less than high school education have the highest percentage of unemployment, with 7.4% or 4 of them being unemployed.
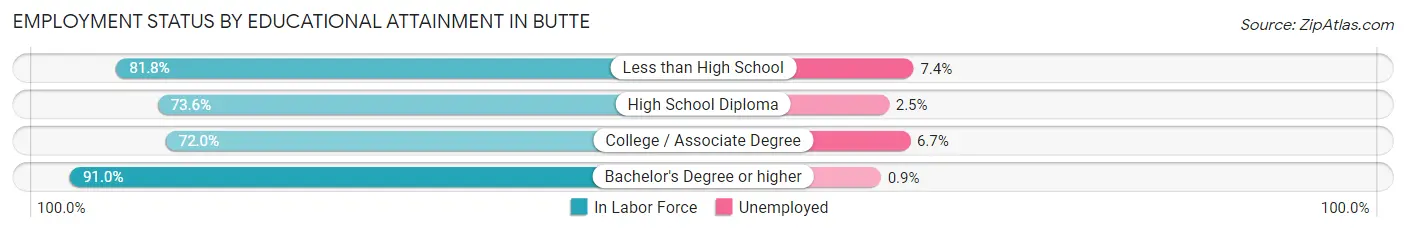
| Educational Attainment | In Labor Force | Unemployed |
| Less than High School | 54 (81.8%) | 5 (7.4%) |
| High School Diploma | 447 (73.6%) | 15 (2.5%) |
| College / Associate Degree | 541 (72.0%) | 50 (6.7%) |
| Bachelor's Degree or higher | 539 (91.0%) | 5 (0.9%) |
| Total | 1,581 (78.4%) | 73 (3.6%) |
Employment Occupations by Sex in Butte
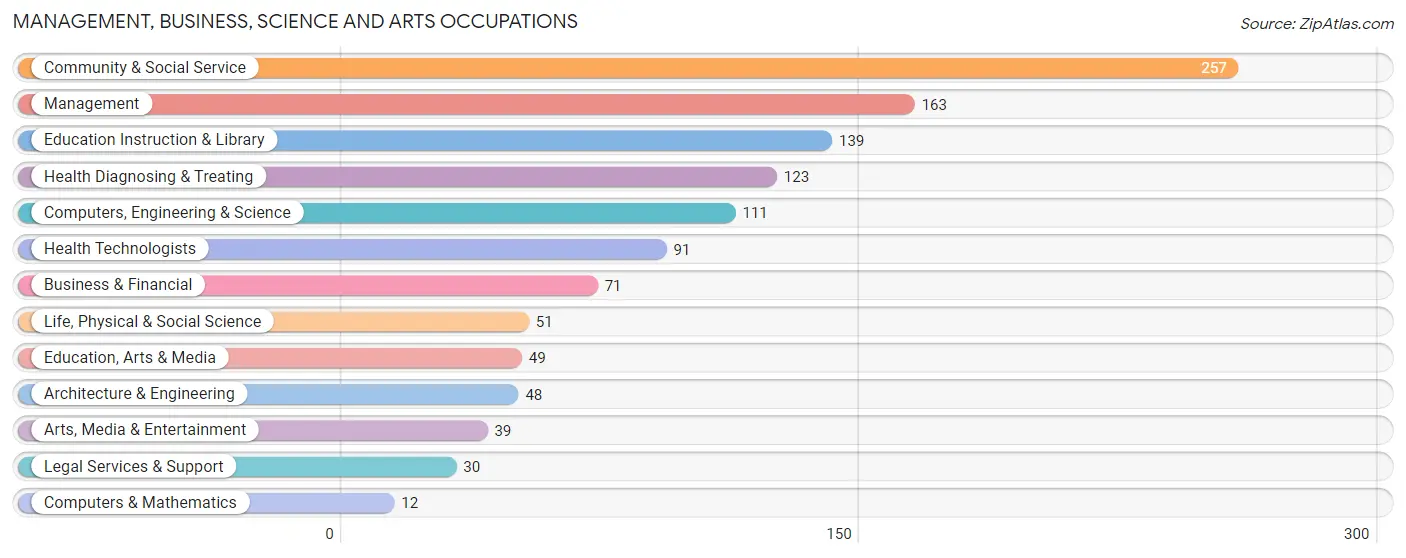
Management, Business, Science and Arts Occupations
The most common Management, Business, Science and Arts occupations in Butte are Community & Social Service (257 | 14.1%), Management (163 | 8.9%), Education Instruction & Library (139 | 7.6%), Health Diagnosing & Treating (123 | 6.7%), and Computers, Engineering & Science (111 | 6.1%).
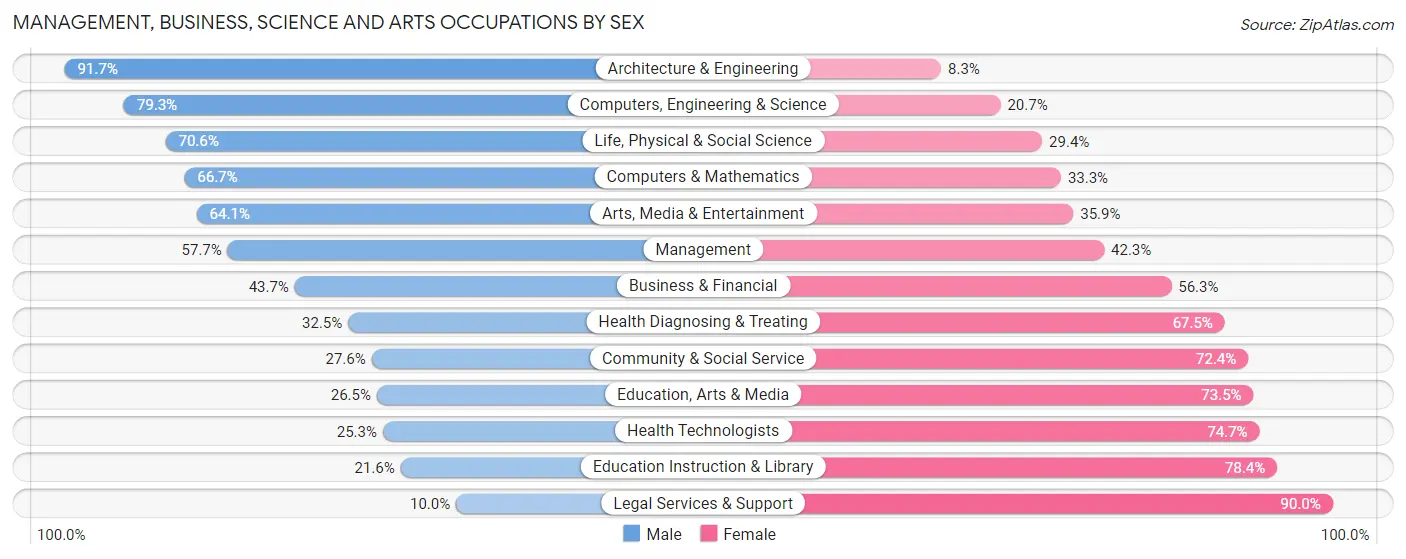
Management, Business, Science and Arts Occupations by Sex
Within the Management, Business, Science and Arts occupations in Butte, the most male-oriented occupations are Architecture & Engineering (91.7%), Computers, Engineering & Science (79.3%), and Life, Physical & Social Science (70.6%), while the most female-oriented occupations are Legal Services & Support (90.0%), Education Instruction & Library (78.4%), and Health Technologists (74.7%).
| Occupation | Male | Female |
| Management | 94 (57.7%) | 69 (42.3%) |
| Business & Financial | 31 (43.7%) | 40 (56.3%) |
| Computers, Engineering & Science | 88 (79.3%) | 23 (20.7%) |
| Computers & Mathematics | 8 (66.7%) | 4 (33.3%) |
| Architecture & Engineering | 44 (91.7%) | 4 (8.3%) |
| Life, Physical & Social Science | 36 (70.6%) | 15 (29.4%) |
| Community & Social Service | 71 (27.6%) | 186 (72.4%) |
| Education, Arts & Media | 13 (26.5%) | 36 (73.5%) |
| Legal Services & Support | 3 (10.0%) | 27 (90.0%) |
| Education Instruction & Library | 30 (21.6%) | 109 (78.4%) |
| Arts, Media & Entertainment | 25 (64.1%) | 14 (35.9%) |
| Health Diagnosing & Treating | 40 (32.5%) | 83 (67.5%) |
| Health Technologists | 23 (25.3%) | 68 (74.7%) |
| Total (Category) | 324 (44.7%) | 401 (55.3%) |
| Total (Overall) | 1,110 (60.8%) | 716 (39.2%) |
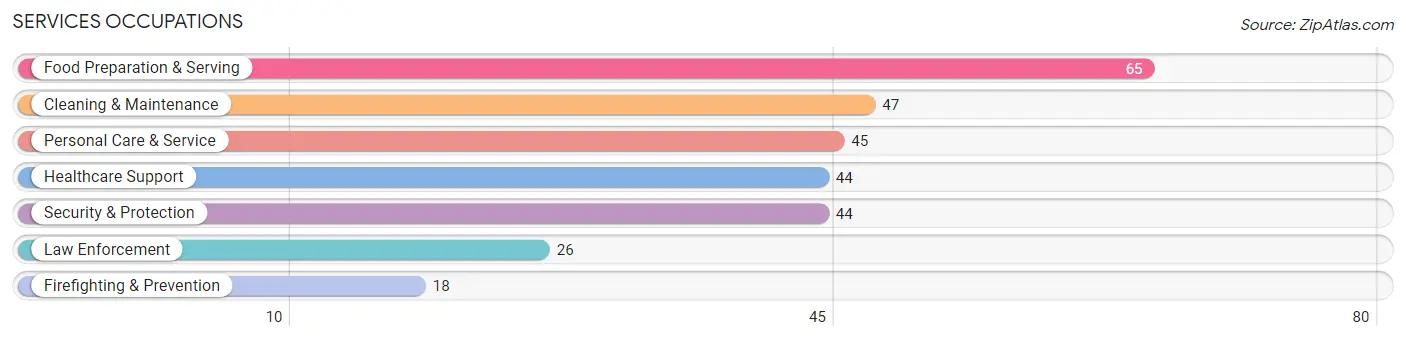
Services Occupations
The most common Services occupations in Butte are Food Preparation & Serving (65 | 3.6%), Cleaning & Maintenance (47 | 2.6%), Personal Care & Service (45 | 2.5%), Healthcare Support (44 | 2.4%), and Security & Protection (44 | 2.4%).
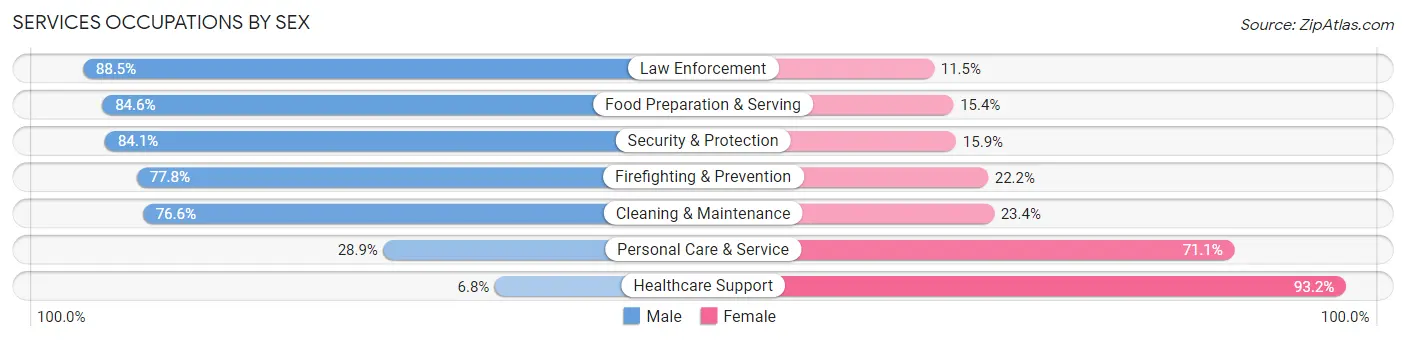
Services Occupations by Sex
Within the Services occupations in Butte, the most male-oriented occupations are Law Enforcement (88.5%), Food Preparation & Serving (84.6%), and Security & Protection (84.1%), while the most female-oriented occupations are Healthcare Support (93.2%), Personal Care & Service (71.1%), and Cleaning & Maintenance (23.4%).
| Occupation | Male | Female |
| Healthcare Support | 3 (6.8%) | 41 (93.2%) |
| Security & Protection | 37 (84.1%) | 7 (15.9%) |
| Firefighting & Prevention | 14 (77.8%) | 4 (22.2%) |
| Law Enforcement | 23 (88.5%) | 3 (11.5%) |
| Food Preparation & Serving | 55 (84.6%) | 10 (15.4%) |
| Cleaning & Maintenance | 36 (76.6%) | 11 (23.4%) |
| Personal Care & Service | 13 (28.9%) | 32 (71.1%) |
| Total (Category) | 144 (58.8%) | 101 (41.2%) |
| Total (Overall) | 1,110 (60.8%) | 716 (39.2%) |
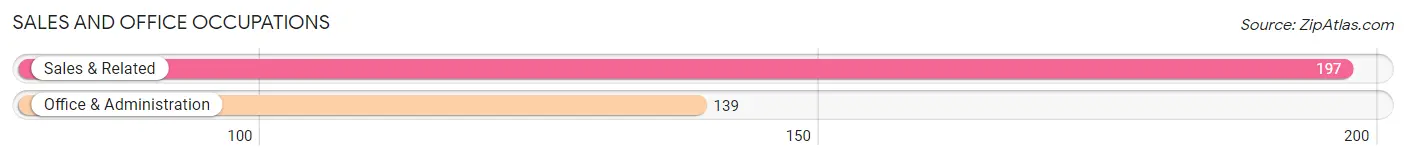
Sales and Office Occupations
The most common Sales and Office occupations in Butte are Sales & Related (197 | 10.8%), and Office & Administration (139 | 7.6%).
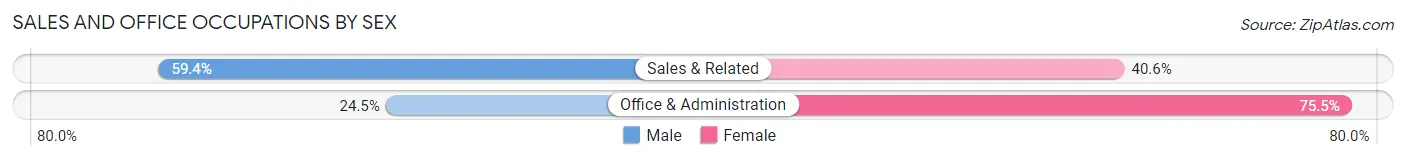
Sales and Office Occupations by Sex
| Occupation | Male | Female |
| Sales & Related | 117 (59.4%) | 80 (40.6%) |
| Office & Administration | 34 (24.5%) | 105 (75.5%) |
| Total (Category) | 151 (44.9%) | 185 (55.1%) |
| Total (Overall) | 1,110 (60.8%) | 716 (39.2%) |
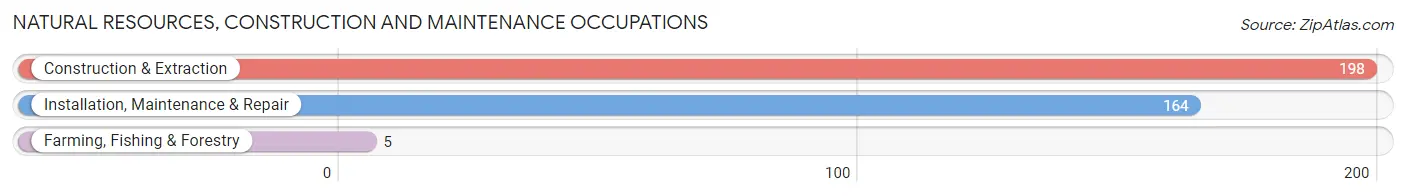
Natural Resources, Construction and Maintenance Occupations
The most common Natural Resources, Construction and Maintenance occupations in Butte are Construction & Extraction (198 | 10.8%), Installation, Maintenance & Repair (164 | 9.0%), and Farming, Fishing & Forestry (5 | 0.3%).
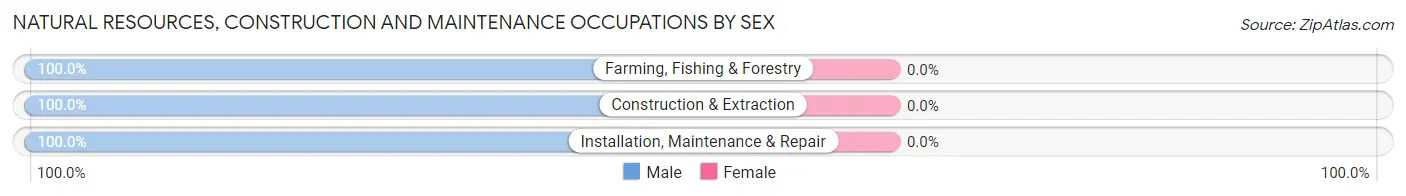
Natural Resources, Construction and Maintenance Occupations by Sex
| Occupation | Male | Female |
| Farming, Fishing & Forestry | 5 (100.0%) | 0 (0.0%) |
| Construction & Extraction | 198 (100.0%) | 0 (0.0%) |
| Installation, Maintenance & Repair | 164 (100.0%) | 0 (0.0%) |
| Total (Category) | 367 (100.0%) | 0 (0.0%) |
| Total (Overall) | 1,110 (60.8%) | 716 (39.2%) |
Production, Transportation and Moving Occupations
The most common Production, Transportation and Moving occupations in Butte are Transportation (88 | 4.8%), Production (38 | 2.1%), and Material Moving (27 | 1.5%).
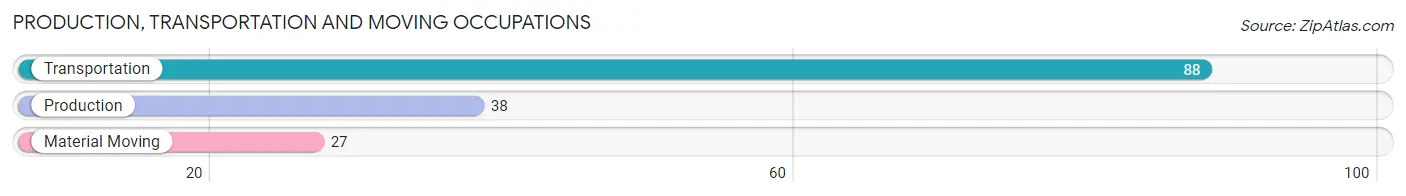
Production, Transportation and Moving Occupations by Sex
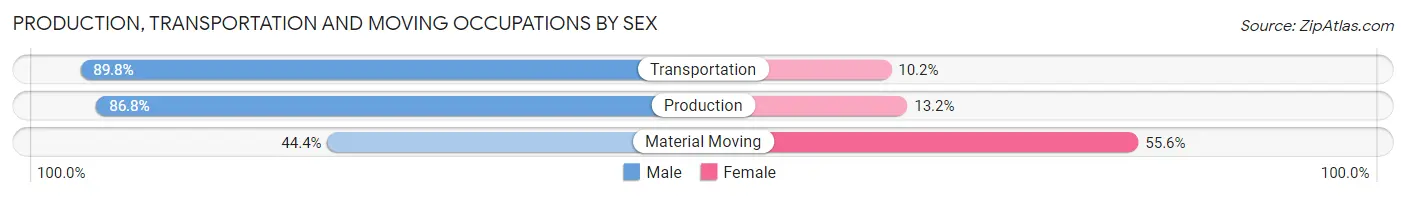
| Occupation | Male | Female |
| Production | 33 (86.8%) | 5 (13.2%) |
| Transportation | 79 (89.8%) | 9 (10.2%) |
| Material Moving | 12 (44.4%) | 15 (55.6%) |
| Total (Category) | 124 (81.0%) | 29 (19.0%) |
| Total (Overall) | 1,110 (60.8%) | 716 (39.2%) |
Employment Industries by Sex in Butte
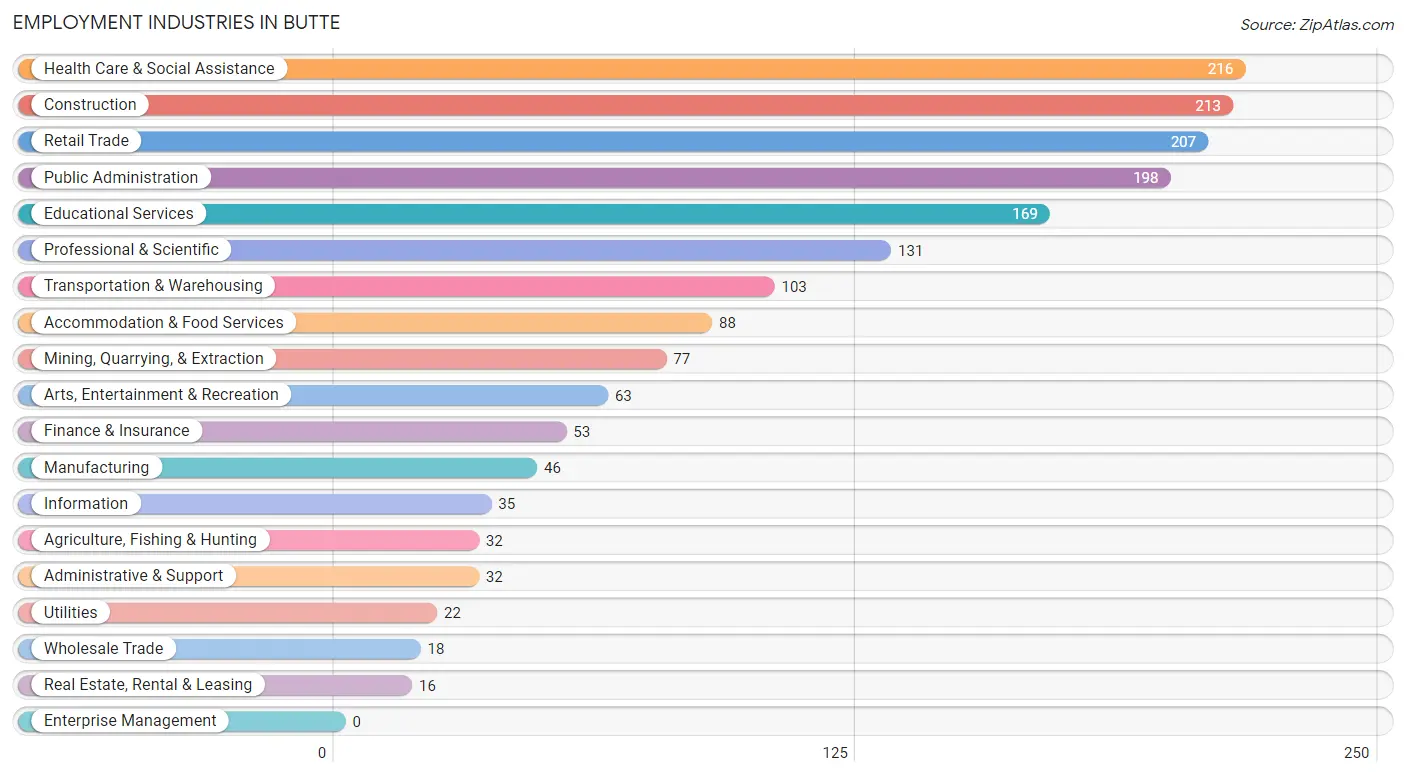
Employment Industries in Butte
The major employment industries in Butte include Health Care & Social Assistance (216 | 11.8%), Construction (213 | 11.7%), Retail Trade (207 | 11.3%), Public Administration (198 | 10.8%), and Educational Services (169 | 9.3%).
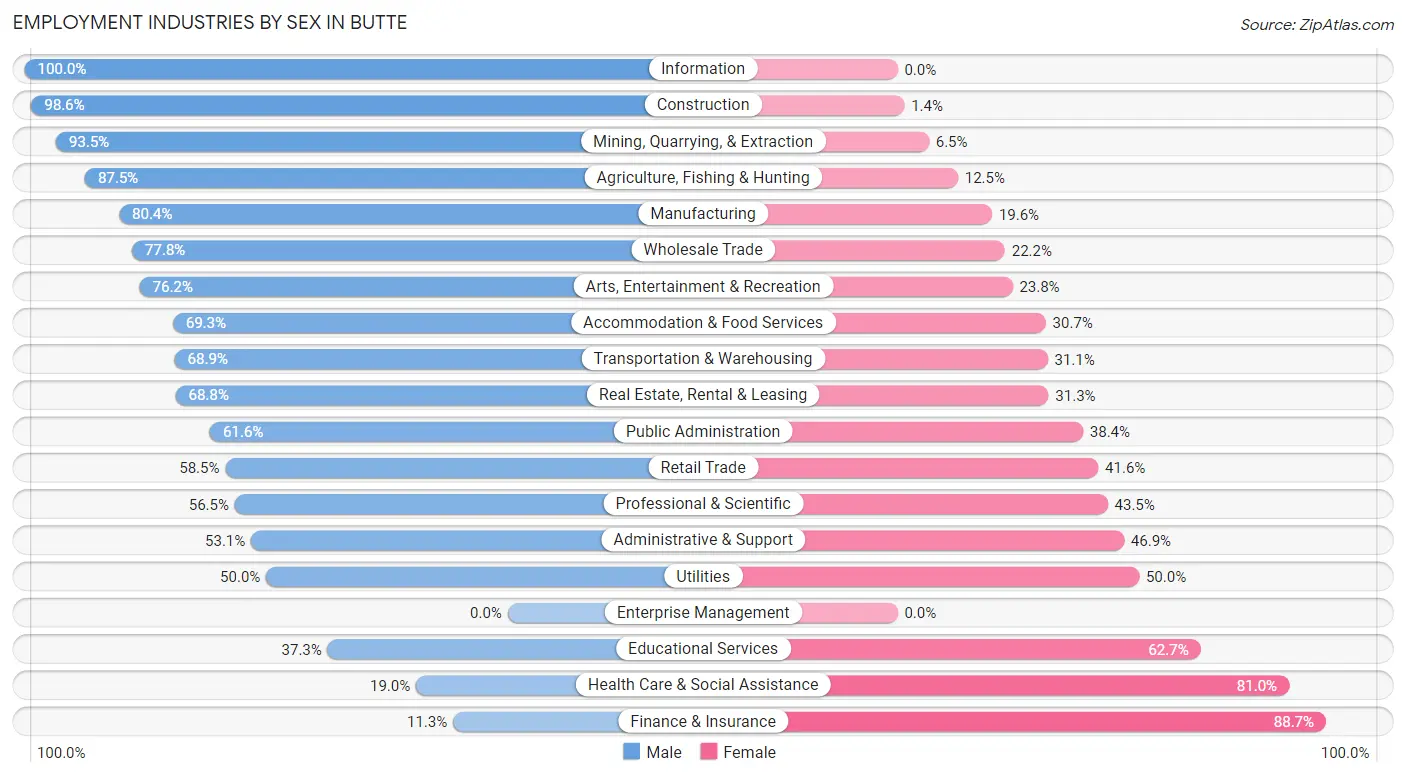
Employment Industries by Sex in Butte
The Butte industries that see more men than women are Information (100.0%), Construction (98.6%), and Mining, Quarrying, & Extraction (93.5%), whereas the industries that tend to have a higher number of women are Finance & Insurance (88.7%), Health Care & Social Assistance (81.0%), and Educational Services (62.7%).
| Industry | Male | Female |
| Agriculture, Fishing & Hunting | 28 (87.5%) | 4 (12.5%) |
| Mining, Quarrying, & Extraction | 72 (93.5%) | 5 (6.5%) |
| Construction | 210 (98.6%) | 3 (1.4%) |
| Manufacturing | 37 (80.4%) | 9 (19.6%) |
| Wholesale Trade | 14 (77.8%) | 4 (22.2%) |
| Retail Trade | 121 (58.5%) | 86 (41.5%) |
| Transportation & Warehousing | 71 (68.9%) | 32 (31.1%) |
| Utilities | 11 (50.0%) | 11 (50.0%) |
| Information | 35 (100.0%) | 0 (0.0%) |
| Finance & Insurance | 6 (11.3%) | 47 (88.7%) |
| Real Estate, Rental & Leasing | 11 (68.8%) | 5 (31.2%) |
| Professional & Scientific | 74 (56.5%) | 57 (43.5%) |
| Enterprise Management | 0 (0.0%) | 0 (0.0%) |
| Administrative & Support | 17 (53.1%) | 15 (46.9%) |
| Educational Services | 63 (37.3%) | 106 (62.7%) |
| Health Care & Social Assistance | 41 (19.0%) | 175 (81.0%) |
| Arts, Entertainment & Recreation | 48 (76.2%) | 15 (23.8%) |
| Accommodation & Food Services | 61 (69.3%) | 27 (30.7%) |
| Public Administration | 122 (61.6%) | 76 (38.4%) |
| Total | 1,110 (60.8%) | 716 (39.2%) |
Education in Butte
School Enrollment in Butte
The most common levels of schooling among the 885 students in Butte are middle school (218 | 24.6%), high school (211 | 23.8%), and college / undergraduate (184 | 20.8%).
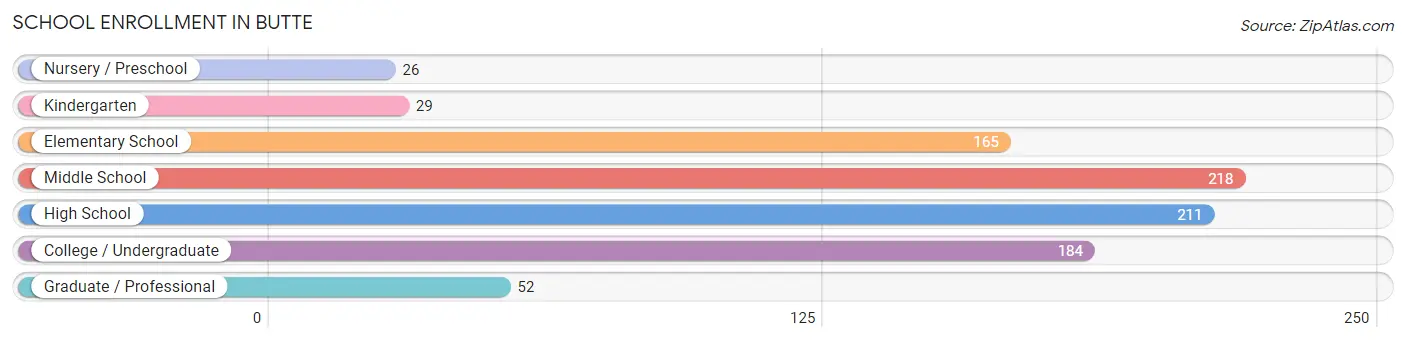
| School Level | # Students | % Students |
| Nursery / Preschool | 26 | 2.9% |
| Kindergarten | 29 | 3.3% |
| Elementary School | 165 | 18.6% |
| Middle School | 218 | 24.6% |
| High School | 211 | 23.8% |
| College / Undergraduate | 184 | 20.8% |
| Graduate / Professional | 52 | 5.9% |
| Total | 885 | 100.0% |
School Enrollment by Age by Funding Source in Butte
Out of a total of 885 students who are enrolled in schools in Butte, 99 (11.2%) attend a private institution, while the remaining 786 (88.8%) are enrolled in public schools. The age group of 3 to 4 year olds has the highest likelihood of being enrolled in private schools, with 6 (50.0% in the age bracket) enrolled. Conversely, the age group of 10 to 14 year olds has the lowest likelihood of being enrolled in a private school, with 255 (97.0% in the age bracket) attending a public institution.
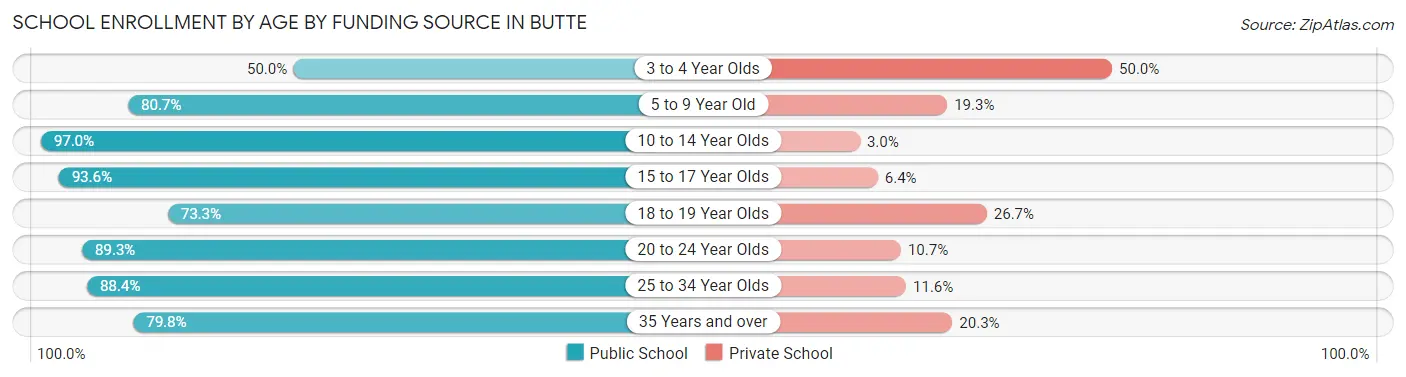
| Age Bracket | Public School | Private School |
| 3 to 4 Year Olds | 6 (50.0%) | 6 (50.0%) |
| 5 to 9 Year Old | 159 (80.7%) | 38 (19.3%) |
| 10 to 14 Year Olds | 255 (97.0%) | 8 (3.0%) |
| 15 to 17 Year Olds | 162 (93.6%) | 11 (6.4%) |
| 18 to 19 Year Olds | 11 (73.3%) | 4 (26.7%) |
| 20 to 24 Year Olds | 92 (89.3%) | 11 (10.7%) |
| 25 to 34 Year Olds | 38 (88.4%) | 5 (11.6%) |
| 35 Years and over | 63 (79.7%) | 16 (20.3%) |
| Total | 786 (88.8%) | 99 (11.2%) |
Educational Attainment by Field of Study in Butte
Education (157 | 19.6%), science & technology (109 | 13.6%), business (95 | 11.8%), bio, nature & agricultural (91 | 11.4%), and arts & humanities (61 | 7.6%) are the most common fields of study among 802 individuals in Butte who have obtained a bachelor's degree or higher.
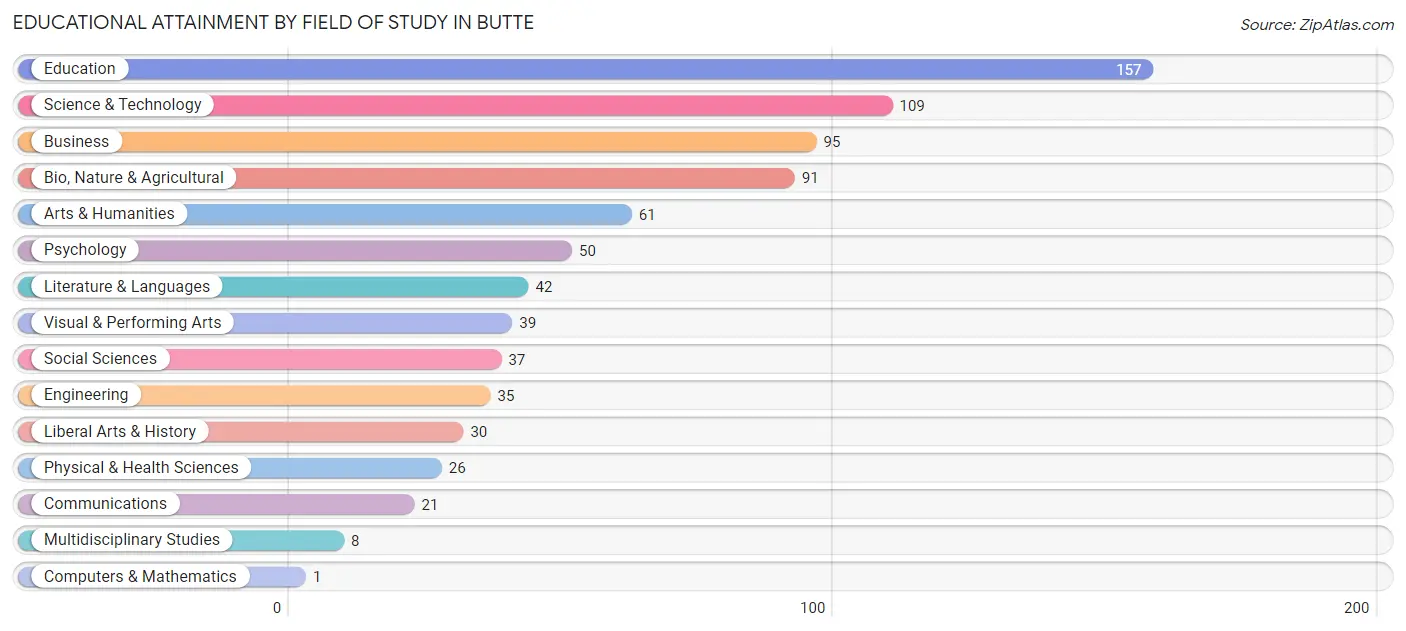
| Field of Study | # Graduates | % Graduates |
| Computers & Mathematics | 1 | 0.1% |
| Bio, Nature & Agricultural | 91 | 11.4% |
| Physical & Health Sciences | 26 | 3.2% |
| Psychology | 50 | 6.2% |
| Social Sciences | 37 | 4.6% |
| Engineering | 35 | 4.4% |
| Multidisciplinary Studies | 8 | 1.0% |
| Science & Technology | 109 | 13.6% |
| Business | 95 | 11.8% |
| Education | 157 | 19.6% |
| Literature & Languages | 42 | 5.2% |
| Liberal Arts & History | 30 | 3.7% |
| Visual & Performing Arts | 39 | 4.9% |
| Communications | 21 | 2.6% |
| Arts & Humanities | 61 | 7.6% |
| Total | 802 | 100.0% |
Transportation & Commute in Butte
Vehicle Availability by Sex in Butte
The most prevalent vehicle ownership categories in Butte are males with 3 vehicles (353, accounting for 31.8%) and females with 3 vehicles (259, making up 49.6%).
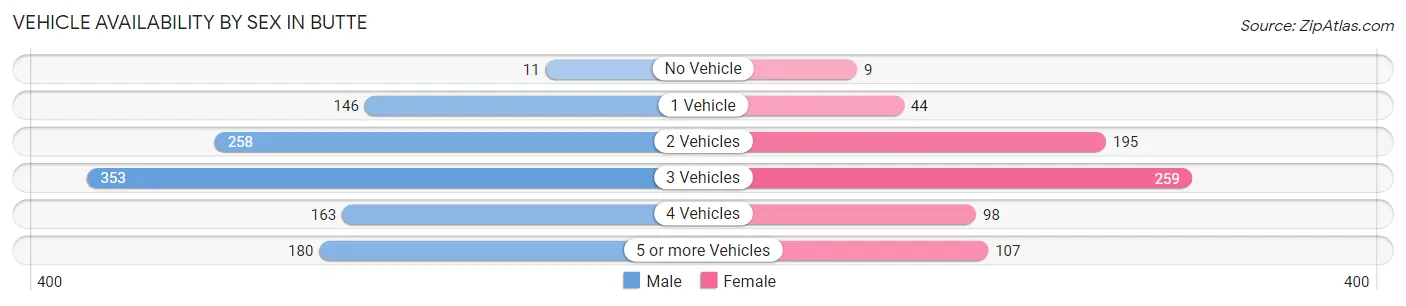
| Vehicles Available | Male | Female |
| No Vehicle | 11 (1.0%) | 9 (1.3%) |
| 1 Vehicle | 146 (13.1%) | 44 (6.2%) |
| 2 Vehicles | 258 (23.2%) | 195 (27.4%) |
| 3 Vehicles | 353 (31.8%) | 259 (36.4%) |
| 4 Vehicles | 163 (14.7%) | 98 (13.8%) |
| 5 or more Vehicles | 180 (16.2%) | 107 (15.0%) |
| Total | 1,111 (100.0%) | 712 (100.0%) |
Commute Time in Butte
The most frequently occuring commute durations in Butte are 45 to 59 minutes (259 commuters, 15.1%), 60 to 89 minutes (225 commuters, 13.1%), and 15 to 19 minutes (192 commuters, 11.2%).
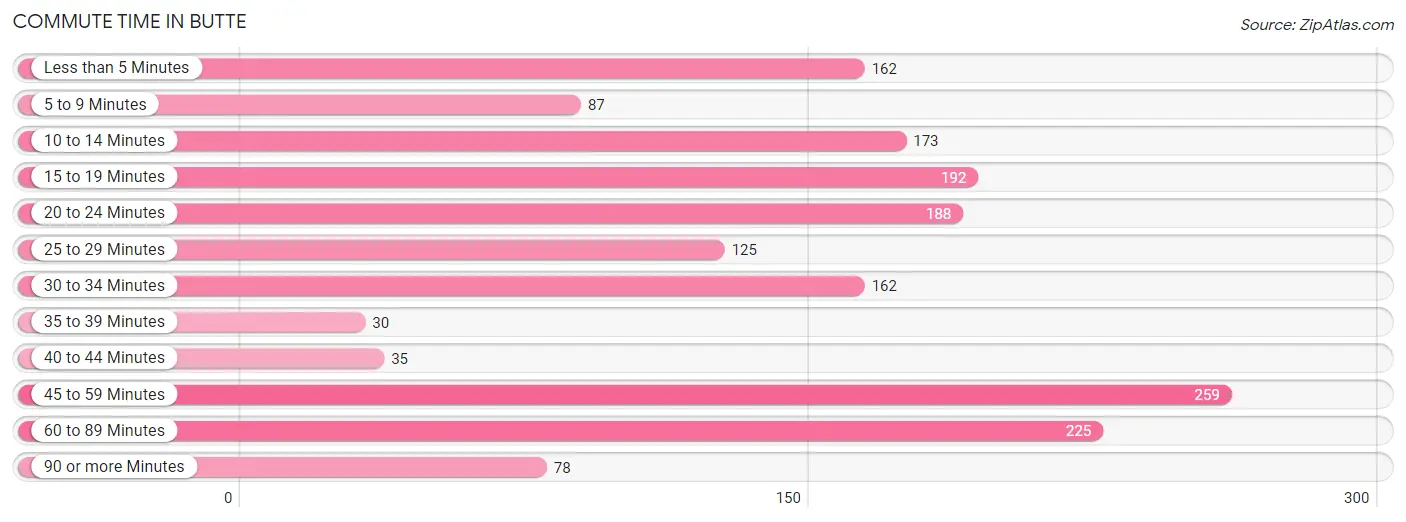
| Commute Time | # Commuters | % Commuters |
| Less than 5 Minutes | 162 | 9.4% |
| 5 to 9 Minutes | 87 | 5.1% |
| 10 to 14 Minutes | 173 | 10.1% |
| 15 to 19 Minutes | 192 | 11.2% |
| 20 to 24 Minutes | 188 | 11.0% |
| 25 to 29 Minutes | 125 | 7.3% |
| 30 to 34 Minutes | 162 | 9.4% |
| 35 to 39 Minutes | 30 | 1.8% |
| 40 to 44 Minutes | 35 | 2.0% |
| 45 to 59 Minutes | 259 | 15.1% |
| 60 to 89 Minutes | 225 | 13.1% |
| 90 or more Minutes | 78 | 4.5% |
Commute Time by Sex in Butte
The most common commute times in Butte are 45 to 59 minutes (175 commuters, 16.7%) for males and 15 to 19 minutes (93 commuters, 13.9%) for females.
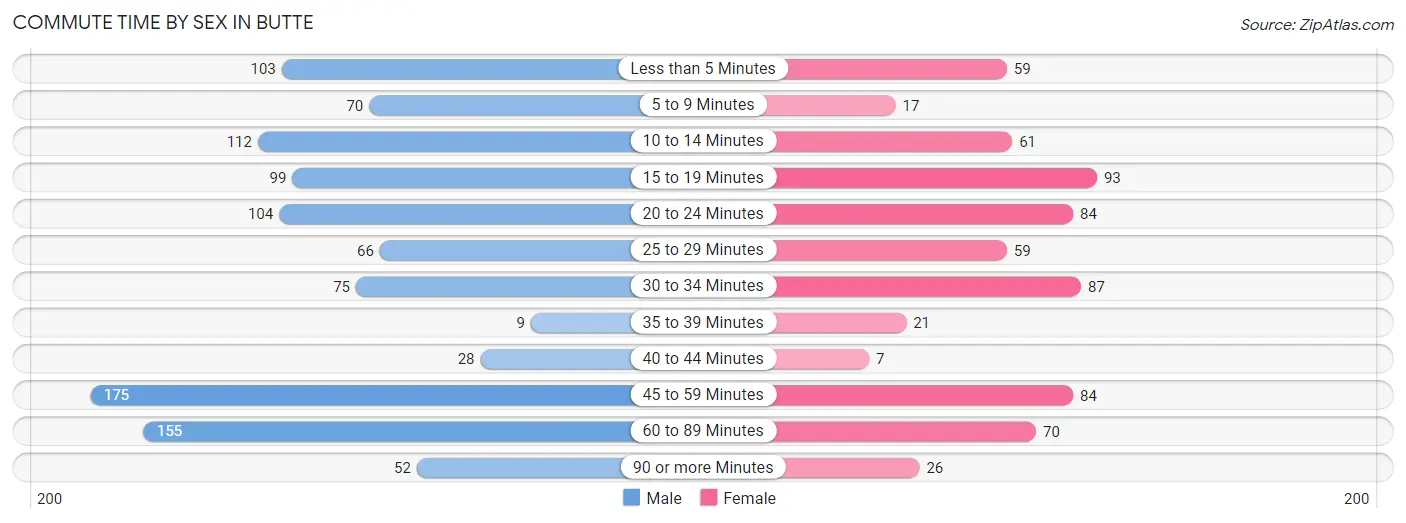
| Commute Time | Male | Female |
| Less than 5 Minutes | 103 (9.8%) | 59 (8.8%) |
| 5 to 9 Minutes | 70 (6.7%) | 17 (2.5%) |
| 10 to 14 Minutes | 112 (10.7%) | 61 (9.1%) |
| 15 to 19 Minutes | 99 (9.5%) | 93 (13.9%) |
| 20 to 24 Minutes | 104 (9.9%) | 84 (12.6%) |
| 25 to 29 Minutes | 66 (6.3%) | 59 (8.8%) |
| 30 to 34 Minutes | 75 (7.2%) | 87 (13.0%) |
| 35 to 39 Minutes | 9 (0.9%) | 21 (3.1%) |
| 40 to 44 Minutes | 28 (2.7%) | 7 (1.1%) |
| 45 to 59 Minutes | 175 (16.7%) | 84 (12.6%) |
| 60 to 89 Minutes | 155 (14.8%) | 70 (10.5%) |
| 90 or more Minutes | 52 (5.0%) | 26 (3.9%) |
Time of Departure to Work by Sex in Butte
The most frequent times of departure to work in Butte are 7:00 AM to 7:29 AM (167, 15.9%) for males and 7:00 AM to 7:29 AM (115, 17.2%) for females.
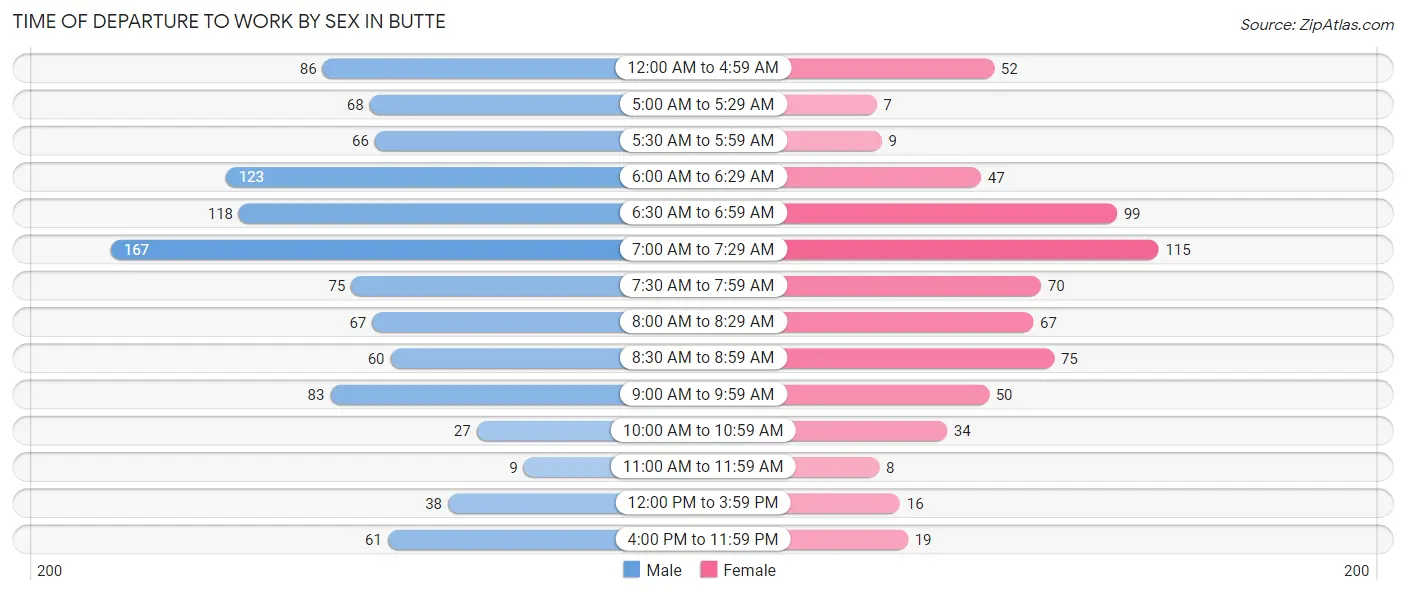
| Time of Departure | Male | Female |
| 12:00 AM to 4:59 AM | 86 (8.2%) | 52 (7.8%) |
| 5:00 AM to 5:29 AM | 68 (6.5%) | 7 (1.1%) |
| 5:30 AM to 5:59 AM | 66 (6.3%) | 9 (1.3%) |
| 6:00 AM to 6:29 AM | 123 (11.7%) | 47 (7.0%) |
| 6:30 AM to 6:59 AM | 118 (11.3%) | 99 (14.8%) |
| 7:00 AM to 7:29 AM | 167 (15.9%) | 115 (17.2%) |
| 7:30 AM to 7:59 AM | 75 (7.2%) | 70 (10.5%) |
| 8:00 AM to 8:29 AM | 67 (6.4%) | 67 (10.0%) |
| 8:30 AM to 8:59 AM | 60 (5.7%) | 75 (11.2%) |
| 9:00 AM to 9:59 AM | 83 (7.9%) | 50 (7.5%) |
| 10:00 AM to 10:59 AM | 27 (2.6%) | 34 (5.1%) |
| 11:00 AM to 11:59 AM | 9 (0.9%) | 8 (1.2%) |
| 12:00 PM to 3:59 PM | 38 (3.6%) | 16 (2.4%) |
| 4:00 PM to 11:59 PM | 61 (5.8%) | 19 (2.8%) |
| Total | 1,048 (100.0%) | 668 (100.0%) |
Housing Occupancy in Butte
Occupancy by Ownership in Butte
Of the total 1,329 dwellings in Butte, owner-occupied units account for 1,059 (79.7%), while renter-occupied units make up 270 (20.3%).
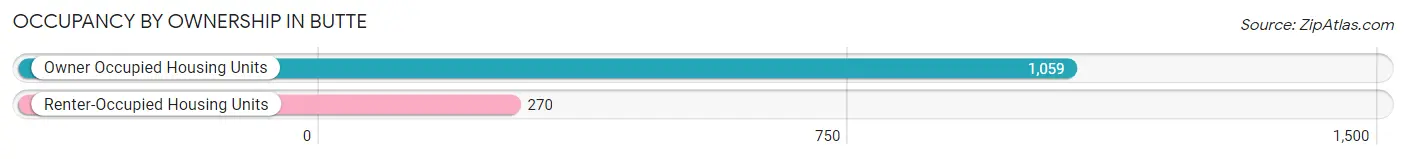
| Occupancy | # Housing Units | % Housing Units |
| Owner Occupied Housing Units | 1,059 | 79.7% |
| Renter-Occupied Housing Units | 270 | 20.3% |
| Total Occupied Housing Units | 1,329 | 100.0% |
Occupancy by Household Size in Butte
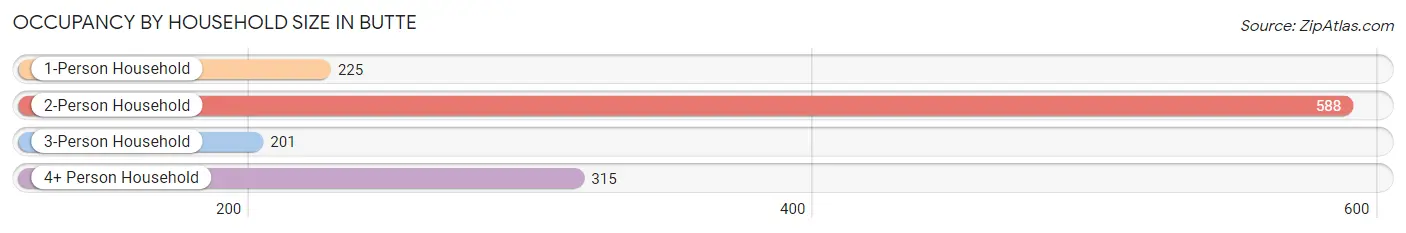
| Household Size | # Housing Units | % Housing Units |
| 1-Person Household | 225 | 16.9% |
| 2-Person Household | 588 | 44.2% |
| 3-Person Household | 201 | 15.1% |
| 4+ Person Household | 315 | 23.7% |
| Total Housing Units | 1,329 | 100.0% |
Occupancy by Ownership by Household Size in Butte
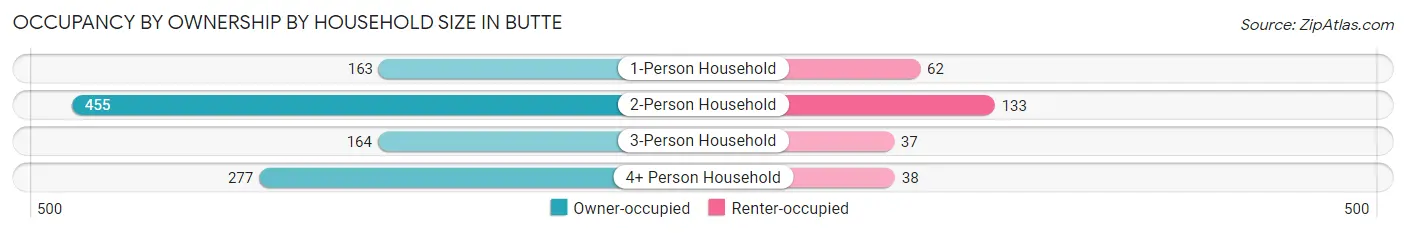
| Household Size | Owner-occupied | Renter-occupied |
| 1-Person Household | 163 (72.4%) | 62 (27.6%) |
| 2-Person Household | 455 (77.4%) | 133 (22.6%) |
| 3-Person Household | 164 (81.6%) | 37 (18.4%) |
| 4+ Person Household | 277 (87.9%) | 38 (12.1%) |
| Total Housing Units | 1,059 (79.7%) | 270 (20.3%) |
Occupancy by Educational Attainment in Butte
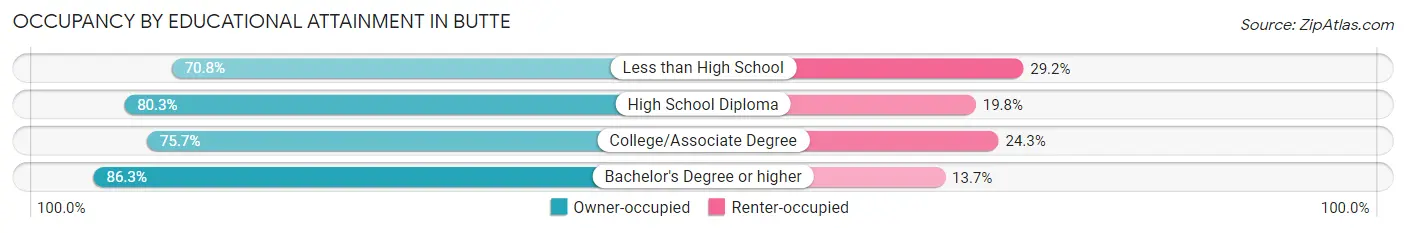
| Household Size | Owner-occupied | Renter-occupied |
| Less than High School | 51 (70.8%) | 21 (29.2%) |
| High School Diploma | 252 (80.2%) | 62 (19.8%) |
| College/Associate Degree | 415 (75.7%) | 133 (24.3%) |
| Bachelor's Degree or higher | 341 (86.3%) | 54 (13.7%) |
Occupancy by Age of Householder in Butte
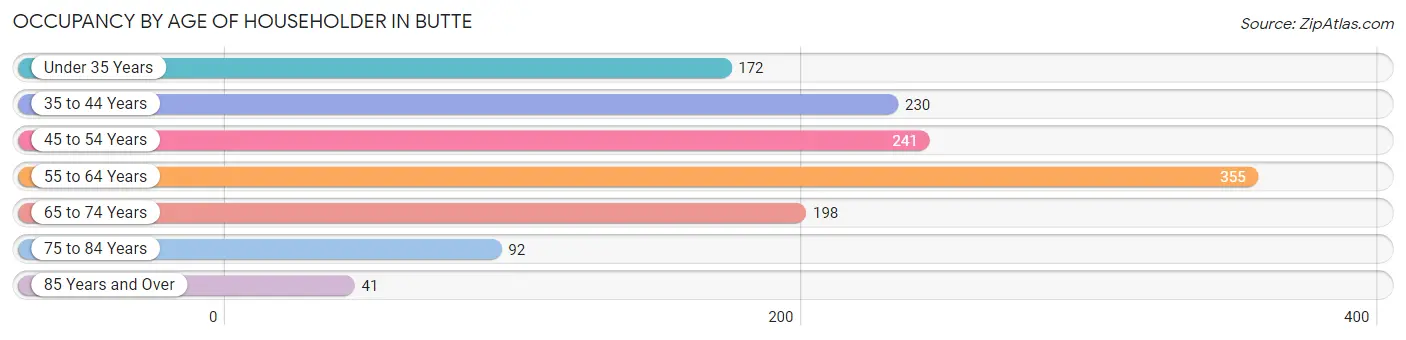
| Age Bracket | # Households | % Households |
| Under 35 Years | 172 | 12.9% |
| 35 to 44 Years | 230 | 17.3% |
| 45 to 54 Years | 241 | 18.1% |
| 55 to 64 Years | 355 | 26.7% |
| 65 to 74 Years | 198 | 14.9% |
| 75 to 84 Years | 92 | 6.9% |
| 85 Years and Over | 41 | 3.1% |
| Total | 1,329 | 100.0% |
Housing Finances in Butte
Median Income by Occupancy in Butte
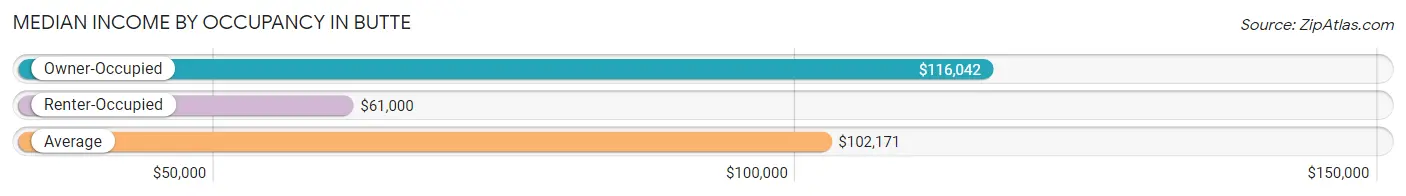
| Occupancy Type | # Households | Median Income |
| Owner-Occupied | 1,059 (79.7%) | $116,042 |
| Renter-Occupied | 270 (20.3%) | $61,000 |
| Average | 1,329 (100.0%) | $102,171 |
Occupancy by Householder Income Bracket in Butte
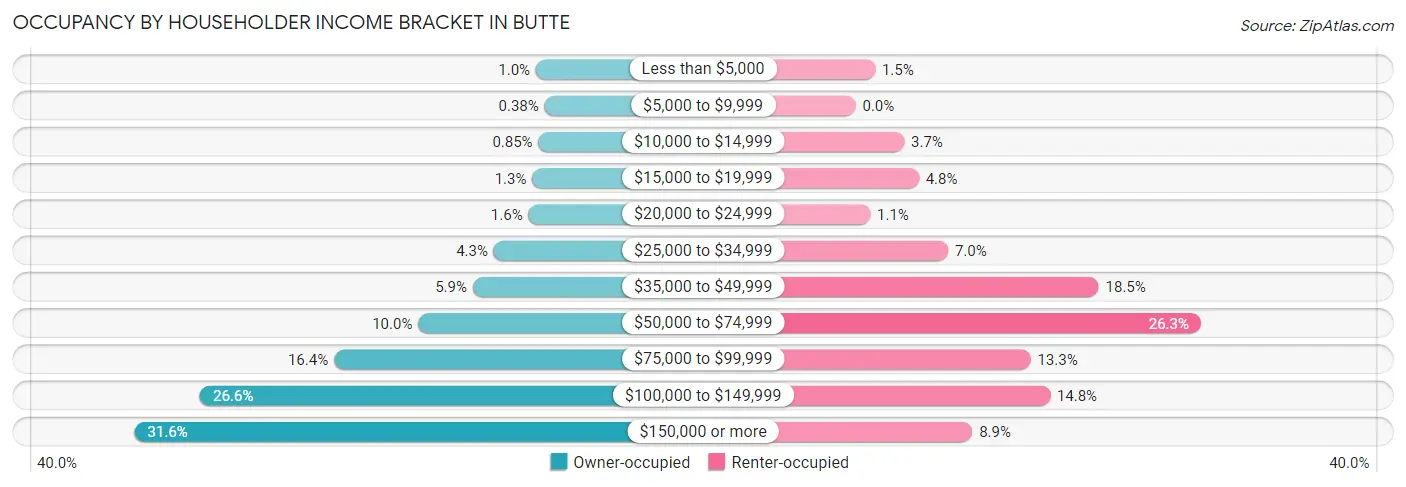
| Income Bracket | Owner-occupied | Renter-occupied |
| Less than $5,000 | 11 (1.0%) | 4 (1.5%) |
| $5,000 to $9,999 | 4 (0.4%) | 0 (0.0%) |
| $10,000 to $14,999 | 9 (0.9%) | 10 (3.7%) |
| $15,000 to $19,999 | 14 (1.3%) | 13 (4.8%) |
| $20,000 to $24,999 | 17 (1.6%) | 3 (1.1%) |
| $25,000 to $34,999 | 45 (4.3%) | 19 (7.0%) |
| $35,000 to $49,999 | 62 (5.9%) | 50 (18.5%) |
| $50,000 to $74,999 | 106 (10.0%) | 71 (26.3%) |
| $75,000 to $99,999 | 174 (16.4%) | 36 (13.3%) |
| $100,000 to $149,999 | 282 (26.6%) | 40 (14.8%) |
| $150,000 or more | 335 (31.6%) | 24 (8.9%) |
| Total | 1,059 (100.0%) | 270 (100.0%) |
Monthly Housing Cost Tiers in Butte
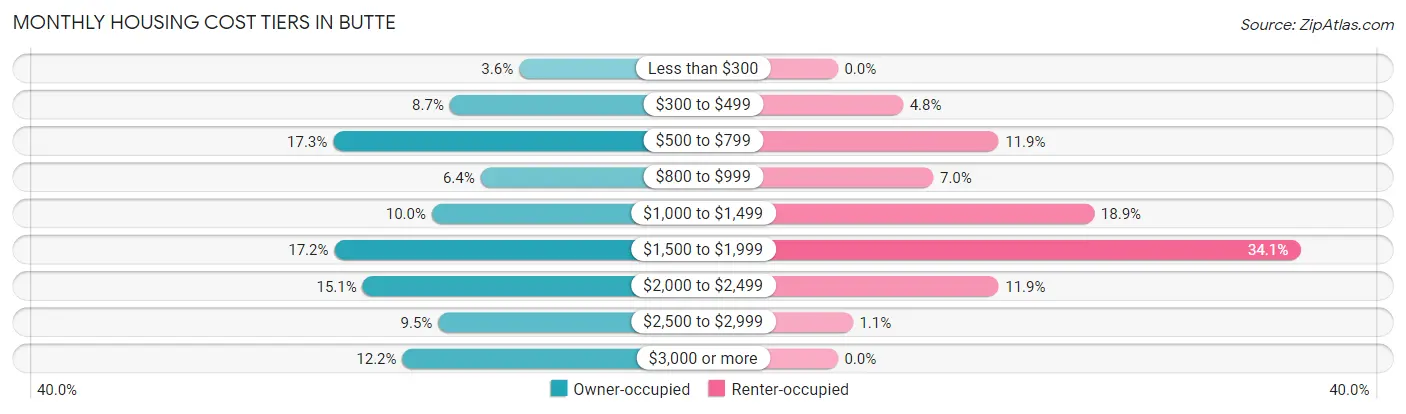
| Monthly Cost | Owner-occupied | Renter-occupied |
| Less than $300 | 38 (3.6%) | 0 (0.0%) |
| $300 to $499 | 92 (8.7%) | 13 (4.8%) |
| $500 to $799 | 183 (17.3%) | 32 (11.8%) |
| $800 to $999 | 68 (6.4%) | 19 (7.0%) |
| $1,000 to $1,499 | 106 (10.0%) | 51 (18.9%) |
| $1,500 to $1,999 | 182 (17.2%) | 92 (34.1%) |
| $2,000 to $2,499 | 160 (15.1%) | 32 (11.8%) |
| $2,500 to $2,999 | 101 (9.5%) | 3 (1.1%) |
| $3,000 or more | 129 (12.2%) | 0 (0.0%) |
| Total | 1,059 (100.0%) | 270 (100.0%) |
Physical Housing Characteristics in Butte
Housing Structures in Butte
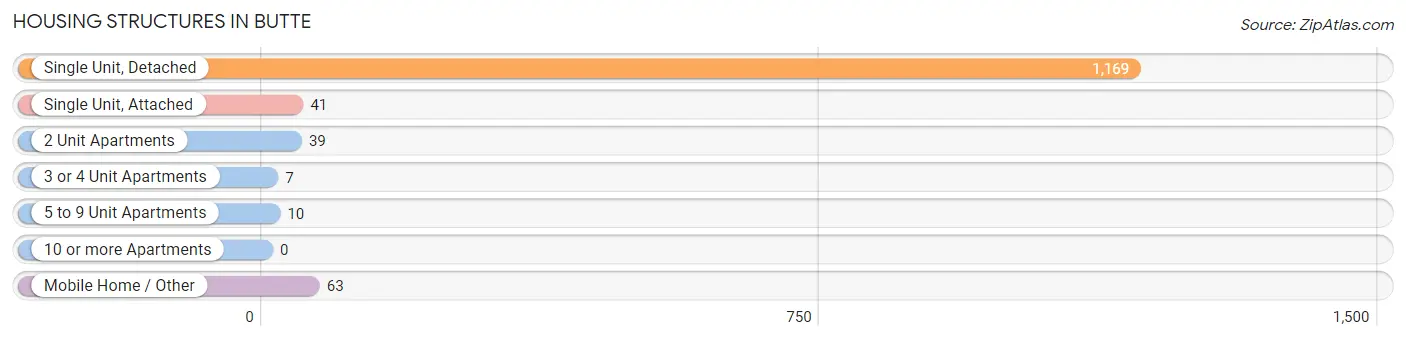
| Structure Type | # Housing Units | % Housing Units |
| Single Unit, Detached | 1,169 | 88.0% |
| Single Unit, Attached | 41 | 3.1% |
| 2 Unit Apartments | 39 | 2.9% |
| 3 or 4 Unit Apartments | 7 | 0.5% |
| 5 to 9 Unit Apartments | 10 | 0.7% |
| 10 or more Apartments | 0 | 0.0% |
| Mobile Home / Other | 63 | 4.7% |
| Total | 1,329 | 100.0% |
Housing Structures by Occupancy in Butte
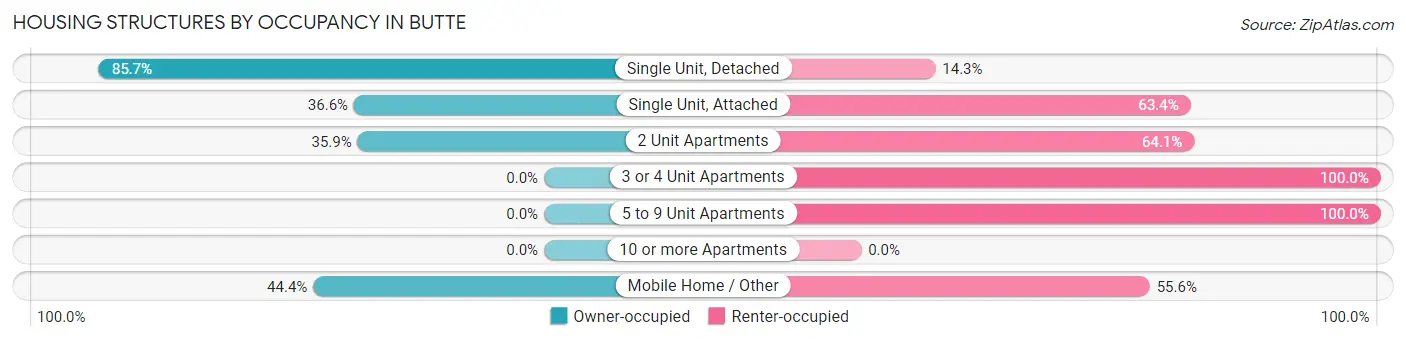
| Structure Type | Owner-occupied | Renter-occupied |
| Single Unit, Detached | 1,002 (85.7%) | 167 (14.3%) |
| Single Unit, Attached | 15 (36.6%) | 26 (63.4%) |
| 2 Unit Apartments | 14 (35.9%) | 25 (64.1%) |
| 3 or 4 Unit Apartments | 0 (0.0%) | 7 (100.0%) |
| 5 to 9 Unit Apartments | 0 (0.0%) | 10 (100.0%) |
| 10 or more Apartments | 0 (0.0%) | 0 (0.0%) |
| Mobile Home / Other | 28 (44.4%) | 35 (55.6%) |
| Total | 1,059 (79.7%) | 270 (20.3%) |
Housing Structures by Number of Rooms in Butte
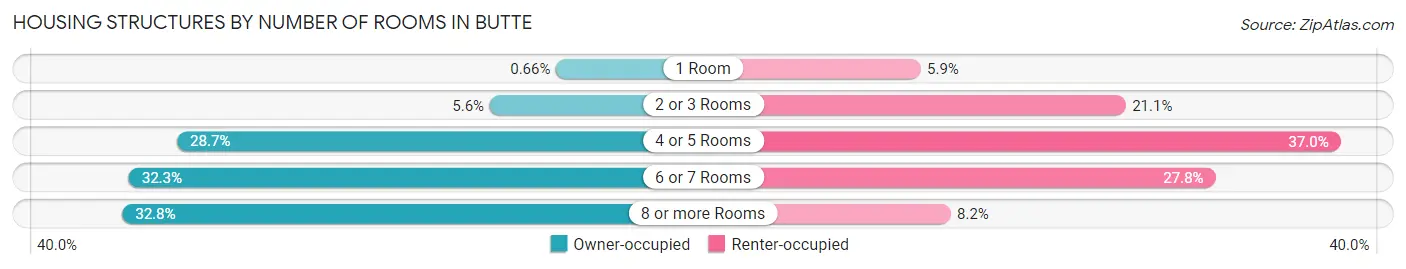
| Number of Rooms | Owner-occupied | Renter-occupied |
| 1 Room | 7 (0.7%) | 16 (5.9%) |
| 2 or 3 Rooms | 59 (5.6%) | 57 (21.1%) |
| 4 or 5 Rooms | 304 (28.7%) | 100 (37.0%) |
| 6 or 7 Rooms | 342 (32.3%) | 75 (27.8%) |
| 8 or more Rooms | 347 (32.8%) | 22 (8.2%) |
| Total | 1,059 (100.0%) | 270 (100.0%) |
Housing Structure by Heating Type in Butte
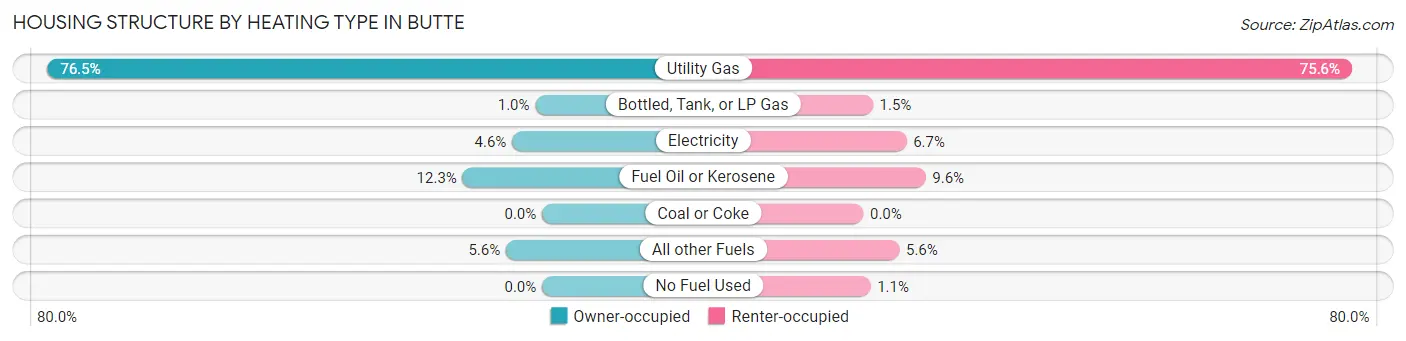
| Heating Type | Owner-occupied | Renter-occupied |
| Utility Gas | 810 (76.5%) | 204 (75.6%) |
| Bottled, Tank, or LP Gas | 11 (1.0%) | 4 (1.5%) |
| Electricity | 49 (4.6%) | 18 (6.7%) |
| Fuel Oil or Kerosene | 130 (12.3%) | 26 (9.6%) |
| Coal or Coke | 0 (0.0%) | 0 (0.0%) |
| All other Fuels | 59 (5.6%) | 15 (5.6%) |
| No Fuel Used | 0 (0.0%) | 3 (1.1%) |
| Total | 1,059 (100.0%) | 270 (100.0%) |
Household Vehicle Usage in Butte
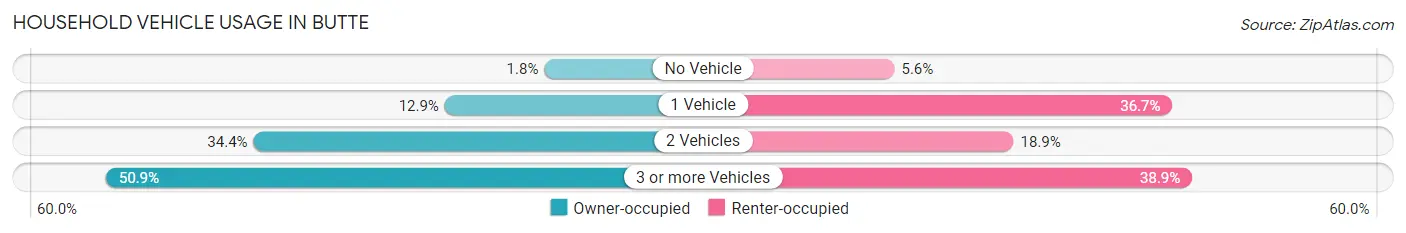
| Vehicles per Household | Owner-occupied | Renter-occupied |
| No Vehicle | 19 (1.8%) | 15 (5.6%) |
| 1 Vehicle | 137 (12.9%) | 99 (36.7%) |
| 2 Vehicles | 364 (34.4%) | 51 (18.9%) |
| 3 or more Vehicles | 539 (50.9%) | 105 (38.9%) |
| Total | 1,059 (100.0%) | 270 (100.0%) |
Real Estate & Mortgages in Butte
Real Estate and Mortgage Overview in Butte
| Characteristic | Without Mortgage | With Mortgage |
| Housing Units | 399 | 660 |
| Median Property Value | $255,700 | $330,900 |
| Median Household Income | $90,234 | $249 |
| Monthly Housing Costs | $630 | $129 |
| Real Estate Taxes | $2,811 | $41 |
Property Value by Mortgage Status in Butte
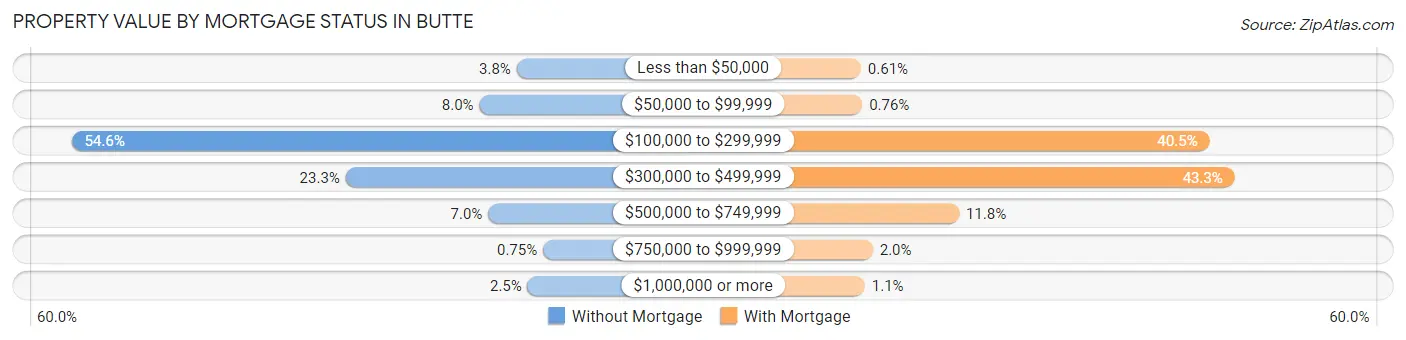
| Property Value | Without Mortgage | With Mortgage |
| Less than $50,000 | 15 (3.8%) | 4 (0.6%) |
| $50,000 to $99,999 | 32 (8.0%) | 5 (0.8%) |
| $100,000 to $299,999 | 218 (54.6%) | 267 (40.5%) |
| $300,000 to $499,999 | 93 (23.3%) | 286 (43.3%) |
| $500,000 to $749,999 | 28 (7.0%) | 78 (11.8%) |
| $750,000 to $999,999 | 3 (0.7%) | 13 (2.0%) |
| $1,000,000 or more | 10 (2.5%) | 7 (1.1%) |
| Total | 399 (100.0%) | 660 (100.0%) |
Household Income by Mortgage Status in Butte
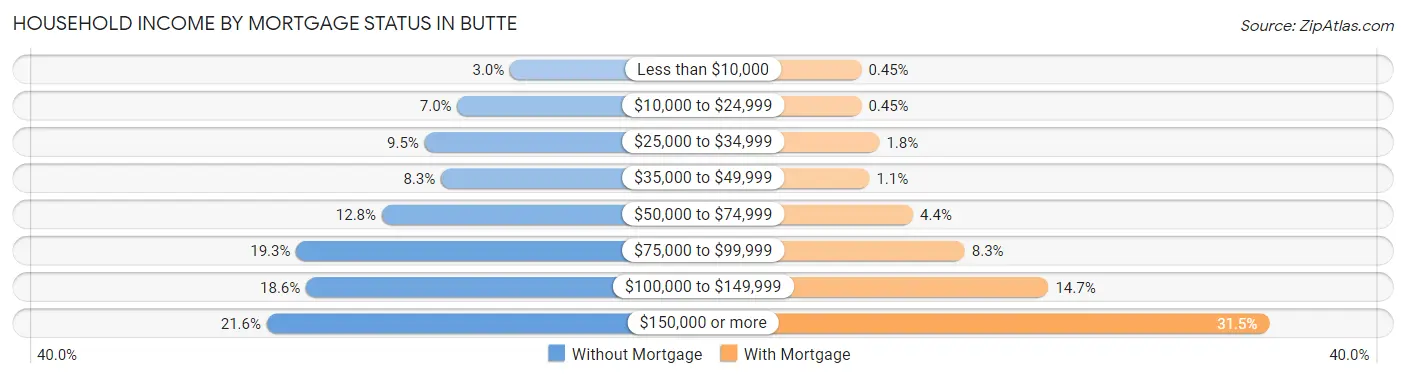
| Household Income | Without Mortgage | With Mortgage |
| Less than $10,000 | 12 (3.0%) | 3 (0.4%) |
| $10,000 to $24,999 | 28 (7.0%) | 3 (0.4%) |
| $25,000 to $34,999 | 38 (9.5%) | 12 (1.8%) |
| $35,000 to $49,999 | 33 (8.3%) | 7 (1.1%) |
| $50,000 to $74,999 | 51 (12.8%) | 29 (4.4%) |
| $75,000 to $99,999 | 77 (19.3%) | 55 (8.3%) |
| $100,000 to $149,999 | 74 (18.5%) | 97 (14.7%) |
| $150,000 or more | 86 (21.5%) | 208 (31.5%) |
| Total | 399 (100.0%) | 660 (100.0%) |
Property Value to Household Income Ratio in Butte
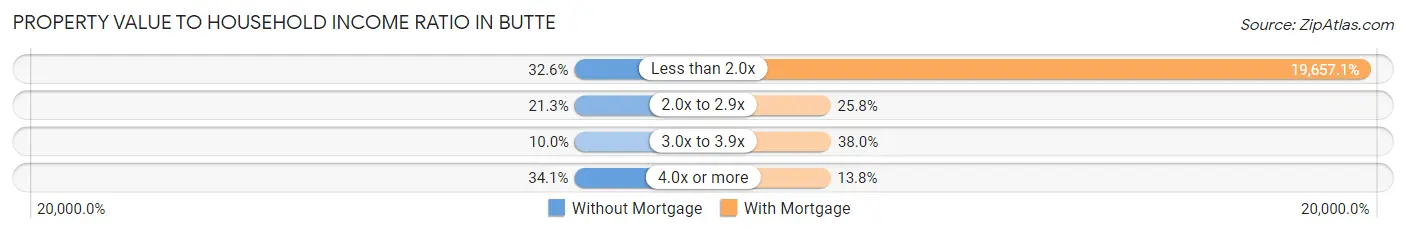
| Value-to-Income Ratio | Without Mortgage | With Mortgage |
| Less than 2.0x | 130 (32.6%) | 129,737 (19,657.1%) |
| 2.0x to 2.9x | 85 (21.3%) | 170 (25.8%) |
| 3.0x to 3.9x | 40 (10.0%) | 251 (38.0%) |
| 4.0x or more | 136 (34.1%) | 91 (13.8%) |
| Total | 399 (100.0%) | 660 (100.0%) |
Real Estate Taxes by Mortgage Status in Butte
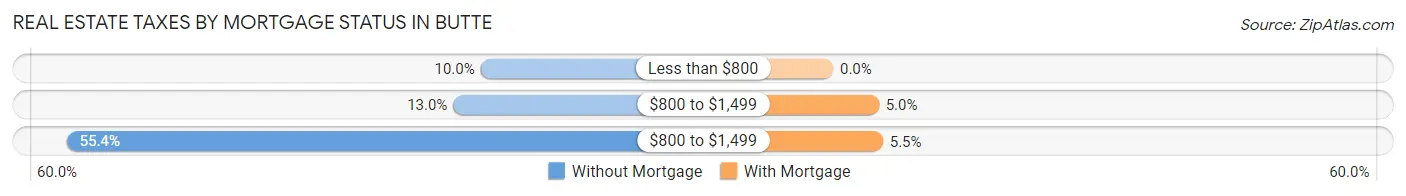
| Property Taxes | Without Mortgage | With Mortgage |
| Less than $800 | 40 (10.0%) | 0 (0.0%) |
| $800 to $1,499 | 52 (13.0%) | 33 (5.0%) |
| $800 to $1,499 | 221 (55.4%) | 36 (5.4%) |
| Total | 399 (100.0%) | 660 (100.0%) |
Health & Disability in Butte
Health Insurance Coverage by Age in Butte
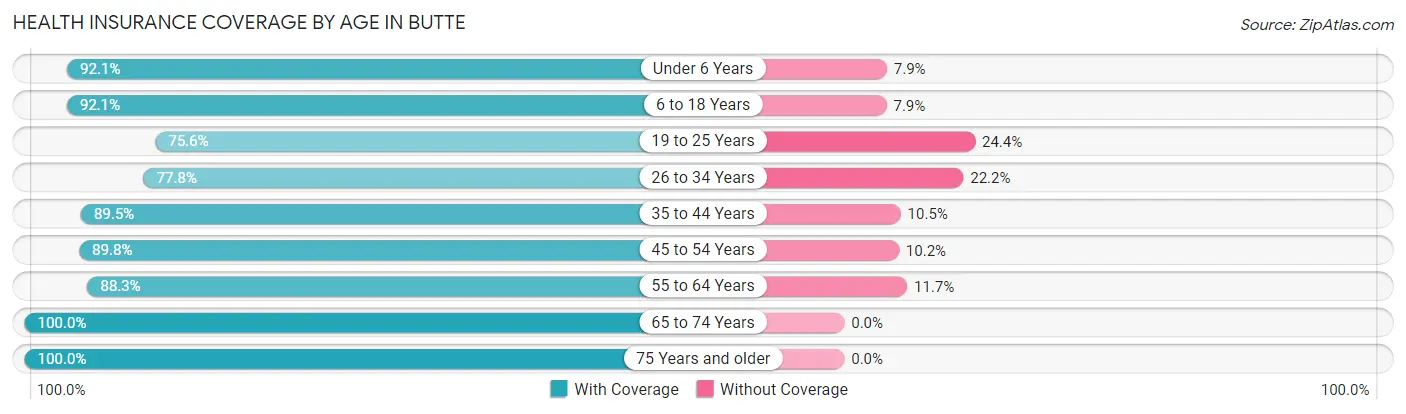
| Age Bracket | With Coverage | Without Coverage |
| Under 6 Years | 209 (92.1%) | 18 (7.9%) |
| 6 to 18 Years | 596 (92.1%) | 51 (7.9%) |
| 19 to 25 Years | 245 (75.6%) | 79 (24.4%) |
| 26 to 34 Years | 249 (77.8%) | 71 (22.2%) |
| 35 to 44 Years | 443 (89.5%) | 52 (10.5%) |
| 45 to 54 Years | 441 (89.8%) | 50 (10.2%) |
| 55 to 64 Years | 573 (88.3%) | 76 (11.7%) |
| 65 to 74 Years | 352 (100.0%) | 0 (0.0%) |
| 75 Years and older | 229 (100.0%) | 0 (0.0%) |
| Total | 3,337 (89.4%) | 397 (10.6%) |
Health Insurance Coverage by Citizenship Status in Butte
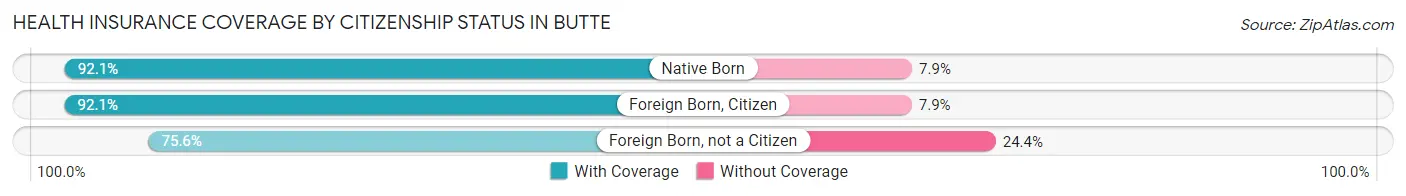
| Citizenship Status | With Coverage | Without Coverage |
| Native Born | 209 (92.1%) | 18 (7.9%) |
| Foreign Born, Citizen | 596 (92.1%) | 51 (7.9%) |
| Foreign Born, not a Citizen | 245 (75.6%) | 79 (24.4%) |
Health Insurance Coverage by Household Income in Butte
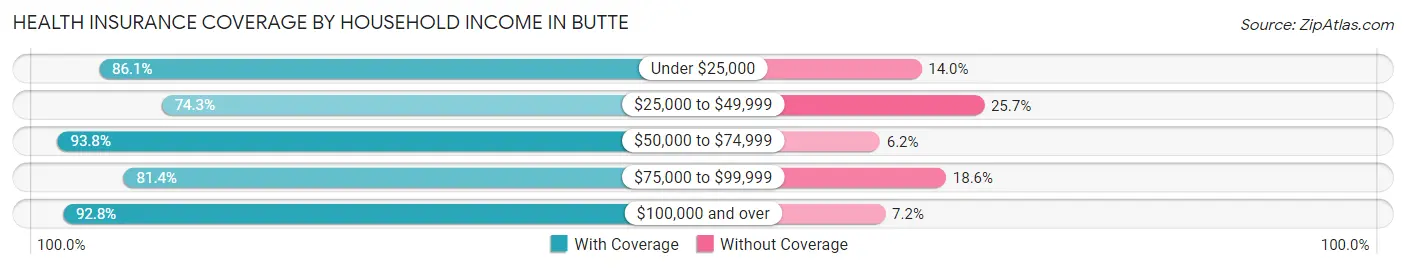
| Household Income | With Coverage | Without Coverage |
| Under $25,000 | 111 (86.1%) | 18 (14.0%) |
| $25,000 to $49,999 | 240 (74.3%) | 83 (25.7%) |
| $50,000 to $74,999 | 440 (93.8%) | 29 (6.2%) |
| $75,000 to $99,999 | 465 (81.4%) | 106 (18.6%) |
| $100,000 and over | 2,077 (92.8%) | 161 (7.2%) |
Public vs Private Health Insurance Coverage by Age in Butte
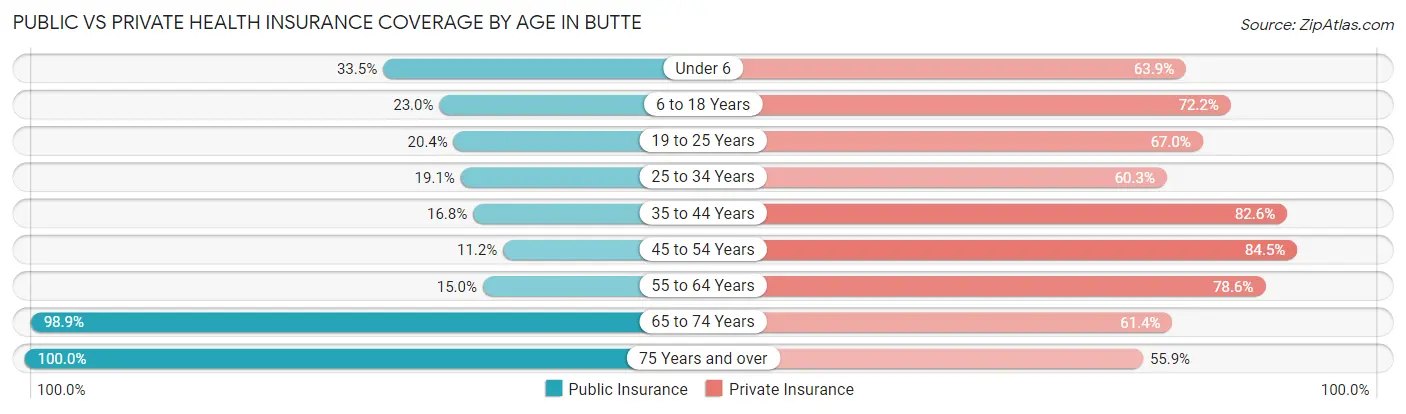
| Age Bracket | Public Insurance | Private Insurance |
| Under 6 | 76 (33.5%) | 145 (63.9%) |
| 6 to 18 Years | 149 (23.0%) | 467 (72.2%) |
| 19 to 25 Years | 66 (20.4%) | 217 (67.0%) |
| 25 to 34 Years | 61 (19.1%) | 193 (60.3%) |
| 35 to 44 Years | 83 (16.8%) | 409 (82.6%) |
| 45 to 54 Years | 55 (11.2%) | 415 (84.5%) |
| 55 to 64 Years | 97 (14.9%) | 510 (78.6%) |
| 65 to 74 Years | 348 (98.9%) | 216 (61.4%) |
| 75 Years and over | 229 (100.0%) | 128 (55.9%) |
| Total | 1,164 (31.2%) | 2,700 (72.3%) |
Disability Status by Sex by Age in Butte
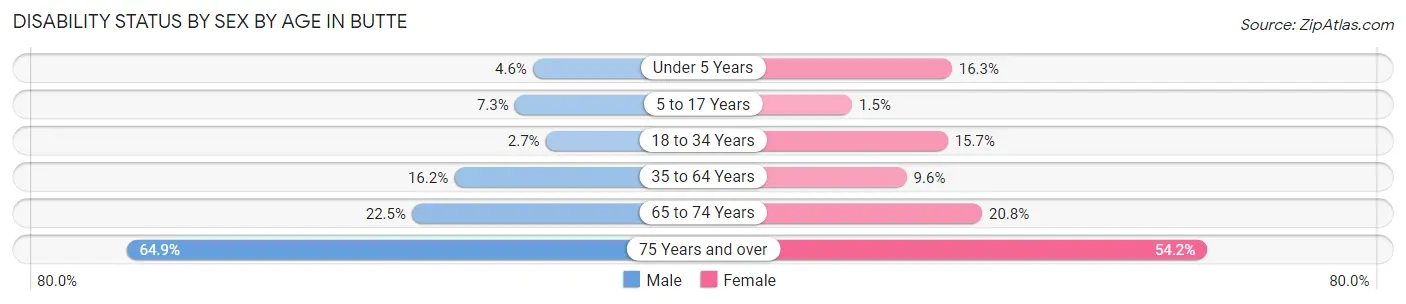
| Age Bracket | Male | Female |
| Under 5 Years | 4 (4.5%) | 16 (16.3%) |
| 5 to 17 Years | 25 (7.2%) | 5 (1.5%) |
| 18 to 34 Years | 10 (2.7%) | 45 (15.7%) |
| 35 to 64 Years | 139 (16.2%) | 75 (9.6%) |
| 65 to 74 Years | 36 (22.5%) | 40 (20.8%) |
| 75 Years and over | 72 (64.9%) | 64 (54.2%) |
Disability Class by Sex by Age in Butte
Disability Class: Hearing Difficulty
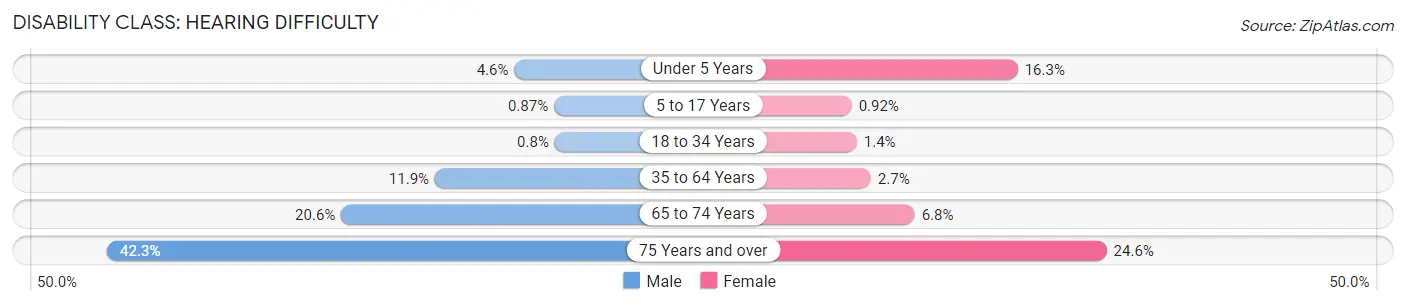
| Age Bracket | Male | Female |
| Under 5 Years | 4 (4.5%) | 16 (16.3%) |
| 5 to 17 Years | 3 (0.9%) | 3 (0.9%) |
| 18 to 34 Years | 3 (0.8%) | 4 (1.4%) |
| 35 to 64 Years | 102 (11.9%) | 21 (2.7%) |
| 65 to 74 Years | 33 (20.6%) | 13 (6.8%) |
| 75 Years and over | 47 (42.3%) | 29 (24.6%) |
Disability Class: Vision Difficulty
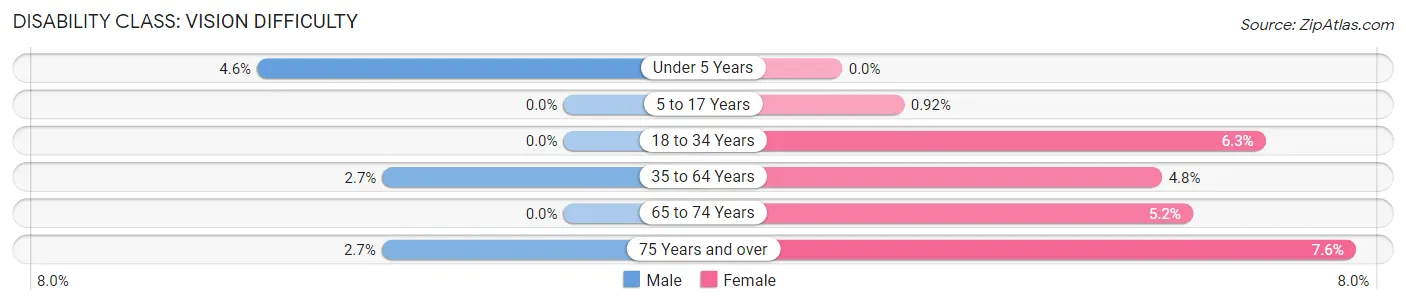
| Age Bracket | Male | Female |
| Under 5 Years | 4 (4.5%) | 0 (0.0%) |
| 5 to 17 Years | 0 (0.0%) | 3 (0.9%) |
| 18 to 34 Years | 0 (0.0%) | 18 (6.3%) |
| 35 to 64 Years | 23 (2.7%) | 37 (4.8%) |
| 65 to 74 Years | 0 (0.0%) | 10 (5.2%) |
| 75 Years and over | 3 (2.7%) | 9 (7.6%) |
Disability Class: Cognitive Difficulty
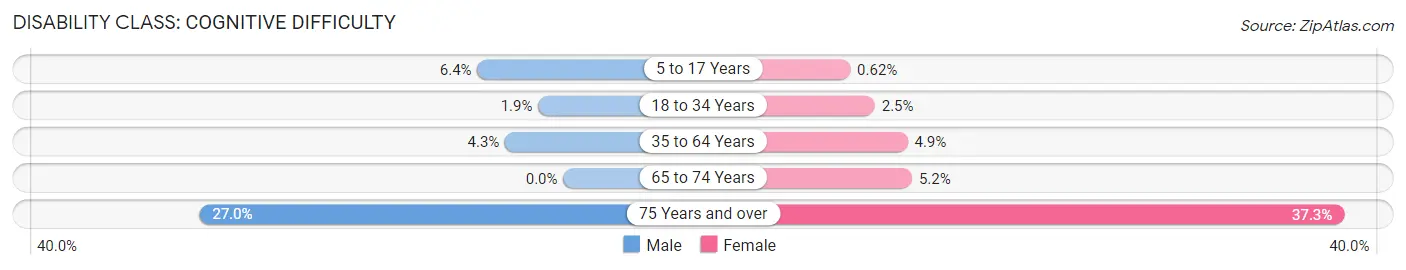
| Age Bracket | Male | Female |
| 5 to 17 Years | 22 (6.4%) | 2 (0.6%) |
| 18 to 34 Years | 7 (1.9%) | 7 (2.5%) |
| 35 to 64 Years | 37 (4.3%) | 38 (4.9%) |
| 65 to 74 Years | 0 (0.0%) | 10 (5.2%) |
| 75 Years and over | 30 (27.0%) | 44 (37.3%) |
Disability Class: Ambulatory Difficulty
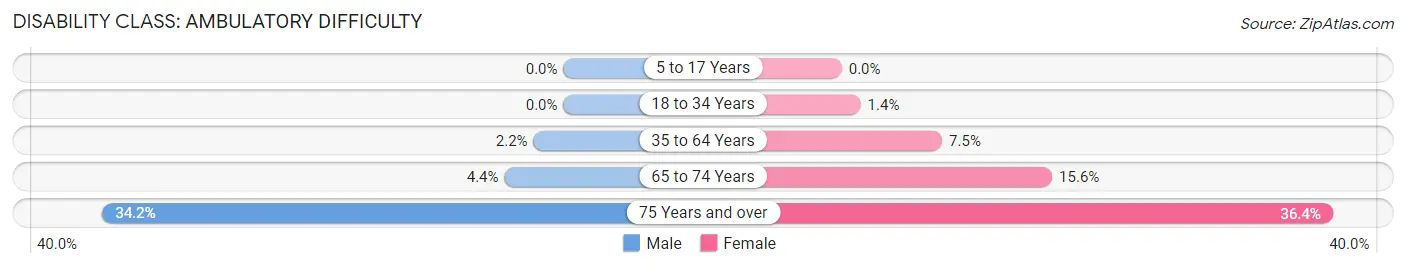
| Age Bracket | Male | Female |
| 5 to 17 Years | 0 (0.0%) | 0 (0.0%) |
| 18 to 34 Years | 0 (0.0%) | 4 (1.4%) |
| 35 to 64 Years | 19 (2.2%) | 58 (7.4%) |
| 65 to 74 Years | 7 (4.4%) | 30 (15.6%) |
| 75 Years and over | 38 (34.2%) | 43 (36.4%) |
Disability Class: Self-Care Difficulty
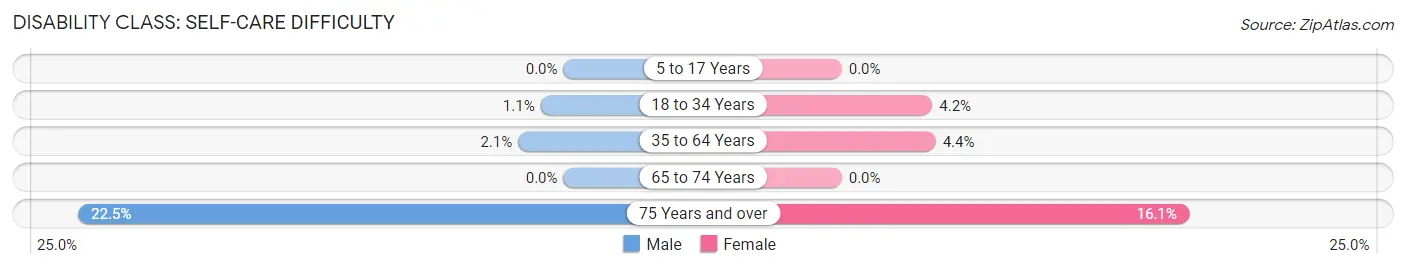
| Age Bracket | Male | Female |
| 5 to 17 Years | 0 (0.0%) | 0 (0.0%) |
| 18 to 34 Years | 4 (1.1%) | 12 (4.2%) |
| 35 to 64 Years | 18 (2.1%) | 34 (4.4%) |
| 65 to 74 Years | 0 (0.0%) | 0 (0.0%) |
| 75 Years and over | 25 (22.5%) | 19 (16.1%) |
Technology Access in Butte
Computing Device Access in Butte
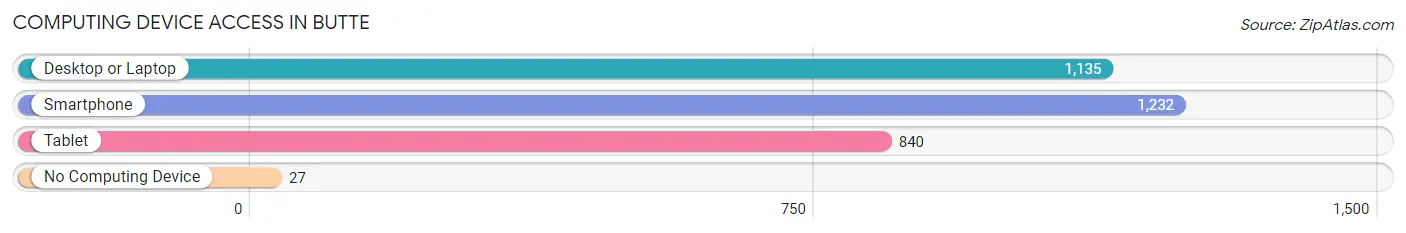
| Device Type | # Households | % Households |
| Desktop or Laptop | 1,135 | 85.4% |
| Smartphone | 1,232 | 92.7% |
| Tablet | 840 | 63.2% |
| No Computing Device | 27 | 2.0% |
| Total | 1,329 | 100.0% |
Internet Access in Butte
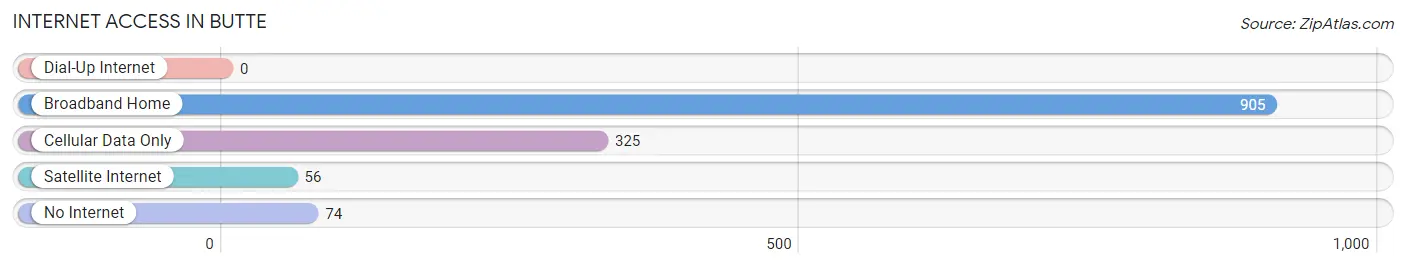
| Internet Type | # Households | % Households |
| Dial-Up Internet | 0 | 0.0% |
| Broadband Home | 905 | 68.1% |
| Cellular Data Only | 325 | 24.4% |
| Satellite Internet | 56 | 4.2% |
| No Internet | 74 | 5.6% |
| Total | 1,329 | 100.0% |
Butte Summary
Butte, Alaska is a small city located in the Matanuska-Susitna Borough of Alaska. It is situated on the south bank of the Susitna River, about 40 miles northeast of Anchorage. The city has a population of approximately 1,000 people and is the largest city in the Matanuska-Susitna Borough.
History
Butte, Alaska was founded in the early 1900s by gold miners who were drawn to the area by the discovery of gold in the Susitna River. The miners named the town after the nearby Butte Creek, which was named after the nearby mountain. The town quickly grew and by 1910, it had a population of over 500 people.
The town was incorporated in 1912 and was the first incorporated city in the Matanuska-Susitna Borough. In the early years, the town was a bustling center of commerce and industry, with several stores, a hotel, a bank, and a post office.
The town experienced a decline in the 1920s and 1930s due to the Great Depression and the decline of the gold mining industry. However, the town experienced a resurgence in the 1940s and 1950s due to the construction of the Alaska Railroad and the discovery of oil in the area.
Geography
Butte, Alaska is located in the Matanuska-Susitna Borough of Alaska. It is situated on the south bank of the Susitna River, about 40 miles northeast of Anchorage. The city is surrounded by mountains and is located in a valley. The climate in Butte is generally mild, with temperatures ranging from the mid-30s in the winter to the mid-60s in the summer.
Economy
Butte, Alaska is a small city with a population of approximately 1,000 people. The economy of the city is largely based on tourism, with many visitors coming to the area to take advantage of the nearby mountains and rivers. The city also has a small manufacturing sector, with several small businesses producing items such as furniture and clothing.
Demographics
As of the 2010 census, the population of Butte, Alaska was 1,000 people. The racial makeup of the city was 95.2% White, 0.7% Native American, 0.3% Asian, 0.2% Pacific Islander, 0.1% from other races, and 3.5% from two or more races. The median household income in Butte was $50,000, and the median family income was $54,000. The per capita income in Butte was $20,000.
Common Questions
What is Per Capita Income in Butte?
Per Capita income in Butte is $43,498.
What is the Median Family Income in Butte?
Median Family Income in Butte is $110,227.
What is the Median Household income in Butte?
Median Household Income in Butte is $102,171.
What is Income or Wage Gap in Butte?
Income or Wage Gap in Butte is 26.4%.
Women in Butte earn 73.6 cents for every dollar earned by a man.
What is Inequality or Gini Index in Butte?
Inequality or Gini Index in Butte is 0.36.
What is the Total Population of Butte?
Total Population of Butte is 3,752.
What is the Total Male Population of Butte?
Total Male Population of Butte is 1,954.
What is the Total Female Population of Butte?
Total Female Population of Butte is 1,798.
What is the Ratio of Males per 100 Females in Butte?
There are 108.68 Males per 100 Females in Butte.
What is the Ratio of Females per 100 Males in Butte?
There are 92.02 Females per 100 Males in Butte.
What is the Median Population Age in Butte?
Median Population Age in Butte is 42.3 Years.
What is the Average Family Size in Butte
Average Family Size in Butte is 3.1 People.
What is the Average Household Size in Butte
Average Household Size in Butte is 2.8 People.
How Large is the Labor Force in Butte?
There are 1,929 People in the Labor Forcein in Butte.
What is the Percentage of People in the Labor Force in Butte?
64.4% of People are in the Labor Force in Butte.
What is the Unemployment Rate in Butte?
Unemployment Rate in Butte is 4.4%.