Dover, ID Map & Demographics
Dover Map
Dover Overview
$45,698
PER CAPITA INCOME
$109,688
AVG FAMILY INCOME
$90,875
AVG HOUSEHOLD INCOME
53.2%
WAGE / INCOME GAP [ % ]
46.8¢/ $1
WAGE / INCOME GAP [ $ ]
0.48
INEQUALITY / GINI INDEX
720
TOTAL POPULATION
306
MALE POPULATION
414
FEMALE POPULATION
73.91
MALES / 100 FEMALES
135.29
FEMALES / 100 MALES
47.6
MEDIAN AGE
3.2
AVG FAMILY SIZE
2.8
AVG HOUSEHOLD SIZE
243
LABOR FORCE [ PEOPLE ]
44.2%
PERCENT IN LABOR FORCE
2.1%
UNEMPLOYMENT RATE
Dover Zip Codes
Dover Area Codes
Income in Dover
Income Overview in Dover
Per Capita Income in Dover is $45,698, while median incomes of families and households are $109,688 and $90,875 respectively.
| Characteristic | Number | Measure |
| Per Capita Income | 720 | $45,698 |
| Median Family Income | 205 | $109,688 |
| Mean Family Income | 205 | $147,022 |
| Median Household Income | 257 | $90,875 |
| Mean Household Income | 257 | $121,607 |
| Income Deficit | 205 | $0 |
| Wage / Income Gap (%) | 720 | 53.17% |
| Wage / Income Gap ($) | 720 | 46.83¢ per $1 |
| Gini / Inequality Index | 720 | 0.48 |
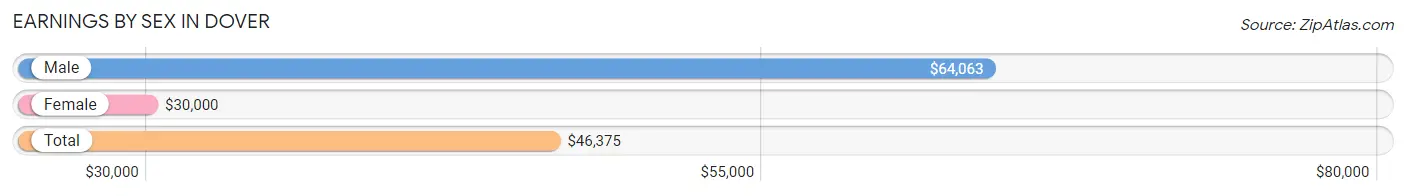
Earnings by Sex in Dover
Average Earnings in Dover are $46,375, $64,063 for men and $30,000 for women, a difference of 53.2%.
| Sex | Number | Average Earnings |
| Male | 145 (54.3%) | $64,063 |
| Female | 122 (45.7%) | $30,000 |
| Total | 267 (100.0%) | $46,375 |
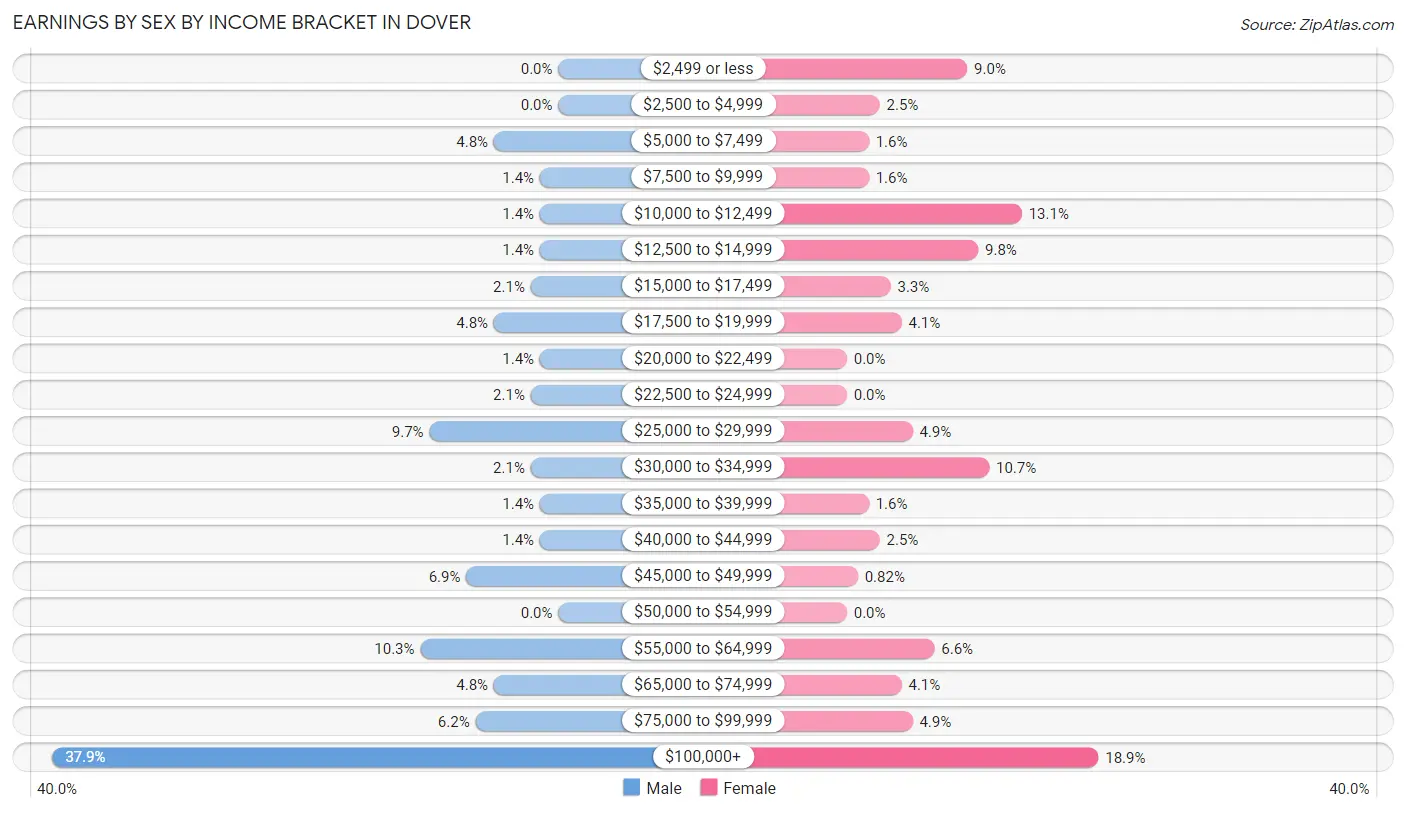
Earnings by Sex by Income Bracket in Dover
The most common earnings brackets in Dover are $100,000+ for men (55 | 37.9%) and $100,000+ for women (23 | 18.9%).
| Income | Male | Female |
| $2,499 or less | 0 (0.0%) | 11 (9.0%) |
| $2,500 to $4,999 | 0 (0.0%) | 3 (2.5%) |
| $5,000 to $7,499 | 7 (4.8%) | 2 (1.6%) |
| $7,500 to $9,999 | 2 (1.4%) | 2 (1.6%) |
| $10,000 to $12,499 | 2 (1.4%) | 16 (13.1%) |
| $12,500 to $14,999 | 2 (1.4%) | 12 (9.8%) |
| $15,000 to $17,499 | 3 (2.1%) | 4 (3.3%) |
| $17,500 to $19,999 | 7 (4.8%) | 5 (4.1%) |
| $20,000 to $22,499 | 2 (1.4%) | 0 (0.0%) |
| $22,500 to $24,999 | 3 (2.1%) | 0 (0.0%) |
| $25,000 to $29,999 | 14 (9.7%) | 6 (4.9%) |
| $30,000 to $34,999 | 3 (2.1%) | 13 (10.7%) |
| $35,000 to $39,999 | 2 (1.4%) | 2 (1.6%) |
| $40,000 to $44,999 | 2 (1.4%) | 3 (2.5%) |
| $45,000 to $49,999 | 10 (6.9%) | 1 (0.8%) |
| $50,000 to $54,999 | 0 (0.0%) | 0 (0.0%) |
| $55,000 to $64,999 | 15 (10.3%) | 8 (6.6%) |
| $65,000 to $74,999 | 7 (4.8%) | 5 (4.1%) |
| $75,000 to $99,999 | 9 (6.2%) | 6 (4.9%) |
| $100,000+ | 55 (37.9%) | 23 (18.9%) |
| Total | 145 (100.0%) | 122 (100.0%) |
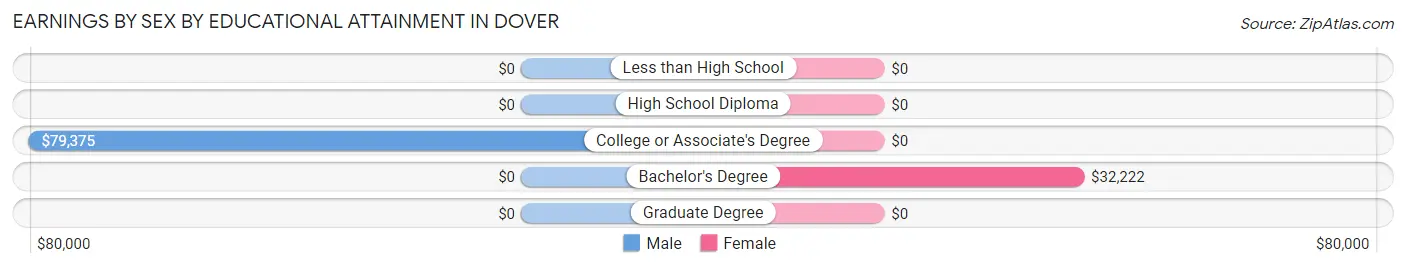
Earnings by Sex by Educational Attainment in Dover
Average earnings in Dover are $78,125 for men and $32,813 for women, a difference of 58.0%. Men with an educational attainment of college or associate's degree enjoy the highest average annual earnings of $79,375, while those with college or associate's degree education earn the least with $79,375. Women with an educational attainment of bachelor's degree earn the most with the average annual earnings of $32,222, while those with bachelor's degree education have the smallest earnings of $32,222.
| Educational Attainment | Male Income | Female Income |
| Less than High School | - | - |
| High School Diploma | - | - |
| College or Associate's Degree | $79,375 | $0 |
| Bachelor's Degree | - | - |
| Graduate Degree | - | - |
| Total | $78,125 | $32,813 |
Family Income in Dover
Family Income Brackets in Dover
According to the Dover family income data, there are 43 families falling into the $150,000 to $199,999 income range, which is the most common income bracket and makes up 21.0% of all families.
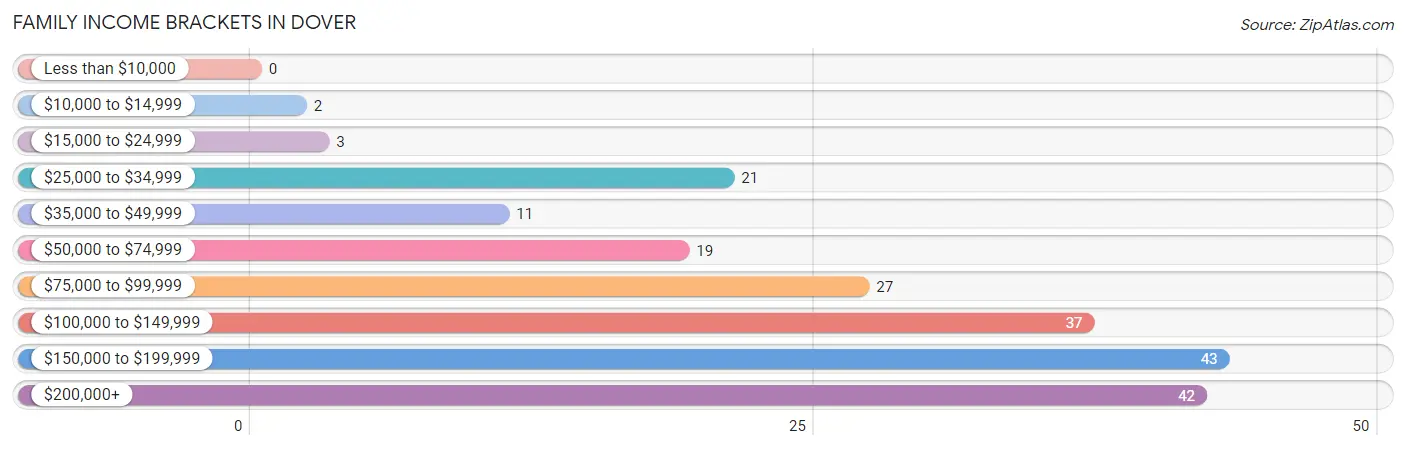
| Income Bracket | # Families | % Families |
| Less than $10,000 | 0 | 0.0% |
| $10,000 to $14,999 | 2 | 1.0% |
| $15,000 to $24,999 | 3 | 1.5% |
| $25,000 to $34,999 | 21 | 10.2% |
| $35,000 to $49,999 | 11 | 5.4% |
| $50,000 to $74,999 | 19 | 9.3% |
| $75,000 to $99,999 | 27 | 13.2% |
| $100,000 to $149,999 | 37 | 18.0% |
| $150,000 to $199,999 | 43 | 21.0% |
| $200,000+ | 42 | 20.5% |
Family Income by Famaliy Size in Dover
3-person families (25 | 12.2%) account for the highest median family income in Dover with $180,625 per family, while 3-person families (25 | 12.2%) have the highest median income of $60,208 per family member.
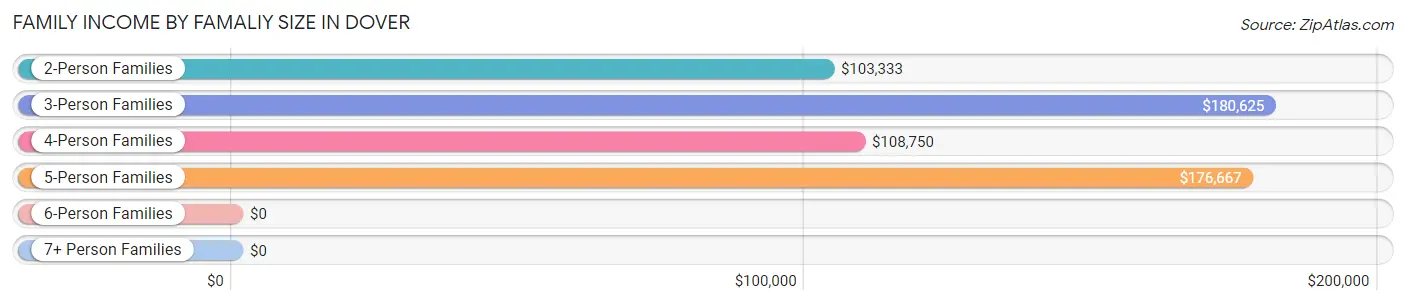
| Income Bracket | # Families | Median Income |
| 2-Person Families | 122 (59.5%) | $103,333 |
| 3-Person Families | 25 (12.2%) | $180,625 |
| 4-Person Families | 33 (16.1%) | $108,750 |
| 5-Person Families | 18 (8.8%) | $176,667 |
| 6-Person Families | 5 (2.4%) | $0 |
| 7+ Person Families | 2 (1.0%) | $0 |
| Total | 205 (100.0%) | $109,688 |
Family Income by Number of Earners in Dover
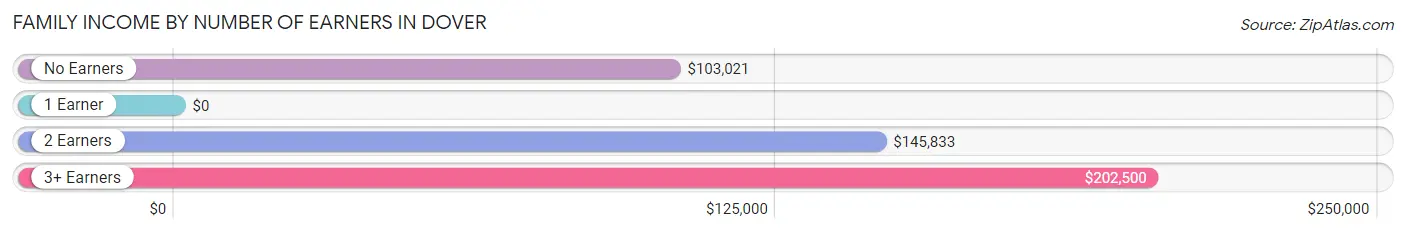
| Number of Earners | # Families | Median Income |
| No Earners | 79 (38.5%) | $103,021 |
| 1 Earner | 42 (20.5%) | $0 |
| 2 Earners | 72 (35.1%) | $145,833 |
| 3+ Earners | 12 (5.9%) | $202,500 |
| Total | 205 (100.0%) | $109,688 |
Household Income in Dover
Household Income Brackets in Dover
With 46 households falling in the category, the $150,000 to $199,999 income range is the most frequent in Dover, accounting for 17.9% of all households. In contrast, only 2 households (0.8%) fall into the $10,000 to $14,999 income bracket, making it the least populous group.
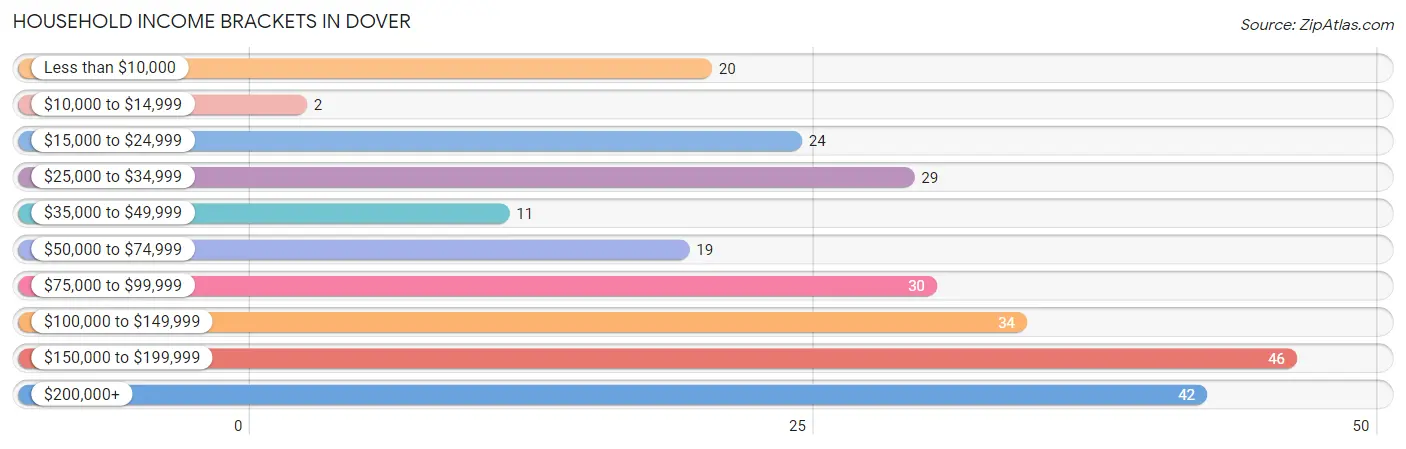
| Income Bracket | # Households | % Households |
| Less than $10,000 | 20 | 7.8% |
| $10,000 to $14,999 | 2 | 0.8% |
| $15,000 to $24,999 | 24 | 9.3% |
| $25,000 to $34,999 | 29 | 11.3% |
| $35,000 to $49,999 | 11 | 4.3% |
| $50,000 to $74,999 | 19 | 7.4% |
| $75,000 to $99,999 | 30 | 11.7% |
| $100,000 to $149,999 | 34 | 13.2% |
| $150,000 to $199,999 | 46 | 17.9% |
| $200,000+ | 42 | 16.3% |
Household Income by Householder Age in Dover
The median household income in Dover is $90,875, with the highest median household income of $147,083 found in the 45 to 64 years age bracket for the primary householder. A total of 73 households (28.4%) fall into this category. Meanwhile, the 15 to 24 years age bracket for the primary householder has the lowest median household income of $0, with 4 households (1.6%) in this group.
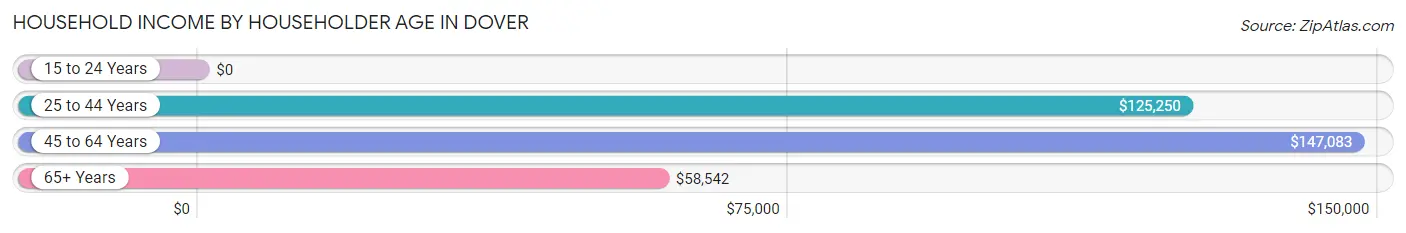
| Income Bracket | # Households | Median Income |
| 15 to 24 Years | 4 (1.6%) | $0 |
| 25 to 44 Years | 51 (19.8%) | $125,250 |
| 45 to 64 Years | 73 (28.4%) | $147,083 |
| 65+ Years | 129 (50.2%) | $58,542 |
| Total | 257 (100.0%) | $90,875 |
Poverty in Dover
Income Below Poverty by Sex and Age in Dover
With 1.3% poverty level for males and 7.0% for females among the residents of Dover, 18 to 24 year old males and 25 to 34 year old females are the most vulnerable to poverty, with 2 males (9.5%) and 7 females (31.8%) in their respective age groups living below the poverty level.
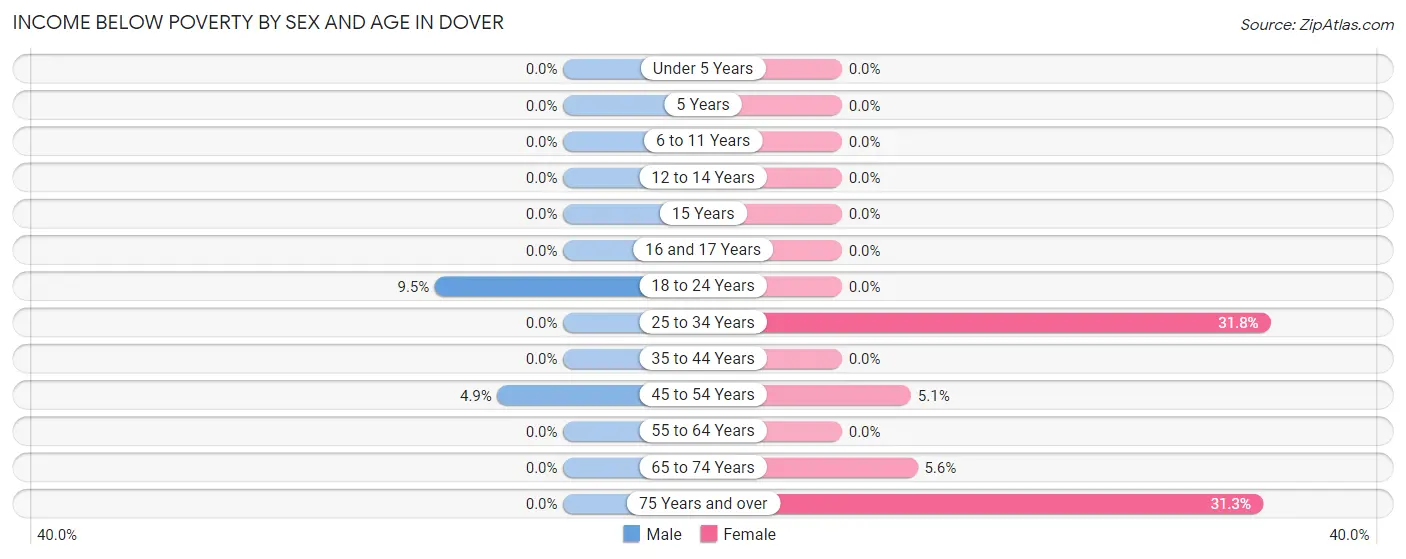
| Age Bracket | Male | Female |
| Under 5 Years | 0 (0.0%) | 0 (0.0%) |
| 5 Years | 0 (0.0%) | 0 (0.0%) |
| 6 to 11 Years | 0 (0.0%) | 0 (0.0%) |
| 12 to 14 Years | 0 (0.0%) | 0 (0.0%) |
| 15 Years | 0 (0.0%) | 0 (0.0%) |
| 16 and 17 Years | 0 (0.0%) | 0 (0.0%) |
| 18 to 24 Years | 2 (9.5%) | 0 (0.0%) |
| 25 to 34 Years | 0 (0.0%) | 7 (31.8%) |
| 35 to 44 Years | 0 (0.0%) | 0 (0.0%) |
| 45 to 54 Years | 2 (4.9%) | 2 (5.1%) |
| 55 to 64 Years | 0 (0.0%) | 0 (0.0%) |
| 65 to 74 Years | 0 (0.0%) | 5 (5.6%) |
| 75 Years and over | 0 (0.0%) | 15 (31.2%) |
| Total | 4 (1.3%) | 29 (7.0%) |
Income Above Poverty by Sex and Age in Dover
According to the poverty statistics in Dover, males aged under 5 years and females aged under 5 years are the age groups that are most secure financially, with 100.0% of males and 100.0% of females in these age groups living above the poverty line.
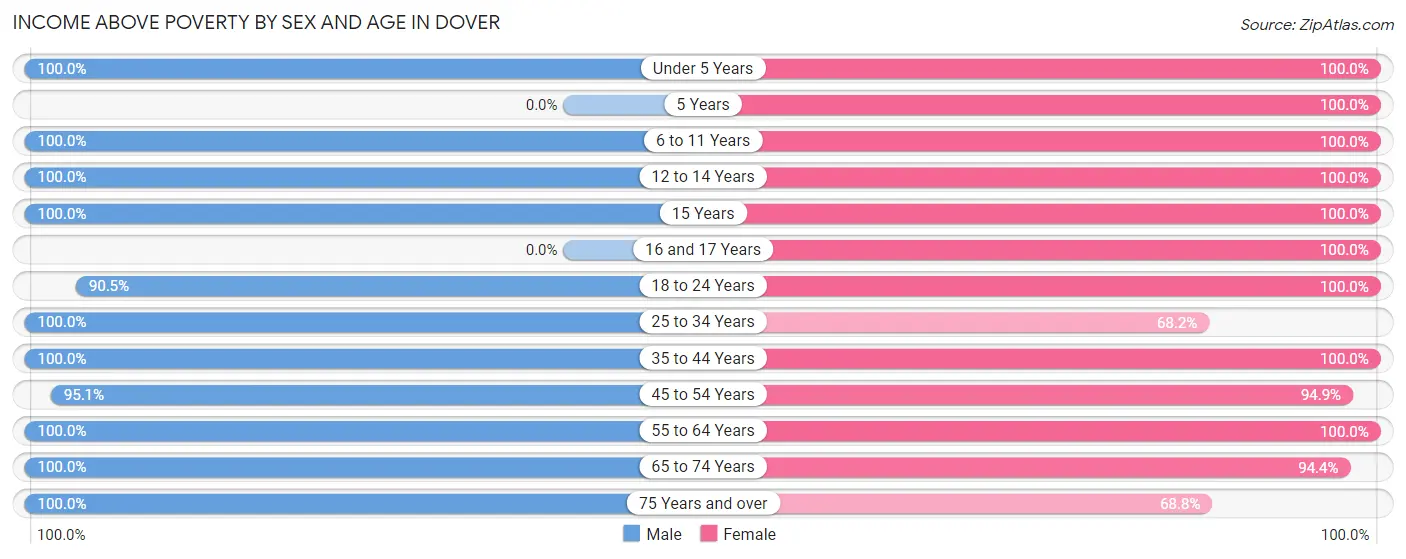
| Age Bracket | Male | Female |
| Under 5 Years | 18 (100.0%) | 31 (100.0%) |
| 5 Years | 0 (0.0%) | 6 (100.0%) |
| 6 to 11 Years | 25 (100.0%) | 44 (100.0%) |
| 12 to 14 Years | 12 (100.0%) | 25 (100.0%) |
| 15 Years | 7 (100.0%) | 2 (100.0%) |
| 16 and 17 Years | 0 (0.0%) | 12 (100.0%) |
| 18 to 24 Years | 19 (90.5%) | 19 (100.0%) |
| 25 to 34 Years | 7 (100.0%) | 15 (68.2%) |
| 35 to 44 Years | 48 (100.0%) | 35 (100.0%) |
| 45 to 54 Years | 39 (95.1%) | 37 (94.9%) |
| 55 to 64 Years | 37 (100.0%) | 42 (100.0%) |
| 65 to 74 Years | 21 (100.0%) | 84 (94.4%) |
| 75 Years and over | 69 (100.0%) | 33 (68.8%) |
| Total | 302 (98.7%) | 385 (93.0%) |
Income Below Poverty Among Married-Couple Families in Dover
The poverty statistics for married-couple families in Dover show that 1.1% or 2 of the total 185 families live below the poverty line. Families with no children have the highest poverty rate of 1.7%, comprising of 2 families. On the other hand, families with 1 or 2 children have the lowest poverty rate of 0.0%, which includes 0 families.
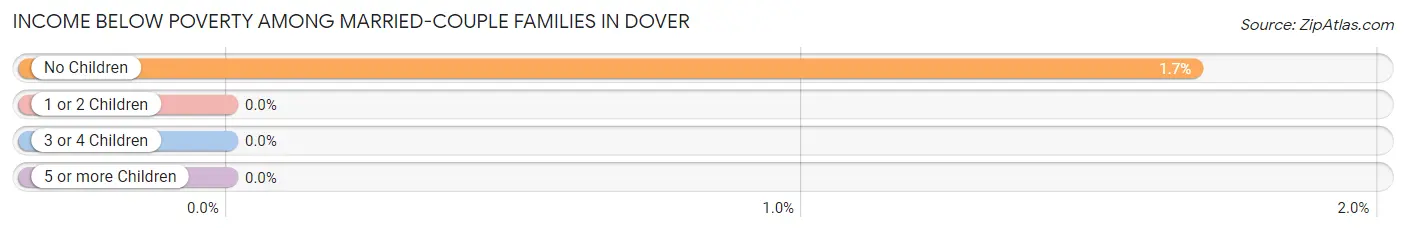
| Children | Above Poverty | Below Poverty |
| No Children | 117 (98.3%) | 2 (1.7%) |
| 1 or 2 Children | 41 (100.0%) | 0 (0.0%) |
| 3 or 4 Children | 25 (100.0%) | 0 (0.0%) |
| 5 or more Children | 0 (0.0%) | 0 (0.0%) |
| Total | 183 (98.9%) | 2 (1.1%) |
Income Below Poverty Among Single-Parent Households in Dover
| Children | Single Father | Single Mother |
| No Children | 0 (0.0%) | 0 (0.0%) |
| 1 or 2 Children | 0 (0.0%) | 0 (0.0%) |
| 3 or 4 Children | 0 (0.0%) | 0 (0.0%) |
| 5 or more Children | 0 (0.0%) | 0 (0.0%) |
| Total | 0 (0.0%) | 0 (0.0%) |
Income Below Poverty Among Married-Couple vs Single-Parent Households in Dover
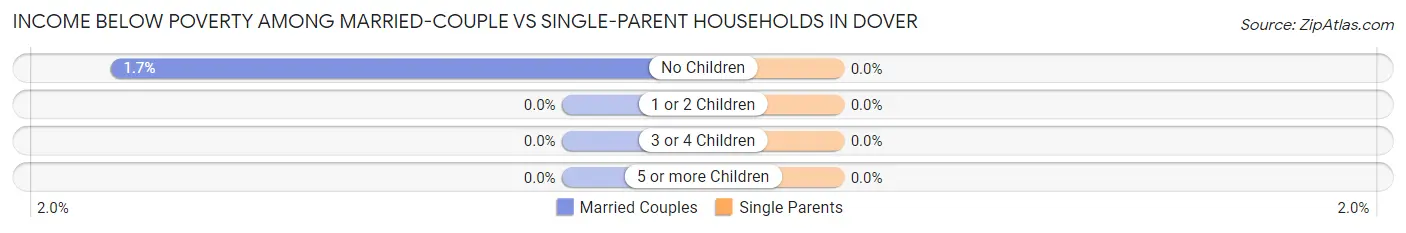
| Children | Married-Couple Families | Single-Parent Households |
| No Children | 2 (1.7%) | 0 (0.0%) |
| 1 or 2 Children | 0 (0.0%) | 0 (0.0%) |
| 3 or 4 Children | 0 (0.0%) | 0 (0.0%) |
| 5 or more Children | 0 (0.0%) | 0 (0.0%) |
| Total | 2 (1.1%) | 0 (0.0%) |
Race in Dover
The most populous races in Dover are White / Caucasian (634 | 88.1%), Two or more Races (66 | 9.2%), and Hispanic or Latino (31 | 4.3%).
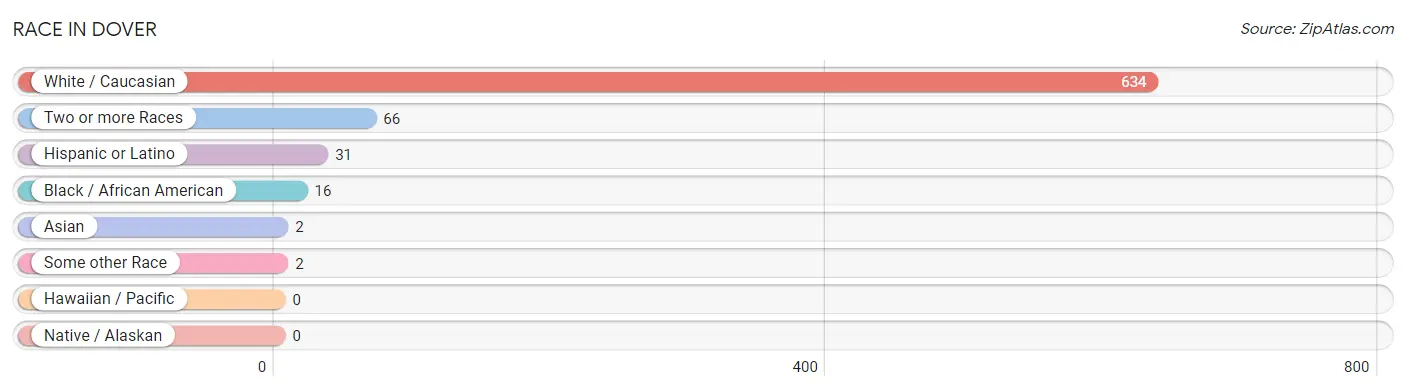
| Race | # Population | % Population |
| Asian | 2 | 0.3% |
| Black / African American | 16 | 2.2% |
| Hawaiian / Pacific | 0 | 0.0% |
| Hispanic or Latino | 31 | 4.3% |
| Native / Alaskan | 0 | 0.0% |
| White / Caucasian | 634 | 88.1% |
| Two or more Races | 66 | 9.2% |
| Some other Race | 2 | 0.3% |
| Total | 720 | 100.0% |
Ancestry in Dover
The most populous ancestries reported in Dover are English (149 | 20.7%), German (132 | 18.3%), Irish (78 | 10.8%), French (73 | 10.1%), and Bhutanese (41 | 5.7%), together accounting for 65.7% of all Dover residents.
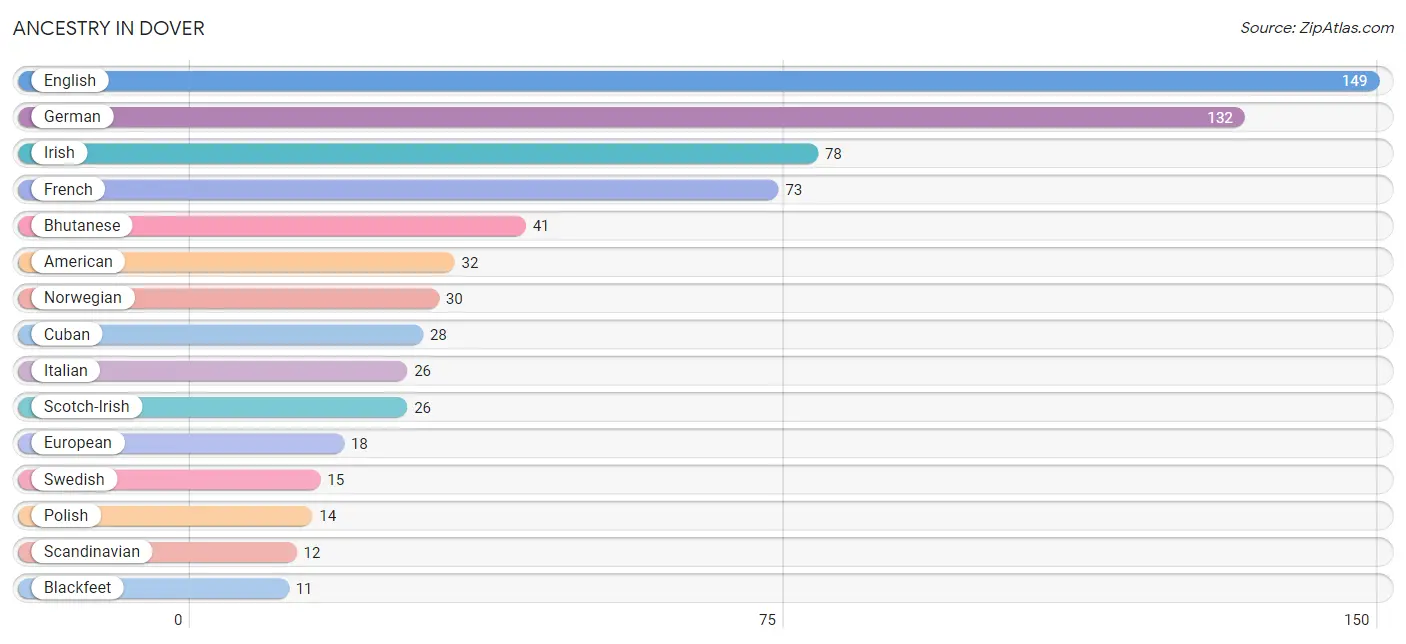
| Ancestry | # Population | % Population |
| American | 32 | 4.4% |
| Australian | 2 | 0.3% |
| Austrian | 5 | 0.7% |
| Bhutanese | 41 | 5.7% |
| Blackfeet | 11 | 1.5% |
| British | 6 | 0.8% |
| Cuban | 28 | 3.9% |
| Czech | 6 | 0.8% |
| Danish | 2 | 0.3% |
| Dutch | 2 | 0.3% |
| English | 149 | 20.7% |
| Ethiopian | 9 | 1.3% |
| European | 18 | 2.5% |
| Finnish | 11 | 1.5% |
| French | 73 | 10.1% |
| German | 132 | 18.3% |
| Greek | 4 | 0.6% |
| Hungarian | 1 | 0.1% |
| Inupiat | 5 | 0.7% |
| Irish | 78 | 10.8% |
| Italian | 26 | 3.6% |
| Lithuanian | 4 | 0.6% |
| Mexican | 3 | 0.4% |
| Norwegian | 30 | 4.2% |
| Polish | 14 | 1.9% |
| Portuguese | 9 | 1.3% |
| Romanian | 8 | 1.1% |
| Russian | 6 | 0.8% |
| Scandinavian | 12 | 1.7% |
| Scotch-Irish | 26 | 3.6% |
| Scottish | 4 | 0.6% |
| Slavic | 5 | 0.7% |
| Subsaharan African | 9 | 1.3% |
| Swedish | 15 | 2.1% |
| Tlingit-Haida | 11 | 1.5% |
| Ukrainian | 2 | 0.3% | View All 36 Rows |
Immigrants in Dover
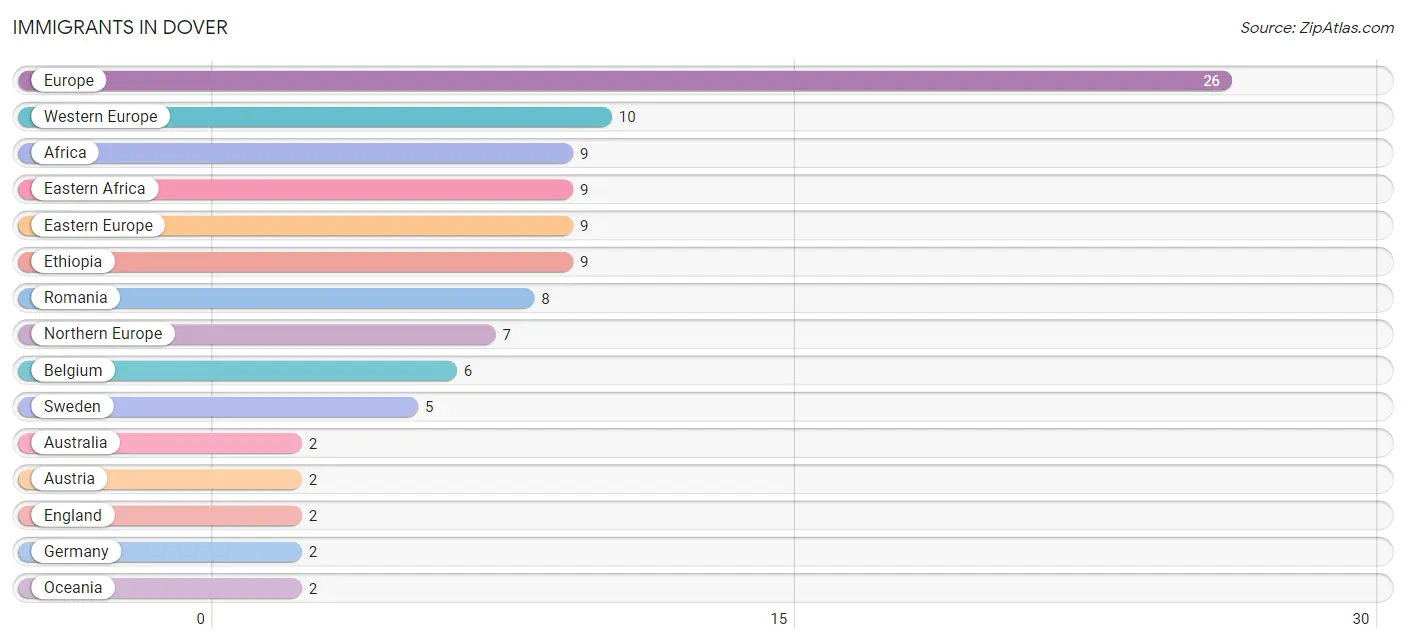
The most numerous immigrant groups reported in Dover came from Europe (26 | 3.6%), Western Europe (10 | 1.4%), Africa (9 | 1.3%), Eastern Africa (9 | 1.3%), and Eastern Europe (9 | 1.3%), together accounting for 8.7% of all Dover residents.
| Immigration Origin | # Population | % Population |
| Africa | 9 | 1.3% |
| Australia | 2 | 0.3% |
| Austria | 2 | 0.3% |
| Belgium | 6 | 0.8% |
| Eastern Africa | 9 | 1.3% |
| Eastern Europe | 9 | 1.3% |
| England | 2 | 0.3% |
| Ethiopia | 9 | 1.3% |
| Europe | 26 | 3.6% |
| Germany | 2 | 0.3% |
| Northern Europe | 7 | 1.0% |
| Oceania | 2 | 0.3% |
| Romania | 8 | 1.1% |
| Russia | 1 | 0.1% |
| Sweden | 5 | 0.7% |
| Western Europe | 10 | 1.4% | View All 16 Rows |
Sex and Age in Dover
Sex and Age in Dover
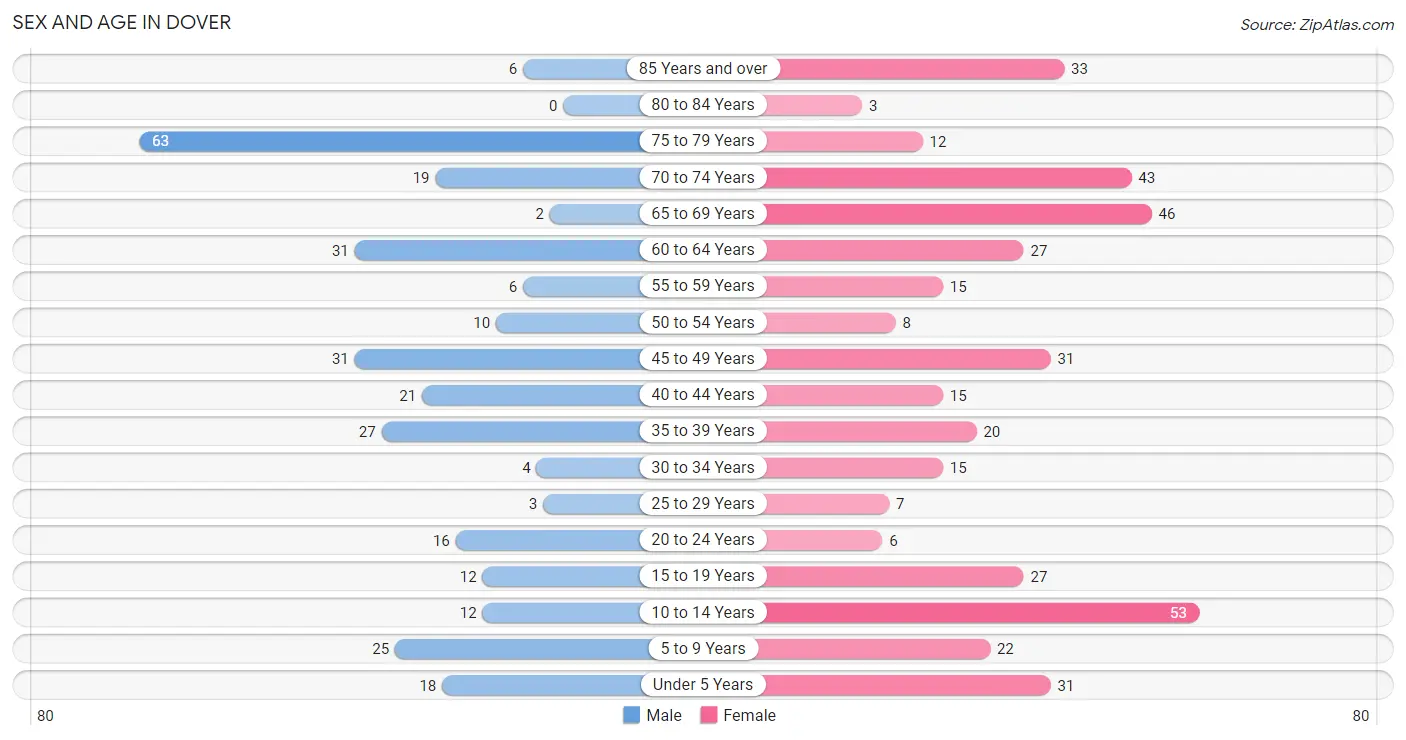
The most populous age groups in Dover are 75 to 79 Years (63 | 20.6%) for men and 10 to 14 Years (53 | 12.8%) for women.
| Age Bracket | Male | Female |
| Under 5 Years | 18 (5.9%) | 31 (7.5%) |
| 5 to 9 Years | 25 (8.2%) | 22 (5.3%) |
| 10 to 14 Years | 12 (3.9%) | 53 (12.8%) |
| 15 to 19 Years | 12 (3.9%) | 27 (6.5%) |
| 20 to 24 Years | 16 (5.2%) | 6 (1.5%) |
| 25 to 29 Years | 3 (1.0%) | 7 (1.7%) |
| 30 to 34 Years | 4 (1.3%) | 15 (3.6%) |
| 35 to 39 Years | 27 (8.8%) | 20 (4.8%) |
| 40 to 44 Years | 21 (6.9%) | 15 (3.6%) |
| 45 to 49 Years | 31 (10.1%) | 31 (7.5%) |
| 50 to 54 Years | 10 (3.3%) | 8 (1.9%) |
| 55 to 59 Years | 6 (2.0%) | 15 (3.6%) |
| 60 to 64 Years | 31 (10.1%) | 27 (6.5%) |
| 65 to 69 Years | 2 (0.6%) | 46 (11.1%) |
| 70 to 74 Years | 19 (6.2%) | 43 (10.4%) |
| 75 to 79 Years | 63 (20.6%) | 12 (2.9%) |
| 80 to 84 Years | 0 (0.0%) | 3 (0.7%) |
| 85 Years and over | 6 (2.0%) | 33 (8.0%) |
| Total | 306 (100.0%) | 414 (100.0%) |
Families and Households in Dover
Median Family Size in Dover
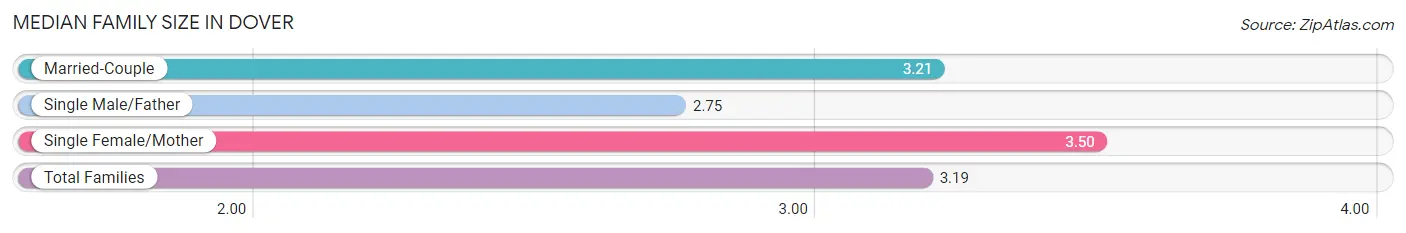
The median family size in Dover is 3.19 persons per family, with single female/mother families (8 | 3.9%) accounting for the largest median family size of 3.5 persons per family. On the other hand, single male/father families (12 | 5.9%) represent the smallest median family size with 2.75 persons per family.
| Family Type | # Families | Family Size |
| Married-Couple | 185 (90.2%) | 3.21 |
| Single Male/Father | 12 (5.9%) | 2.75 |
| Single Female/Mother | 8 (3.9%) | 3.50 |
| Total Families | 205 (100.0%) | 3.19 |
Median Household Size in Dover
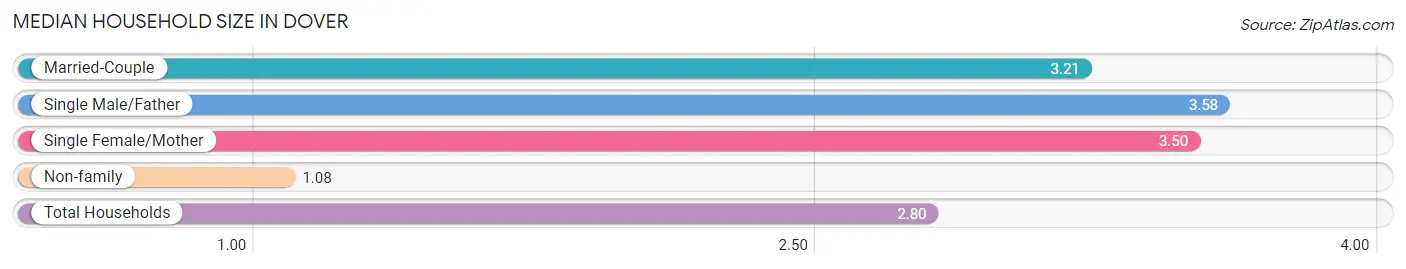
The median household size in Dover is 2.80 persons per household, with single male/father households (12 | 4.7%) accounting for the largest median household size of 3.58 persons per household. non-family households (52 | 20.2%) represent the smallest median household size with 1.08 persons per household.
| Household Type | # Households | Household Size |
| Married-Couple | 185 (72.0%) | 3.21 |
| Single Male/Father | 12 (4.7%) | 3.58 |
| Single Female/Mother | 8 (3.1%) | 3.50 |
| Non-family | 52 (20.2%) | 1.08 |
| Total Households | 257 (100.0%) | 2.80 |
Household Size by Marriage Status in Dover
Out of a total of 257 households in Dover, 205 (79.8%) are family households, while 52 (20.2%) are nonfamily households. The most numerous type of family households are 2-person households, comprising 120, and the most common type of nonfamily households are 1-person households, comprising 49.
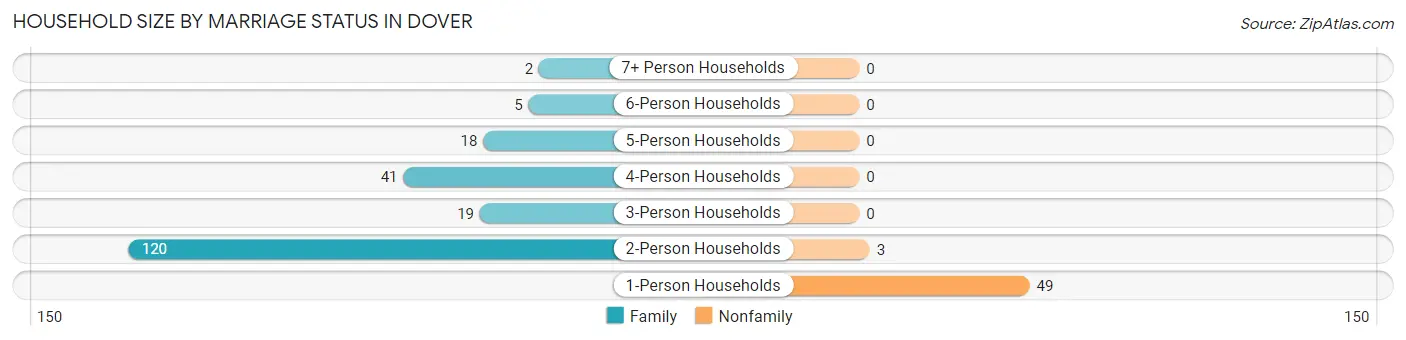
| Household Size | Family Households | Nonfamily Households |
| 1-Person Households | - | 49 (19.1%) |
| 2-Person Households | 120 (46.7%) | 3 (1.2%) |
| 3-Person Households | 19 (7.4%) | 0 (0.0%) |
| 4-Person Households | 41 (16.0%) | 0 (0.0%) |
| 5-Person Households | 18 (7.0%) | 0 (0.0%) |
| 6-Person Households | 5 (1.9%) | 0 (0.0%) |
| 7+ Person Households | 2 (0.8%) | 0 (0.0%) |
| Total | 205 (79.8%) | 52 (20.2%) |
Female Fertility in Dover
Fertility by Age in Dover
| Age Bracket | Women with Births | Births / 1,000 Women |
| 15 to 19 years | 0 (0.0%) | 0.0 |
| 20 to 34 years | 0 (0.0%) | 0.0 |
| 35 to 50 years | 0 (0.0%) | 0.0 |
| Total | 0 (0.0%) | 0.0 |
Fertility by Age by Marriage Status in Dover
| Age Bracket | Married | Unmarried |
| 15 to 19 years | 0 (0.0%) | 0 (0.0%) |
| 20 to 34 years | 0 (0.0%) | 0 (0.0%) |
| 35 to 50 years | 0 (0.0%) | 0 (0.0%) |
| Total | 0 (0.0%) | 0 (0.0%) |
Fertility by Education in Dover
| Educational Attainment | Women with Births | Births / 1,000 Women |
| Less than High School | 0 (0.0%) | 0.0 |
| High School Diploma | 0 (0.0%) | 0.0 |
| College or Associate's Degree | 0 (0.0%) | 0.0 |
| Bachelor's Degree | 0 (0.0%) | 0.0 |
| Graduate Degree | 0 (0.0%) | 0.0 |
| Total | 0 (0.0%) | 0.0 |
Fertility by Education by Marriage Status in Dover
| Educational Attainment | Married | Unmarried |
| Less than High School | 0 (0.0%) | 0 (0.0%) |
| High School Diploma | 0 (0.0%) | 0 (0.0%) |
| College or Associate's Degree | 0 (0.0%) | 0 (0.0%) |
| Bachelor's Degree | 0 (0.0%) | 0 (0.0%) |
| Graduate Degree | 0 (0.0%) | 0 (0.0%) |
| Total | 0 (0.0%) | 0 (0.0%) |
Employment Characteristics in Dover
Employment by Class of Employer in Dover
Among the 235 employed individuals in Dover, private company employees (122 | 51.9%), self-employed (not incorporated) (42 | 17.9%), and self-employed (incorporated) (36 | 15.3%) make up the most common classes of employment.
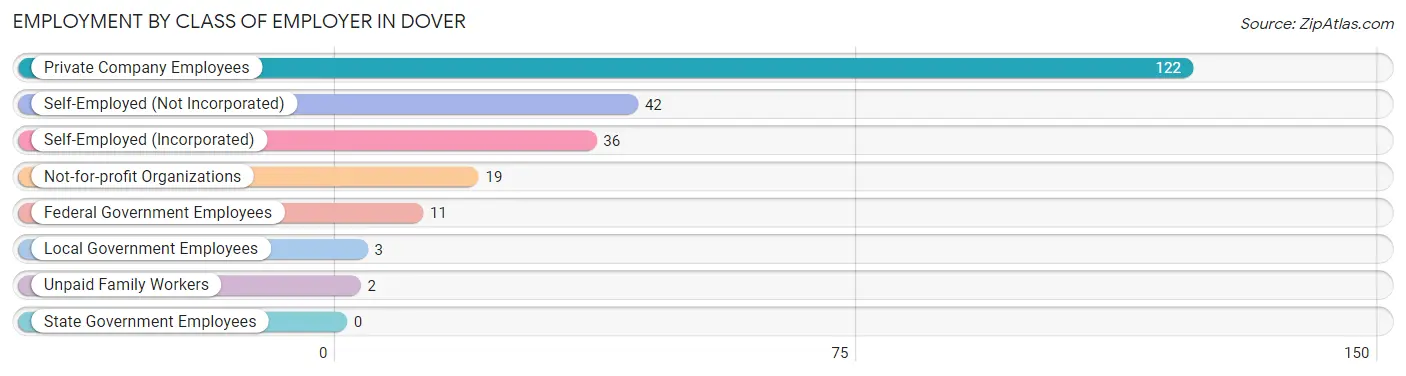
| Employer Class | # Employees | % Employees |
| Private Company Employees | 122 | 51.9% |
| Self-Employed (Incorporated) | 36 | 15.3% |
| Self-Employed (Not Incorporated) | 42 | 17.9% |
| Not-for-profit Organizations | 19 | 8.1% |
| Local Government Employees | 3 | 1.3% |
| State Government Employees | 0 | 0.0% |
| Federal Government Employees | 11 | 4.7% |
| Unpaid Family Workers | 2 | 0.9% |
| Total | 235 | 100.0% |
Employment Status by Age in Dover
According to the labor force statistics for Dover, out of the total population over 16 years of age (550), 44.2% or 243 individuals are in the labor force, with 2.1% or 5 of them unemployed. The age group with the highest labor force participation rate is 45 to 54 years, with 97.5% or 78 individuals in the labor force. Within the labor force, the 20 to 24 years age range has the highest percentage of unemployed individuals, with 11.1% or 2 of them being unemployed.
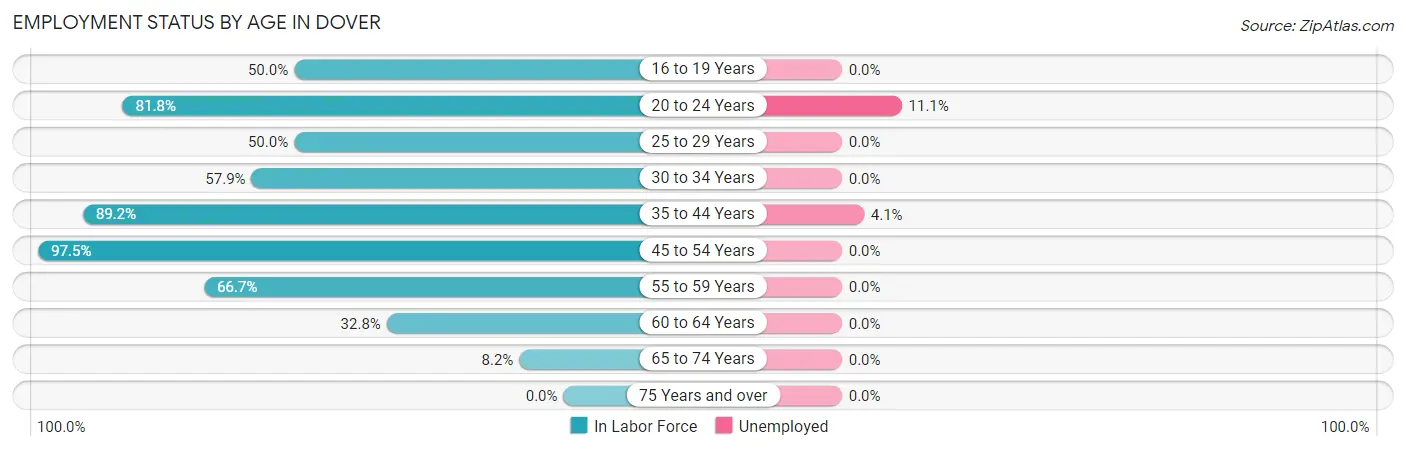
| Age Bracket | In Labor Force | Unemployed |
| 16 to 19 Years | 15 (50.0%) | 0 (0.0%) |
| 20 to 24 Years | 18 (81.8%) | 2 (11.1%) |
| 25 to 29 Years | 5 (50.0%) | 0 (0.0%) |
| 30 to 34 Years | 11 (57.9%) | 0 (0.0%) |
| 35 to 44 Years | 74 (89.2%) | 3 (4.1%) |
| 45 to 54 Years | 78 (97.5%) | 0 (0.0%) |
| 55 to 59 Years | 14 (66.7%) | 0 (0.0%) |
| 60 to 64 Years | 19 (32.8%) | 0 (0.0%) |
| 65 to 74 Years | 9 (8.2%) | 0 (0.0%) |
| 75 Years and over | 0 (0.0%) | 0 (0.0%) |
| Total | 243 (44.2%) | 5 (2.1%) |
Employment Status by Educational Attainment in Dover
According to labor force statistics for Dover, 74.2% of individuals (201) out of the total population between 25 and 64 years of age (271) are in the labor force, with 1.5% or 3 of them being unemployed. The group with the highest labor force participation rate are those with the educational attainment of less than high school, with 100.0% or 2 individuals in the labor force. Within the labor force, individuals with college / associate degree education have the highest percentage of unemployment, with 5.7% or 3 of them being unemployed.
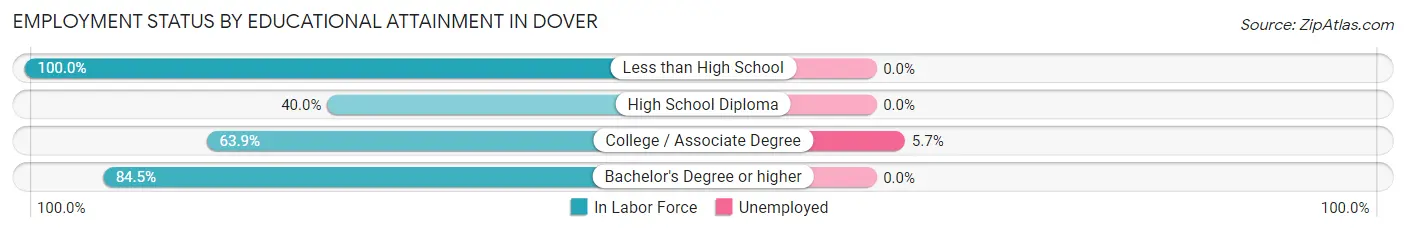
| Educational Attainment | In Labor Force | Unemployed |
| Less than High School | 2 (100.0%) | 0 (0.0%) |
| High School Diploma | 10 (40.0%) | 0 (0.0%) |
| College / Associate Degree | 53 (63.9%) | 5 (5.7%) |
| Bachelor's Degree or higher | 136 (84.5%) | 0 (0.0%) |
| Total | 201 (74.2%) | 4 (1.5%) |
Employment Occupations by Sex in Dover
Management, Business, Science and Arts Occupations
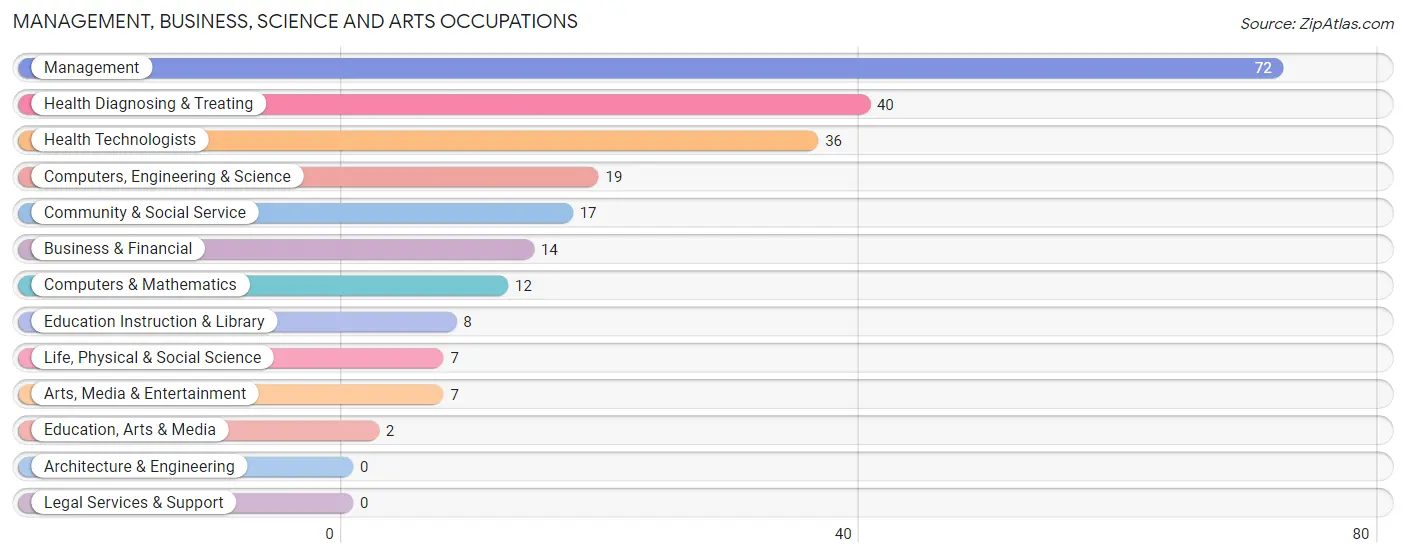
The most common Management, Business, Science and Arts occupations in Dover are Management (72 | 30.2%), Health Diagnosing & Treating (40 | 16.8%), Health Technologists (36 | 15.1%), Computers, Engineering & Science (19 | 8.0%), and Community & Social Service (17 | 7.1%).
Management, Business, Science and Arts Occupations by Sex
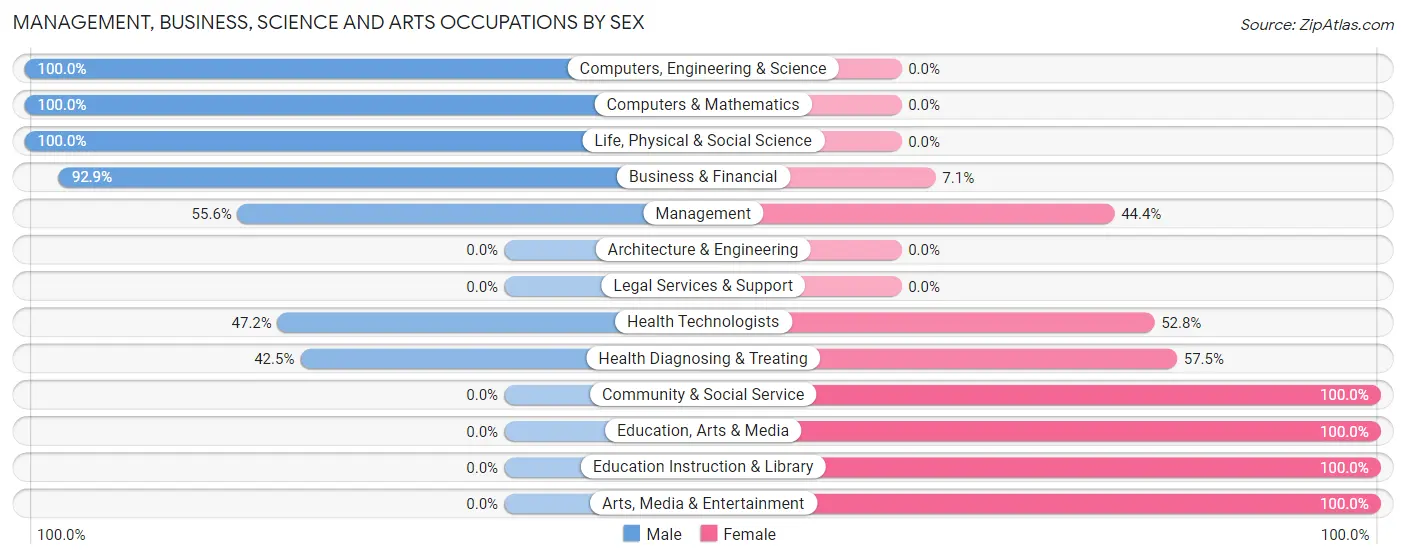
Within the Management, Business, Science and Arts occupations in Dover, the most male-oriented occupations are Computers, Engineering & Science (100.0%), Computers & Mathematics (100.0%), and Life, Physical & Social Science (100.0%), while the most female-oriented occupations are Community & Social Service (100.0%), Education, Arts & Media (100.0%), and Education Instruction & Library (100.0%).
| Occupation | Male | Female |
| Management | 40 (55.6%) | 32 (44.4%) |
| Business & Financial | 13 (92.9%) | 1 (7.1%) |
| Computers, Engineering & Science | 19 (100.0%) | 0 (0.0%) |
| Computers & Mathematics | 12 (100.0%) | 0 (0.0%) |
| Architecture & Engineering | 0 (0.0%) | 0 (0.0%) |
| Life, Physical & Social Science | 7 (100.0%) | 0 (0.0%) |
| Community & Social Service | 0 (0.0%) | 17 (100.0%) |
| Education, Arts & Media | 0 (0.0%) | 2 (100.0%) |
| Legal Services & Support | 0 (0.0%) | 0 (0.0%) |
| Education Instruction & Library | 0 (0.0%) | 8 (100.0%) |
| Arts, Media & Entertainment | 0 (0.0%) | 7 (100.0%) |
| Health Diagnosing & Treating | 17 (42.5%) | 23 (57.5%) |
| Health Technologists | 17 (47.2%) | 19 (52.8%) |
| Total (Category) | 89 (54.9%) | 73 (45.1%) |
| Total (Overall) | 127 (53.4%) | 111 (46.6%) |
Services Occupations
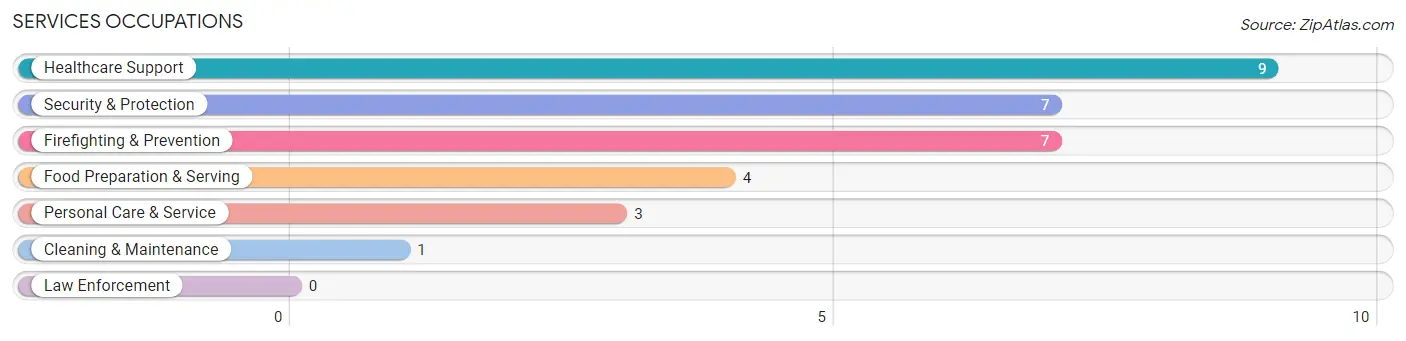
The most common Services occupations in Dover are Healthcare Support (9 | 3.8%), Security & Protection (7 | 2.9%), Firefighting & Prevention (7 | 2.9%), Food Preparation & Serving (4 | 1.7%), and Personal Care & Service (3 | 1.3%).
Services Occupations by Sex
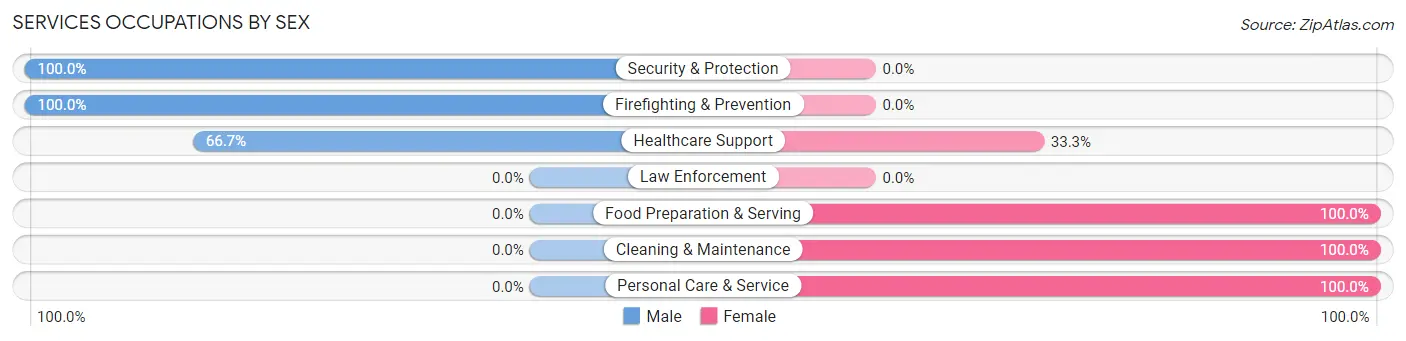
Within the Services occupations in Dover, the most male-oriented occupations are Security & Protection (100.0%), Firefighting & Prevention (100.0%), and Healthcare Support (66.7%), while the most female-oriented occupations are Food Preparation & Serving (100.0%), Cleaning & Maintenance (100.0%), and Personal Care & Service (100.0%).
| Occupation | Male | Female |
| Healthcare Support | 6 (66.7%) | 3 (33.3%) |
| Security & Protection | 7 (100.0%) | 0 (0.0%) |
| Firefighting & Prevention | 7 (100.0%) | 0 (0.0%) |
| Law Enforcement | 0 (0.0%) | 0 (0.0%) |
| Food Preparation & Serving | 0 (0.0%) | 4 (100.0%) |
| Cleaning & Maintenance | 0 (0.0%) | 1 (100.0%) |
| Personal Care & Service | 0 (0.0%) | 3 (100.0%) |
| Total (Category) | 13 (54.2%) | 11 (45.8%) |
| Total (Overall) | 127 (53.4%) | 111 (46.6%) |
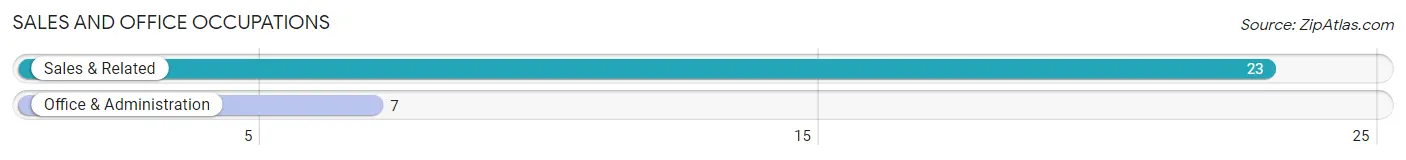
Sales and Office Occupations
The most common Sales and Office occupations in Dover are Sales & Related (23 | 9.7%), and Office & Administration (7 | 2.9%).
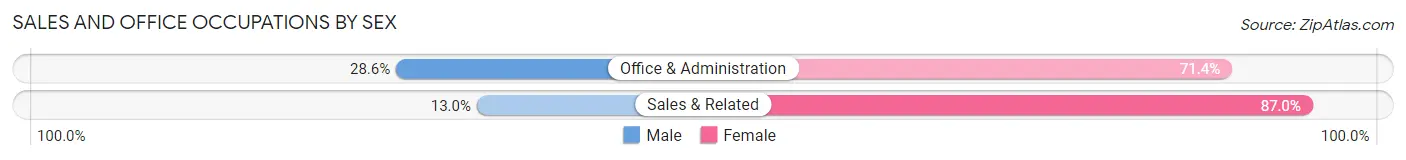
Sales and Office Occupations by Sex
| Occupation | Male | Female |
| Sales & Related | 3 (13.0%) | 20 (87.0%) |
| Office & Administration | 2 (28.6%) | 5 (71.4%) |
| Total (Category) | 5 (16.7%) | 25 (83.3%) |
| Total (Overall) | 127 (53.4%) | 111 (46.6%) |
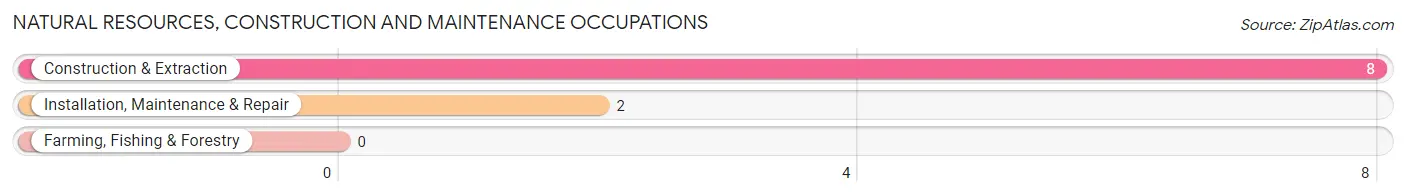
Natural Resources, Construction and Maintenance Occupations
The most common Natural Resources, Construction and Maintenance occupations in Dover are Construction & Extraction (8 | 3.4%), and Installation, Maintenance & Repair (2 | 0.8%).
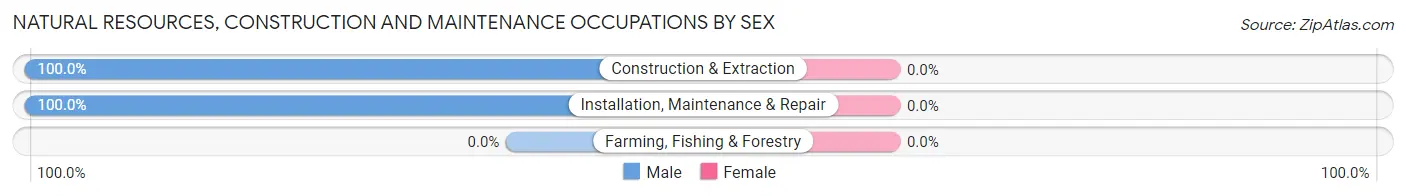
Natural Resources, Construction and Maintenance Occupations by Sex
| Occupation | Male | Female |
| Farming, Fishing & Forestry | 0 (0.0%) | 0 (0.0%) |
| Construction & Extraction | 8 (100.0%) | 0 (0.0%) |
| Installation, Maintenance & Repair | 2 (100.0%) | 0 (0.0%) |
| Total (Category) | 10 (100.0%) | 0 (0.0%) |
| Total (Overall) | 127 (53.4%) | 111 (46.6%) |
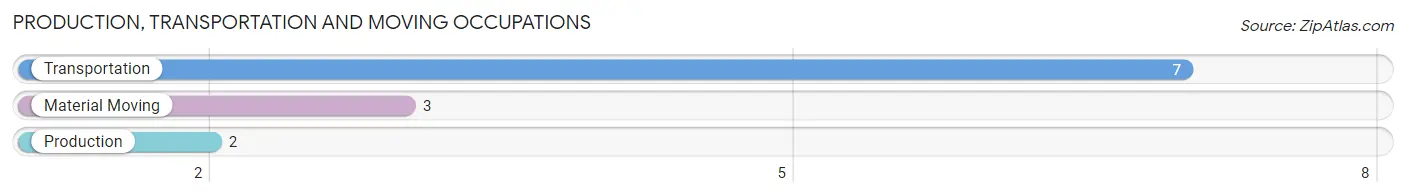
Production, Transportation and Moving Occupations
The most common Production, Transportation and Moving occupations in Dover are Transportation (7 | 2.9%), Material Moving (3 | 1.3%), and Production (2 | 0.8%).
Production, Transportation and Moving Occupations by Sex
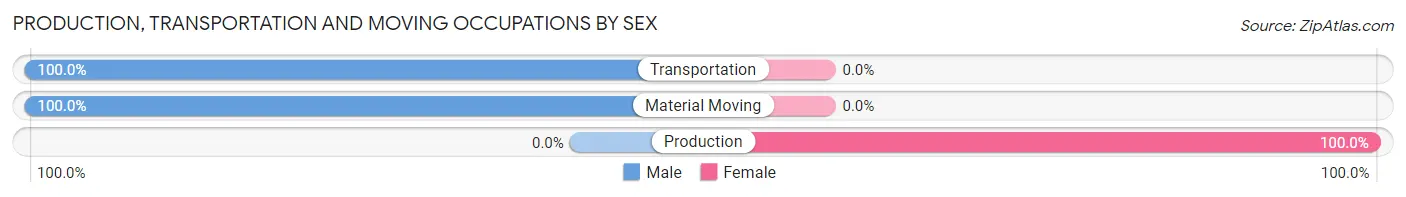
| Occupation | Male | Female |
| Production | 0 (0.0%) | 2 (100.0%) |
| Transportation | 7 (100.0%) | 0 (0.0%) |
| Material Moving | 3 (100.0%) | 0 (0.0%) |
| Total (Category) | 10 (83.3%) | 2 (16.7%) |
| Total (Overall) | 127 (53.4%) | 111 (46.6%) |
Employment Industries by Sex in Dover
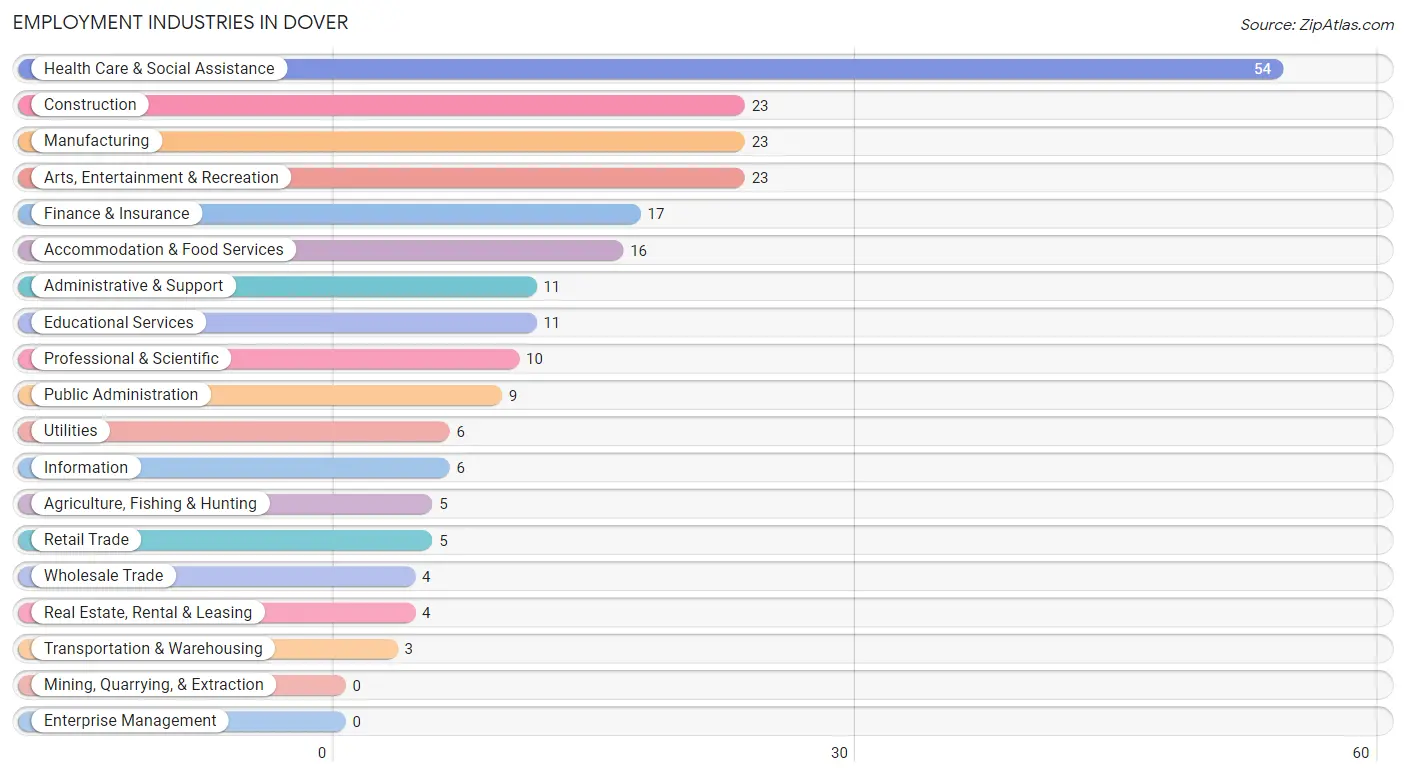
Employment Industries in Dover
The major employment industries in Dover include Health Care & Social Assistance (54 | 22.7%), Construction (23 | 9.7%), Manufacturing (23 | 9.7%), Arts, Entertainment & Recreation (23 | 9.7%), and Finance & Insurance (17 | 7.1%).
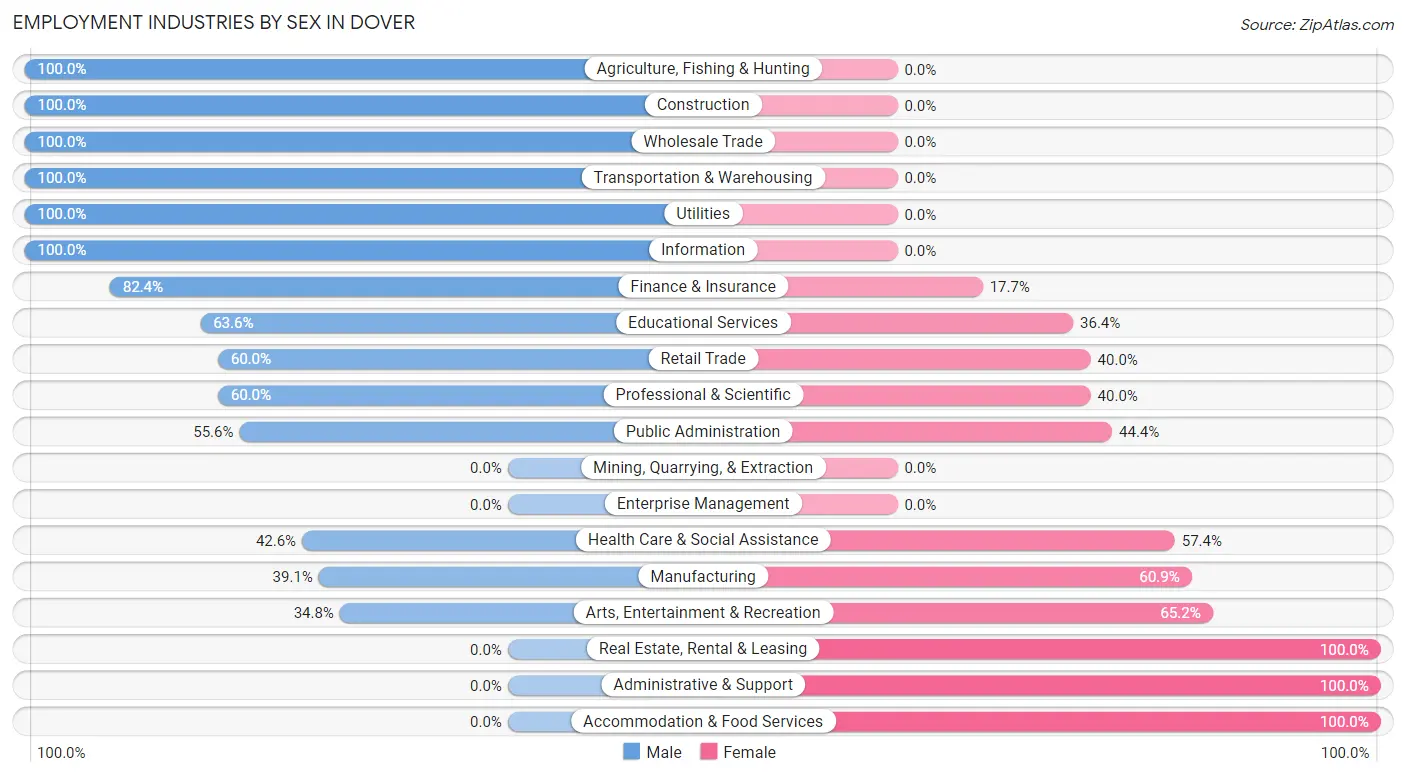
Employment Industries by Sex in Dover
The Dover industries that see more men than women are Agriculture, Fishing & Hunting (100.0%), Construction (100.0%), and Wholesale Trade (100.0%), whereas the industries that tend to have a higher number of women are Real Estate, Rental & Leasing (100.0%), Administrative & Support (100.0%), and Accommodation & Food Services (100.0%).
| Industry | Male | Female |
| Agriculture, Fishing & Hunting | 5 (100.0%) | 0 (0.0%) |
| Mining, Quarrying, & Extraction | 0 (0.0%) | 0 (0.0%) |
| Construction | 23 (100.0%) | 0 (0.0%) |
| Manufacturing | 9 (39.1%) | 14 (60.9%) |
| Wholesale Trade | 4 (100.0%) | 0 (0.0%) |
| Retail Trade | 3 (60.0%) | 2 (40.0%) |
| Transportation & Warehousing | 3 (100.0%) | 0 (0.0%) |
| Utilities | 6 (100.0%) | 0 (0.0%) |
| Information | 6 (100.0%) | 0 (0.0%) |
| Finance & Insurance | 14 (82.4%) | 3 (17.6%) |
| Real Estate, Rental & Leasing | 0 (0.0%) | 4 (100.0%) |
| Professional & Scientific | 6 (60.0%) | 4 (40.0%) |
| Enterprise Management | 0 (0.0%) | 0 (0.0%) |
| Administrative & Support | 0 (0.0%) | 11 (100.0%) |
| Educational Services | 7 (63.6%) | 4 (36.4%) |
| Health Care & Social Assistance | 23 (42.6%) | 31 (57.4%) |
| Arts, Entertainment & Recreation | 8 (34.8%) | 15 (65.2%) |
| Accommodation & Food Services | 0 (0.0%) | 16 (100.0%) |
| Public Administration | 5 (55.6%) | 4 (44.4%) |
| Total | 127 (53.4%) | 111 (46.6%) |
Education in Dover
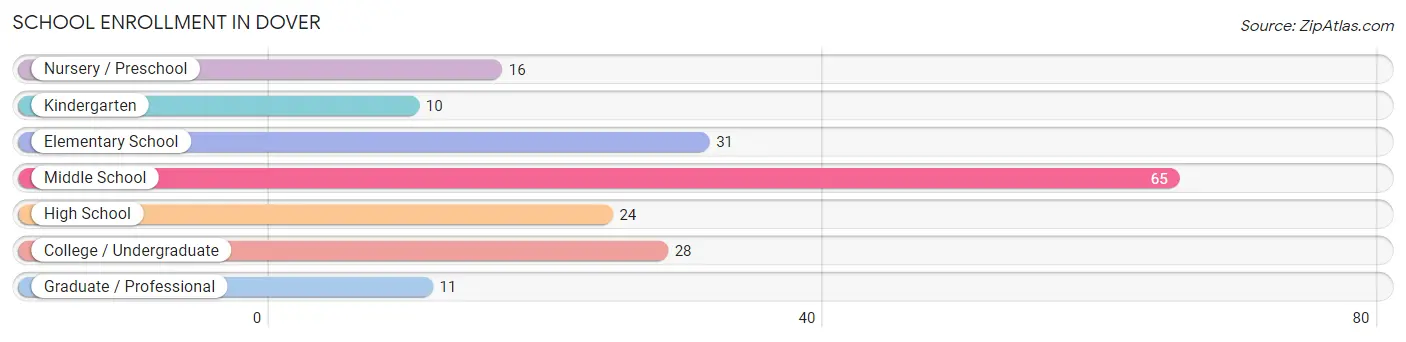
School Enrollment in Dover
The most common levels of schooling among the 185 students in Dover are middle school (65 | 35.1%), elementary school (31 | 16.8%), and college / undergraduate (28 | 15.1%).
| School Level | # Students | % Students |
| Nursery / Preschool | 16 | 8.6% |
| Kindergarten | 10 | 5.4% |
| Elementary School | 31 | 16.8% |
| Middle School | 65 | 35.1% |
| High School | 24 | 13.0% |
| College / Undergraduate | 28 | 15.1% |
| Graduate / Professional | 11 | 5.9% |
| Total | 185 | 100.0% |
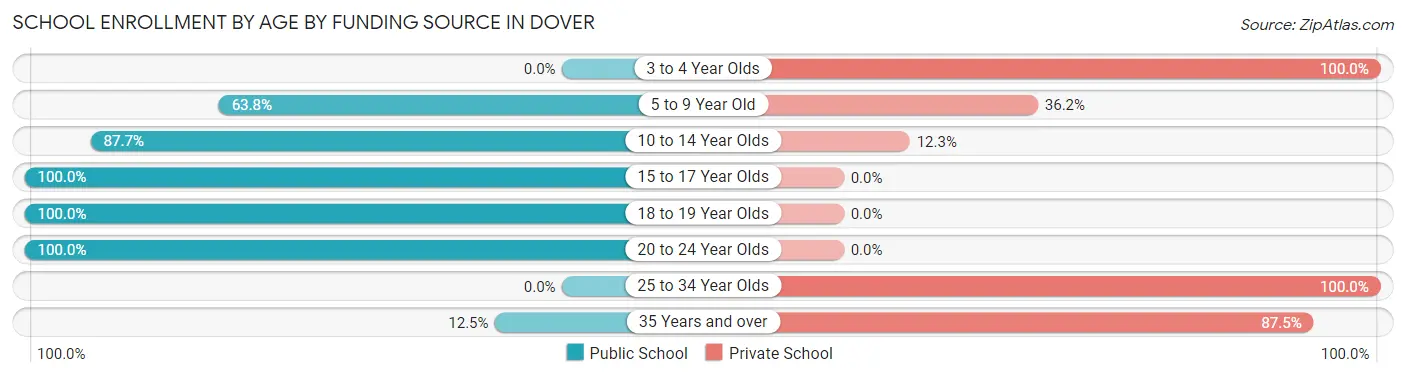
School Enrollment by Age by Funding Source in Dover
Out of a total of 185 students who are enrolled in schools in Dover, 52 (28.1%) attend a private institution, while the remaining 133 (71.9%) are enrolled in public schools. The age group of 3 to 4 year olds has the highest likelihood of being enrolled in private schools, with 10 (100.0% in the age bracket) enrolled. Conversely, the age group of 15 to 17 year olds has the lowest likelihood of being enrolled in a private school, with 21 (100.0% in the age bracket) attending a public institution.
| Age Bracket | Public School | Private School |
| 3 to 4 Year Olds | 0 (0.0%) | 10 (100.0%) |
| 5 to 9 Year Old | 30 (63.8%) | 17 (36.2%) |
| 10 to 14 Year Olds | 57 (87.7%) | 8 (12.3%) |
| 15 to 17 Year Olds | 21 (100.0%) | 0 (0.0%) |
| 18 to 19 Year Olds | 16 (100.0%) | 0 (0.0%) |
| 20 to 24 Year Olds | 7 (100.0%) | 0 (0.0%) |
| 25 to 34 Year Olds | 0 (0.0%) | 3 (100.0%) |
| 35 Years and over | 2 (12.5%) | 14 (87.5%) |
| Total | 133 (71.9%) | 52 (28.1%) |
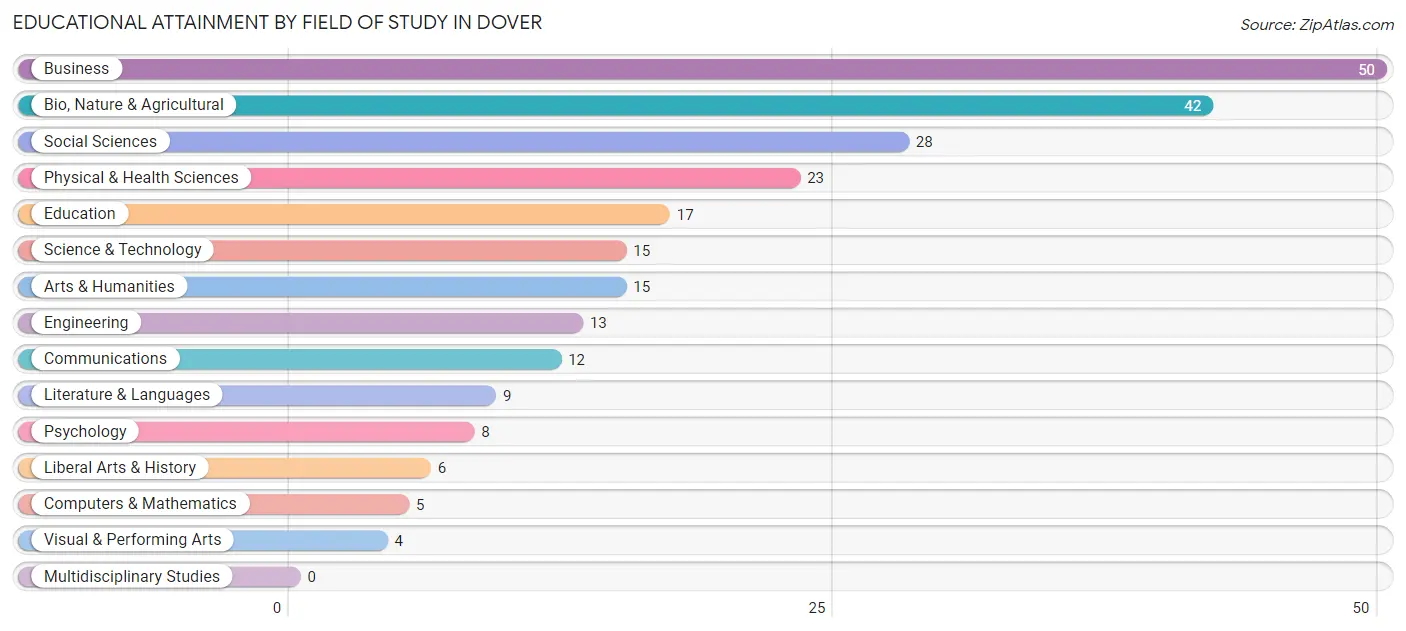
Educational Attainment by Field of Study in Dover
Business (50 | 20.2%), bio, nature & agricultural (42 | 17.0%), social sciences (28 | 11.3%), physical & health sciences (23 | 9.3%), and education (17 | 6.9%) are the most common fields of study among 247 individuals in Dover who have obtained a bachelor's degree or higher.
| Field of Study | # Graduates | % Graduates |
| Computers & Mathematics | 5 | 2.0% |
| Bio, Nature & Agricultural | 42 | 17.0% |
| Physical & Health Sciences | 23 | 9.3% |
| Psychology | 8 | 3.2% |
| Social Sciences | 28 | 11.3% |
| Engineering | 13 | 5.3% |
| Multidisciplinary Studies | 0 | 0.0% |
| Science & Technology | 15 | 6.1% |
| Business | 50 | 20.2% |
| Education | 17 | 6.9% |
| Literature & Languages | 9 | 3.6% |
| Liberal Arts & History | 6 | 2.4% |
| Visual & Performing Arts | 4 | 1.6% |
| Communications | 12 | 4.9% |
| Arts & Humanities | 15 | 6.1% |
| Total | 247 | 100.0% |
Transportation & Commute in Dover
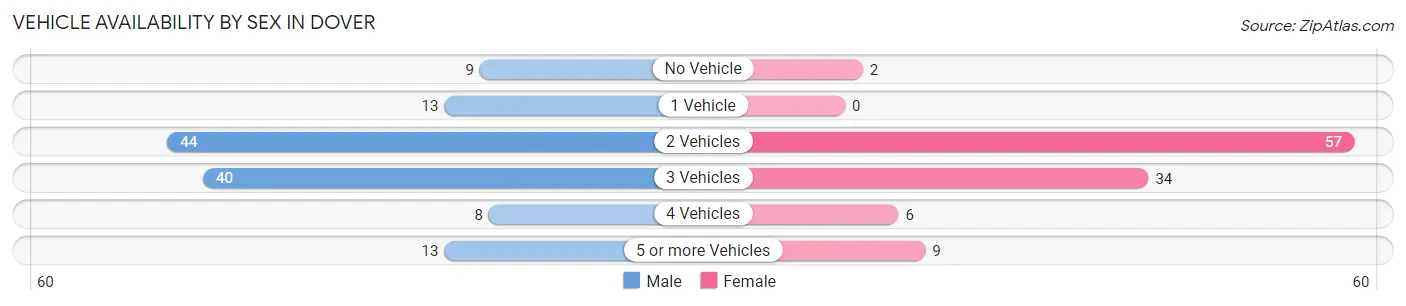
Vehicle Availability by Sex in Dover
The most prevalent vehicle ownership categories in Dover are males with 2 vehicles (44, accounting for 34.6%) and females with 2 vehicles (57, making up 40.7%).
| Vehicles Available | Male | Female |
| No Vehicle | 9 (7.1%) | 2 (1.8%) |
| 1 Vehicle | 13 (10.2%) | 0 (0.0%) |
| 2 Vehicles | 44 (34.6%) | 57 (52.8%) |
| 3 Vehicles | 40 (31.5%) | 34 (31.5%) |
| 4 Vehicles | 8 (6.3%) | 6 (5.6%) |
| 5 or more Vehicles | 13 (10.2%) | 9 (8.3%) |
| Total | 127 (100.0%) | 108 (100.0%) |
Commute Time in Dover
The most frequently occuring commute durations in Dover are 5 to 9 minutes (60 commuters, 34.5%), 10 to 14 minutes (49 commuters, 28.2%), and 30 to 34 minutes (24 commuters, 13.8%).
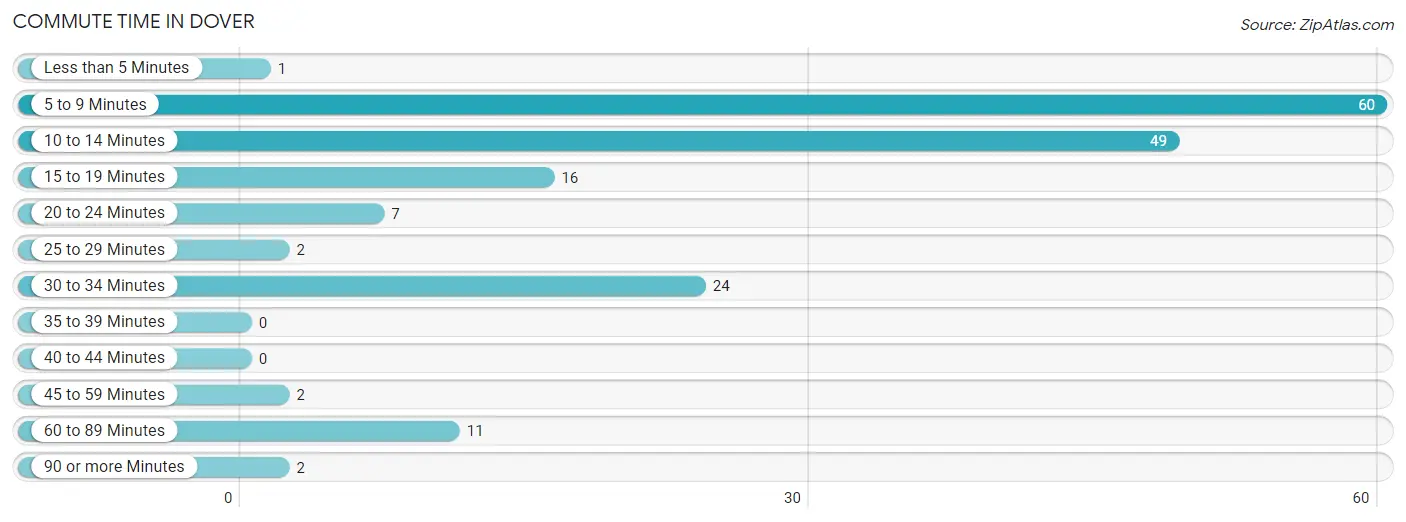
| Commute Time | # Commuters | % Commuters |
| Less than 5 Minutes | 1 | 0.6% |
| 5 to 9 Minutes | 60 | 34.5% |
| 10 to 14 Minutes | 49 | 28.2% |
| 15 to 19 Minutes | 16 | 9.2% |
| 20 to 24 Minutes | 7 | 4.0% |
| 25 to 29 Minutes | 2 | 1.1% |
| 30 to 34 Minutes | 24 | 13.8% |
| 35 to 39 Minutes | 0 | 0.0% |
| 40 to 44 Minutes | 0 | 0.0% |
| 45 to 59 Minutes | 2 | 1.1% |
| 60 to 89 Minutes | 11 | 6.3% |
| 90 or more Minutes | 2 | 1.1% |
Commute Time by Sex in Dover
The most common commute times in Dover are 5 to 9 minutes (28 commuters, 28.6%) for males and 10 to 14 minutes (35 commuters, 46.1%) for females.
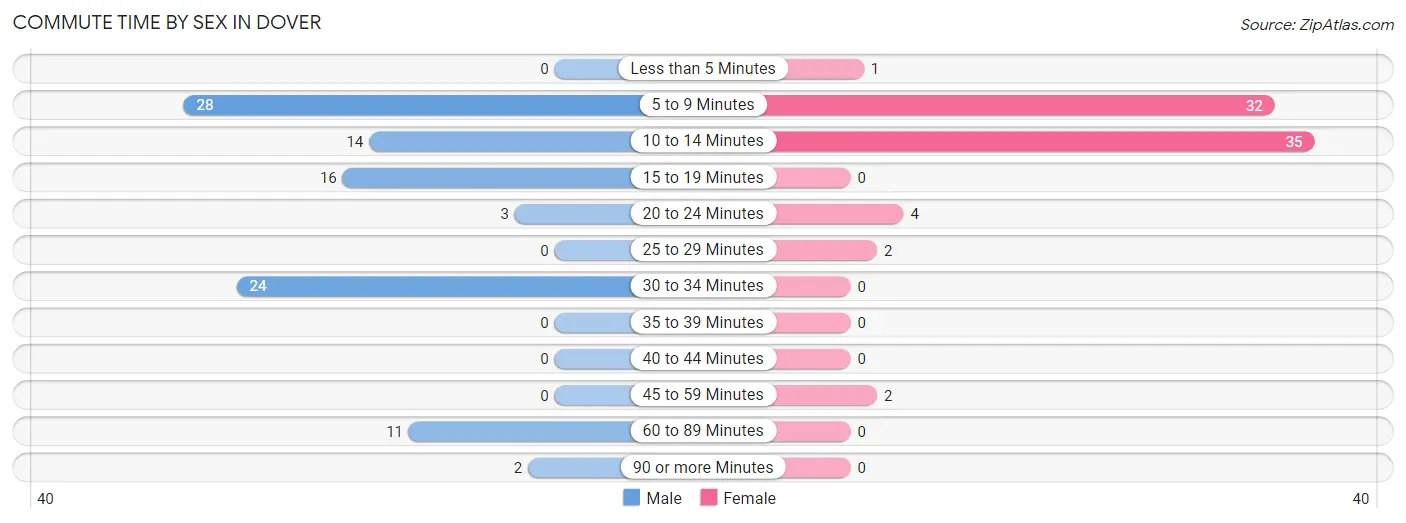
| Commute Time | Male | Female |
| Less than 5 Minutes | 0 (0.0%) | 1 (1.3%) |
| 5 to 9 Minutes | 28 (28.6%) | 32 (42.1%) |
| 10 to 14 Minutes | 14 (14.3%) | 35 (46.1%) |
| 15 to 19 Minutes | 16 (16.3%) | 0 (0.0%) |
| 20 to 24 Minutes | 3 (3.1%) | 4 (5.3%) |
| 25 to 29 Minutes | 0 (0.0%) | 2 (2.6%) |
| 30 to 34 Minutes | 24 (24.5%) | 0 (0.0%) |
| 35 to 39 Minutes | 0 (0.0%) | 0 (0.0%) |
| 40 to 44 Minutes | 0 (0.0%) | 0 (0.0%) |
| 45 to 59 Minutes | 0 (0.0%) | 2 (2.6%) |
| 60 to 89 Minutes | 11 (11.2%) | 0 (0.0%) |
| 90 or more Minutes | 2 (2.0%) | 0 (0.0%) |
Time of Departure to Work by Sex in Dover
The most frequent times of departure to work in Dover are 7:00 AM to 7:29 AM (27, 27.6%) for males and 7:30 AM to 7:59 AM (14, 18.4%) for females.
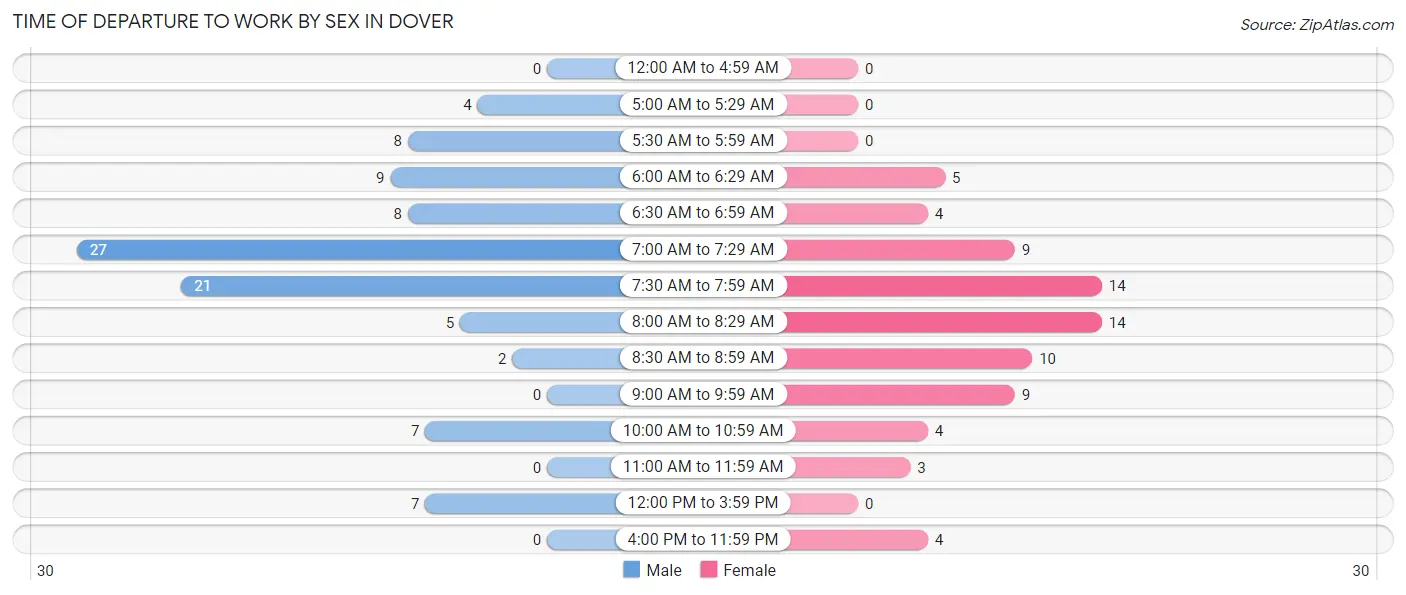
| Time of Departure | Male | Female |
| 12:00 AM to 4:59 AM | 0 (0.0%) | 0 (0.0%) |
| 5:00 AM to 5:29 AM | 4 (4.1%) | 0 (0.0%) |
| 5:30 AM to 5:59 AM | 8 (8.2%) | 0 (0.0%) |
| 6:00 AM to 6:29 AM | 9 (9.2%) | 5 (6.6%) |
| 6:30 AM to 6:59 AM | 8 (8.2%) | 4 (5.3%) |
| 7:00 AM to 7:29 AM | 27 (27.6%) | 9 (11.8%) |
| 7:30 AM to 7:59 AM | 21 (21.4%) | 14 (18.4%) |
| 8:00 AM to 8:29 AM | 5 (5.1%) | 14 (18.4%) |
| 8:30 AM to 8:59 AM | 2 (2.0%) | 10 (13.2%) |
| 9:00 AM to 9:59 AM | 0 (0.0%) | 9 (11.8%) |
| 10:00 AM to 10:59 AM | 7 (7.1%) | 4 (5.3%) |
| 11:00 AM to 11:59 AM | 0 (0.0%) | 3 (4.0%) |
| 12:00 PM to 3:59 PM | 7 (7.1%) | 0 (0.0%) |
| 4:00 PM to 11:59 PM | 0 (0.0%) | 4 (5.3%) |
| Total | 98 (100.0%) | 76 (100.0%) |
Housing Occupancy in Dover
Occupancy by Ownership in Dover
Of the total 257 dwellings in Dover, owner-occupied units account for 233 (90.7%), while renter-occupied units make up 24 (9.3%).
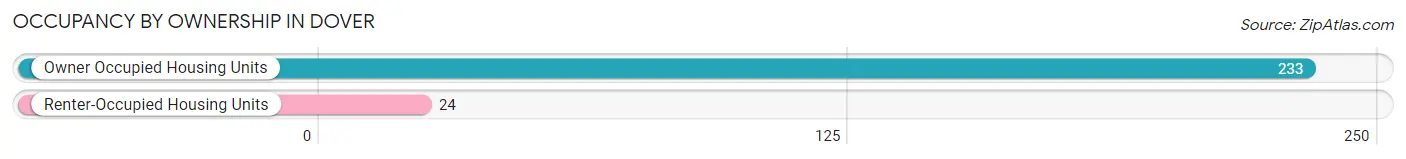
| Occupancy | # Housing Units | % Housing Units |
| Owner Occupied Housing Units | 233 | 90.7% |
| Renter-Occupied Housing Units | 24 | 9.3% |
| Total Occupied Housing Units | 257 | 100.0% |
Occupancy by Household Size in Dover
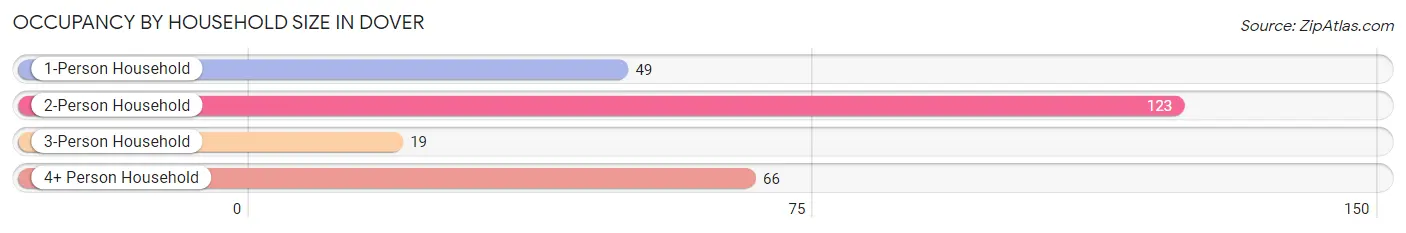
| Household Size | # Housing Units | % Housing Units |
| 1-Person Household | 49 | 19.1% |
| 2-Person Household | 123 | 47.9% |
| 3-Person Household | 19 | 7.4% |
| 4+ Person Household | 66 | 25.7% |
| Total Housing Units | 257 | 100.0% |
Occupancy by Ownership by Household Size in Dover
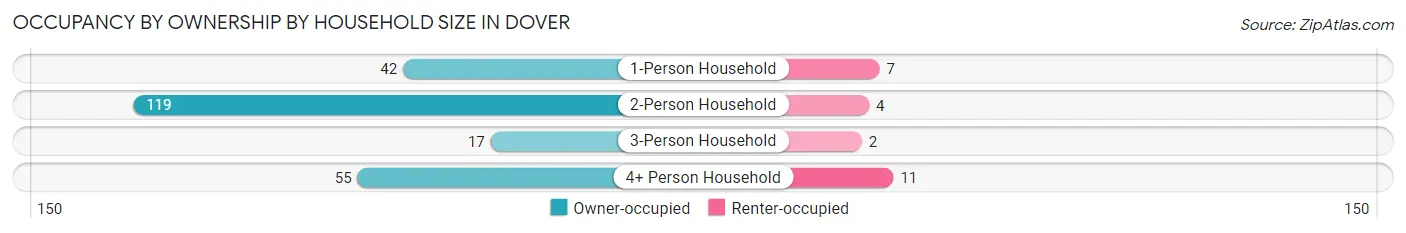
| Household Size | Owner-occupied | Renter-occupied |
| 1-Person Household | 42 (85.7%) | 7 (14.3%) |
| 2-Person Household | 119 (96.8%) | 4 (3.3%) |
| 3-Person Household | 17 (89.5%) | 2 (10.5%) |
| 4+ Person Household | 55 (83.3%) | 11 (16.7%) |
| Total Housing Units | 233 (90.7%) | 24 (9.3%) |
Occupancy by Educational Attainment in Dover
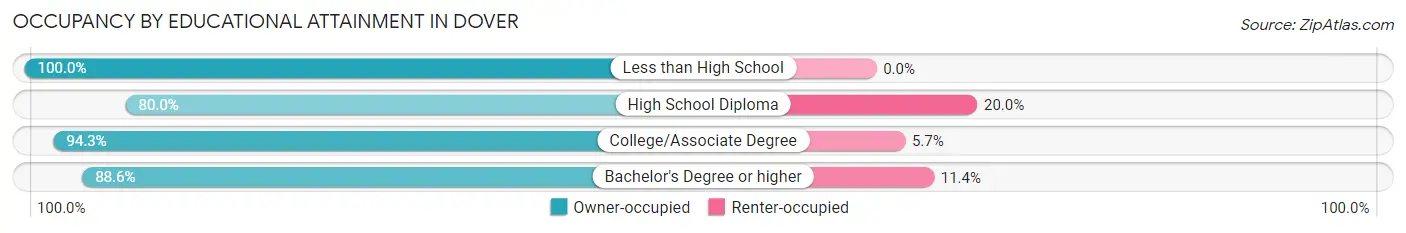
| Household Size | Owner-occupied | Renter-occupied |
| Less than High School | 27 (100.0%) | 0 (0.0%) |
| High School Diploma | 16 (80.0%) | 4 (20.0%) |
| College/Associate Degree | 66 (94.3%) | 4 (5.7%) |
| Bachelor's Degree or higher | 124 (88.6%) | 16 (11.4%) |
Occupancy by Age of Householder in Dover
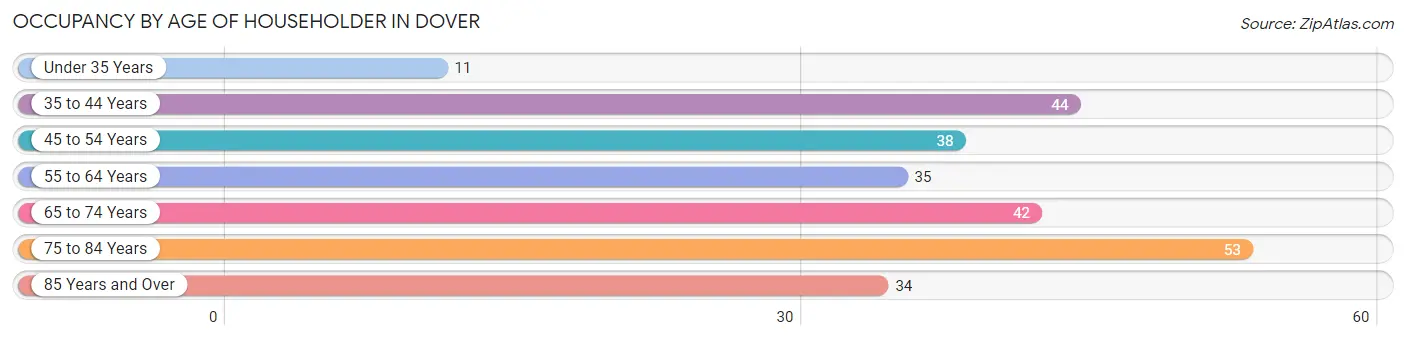
| Age Bracket | # Households | % Households |
| Under 35 Years | 11 | 4.3% |
| 35 to 44 Years | 44 | 17.1% |
| 45 to 54 Years | 38 | 14.8% |
| 55 to 64 Years | 35 | 13.6% |
| 65 to 74 Years | 42 | 16.3% |
| 75 to 84 Years | 53 | 20.6% |
| 85 Years and Over | 34 | 13.2% |
| Total | 257 | 100.0% |
Housing Finances in Dover
Median Income by Occupancy in Dover
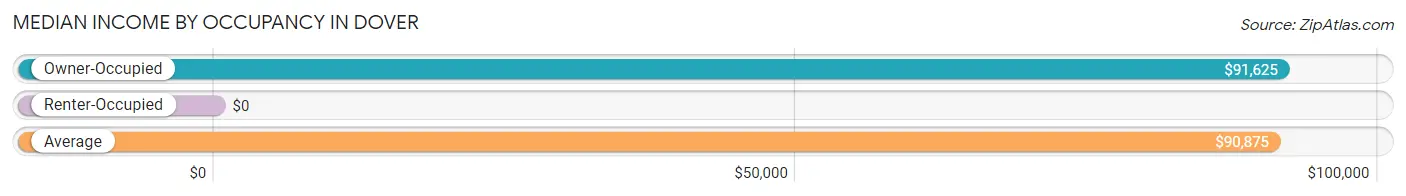
| Occupancy Type | # Households | Median Income |
| Owner-Occupied | 233 (90.7%) | $91,625 |
| Renter-Occupied | 24 (9.3%) | $0 |
| Average | 257 (100.0%) | $90,875 |
Occupancy by Householder Income Bracket in Dover
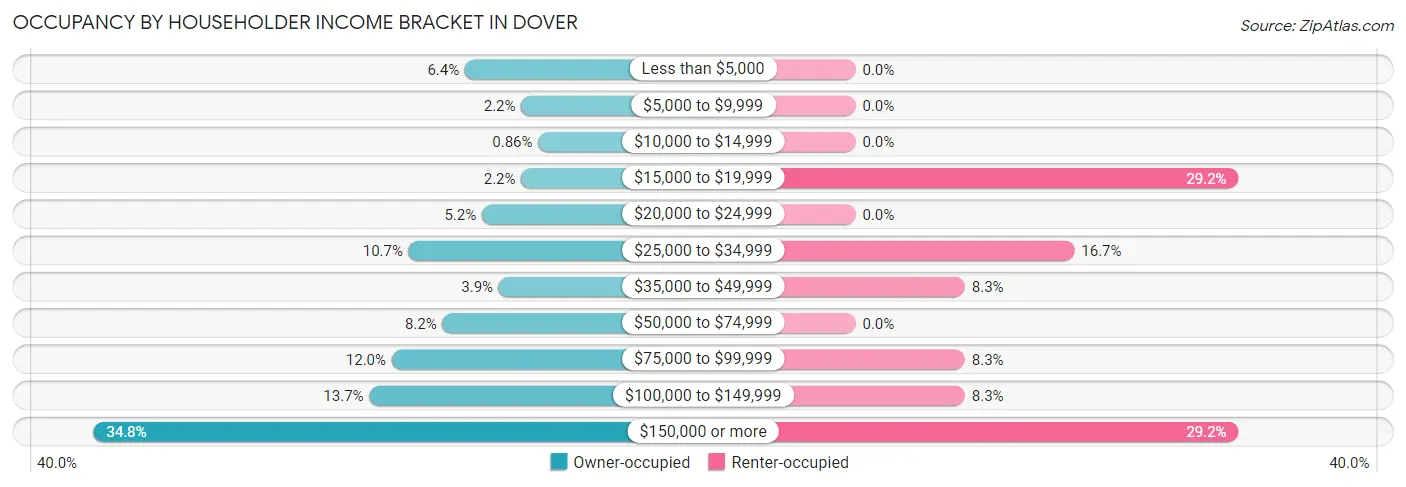
| Income Bracket | Owner-occupied | Renter-occupied |
| Less than $5,000 | 15 (6.4%) | 0 (0.0%) |
| $5,000 to $9,999 | 5 (2.1%) | 0 (0.0%) |
| $10,000 to $14,999 | 2 (0.9%) | 0 (0.0%) |
| $15,000 to $19,999 | 5 (2.1%) | 7 (29.2%) |
| $20,000 to $24,999 | 12 (5.1%) | 0 (0.0%) |
| $25,000 to $34,999 | 25 (10.7%) | 4 (16.7%) |
| $35,000 to $49,999 | 9 (3.9%) | 2 (8.3%) |
| $50,000 to $74,999 | 19 (8.2%) | 0 (0.0%) |
| $75,000 to $99,999 | 28 (12.0%) | 2 (8.3%) |
| $100,000 to $149,999 | 32 (13.7%) | 2 (8.3%) |
| $150,000 or more | 81 (34.8%) | 7 (29.2%) |
| Total | 233 (100.0%) | 24 (100.0%) |
Monthly Housing Cost Tiers in Dover
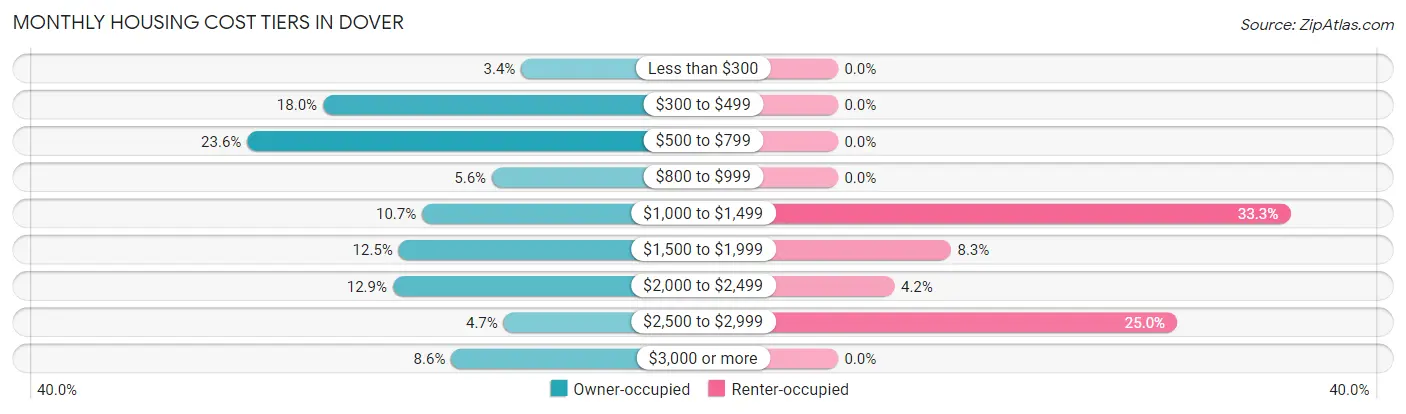
| Monthly Cost | Owner-occupied | Renter-occupied |
| Less than $300 | 8 (3.4%) | 0 (0.0%) |
| $300 to $499 | 42 (18.0%) | 0 (0.0%) |
| $500 to $799 | 55 (23.6%) | 0 (0.0%) |
| $800 to $999 | 13 (5.6%) | 0 (0.0%) |
| $1,000 to $1,499 | 25 (10.7%) | 8 (33.3%) |
| $1,500 to $1,999 | 29 (12.4%) | 2 (8.3%) |
| $2,000 to $2,499 | 30 (12.9%) | 1 (4.2%) |
| $2,500 to $2,999 | 11 (4.7%) | 6 (25.0%) |
| $3,000 or more | 20 (8.6%) | 0 (0.0%) |
| Total | 233 (100.0%) | 24 (100.0%) |
Physical Housing Characteristics in Dover
Housing Structures in Dover
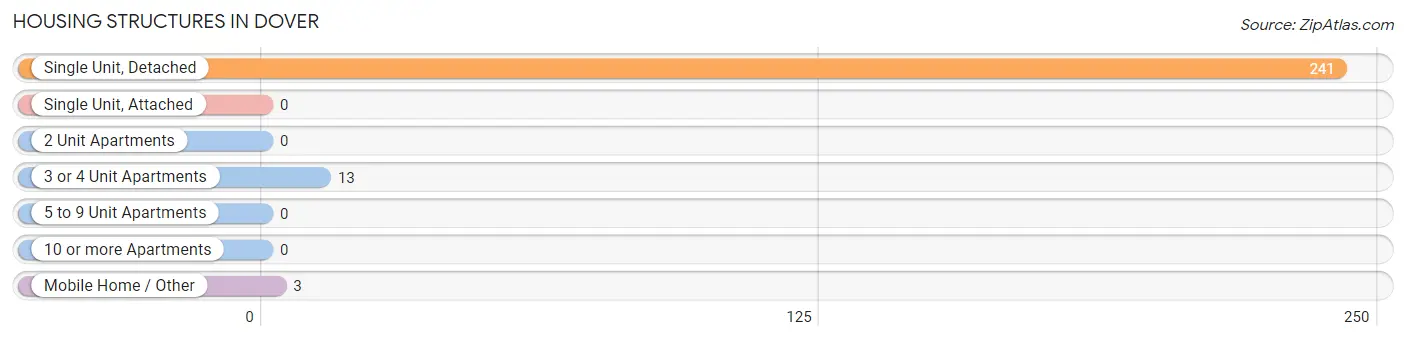
| Structure Type | # Housing Units | % Housing Units |
| Single Unit, Detached | 241 | 93.8% |
| Single Unit, Attached | 0 | 0.0% |
| 2 Unit Apartments | 0 | 0.0% |
| 3 or 4 Unit Apartments | 13 | 5.1% |
| 5 to 9 Unit Apartments | 0 | 0.0% |
| 10 or more Apartments | 0 | 0.0% |
| Mobile Home / Other | 3 | 1.2% |
| Total | 257 | 100.0% |
Housing Structures by Occupancy in Dover
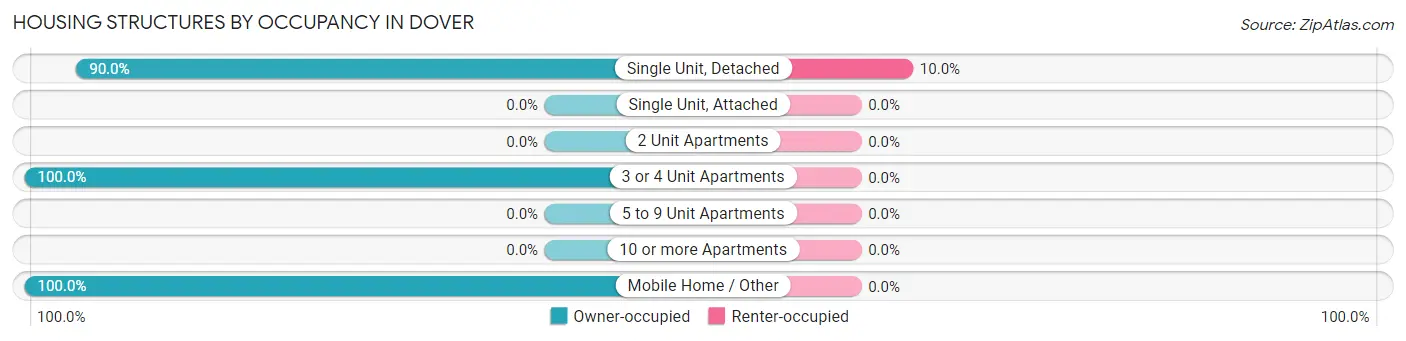
| Structure Type | Owner-occupied | Renter-occupied |
| Single Unit, Detached | 217 (90.0%) | 24 (10.0%) |
| Single Unit, Attached | 0 (0.0%) | 0 (0.0%) |
| 2 Unit Apartments | 0 (0.0%) | 0 (0.0%) |
| 3 or 4 Unit Apartments | 13 (100.0%) | 0 (0.0%) |
| 5 to 9 Unit Apartments | 0 (0.0%) | 0 (0.0%) |
| 10 or more Apartments | 0 (0.0%) | 0 (0.0%) |
| Mobile Home / Other | 3 (100.0%) | 0 (0.0%) |
| Total | 233 (90.7%) | 24 (9.3%) |
Housing Structures by Number of Rooms in Dover
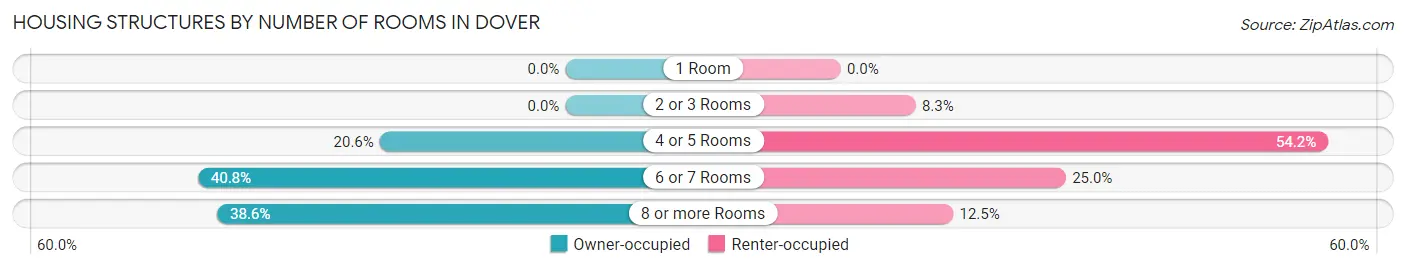
| Number of Rooms | Owner-occupied | Renter-occupied |
| 1 Room | 0 (0.0%) | 0 (0.0%) |
| 2 or 3 Rooms | 0 (0.0%) | 2 (8.3%) |
| 4 or 5 Rooms | 48 (20.6%) | 13 (54.2%) |
| 6 or 7 Rooms | 95 (40.8%) | 6 (25.0%) |
| 8 or more Rooms | 90 (38.6%) | 3 (12.5%) |
| Total | 233 (100.0%) | 24 (100.0%) |
Housing Structure by Heating Type in Dover
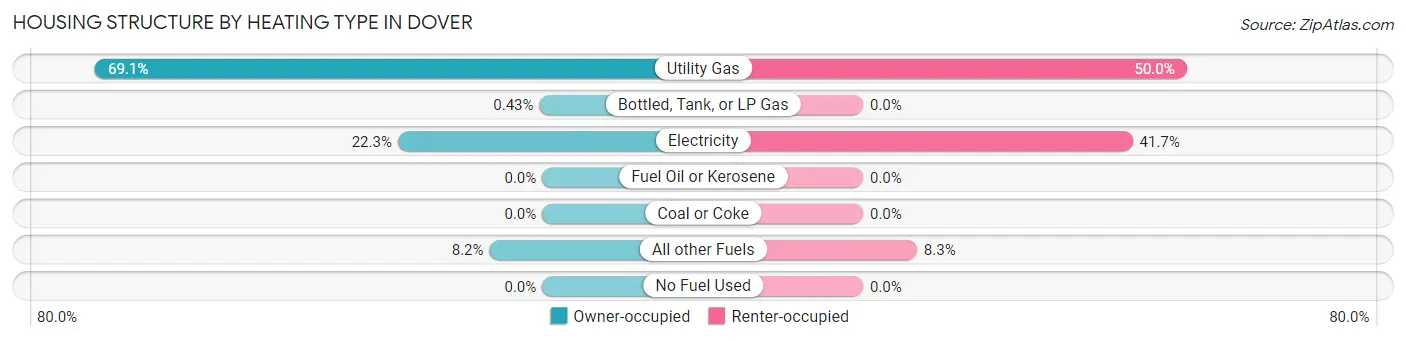
| Heating Type | Owner-occupied | Renter-occupied |
| Utility Gas | 161 (69.1%) | 12 (50.0%) |
| Bottled, Tank, or LP Gas | 1 (0.4%) | 0 (0.0%) |
| Electricity | 52 (22.3%) | 10 (41.7%) |
| Fuel Oil or Kerosene | 0 (0.0%) | 0 (0.0%) |
| Coal or Coke | 0 (0.0%) | 0 (0.0%) |
| All other Fuels | 19 (8.2%) | 2 (8.3%) |
| No Fuel Used | 0 (0.0%) | 0 (0.0%) |
| Total | 233 (100.0%) | 24 (100.0%) |
Household Vehicle Usage in Dover
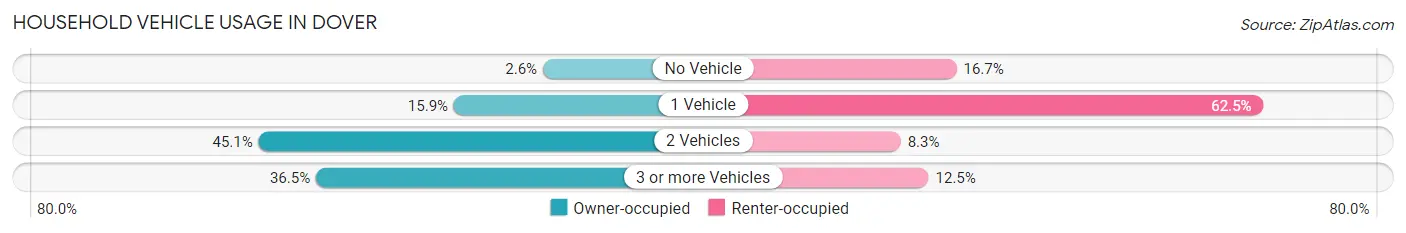
| Vehicles per Household | Owner-occupied | Renter-occupied |
| No Vehicle | 6 (2.6%) | 4 (16.7%) |
| 1 Vehicle | 37 (15.9%) | 15 (62.5%) |
| 2 Vehicles | 105 (45.1%) | 2 (8.3%) |
| 3 or more Vehicles | 85 (36.5%) | 3 (12.5%) |
| Total | 233 (100.0%) | 24 (100.0%) |
Real Estate & Mortgages in Dover
Real Estate and Mortgage Overview in Dover
| Characteristic | Without Mortgage | With Mortgage |
| Housing Units | 138 | 95 |
| Median Property Value | $598,200 | $649,000 |
| Median Household Income | $58,750 | $51 |
| Monthly Housing Costs | $583 | $20 |
| Real Estate Taxes | $2,938 | $0 |
Property Value by Mortgage Status in Dover
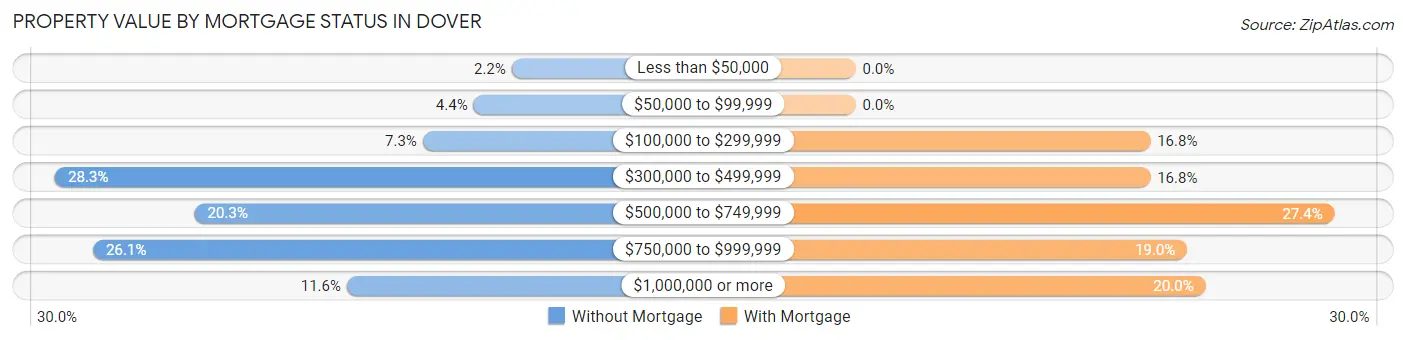
| Property Value | Without Mortgage | With Mortgage |
| Less than $50,000 | 3 (2.2%) | 0 (0.0%) |
| $50,000 to $99,999 | 6 (4.3%) | 0 (0.0%) |
| $100,000 to $299,999 | 10 (7.2%) | 16 (16.8%) |
| $300,000 to $499,999 | 39 (28.3%) | 16 (16.8%) |
| $500,000 to $749,999 | 28 (20.3%) | 26 (27.4%) |
| $750,000 to $999,999 | 36 (26.1%) | 18 (19.0%) |
| $1,000,000 or more | 16 (11.6%) | 19 (20.0%) |
| Total | 138 (100.0%) | 95 (100.0%) |
Household Income by Mortgage Status in Dover
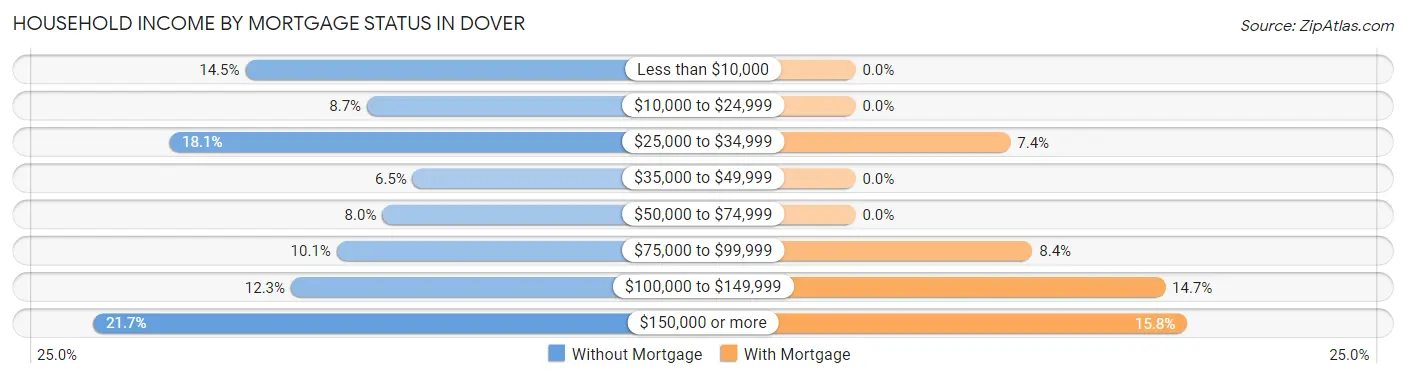
| Household Income | Without Mortgage | With Mortgage |
| Less than $10,000 | 20 (14.5%) | 0 (0.0%) |
| $10,000 to $24,999 | 12 (8.7%) | 0 (0.0%) |
| $25,000 to $34,999 | 25 (18.1%) | 7 (7.4%) |
| $35,000 to $49,999 | 9 (6.5%) | 0 (0.0%) |
| $50,000 to $74,999 | 11 (8.0%) | 0 (0.0%) |
| $75,000 to $99,999 | 14 (10.1%) | 8 (8.4%) |
| $100,000 to $149,999 | 17 (12.3%) | 14 (14.7%) |
| $150,000 or more | 30 (21.7%) | 15 (15.8%) |
| Total | 138 (100.0%) | 95 (100.0%) |
Property Value to Household Income Ratio in Dover
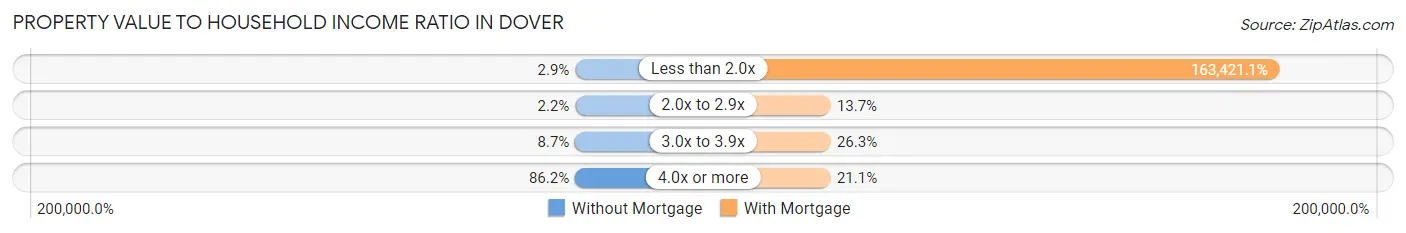
| Value-to-Income Ratio | Without Mortgage | With Mortgage |
| Less than 2.0x | 4 (2.9%) | 155,250 (163,421.0%) |
| 2.0x to 2.9x | 3 (2.2%) | 13 (13.7%) |
| 3.0x to 3.9x | 12 (8.7%) | 25 (26.3%) |
| 4.0x or more | 119 (86.2%) | 20 (21.0%) |
| Total | 138 (100.0%) | 95 (100.0%) |
Real Estate Taxes by Mortgage Status in Dover
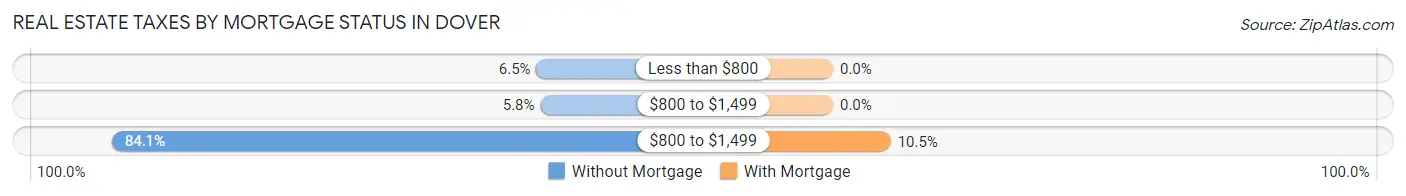
| Property Taxes | Without Mortgage | With Mortgage |
| Less than $800 | 9 (6.5%) | 0 (0.0%) |
| $800 to $1,499 | 8 (5.8%) | 0 (0.0%) |
| $800 to $1,499 | 116 (84.1%) | 10 (10.5%) |
| Total | 138 (100.0%) | 95 (100.0%) |
Health & Disability in Dover
Health Insurance Coverage by Age in Dover
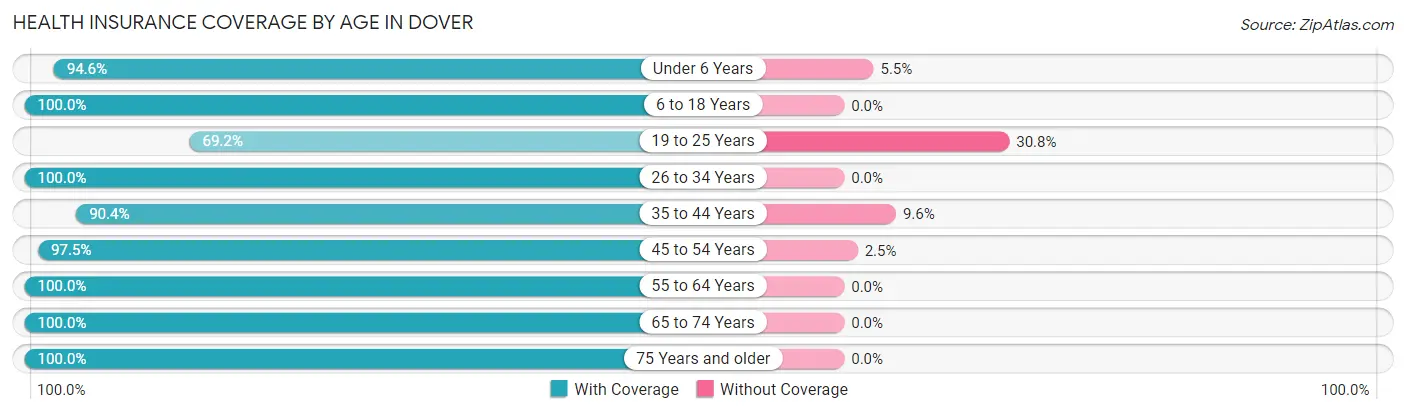
| Age Bracket | With Coverage | Without Coverage |
| Under 6 Years | 52 (94.6%) | 3 (5.4%) |
| 6 to 18 Years | 143 (100.0%) | 0 (0.0%) |
| 19 to 25 Years | 18 (69.2%) | 8 (30.8%) |
| 26 to 34 Years | 27 (100.0%) | 0 (0.0%) |
| 35 to 44 Years | 75 (90.4%) | 8 (9.6%) |
| 45 to 54 Years | 78 (97.5%) | 2 (2.5%) |
| 55 to 64 Years | 79 (100.0%) | 0 (0.0%) |
| 65 to 74 Years | 110 (100.0%) | 0 (0.0%) |
| 75 Years and older | 117 (100.0%) | 0 (0.0%) |
| Total | 699 (97.1%) | 21 (2.9%) |
Health Insurance Coverage by Citizenship Status in Dover
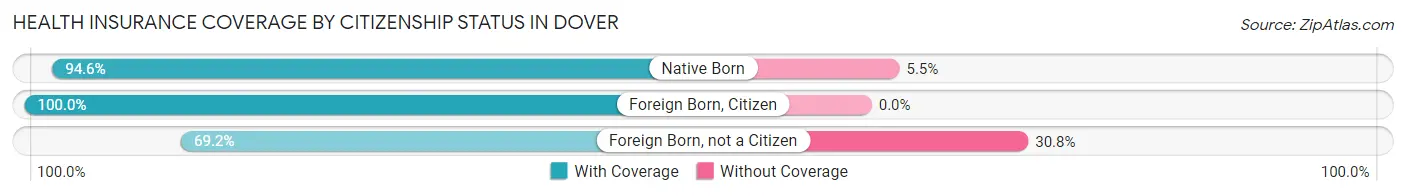
| Citizenship Status | With Coverage | Without Coverage |
| Native Born | 52 (94.6%) | 3 (5.4%) |
| Foreign Born, Citizen | 143 (100.0%) | 0 (0.0%) |
| Foreign Born, not a Citizen | 18 (69.2%) | 8 (30.8%) |
Health Insurance Coverage by Household Income in Dover
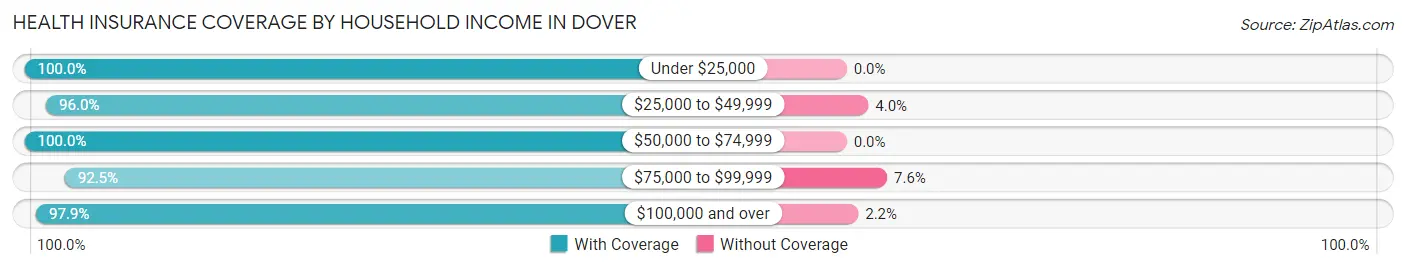
| Household Income | With Coverage | Without Coverage |
| Under $25,000 | 51 (100.0%) | 0 (0.0%) |
| $25,000 to $49,999 | 95 (96.0%) | 4 (4.0%) |
| $50,000 to $74,999 | 45 (100.0%) | 0 (0.0%) |
| $75,000 to $99,999 | 98 (92.4%) | 8 (7.5%) |
| $100,000 and over | 410 (97.9%) | 9 (2.1%) |
Public vs Private Health Insurance Coverage by Age in Dover
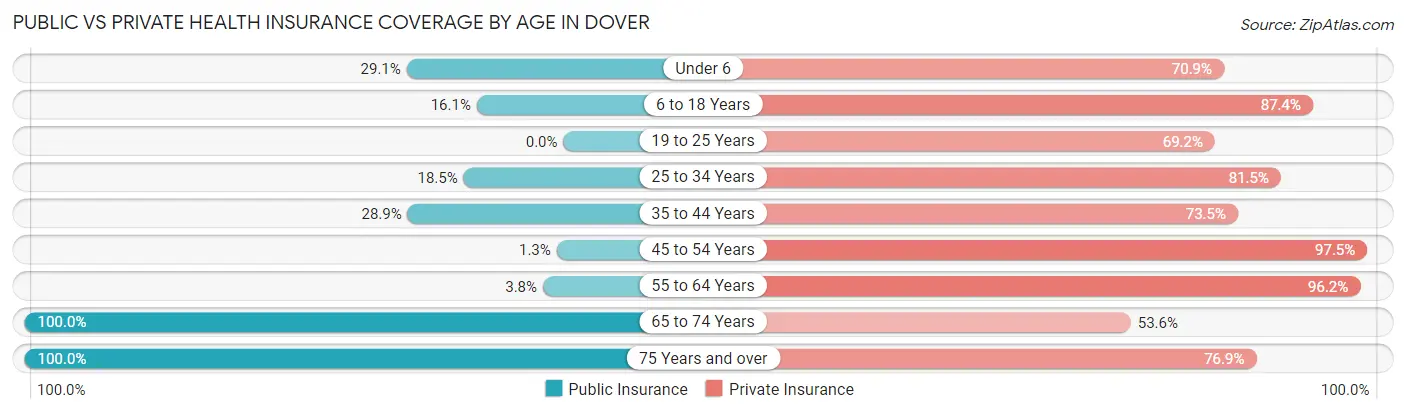
| Age Bracket | Public Insurance | Private Insurance |
| Under 6 | 16 (29.1%) | 39 (70.9%) |
| 6 to 18 Years | 23 (16.1%) | 125 (87.4%) |
| 19 to 25 Years | 0 (0.0%) | 18 (69.2%) |
| 25 to 34 Years | 5 (18.5%) | 22 (81.5%) |
| 35 to 44 Years | 24 (28.9%) | 61 (73.5%) |
| 45 to 54 Years | 1 (1.3%) | 78 (97.5%) |
| 55 to 64 Years | 3 (3.8%) | 76 (96.2%) |
| 65 to 74 Years | 110 (100.0%) | 59 (53.6%) |
| 75 Years and over | 117 (100.0%) | 90 (76.9%) |
| Total | 299 (41.5%) | 568 (78.9%) |
Disability Status by Sex by Age in Dover
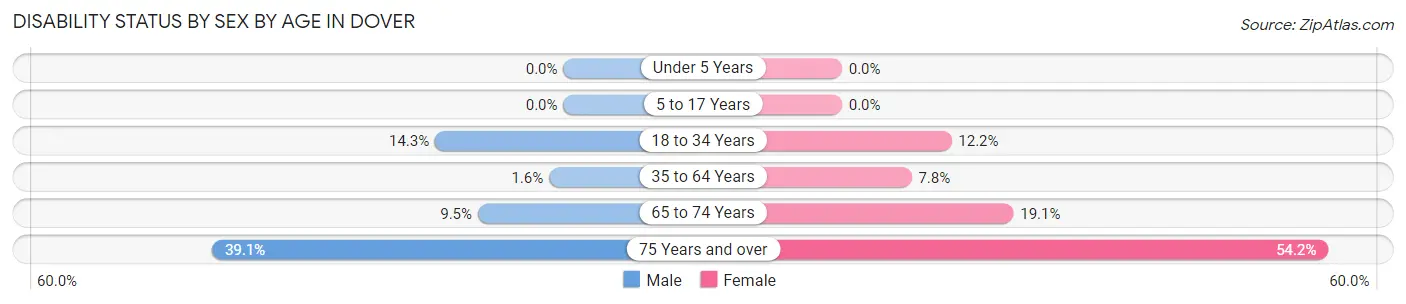
| Age Bracket | Male | Female |
| Under 5 Years | 0 (0.0%) | 0 (0.0%) |
| 5 to 17 Years | 0 (0.0%) | 0 (0.0%) |
| 18 to 34 Years | 4 (14.3%) | 5 (12.2%) |
| 35 to 64 Years | 2 (1.6%) | 9 (7.8%) |
| 65 to 74 Years | 2 (9.5%) | 17 (19.1%) |
| 75 Years and over | 27 (39.1%) | 26 (54.2%) |
Disability Class by Sex by Age in Dover
Disability Class: Hearing Difficulty
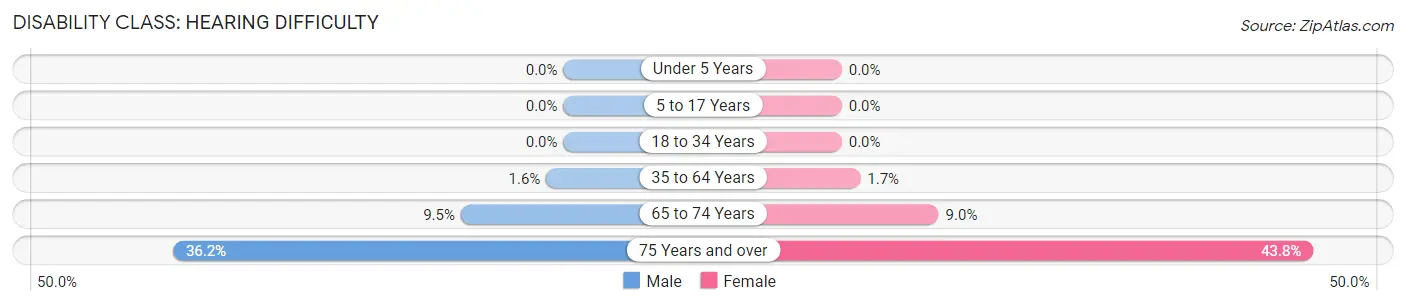
| Age Bracket | Male | Female |
| Under 5 Years | 0 (0.0%) | 0 (0.0%) |
| 5 to 17 Years | 0 (0.0%) | 0 (0.0%) |
| 18 to 34 Years | 0 (0.0%) | 0 (0.0%) |
| 35 to 64 Years | 2 (1.6%) | 2 (1.7%) |
| 65 to 74 Years | 2 (9.5%) | 8 (9.0%) |
| 75 Years and over | 25 (36.2%) | 21 (43.8%) |
Disability Class: Vision Difficulty
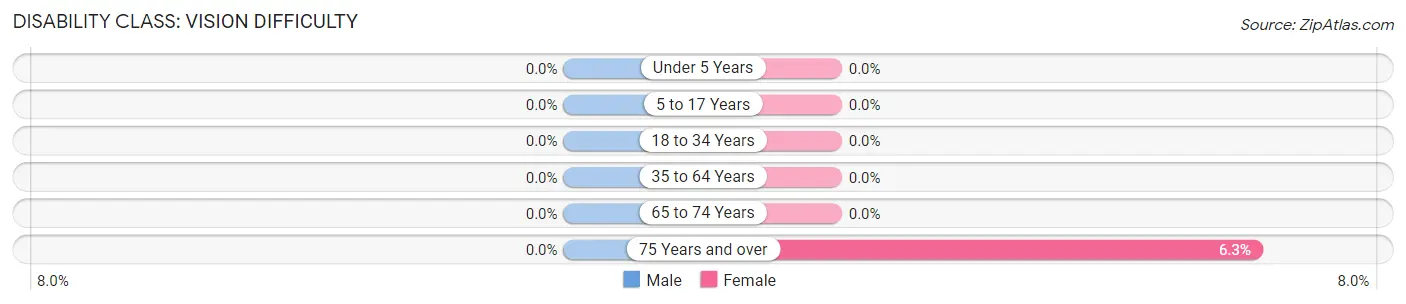
| Age Bracket | Male | Female |
| Under 5 Years | 0 (0.0%) | 0 (0.0%) |
| 5 to 17 Years | 0 (0.0%) | 0 (0.0%) |
| 18 to 34 Years | 0 (0.0%) | 0 (0.0%) |
| 35 to 64 Years | 0 (0.0%) | 0 (0.0%) |
| 65 to 74 Years | 0 (0.0%) | 0 (0.0%) |
| 75 Years and over | 0 (0.0%) | 3 (6.2%) |
Disability Class: Cognitive Difficulty
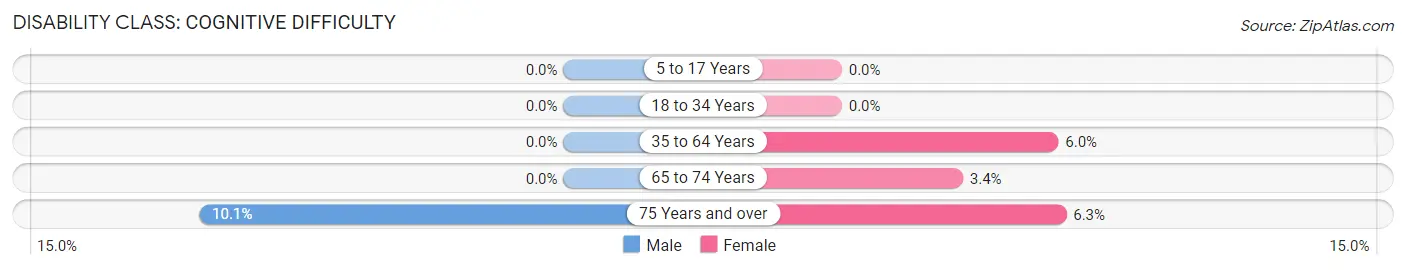
| Age Bracket | Male | Female |
| 5 to 17 Years | 0 (0.0%) | 0 (0.0%) |
| 18 to 34 Years | 0 (0.0%) | 0 (0.0%) |
| 35 to 64 Years | 0 (0.0%) | 7 (6.0%) |
| 65 to 74 Years | 0 (0.0%) | 3 (3.4%) |
| 75 Years and over | 7 (10.1%) | 3 (6.2%) |
Disability Class: Ambulatory Difficulty
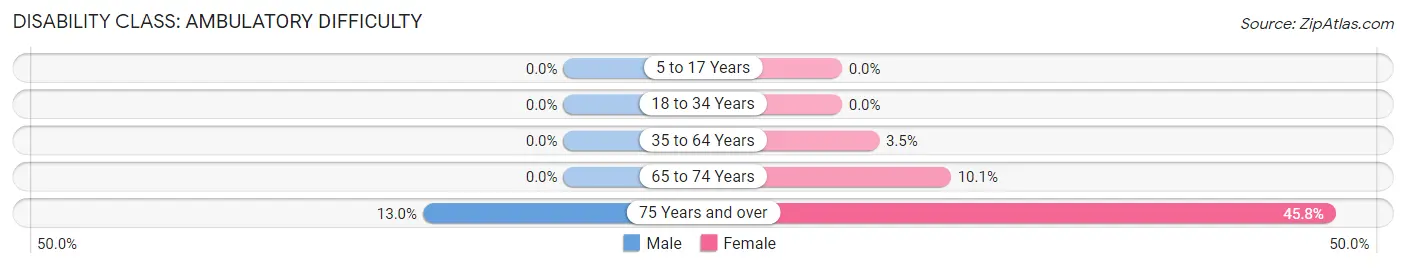
| Age Bracket | Male | Female |
| 5 to 17 Years | 0 (0.0%) | 0 (0.0%) |
| 18 to 34 Years | 0 (0.0%) | 0 (0.0%) |
| 35 to 64 Years | 0 (0.0%) | 4 (3.5%) |
| 65 to 74 Years | 0 (0.0%) | 9 (10.1%) |
| 75 Years and over | 9 (13.0%) | 22 (45.8%) |
Disability Class: Self-Care Difficulty
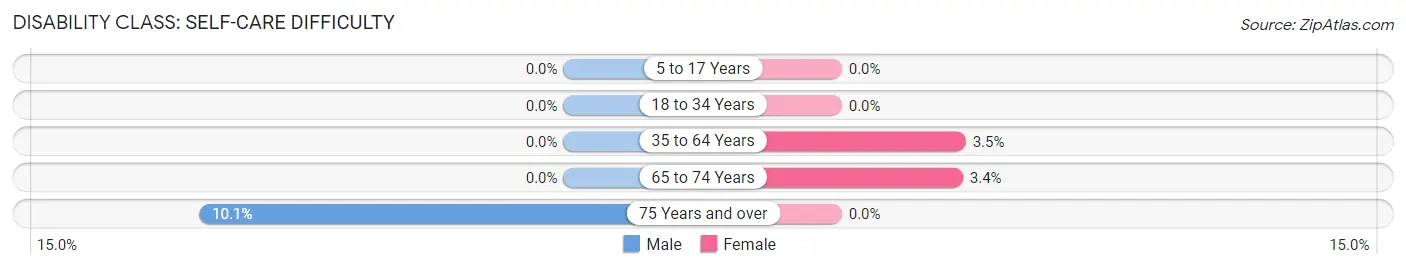
| Age Bracket | Male | Female |
| 5 to 17 Years | 0 (0.0%) | 0 (0.0%) |
| 18 to 34 Years | 0 (0.0%) | 0 (0.0%) |
| 35 to 64 Years | 0 (0.0%) | 4 (3.5%) |
| 65 to 74 Years | 0 (0.0%) | 3 (3.4%) |
| 75 Years and over | 7 (10.1%) | 0 (0.0%) |
Technology Access in Dover
Computing Device Access in Dover
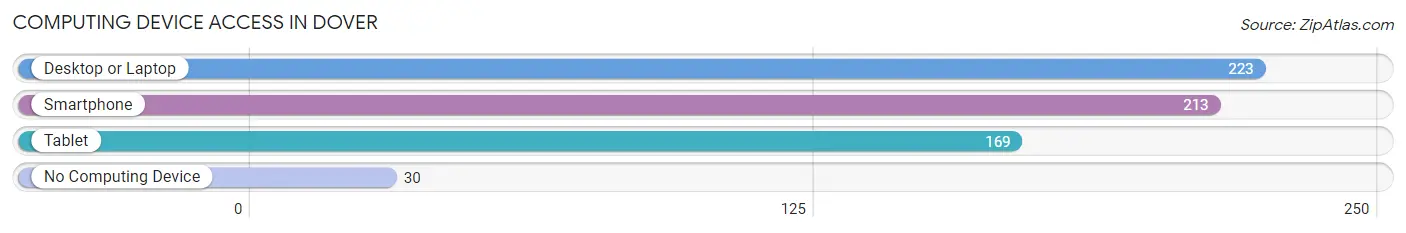
| Device Type | # Households | % Households |
| Desktop or Laptop | 223 | 86.8% |
| Smartphone | 213 | 82.9% |
| Tablet | 169 | 65.8% |
| No Computing Device | 30 | 11.7% |
| Total | 257 | 100.0% |
Internet Access in Dover
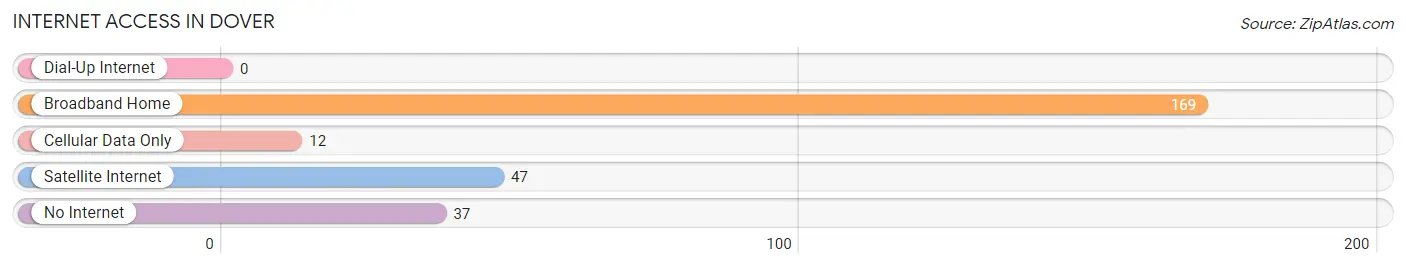
| Internet Type | # Households | % Households |
| Dial-Up Internet | 0 | 0.0% |
| Broadband Home | 169 | 65.8% |
| Cellular Data Only | 12 | 4.7% |
| Satellite Internet | 47 | 18.3% |
| No Internet | 37 | 14.4% |
| Total | 257 | 100.0% |
Dover Summary
Dover, Idaho is a small city located in the northern part of the state, in Bonner County. It is situated on the Pend Oreille River, near the Idaho-Montana border. The city has a population of approximately 1,000 people, and is part of the larger Sandpoint metropolitan area.
History
Dover was first settled in the late 1800s by a group of homesteaders. The town was originally known as "Pend Oreille City," but was later renamed Dover in honor of the nearby Dover Mine. The mine was a major source of employment for the area, and the town grew rapidly in the early 1900s.
In the 1920s, the town was incorporated and began to develop a more modern infrastructure. The city was connected to the rest of the state by a railway line, and the local economy began to diversify. The city also became a popular tourist destination, with visitors coming to enjoy the nearby lakes and rivers.
In the 1950s, the city experienced a period of growth and development. The local economy was bolstered by the construction of a pulp mill, and the city began to attract new businesses and industries. The city also saw an influx of new residents, as people moved to the area to take advantage of the growing job opportunities.
Geography
Dover is located in the northern part of Idaho, in Bonner County. It is situated on the Pend Oreille River, near the Idaho-Montana border. The city is surrounded by mountains and forests, and is located close to several lakes and rivers. The city is also located near the Selkirk Mountains, which provide a stunning backdrop for the city.
Economy
Dover's economy is largely based on tourism and outdoor recreation. The city is home to several resorts and campgrounds, and is a popular destination for fishing, hunting, and other outdoor activities. The city is also home to several small businesses, including restaurants, retail stores, and other services.
The city is also home to a pulp mill, which is a major employer in the area. The mill produces paper products, and provides jobs for many of the city's residents.
Demographics
As of the 2010 census, Dover had a population of 1,000 people. The racial makeup of the city was 95.2% White, 0.7% Native American, 0.3% Asian, 0.2% African American, 0.1% Pacific Islander, and 3.5% from other races. The median household income was $37,500, and the median age was 44.
Conclusion
Dover, Idaho is a small city located in the northern part of the state, in Bonner County. It is situated on the Pend Oreille River, near the Idaho-Montana border. The city has a population of approximately 1,000 people, and is part of the larger Sandpoint metropolitan area. The city's economy is largely based on tourism and outdoor recreation, and the local pulp mill is a major employer in the area. The city is also home to several small businesses, and is a popular destination for fishing, hunting, and other outdoor activities.
Common Questions
What is Per Capita Income in Dover?
Per Capita income in Dover is $45,698.
What is the Median Family Income in Dover?
Median Family Income in Dover is $109,688.
What is the Median Household income in Dover?
Median Household Income in Dover is $90,875.
What is Income or Wage Gap in Dover?
Income or Wage Gap in Dover is 53.2%.
Women in Dover earn 46.8 cents for every dollar earned by a man.
What is Inequality or Gini Index in Dover?
Inequality or Gini Index in Dover is 0.48.
What is the Total Population of Dover?
Total Population of Dover is 720.
What is the Total Male Population of Dover?
Total Male Population of Dover is 306.
What is the Total Female Population of Dover?
Total Female Population of Dover is 414.
What is the Ratio of Males per 100 Females in Dover?
There are 73.91 Males per 100 Females in Dover.
What is the Ratio of Females per 100 Males in Dover?
There are 135.29 Females per 100 Males in Dover.
What is the Median Population Age in Dover?
Median Population Age in Dover is 47.6 Years.
What is the Average Family Size in Dover
Average Family Size in Dover is 3.2 People.
What is the Average Household Size in Dover
Average Household Size in Dover is 2.8 People.
How Large is the Labor Force in Dover?
There are 243 People in the Labor Forcein in Dover.
What is the Percentage of People in the Labor Force in Dover?
44.2% of People are in the Labor Force in Dover.
What is the Unemployment Rate in Dover?
Unemployment Rate in Dover is 2.1%.