Merrill, OR Map & Demographics
Merrill Map
Merrill Overview
$21,470
PER CAPITA INCOME
$73,393
AVG FAMILY INCOME
$52,708
AVG HOUSEHOLD INCOME
20.1%
WAGE / INCOME GAP [ % ]
79.9¢/ $1
WAGE / INCOME GAP [ $ ]
0.39
INEQUALITY / GINI INDEX
905
TOTAL POPULATION
483
MALE POPULATION
422
FEMALE POPULATION
114.45
MALES / 100 FEMALES
87.37
FEMALES / 100 MALES
30.8
MEDIAN AGE
3.8
AVG FAMILY SIZE
2.9
AVG HOUSEHOLD SIZE
360
LABOR FORCE [ PEOPLE ]
59.0%
PERCENT IN LABOR FORCE
10.3%
UNEMPLOYMENT RATE
Merrill Zip Codes
Merrill Area Codes
Income in Merrill
Income Overview in Merrill
Per Capita Income in Merrill is $21,470, while median incomes of families and households are $73,393 and $52,708 respectively.
| Characteristic | Number | Measure |
| Per Capita Income | 905 | $21,470 |
| Median Family Income | 201 | $73,393 |
| Mean Family Income | 201 | $72,980 |
| Median Household Income | 308 | $52,708 |
| Mean Household Income | 308 | $60,604 |
| Income Deficit | 201 | $0 |
| Wage / Income Gap (%) | 905 | 20.12% |
| Wage / Income Gap ($) | 905 | 79.88¢ per $1 |
| Gini / Inequality Index | 905 | 0.39 |
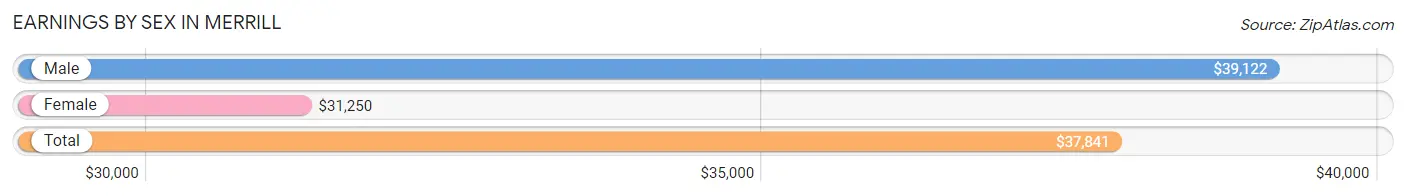
Earnings by Sex in Merrill
Average Earnings in Merrill are $37,841, $39,122 for men and $31,250 for women, a difference of 20.1%.
| Sex | Number | Average Earnings |
| Male | 191 (55.7%) | $39,122 |
| Female | 152 (44.3%) | $31,250 |
| Total | 343 (100.0%) | $37,841 |
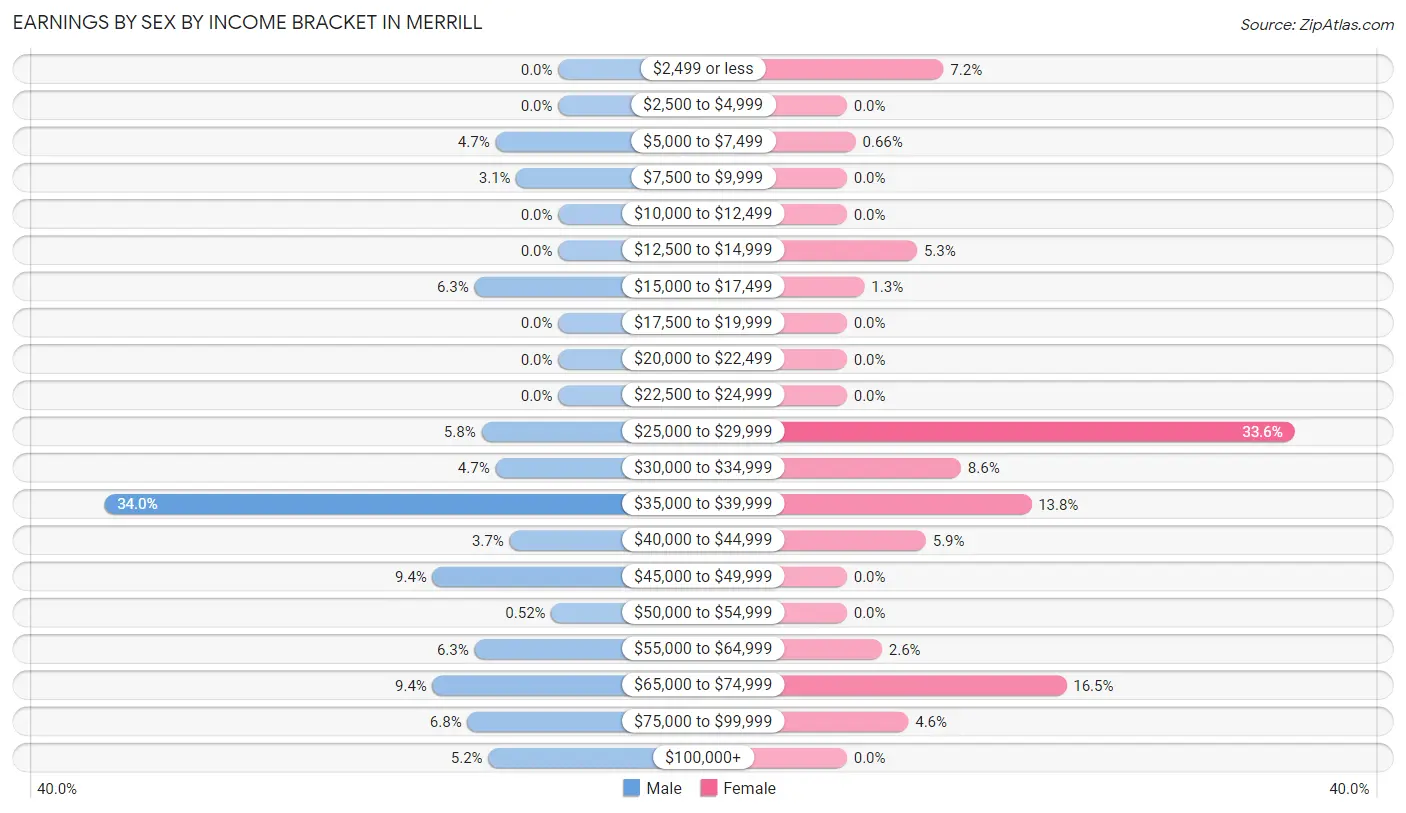
Earnings by Sex by Income Bracket in Merrill
The most common earnings brackets in Merrill are $35,000 to $39,999 for men (65 | 34.0%) and $25,000 to $29,999 for women (51 | 33.6%).
| Income | Male | Female |
| $2,499 or less | 0 (0.0%) | 11 (7.2%) |
| $2,500 to $4,999 | 0 (0.0%) | 0 (0.0%) |
| $5,000 to $7,499 | 9 (4.7%) | 1 (0.7%) |
| $7,500 to $9,999 | 6 (3.1%) | 0 (0.0%) |
| $10,000 to $12,499 | 0 (0.0%) | 0 (0.0%) |
| $12,500 to $14,999 | 0 (0.0%) | 8 (5.3%) |
| $15,000 to $17,499 | 12 (6.3%) | 2 (1.3%) |
| $17,500 to $19,999 | 0 (0.0%) | 0 (0.0%) |
| $20,000 to $22,499 | 0 (0.0%) | 0 (0.0%) |
| $22,500 to $24,999 | 0 (0.0%) | 0 (0.0%) |
| $25,000 to $29,999 | 11 (5.8%) | 51 (33.6%) |
| $30,000 to $34,999 | 9 (4.7%) | 13 (8.6%) |
| $35,000 to $39,999 | 65 (34.0%) | 21 (13.8%) |
| $40,000 to $44,999 | 7 (3.7%) | 9 (5.9%) |
| $45,000 to $49,999 | 18 (9.4%) | 0 (0.0%) |
| $50,000 to $54,999 | 1 (0.5%) | 0 (0.0%) |
| $55,000 to $64,999 | 12 (6.3%) | 4 (2.6%) |
| $65,000 to $74,999 | 18 (9.4%) | 25 (16.5%) |
| $75,000 to $99,999 | 13 (6.8%) | 7 (4.6%) |
| $100,000+ | 10 (5.2%) | 0 (0.0%) |
| Total | 191 (100.0%) | 152 (100.0%) |
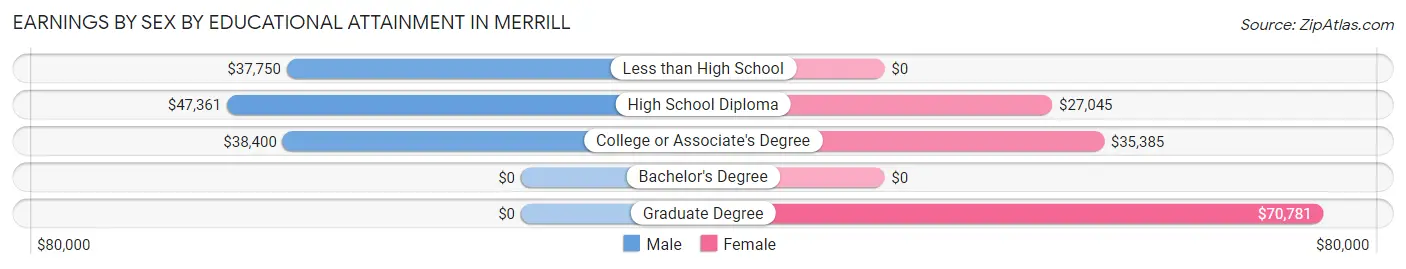
Earnings by Sex by Educational Attainment in Merrill
Average earnings in Merrill are $39,574 for men and $32,679 for women, a difference of 17.4%. Men with an educational attainment of high school diploma enjoy the highest average annual earnings of $47,361, while those with less than high school education earn the least with $37,750. Women with an educational attainment of graduate degree earn the most with the average annual earnings of $70,781, while those with high school diploma education have the smallest earnings of $27,045.
| Educational Attainment | Male Income | Female Income |
| Less than High School | $37,750 | $0 |
| High School Diploma | $47,361 | $27,045 |
| College or Associate's Degree | $38,400 | $35,385 |
| Bachelor's Degree | - | - |
| Graduate Degree | - | - |
| Total | $39,574 | $32,679 |
Family Income in Merrill
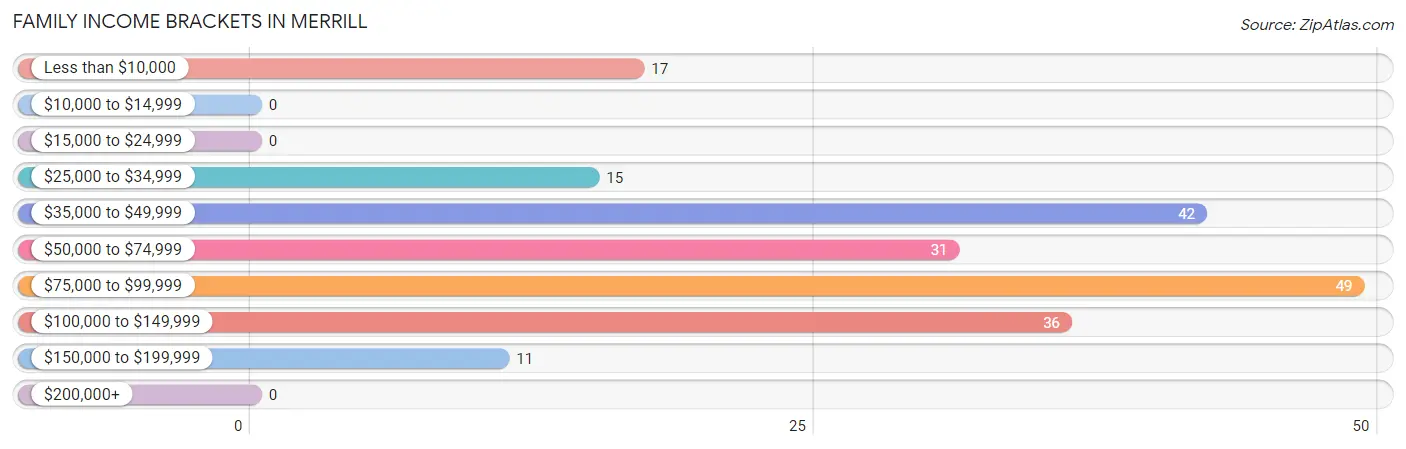
Family Income Brackets in Merrill
According to the Merrill family income data, there are 49 families falling into the $75,000 to $99,999 income range, which is the most common income bracket and makes up 24.4% of all families.
| Income Bracket | # Families | % Families |
| Less than $10,000 | 17 | 8.5% |
| $10,000 to $14,999 | 0 | 0.0% |
| $15,000 to $24,999 | 0 | 0.0% |
| $25,000 to $34,999 | 15 | 7.5% |
| $35,000 to $49,999 | 42 | 20.9% |
| $50,000 to $74,999 | 31 | 15.4% |
| $75,000 to $99,999 | 49 | 24.4% |
| $100,000 to $149,999 | 36 | 17.9% |
| $150,000 to $199,999 | 11 | 5.5% |
| $200,000+ | 0 | 0.0% |
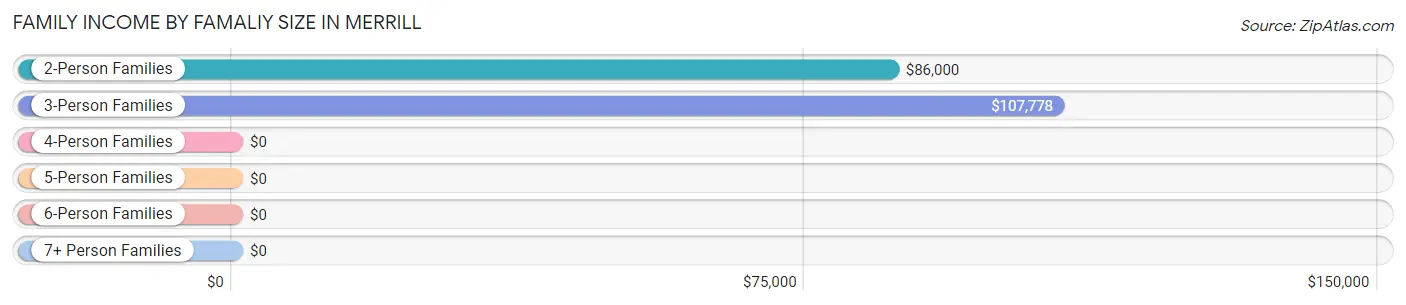
Family Income by Famaliy Size in Merrill
3-person families (30 | 14.9%) account for the highest median family income in Merrill with $107,778 per family, while 2-person families (90 | 44.8%) have the highest median income of $43,000 per family member.
| Income Bracket | # Families | Median Income |
| 2-Person Families | 90 (44.8%) | $86,000 |
| 3-Person Families | 30 (14.9%) | $107,778 |
| 4-Person Families | 57 (28.4%) | $0 |
| 5-Person Families | 1 (0.5%) | $0 |
| 6-Person Families | 14 (7.0%) | $0 |
| 7+ Person Families | 9 (4.5%) | $0 |
| Total | 201 (100.0%) | $73,393 |
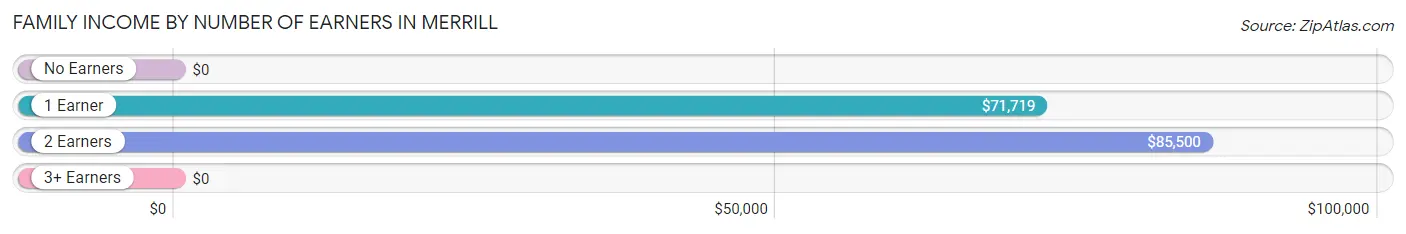
Family Income by Number of Earners in Merrill
| Number of Earners | # Families | Median Income |
| No Earners | 42 (20.9%) | $0 |
| 1 Earner | 55 (27.4%) | $71,719 |
| 2 Earners | 104 (51.7%) | $85,500 |
| 3+ Earners | 0 (0.0%) | $0 |
| Total | 201 (100.0%) | $73,393 |
Household Income in Merrill
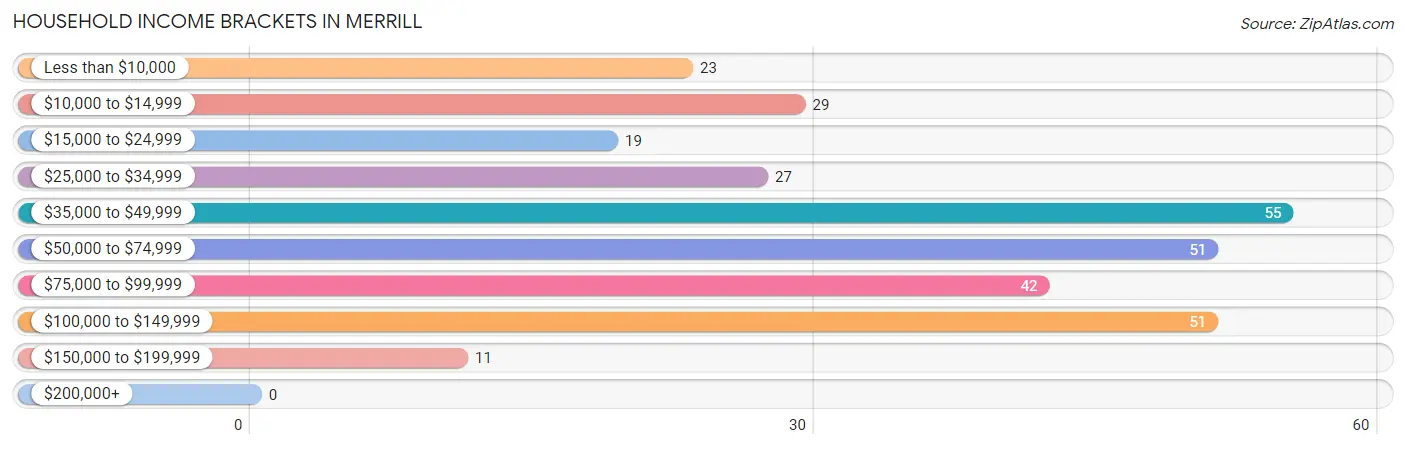
Household Income Brackets in Merrill
With 55 households falling in the category, the $35,000 to $49,999 income range is the most frequent in Merrill, accounting for 17.9% of all households.
| Income Bracket | # Households | % Households |
| Less than $10,000 | 23 | 7.5% |
| $10,000 to $14,999 | 29 | 9.4% |
| $15,000 to $24,999 | 19 | 6.2% |
| $25,000 to $34,999 | 27 | 8.8% |
| $35,000 to $49,999 | 55 | 17.9% |
| $50,000 to $74,999 | 51 | 16.6% |
| $75,000 to $99,999 | 42 | 13.6% |
| $100,000 to $149,999 | 51 | 16.6% |
| $150,000 to $199,999 | 11 | 3.6% |
| $200,000+ | 0 | 0.0% |
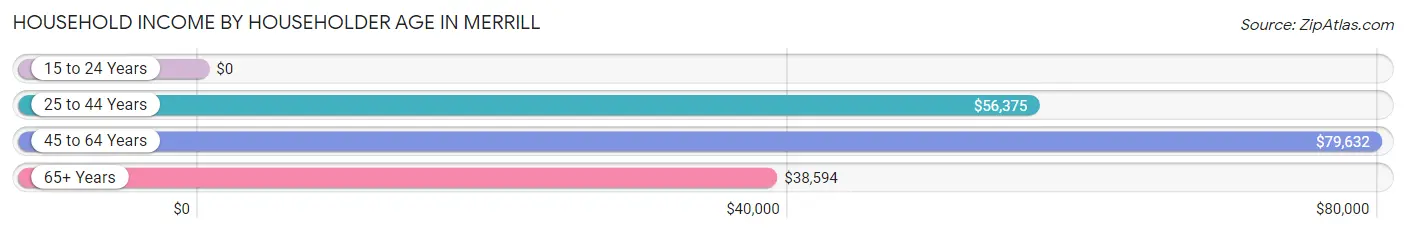
Household Income by Householder Age in Merrill
The median household income in Merrill is $52,708, with the highest median household income of $79,632 found in the 45 to 64 years age bracket for the primary householder. A total of 81 households (26.3%) fall into this category. Meanwhile, the 15 to 24 years age bracket for the primary householder has the lowest median household income of $0, with 17 households (5.5%) in this group.
| Income Bracket | # Households | Median Income |
| 15 to 24 Years | 17 (5.5%) | $0 |
| 25 to 44 Years | 129 (41.9%) | $56,375 |
| 45 to 64 Years | 81 (26.3%) | $79,632 |
| 65+ Years | 81 (26.3%) | $38,594 |
| Total | 308 (100.0%) | $52,708 |
Poverty in Merrill
Income Below Poverty by Sex and Age in Merrill
With 11.8% poverty level for males and 13.0% for females among the residents of Merrill, 5 year old males and 45 to 54 year old females are the most vulnerable to poverty, with 9 males (100.0%) and 12 females (40.0%) in their respective age groups living below the poverty level.
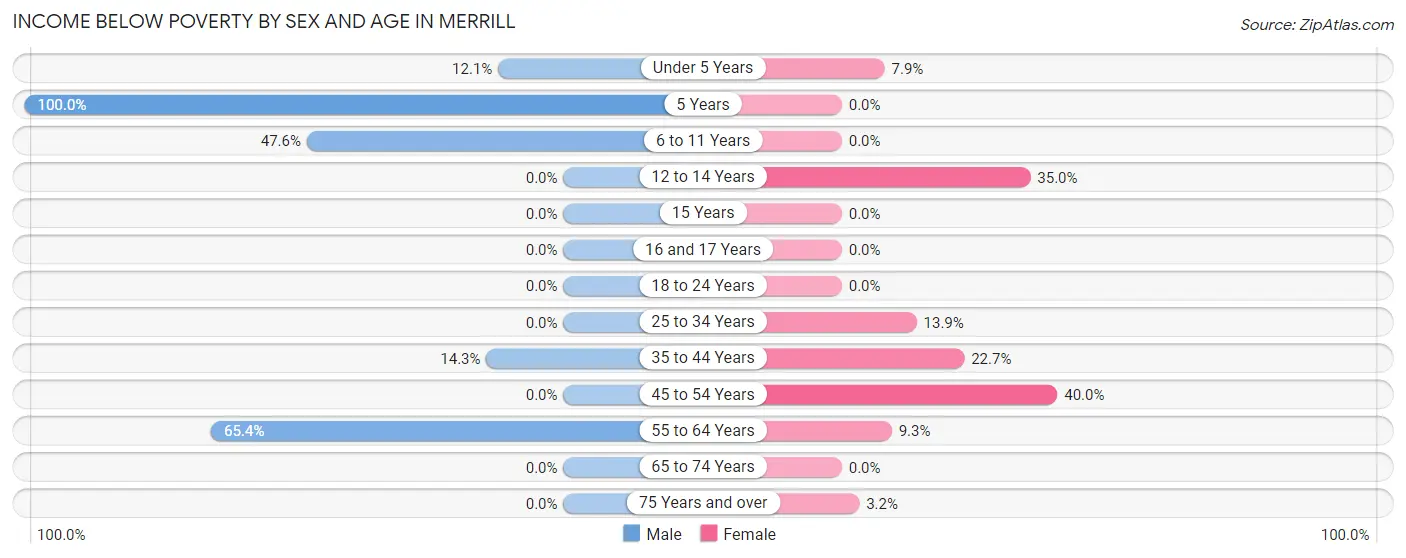
| Age Bracket | Male | Female |
| Under 5 Years | 15 (12.1%) | 5 (7.9%) |
| 5 Years | 9 (100.0%) | 0 (0.0%) |
| 6 to 11 Years | 10 (47.6%) | 0 (0.0%) |
| 12 to 14 Years | 0 (0.0%) | 7 (35.0%) |
| 15 Years | 0 (0.0%) | 0 (0.0%) |
| 16 and 17 Years | 0 (0.0%) | 0 (0.0%) |
| 18 to 24 Years | 0 (0.0%) | 0 (0.0%) |
| 25 to 34 Years | 0 (0.0%) | 10 (13.9%) |
| 35 to 44 Years | 6 (14.3%) | 15 (22.7%) |
| 45 to 54 Years | 0 (0.0%) | 12 (40.0%) |
| 55 to 64 Years | 17 (65.4%) | 5 (9.3%) |
| 65 to 74 Years | 0 (0.0%) | 0 (0.0%) |
| 75 Years and over | 0 (0.0%) | 1 (3.2%) |
| Total | 57 (11.8%) | 55 (13.0%) |
Income Above Poverty by Sex and Age in Merrill
According to the poverty statistics in Merrill, males aged 12 to 14 years and females aged 5 years are the age groups that are most secure financially, with 100.0% of males and 100.0% of females in these age groups living above the poverty line.
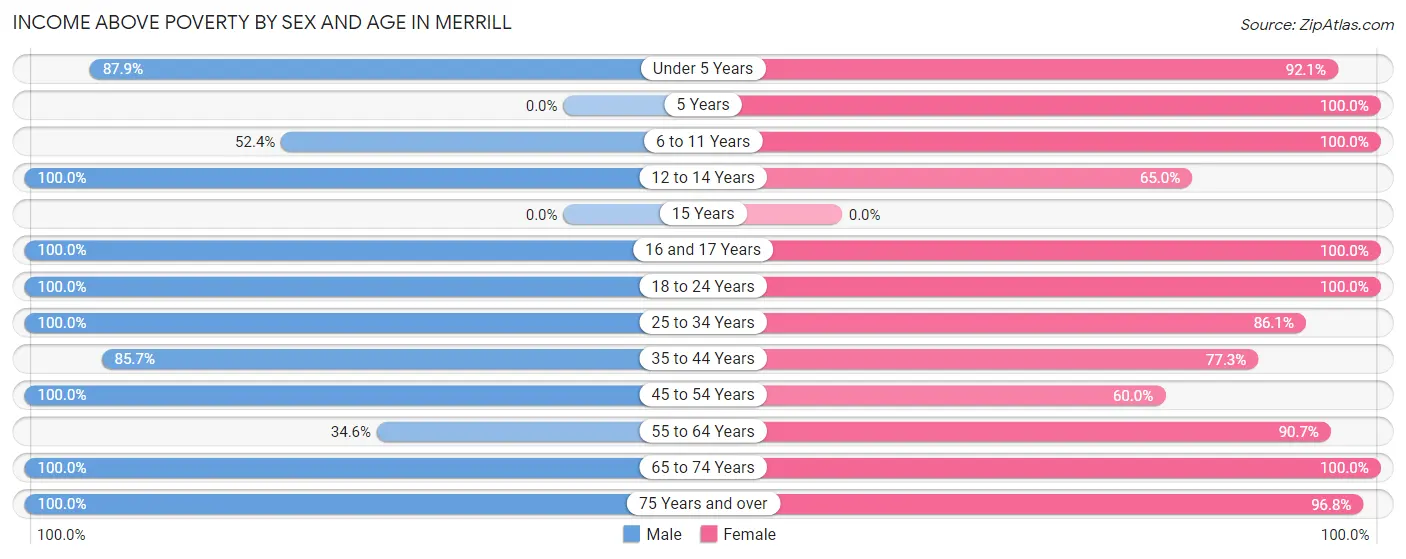
| Age Bracket | Male | Female |
| Under 5 Years | 109 (87.9%) | 58 (92.1%) |
| 5 Years | 0 (0.0%) | 8 (100.0%) |
| 6 to 11 Years | 11 (52.4%) | 13 (100.0%) |
| 12 to 14 Years | 37 (100.0%) | 13 (65.0%) |
| 15 Years | 0 (0.0%) | 0 (0.0%) |
| 16 and 17 Years | 6 (100.0%) | 15 (100.0%) |
| 18 to 24 Years | 17 (100.0%) | 25 (100.0%) |
| 25 to 34 Years | 97 (100.0%) | 62 (86.1%) |
| 35 to 44 Years | 36 (85.7%) | 51 (77.3%) |
| 45 to 54 Years | 46 (100.0%) | 18 (60.0%) |
| 55 to 64 Years | 9 (34.6%) | 49 (90.7%) |
| 65 to 74 Years | 37 (100.0%) | 25 (100.0%) |
| 75 Years and over | 21 (100.0%) | 30 (96.8%) |
| Total | 426 (88.2%) | 367 (87.0%) |
Income Below Poverty Among Married-Couple Families in Merrill
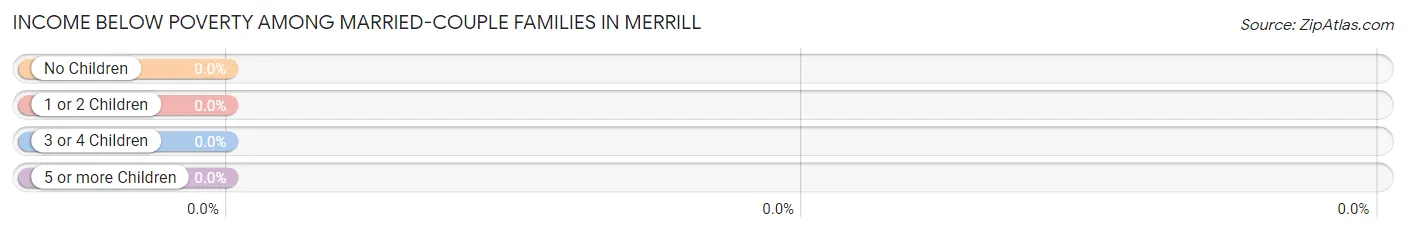
| Children | Above Poverty | Below Poverty |
| No Children | 77 (100.0%) | 0 (0.0%) |
| 1 or 2 Children | 50 (100.0%) | 0 (0.0%) |
| 3 or 4 Children | 15 (100.0%) | 0 (0.0%) |
| 5 or more Children | 0 (0.0%) | 0 (0.0%) |
| Total | 142 (100.0%) | 0 (0.0%) |
Income Below Poverty Among Single-Parent Households in Merrill
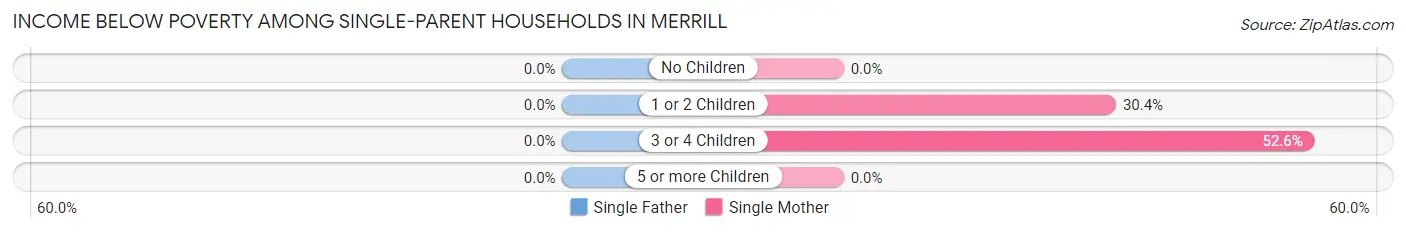
| Children | Single Father | Single Mother |
| No Children | 0 (0.0%) | 0 (0.0%) |
| 1 or 2 Children | 0 (0.0%) | 7 (30.4%) |
| 3 or 4 Children | 0 (0.0%) | 10 (52.6%) |
| 5 or more Children | 0 (0.0%) | 0 (0.0%) |
| Total | 0 (0.0%) | 17 (40.5%) |
Income Below Poverty Among Married-Couple vs Single-Parent Households in Merrill
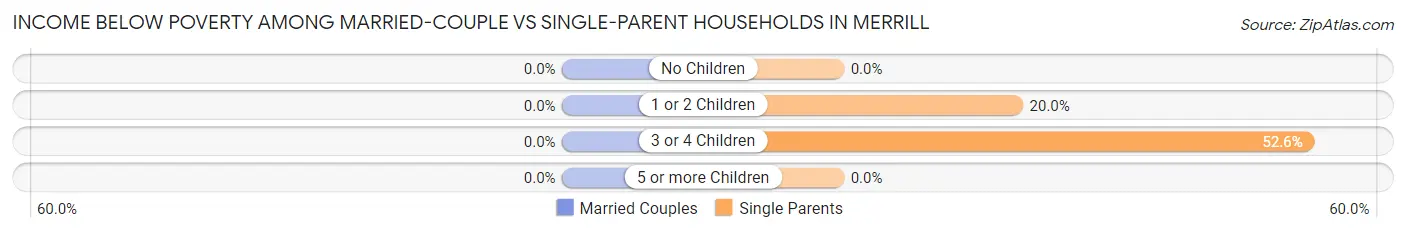
| Children | Married-Couple Families | Single-Parent Households |
| No Children | 0 (0.0%) | 0 (0.0%) |
| 1 or 2 Children | 0 (0.0%) | 7 (20.0%) |
| 3 or 4 Children | 0 (0.0%) | 10 (52.6%) |
| 5 or more Children | 0 (0.0%) | 0 (0.0%) |
| Total | 0 (0.0%) | 17 (28.8%) |
Race in Merrill
The most populous races in Merrill are White / Caucasian (718 | 79.3%), Hispanic or Latino (500 | 55.2%), and Some other Race (78 | 8.6%).
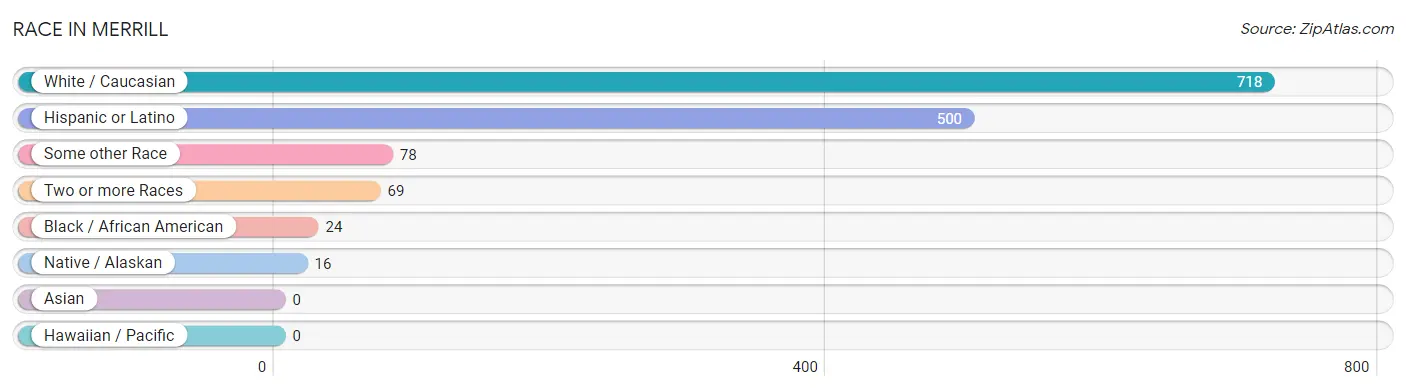
| Race | # Population | % Population |
| Asian | 0 | 0.0% |
| Black / African American | 24 | 2.6% |
| Hawaiian / Pacific | 0 | 0.0% |
| Hispanic or Latino | 500 | 55.2% |
| Native / Alaskan | 16 | 1.8% |
| White / Caucasian | 718 | 79.3% |
| Two or more Races | 69 | 7.6% |
| Some other Race | 78 | 8.6% |
| Total | 905 | 100.0% |
Ancestry in Merrill
The most populous ancestries reported in Merrill are Mexican (467 | 51.6%), Irish (105 | 11.6%), German (86 | 9.5%), English (41 | 4.5%), and American (34 | 3.8%), together accounting for 81.0% of all Merrill residents.
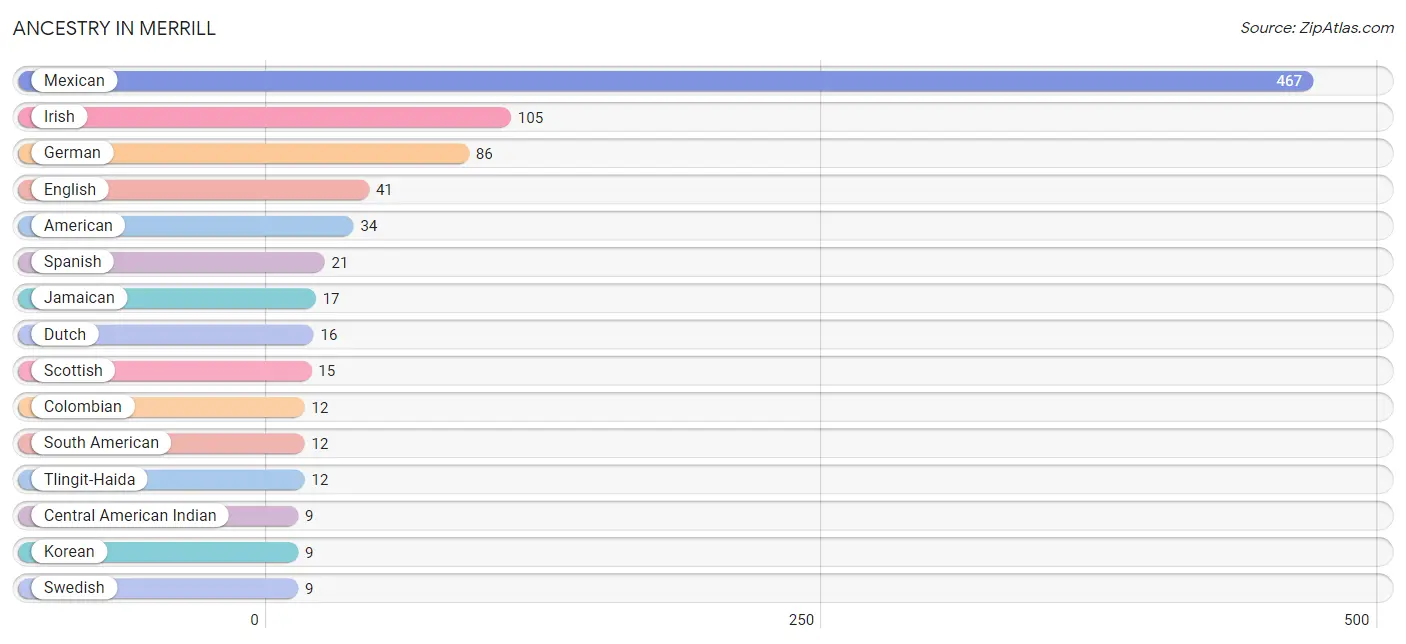
| Ancestry | # Population | % Population |
| African | 7 | 0.8% |
| American | 34 | 3.8% |
| Austrian | 6 | 0.7% |
| Celtic | 6 | 0.7% |
| Central American Indian | 9 | 1.0% |
| Colombian | 12 | 1.3% |
| Dutch | 16 | 1.8% |
| English | 41 | 4.5% |
| European | 4 | 0.4% |
| French | 6 | 0.7% |
| French Canadian | 5 | 0.5% |
| German | 86 | 9.5% |
| Irish | 105 | 11.6% |
| Italian | 7 | 0.8% |
| Jamaican | 17 | 1.9% |
| Korean | 9 | 1.0% |
| Mexican | 467 | 51.6% |
| Scandinavian | 5 | 0.5% |
| Scottish | 15 | 1.7% |
| South American | 12 | 1.3% |
| Spanish | 21 | 2.3% |
| Subsaharan African | 7 | 0.8% |
| Swedish | 9 | 1.0% |
| Tlingit-Haida | 12 | 1.3% |
| Yugoslavian | 2 | 0.2% | View All 25 Rows |
Immigrants in Merrill
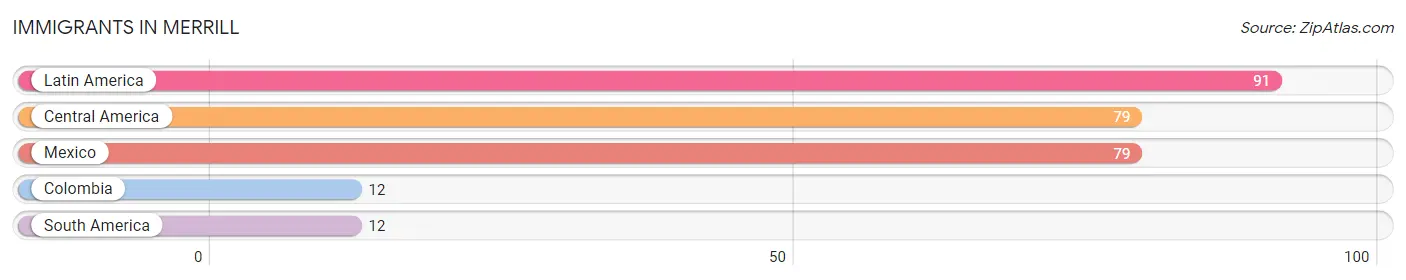
The most numerous immigrant groups reported in Merrill came from Latin America (91 | 10.1%), Central America (79 | 8.7%), Mexico (79 | 8.7%), Colombia (12 | 1.3%), and South America (12 | 1.3%), together accounting for 30.2% of all Merrill residents.
| Immigration Origin | # Population | % Population |
| Central America | 79 | 8.7% |
| Colombia | 12 | 1.3% |
| Latin America | 91 | 10.1% |
| Mexico | 79 | 8.7% |
| South America | 12 | 1.3% | View All 5 Rows |
Sex and Age in Merrill
Sex and Age in Merrill
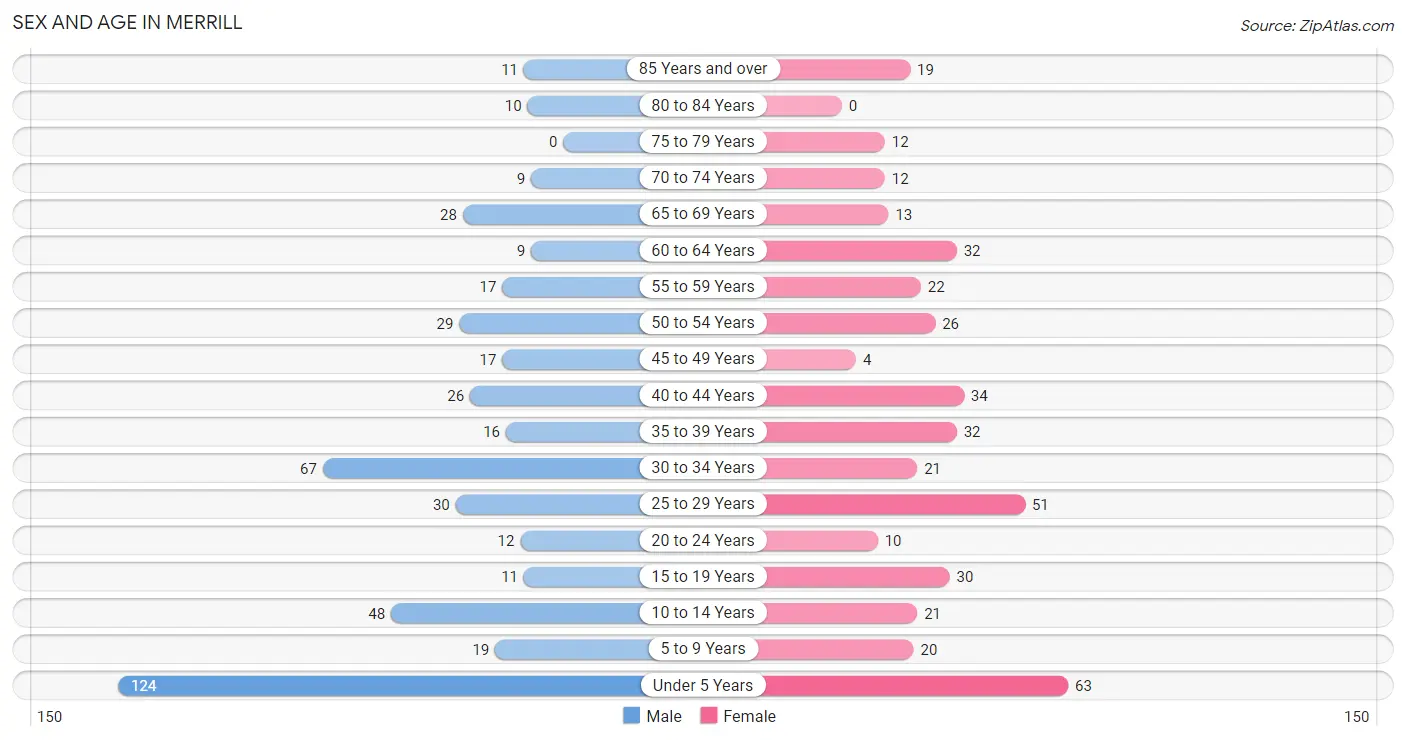
The most populous age groups in Merrill are Under 5 Years (124 | 25.7%) for men and Under 5 Years (63 | 14.9%) for women.
| Age Bracket | Male | Female |
| Under 5 Years | 124 (25.7%) | 63 (14.9%) |
| 5 to 9 Years | 19 (3.9%) | 20 (4.7%) |
| 10 to 14 Years | 48 (9.9%) | 21 (5.0%) |
| 15 to 19 Years | 11 (2.3%) | 30 (7.1%) |
| 20 to 24 Years | 12 (2.5%) | 10 (2.4%) |
| 25 to 29 Years | 30 (6.2%) | 51 (12.1%) |
| 30 to 34 Years | 67 (13.9%) | 21 (5.0%) |
| 35 to 39 Years | 16 (3.3%) | 32 (7.6%) |
| 40 to 44 Years | 26 (5.4%) | 34 (8.1%) |
| 45 to 49 Years | 17 (3.5%) | 4 (0.9%) |
| 50 to 54 Years | 29 (6.0%) | 26 (6.2%) |
| 55 to 59 Years | 17 (3.5%) | 22 (5.2%) |
| 60 to 64 Years | 9 (1.9%) | 32 (7.6%) |
| 65 to 69 Years | 28 (5.8%) | 13 (3.1%) |
| 70 to 74 Years | 9 (1.9%) | 12 (2.8%) |
| 75 to 79 Years | 0 (0.0%) | 12 (2.8%) |
| 80 to 84 Years | 10 (2.1%) | 0 (0.0%) |
| 85 Years and over | 11 (2.3%) | 19 (4.5%) |
| Total | 483 (100.0%) | 422 (100.0%) |
Families and Households in Merrill
Median Family Size in Merrill
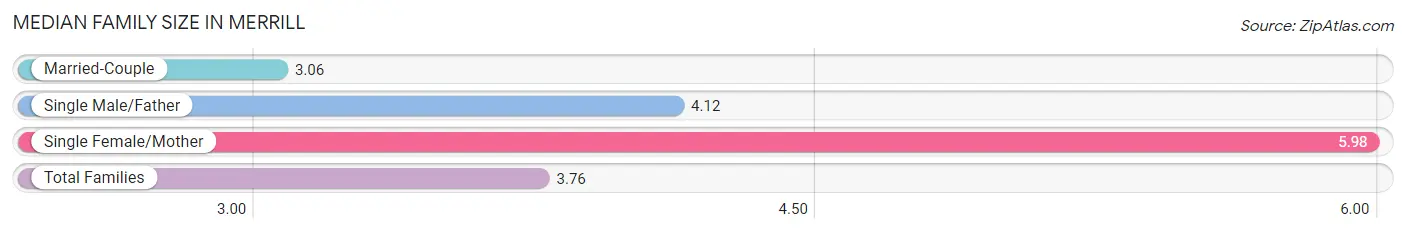
The median family size in Merrill is 3.76 persons per family, with single female/mother families (42 | 20.9%) accounting for the largest median family size of 5.98 persons per family. On the other hand, married-couple families (142 | 70.7%) represent the smallest median family size with 3.06 persons per family.
| Family Type | # Families | Family Size |
| Married-Couple | 142 (70.7%) | 3.06 |
| Single Male/Father | 17 (8.5%) | 4.12 |
| Single Female/Mother | 42 (20.9%) | 5.98 |
| Total Families | 201 (100.0%) | 3.76 |
Median Household Size in Merrill
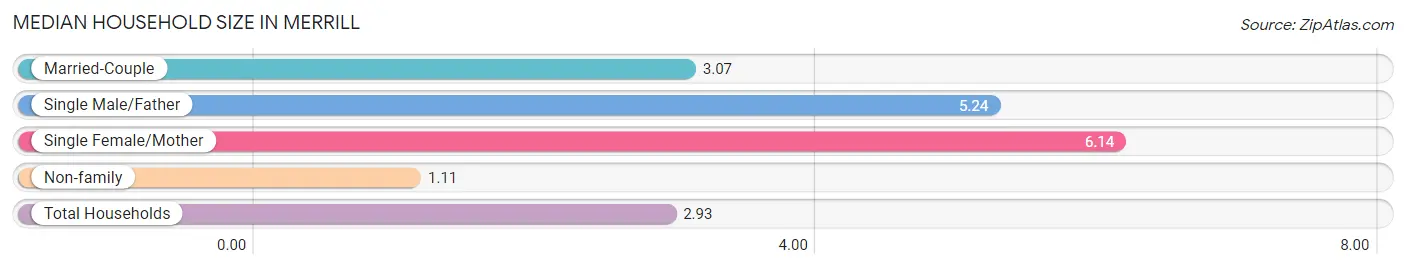
The median household size in Merrill is 2.93 persons per household, with single female/mother households (42 | 13.6%) accounting for the largest median household size of 6.14 persons per household. non-family households (107 | 34.7%) represent the smallest median household size with 1.11 persons per household.
| Household Type | # Households | Household Size |
| Married-Couple | 142 (46.1%) | 3.07 |
| Single Male/Father | 17 (5.5%) | 5.24 |
| Single Female/Mother | 42 (13.6%) | 6.14 |
| Non-family | 107 (34.7%) | 1.11 |
| Total Households | 308 (100.0%) | 2.93 |
Household Size by Marriage Status in Merrill
Out of a total of 308 households in Merrill, 201 (65.3%) are family households, while 107 (34.7%) are nonfamily households. The most numerous type of family households are 2-person households, comprising 85, and the most common type of nonfamily households are 1-person households, comprising 100.
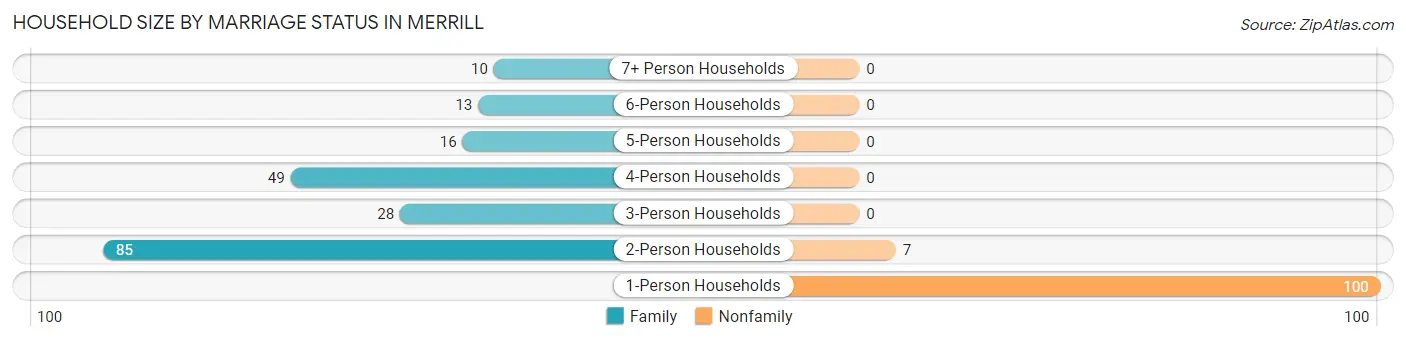
| Household Size | Family Households | Nonfamily Households |
| 1-Person Households | - | 100 (32.5%) |
| 2-Person Households | 85 (27.6%) | 7 (2.3%) |
| 3-Person Households | 28 (9.1%) | 0 (0.0%) |
| 4-Person Households | 49 (15.9%) | 0 (0.0%) |
| 5-Person Households | 16 (5.2%) | 0 (0.0%) |
| 6-Person Households | 13 (4.2%) | 0 (0.0%) |
| 7+ Person Households | 10 (3.3%) | 0 (0.0%) |
| Total | 201 (65.3%) | 107 (34.7%) |
Female Fertility in Merrill
Fertility by Age in Merrill
Average fertility rate in Merrill is 110.0 births per 1,000 women. Women in the age bracket of 20 to 34 years have the highest fertility rate with 244.0 births per 1,000 women. Women in the age bracket of 20 to 34 years acount for 100.0% of all women with births.
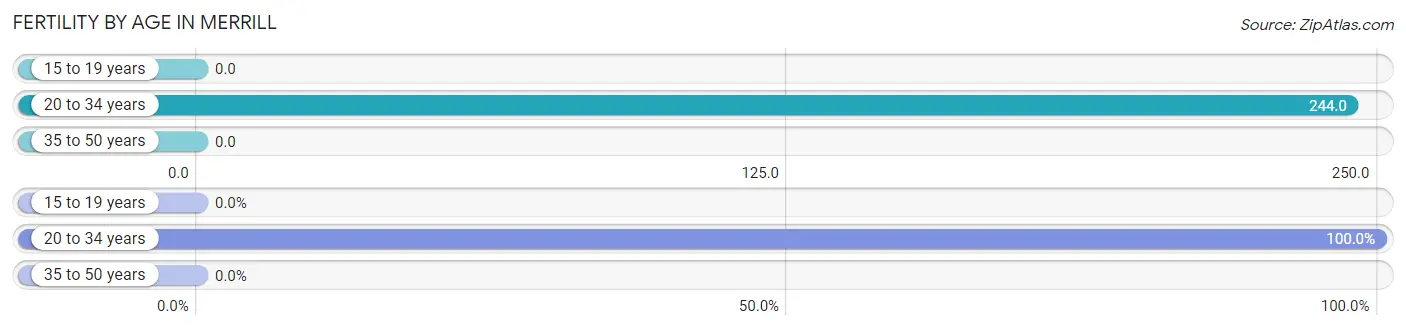
| Age Bracket | Women with Births | Births / 1,000 Women |
| 15 to 19 years | 0 (0.0%) | 0.0 |
| 20 to 34 years | 20 (100.0%) | 244.0 |
| 35 to 50 years | 0 (0.0%) | 0.0 |
| Total | 20 (100.0%) | 110.0 |
Fertility by Age by Marriage Status in Merrill
50.0% of women with births (20) in Merrill are married. The highest percentage of unmarried women with births falls into 20 to 34 years age bracket with 50.0% of them unmarried at the time of birth, while the lowest percentage of unmarried women with births belong to 20 to 34 years age bracket with 50.0% of them unmarried.
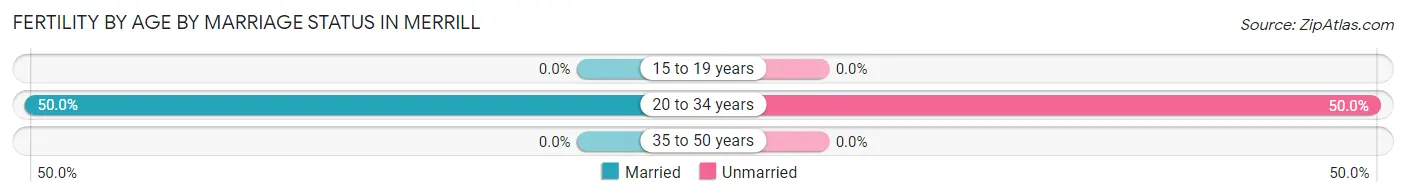
| Age Bracket | Married | Unmarried |
| 15 to 19 years | 0 (0.0%) | 0 (0.0%) |
| 20 to 34 years | 10 (50.0%) | 10 (50.0%) |
| 35 to 50 years | 0 (0.0%) | 0 (0.0%) |
| Total | 10 (50.0%) | 10 (50.0%) |
Fertility by Education in Merrill
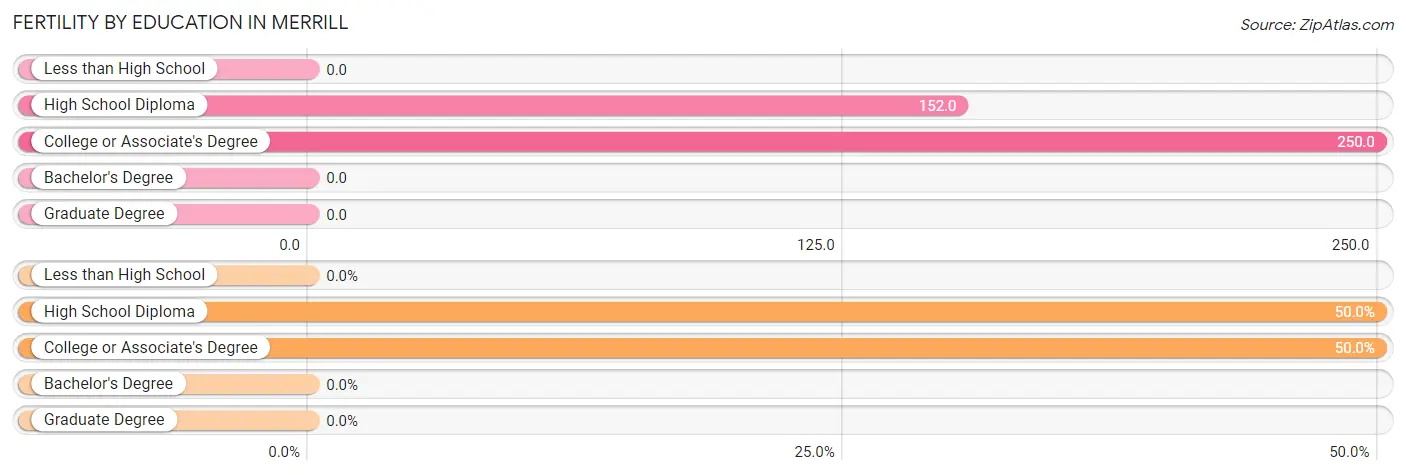
| Educational Attainment | Women with Births | Births / 1,000 Women |
| Less than High School | 0 (0.0%) | 0.0 |
| High School Diploma | 10 (50.0%) | 152.0 |
| College or Associate's Degree | 10 (50.0%) | 250.0 |
| Bachelor's Degree | 0 (0.0%) | 0.0 |
| Graduate Degree | 0 (0.0%) | 0.0 |
| Total | 20 (100.0%) | 110.0 |
Fertility by Education by Marriage Status in Merrill
50.0% of women with births in Merrill are unmarried. Women with the educational attainment of high school diploma are most likely to be married with 100.0% of them married at childbirth, while women with the educational attainment of college or associate's degree are least likely to be married with 100.0% of them unmarried at childbirth.
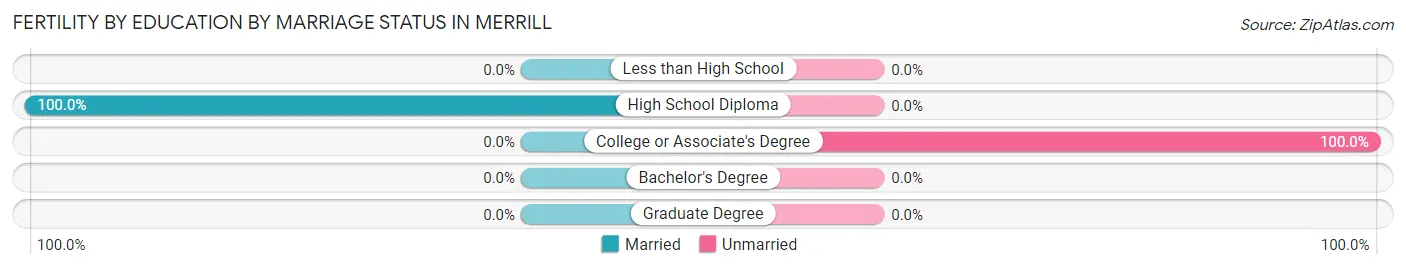
| Educational Attainment | Married | Unmarried |
| Less than High School | 0 (0.0%) | 0 (0.0%) |
| High School Diploma | 10 (100.0%) | 0 (0.0%) |
| College or Associate's Degree | 0 (0.0%) | 10 (100.0%) |
| Bachelor's Degree | 0 (0.0%) | 0 (0.0%) |
| Graduate Degree | 0 (0.0%) | 0 (0.0%) |
| Total | 10 (50.0%) | 10 (50.0%) |
Employment Characteristics in Merrill
Employment by Class of Employer in Merrill
Among the 317 employed individuals in Merrill, private company employees (208 | 65.6%), local government employees (34 | 10.7%), and not-for-profit organizations (25 | 7.9%) make up the most common classes of employment.
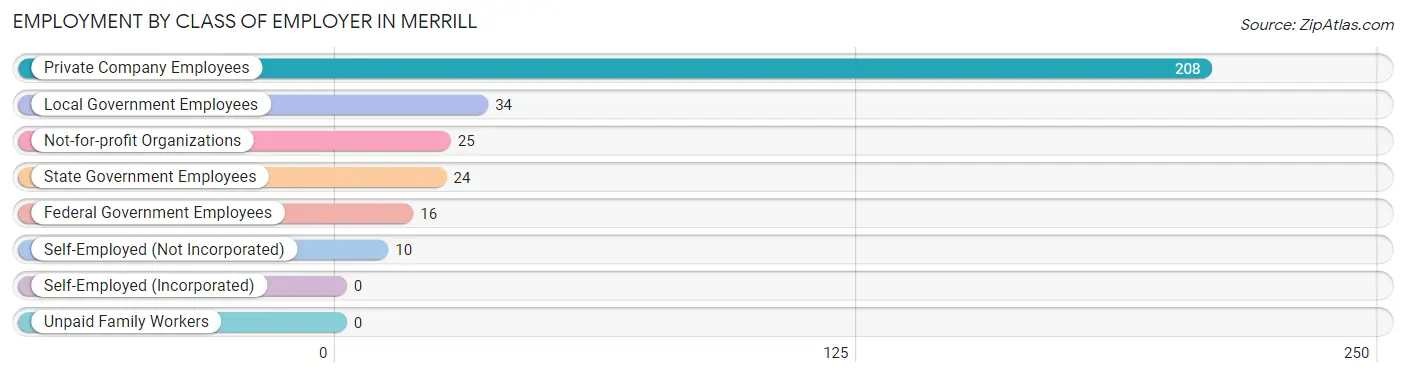
| Employer Class | # Employees | % Employees |
| Private Company Employees | 208 | 65.6% |
| Self-Employed (Incorporated) | 0 | 0.0% |
| Self-Employed (Not Incorporated) | 10 | 3.2% |
| Not-for-profit Organizations | 25 | 7.9% |
| Local Government Employees | 34 | 10.7% |
| State Government Employees | 24 | 7.6% |
| Federal Government Employees | 16 | 5.1% |
| Unpaid Family Workers | 0 | 0.0% |
| Total | 317 | 100.0% |
Employment Status by Age in Merrill
According to the labor force statistics for Merrill, out of the total population over 16 years of age (610), 59.0% or 360 individuals are in the labor force, with 10.3% or 37 of them unemployed. The age group with the highest labor force participation rate is 30 to 34 years, with 92.0% or 81 individuals in the labor force. Within the labor force, the 30 to 34 years age range has the highest percentage of unemployed individuals, with 44.4% or 36 of them being unemployed.
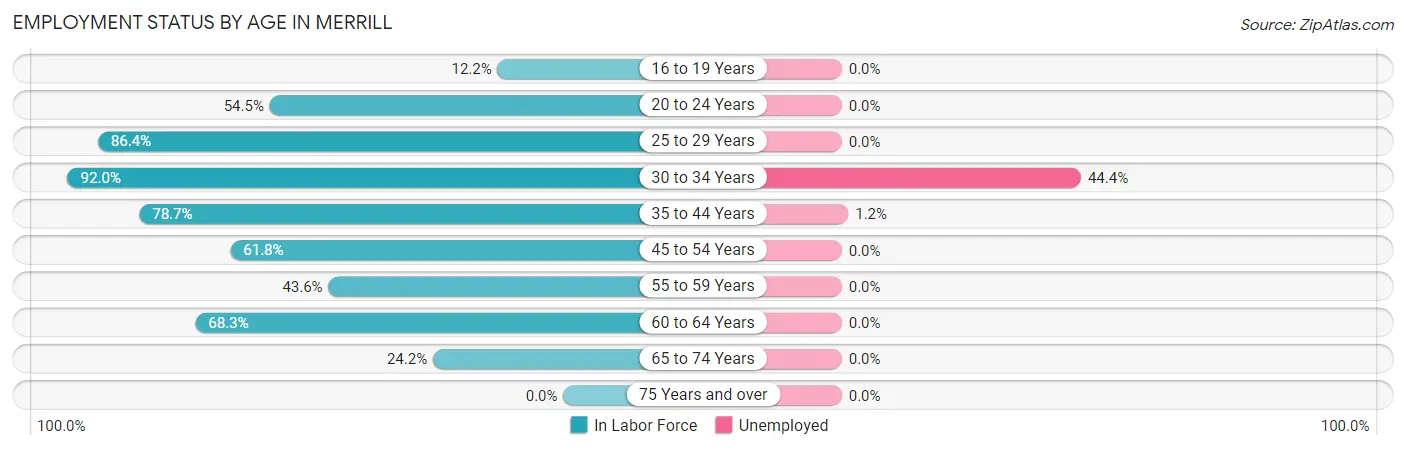
| Age Bracket | In Labor Force | Unemployed |
| 16 to 19 Years | 5 (12.2%) | 0 (0.0%) |
| 20 to 24 Years | 12 (54.5%) | 0 (0.0%) |
| 25 to 29 Years | 70 (86.4%) | 0 (0.0%) |
| 30 to 34 Years | 81 (92.0%) | 36 (44.4%) |
| 35 to 44 Years | 85 (78.7%) | 1 (1.2%) |
| 45 to 54 Years | 47 (61.8%) | 0 (0.0%) |
| 55 to 59 Years | 17 (43.6%) | 0 (0.0%) |
| 60 to 64 Years | 28 (68.3%) | 0 (0.0%) |
| 65 to 74 Years | 15 (24.2%) | 0 (0.0%) |
| 75 Years and over | 0 (0.0%) | 0 (0.0%) |
| Total | 360 (59.0%) | 37 (10.3%) |
Employment Status by Educational Attainment in Merrill
According to labor force statistics for Merrill, 75.8% of individuals (328) out of the total population between 25 and 64 years of age (433) are in the labor force, with 11.3% or 37 of them being unemployed. The group with the highest labor force participation rate are those with the educational attainment of bachelor's degree or higher, with 81.8% or 45 individuals in the labor force. Within the labor force, individuals with less than high school education have the highest percentage of unemployment, with 20.0% or 10 of them being unemployed.
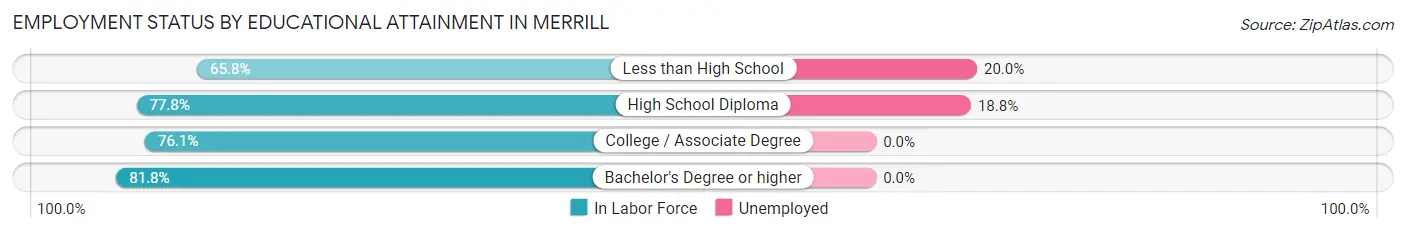
| Educational Attainment | In Labor Force | Unemployed |
| Less than High School | 50 (65.8%) | 15 (20.0%) |
| High School Diploma | 144 (77.8%) | 35 (18.8%) |
| College / Associate Degree | 89 (76.1%) | 0 (0.0%) |
| Bachelor's Degree or higher | 45 (81.8%) | 0 (0.0%) |
| Total | 328 (75.8%) | 49 (11.3%) |
Employment Occupations by Sex in Merrill
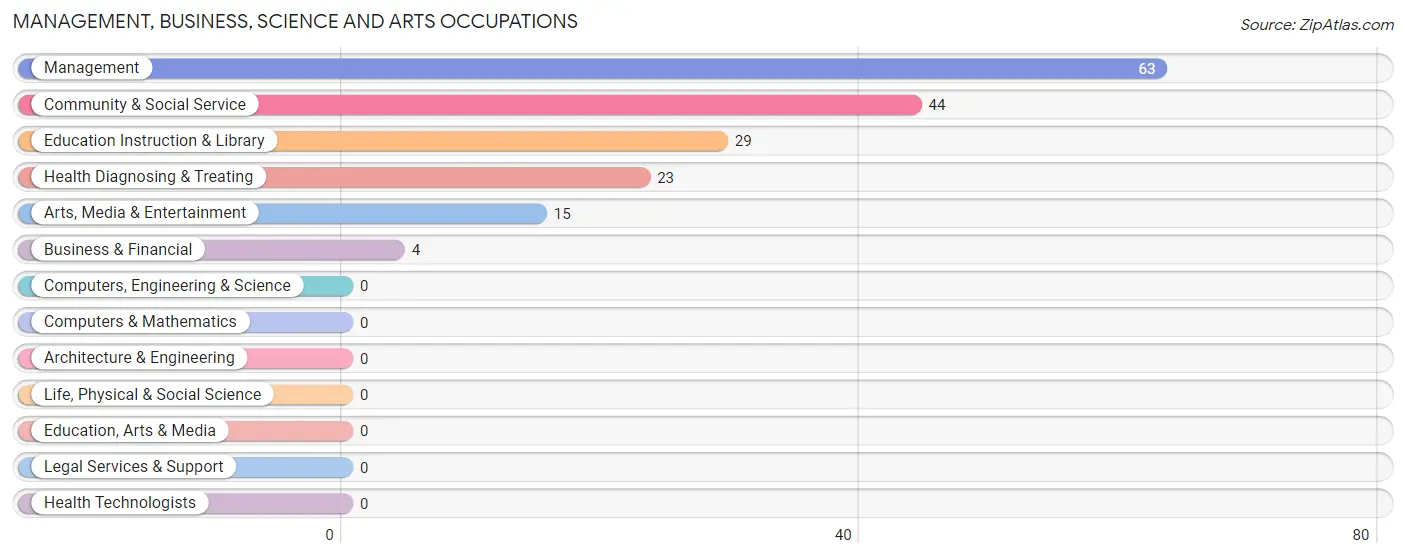
Management, Business, Science and Arts Occupations
The most common Management, Business, Science and Arts occupations in Merrill are Management (63 | 19.5%), Community & Social Service (44 | 13.6%), Education Instruction & Library (29 | 9.0%), Health Diagnosing & Treating (23 | 7.1%), and Arts, Media & Entertainment (15 | 4.6%).
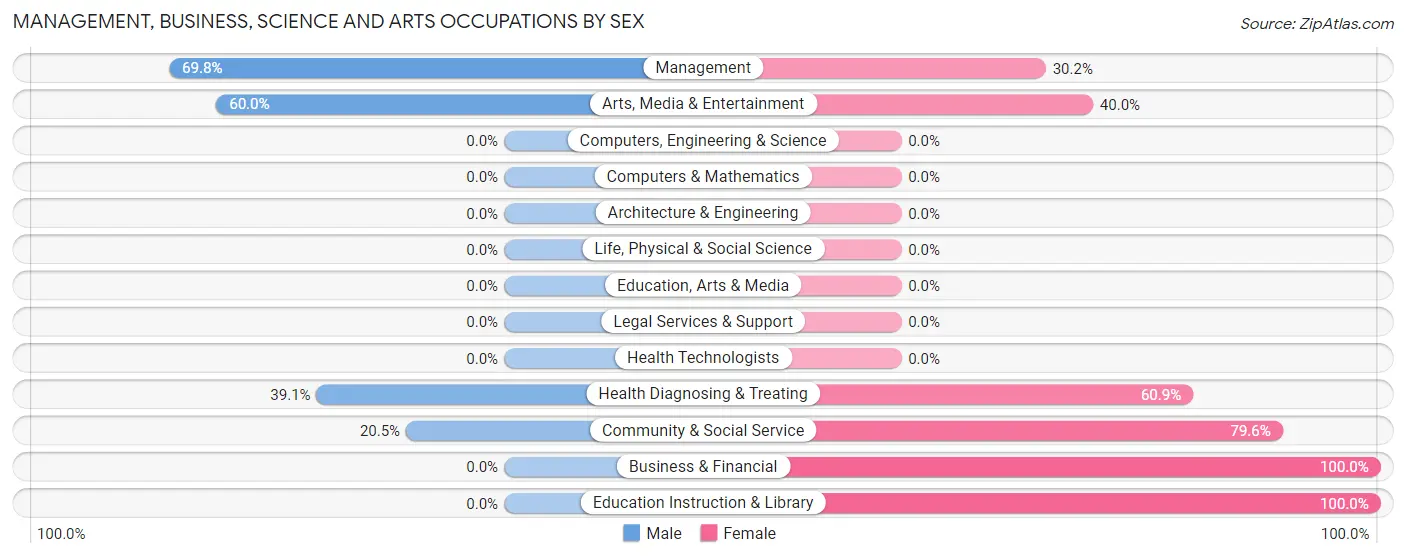
Management, Business, Science and Arts Occupations by Sex
Within the Management, Business, Science and Arts occupations in Merrill, the most male-oriented occupations are Management (69.8%), Arts, Media & Entertainment (60.0%), and Health Diagnosing & Treating (39.1%), while the most female-oriented occupations are Business & Financial (100.0%), Education Instruction & Library (100.0%), and Community & Social Service (79.5%).
| Occupation | Male | Female |
| Management | 44 (69.8%) | 19 (30.2%) |
| Business & Financial | 0 (0.0%) | 4 (100.0%) |
| Computers, Engineering & Science | 0 (0.0%) | 0 (0.0%) |
| Computers & Mathematics | 0 (0.0%) | 0 (0.0%) |
| Architecture & Engineering | 0 (0.0%) | 0 (0.0%) |
| Life, Physical & Social Science | 0 (0.0%) | 0 (0.0%) |
| Community & Social Service | 9 (20.4%) | 35 (79.5%) |
| Education, Arts & Media | 0 (0.0%) | 0 (0.0%) |
| Legal Services & Support | 0 (0.0%) | 0 (0.0%) |
| Education Instruction & Library | 0 (0.0%) | 29 (100.0%) |
| Arts, Media & Entertainment | 9 (60.0%) | 6 (40.0%) |
| Health Diagnosing & Treating | 9 (39.1%) | 14 (60.9%) |
| Health Technologists | 0 (0.0%) | 0 (0.0%) |
| Total (Category) | 62 (46.3%) | 72 (53.7%) |
| Total (Overall) | 181 (56.0%) | 142 (44.0%) |
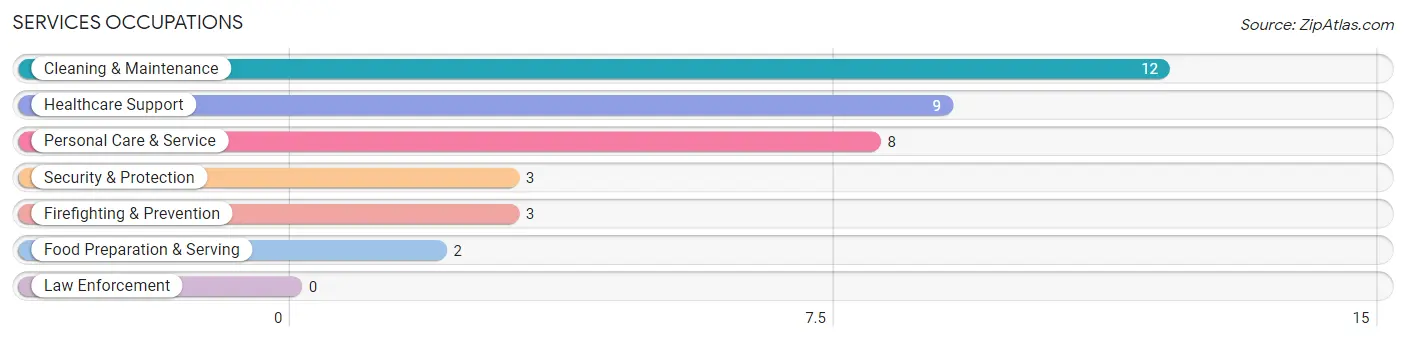
Services Occupations
The most common Services occupations in Merrill are Cleaning & Maintenance (12 | 3.7%), Healthcare Support (9 | 2.8%), Personal Care & Service (8 | 2.5%), Security & Protection (3 | 0.9%), and Firefighting & Prevention (3 | 0.9%).
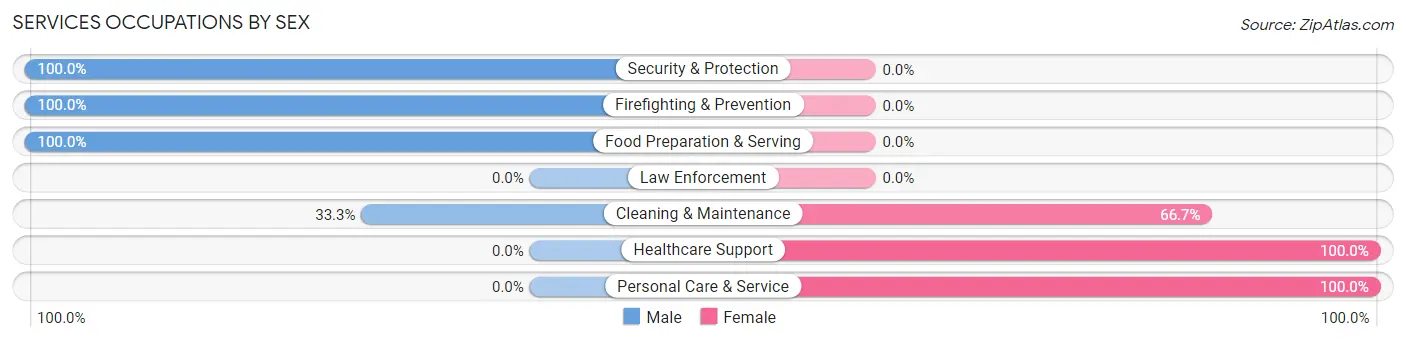
Services Occupations by Sex
Within the Services occupations in Merrill, the most male-oriented occupations are Security & Protection (100.0%), Firefighting & Prevention (100.0%), and Food Preparation & Serving (100.0%), while the most female-oriented occupations are Healthcare Support (100.0%), Personal Care & Service (100.0%), and Cleaning & Maintenance (66.7%).
| Occupation | Male | Female |
| Healthcare Support | 0 (0.0%) | 9 (100.0%) |
| Security & Protection | 3 (100.0%) | 0 (0.0%) |
| Firefighting & Prevention | 3 (100.0%) | 0 (0.0%) |
| Law Enforcement | 0 (0.0%) | 0 (0.0%) |
| Food Preparation & Serving | 2 (100.0%) | 0 (0.0%) |
| Cleaning & Maintenance | 4 (33.3%) | 8 (66.7%) |
| Personal Care & Service | 0 (0.0%) | 8 (100.0%) |
| Total (Category) | 9 (26.5%) | 25 (73.5%) |
| Total (Overall) | 181 (56.0%) | 142 (44.0%) |
Sales and Office Occupations
The most common Sales and Office occupations in Merrill are Office & Administration (42 | 13.0%), and Sales & Related (19 | 5.9%).
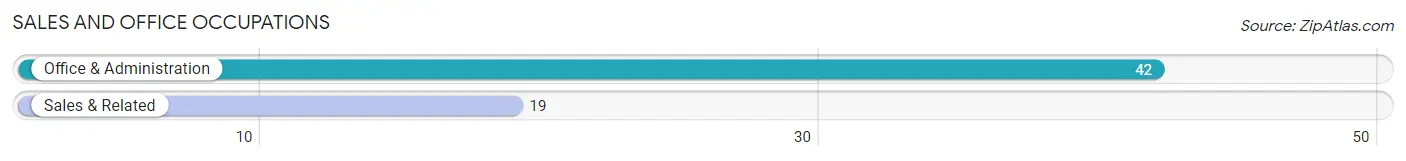
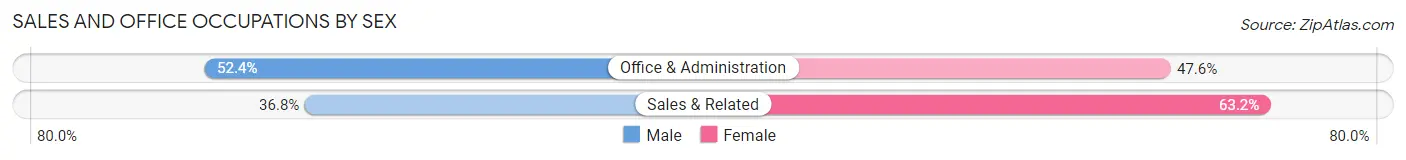
Sales and Office Occupations by Sex
| Occupation | Male | Female |
| Sales & Related | 7 (36.8%) | 12 (63.2%) |
| Office & Administration | 22 (52.4%) | 20 (47.6%) |
| Total (Category) | 29 (47.5%) | 32 (52.5%) |
| Total (Overall) | 181 (56.0%) | 142 (44.0%) |
Natural Resources, Construction and Maintenance Occupations
The most common Natural Resources, Construction and Maintenance occupations in Merrill are Farming, Fishing & Forestry (34 | 10.5%), and Construction & Extraction (18 | 5.6%).
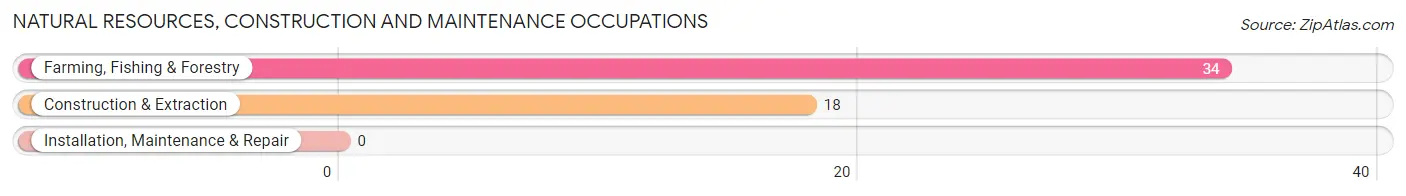
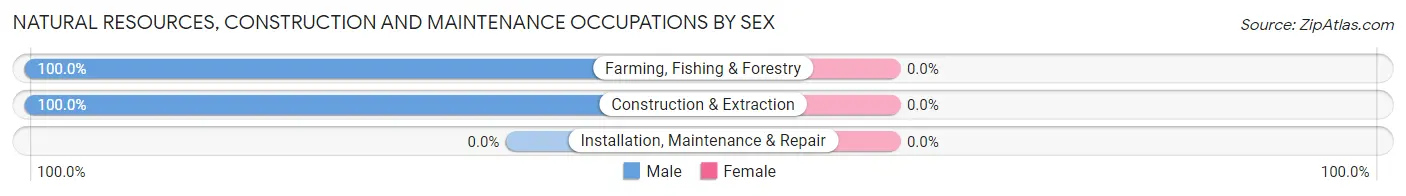
Natural Resources, Construction and Maintenance Occupations by Sex
| Occupation | Male | Female |
| Farming, Fishing & Forestry | 34 (100.0%) | 0 (0.0%) |
| Construction & Extraction | 18 (100.0%) | 0 (0.0%) |
| Installation, Maintenance & Repair | 0 (0.0%) | 0 (0.0%) |
| Total (Category) | 52 (100.0%) | 0 (0.0%) |
| Total (Overall) | 181 (56.0%) | 142 (44.0%) |
Production, Transportation and Moving Occupations
The most common Production, Transportation and Moving occupations in Merrill are Production (25 | 7.7%), and Transportation (17 | 5.3%).
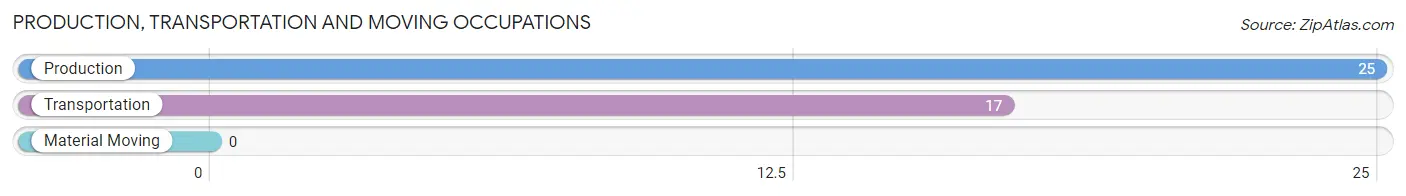
Production, Transportation and Moving Occupations by Sex
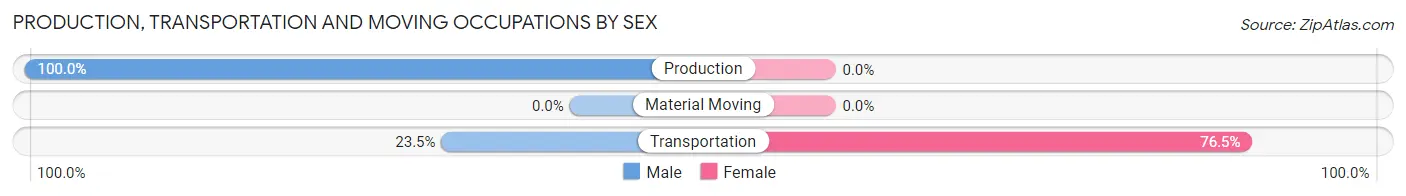
| Occupation | Male | Female |
| Production | 25 (100.0%) | 0 (0.0%) |
| Transportation | 4 (23.5%) | 13 (76.5%) |
| Material Moving | 0 (0.0%) | 0 (0.0%) |
| Total (Category) | 29 (69.1%) | 13 (30.9%) |
| Total (Overall) | 181 (56.0%) | 142 (44.0%) |
Employment Industries by Sex in Merrill
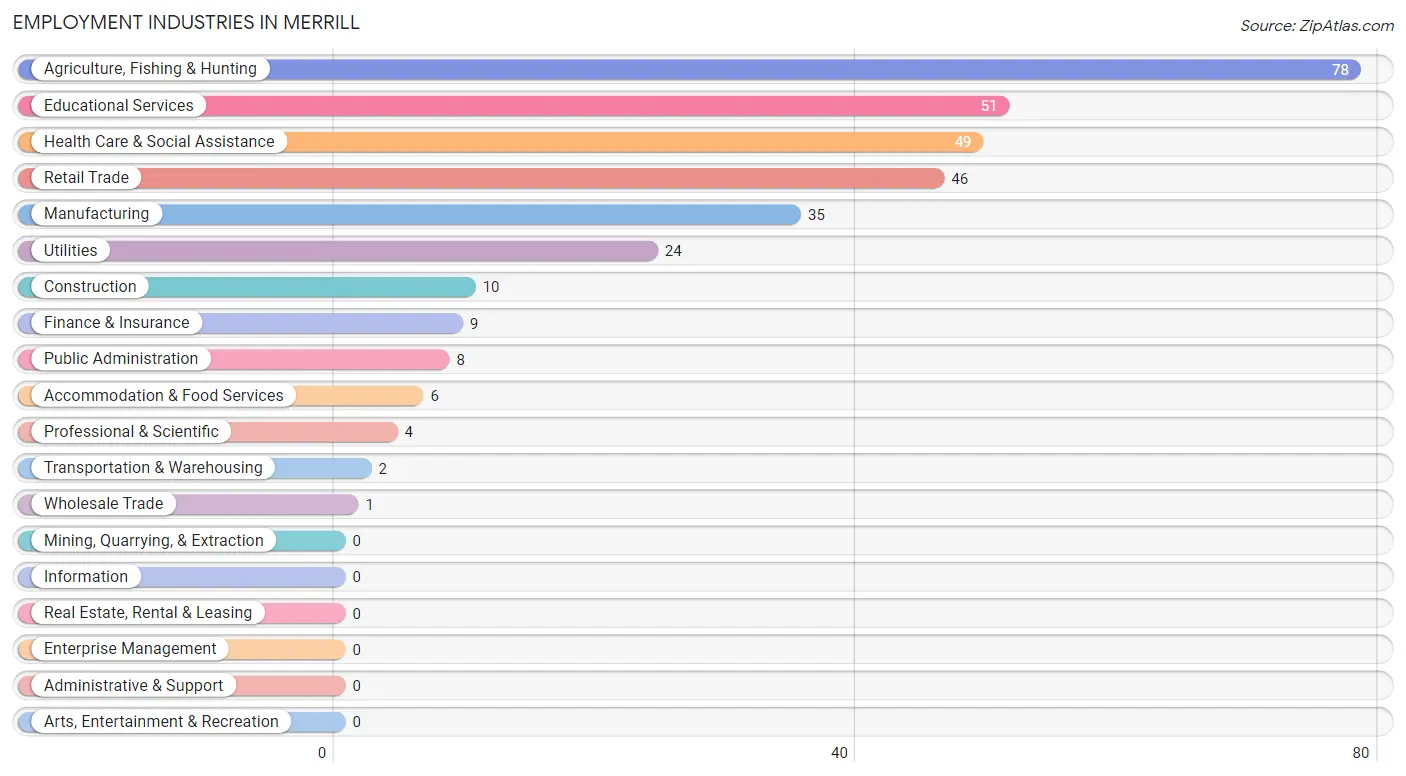
Employment Industries in Merrill
The major employment industries in Merrill include Agriculture, Fishing & Hunting (78 | 24.1%), Educational Services (51 | 15.8%), Health Care & Social Assistance (49 | 15.2%), Retail Trade (46 | 14.2%), and Manufacturing (35 | 10.8%).
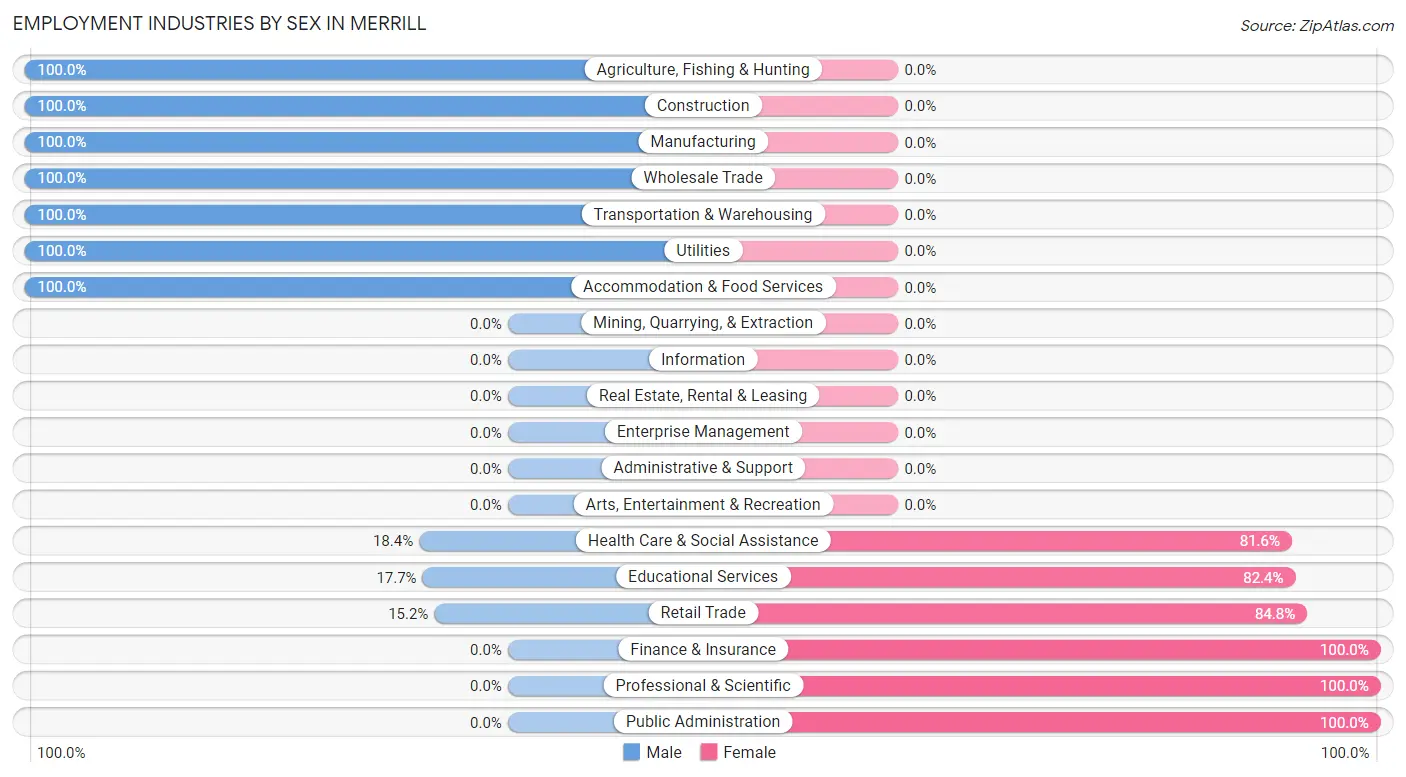
Employment Industries by Sex in Merrill
The Merrill industries that see more men than women are Agriculture, Fishing & Hunting (100.0%), Construction (100.0%), and Manufacturing (100.0%), whereas the industries that tend to have a higher number of women are Finance & Insurance (100.0%), Professional & Scientific (100.0%), and Public Administration (100.0%).
| Industry | Male | Female |
| Agriculture, Fishing & Hunting | 78 (100.0%) | 0 (0.0%) |
| Mining, Quarrying, & Extraction | 0 (0.0%) | 0 (0.0%) |
| Construction | 10 (100.0%) | 0 (0.0%) |
| Manufacturing | 35 (100.0%) | 0 (0.0%) |
| Wholesale Trade | 1 (100.0%) | 0 (0.0%) |
| Retail Trade | 7 (15.2%) | 39 (84.8%) |
| Transportation & Warehousing | 2 (100.0%) | 0 (0.0%) |
| Utilities | 24 (100.0%) | 0 (0.0%) |
| Information | 0 (0.0%) | 0 (0.0%) |
| Finance & Insurance | 0 (0.0%) | 9 (100.0%) |
| Real Estate, Rental & Leasing | 0 (0.0%) | 0 (0.0%) |
| Professional & Scientific | 0 (0.0%) | 4 (100.0%) |
| Enterprise Management | 0 (0.0%) | 0 (0.0%) |
| Administrative & Support | 0 (0.0%) | 0 (0.0%) |
| Educational Services | 9 (17.6%) | 42 (82.4%) |
| Health Care & Social Assistance | 9 (18.4%) | 40 (81.6%) |
| Arts, Entertainment & Recreation | 0 (0.0%) | 0 (0.0%) |
| Accommodation & Food Services | 6 (100.0%) | 0 (0.0%) |
| Public Administration | 0 (0.0%) | 8 (100.0%) |
| Total | 181 (56.0%) | 142 (44.0%) |
Education in Merrill
School Enrollment in Merrill
The most common levels of schooling among the 185 students in Merrill are middle school (57 | 30.8%), high school (43 | 23.2%), and college / undergraduate (30 | 16.2%).
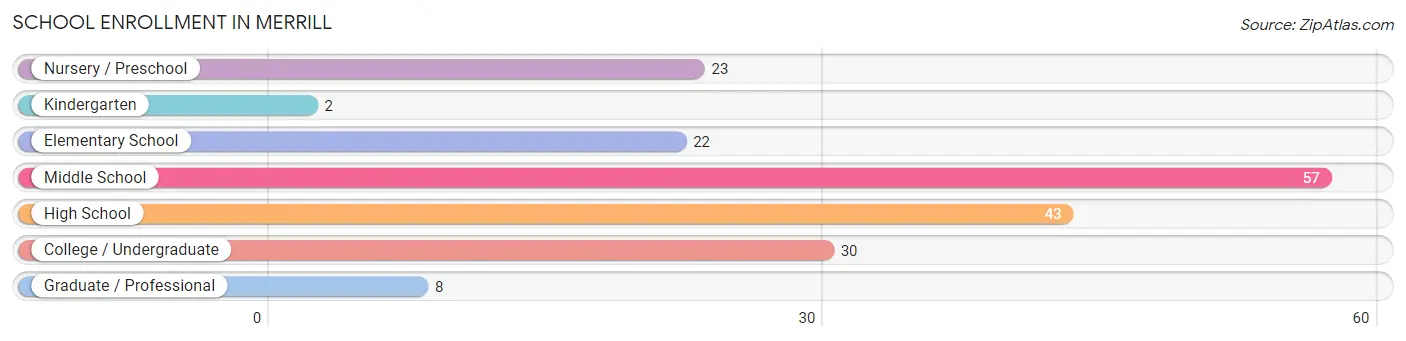
| School Level | # Students | % Students |
| Nursery / Preschool | 23 | 12.4% |
| Kindergarten | 2 | 1.1% |
| Elementary School | 22 | 11.9% |
| Middle School | 57 | 30.8% |
| High School | 43 | 23.2% |
| College / Undergraduate | 30 | 16.2% |
| Graduate / Professional | 8 | 4.3% |
| Total | 185 | 100.0% |
School Enrollment by Age by Funding Source in Merrill
Out of a total of 185 students who are enrolled in schools in Merrill, 7 (3.8%) attend a private institution, while the remaining 178 (96.2%) are enrolled in public schools. The age group of 10 to 14 year olds has the highest likelihood of being enrolled in private schools, with 7 (10.8% in the age bracket) enrolled. Conversely, the age group of 3 to 4 year olds has the lowest likelihood of being enrolled in a private school, with 14 (100.0% in the age bracket) attending a public institution.
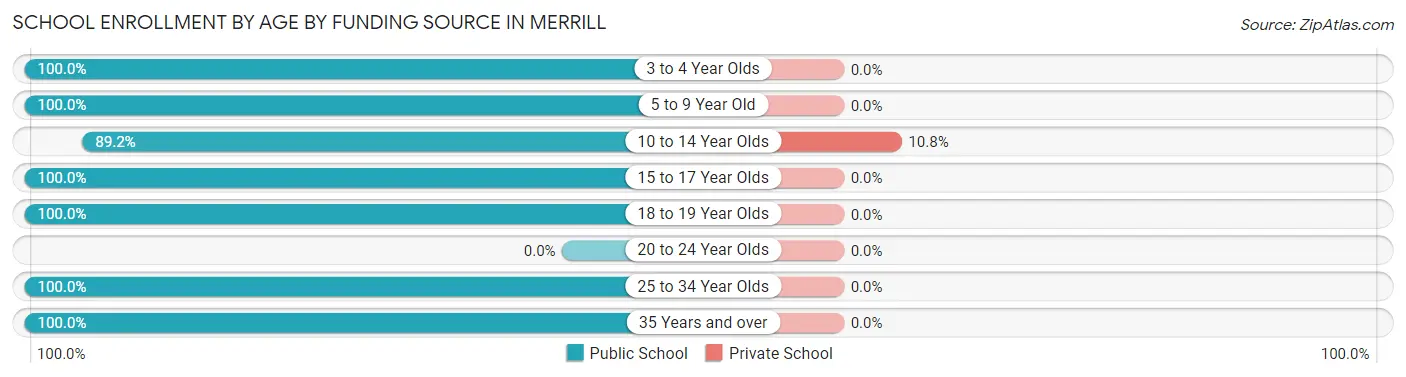
| Age Bracket | Public School | Private School |
| 3 to 4 Year Olds | 14 (100.0%) | 0 (0.0%) |
| 5 to 9 Year Old | 32 (100.0%) | 0 (0.0%) |
| 10 to 14 Year Olds | 58 (89.2%) | 7 (10.8%) |
| 15 to 17 Year Olds | 21 (100.0%) | 0 (0.0%) |
| 18 to 19 Year Olds | 15 (100.0%) | 0 (0.0%) |
| 20 to 24 Year Olds | 0 (0.0%) | 0 (0.0%) |
| 25 to 34 Year Olds | 21 (100.0%) | 0 (0.0%) |
| 35 Years and over | 17 (100.0%) | 0 (0.0%) |
| Total | 178 (96.2%) | 7 (3.8%) |
Educational Attainment by Field of Study in Merrill
Science & technology (22 | 40.0%), education (12 | 21.8%), business (11 | 20.0%), and psychology (10 | 18.2%) are the most common fields of study among 55 individuals in Merrill who have obtained a bachelor's degree or higher.
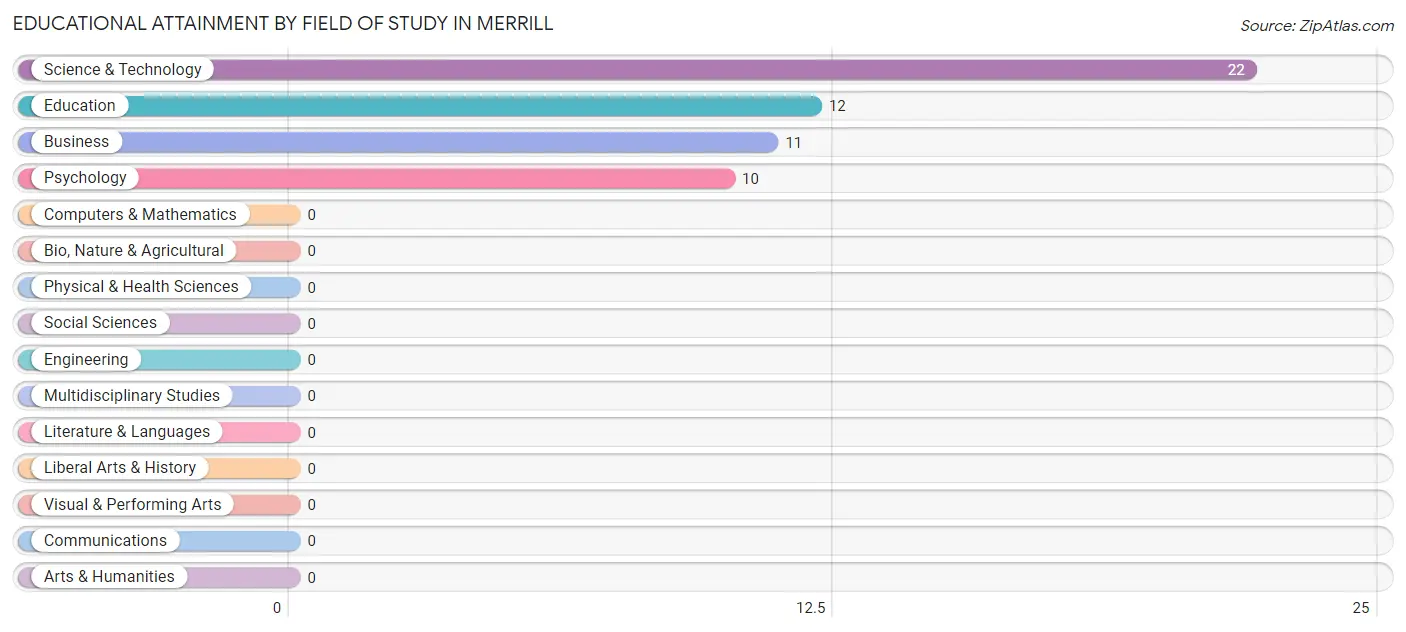
| Field of Study | # Graduates | % Graduates |
| Computers & Mathematics | 0 | 0.0% |
| Bio, Nature & Agricultural | 0 | 0.0% |
| Physical & Health Sciences | 0 | 0.0% |
| Psychology | 10 | 18.2% |
| Social Sciences | 0 | 0.0% |
| Engineering | 0 | 0.0% |
| Multidisciplinary Studies | 0 | 0.0% |
| Science & Technology | 22 | 40.0% |
| Business | 11 | 20.0% |
| Education | 12 | 21.8% |
| Literature & Languages | 0 | 0.0% |
| Liberal Arts & History | 0 | 0.0% |
| Visual & Performing Arts | 0 | 0.0% |
| Communications | 0 | 0.0% |
| Arts & Humanities | 0 | 0.0% |
| Total | 55 | 100.0% |
Transportation & Commute in Merrill
Vehicle Availability by Sex in Merrill
The most prevalent vehicle ownership categories in Merrill are males with 2 vehicles (57, accounting for 31.5%) and females with 2 vehicles (51, making up 41.9%).
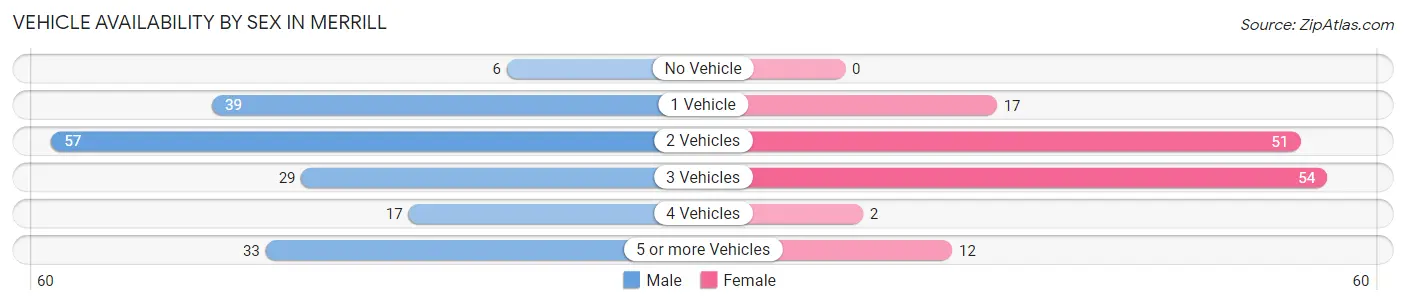
| Vehicles Available | Male | Female |
| No Vehicle | 6 (3.3%) | 0 (0.0%) |
| 1 Vehicle | 39 (21.5%) | 17 (12.5%) |
| 2 Vehicles | 57 (31.5%) | 51 (37.5%) |
| 3 Vehicles | 29 (16.0%) | 54 (39.7%) |
| 4 Vehicles | 17 (9.4%) | 2 (1.5%) |
| 5 or more Vehicles | 33 (18.2%) | 12 (8.8%) |
| Total | 181 (100.0%) | 136 (100.0%) |
Commute Time in Merrill
The most frequently occuring commute durations in Merrill are 20 to 24 minutes (70 commuters, 22.4%), 30 to 34 minutes (64 commuters, 20.4%), and 10 to 14 minutes (61 commuters, 19.5%).
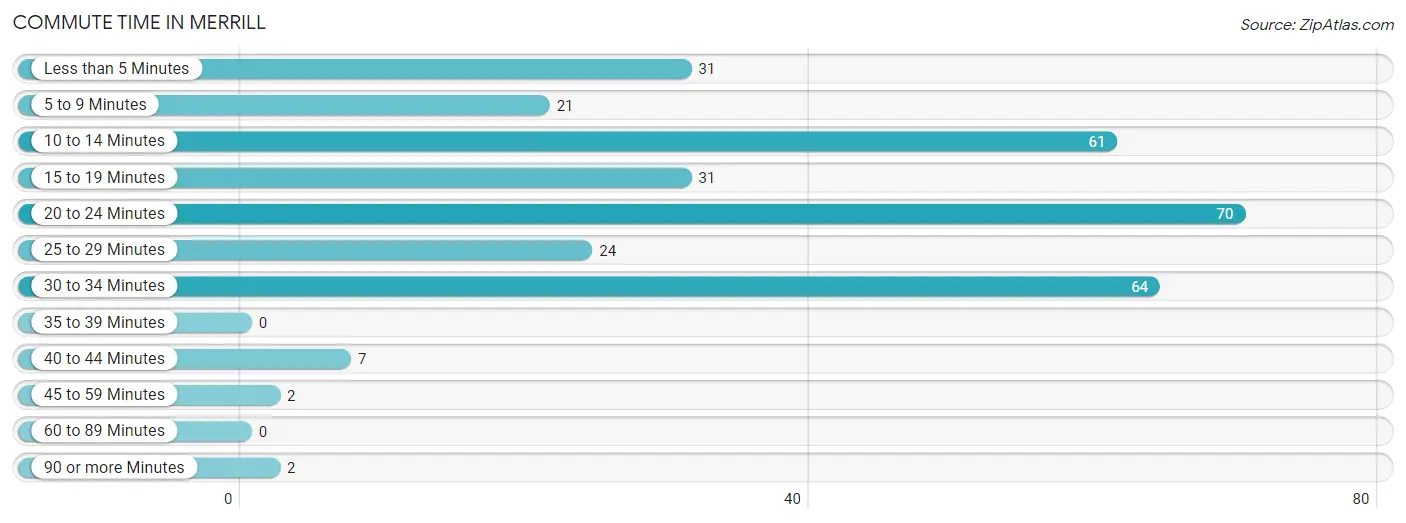
| Commute Time | # Commuters | % Commuters |
| Less than 5 Minutes | 31 | 9.9% |
| 5 to 9 Minutes | 21 | 6.7% |
| 10 to 14 Minutes | 61 | 19.5% |
| 15 to 19 Minutes | 31 | 9.9% |
| 20 to 24 Minutes | 70 | 22.4% |
| 25 to 29 Minutes | 24 | 7.7% |
| 30 to 34 Minutes | 64 | 20.4% |
| 35 to 39 Minutes | 0 | 0.0% |
| 40 to 44 Minutes | 7 | 2.2% |
| 45 to 59 Minutes | 2 | 0.6% |
| 60 to 89 Minutes | 0 | 0.0% |
| 90 or more Minutes | 2 | 0.6% |
Commute Time by Sex in Merrill
The most common commute times in Merrill are 10 to 14 minutes (53 commuters, 29.9%) for males and 20 to 24 minutes (38 commuters, 27.9%) for females.
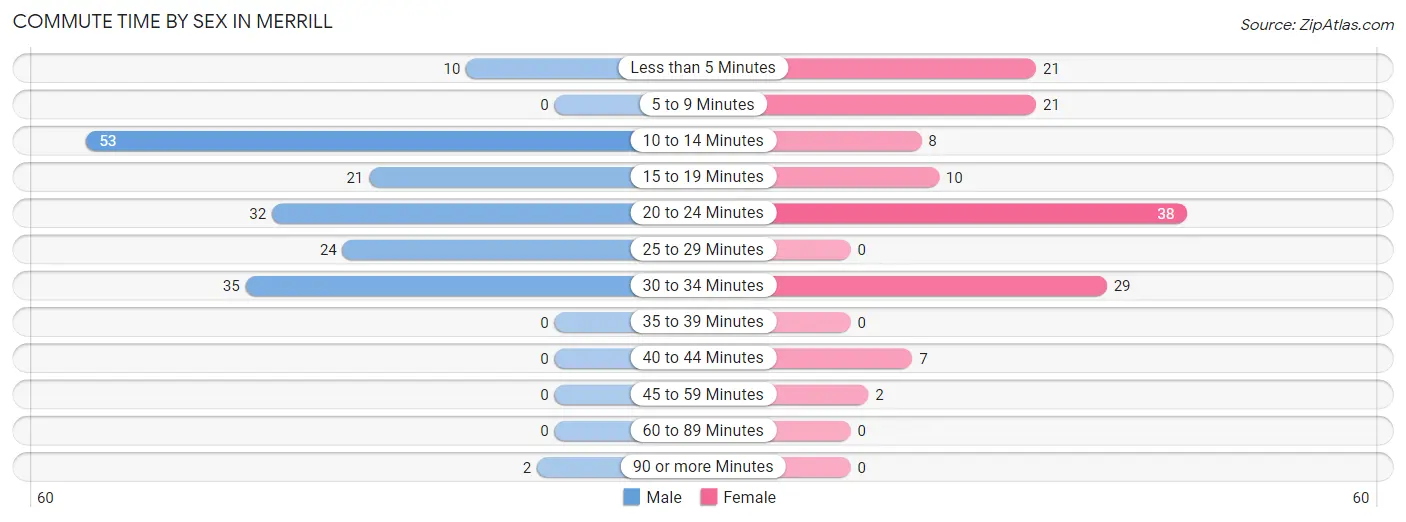
| Commute Time | Male | Female |
| Less than 5 Minutes | 10 (5.7%) | 21 (15.4%) |
| 5 to 9 Minutes | 0 (0.0%) | 21 (15.4%) |
| 10 to 14 Minutes | 53 (29.9%) | 8 (5.9%) |
| 15 to 19 Minutes | 21 (11.9%) | 10 (7.3%) |
| 20 to 24 Minutes | 32 (18.1%) | 38 (27.9%) |
| 25 to 29 Minutes | 24 (13.6%) | 0 (0.0%) |
| 30 to 34 Minutes | 35 (19.8%) | 29 (21.3%) |
| 35 to 39 Minutes | 0 (0.0%) | 0 (0.0%) |
| 40 to 44 Minutes | 0 (0.0%) | 7 (5.1%) |
| 45 to 59 Minutes | 0 (0.0%) | 2 (1.5%) |
| 60 to 89 Minutes | 0 (0.0%) | 0 (0.0%) |
| 90 or more Minutes | 2 (1.1%) | 0 (0.0%) |
Time of Departure to Work by Sex in Merrill
The most frequent times of departure to work in Merrill are 7:30 AM to 7:59 AM (53, 29.9%) for males and 7:00 AM to 7:29 AM (23, 16.9%) for females.
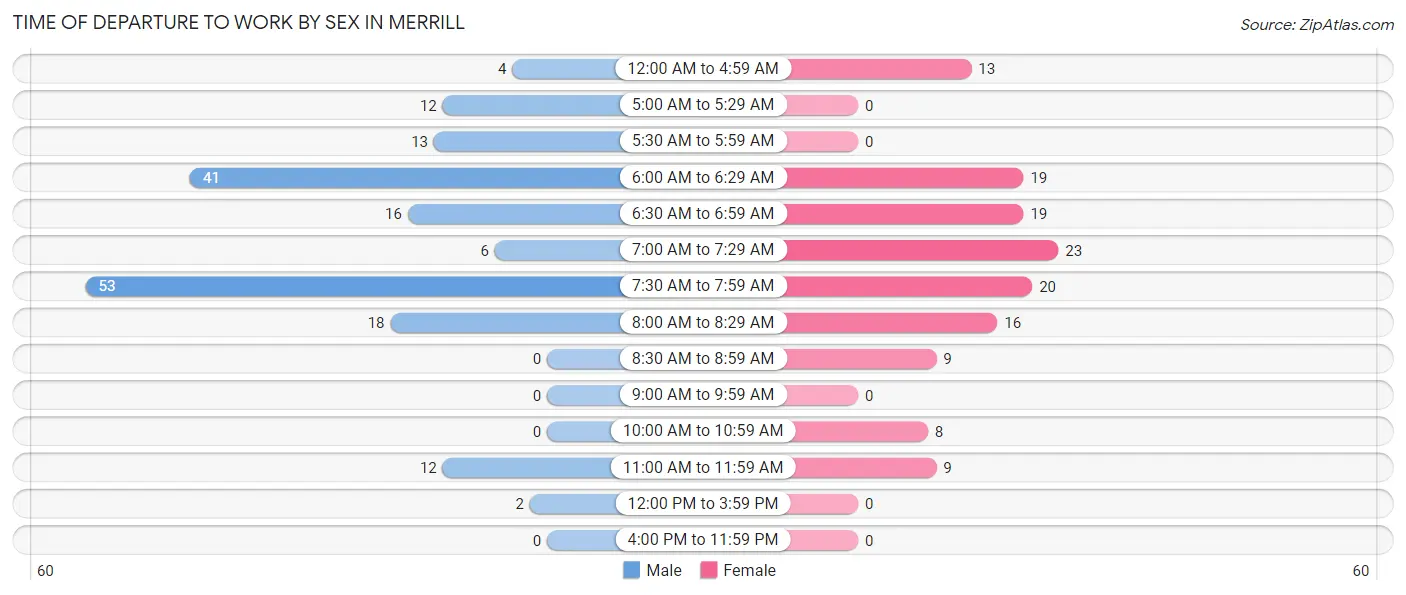
| Time of Departure | Male | Female |
| 12:00 AM to 4:59 AM | 4 (2.3%) | 13 (9.6%) |
| 5:00 AM to 5:29 AM | 12 (6.8%) | 0 (0.0%) |
| 5:30 AM to 5:59 AM | 13 (7.3%) | 0 (0.0%) |
| 6:00 AM to 6:29 AM | 41 (23.2%) | 19 (14.0%) |
| 6:30 AM to 6:59 AM | 16 (9.0%) | 19 (14.0%) |
| 7:00 AM to 7:29 AM | 6 (3.4%) | 23 (16.9%) |
| 7:30 AM to 7:59 AM | 53 (29.9%) | 20 (14.7%) |
| 8:00 AM to 8:29 AM | 18 (10.2%) | 16 (11.8%) |
| 8:30 AM to 8:59 AM | 0 (0.0%) | 9 (6.6%) |
| 9:00 AM to 9:59 AM | 0 (0.0%) | 0 (0.0%) |
| 10:00 AM to 10:59 AM | 0 (0.0%) | 8 (5.9%) |
| 11:00 AM to 11:59 AM | 12 (6.8%) | 9 (6.6%) |
| 12:00 PM to 3:59 PM | 2 (1.1%) | 0 (0.0%) |
| 4:00 PM to 11:59 PM | 0 (0.0%) | 0 (0.0%) |
| Total | 177 (100.0%) | 136 (100.0%) |
Housing Occupancy in Merrill
Occupancy by Ownership in Merrill
Of the total 308 dwellings in Merrill, owner-occupied units account for 185 (60.1%), while renter-occupied units make up 123 (39.9%).
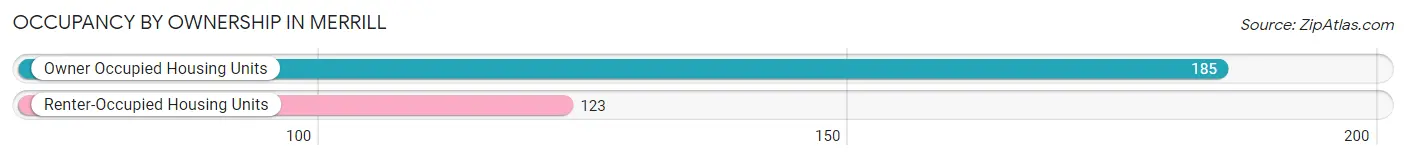
| Occupancy | # Housing Units | % Housing Units |
| Owner Occupied Housing Units | 185 | 60.1% |
| Renter-Occupied Housing Units | 123 | 39.9% |
| Total Occupied Housing Units | 308 | 100.0% |
Occupancy by Household Size in Merrill
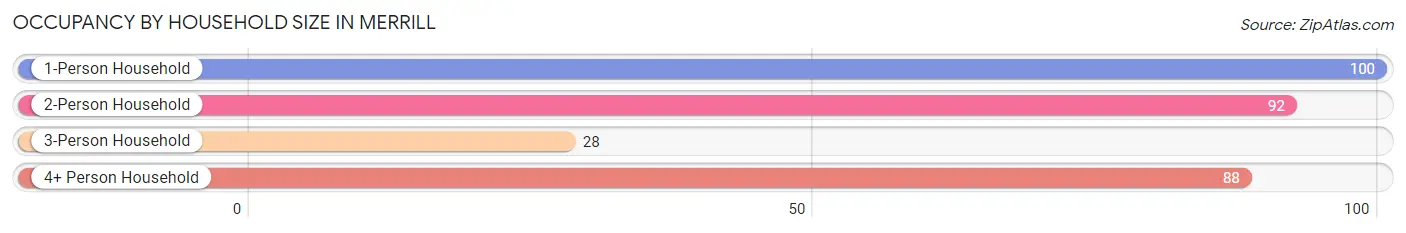
| Household Size | # Housing Units | % Housing Units |
| 1-Person Household | 100 | 32.5% |
| 2-Person Household | 92 | 29.9% |
| 3-Person Household | 28 | 9.1% |
| 4+ Person Household | 88 | 28.6% |
| Total Housing Units | 308 | 100.0% |
Occupancy by Ownership by Household Size in Merrill
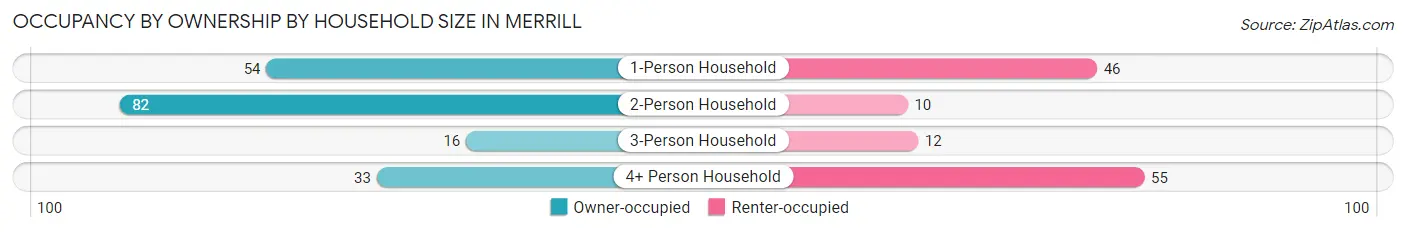
| Household Size | Owner-occupied | Renter-occupied |
| 1-Person Household | 54 (54.0%) | 46 (46.0%) |
| 2-Person Household | 82 (89.1%) | 10 (10.9%) |
| 3-Person Household | 16 (57.1%) | 12 (42.9%) |
| 4+ Person Household | 33 (37.5%) | 55 (62.5%) |
| Total Housing Units | 185 (60.1%) | 123 (39.9%) |
Occupancy by Educational Attainment in Merrill
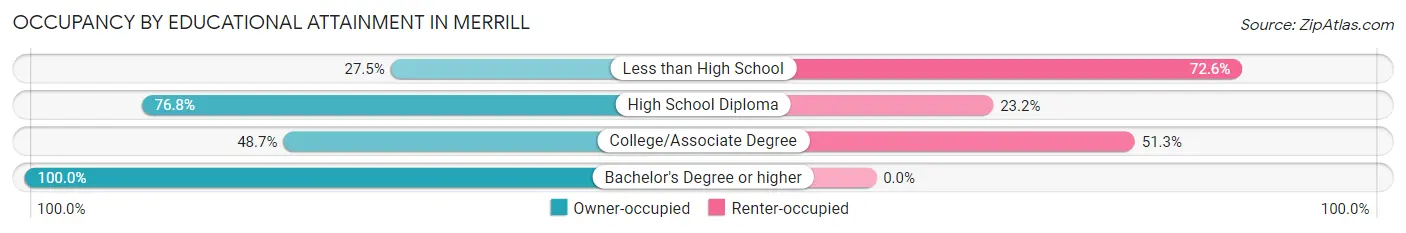
| Household Size | Owner-occupied | Renter-occupied |
| Less than High School | 14 (27.5%) | 37 (72.6%) |
| High School Diploma | 86 (76.8%) | 26 (23.2%) |
| College/Associate Degree | 57 (48.7%) | 60 (51.3%) |
| Bachelor's Degree or higher | 28 (100.0%) | 0 (0.0%) |
Occupancy by Age of Householder in Merrill
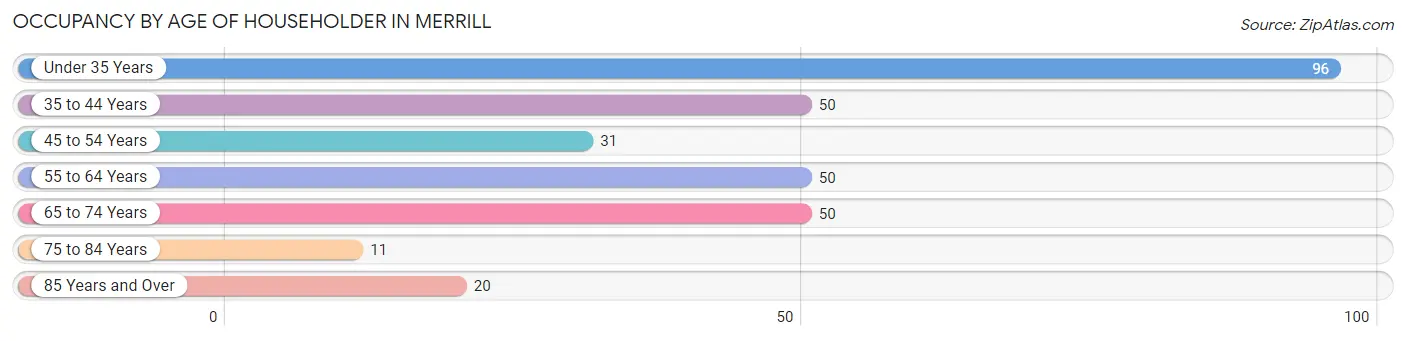
| Age Bracket | # Households | % Households |
| Under 35 Years | 96 | 31.2% |
| 35 to 44 Years | 50 | 16.2% |
| 45 to 54 Years | 31 | 10.1% |
| 55 to 64 Years | 50 | 16.2% |
| 65 to 74 Years | 50 | 16.2% |
| 75 to 84 Years | 11 | 3.6% |
| 85 Years and Over | 20 | 6.5% |
| Total | 308 | 100.0% |
Housing Finances in Merrill
Median Income by Occupancy in Merrill
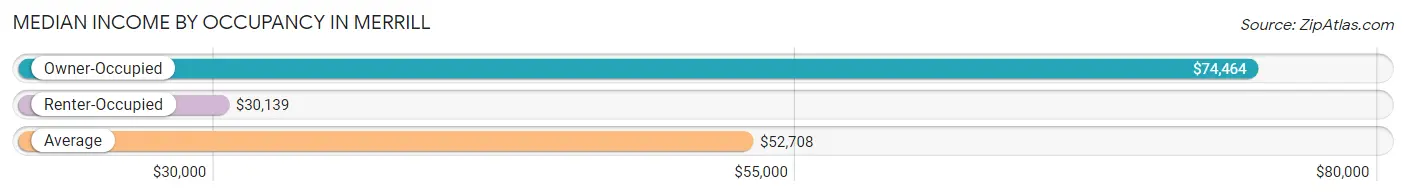
| Occupancy Type | # Households | Median Income |
| Owner-Occupied | 185 (60.1%) | $74,464 |
| Renter-Occupied | 123 (39.9%) | $30,139 |
| Average | 308 (100.0%) | $52,708 |
Occupancy by Householder Income Bracket in Merrill
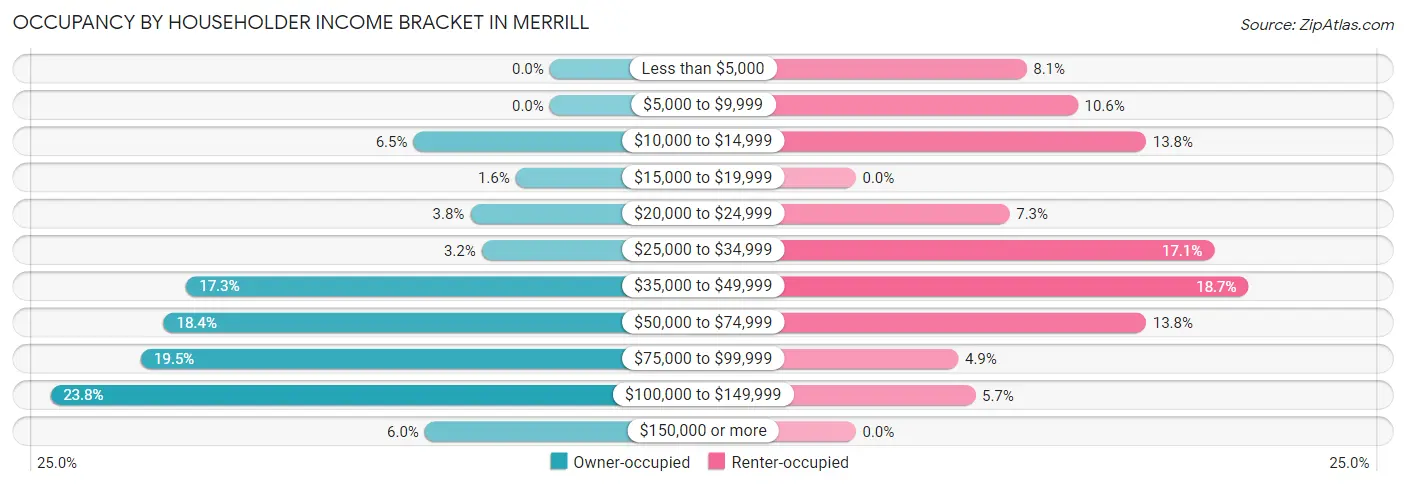
| Income Bracket | Owner-occupied | Renter-occupied |
| Less than $5,000 | 0 (0.0%) | 10 (8.1%) |
| $5,000 to $9,999 | 0 (0.0%) | 13 (10.6%) |
| $10,000 to $14,999 | 12 (6.5%) | 17 (13.8%) |
| $15,000 to $19,999 | 3 (1.6%) | 0 (0.0%) |
| $20,000 to $24,999 | 7 (3.8%) | 9 (7.3%) |
| $25,000 to $34,999 | 6 (3.2%) | 21 (17.1%) |
| $35,000 to $49,999 | 32 (17.3%) | 23 (18.7%) |
| $50,000 to $74,999 | 34 (18.4%) | 17 (13.8%) |
| $75,000 to $99,999 | 36 (19.5%) | 6 (4.9%) |
| $100,000 to $149,999 | 44 (23.8%) | 7 (5.7%) |
| $150,000 or more | 11 (5.9%) | 0 (0.0%) |
| Total | 185 (100.0%) | 123 (100.0%) |
Monthly Housing Cost Tiers in Merrill
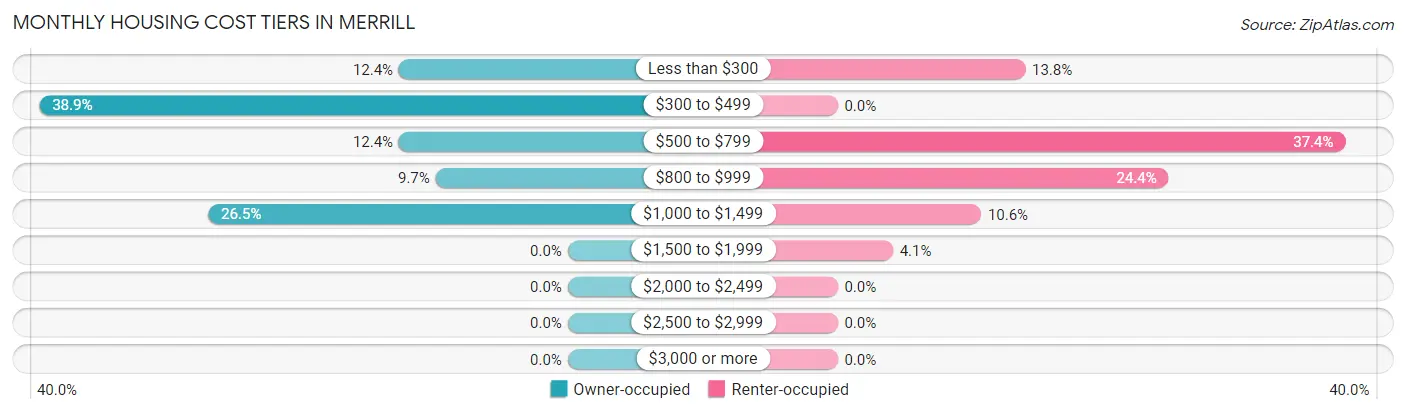
| Monthly Cost | Owner-occupied | Renter-occupied |
| Less than $300 | 23 (12.4%) | 17 (13.8%) |
| $300 to $499 | 72 (38.9%) | 0 (0.0%) |
| $500 to $799 | 23 (12.4%) | 46 (37.4%) |
| $800 to $999 | 18 (9.7%) | 30 (24.4%) |
| $1,000 to $1,499 | 49 (26.5%) | 13 (10.6%) |
| $1,500 to $1,999 | 0 (0.0%) | 5 (4.1%) |
| $2,000 to $2,499 | 0 (0.0%) | 0 (0.0%) |
| $2,500 to $2,999 | 0 (0.0%) | 0 (0.0%) |
| $3,000 or more | 0 (0.0%) | 0 (0.0%) |
| Total | 185 (100.0%) | 123 (100.0%) |
Physical Housing Characteristics in Merrill
Housing Structures in Merrill
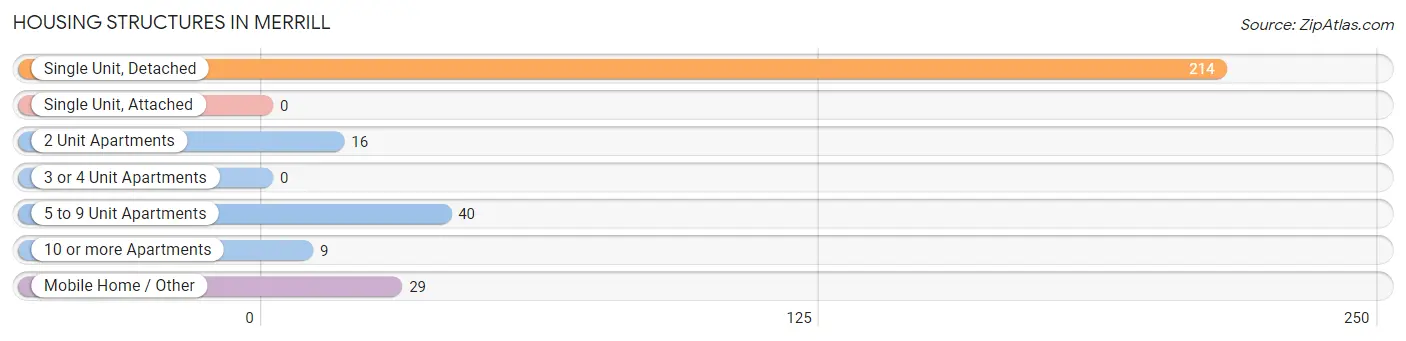
| Structure Type | # Housing Units | % Housing Units |
| Single Unit, Detached | 214 | 69.5% |
| Single Unit, Attached | 0 | 0.0% |
| 2 Unit Apartments | 16 | 5.2% |
| 3 or 4 Unit Apartments | 0 | 0.0% |
| 5 to 9 Unit Apartments | 40 | 13.0% |
| 10 or more Apartments | 9 | 2.9% |
| Mobile Home / Other | 29 | 9.4% |
| Total | 308 | 100.0% |
Housing Structures by Occupancy in Merrill
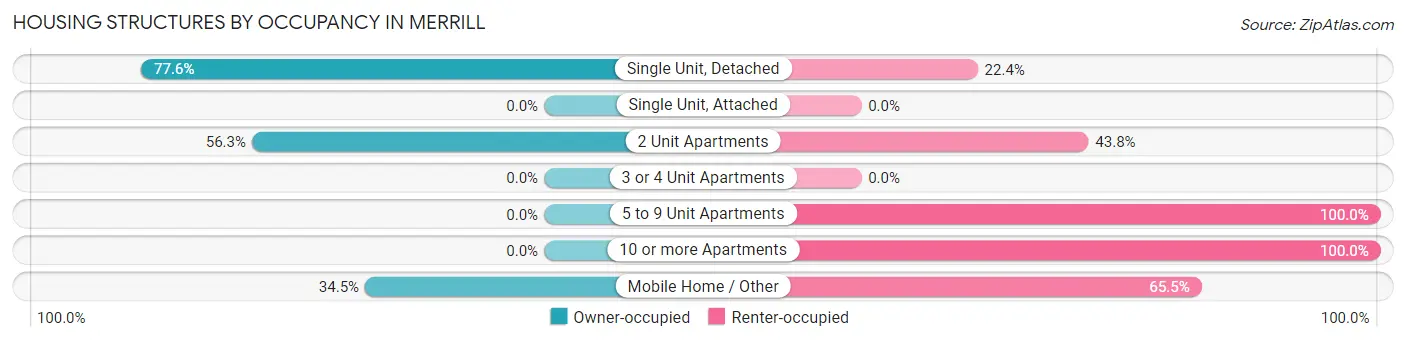
| Structure Type | Owner-occupied | Renter-occupied |
| Single Unit, Detached | 166 (77.6%) | 48 (22.4%) |
| Single Unit, Attached | 0 (0.0%) | 0 (0.0%) |
| 2 Unit Apartments | 9 (56.2%) | 7 (43.8%) |
| 3 or 4 Unit Apartments | 0 (0.0%) | 0 (0.0%) |
| 5 to 9 Unit Apartments | 0 (0.0%) | 40 (100.0%) |
| 10 or more Apartments | 0 (0.0%) | 9 (100.0%) |
| Mobile Home / Other | 10 (34.5%) | 19 (65.5%) |
| Total | 185 (60.1%) | 123 (39.9%) |
Housing Structures by Number of Rooms in Merrill
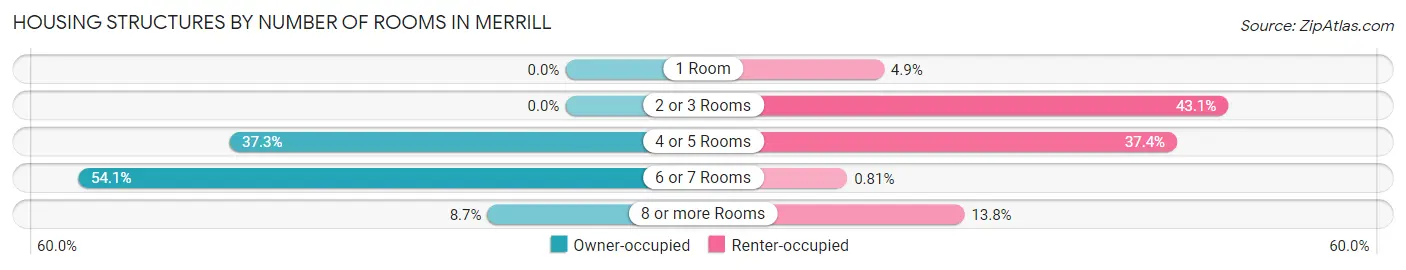
| Number of Rooms | Owner-occupied | Renter-occupied |
| 1 Room | 0 (0.0%) | 6 (4.9%) |
| 2 or 3 Rooms | 0 (0.0%) | 53 (43.1%) |
| 4 or 5 Rooms | 69 (37.3%) | 46 (37.4%) |
| 6 or 7 Rooms | 100 (54.0%) | 1 (0.8%) |
| 8 or more Rooms | 16 (8.6%) | 17 (13.8%) |
| Total | 185 (100.0%) | 123 (100.0%) |
Housing Structure by Heating Type in Merrill
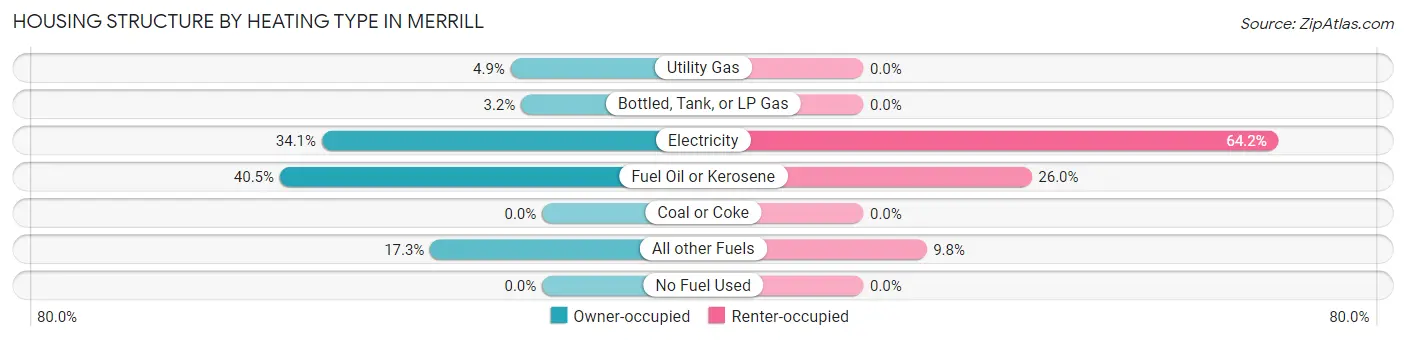
| Heating Type | Owner-occupied | Renter-occupied |
| Utility Gas | 9 (4.9%) | 0 (0.0%) |
| Bottled, Tank, or LP Gas | 6 (3.2%) | 0 (0.0%) |
| Electricity | 63 (34.1%) | 79 (64.2%) |
| Fuel Oil or Kerosene | 75 (40.5%) | 32 (26.0%) |
| Coal or Coke | 0 (0.0%) | 0 (0.0%) |
| All other Fuels | 32 (17.3%) | 12 (9.8%) |
| No Fuel Used | 0 (0.0%) | 0 (0.0%) |
| Total | 185 (100.0%) | 123 (100.0%) |
Household Vehicle Usage in Merrill
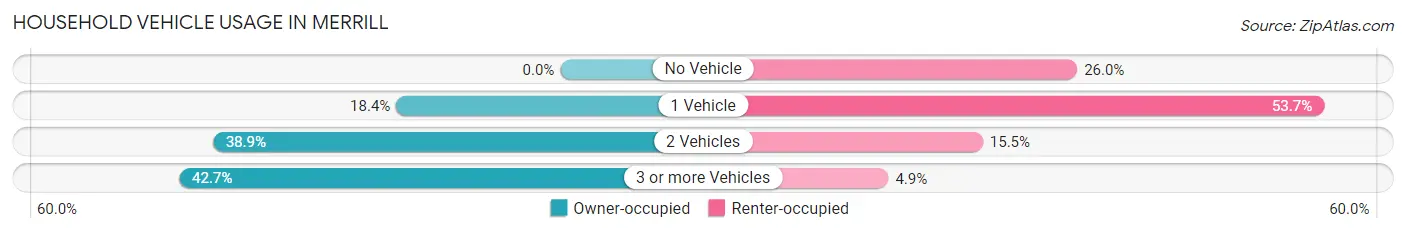
| Vehicles per Household | Owner-occupied | Renter-occupied |
| No Vehicle | 0 (0.0%) | 32 (26.0%) |
| 1 Vehicle | 34 (18.4%) | 66 (53.7%) |
| 2 Vehicles | 72 (38.9%) | 19 (15.4%) |
| 3 or more Vehicles | 79 (42.7%) | 6 (4.9%) |
| Total | 185 (100.0%) | 123 (100.0%) |
Real Estate & Mortgages in Merrill
Real Estate and Mortgage Overview in Merrill
| Characteristic | Without Mortgage | With Mortgage |
| Housing Units | 105 | 80 |
| Median Property Value | $185,100 | $135,700 |
| Median Household Income | $58,125 | $0 |
| Monthly Housing Costs | $397 | $0 |
| Real Estate Taxes | $1,083 | $0 |
Property Value by Mortgage Status in Merrill
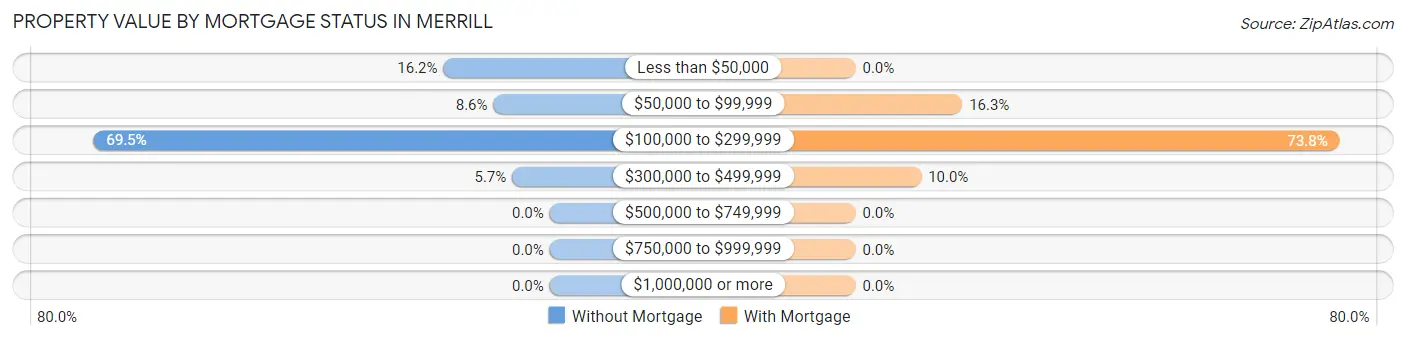
| Property Value | Without Mortgage | With Mortgage |
| Less than $50,000 | 17 (16.2%) | 0 (0.0%) |
| $50,000 to $99,999 | 9 (8.6%) | 13 (16.3%) |
| $100,000 to $299,999 | 73 (69.5%) | 59 (73.8%) |
| $300,000 to $499,999 | 6 (5.7%) | 8 (10.0%) |
| $500,000 to $749,999 | 0 (0.0%) | 0 (0.0%) |
| $750,000 to $999,999 | 0 (0.0%) | 0 (0.0%) |
| $1,000,000 or more | 0 (0.0%) | 0 (0.0%) |
| Total | 105 (100.0%) | 80 (100.0%) |
Household Income by Mortgage Status in Merrill
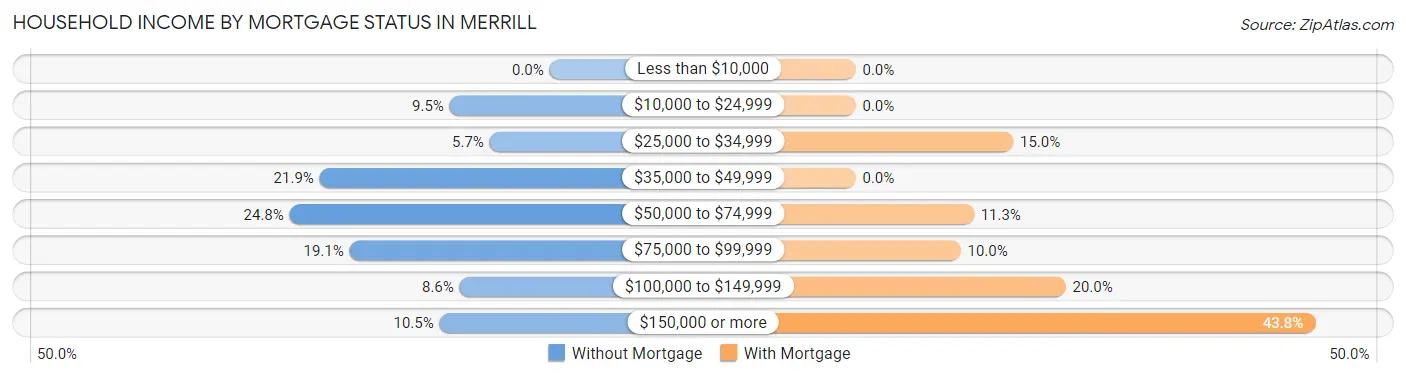
| Household Income | Without Mortgage | With Mortgage |
| Less than $10,000 | 0 (0.0%) | 0 (0.0%) |
| $10,000 to $24,999 | 10 (9.5%) | 0 (0.0%) |
| $25,000 to $34,999 | 6 (5.7%) | 12 (15.0%) |
| $35,000 to $49,999 | 23 (21.9%) | 0 (0.0%) |
| $50,000 to $74,999 | 26 (24.8%) | 9 (11.3%) |
| $75,000 to $99,999 | 20 (19.1%) | 8 (10.0%) |
| $100,000 to $149,999 | 9 (8.6%) | 16 (20.0%) |
| $150,000 or more | 11 (10.5%) | 35 (43.8%) |
| Total | 105 (100.0%) | 80 (100.0%) |
Property Value to Household Income Ratio in Merrill
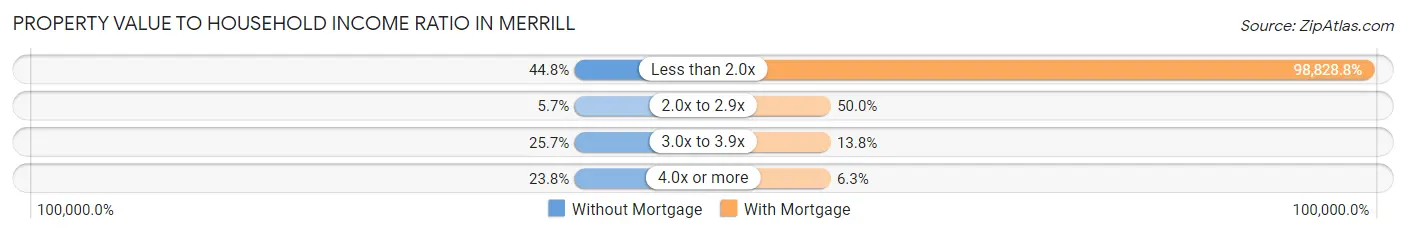
| Value-to-Income Ratio | Without Mortgage | With Mortgage |
| Less than 2.0x | 47 (44.8%) | 79,063 (98,828.8%) |
| 2.0x to 2.9x | 6 (5.7%) | 40 (50.0%) |
| 3.0x to 3.9x | 27 (25.7%) | 11 (13.8%) |
| 4.0x or more | 25 (23.8%) | 5 (6.2%) |
| Total | 105 (100.0%) | 80 (100.0%) |
Real Estate Taxes by Mortgage Status in Merrill
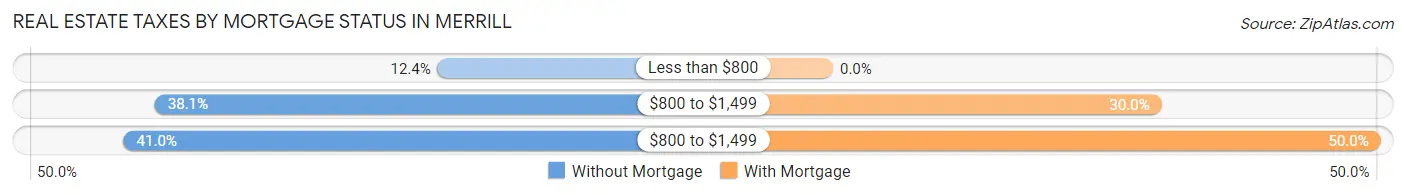
| Property Taxes | Without Mortgage | With Mortgage |
| Less than $800 | 13 (12.4%) | 0 (0.0%) |
| $800 to $1,499 | 40 (38.1%) | 24 (30.0%) |
| $800 to $1,499 | 43 (40.9%) | 40 (50.0%) |
| Total | 105 (100.0%) | 80 (100.0%) |
Health & Disability in Merrill
Health Insurance Coverage by Age in Merrill
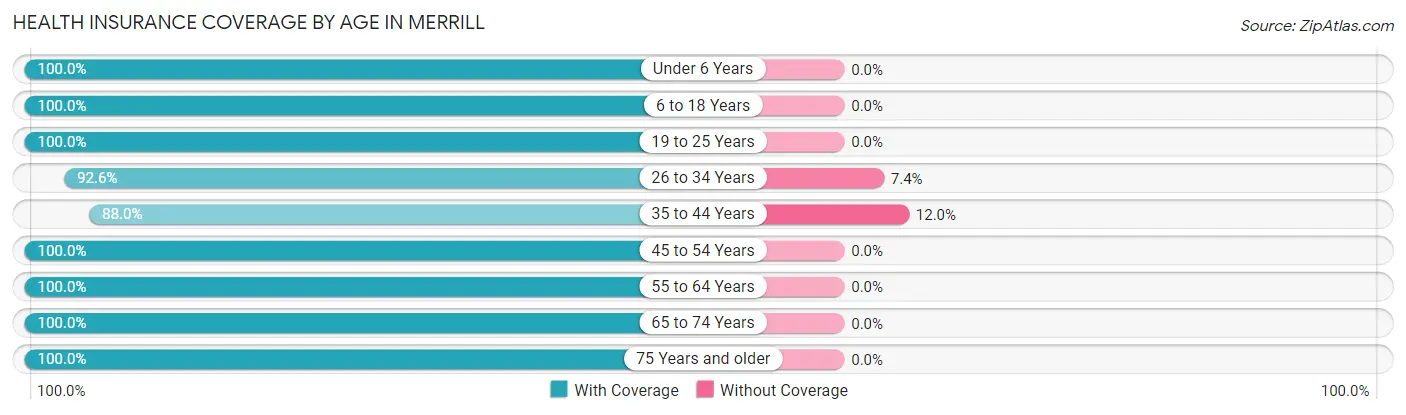
| Age Bracket | With Coverage | Without Coverage |
| Under 6 Years | 204 (100.0%) | 0 (0.0%) |
| 6 to 18 Years | 132 (100.0%) | 0 (0.0%) |
| 19 to 25 Years | 42 (100.0%) | 0 (0.0%) |
| 26 to 34 Years | 138 (92.6%) | 11 (7.4%) |
| 35 to 44 Years | 95 (88.0%) | 13 (12.0%) |
| 45 to 54 Years | 76 (100.0%) | 0 (0.0%) |
| 55 to 64 Years | 80 (100.0%) | 0 (0.0%) |
| 65 to 74 Years | 62 (100.0%) | 0 (0.0%) |
| 75 Years and older | 52 (100.0%) | 0 (0.0%) |
| Total | 881 (97.4%) | 24 (2.6%) |
Health Insurance Coverage by Citizenship Status in Merrill
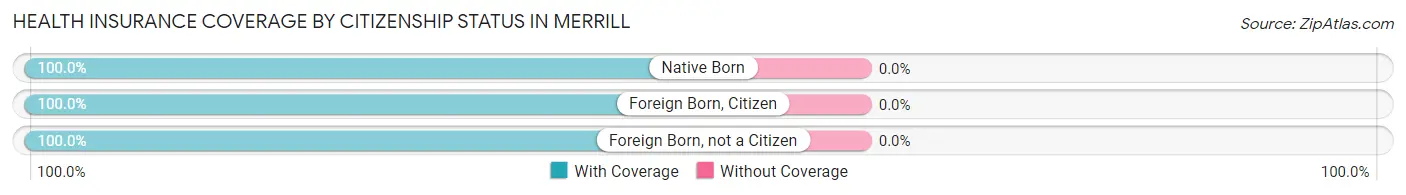
| Citizenship Status | With Coverage | Without Coverage |
| Native Born | 204 (100.0%) | 0 (0.0%) |
| Foreign Born, Citizen | 132 (100.0%) | 0 (0.0%) |
| Foreign Born, not a Citizen | 42 (100.0%) | 0 (0.0%) |
Health Insurance Coverage by Household Income in Merrill
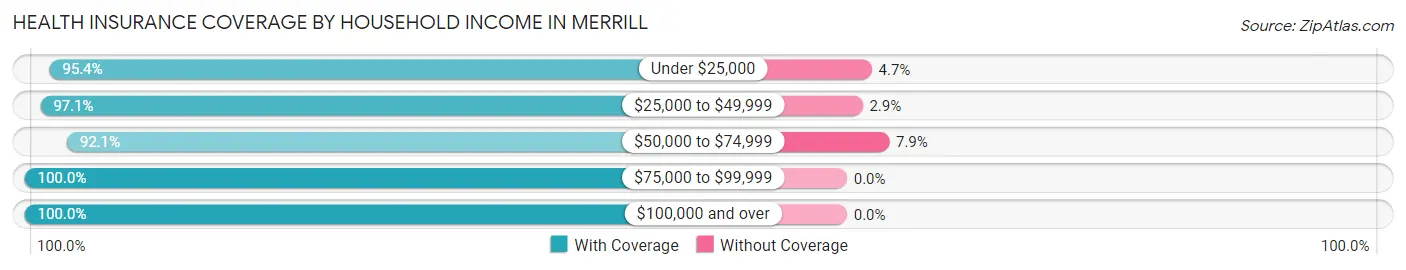
| Household Income | With Coverage | Without Coverage |
| Under $25,000 | 123 (95.4%) | 6 (4.6%) |
| $25,000 to $49,999 | 232 (97.1%) | 7 (2.9%) |
| $50,000 to $74,999 | 128 (92.1%) | 11 (7.9%) |
| $75,000 to $99,999 | 188 (100.0%) | 0 (0.0%) |
| $100,000 and over | 207 (100.0%) | 0 (0.0%) |
Public vs Private Health Insurance Coverage by Age in Merrill
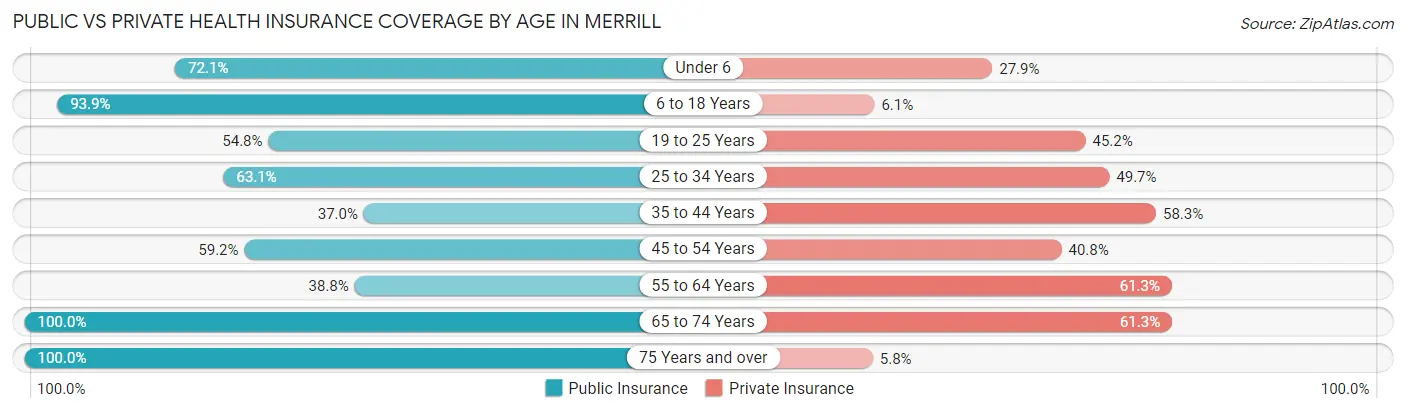
| Age Bracket | Public Insurance | Private Insurance |
| Under 6 | 147 (72.1%) | 57 (27.9%) |
| 6 to 18 Years | 124 (93.9%) | 8 (6.1%) |
| 19 to 25 Years | 23 (54.8%) | 19 (45.2%) |
| 25 to 34 Years | 94 (63.1%) | 74 (49.7%) |
| 35 to 44 Years | 40 (37.0%) | 63 (58.3%) |
| 45 to 54 Years | 45 (59.2%) | 31 (40.8%) |
| 55 to 64 Years | 31 (38.8%) | 49 (61.3%) |
| 65 to 74 Years | 62 (100.0%) | 38 (61.3%) |
| 75 Years and over | 52 (100.0%) | 3 (5.8%) |
| Total | 618 (68.3%) | 342 (37.8%) |
Disability Status by Sex by Age in Merrill
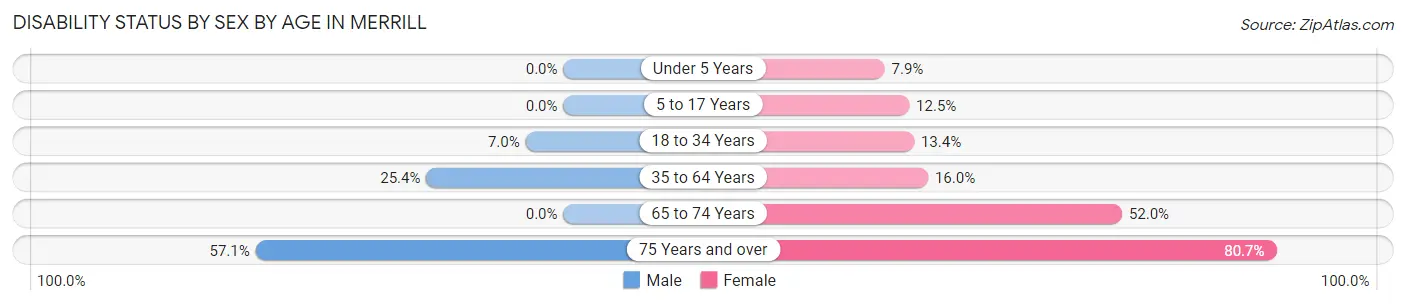
| Age Bracket | Male | Female |
| Under 5 Years | 0 (0.0%) | 5 (7.9%) |
| 5 to 17 Years | 0 (0.0%) | 7 (12.5%) |
| 18 to 34 Years | 8 (7.0%) | 13 (13.4%) |
| 35 to 64 Years | 29 (25.4%) | 24 (16.0%) |
| 65 to 74 Years | 0 (0.0%) | 13 (52.0%) |
| 75 Years and over | 12 (57.1%) | 25 (80.6%) |
Disability Class by Sex by Age in Merrill
Disability Class: Hearing Difficulty
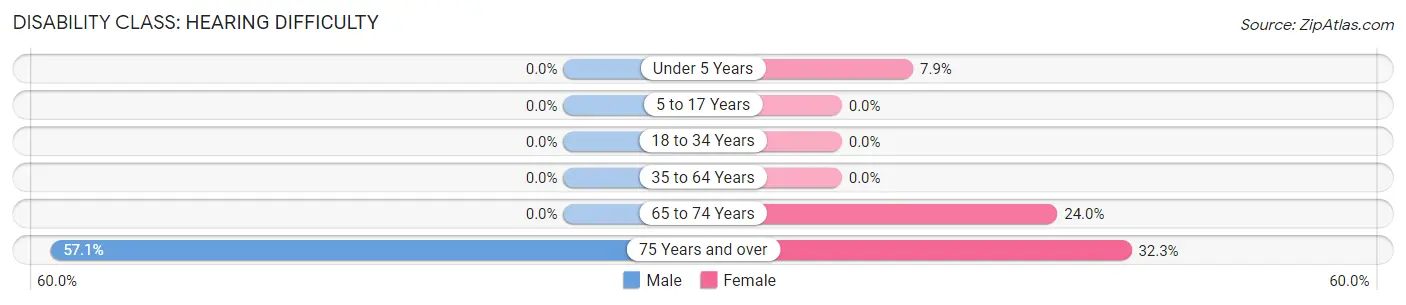
| Age Bracket | Male | Female |
| Under 5 Years | 0 (0.0%) | 5 (7.9%) |
| 5 to 17 Years | 0 (0.0%) | 0 (0.0%) |
| 18 to 34 Years | 0 (0.0%) | 0 (0.0%) |
| 35 to 64 Years | 0 (0.0%) | 0 (0.0%) |
| 65 to 74 Years | 0 (0.0%) | 6 (24.0%) |
| 75 Years and over | 12 (57.1%) | 10 (32.3%) |
Disability Class: Vision Difficulty
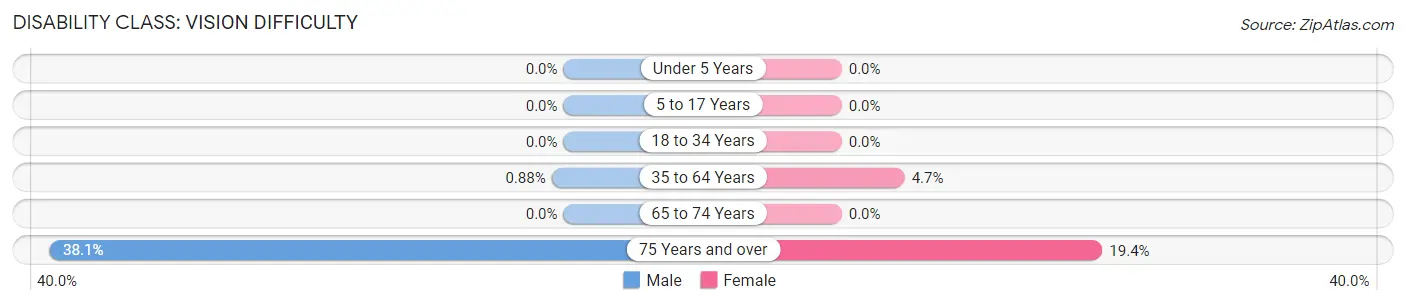
| Age Bracket | Male | Female |
| Under 5 Years | 0 (0.0%) | 0 (0.0%) |
| 5 to 17 Years | 0 (0.0%) | 0 (0.0%) |
| 18 to 34 Years | 0 (0.0%) | 0 (0.0%) |
| 35 to 64 Years | 1 (0.9%) | 7 (4.7%) |
| 65 to 74 Years | 0 (0.0%) | 0 (0.0%) |
| 75 Years and over | 8 (38.1%) | 6 (19.4%) |
Disability Class: Cognitive Difficulty
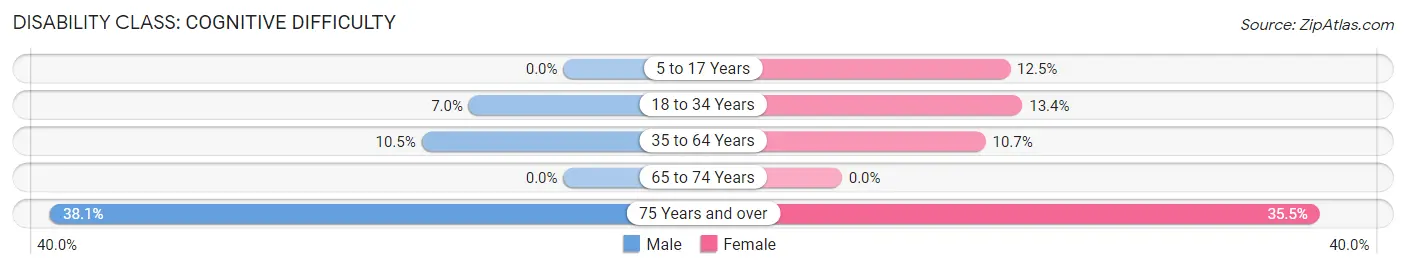
| Age Bracket | Male | Female |
| 5 to 17 Years | 0 (0.0%) | 7 (12.5%) |
| 18 to 34 Years | 8 (7.0%) | 13 (13.4%) |
| 35 to 64 Years | 12 (10.5%) | 16 (10.7%) |
| 65 to 74 Years | 0 (0.0%) | 0 (0.0%) |
| 75 Years and over | 8 (38.1%) | 11 (35.5%) |
Disability Class: Ambulatory Difficulty
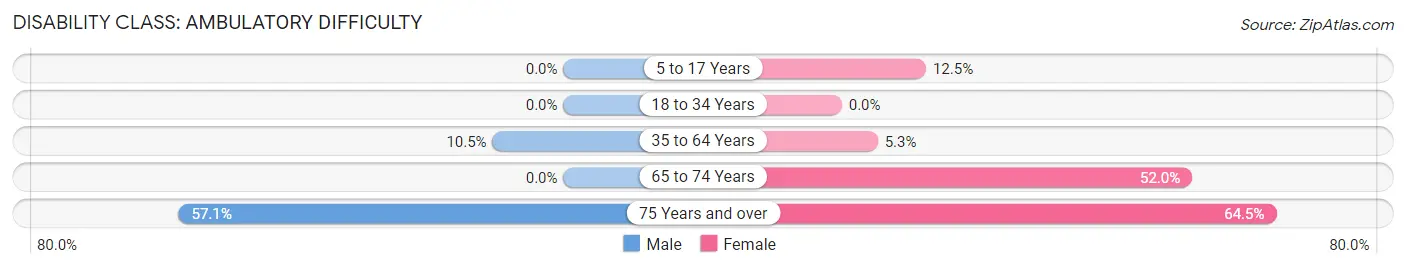
| Age Bracket | Male | Female |
| 5 to 17 Years | 0 (0.0%) | 7 (12.5%) |
| 18 to 34 Years | 0 (0.0%) | 0 (0.0%) |
| 35 to 64 Years | 12 (10.5%) | 8 (5.3%) |
| 65 to 74 Years | 0 (0.0%) | 13 (52.0%) |
| 75 Years and over | 12 (57.1%) | 20 (64.5%) |
Disability Class: Self-Care Difficulty
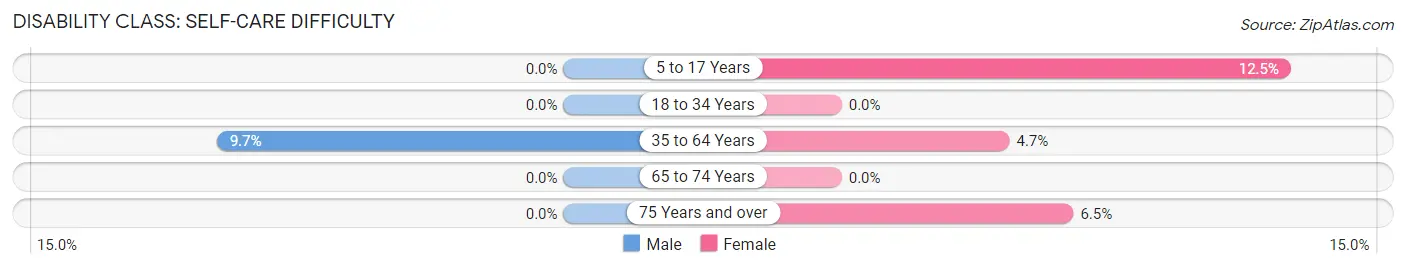
| Age Bracket | Male | Female |
| 5 to 17 Years | 0 (0.0%) | 7 (12.5%) |
| 18 to 34 Years | 0 (0.0%) | 0 (0.0%) |
| 35 to 64 Years | 11 (9.7%) | 7 (4.7%) |
| 65 to 74 Years | 0 (0.0%) | 0 (0.0%) |
| 75 Years and over | 0 (0.0%) | 2 (6.5%) |
Technology Access in Merrill
Computing Device Access in Merrill
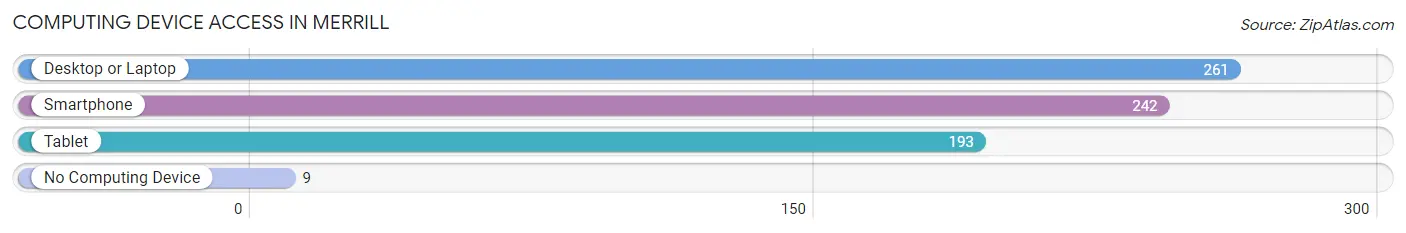
| Device Type | # Households | % Households |
| Desktop or Laptop | 261 | 84.7% |
| Smartphone | 242 | 78.6% |
| Tablet | 193 | 62.7% |
| No Computing Device | 9 | 2.9% |
| Total | 308 | 100.0% |
Internet Access in Merrill
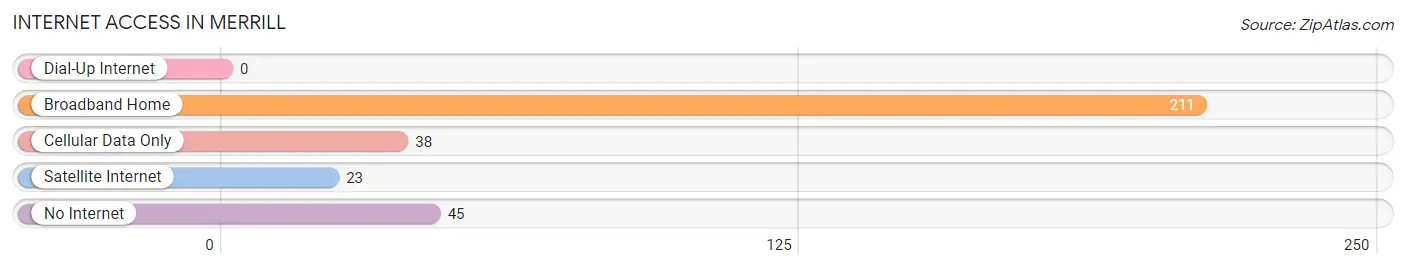
| Internet Type | # Households | % Households |
| Dial-Up Internet | 0 | 0.0% |
| Broadband Home | 211 | 68.5% |
| Cellular Data Only | 38 | 12.3% |
| Satellite Internet | 23 | 7.5% |
| No Internet | 45 | 14.6% |
| Total | 308 | 100.0% |
Merrill Summary
Merrill is a small city located in the state of Oregon, in the United States. It is situated in the Klamath Basin region of the state, and is part of Klamath County. The city has a population of approximately 1,500 people, and is located about 20 miles south of Klamath Falls.
History
Merrill was founded in 1884 by a group of settlers from the Midwest. The city was named after the Merrill family, who were among the first settlers in the area. The city was originally a farming community, and the main crops grown were wheat, barley, and oats. In the early 1900s, the city began to grow and develop, and by the 1920s, it had become a thriving community.
In the 1950s, the city began to experience a decline in population, as many of the residents moved away to larger cities. However, in the late 1970s, the city began to experience a resurgence in population, as people began to move back to the area. Today, Merrill is a small but vibrant city, with a population of around 1,500 people.
Geography
Merrill is located in the Klamath Basin region of Oregon, and is part of Klamath County. The city is situated at an elevation of 4,000 feet, and is surrounded by the Cascade Mountains to the west and the High Desert to the east. The city is located about 20 miles south of Klamath Falls, and is about a two-hour drive from the Oregon Coast.
The climate in Merrill is semi-arid, with hot summers and cold winters. The average annual temperature is around 50 degrees Fahrenheit, and the average annual precipitation is around 10 inches.
Economy
Merrill’s economy is largely based on agriculture and tourism. The city is home to several farms, which produce a variety of crops, including wheat, barley, oats, and hay. The city is also home to several tourist attractions, including the Merrill Historical Museum, the Merrill Wildlife Refuge, and the Merrill Hot Springs.
In addition to agriculture and tourism, Merrill is also home to several small businesses, including restaurants, retail stores, and service providers. The city is also home to several manufacturing companies, which produce a variety of products, including furniture, clothing, and electronics.
Demographics
As of the 2010 census, the population of Merrill was 1,500 people. The racial makeup of the city was 94.2% White, 0.7% African American, 0.7% Native American, 0.7% Asian, 0.3% Pacific Islander, and 2.7% from other races. The median household income in Merrill was $37,500, and the median age was 41.5 years.
Merrill is a small but vibrant city, with a diverse population and a strong economy. The city is home to several farms, tourist attractions, and small businesses, and is a great place to live and work.
Common Questions
What is Per Capita Income in Merrill?
Per Capita income in Merrill is $21,470.
What is the Median Family Income in Merrill?
Median Family Income in Merrill is $73,393.
What is the Median Household income in Merrill?
Median Household Income in Merrill is $52,708.
What is Income or Wage Gap in Merrill?
Income or Wage Gap in Merrill is 20.1%.
Women in Merrill earn 79.9 cents for every dollar earned by a man.
What is Inequality or Gini Index in Merrill?
Inequality or Gini Index in Merrill is 0.39.
What is the Total Population of Merrill?
Total Population of Merrill is 905.
What is the Total Male Population of Merrill?
Total Male Population of Merrill is 483.
What is the Total Female Population of Merrill?
Total Female Population of Merrill is 422.
What is the Ratio of Males per 100 Females in Merrill?
There are 114.45 Males per 100 Females in Merrill.
What is the Ratio of Females per 100 Males in Merrill?
There are 87.37 Females per 100 Males in Merrill.
What is the Median Population Age in Merrill?
Median Population Age in Merrill is 30.8 Years.
What is the Average Family Size in Merrill
Average Family Size in Merrill is 3.8 People.
What is the Average Household Size in Merrill
Average Household Size in Merrill is 2.9 People.
How Large is the Labor Force in Merrill?
There are 360 People in the Labor Forcein in Merrill.
What is the Percentage of People in the Labor Force in Merrill?
59.0% of People are in the Labor Force in Merrill.
What is the Unemployment Rate in Merrill?
Unemployment Rate in Merrill is 10.3%.