Nondalton, AK Map & Demographics
Nondalton Map
Nondalton Overview
$38,820
PER CAPITA INCOME
$48,333
AVG FAMILY INCOME
$55,000
AVG HOUSEHOLD INCOME
0.37
INEQUALITY / GINI INDEX
40
TOTAL POPULATION
20
MALE POPULATION
20
FEMALE POPULATION
100.00
MALES / 100 FEMALES
100.00
FEMALES / 100 MALES
55.0
MEDIAN AGE
2.3
AVG FAMILY SIZE
1.8
AVG HOUSEHOLD SIZE
29
LABOR FORCE [ PEOPLE ]
74.4%
PERCENT IN LABOR FORCE
41.4%
UNEMPLOYMENT RATE
Nondalton Zip Codes
Nondalton Area Codes
Income in Nondalton
Income Overview in Nondalton
Per Capita Income in Nondalton is $38,820, while median incomes of families and households are $48,333 and $55,000 respectively.
| Characteristic | Number | Measure |
| Per Capita Income | 40 | $38,820 |
| Median Family Income | 12 | $48,333 |
| Mean Family Income | 12 | $53,142 |
| Median Household Income | 22 | $55,000 |
| Mean Household Income | 22 | $79,541 |
| Income Deficit | 12 | $0 |
| Wage / Income Gap (%) | 40 | 0.00% |
| Wage / Income Gap ($) | 40 | 100.00¢ per $1 |
| Gini / Inequality Index | 40 | 0.37 |
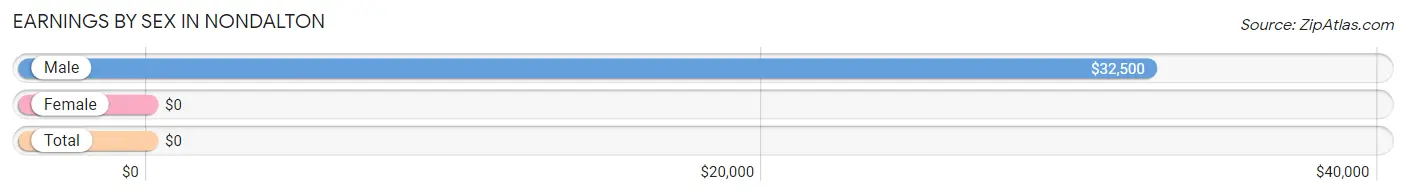
Earnings by Sex in Nondalton
| Sex | Number | Average Earnings |
| Male | 18 (58.1%) | $32,500 |
| Female | 13 (41.9%) | $0 |
| Total | 31 (100.0%) | $0 |
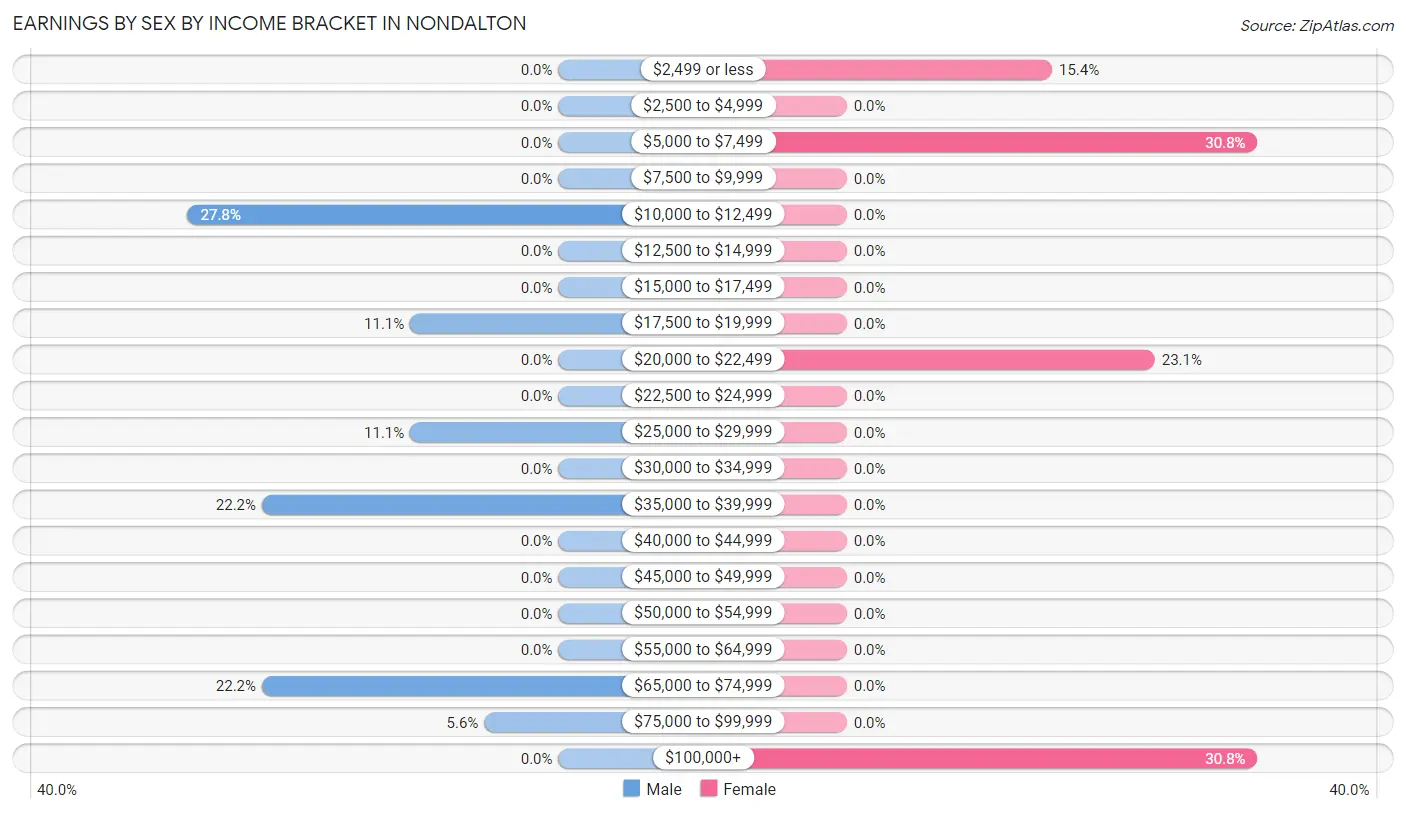
Earnings by Sex by Income Bracket in Nondalton
The most common earnings brackets in Nondalton are $10,000 to $12,499 for men (5 | 27.8%) and $5,000 to $7,499 for women (4 | 30.8%).
| Income | Male | Female |
| $2,499 or less | 0 (0.0%) | 2 (15.4%) |
| $2,500 to $4,999 | 0 (0.0%) | 0 (0.0%) |
| $5,000 to $7,499 | 0 (0.0%) | 4 (30.8%) |
| $7,500 to $9,999 | 0 (0.0%) | 0 (0.0%) |
| $10,000 to $12,499 | 5 (27.8%) | 0 (0.0%) |
| $12,500 to $14,999 | 0 (0.0%) | 0 (0.0%) |
| $15,000 to $17,499 | 0 (0.0%) | 0 (0.0%) |
| $17,500 to $19,999 | 2 (11.1%) | 0 (0.0%) |
| $20,000 to $22,499 | 0 (0.0%) | 3 (23.1%) |
| $22,500 to $24,999 | 0 (0.0%) | 0 (0.0%) |
| $25,000 to $29,999 | 2 (11.1%) | 0 (0.0%) |
| $30,000 to $34,999 | 0 (0.0%) | 0 (0.0%) |
| $35,000 to $39,999 | 4 (22.2%) | 0 (0.0%) |
| $40,000 to $44,999 | 0 (0.0%) | 0 (0.0%) |
| $45,000 to $49,999 | 0 (0.0%) | 0 (0.0%) |
| $50,000 to $54,999 | 0 (0.0%) | 0 (0.0%) |
| $55,000 to $64,999 | 0 (0.0%) | 0 (0.0%) |
| $65,000 to $74,999 | 4 (22.2%) | 0 (0.0%) |
| $75,000 to $99,999 | 1 (5.6%) | 0 (0.0%) |
| $100,000+ | 0 (0.0%) | 4 (30.8%) |
| Total | 18 (100.0%) | 13 (100.0%) |
Earnings by Sex by Educational Attainment in Nondalton
| Educational Attainment | Male Income | Female Income |
| Less than High School | - | - |
| High School Diploma | - | - |
| College or Associate's Degree | - | - |
| Bachelor's Degree | - | - |
| Graduate Degree | - | - |
| Total | $32,500 | $0 |
Family Income in Nondalton
Family Income Brackets in Nondalton
According to the Nondalton family income data, there are 5 families falling into the $25,000 to $34,999 income range, which is the most common income bracket and makes up 41.7% of all families.
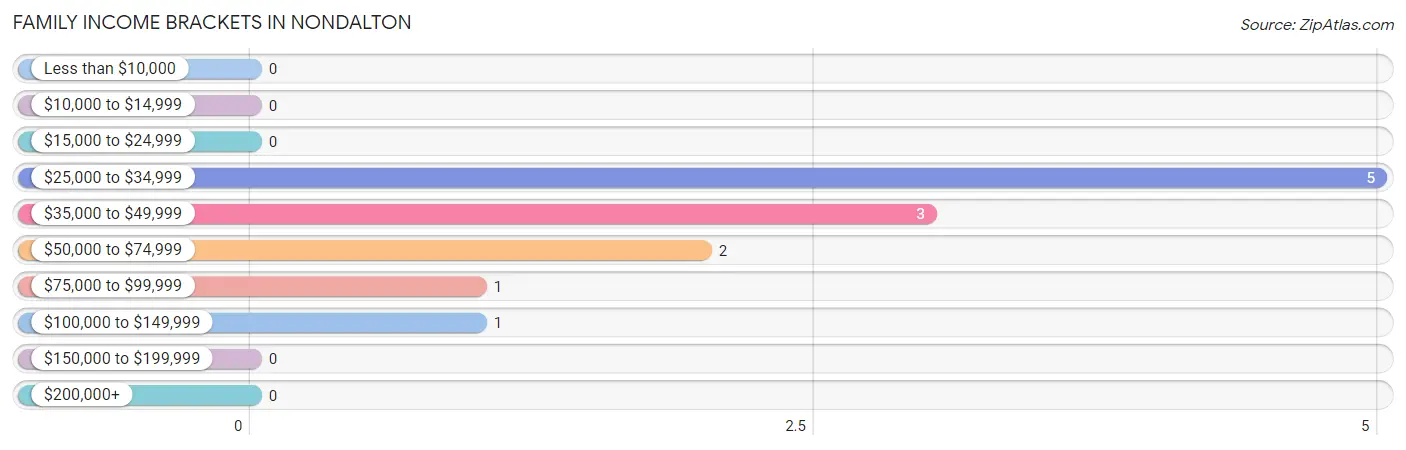
| Income Bracket | # Families | % Families |
| Less than $10,000 | 0 | 0.0% |
| $10,000 to $14,999 | 0 | 0.0% |
| $15,000 to $24,999 | 0 | 0.0% |
| $25,000 to $34,999 | 5 | 41.7% |
| $35,000 to $49,999 | 3 | 25.0% |
| $50,000 to $74,999 | 2 | 16.7% |
| $75,000 to $99,999 | 1 | 8.3% |
| $100,000 to $149,999 | 1 | 8.3% |
| $150,000 to $199,999 | 0 | 0.0% |
| $200,000+ | 0 | 0.0% |
Family Income by Famaliy Size in Nondalton
2-person families (10 | 83.3%) account for the highest median family income in Nondalton with $40,000 per family, while 2-person families (10 | 83.3%) have the highest median income of $20,000 per family member.
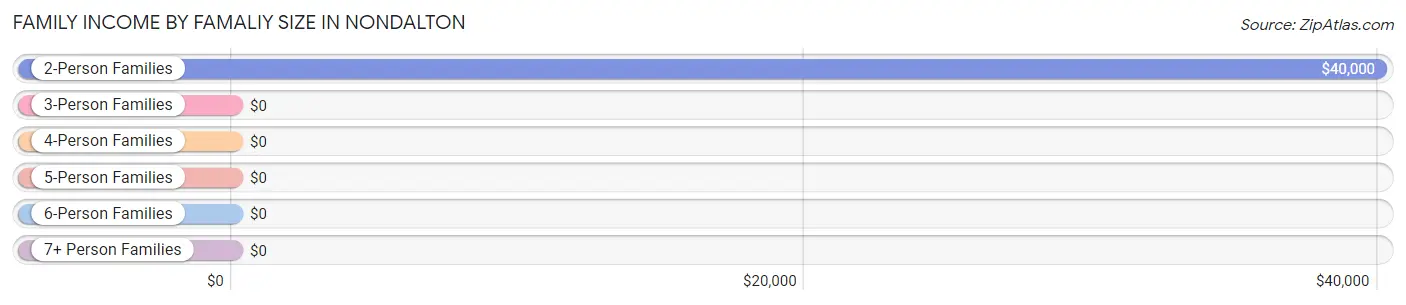
| Income Bracket | # Families | Median Income |
| 2-Person Families | 10 (83.3%) | $40,000 |
| 3-Person Families | 0 (0.0%) | $0 |
| 4-Person Families | 2 (16.7%) | $0 |
| 5-Person Families | 0 (0.0%) | $0 |
| 6-Person Families | 0 (0.0%) | $0 |
| 7+ Person Families | 0 (0.0%) | $0 |
| Total | 12 (100.0%) | $48,333 |
Family Income by Number of Earners in Nondalton
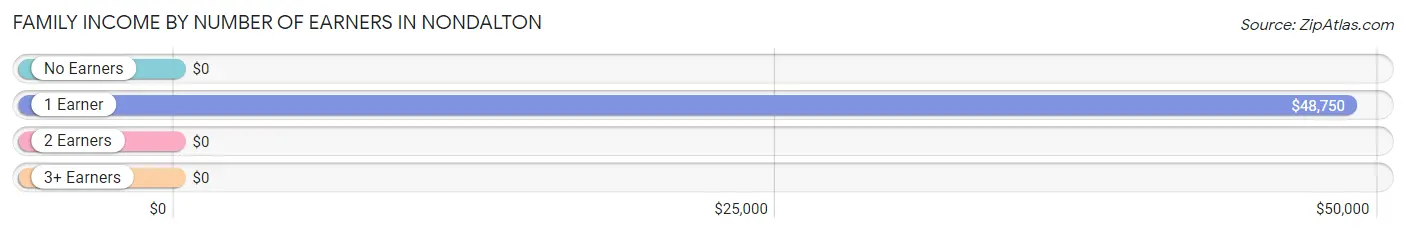
| Number of Earners | # Families | Median Income |
| No Earners | 0 (0.0%) | $0 |
| 1 Earner | 7 (58.3%) | $48,750 |
| 2 Earners | 3 (25.0%) | $0 |
| 3+ Earners | 2 (16.7%) | $0 |
| Total | 12 (100.0%) | $48,333 |
Household Income in Nondalton
Household Income Brackets in Nondalton
With 6 households falling in the category, the $35,000 to $49,999 income range is the most frequent in Nondalton, accounting for 27.3% of all households.
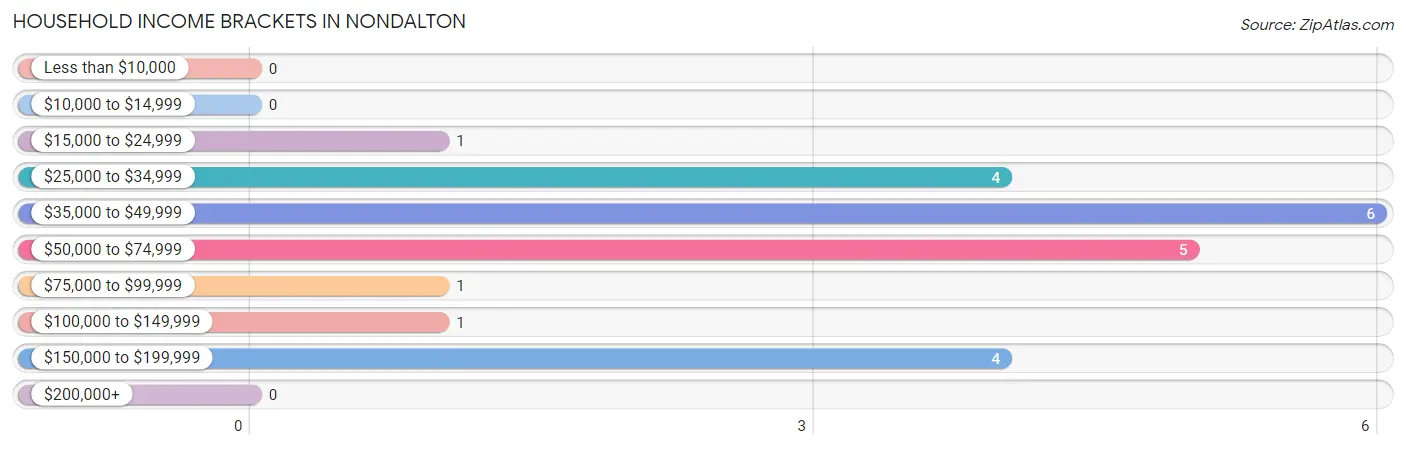
| Income Bracket | # Households | % Households |
| Less than $10,000 | 0 | 0.0% |
| $10,000 to $14,999 | 0 | 0.0% |
| $15,000 to $24,999 | 1 | 4.5% |
| $25,000 to $34,999 | 4 | 18.2% |
| $35,000 to $49,999 | 6 | 27.3% |
| $50,000 to $74,999 | 5 | 22.7% |
| $75,000 to $99,999 | 1 | 4.5% |
| $100,000 to $149,999 | 1 | 4.5% |
| $150,000 to $199,999 | 4 | 18.2% |
| $200,000+ | 0 | 0.0% |
Household Income by Householder Age in Nondalton
The median household income in Nondalton is $55,000, with the highest median household income of $69,167 found in the 65+ years age bracket for the primary householder. A total of 6 households (27.3%) fall into this category.
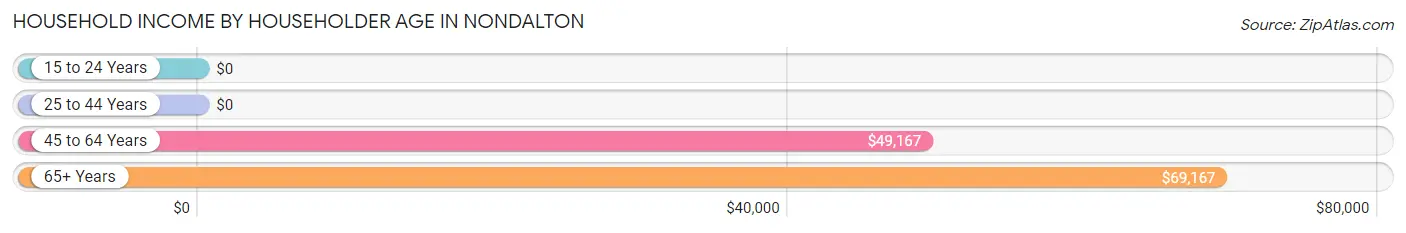
| Income Bracket | # Households | Median Income |
| 15 to 24 Years | 0 (0.0%) | $0 |
| 25 to 44 Years | 2 (9.1%) | $0 |
| 45 to 64 Years | 14 (63.6%) | $49,167 |
| 65+ Years | 6 (27.3%) | $69,167 |
| Total | 22 (100.0%) | $55,000 |
Poverty in Nondalton
Income Below Poverty by Sex and Age in Nondalton
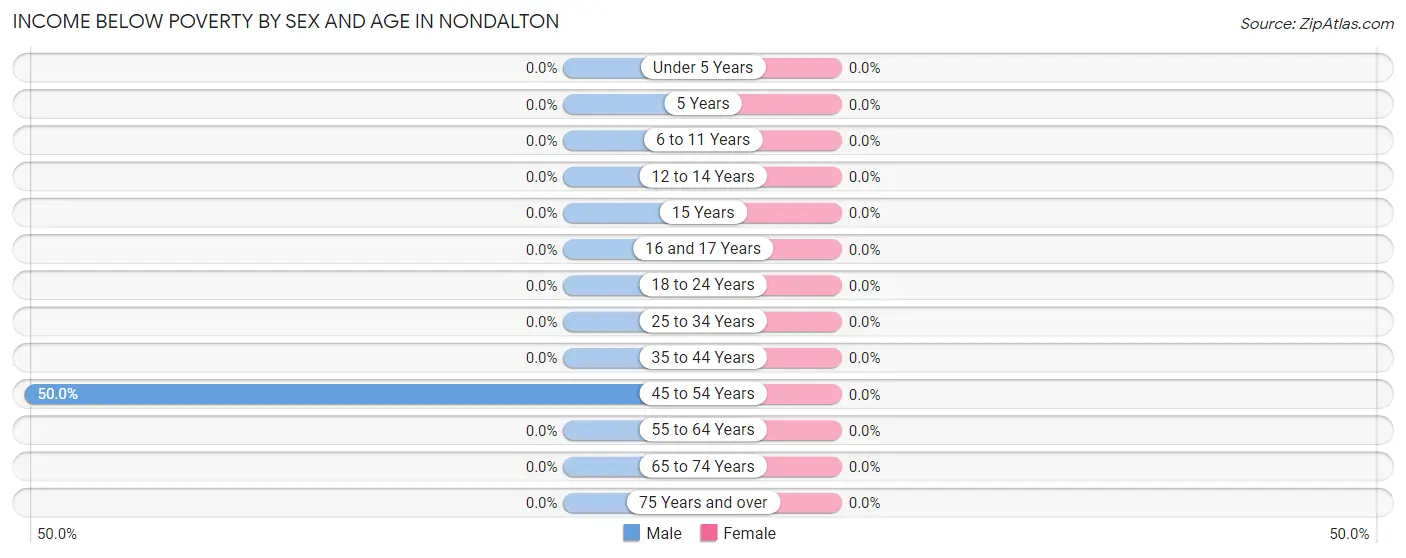
| Age Bracket | Male | Female |
| Under 5 Years | 0 (0.0%) | 0 (0.0%) |
| 5 Years | 0 (0.0%) | 0 (0.0%) |
| 6 to 11 Years | 0 (0.0%) | 0 (0.0%) |
| 12 to 14 Years | 0 (0.0%) | 0 (0.0%) |
| 15 Years | 0 (0.0%) | 0 (0.0%) |
| 16 and 17 Years | 0 (0.0%) | 0 (0.0%) |
| 18 to 24 Years | 0 (0.0%) | 0 (0.0%) |
| 25 to 34 Years | 0 (0.0%) | 0 (0.0%) |
| 35 to 44 Years | 0 (0.0%) | 0 (0.0%) |
| 45 to 54 Years | 1 (50.0%) | 0 (0.0%) |
| 55 to 64 Years | 0 (0.0%) | 0 (0.0%) |
| 65 to 74 Years | 0 (0.0%) | 0 (0.0%) |
| 75 Years and over | 0 (0.0%) | 0 (0.0%) |
| Total | 1 (5.0%) | 0 (0.0%) |
Income Above Poverty by Sex and Age in Nondalton
According to the poverty statistics in Nondalton, males aged 25 to 34 years and females aged 15 years are the age groups that are most secure financially, with 100.0% of males and 100.0% of females in these age groups living above the poverty line.
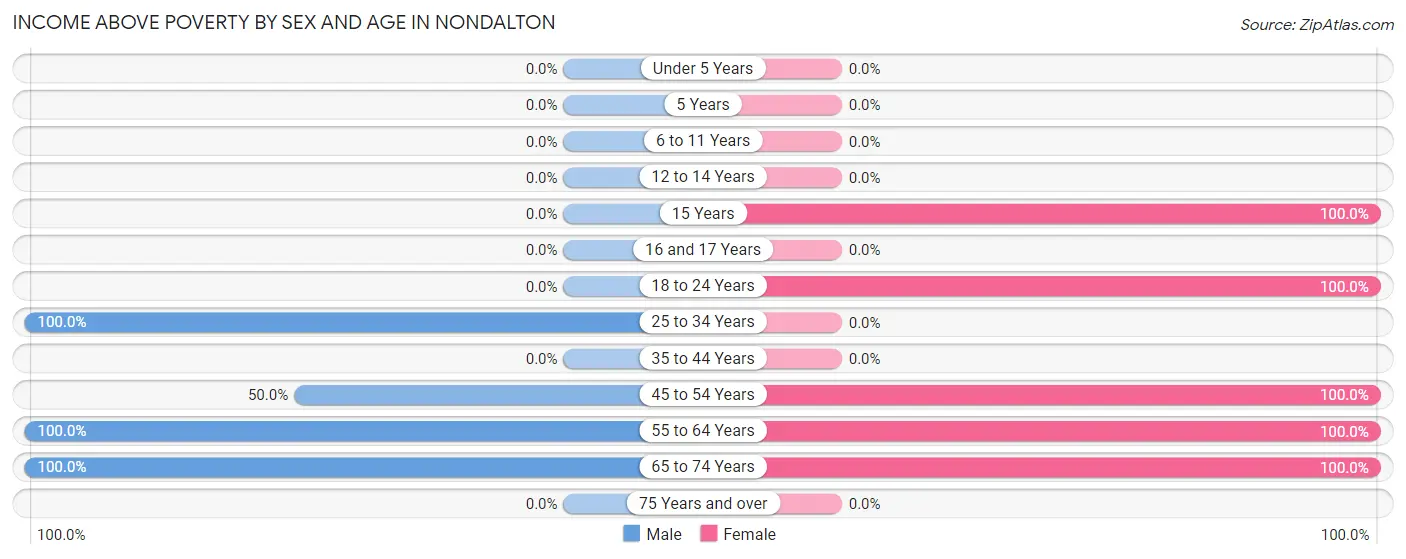
| Age Bracket | Male | Female |
| Under 5 Years | 0 (0.0%) | 0 (0.0%) |
| 5 Years | 0 (0.0%) | 0 (0.0%) |
| 6 to 11 Years | 0 (0.0%) | 0 (0.0%) |
| 12 to 14 Years | 0 (0.0%) | 0 (0.0%) |
| 15 Years | 0 (0.0%) | 1 (100.0%) |
| 16 and 17 Years | 0 (0.0%) | 0 (0.0%) |
| 18 to 24 Years | 0 (0.0%) | 2 (100.0%) |
| 25 to 34 Years | 6 (100.0%) | 0 (0.0%) |
| 35 to 44 Years | 0 (0.0%) | 0 (0.0%) |
| 45 to 54 Years | 1 (50.0%) | 9 (100.0%) |
| 55 to 64 Years | 7 (100.0%) | 3 (100.0%) |
| 65 to 74 Years | 5 (100.0%) | 5 (100.0%) |
| 75 Years and over | 0 (0.0%) | 0 (0.0%) |
| Total | 19 (95.0%) | 20 (100.0%) |
Income Below Poverty Among Married-Couple Families in Nondalton
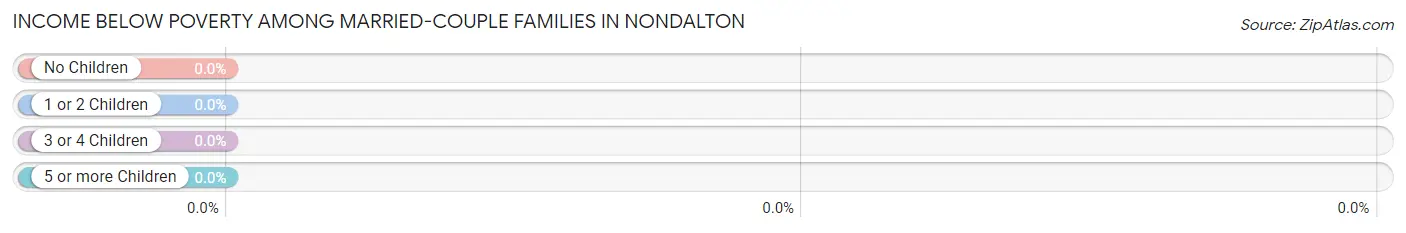
| Children | Above Poverty | Below Poverty |
| No Children | 5 (100.0%) | 0 (0.0%) |
| 1 or 2 Children | 2 (100.0%) | 0 (0.0%) |
| 3 or 4 Children | 0 (0.0%) | 0 (0.0%) |
| 5 or more Children | 0 (0.0%) | 0 (0.0%) |
| Total | 7 (100.0%) | 0 (0.0%) |
Income Below Poverty Among Single-Parent Households in Nondalton
| Children | Single Father | Single Mother |
| No Children | 0 (0.0%) | 0 (0.0%) |
| 1 or 2 Children | 0 (0.0%) | 0 (0.0%) |
| 3 or 4 Children | 0 (0.0%) | 0 (0.0%) |
| 5 or more Children | 0 (0.0%) | 0 (0.0%) |
| Total | 0 (0.0%) | 0 (0.0%) |
Income Below Poverty Among Married-Couple vs Single-Parent Households in Nondalton
| Children | Married-Couple Families | Single-Parent Households |
| No Children | 0 (0.0%) | 0 (0.0%) |
| 1 or 2 Children | 0 (0.0%) | 0 (0.0%) |
| 3 or 4 Children | 0 (0.0%) | 0 (0.0%) |
| 5 or more Children | 0 (0.0%) | 0 (0.0%) |
| Total | 0 (0.0%) | 0 (0.0%) |
Race in Nondalton
The most populous races in Nondalton are Native / Alaskan (31 | 77.5%), White / Caucasian (6 | 15.0%), and Black / African American (3 | 7.5%).
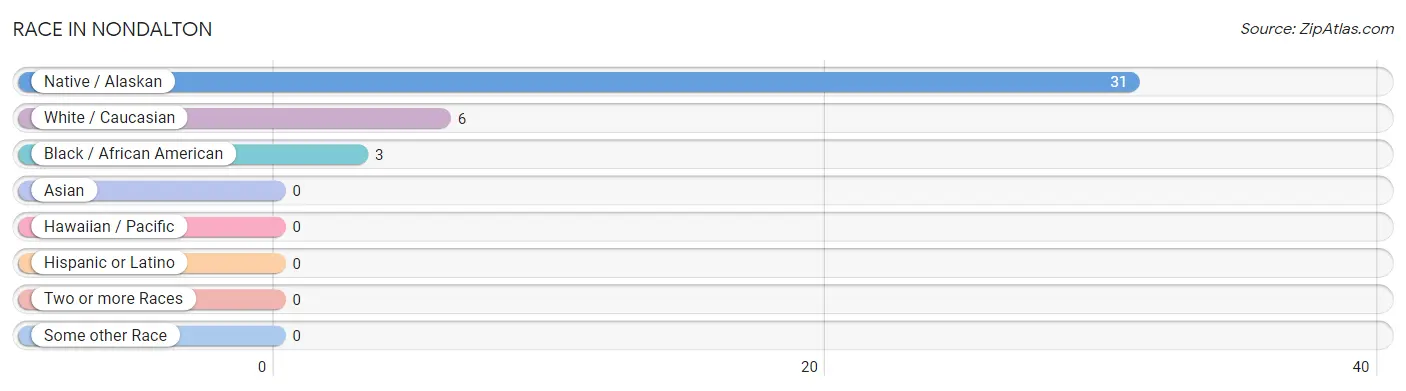
| Race | # Population | % Population |
| Asian | 0 | 0.0% |
| Black / African American | 3 | 7.5% |
| Hawaiian / Pacific | 0 | 0.0% |
| Hispanic or Latino | 0 | 0.0% |
| Native / Alaskan | 31 | 77.5% |
| White / Caucasian | 6 | 15.0% |
| Two or more Races | 0 | 0.0% |
| Some other Race | 0 | 0.0% |
| Total | 40 | 100.0% |
Ancestry in Nondalton
The most populous ancestries reported in Nondalton are Alaskan Athabascan (20 | 50.0%), Alaska Native (7 | 17.5%), German (5 | 12.5%), English (4 | 10.0%), and American (3 | 7.5%), together accounting for 97.5% of all Nondalton residents.
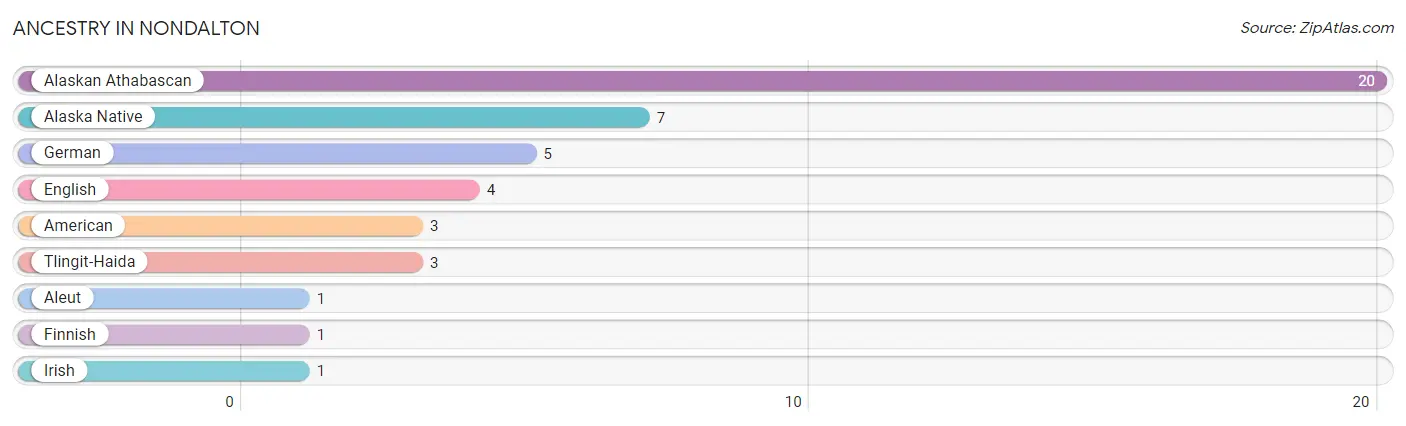
| Ancestry | # Population | % Population |
| Alaska Native | 7 | 17.5% |
| Alaskan Athabascan | 20 | 50.0% |
| Aleut | 1 | 2.5% |
| American | 3 | 7.5% |
| English | 4 | 10.0% |
| Finnish | 1 | 2.5% |
| German | 5 | 12.5% |
| Irish | 1 | 2.5% |
| Tlingit-Haida | 3 | 7.5% | View All 9 Rows |
Immigrants in Nondalton

| Immigration Origin | # Population | % Population | View All 0 Rows |
Sex and Age in Nondalton
Sex and Age in Nondalton
The most populous age groups in Nondalton are 25 to 29 Years (5 | 25.0%) for men and 45 to 49 Years (8 | 40.0%) for women.
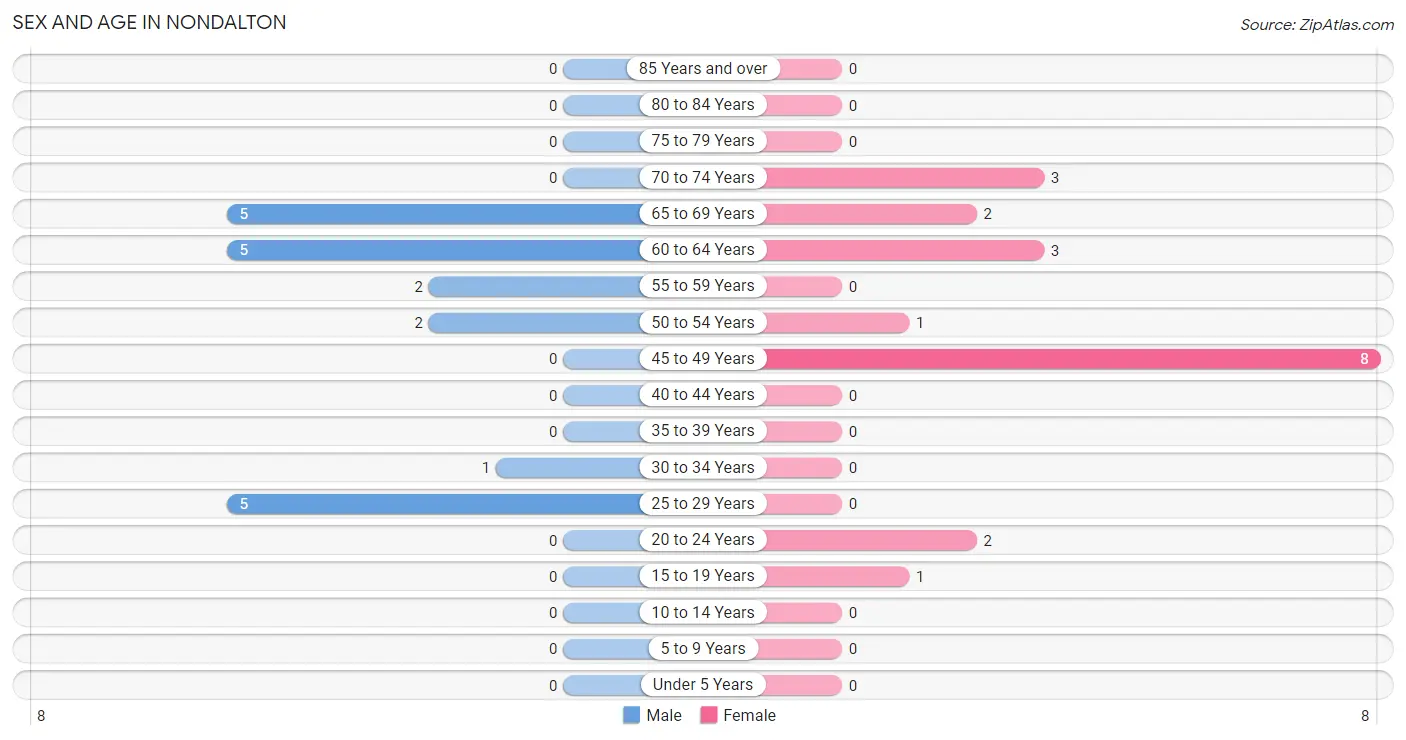
| Age Bracket | Male | Female |
| Under 5 Years | 0 (0.0%) | 0 (0.0%) |
| 5 to 9 Years | 0 (0.0%) | 0 (0.0%) |
| 10 to 14 Years | 0 (0.0%) | 0 (0.0%) |
| 15 to 19 Years | 0 (0.0%) | 1 (5.0%) |
| 20 to 24 Years | 0 (0.0%) | 2 (10.0%) |
| 25 to 29 Years | 5 (25.0%) | 0 (0.0%) |
| 30 to 34 Years | 1 (5.0%) | 0 (0.0%) |
| 35 to 39 Years | 0 (0.0%) | 0 (0.0%) |
| 40 to 44 Years | 0 (0.0%) | 0 (0.0%) |
| 45 to 49 Years | 0 (0.0%) | 8 (40.0%) |
| 50 to 54 Years | 2 (10.0%) | 1 (5.0%) |
| 55 to 59 Years | 2 (10.0%) | 0 (0.0%) |
| 60 to 64 Years | 5 (25.0%) | 3 (15.0%) |
| 65 to 69 Years | 5 (25.0%) | 2 (10.0%) |
| 70 to 74 Years | 0 (0.0%) | 3 (15.0%) |
| 75 to 79 Years | 0 (0.0%) | 0 (0.0%) |
| 80 to 84 Years | 0 (0.0%) | 0 (0.0%) |
| 85 Years and over | 0 (0.0%) | 0 (0.0%) |
| Total | 20 (100.0%) | 20 (100.0%) |
Families and Households in Nondalton
Median Family Size in Nondalton
The median family size in Nondalton is 2.33 persons per family, with married-couple families (7 | 58.3%) accounting for the largest median family size of 2.86 persons per family. On the other hand, single male/father families (2 | 16.7%) represent the smallest median family size with 1.50 persons per family.
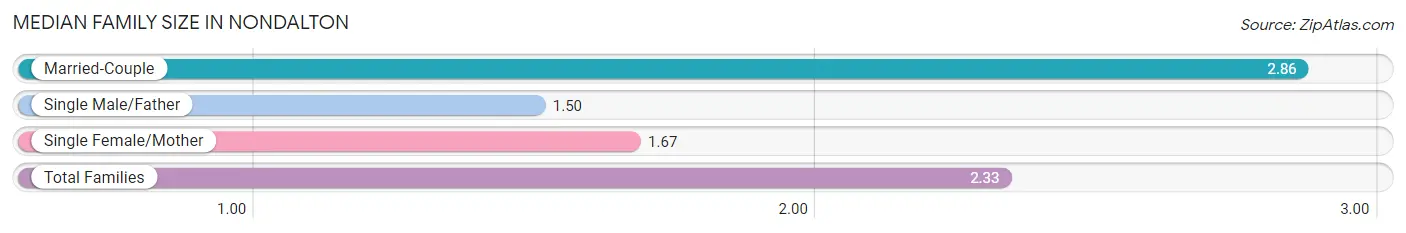
| Family Type | # Families | Family Size |
| Married-Couple | 7 (58.3%) | 2.86 |
| Single Male/Father | 2 (16.7%) | 1.50 |
| Single Female/Mother | 3 (25.0%) | 1.67 |
| Total Families | 12 (100.0%) | 2.33 |
Median Household Size in Nondalton
The median household size in Nondalton is 1.82 persons per household, with married-couple households (7 | 31.8%) accounting for the largest median household size of 2.86 persons per household. non-family households (10 | 45.5%) represent the smallest median household size with 1.10 persons per household.
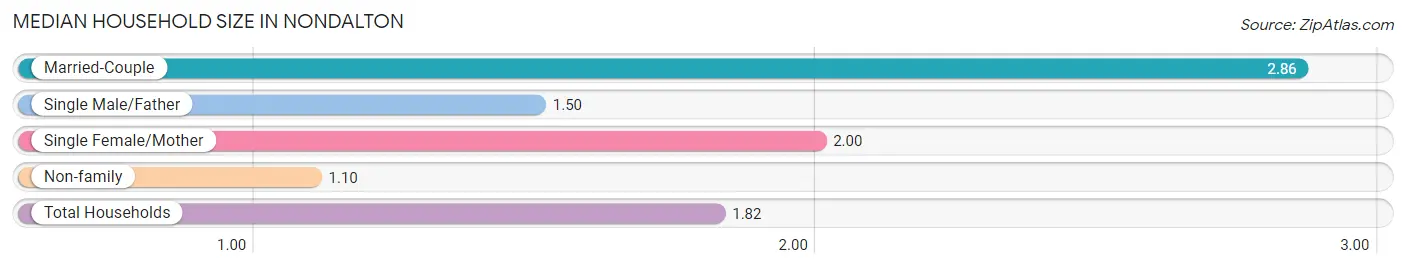
| Household Type | # Households | Household Size |
| Married-Couple | 7 (31.8%) | 2.86 |
| Single Male/Father | 2 (9.1%) | 1.50 |
| Single Female/Mother | 3 (13.6%) | 2.00 |
| Non-family | 10 (45.5%) | 1.10 |
| Total Households | 22 (100.0%) | 1.82 |
Household Size by Marriage Status in Nondalton
Out of a total of 22 households in Nondalton, 12 (54.5%) are family households, while 10 (45.5%) are nonfamily households. The most numerous type of family households are 2-person households, comprising 7, and the most common type of nonfamily households are 1-person households, comprising 6.
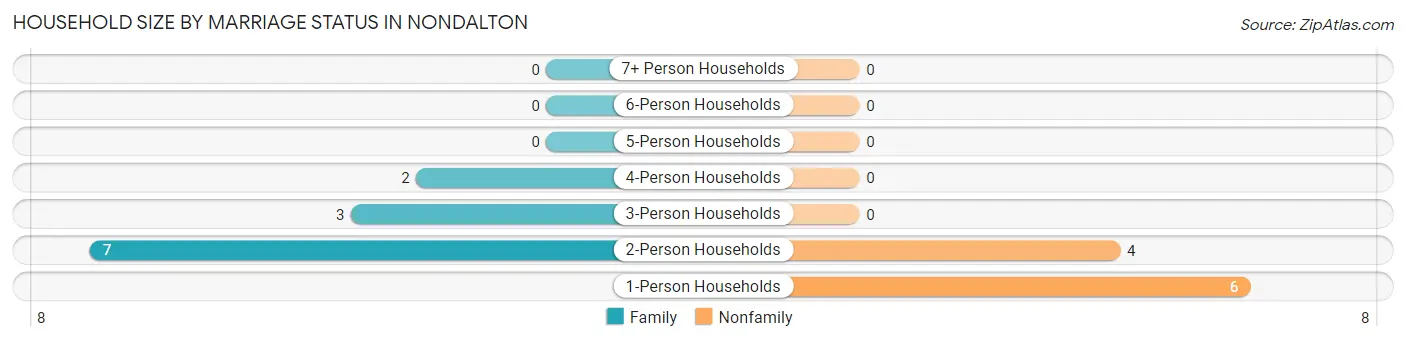
| Household Size | Family Households | Nonfamily Households |
| 1-Person Households | - | 6 (27.3%) |
| 2-Person Households | 7 (31.8%) | 4 (18.2%) |
| 3-Person Households | 3 (13.6%) | 0 (0.0%) |
| 4-Person Households | 2 (9.1%) | 0 (0.0%) |
| 5-Person Households | 0 (0.0%) | 0 (0.0%) |
| 6-Person Households | 0 (0.0%) | 0 (0.0%) |
| 7+ Person Households | 0 (0.0%) | 0 (0.0%) |
| Total | 12 (54.5%) | 10 (45.5%) |
Female Fertility in Nondalton
Fertility by Age in Nondalton
| Age Bracket | Women with Births | Births / 1,000 Women |
| 15 to 19 years | 0 (0.0%) | 0.0 |
| 20 to 34 years | 0 (0.0%) | 0.0 |
| 35 to 50 years | 0 (0.0%) | 0.0 |
| Total | 0 (0.0%) | 0.0 |
Fertility by Age by Marriage Status in Nondalton
| Age Bracket | Married | Unmarried |
| 15 to 19 years | 0 (0.0%) | 0 (0.0%) |
| 20 to 34 years | 0 (0.0%) | 0 (0.0%) |
| 35 to 50 years | 0 (0.0%) | 0 (0.0%) |
| Total | 0 (0.0%) | 0 (0.0%) |
Fertility by Education in Nondalton
| Educational Attainment | Women with Births | Births / 1,000 Women |
| Less than High School | 0 (0.0%) | 0.0 |
| High School Diploma | 0 (0.0%) | 0.0 |
| College or Associate's Degree | 0 (0.0%) | 0.0 |
| Bachelor's Degree | 0 (0.0%) | 0.0 |
| Graduate Degree | 0 (0.0%) | 0.0 |
| Total | 0 (0.0%) | 0.0 |
Fertility by Education by Marriage Status in Nondalton
| Educational Attainment | Married | Unmarried |
| Less than High School | 0 (0.0%) | 0 (0.0%) |
| High School Diploma | 0 (0.0%) | 0 (0.0%) |
| College or Associate's Degree | 0 (0.0%) | 0 (0.0%) |
| Bachelor's Degree | 0 (0.0%) | 0 (0.0%) |
| Graduate Degree | 0 (0.0%) | 0 (0.0%) |
| Total | 0 (0.0%) | 0 (0.0%) |
Employment Characteristics in Nondalton
Employment by Class of Employer in Nondalton
Among the 17 employed individuals in Nondalton, state government employees (10 | 58.8%), local government employees (5 | 29.4%), and private company employees (1 | 5.9%) make up the most common classes of employment.
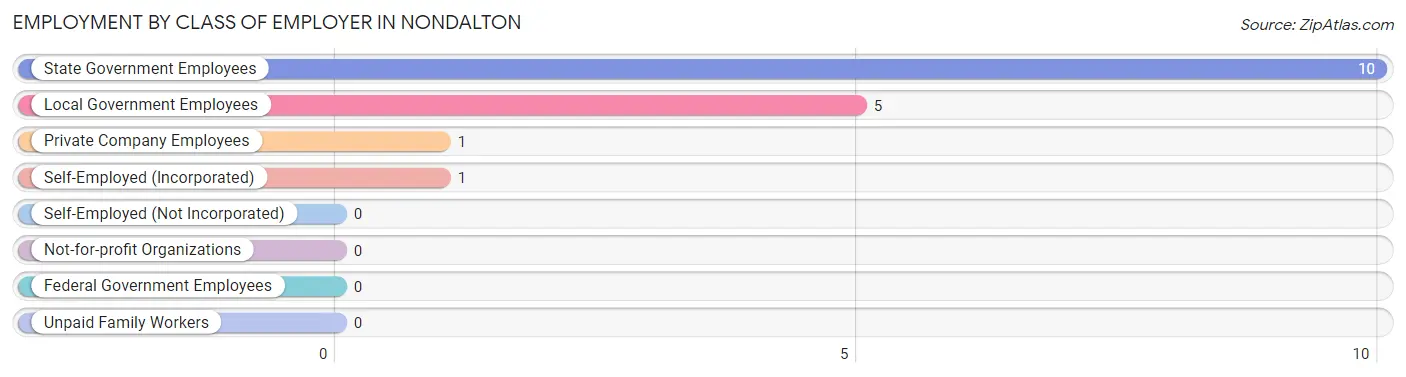
| Employer Class | # Employees | % Employees |
| Private Company Employees | 1 | 5.9% |
| Self-Employed (Incorporated) | 1 | 5.9% |
| Self-Employed (Not Incorporated) | 0 | 0.0% |
| Not-for-profit Organizations | 0 | 0.0% |
| Local Government Employees | 5 | 29.4% |
| State Government Employees | 10 | 58.8% |
| Federal Government Employees | 0 | 0.0% |
| Unpaid Family Workers | 0 | 0.0% |
| Total | 17 | 100.0% |
Employment Status by Age in Nondalton
According to the labor force statistics for Nondalton, out of the total population over 16 years of age (39), 74.4% or 29 individuals are in the labor force, with 41.4% or 12 of them unemployed. The age group with the highest labor force participation rate is 25 to 29 years, with 100.0% or 5 individuals in the labor force. Within the labor force, the 25 to 29 years age range has the highest percentage of unemployed individuals, with 100.0% or 5 of them being unemployed.
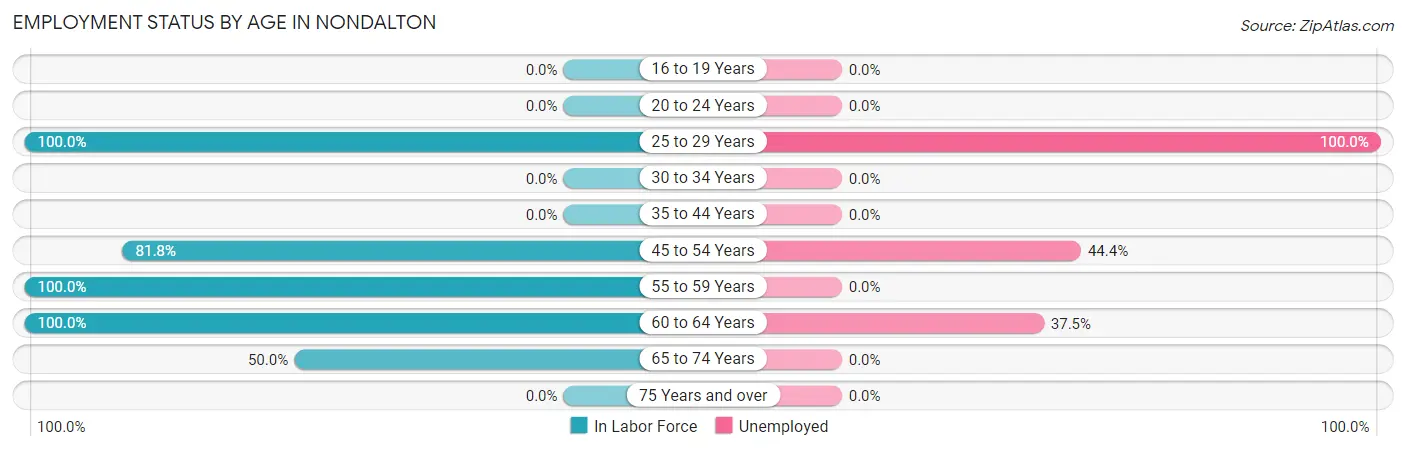
| Age Bracket | In Labor Force | Unemployed |
| 16 to 19 Years | 0 (0.0%) | 0 (0.0%) |
| 20 to 24 Years | 0 (0.0%) | 0 (0.0%) |
| 25 to 29 Years | 5 (100.0%) | 5 (100.0%) |
| 30 to 34 Years | 0 (0.0%) | 0 (0.0%) |
| 35 to 44 Years | 0 (0.0%) | 0 (0.0%) |
| 45 to 54 Years | 9 (81.8%) | 4 (44.4%) |
| 55 to 59 Years | 2 (100.0%) | 0 (0.0%) |
| 60 to 64 Years | 8 (100.0%) | 3 (37.5%) |
| 65 to 74 Years | 5 (50.0%) | 0 (0.0%) |
| 75 Years and over | 0 (0.0%) | 0 (0.0%) |
| Total | 29 (74.4%) | 12 (41.4%) |
Employment Status by Educational Attainment in Nondalton
According to labor force statistics for Nondalton, 88.9% of individuals (24) out of the total population between 25 and 64 years of age (27) are in the labor force, with 50.0% or 12 of them being unemployed. The group with the highest labor force participation rate are those with the educational attainment of less than high school, with 100.0% or 2 individuals in the labor force. Within the labor force, individuals with less than high school education have the highest percentage of unemployment, with 100.0% or 2 of them being unemployed.
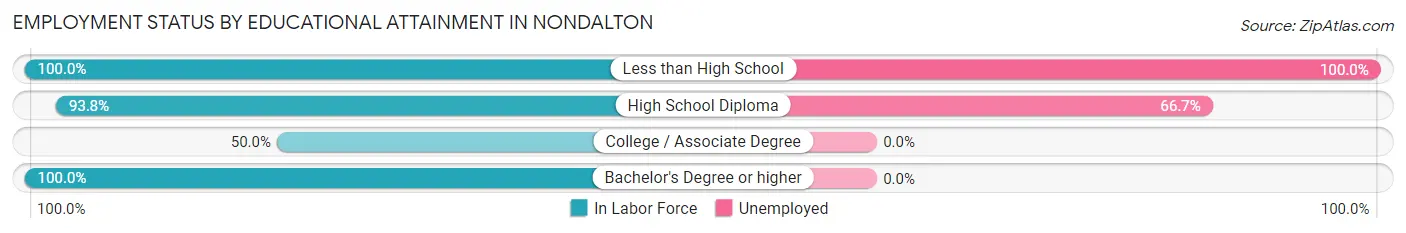
| Educational Attainment | In Labor Force | Unemployed |
| Less than High School | 2 (100.0%) | 2 (100.0%) |
| High School Diploma | 15 (93.8%) | 11 (66.7%) |
| College / Associate Degree | 2 (50.0%) | 0 (0.0%) |
| Bachelor's Degree or higher | 5 (100.0%) | 0 (0.0%) |
| Total | 24 (88.9%) | 14 (50.0%) |
Employment Occupations by Sex in Nondalton
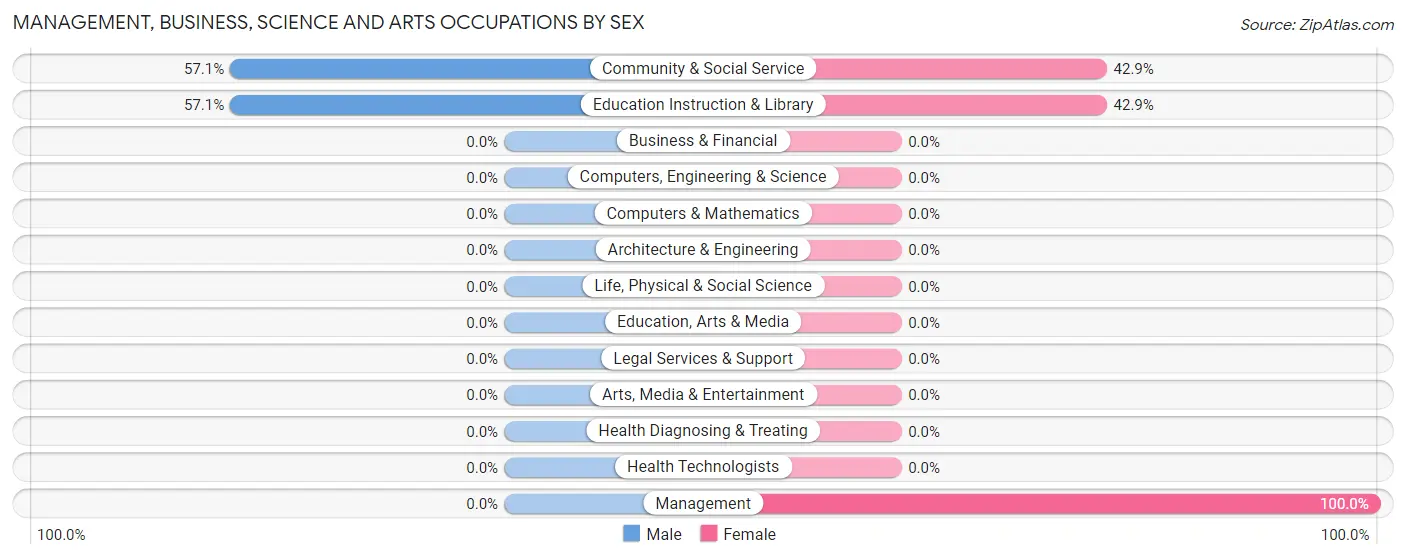
Management, Business, Science and Arts Occupations
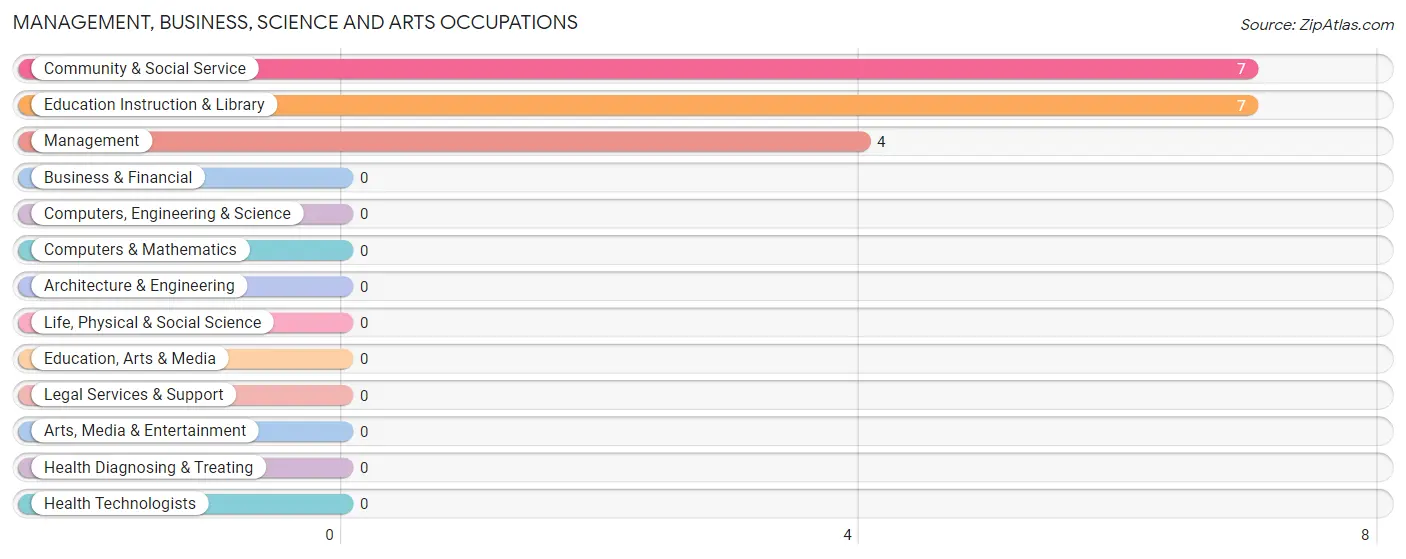
The most common Management, Business, Science and Arts occupations in Nondalton are Community & Social Service (7 | 41.2%), Education Instruction & Library (7 | 41.2%), and Management (4 | 23.5%).
Management, Business, Science and Arts Occupations by Sex
Within the Management, Business, Science and Arts occupations in Nondalton, the most male-oriented occupations are Community & Social Service (57.1%), and Education Instruction & Library (57.1%), while the most female-oriented occupations are Management (100.0%), Community & Social Service (42.9%), and Education Instruction & Library (42.9%).
| Occupation | Male | Female |
| Management | 0 (0.0%) | 4 (100.0%) |
| Business & Financial | 0 (0.0%) | 0 (0.0%) |
| Computers, Engineering & Science | 0 (0.0%) | 0 (0.0%) |
| Computers & Mathematics | 0 (0.0%) | 0 (0.0%) |
| Architecture & Engineering | 0 (0.0%) | 0 (0.0%) |
| Life, Physical & Social Science | 0 (0.0%) | 0 (0.0%) |
| Community & Social Service | 4 (57.1%) | 3 (42.9%) |
| Education, Arts & Media | 0 (0.0%) | 0 (0.0%) |
| Legal Services & Support | 0 (0.0%) | 0 (0.0%) |
| Education Instruction & Library | 4 (57.1%) | 3 (42.9%) |
| Arts, Media & Entertainment | 0 (0.0%) | 0 (0.0%) |
| Health Diagnosing & Treating | 0 (0.0%) | 0 (0.0%) |
| Health Technologists | 0 (0.0%) | 0 (0.0%) |
| Total (Category) | 4 (36.4%) | 7 (63.6%) |
| Total (Overall) | 10 (58.8%) | 7 (41.2%) |
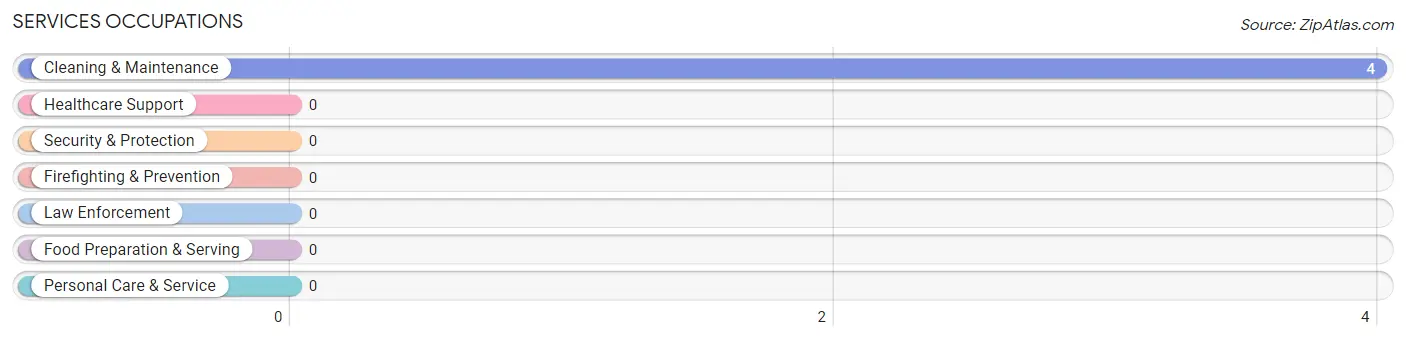
Services Occupations
The most common Services occupations in Nondalton are , and Cleaning & Maintenance (4 | 23.5%).
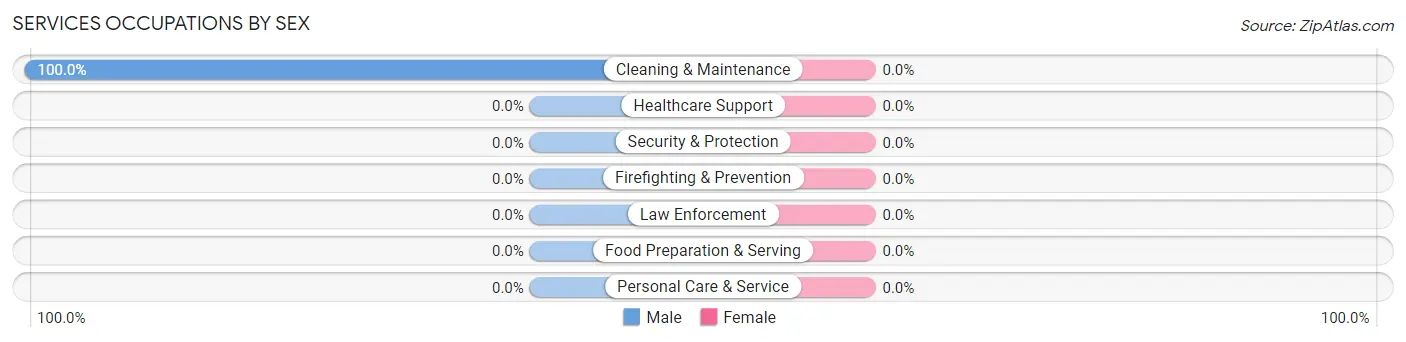
Services Occupations by Sex
| Occupation | Male | Female |
| Healthcare Support | 0 (0.0%) | 0 (0.0%) |
| Security & Protection | 0 (0.0%) | 0 (0.0%) |
| Firefighting & Prevention | 0 (0.0%) | 0 (0.0%) |
| Law Enforcement | 0 (0.0%) | 0 (0.0%) |
| Food Preparation & Serving | 0 (0.0%) | 0 (0.0%) |
| Cleaning & Maintenance | 4 (100.0%) | 0 (0.0%) |
| Personal Care & Service | 0 (0.0%) | 0 (0.0%) |
| Total (Category) | 4 (100.0%) | 0 (0.0%) |
| Total (Overall) | 10 (58.8%) | 7 (41.2%) |
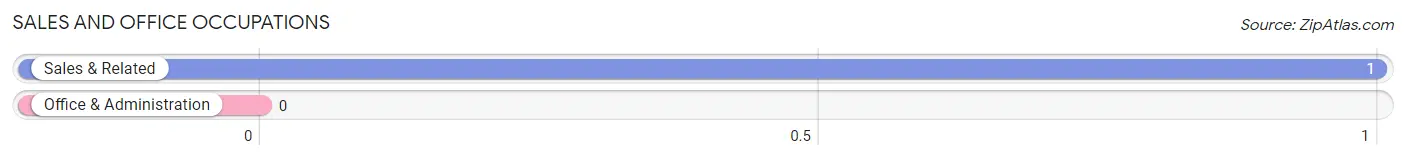
Sales and Office Occupations
The most common Sales and Office occupations in Nondalton are , and Sales & Related (1 | 5.9%).
Sales and Office Occupations by Sex
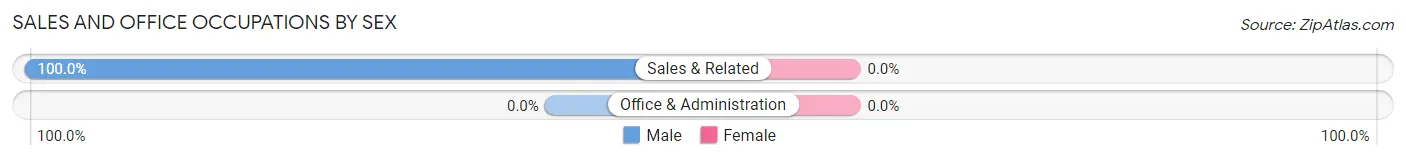
| Occupation | Male | Female |
| Sales & Related | 1 (100.0%) | 0 (0.0%) |
| Office & Administration | 0 (0.0%) | 0 (0.0%) |
| Total (Category) | 1 (100.0%) | 0 (0.0%) |
| Total (Overall) | 10 (58.8%) | 7 (41.2%) |
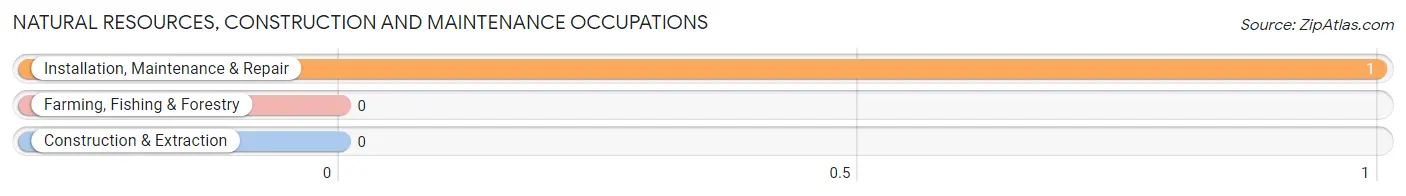
Natural Resources, Construction and Maintenance Occupations
The most common Natural Resources, Construction and Maintenance occupations in Nondalton are , and Installation, Maintenance & Repair (1 | 5.9%).
Natural Resources, Construction and Maintenance Occupations by Sex
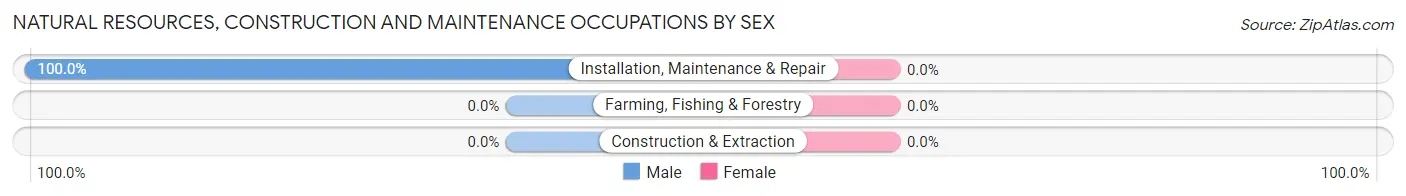
| Occupation | Male | Female |
| Farming, Fishing & Forestry | 0 (0.0%) | 0 (0.0%) |
| Construction & Extraction | 0 (0.0%) | 0 (0.0%) |
| Installation, Maintenance & Repair | 1 (100.0%) | 0 (0.0%) |
| Total (Category) | 1 (100.0%) | 0 (0.0%) |
| Total (Overall) | 10 (58.8%) | 7 (41.2%) |
Production, Transportation and Moving Occupations
Production, Transportation and Moving Occupations by Sex
| Occupation | Male | Female |
| Production | 0 (0.0%) | 0 (0.0%) |
| Transportation | 0 (0.0%) | 0 (0.0%) |
| Material Moving | 0 (0.0%) | 0 (0.0%) |
| Total (Category) | 0 (0.0%) | 0 (0.0%) |
| Total (Overall) | 10 (58.8%) | 7 (41.2%) |
Employment Industries by Sex in Nondalton
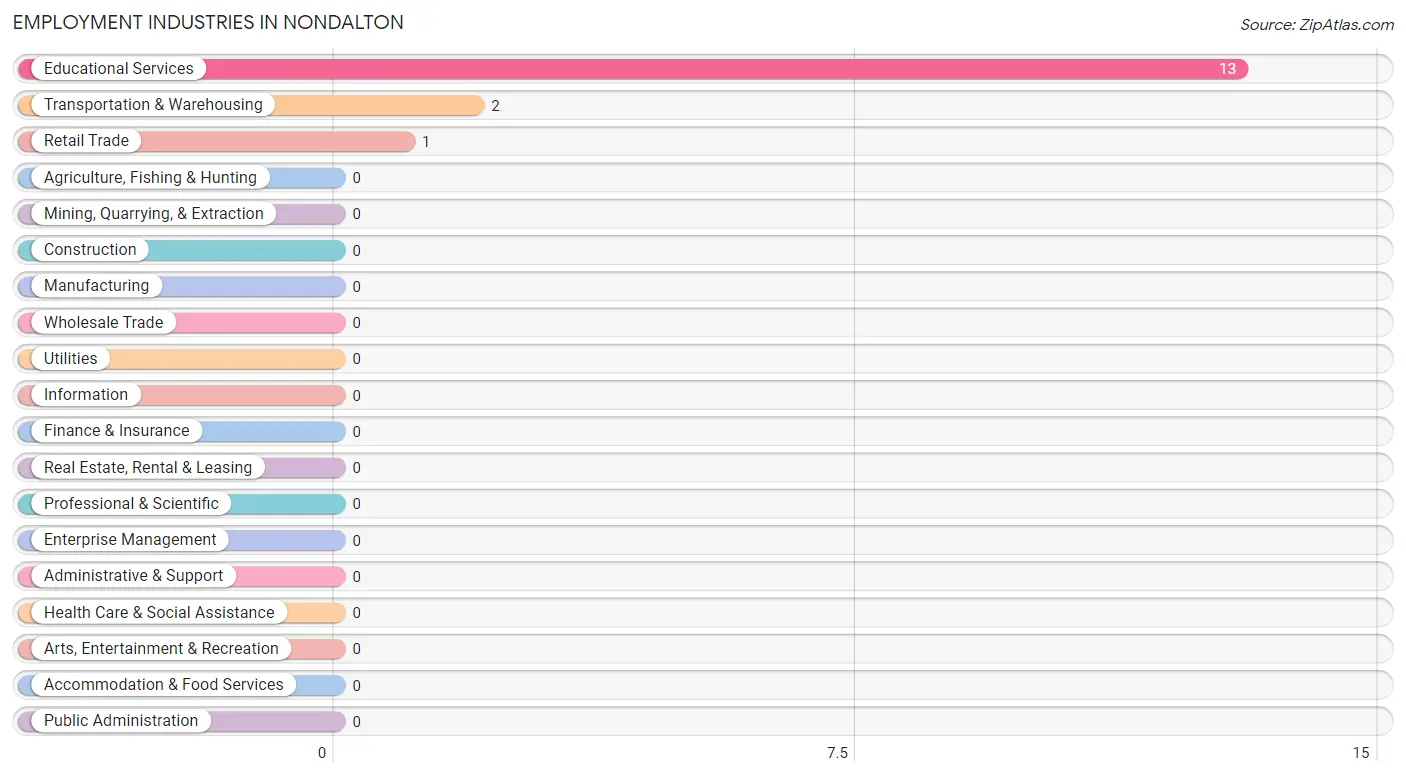
Employment Industries in Nondalton
The major employment industries in Nondalton include Educational Services (13 | 76.5%), Transportation & Warehousing (2 | 11.8%), and Retail Trade (1 | 5.9%).
Employment Industries by Sex in Nondalton
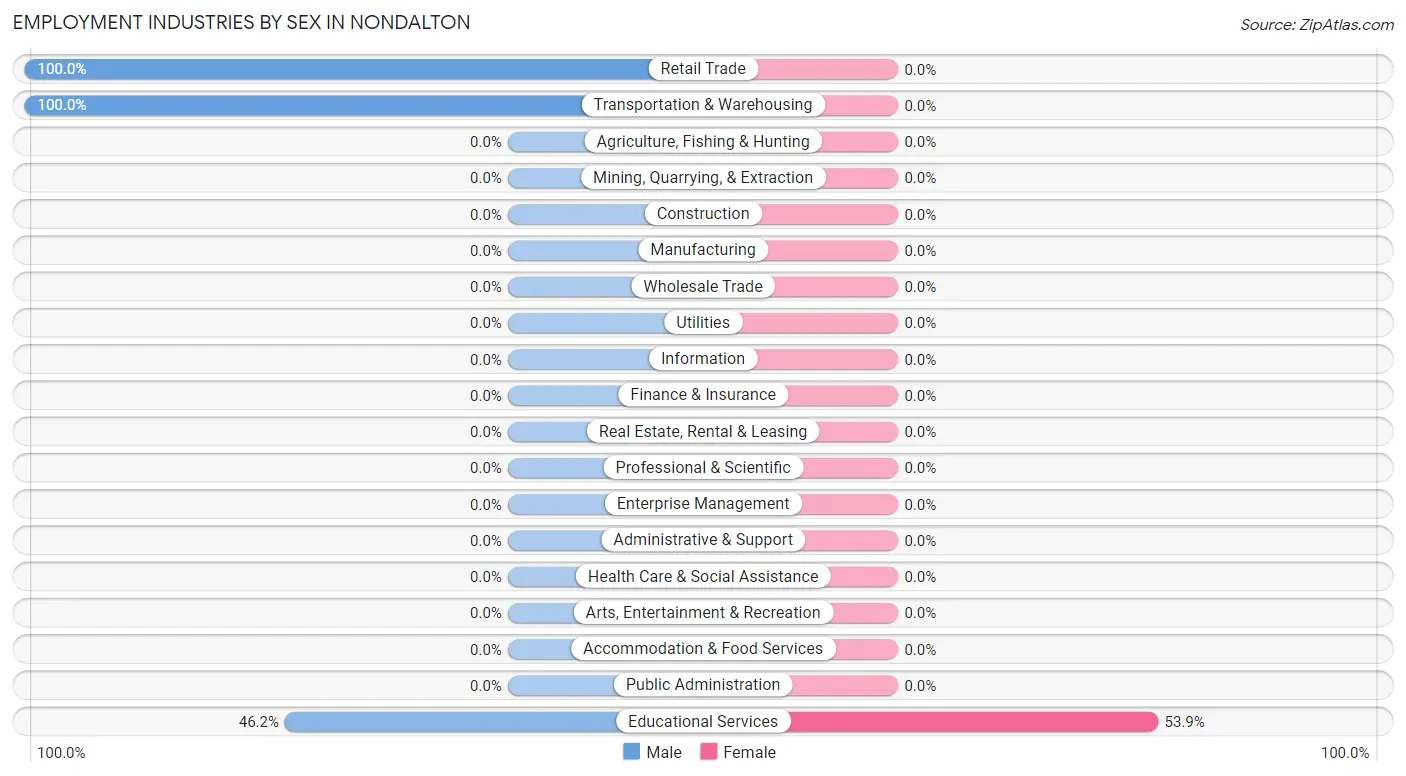
| Industry | Male | Female |
| Agriculture, Fishing & Hunting | 0 (0.0%) | 0 (0.0%) |
| Mining, Quarrying, & Extraction | 0 (0.0%) | 0 (0.0%) |
| Construction | 0 (0.0%) | 0 (0.0%) |
| Manufacturing | 0 (0.0%) | 0 (0.0%) |
| Wholesale Trade | 0 (0.0%) | 0 (0.0%) |
| Retail Trade | 1 (100.0%) | 0 (0.0%) |
| Transportation & Warehousing | 2 (100.0%) | 0 (0.0%) |
| Utilities | 0 (0.0%) | 0 (0.0%) |
| Information | 0 (0.0%) | 0 (0.0%) |
| Finance & Insurance | 0 (0.0%) | 0 (0.0%) |
| Real Estate, Rental & Leasing | 0 (0.0%) | 0 (0.0%) |
| Professional & Scientific | 0 (0.0%) | 0 (0.0%) |
| Enterprise Management | 0 (0.0%) | 0 (0.0%) |
| Administrative & Support | 0 (0.0%) | 0 (0.0%) |
| Educational Services | 6 (46.2%) | 7 (53.8%) |
| Health Care & Social Assistance | 0 (0.0%) | 0 (0.0%) |
| Arts, Entertainment & Recreation | 0 (0.0%) | 0 (0.0%) |
| Accommodation & Food Services | 0 (0.0%) | 0 (0.0%) |
| Public Administration | 0 (0.0%) | 0 (0.0%) |
| Total | 10 (58.8%) | 7 (41.2%) |
Education in Nondalton
School Enrollment in Nondalton
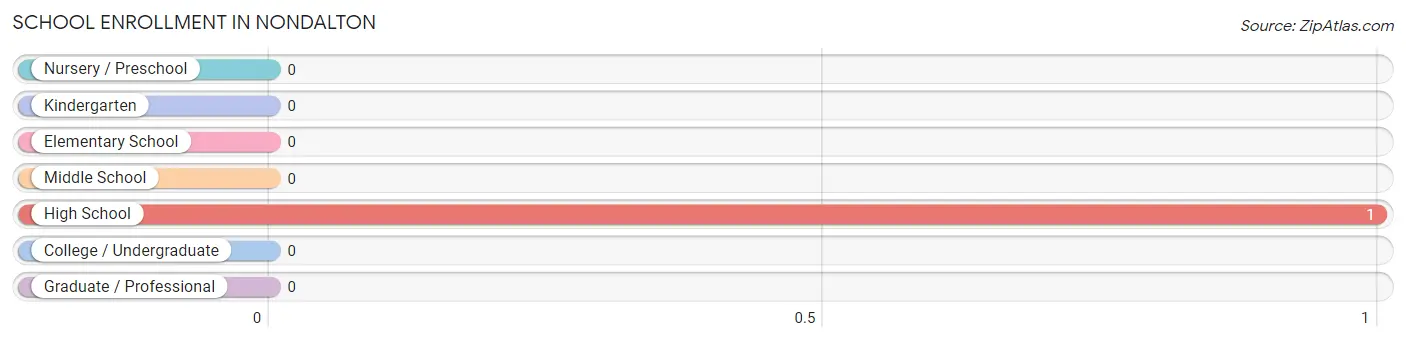
| School Level | # Students | % Students |
| Nursery / Preschool | 0 | 0.0% |
| Kindergarten | 0 | 0.0% |
| Elementary School | 0 | 0.0% |
| Middle School | 0 | 0.0% |
| High School | 1 | 100.0% |
| College / Undergraduate | 0 | 0.0% |
| Graduate / Professional | 0 | 0.0% |
| Total | 1 | 100.0% |
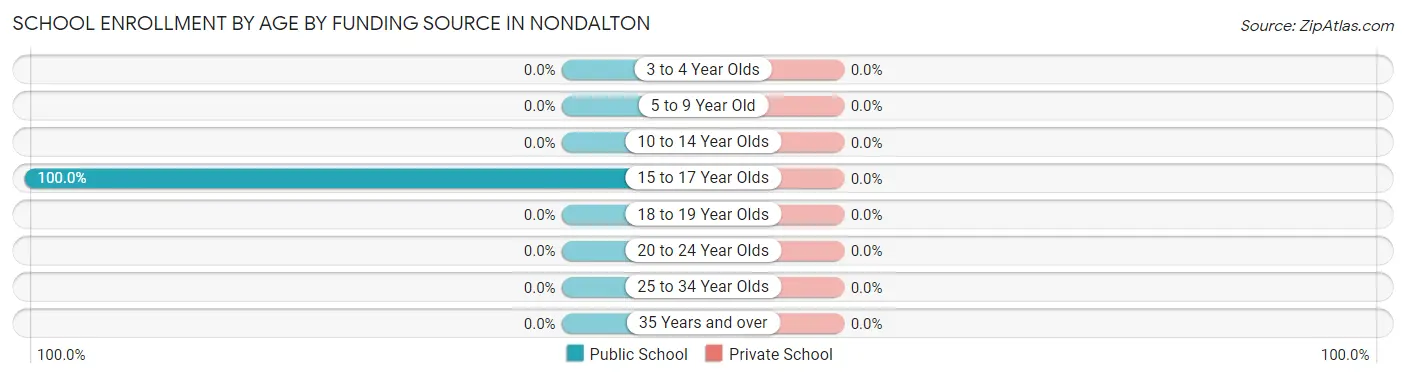
School Enrollment by Age by Funding Source in Nondalton
| Age Bracket | Public School | Private School |
| 3 to 4 Year Olds | 0 (0.0%) | 0 (0.0%) |
| 5 to 9 Year Old | 0 (0.0%) | 0 (0.0%) |
| 10 to 14 Year Olds | 0 (0.0%) | 0 (0.0%) |
| 15 to 17 Year Olds | 1 (100.0%) | 0 (0.0%) |
| 18 to 19 Year Olds | 0 (0.0%) | 0 (0.0%) |
| 20 to 24 Year Olds | 0 (0.0%) | 0 (0.0%) |
| 25 to 34 Year Olds | 0 (0.0%) | 0 (0.0%) |
| 35 Years and over | 0 (0.0%) | 0 (0.0%) |
| Total | 1 (100.0%) | 0 (0.0%) |
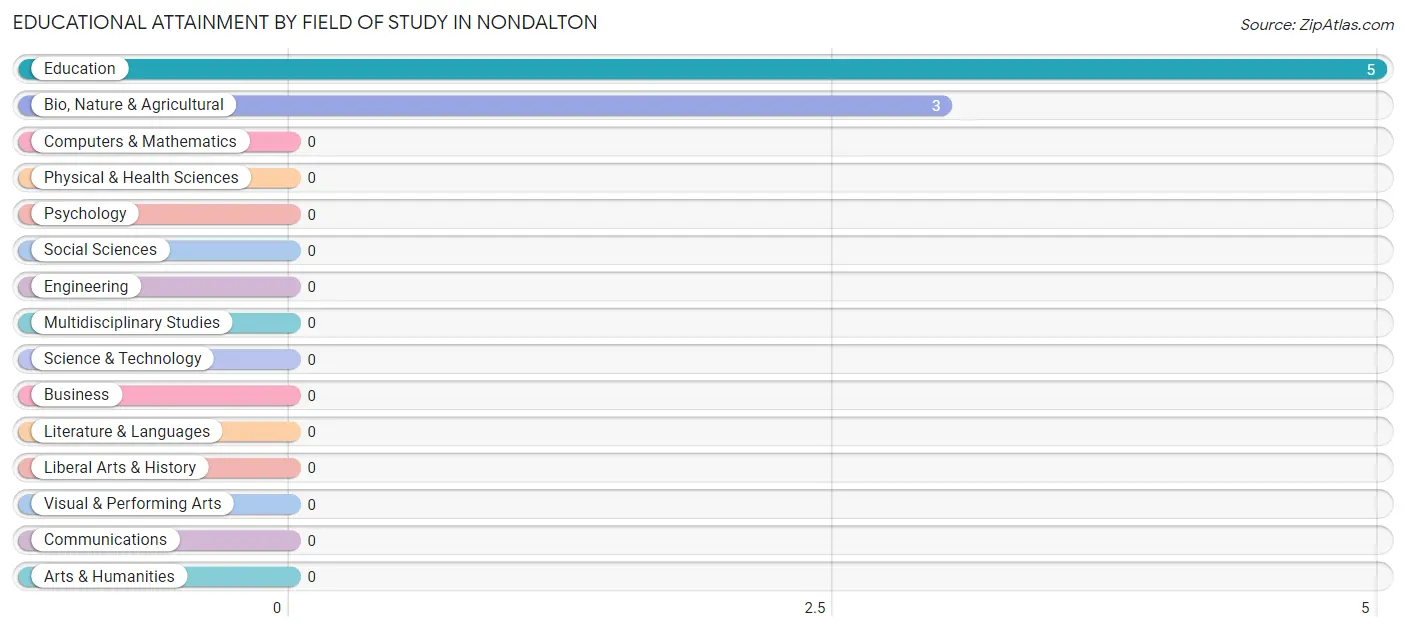
Educational Attainment by Field of Study in Nondalton
Education (5 | 62.5%), and bio, nature & agricultural (3 | 37.5%) are the most common fields of study among 8 individuals in Nondalton who have obtained a bachelor's degree or higher.
| Field of Study | # Graduates | % Graduates |
| Computers & Mathematics | 0 | 0.0% |
| Bio, Nature & Agricultural | 3 | 37.5% |
| Physical & Health Sciences | 0 | 0.0% |
| Psychology | 0 | 0.0% |
| Social Sciences | 0 | 0.0% |
| Engineering | 0 | 0.0% |
| Multidisciplinary Studies | 0 | 0.0% |
| Science & Technology | 0 | 0.0% |
| Business | 0 | 0.0% |
| Education | 5 | 62.5% |
| Literature & Languages | 0 | 0.0% |
| Liberal Arts & History | 0 | 0.0% |
| Visual & Performing Arts | 0 | 0.0% |
| Communications | 0 | 0.0% |
| Arts & Humanities | 0 | 0.0% |
| Total | 8 | 100.0% |
Transportation & Commute in Nondalton
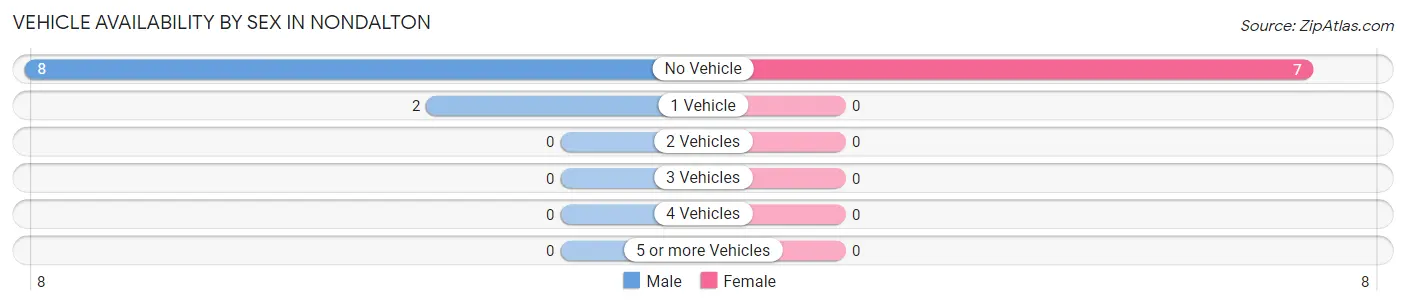
Vehicle Availability by Sex in Nondalton
The most prevalent vehicle ownership categories in Nondalton are males with no vehicle (8, accounting for 80.0%) and females with no vehicle (7, making up 114.3%).
| Vehicles Available | Male | Female |
| No Vehicle | 8 (80.0%) | 7 (100.0%) |
| 1 Vehicle | 2 (20.0%) | 0 (0.0%) |
| 2 Vehicles | 0 (0.0%) | 0 (0.0%) |
| 3 Vehicles | 0 (0.0%) | 0 (0.0%) |
| 4 Vehicles | 0 (0.0%) | 0 (0.0%) |
| 5 or more Vehicles | 0 (0.0%) | 0 (0.0%) |
| Total | 10 (100.0%) | 7 (100.0%) |
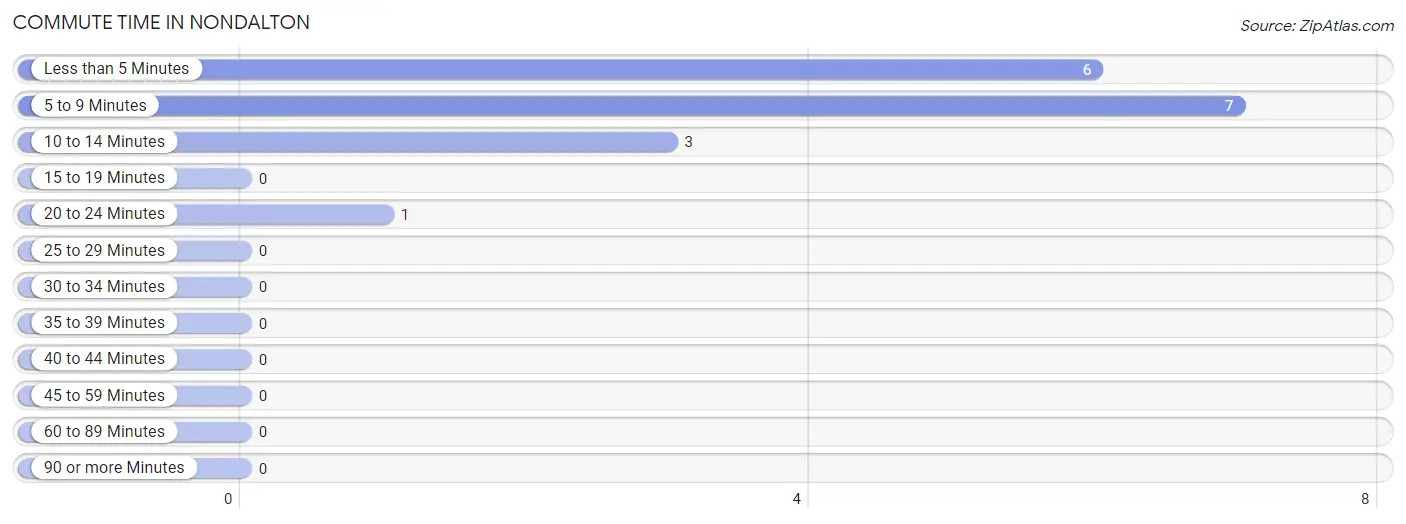
Commute Time in Nondalton
The most frequently occuring commute durations in Nondalton are 5 to 9 minutes (7 commuters, 41.2%), less than 5 minutes (6 commuters, 35.3%), and 10 to 14 minutes (3 commuters, 17.6%).
| Commute Time | # Commuters | % Commuters |
| Less than 5 Minutes | 6 | 35.3% |
| 5 to 9 Minutes | 7 | 41.2% |
| 10 to 14 Minutes | 3 | 17.6% |
| 15 to 19 Minutes | 0 | 0.0% |
| 20 to 24 Minutes | 1 | 5.9% |
| 25 to 29 Minutes | 0 | 0.0% |
| 30 to 34 Minutes | 0 | 0.0% |
| 35 to 39 Minutes | 0 | 0.0% |
| 40 to 44 Minutes | 0 | 0.0% |
| 45 to 59 Minutes | 0 | 0.0% |
| 60 to 89 Minutes | 0 | 0.0% |
| 90 or more Minutes | 0 | 0.0% |
Commute Time by Sex in Nondalton
The most common commute times in Nondalton are 5 to 9 minutes (4 commuters, 40.0%) for males and less than 5 minutes (4 commuters, 57.1%) for females.
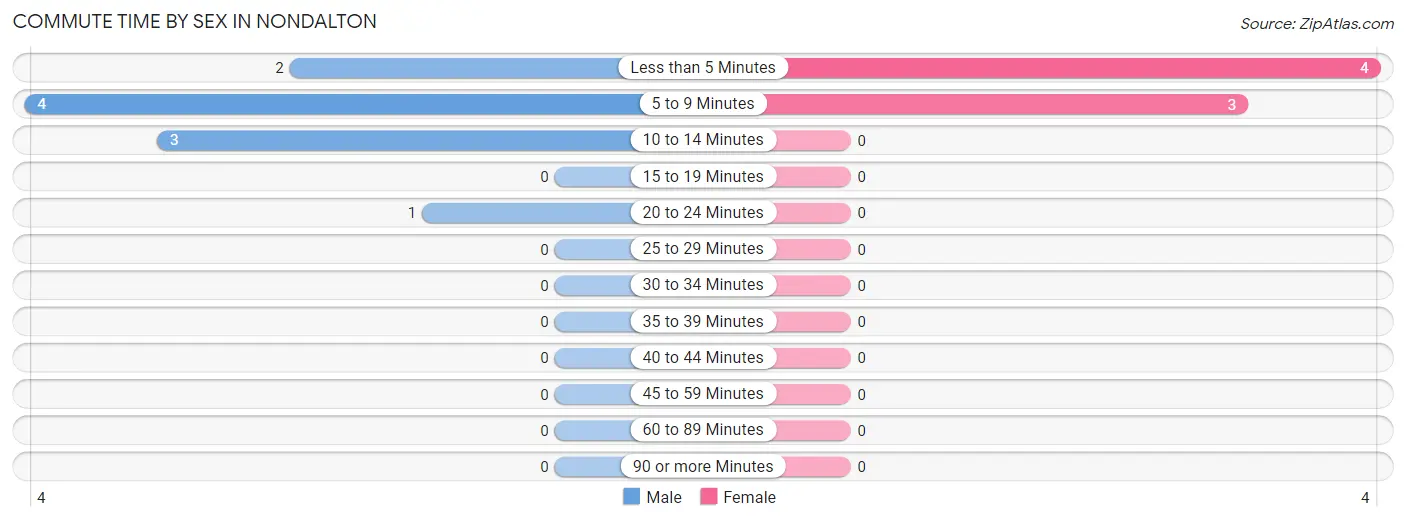
| Commute Time | Male | Female |
| Less than 5 Minutes | 2 (20.0%) | 4 (57.1%) |
| 5 to 9 Minutes | 4 (40.0%) | 3 (42.9%) |
| 10 to 14 Minutes | 3 (30.0%) | 0 (0.0%) |
| 15 to 19 Minutes | 0 (0.0%) | 0 (0.0%) |
| 20 to 24 Minutes | 1 (10.0%) | 0 (0.0%) |
| 25 to 29 Minutes | 0 (0.0%) | 0 (0.0%) |
| 30 to 34 Minutes | 0 (0.0%) | 0 (0.0%) |
| 35 to 39 Minutes | 0 (0.0%) | 0 (0.0%) |
| 40 to 44 Minutes | 0 (0.0%) | 0 (0.0%) |
| 45 to 59 Minutes | 0 (0.0%) | 0 (0.0%) |
| 60 to 89 Minutes | 0 (0.0%) | 0 (0.0%) |
| 90 or more Minutes | 0 (0.0%) | 0 (0.0%) |
Time of Departure to Work by Sex in Nondalton
The most frequent times of departure to work in Nondalton are 5:00 AM to 5:29 AM (4, 40.0%) for males and 6:30 AM to 6:59 AM (4, 57.1%) for females.
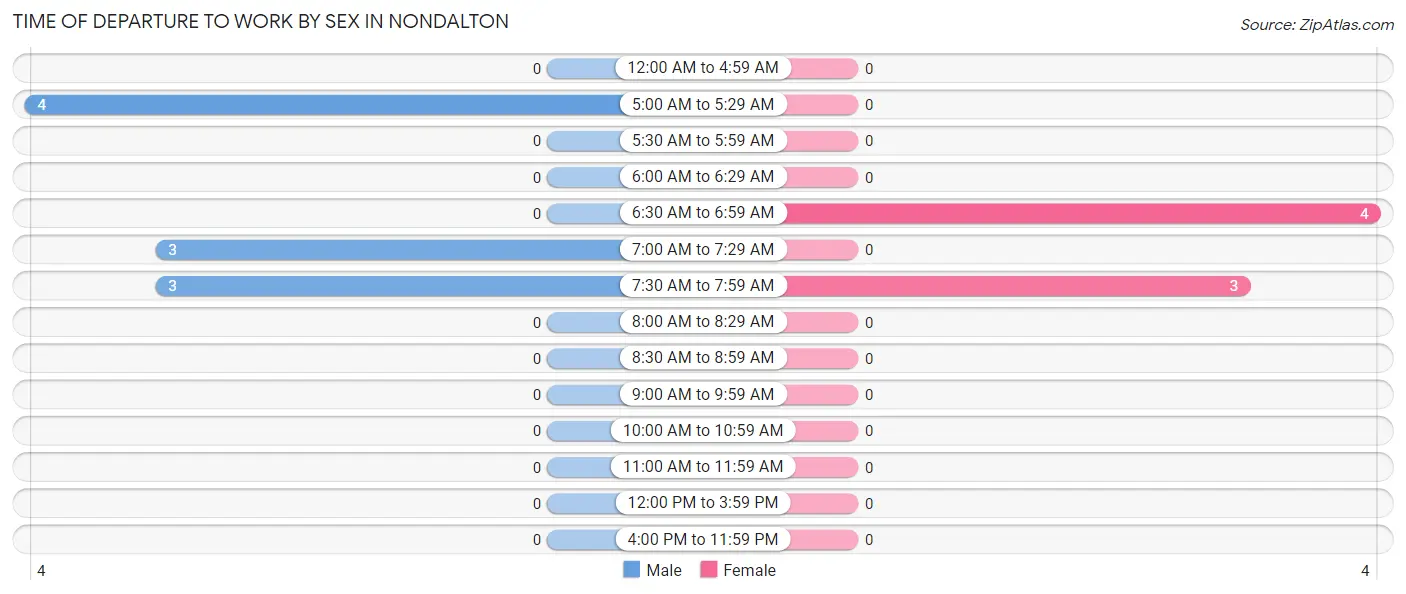
| Time of Departure | Male | Female |
| 12:00 AM to 4:59 AM | 0 (0.0%) | 0 (0.0%) |
| 5:00 AM to 5:29 AM | 4 (40.0%) | 0 (0.0%) |
| 5:30 AM to 5:59 AM | 0 (0.0%) | 0 (0.0%) |
| 6:00 AM to 6:29 AM | 0 (0.0%) | 0 (0.0%) |
| 6:30 AM to 6:59 AM | 0 (0.0%) | 4 (57.1%) |
| 7:00 AM to 7:29 AM | 3 (30.0%) | 0 (0.0%) |
| 7:30 AM to 7:59 AM | 3 (30.0%) | 3 (42.9%) |
| 8:00 AM to 8:29 AM | 0 (0.0%) | 0 (0.0%) |
| 8:30 AM to 8:59 AM | 0 (0.0%) | 0 (0.0%) |
| 9:00 AM to 9:59 AM | 0 (0.0%) | 0 (0.0%) |
| 10:00 AM to 10:59 AM | 0 (0.0%) | 0 (0.0%) |
| 11:00 AM to 11:59 AM | 0 (0.0%) | 0 (0.0%) |
| 12:00 PM to 3:59 PM | 0 (0.0%) | 0 (0.0%) |
| 4:00 PM to 11:59 PM | 0 (0.0%) | 0 (0.0%) |
| Total | 10 (100.0%) | 7 (100.0%) |
Housing Occupancy in Nondalton
Occupancy by Ownership in Nondalton
Of the total 22 dwellings in Nondalton, owner-occupied units account for 7 (31.8%), while renter-occupied units make up 15 (68.2%).
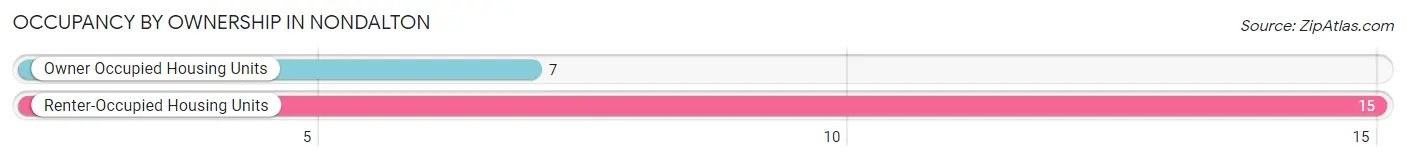
| Occupancy | # Housing Units | % Housing Units |
| Owner Occupied Housing Units | 7 | 31.8% |
| Renter-Occupied Housing Units | 15 | 68.2% |
| Total Occupied Housing Units | 22 | 100.0% |
Occupancy by Household Size in Nondalton
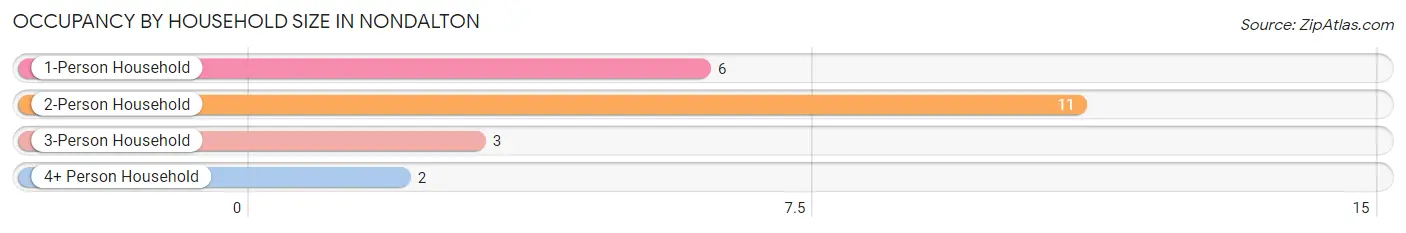
| Household Size | # Housing Units | % Housing Units |
| 1-Person Household | 6 | 27.3% |
| 2-Person Household | 11 | 50.0% |
| 3-Person Household | 3 | 13.6% |
| 4+ Person Household | 2 | 9.1% |
| Total Housing Units | 22 | 100.0% |
Occupancy by Ownership by Household Size in Nondalton
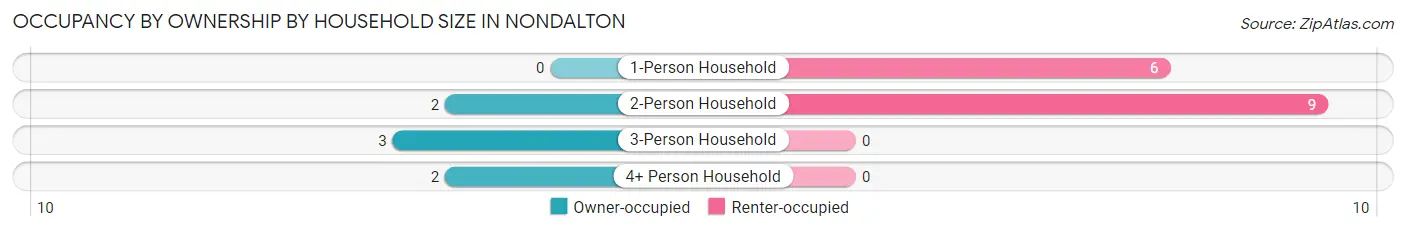
| Household Size | Owner-occupied | Renter-occupied |
| 1-Person Household | 0 (0.0%) | 6 (100.0%) |
| 2-Person Household | 2 (18.2%) | 9 (81.8%) |
| 3-Person Household | 3 (100.0%) | 0 (0.0%) |
| 4+ Person Household | 2 (100.0%) | 0 (0.0%) |
| Total Housing Units | 7 (31.8%) | 15 (68.2%) |
Occupancy by Educational Attainment in Nondalton
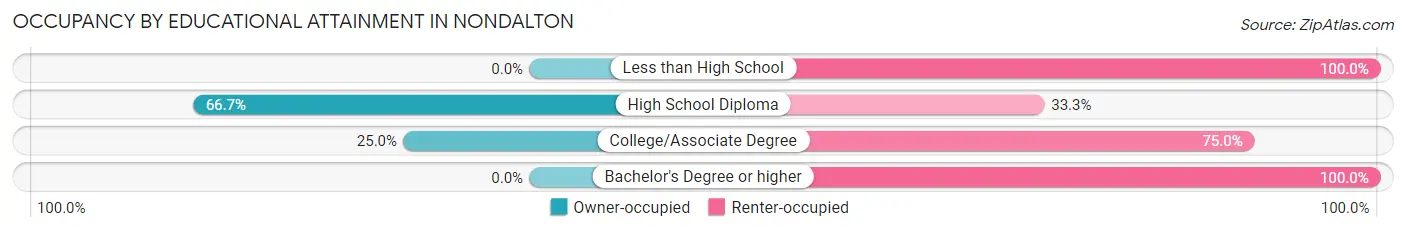
| Household Size | Owner-occupied | Renter-occupied |
| Less than High School | 0 (0.0%) | 2 (100.0%) |
| High School Diploma | 6 (66.7%) | 3 (33.3%) |
| College/Associate Degree | 1 (25.0%) | 3 (75.0%) |
| Bachelor's Degree or higher | 0 (0.0%) | 7 (100.0%) |
Occupancy by Age of Householder in Nondalton
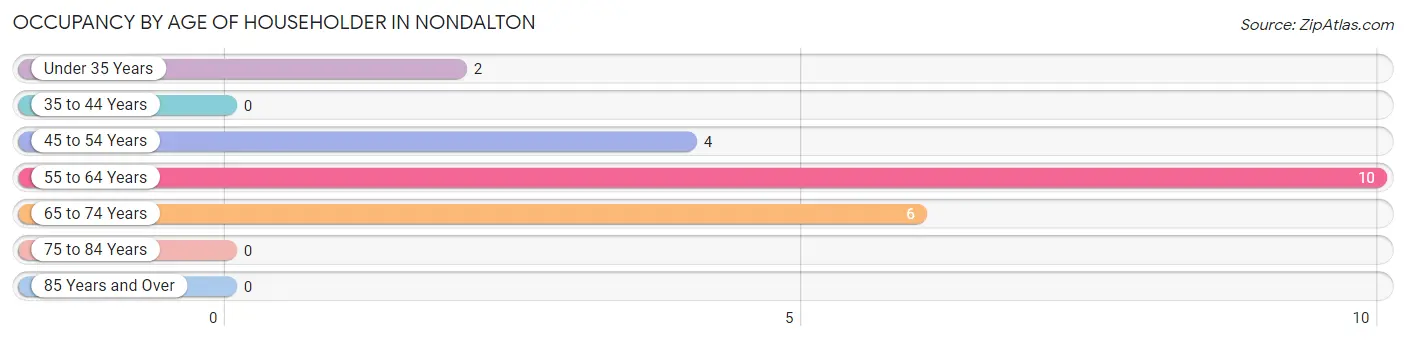
| Age Bracket | # Households | % Households |
| Under 35 Years | 2 | 9.1% |
| 35 to 44 Years | 0 | 0.0% |
| 45 to 54 Years | 4 | 18.2% |
| 55 to 64 Years | 10 | 45.5% |
| 65 to 74 Years | 6 | 27.3% |
| 75 to 84 Years | 0 | 0.0% |
| 85 Years and Over | 0 | 0.0% |
| Total | 22 | 100.0% |
Housing Finances in Nondalton
Median Income by Occupancy in Nondalton
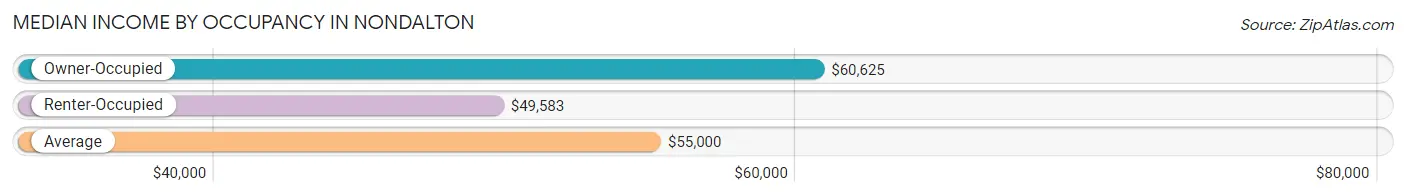
| Occupancy Type | # Households | Median Income |
| Owner-Occupied | 7 (31.8%) | $60,625 |
| Renter-Occupied | 15 (68.2%) | $49,583 |
| Average | 22 (100.0%) | $55,000 |
Occupancy by Householder Income Bracket in Nondalton
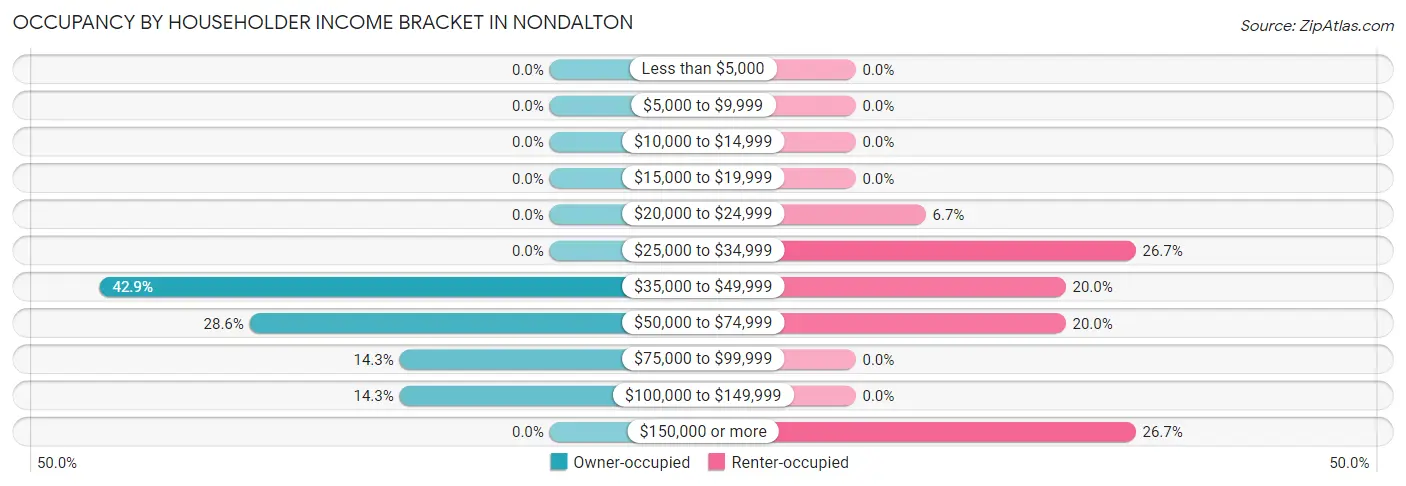
| Income Bracket | Owner-occupied | Renter-occupied |
| Less than $5,000 | 0 (0.0%) | 0 (0.0%) |
| $5,000 to $9,999 | 0 (0.0%) | 0 (0.0%) |
| $10,000 to $14,999 | 0 (0.0%) | 0 (0.0%) |
| $15,000 to $19,999 | 0 (0.0%) | 0 (0.0%) |
| $20,000 to $24,999 | 0 (0.0%) | 1 (6.7%) |
| $25,000 to $34,999 | 0 (0.0%) | 4 (26.7%) |
| $35,000 to $49,999 | 3 (42.9%) | 3 (20.0%) |
| $50,000 to $74,999 | 2 (28.6%) | 3 (20.0%) |
| $75,000 to $99,999 | 1 (14.3%) | 0 (0.0%) |
| $100,000 to $149,999 | 1 (14.3%) | 0 (0.0%) |
| $150,000 or more | 0 (0.0%) | 4 (26.7%) |
| Total | 7 (100.0%) | 15 (100.0%) |
Monthly Housing Cost Tiers in Nondalton
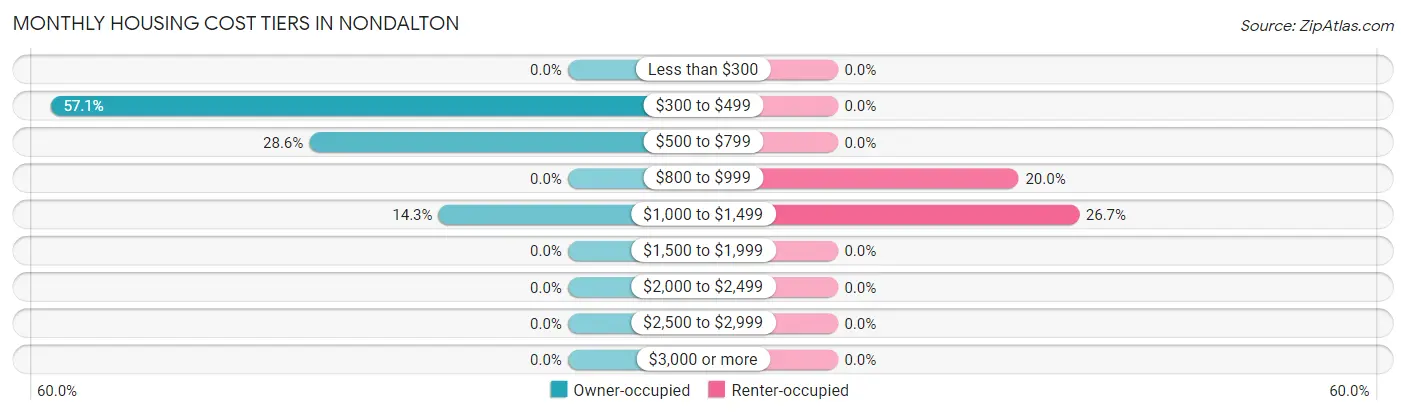
| Monthly Cost | Owner-occupied | Renter-occupied |
| Less than $300 | 0 (0.0%) | 0 (0.0%) |
| $300 to $499 | 4 (57.1%) | 0 (0.0%) |
| $500 to $799 | 2 (28.6%) | 0 (0.0%) |
| $800 to $999 | 0 (0.0%) | 3 (20.0%) |
| $1,000 to $1,499 | 1 (14.3%) | 4 (26.7%) |
| $1,500 to $1,999 | 0 (0.0%) | 0 (0.0%) |
| $2,000 to $2,499 | 0 (0.0%) | 0 (0.0%) |
| $2,500 to $2,999 | 0 (0.0%) | 0 (0.0%) |
| $3,000 or more | 0 (0.0%) | 0 (0.0%) |
| Total | 7 (100.0%) | 15 (100.0%) |
Physical Housing Characteristics in Nondalton
Housing Structures in Nondalton
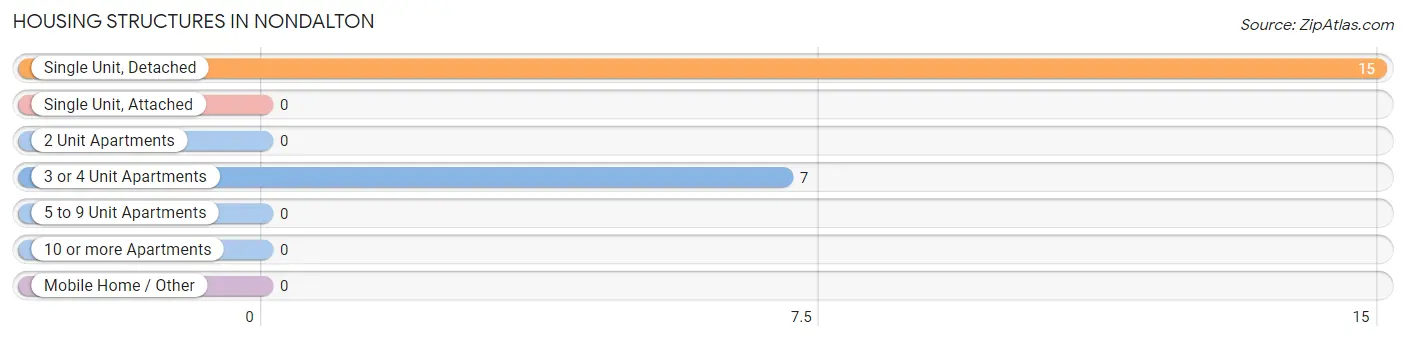
| Structure Type | # Housing Units | % Housing Units |
| Single Unit, Detached | 15 | 68.2% |
| Single Unit, Attached | 0 | 0.0% |
| 2 Unit Apartments | 0 | 0.0% |
| 3 or 4 Unit Apartments | 7 | 31.8% |
| 5 to 9 Unit Apartments | 0 | 0.0% |
| 10 or more Apartments | 0 | 0.0% |
| Mobile Home / Other | 0 | 0.0% |
| Total | 22 | 100.0% |
Housing Structures by Occupancy in Nondalton
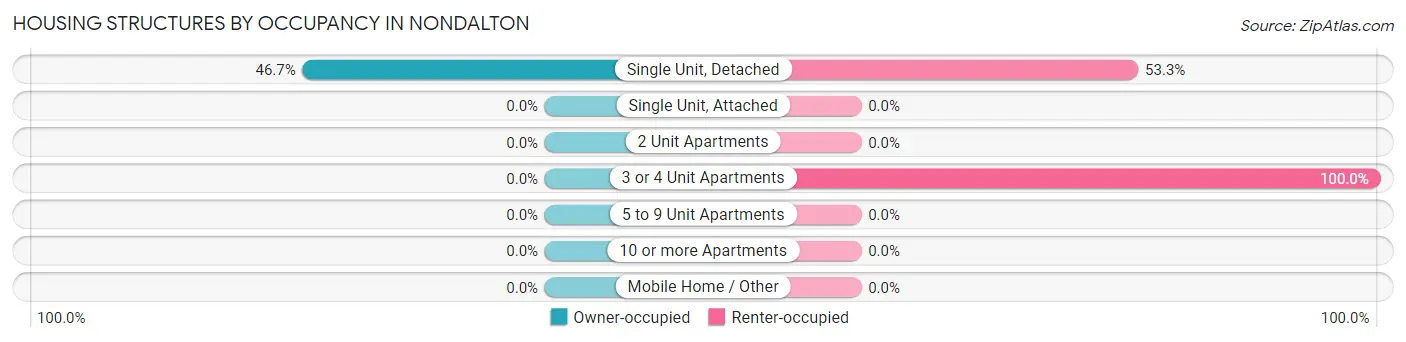
| Structure Type | Owner-occupied | Renter-occupied |
| Single Unit, Detached | 7 (46.7%) | 8 (53.3%) |
| Single Unit, Attached | 0 (0.0%) | 0 (0.0%) |
| 2 Unit Apartments | 0 (0.0%) | 0 (0.0%) |
| 3 or 4 Unit Apartments | 0 (0.0%) | 7 (100.0%) |
| 5 to 9 Unit Apartments | 0 (0.0%) | 0 (0.0%) |
| 10 or more Apartments | 0 (0.0%) | 0 (0.0%) |
| Mobile Home / Other | 0 (0.0%) | 0 (0.0%) |
| Total | 7 (31.8%) | 15 (68.2%) |
Housing Structures by Number of Rooms in Nondalton
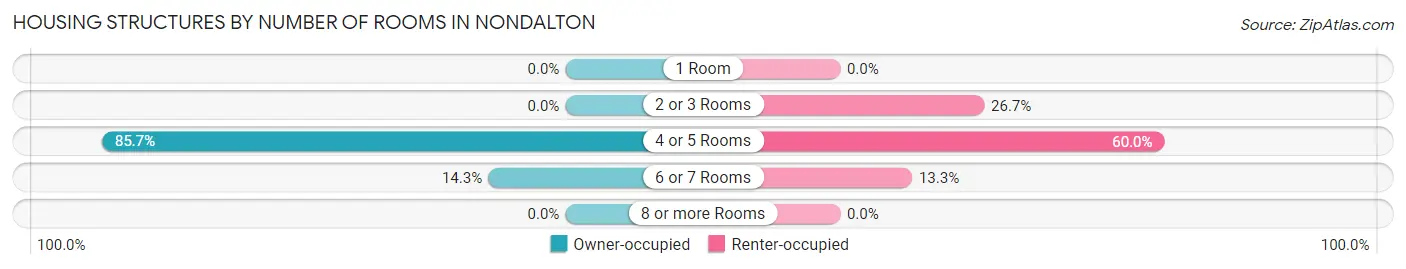
| Number of Rooms | Owner-occupied | Renter-occupied |
| 1 Room | 0 (0.0%) | 0 (0.0%) |
| 2 or 3 Rooms | 0 (0.0%) | 4 (26.7%) |
| 4 or 5 Rooms | 6 (85.7%) | 9 (60.0%) |
| 6 or 7 Rooms | 1 (14.3%) | 2 (13.3%) |
| 8 or more Rooms | 0 (0.0%) | 0 (0.0%) |
| Total | 7 (100.0%) | 15 (100.0%) |
Housing Structure by Heating Type in Nondalton
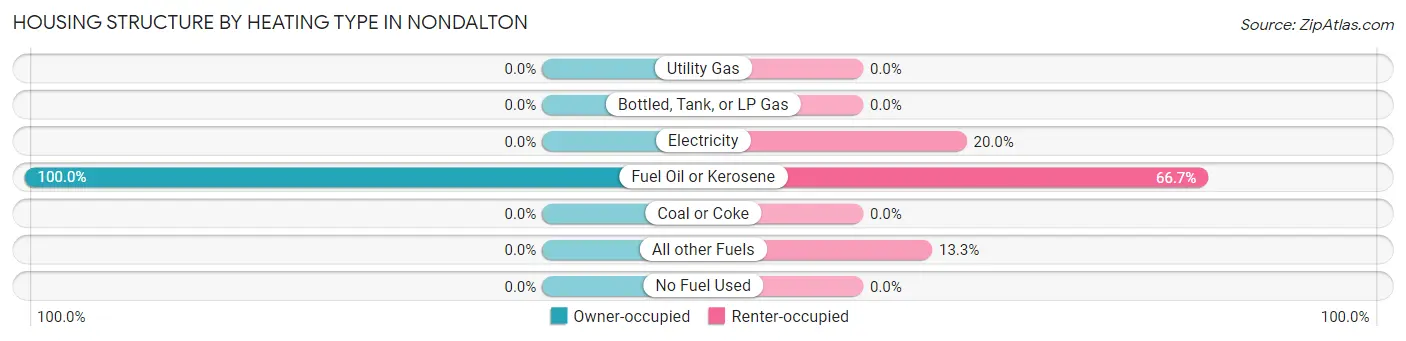
| Heating Type | Owner-occupied | Renter-occupied |
| Utility Gas | 0 (0.0%) | 0 (0.0%) |
| Bottled, Tank, or LP Gas | 0 (0.0%) | 0 (0.0%) |
| Electricity | 0 (0.0%) | 3 (20.0%) |
| Fuel Oil or Kerosene | 7 (100.0%) | 10 (66.7%) |
| Coal or Coke | 0 (0.0%) | 0 (0.0%) |
| All other Fuels | 0 (0.0%) | 2 (13.3%) |
| No Fuel Used | 0 (0.0%) | 0 (0.0%) |
| Total | 7 (100.0%) | 15 (100.0%) |
Household Vehicle Usage in Nondalton
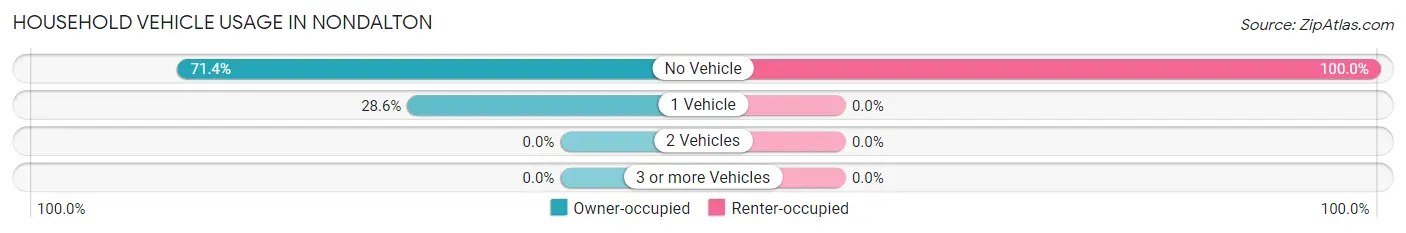
| Vehicles per Household | Owner-occupied | Renter-occupied |
| No Vehicle | 5 (71.4%) | 15 (100.0%) |
| 1 Vehicle | 2 (28.6%) | 0 (0.0%) |
| 2 Vehicles | 0 (0.0%) | 0 (0.0%) |
| 3 or more Vehicles | 0 (0.0%) | 0 (0.0%) |
| Total | 7 (100.0%) | 15 (100.0%) |
Real Estate & Mortgages in Nondalton
Real Estate and Mortgage Overview in Nondalton
| Characteristic | Without Mortgage | With Mortgage |
| Housing Units | 7 | 0 |
| Median Property Value | $179,200 | $0 |
| Median Household Income | $60,625 | $0 |
| Monthly Housing Costs | - | - |
| Real Estate Taxes | - | - |
Property Value by Mortgage Status in Nondalton
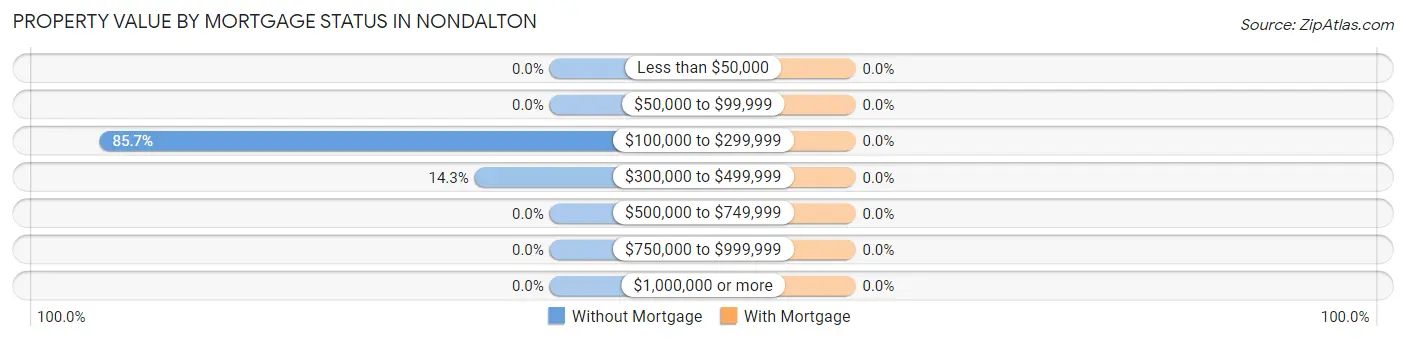
| Property Value | Without Mortgage | With Mortgage |
| Less than $50,000 | 0 (0.0%) | 0 (0.0%) |
| $50,000 to $99,999 | 0 (0.0%) | 0 (0.0%) |
| $100,000 to $299,999 | 6 (85.7%) | 0 (0.0%) |
| $300,000 to $499,999 | 1 (14.3%) | 0 (0.0%) |
| $500,000 to $749,999 | 0 (0.0%) | 0 (0.0%) |
| $750,000 to $999,999 | 0 (0.0%) | 0 (0.0%) |
| $1,000,000 or more | 0 (0.0%) | 0 (0.0%) |
| Total | 7 (100.0%) | 0 (0.0%) |
Household Income by Mortgage Status in Nondalton
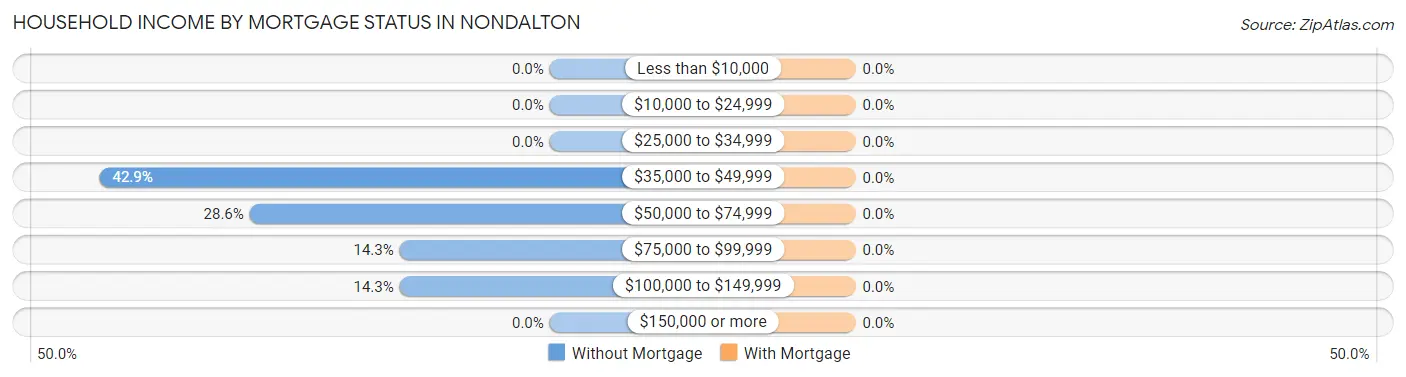
| Household Income | Without Mortgage | With Mortgage |
| Less than $10,000 | 0 (0.0%) | 0 (0.0%) |
| $10,000 to $24,999 | 0 (0.0%) | 0 (0.0%) |
| $25,000 to $34,999 | 0 (0.0%) | 0 (0.0%) |
| $35,000 to $49,999 | 3 (42.9%) | 0 (0.0%) |
| $50,000 to $74,999 | 2 (28.6%) | 0 (0.0%) |
| $75,000 to $99,999 | 1 (14.3%) | 0 (0.0%) |
| $100,000 to $149,999 | 1 (14.3%) | 0 (0.0%) |
| $150,000 or more | 0 (0.0%) | 0 (0.0%) |
| Total | 7 (100.0%) | 0 (0.0%) |
Property Value to Household Income Ratio in Nondalton
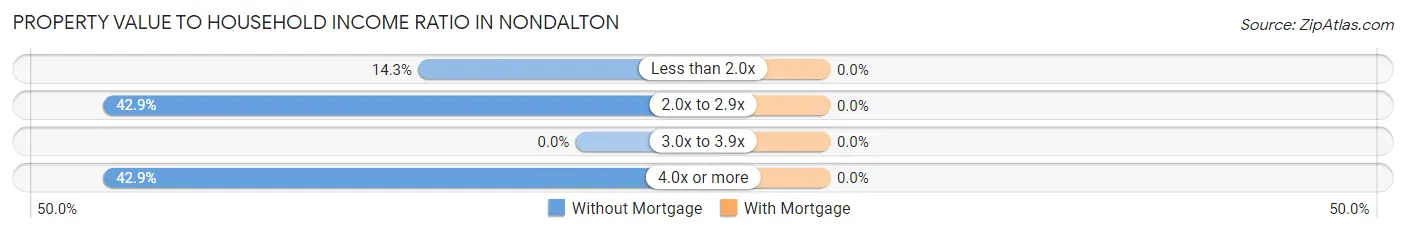
| Value-to-Income Ratio | Without Mortgage | With Mortgage |
| Less than 2.0x | 1 (14.3%) | 0 (0.0%) |
| 2.0x to 2.9x | 3 (42.9%) | 0 (0.0%) |
| 3.0x to 3.9x | 0 (0.0%) | 0 (0.0%) |
| 4.0x or more | 3 (42.9%) | 0 (0.0%) |
| Total | 7 (100.0%) | 0 (0.0%) |
Real Estate Taxes by Mortgage Status in Nondalton
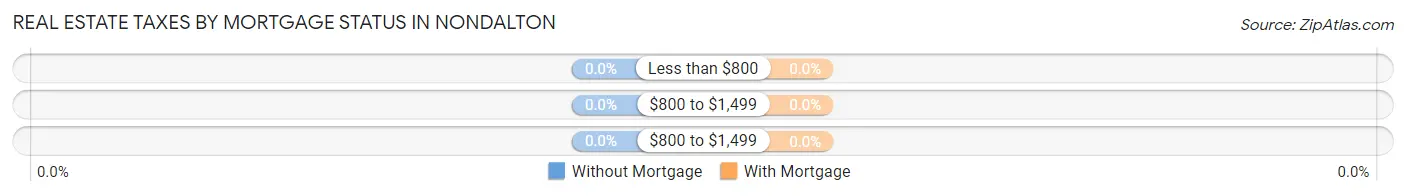
| Property Taxes | Without Mortgage | With Mortgage |
| Less than $800 | 0 (0.0%) | 0 (0.0%) |
| $800 to $1,499 | 0 (0.0%) | 0 (0.0%) |
| $800 to $1,499 | 0 (0.0%) | 0 (0.0%) |
| Total | 7 (100.0%) | 0 (0.0%) |
Health & Disability in Nondalton
Health Insurance Coverage by Age in Nondalton
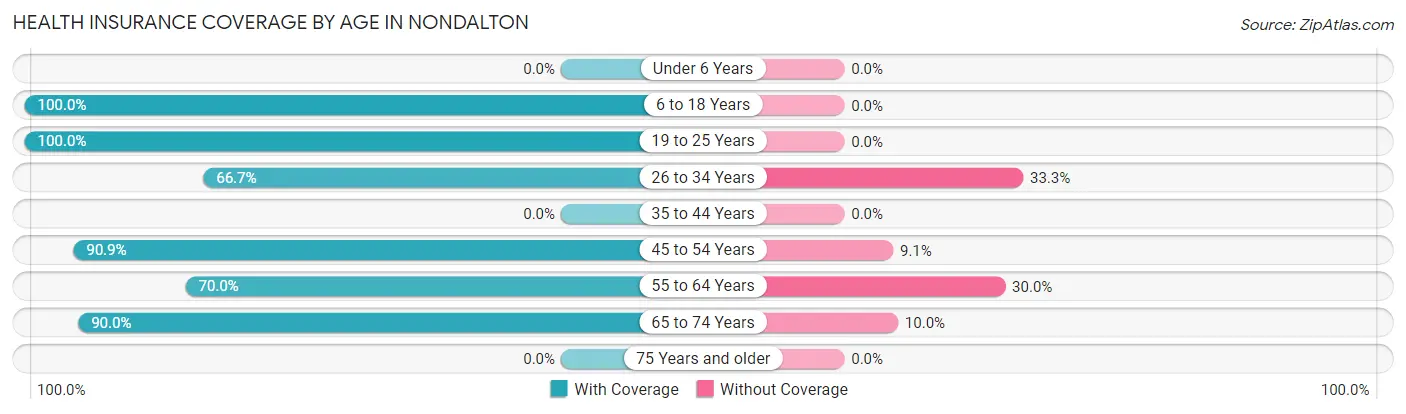
| Age Bracket | With Coverage | Without Coverage |
| Under 6 Years | 0 (0.0%) | 0 (0.0%) |
| 6 to 18 Years | 1 (100.0%) | 0 (0.0%) |
| 19 to 25 Years | 2 (100.0%) | 0 (0.0%) |
| 26 to 34 Years | 4 (66.7%) | 2 (33.3%) |
| 35 to 44 Years | 0 (0.0%) | 0 (0.0%) |
| 45 to 54 Years | 10 (90.9%) | 1 (9.1%) |
| 55 to 64 Years | 7 (70.0%) | 3 (30.0%) |
| 65 to 74 Years | 9 (90.0%) | 1 (10.0%) |
| 75 Years and older | 0 (0.0%) | 0 (0.0%) |
| Total | 33 (82.5%) | 7 (17.5%) |
Health Insurance Coverage by Citizenship Status in Nondalton
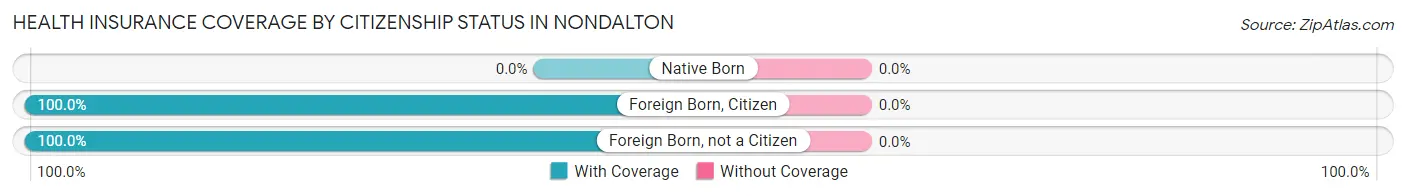
| Citizenship Status | With Coverage | Without Coverage |
| Native Born | 0 (0.0%) | 0 (0.0%) |
| Foreign Born, Citizen | 1 (100.0%) | 0 (0.0%) |
| Foreign Born, not a Citizen | 2 (100.0%) | 0 (0.0%) |
Health Insurance Coverage by Household Income in Nondalton
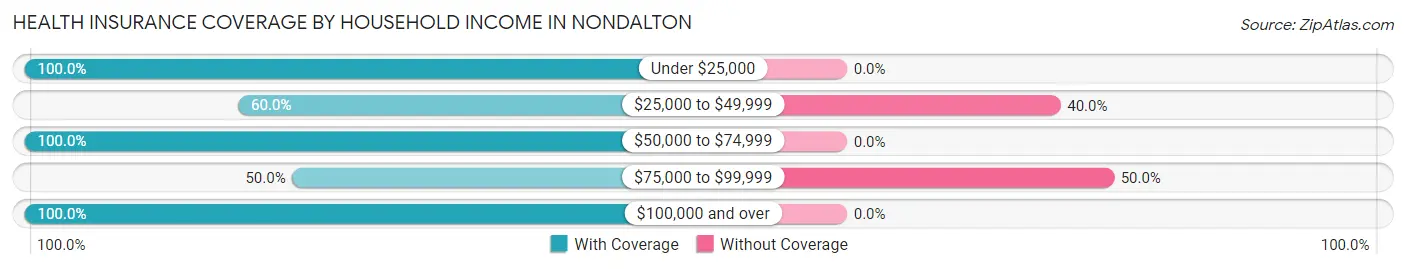
| Household Income | With Coverage | Without Coverage |
| Under $25,000 | 1 (100.0%) | 0 (0.0%) |
| $25,000 to $49,999 | 9 (60.0%) | 6 (40.0%) |
| $50,000 to $74,999 | 13 (100.0%) | 0 (0.0%) |
| $75,000 to $99,999 | 1 (50.0%) | 1 (50.0%) |
| $100,000 and over | 9 (100.0%) | 0 (0.0%) |
Public vs Private Health Insurance Coverage by Age in Nondalton
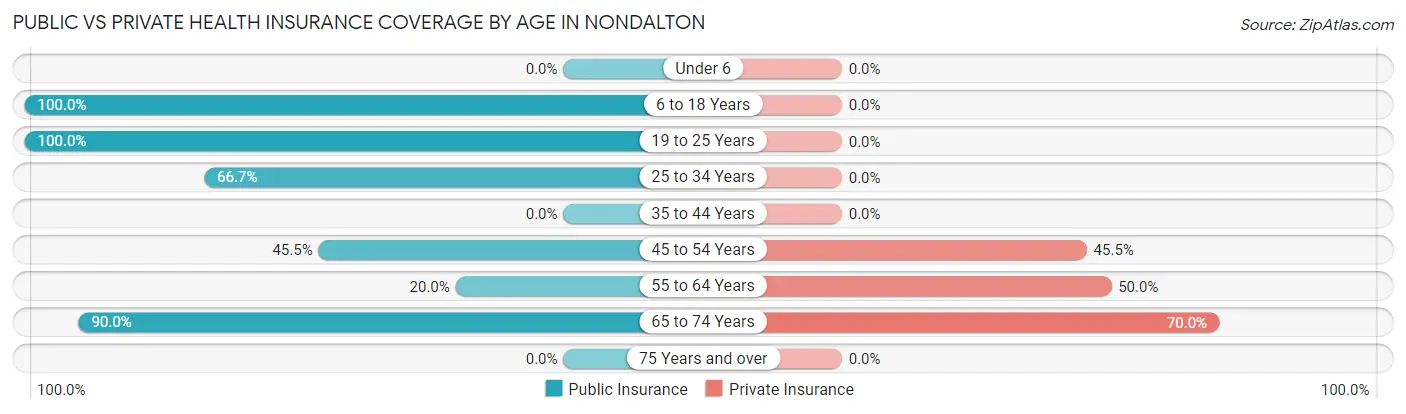
| Age Bracket | Public Insurance | Private Insurance |
| Under 6 | 0 (0.0%) | 0 (0.0%) |
| 6 to 18 Years | 1 (100.0%) | 0 (0.0%) |
| 19 to 25 Years | 2 (100.0%) | 0 (0.0%) |
| 25 to 34 Years | 4 (66.7%) | 0 (0.0%) |
| 35 to 44 Years | 0 (0.0%) | 0 (0.0%) |
| 45 to 54 Years | 5 (45.5%) | 5 (45.5%) |
| 55 to 64 Years | 2 (20.0%) | 5 (50.0%) |
| 65 to 74 Years | 9 (90.0%) | 7 (70.0%) |
| 75 Years and over | 0 (0.0%) | 0 (0.0%) |
| Total | 23 (57.5%) | 17 (42.5%) |
Disability Status by Sex by Age in Nondalton
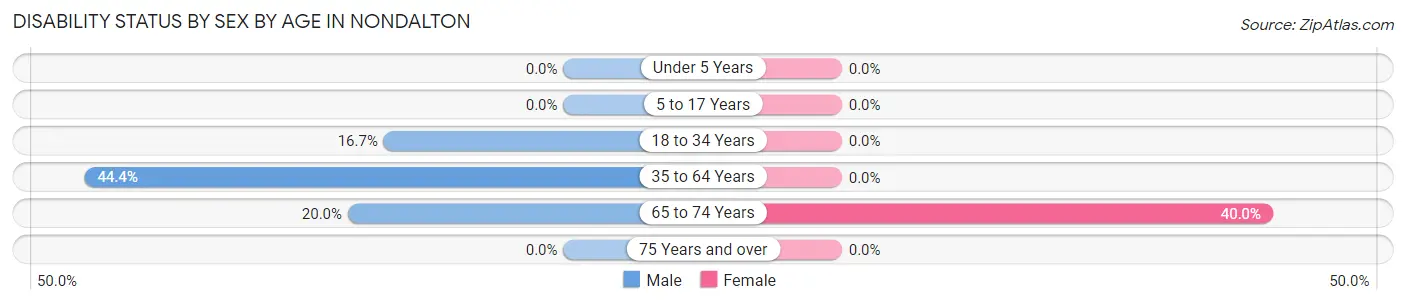
| Age Bracket | Male | Female |
| Under 5 Years | 0 (0.0%) | 0 (0.0%) |
| 5 to 17 Years | 0 (0.0%) | 0 (0.0%) |
| 18 to 34 Years | 1 (16.7%) | 0 (0.0%) |
| 35 to 64 Years | 4 (44.4%) | 0 (0.0%) |
| 65 to 74 Years | 1 (20.0%) | 2 (40.0%) |
| 75 Years and over | 0 (0.0%) | 0 (0.0%) |
Disability Class by Sex by Age in Nondalton
Disability Class: Hearing Difficulty
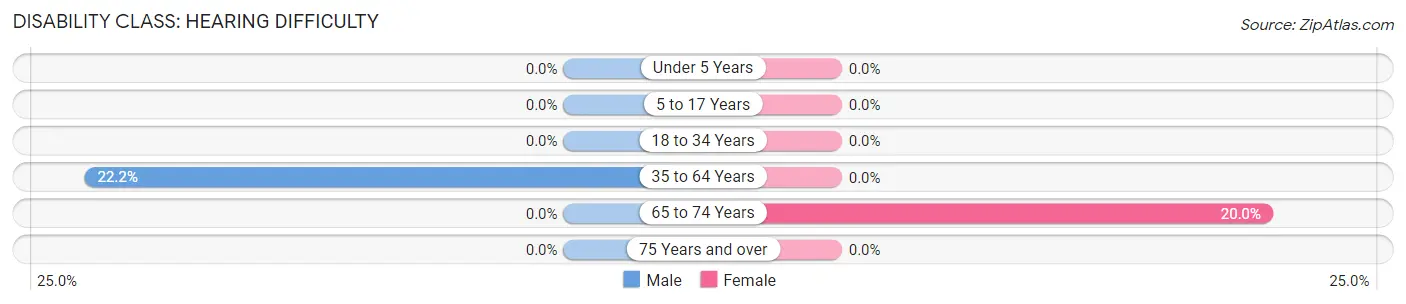
| Age Bracket | Male | Female |
| Under 5 Years | 0 (0.0%) | 0 (0.0%) |
| 5 to 17 Years | 0 (0.0%) | 0 (0.0%) |
| 18 to 34 Years | 0 (0.0%) | 0 (0.0%) |
| 35 to 64 Years | 2 (22.2%) | 0 (0.0%) |
| 65 to 74 Years | 0 (0.0%) | 1 (20.0%) |
| 75 Years and over | 0 (0.0%) | 0 (0.0%) |
Disability Class: Vision Difficulty
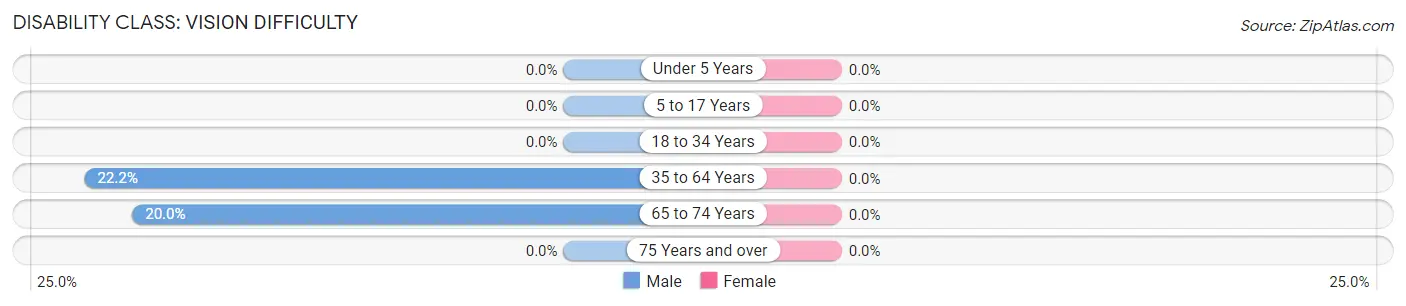
| Age Bracket | Male | Female |
| Under 5 Years | 0 (0.0%) | 0 (0.0%) |
| 5 to 17 Years | 0 (0.0%) | 0 (0.0%) |
| 18 to 34 Years | 0 (0.0%) | 0 (0.0%) |
| 35 to 64 Years | 2 (22.2%) | 0 (0.0%) |
| 65 to 74 Years | 1 (20.0%) | 0 (0.0%) |
| 75 Years and over | 0 (0.0%) | 0 (0.0%) |
Disability Class: Cognitive Difficulty
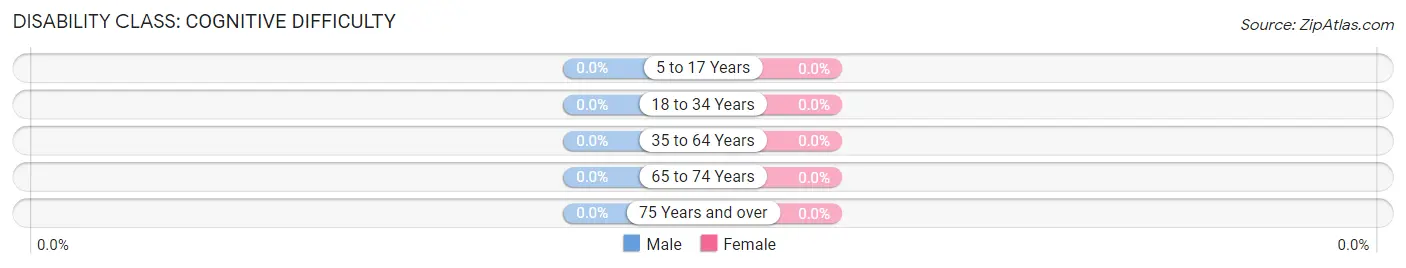
| Age Bracket | Male | Female |
| 5 to 17 Years | 0 (0.0%) | 0 (0.0%) |
| 18 to 34 Years | 0 (0.0%) | 0 (0.0%) |
| 35 to 64 Years | 0 (0.0%) | 0 (0.0%) |
| 65 to 74 Years | 0 (0.0%) | 0 (0.0%) |
| 75 Years and over | 0 (0.0%) | 0 (0.0%) |
Disability Class: Ambulatory Difficulty
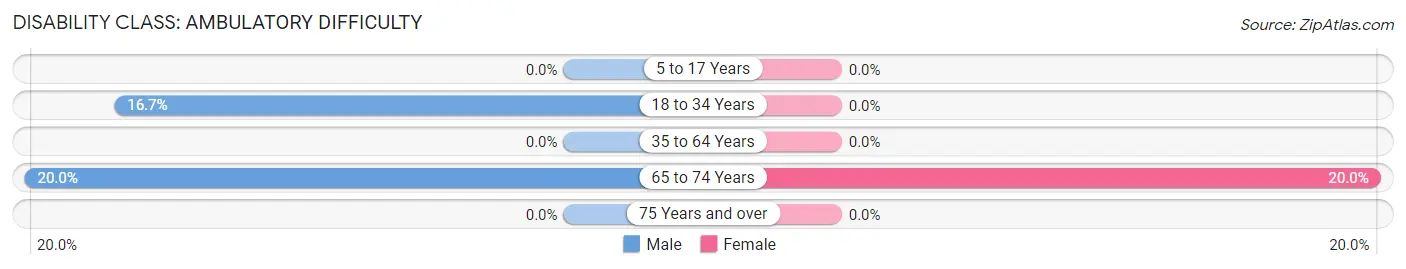
| Age Bracket | Male | Female |
| 5 to 17 Years | 0 (0.0%) | 0 (0.0%) |
| 18 to 34 Years | 1 (16.7%) | 0 (0.0%) |
| 35 to 64 Years | 0 (0.0%) | 0 (0.0%) |
| 65 to 74 Years | 1 (20.0%) | 1 (20.0%) |
| 75 Years and over | 0 (0.0%) | 0 (0.0%) |
Disability Class: Self-Care Difficulty
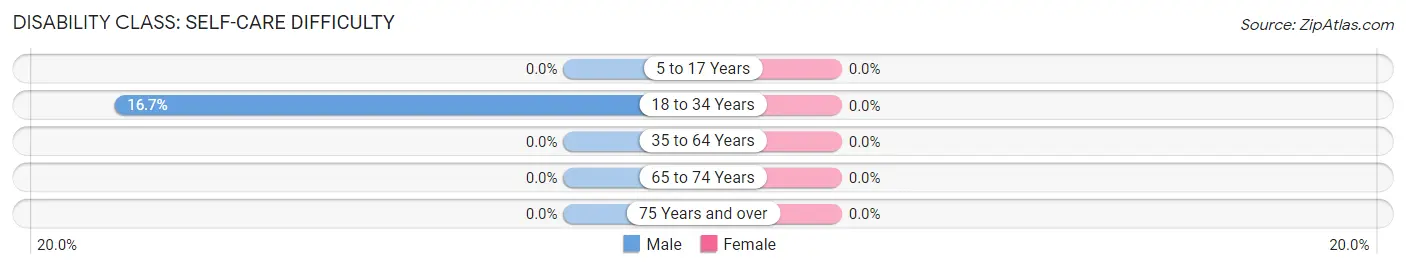
| Age Bracket | Male | Female |
| 5 to 17 Years | 0 (0.0%) | 0 (0.0%) |
| 18 to 34 Years | 1 (16.7%) | 0 (0.0%) |
| 35 to 64 Years | 0 (0.0%) | 0 (0.0%) |
| 65 to 74 Years | 0 (0.0%) | 0 (0.0%) |
| 75 Years and over | 0 (0.0%) | 0 (0.0%) |
Technology Access in Nondalton
Computing Device Access in Nondalton
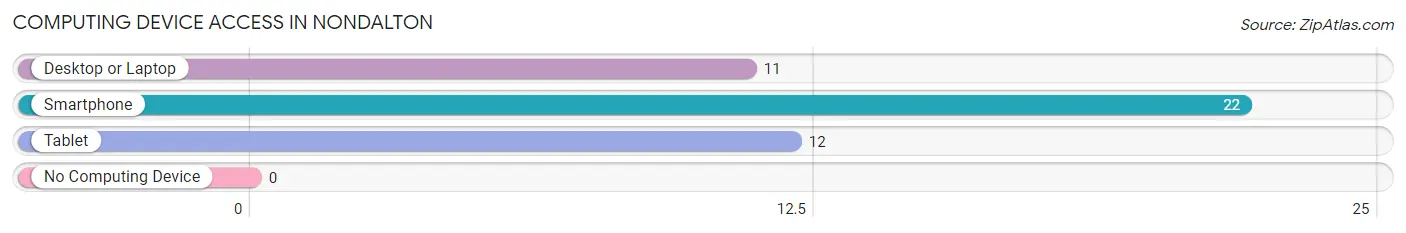
| Device Type | # Households | % Households |
| Desktop or Laptop | 11 | 50.0% |
| Smartphone | 22 | 100.0% |
| Tablet | 12 | 54.5% |
| No Computing Device | 0 | 0.0% |
| Total | 22 | 100.0% |
Internet Access in Nondalton
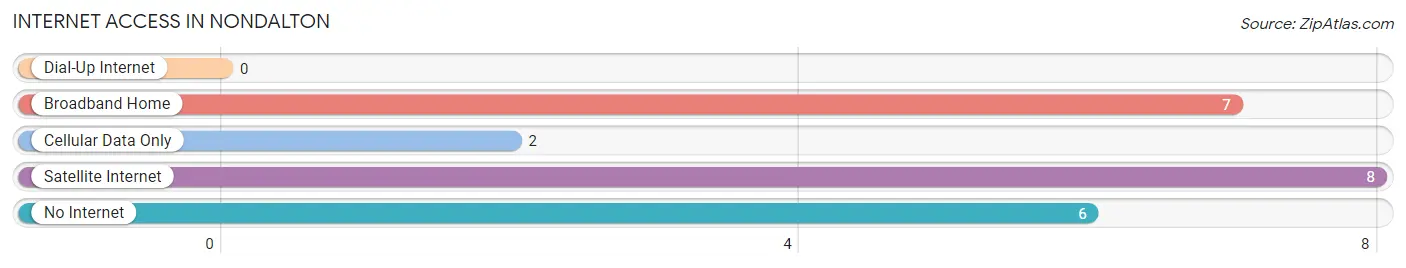
| Internet Type | # Households | % Households |
| Dial-Up Internet | 0 | 0.0% |
| Broadband Home | 7 | 31.8% |
| Cellular Data Only | 2 | 9.1% |
| Satellite Internet | 8 | 36.4% |
| No Internet | 6 | 27.3% |
| Total | 22 | 100.0% |
Nondalton Summary
Nondalton is a small village located in the southwestern part of Alaska, United States. It is situated on the shore of Lake Clark, a large lake in the Alaska Peninsula. The village is part of the Lake and Peninsula Borough and is located within the Lake Clark National Park and Preserve. As of the 2010 census, the population of Nondalton was 166, making it one of the smallest incorporated cities in Alaska.
History
The area around Nondalton has been inhabited by the Dena’ina Athabascan people for centuries. The Dena’ina people have a long history of living in the area and have a deep connection to the land and its resources. The Dena’ina people have a rich oral tradition and have passed down stories of the area for generations.
The first recorded contact with Europeans in the area was in 1778 when the Russian explorer, Captain James Cook, visited the area. In the late 1800s, the area was explored by gold prospectors and fur traders. In the early 1900s, the area was settled by homesteaders and trappers.
In the 1950s, the area was opened up to commercial fishing and logging. The village of Nondalton was established in the 1960s and incorporated in 1971.
Geography
Nondalton is located on the shore of Lake Clark, a large lake in the Alaska Peninsula. The village is situated at an elevation of approximately 200 feet above sea level. The area is surrounded by mountains and is home to a variety of wildlife, including moose, bear, and caribou.
The climate in Nondalton is subarctic, with cold winters and mild summers. The average temperature in the summer is around 50°F and in the winter it is around 10°F. The area receives an average of 40 inches of precipitation per year.
Economy
The economy of Nondalton is largely based on subsistence activities, such as fishing, hunting, and gathering. The village is also home to a small commercial fishing fleet. The village also has a small tourism industry, with visitors coming to the area to take advantage of the area’s natural beauty and wildlife.
Demographics
As of the 2010 census, the population of Nondalton was 166. The population is primarily Native American, with the majority of the population being of Dena’ina Athabascan descent. The median age of the population is 33.5 years, with a gender ratio of 51.2% male and 48.8% female. The median household income is $25,000.
Conclusion
Nondalton is a small village located in the southwestern part of Alaska, United States. It is situated on the shore of Lake Clark, a large lake in the Alaska Peninsula. The village is part of the Lake and Peninsula Borough and is located within the Lake Clark National Park and Preserve. The economy of Nondalton is largely based on subsistence activities, such as fishing, hunting, and gathering. The population is primarily Native American, with the majority of the population being of Dena’ina Athabascan descent. Nondalton is a unique and beautiful place with a rich history and culture.
Common Questions
What is Per Capita Income in Nondalton?
Per Capita income in Nondalton is $38,820.
What is the Median Family Income in Nondalton?
Median Family Income in Nondalton is $48,333.
What is the Median Household income in Nondalton?
Median Household Income in Nondalton is $55,000.
What is Inequality or Gini Index in Nondalton?
Inequality or Gini Index in Nondalton is 0.37.
What is the Total Population of Nondalton?
Total Population of Nondalton is 40.
What is the Total Male Population of Nondalton?
Total Male Population of Nondalton is 20.
What is the Total Female Population of Nondalton?
Total Female Population of Nondalton is 20.
What is the Ratio of Males per 100 Females in Nondalton?
There are 100.00 Males per 100 Females in Nondalton.
What is the Ratio of Females per 100 Males in Nondalton?
There are 100.00 Females per 100 Males in Nondalton.
What is the Median Population Age in Nondalton?
Median Population Age in Nondalton is 55.0 Years.
What is the Average Family Size in Nondalton
Average Family Size in Nondalton is 2.3 People.
What is the Average Household Size in Nondalton
Average Household Size in Nondalton is 1.8 People.
How Large is the Labor Force in Nondalton?
There are 29 People in the Labor Forcein in Nondalton.
What is the Percentage of People in the Labor Force in Nondalton?
74.4% of People are in the Labor Force in Nondalton.
What is the Unemployment Rate in Nondalton?
Unemployment Rate in Nondalton is 41.4%.