Happy Valley, AK Map & Demographics
Happy Valley Map
Happy Valley Overview
$33,440
PER CAPITA INCOME
$67,857
AVG FAMILY INCOME
$52,273
AVG HOUSEHOLD INCOME
48.5%
WAGE / INCOME GAP [ % ]
51.5¢/ $1
WAGE / INCOME GAP [ $ ]
$3,277
FAMILY INCOME DEFICIT
0.47
INEQUALITY / GINI INDEX
748
TOTAL POPULATION
401
MALE POPULATION
347
FEMALE POPULATION
115.56
MALES / 100 FEMALES
86.53
FEMALES / 100 MALES
58.5
MEDIAN AGE
3.0
AVG FAMILY SIZE
2.2
AVG HOUSEHOLD SIZE
244
LABOR FORCE [ PEOPLE ]
38.8%
PERCENT IN LABOR FORCE
8.2%
UNEMPLOYMENT RATE
Income in Happy Valley
Income Overview in Happy Valley
Per Capita Income in Happy Valley is $33,440, while median incomes of families and households are $67,857 and $52,273 respectively.
| Characteristic | Number | Measure |
| Per Capita Income | 748 | $33,440 |
| Median Family Income | 194 | $67,857 |
| Mean Family Income | 194 | $91,698 |
| Median Household Income | 340 | $52,273 |
| Mean Household Income | 340 | $69,465 |
| Income Deficit | 194 | $3,277 |
| Wage / Income Gap (%) | 748 | 48.50% |
| Wage / Income Gap ($) | 748 | 51.50¢ per $1 |
| Gini / Inequality Index | 748 | 0.47 |
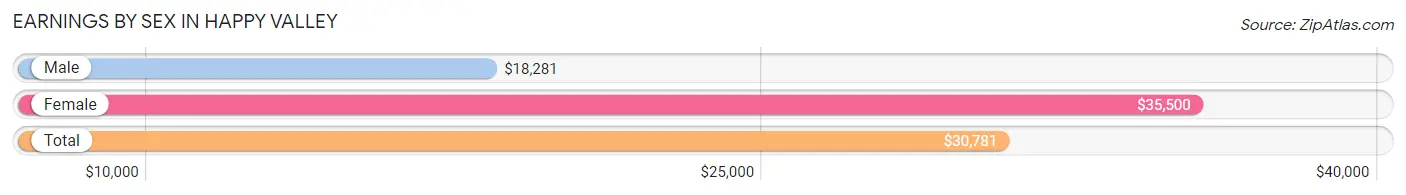
Earnings by Sex in Happy Valley
Average Earnings in Happy Valley are $30,781, $18,281 for men and $35,500 for women, a difference of 48.5%.
| Sex | Number | Average Earnings |
| Male | 135 (52.5%) | $18,281 |
| Female | 122 (47.5%) | $35,500 |
| Total | 257 (100.0%) | $30,781 |
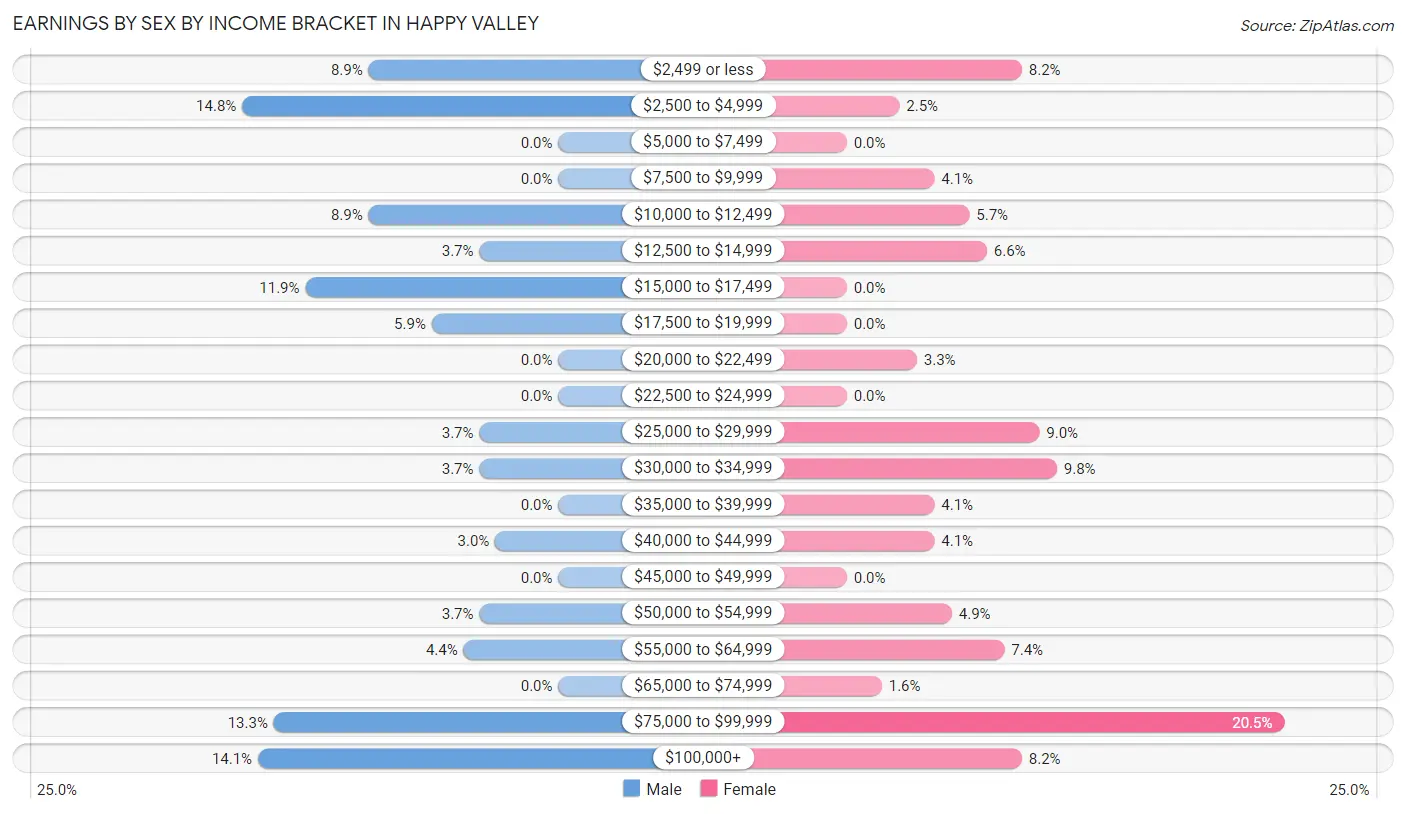
Earnings by Sex by Income Bracket in Happy Valley
The most common earnings brackets in Happy Valley are $2,500 to $4,999 for men (20 | 14.8%) and $75,000 to $99,999 for women (25 | 20.5%).
| Income | Male | Female |
| $2,499 or less | 12 (8.9%) | 10 (8.2%) |
| $2,500 to $4,999 | 20 (14.8%) | 3 (2.5%) |
| $5,000 to $7,499 | 0 (0.0%) | 0 (0.0%) |
| $7,500 to $9,999 | 0 (0.0%) | 5 (4.1%) |
| $10,000 to $12,499 | 12 (8.9%) | 7 (5.7%) |
| $12,500 to $14,999 | 5 (3.7%) | 8 (6.6%) |
| $15,000 to $17,499 | 16 (11.8%) | 0 (0.0%) |
| $17,500 to $19,999 | 8 (5.9%) | 0 (0.0%) |
| $20,000 to $22,499 | 0 (0.0%) | 4 (3.3%) |
| $22,500 to $24,999 | 0 (0.0%) | 0 (0.0%) |
| $25,000 to $29,999 | 5 (3.7%) | 11 (9.0%) |
| $30,000 to $34,999 | 5 (3.7%) | 12 (9.8%) |
| $35,000 to $39,999 | 0 (0.0%) | 5 (4.1%) |
| $40,000 to $44,999 | 4 (3.0%) | 5 (4.1%) |
| $45,000 to $49,999 | 0 (0.0%) | 0 (0.0%) |
| $50,000 to $54,999 | 5 (3.7%) | 6 (4.9%) |
| $55,000 to $64,999 | 6 (4.4%) | 9 (7.4%) |
| $65,000 to $74,999 | 0 (0.0%) | 2 (1.6%) |
| $75,000 to $99,999 | 18 (13.3%) | 25 (20.5%) |
| $100,000+ | 19 (14.1%) | 10 (8.2%) |
| Total | 135 (100.0%) | 122 (100.0%) |
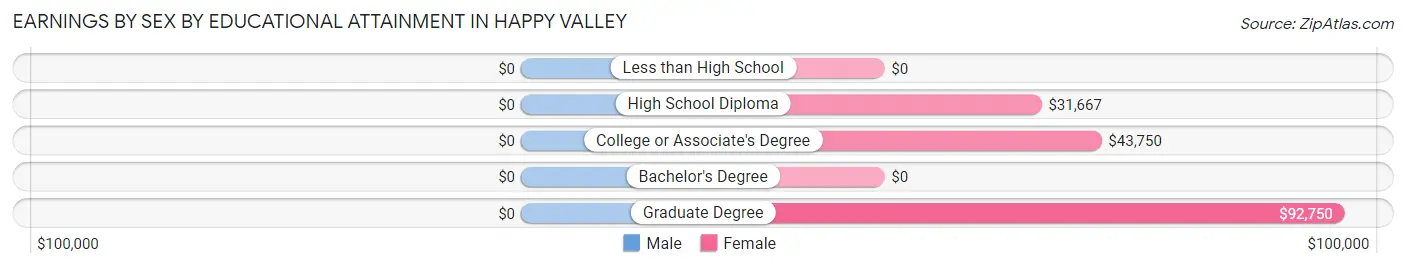
Earnings by Sex by Educational Attainment in Happy Valley
| Educational Attainment | Male Income | Female Income |
| Less than High School | - | - |
| High School Diploma | - | - |
| College or Associate's Degree | - | - |
| Bachelor's Degree | - | - |
| Graduate Degree | - | - |
| Total | $19,531 | $43,750 |
Family Income in Happy Valley
Family Income Brackets in Happy Valley
According to the Happy Valley family income data, there are 58 families falling into the $50,000 to $74,999 income range, which is the most common income bracket and makes up 29.9% of all families.
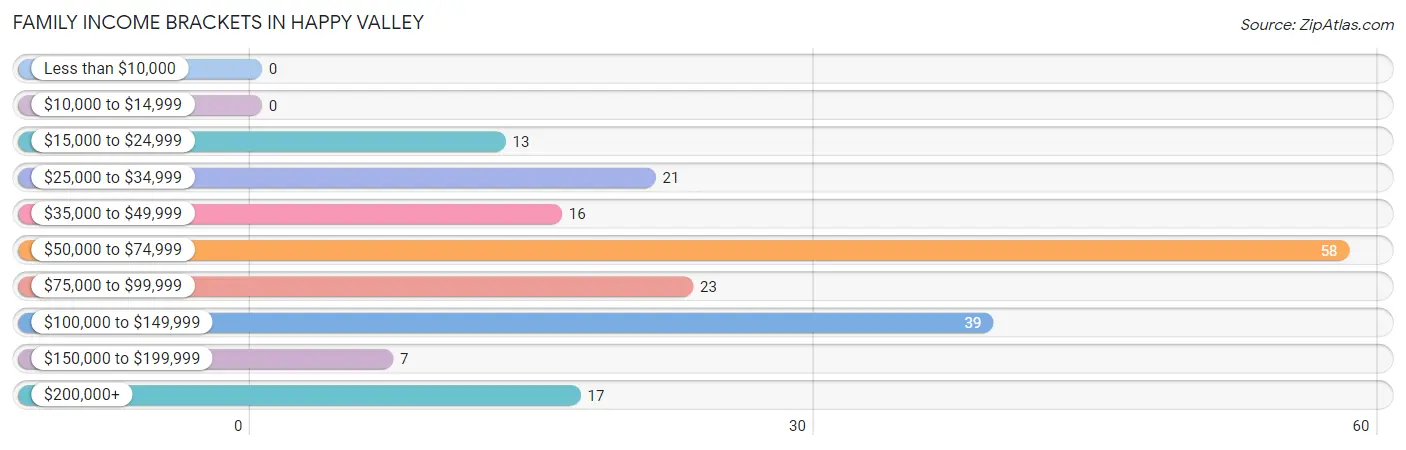
| Income Bracket | # Families | % Families |
| Less than $10,000 | 0 | 0.0% |
| $10,000 to $14,999 | 0 | 0.0% |
| $15,000 to $24,999 | 13 | 6.7% |
| $25,000 to $34,999 | 21 | 10.8% |
| $35,000 to $49,999 | 16 | 8.2% |
| $50,000 to $74,999 | 58 | 29.9% |
| $75,000 to $99,999 | 23 | 11.9% |
| $100,000 to $149,999 | 39 | 20.1% |
| $150,000 to $199,999 | 7 | 3.6% |
| $200,000+ | 17 | 8.8% |
Family Income by Famaliy Size in Happy Valley
7+ person families (13 | 6.7%) account for the highest median family income in Happy Valley with $146,250 per family, while 3-person families (21 | 10.8%) have the highest median income of $35,938 per family member.
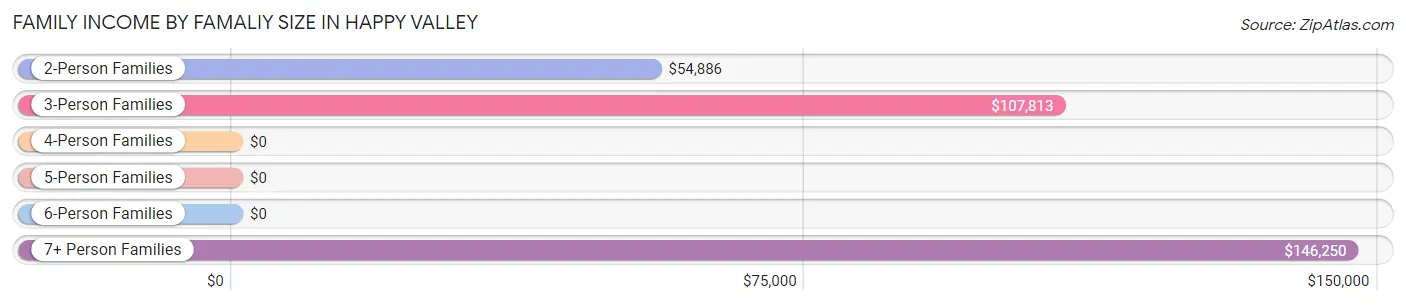
| Income Bracket | # Families | Median Income |
| 2-Person Families | 141 (72.7%) | $54,886 |
| 3-Person Families | 21 (10.8%) | $107,813 |
| 4-Person Families | 10 (5.1%) | $0 |
| 5-Person Families | 5 (2.6%) | $0 |
| 6-Person Families | 4 (2.1%) | $0 |
| 7+ Person Families | 13 (6.7%) | $146,250 |
| Total | 194 (100.0%) | $67,857 |
Family Income by Number of Earners in Happy Valley
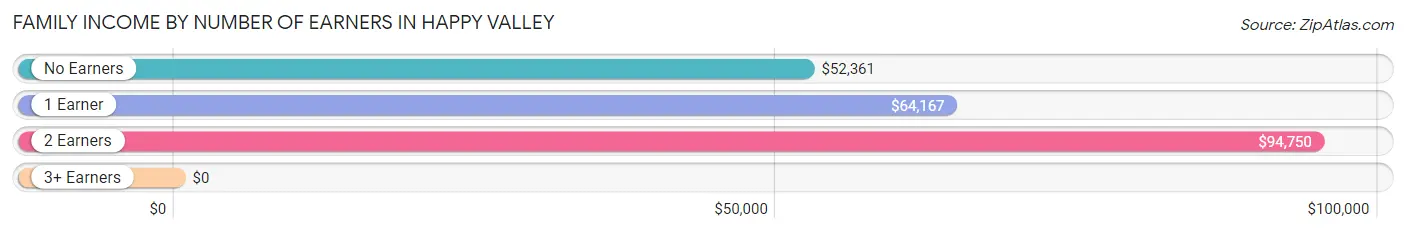
| Number of Earners | # Families | Median Income |
| No Earners | 78 (40.2%) | $52,361 |
| 1 Earner | 60 (30.9%) | $64,167 |
| 2 Earners | 47 (24.2%) | $94,750 |
| 3+ Earners | 9 (4.6%) | $0 |
| Total | 194 (100.0%) | $67,857 |
Household Income in Happy Valley
Household Income Brackets in Happy Valley
With 75 households falling in the category, the $50,000 to $74,999 income range is the most frequent in Happy Valley, accounting for 22.1% of all households.
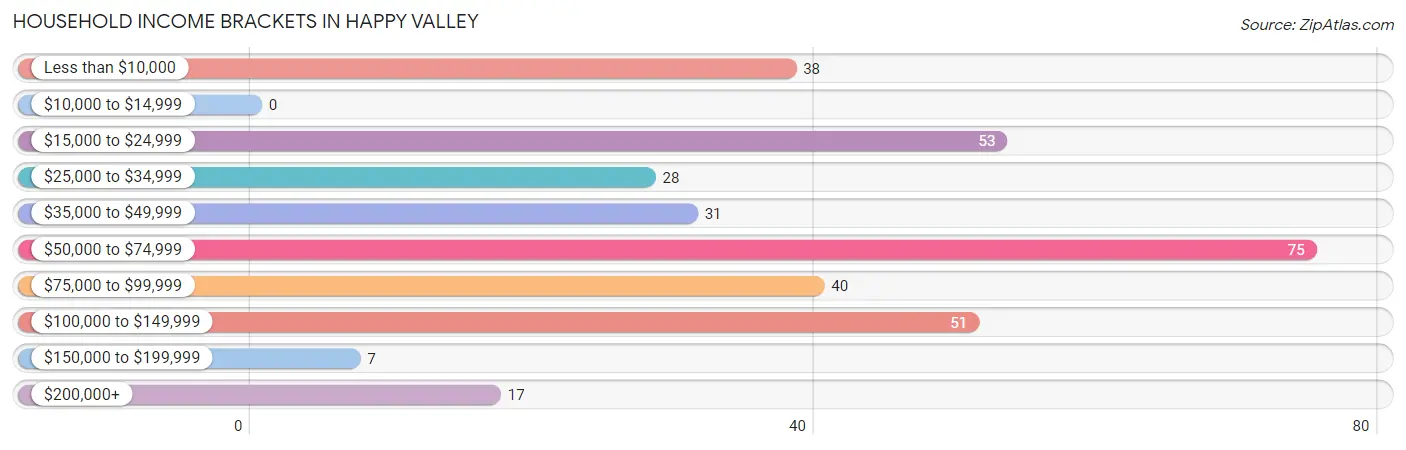
| Income Bracket | # Households | % Households |
| Less than $10,000 | 38 | 11.2% |
| $10,000 to $14,999 | 0 | 0.0% |
| $15,000 to $24,999 | 53 | 15.6% |
| $25,000 to $34,999 | 28 | 8.2% |
| $35,000 to $49,999 | 31 | 9.1% |
| $50,000 to $74,999 | 75 | 22.1% |
| $75,000 to $99,999 | 40 | 11.8% |
| $100,000 to $149,999 | 51 | 15.0% |
| $150,000 to $199,999 | 7 | 2.1% |
| $200,000+ | 17 | 5.0% |
Household Income by Householder Age in Happy Valley
The median household income in Happy Valley is $52,273, with the highest median household income of $112,500 found in the 25 to 44 years age bracket for the primary householder. A total of 56 households (16.5%) fall into this category. Meanwhile, the 15 to 24 years age bracket for the primary householder has the lowest median household income of $0, with 12 households (3.5%) in this group.
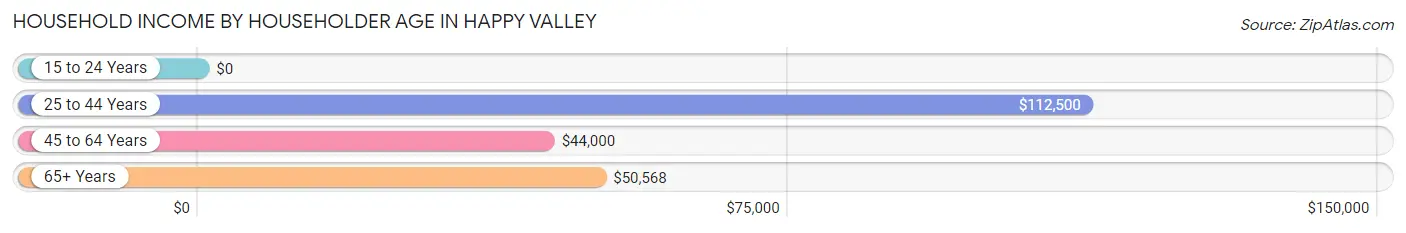
| Income Bracket | # Households | Median Income |
| 15 to 24 Years | 12 (3.5%) | $0 |
| 25 to 44 Years | 56 (16.5%) | $112,500 |
| 45 to 64 Years | 82 (24.1%) | $44,000 |
| 65+ Years | 190 (55.9%) | $50,568 |
| Total | 340 (100.0%) | $52,273 |
Poverty in Happy Valley
Income Below Poverty by Sex and Age in Happy Valley
With 14.5% poverty level for males and 11.5% for females among the residents of Happy Valley, 35 to 44 year old males and 18 to 24 year old females are the most vulnerable to poverty, with 14 males (35.9%) and 5 females (33.3%) in their respective age groups living below the poverty level.
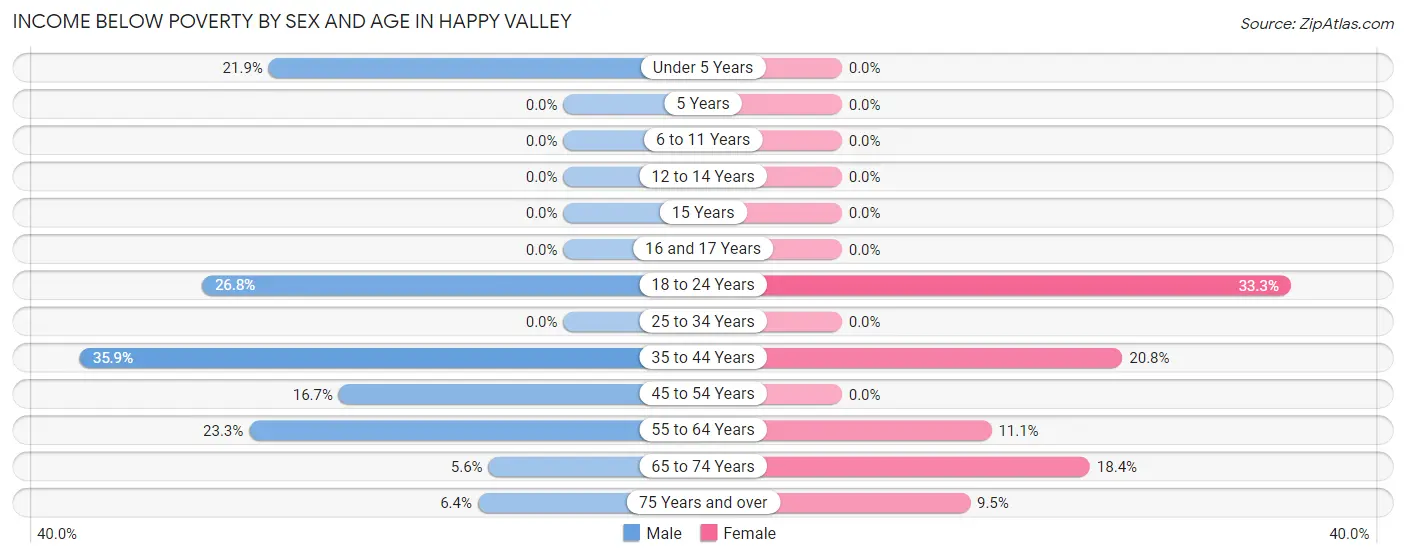
| Age Bracket | Male | Female |
| Under 5 Years | 7 (21.9%) | 0 (0.0%) |
| 5 Years | 0 (0.0%) | 0 (0.0%) |
| 6 to 11 Years | 0 (0.0%) | 0 (0.0%) |
| 12 to 14 Years | 0 (0.0%) | 0 (0.0%) |
| 15 Years | 0 (0.0%) | 0 (0.0%) |
| 16 and 17 Years | 0 (0.0%) | 0 (0.0%) |
| 18 to 24 Years | 11 (26.8%) | 5 (33.3%) |
| 25 to 34 Years | 0 (0.0%) | 0 (0.0%) |
| 35 to 44 Years | 14 (35.9%) | 5 (20.8%) |
| 45 to 54 Years | 4 (16.7%) | 0 (0.0%) |
| 55 to 64 Years | 14 (23.3%) | 10 (11.1%) |
| 65 to 74 Years | 4 (5.6%) | 14 (18.4%) |
| 75 Years and over | 4 (6.4%) | 6 (9.5%) |
| Total | 58 (14.5%) | 40 (11.5%) |
Income Above Poverty by Sex and Age in Happy Valley
According to the poverty statistics in Happy Valley, males aged 6 to 11 years and females aged under 5 years are the age groups that are most secure financially, with 100.0% of males and 100.0% of females in these age groups living above the poverty line.
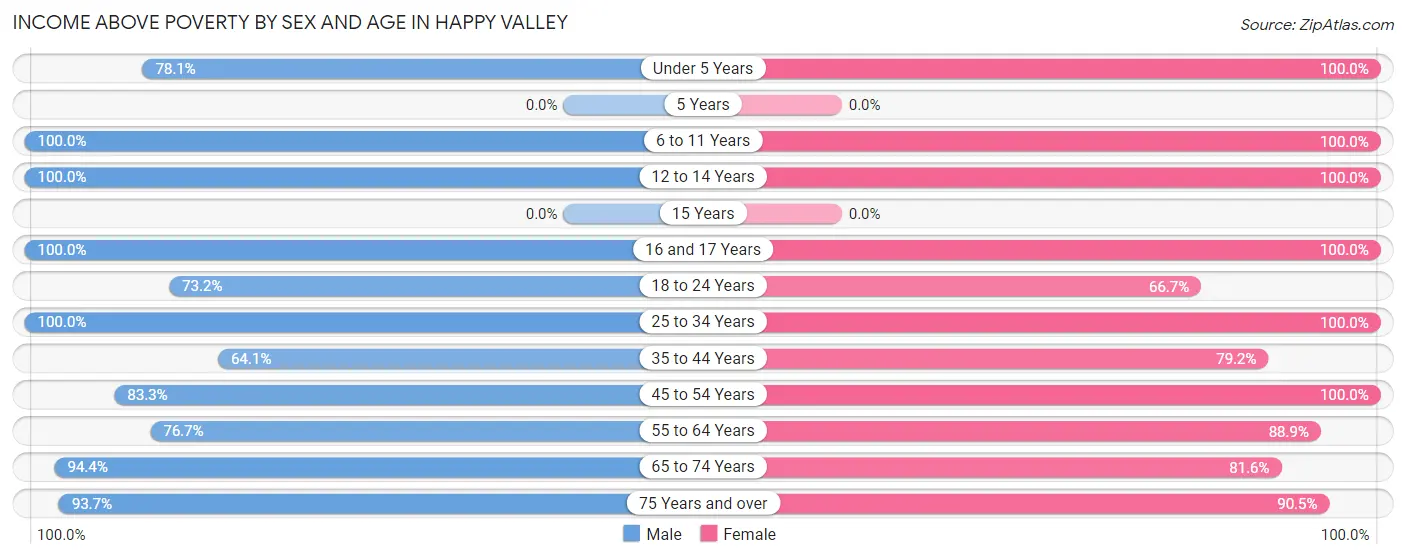
| Age Bracket | Male | Female |
| Under 5 Years | 25 (78.1%) | 8 (100.0%) |
| 5 Years | 0 (0.0%) | 0 (0.0%) |
| 6 to 11 Years | 22 (100.0%) | 32 (100.0%) |
| 12 to 14 Years | 20 (100.0%) | 5 (100.0%) |
| 15 Years | 0 (0.0%) | 0 (0.0%) |
| 16 and 17 Years | 7 (100.0%) | 5 (100.0%) |
| 18 to 24 Years | 30 (73.2%) | 10 (66.7%) |
| 25 to 34 Years | 21 (100.0%) | 17 (100.0%) |
| 35 to 44 Years | 25 (64.1%) | 19 (79.2%) |
| 45 to 54 Years | 20 (83.3%) | 12 (100.0%) |
| 55 to 64 Years | 46 (76.7%) | 80 (88.9%) |
| 65 to 74 Years | 68 (94.4%) | 62 (81.6%) |
| 75 Years and over | 59 (93.6%) | 57 (90.5%) |
| Total | 343 (85.5%) | 307 (88.5%) |
Income Below Poverty Among Married-Couple Families in Happy Valley
The poverty statistics for married-couple families in Happy Valley show that 7.3% or 13 of the total 178 families live below the poverty line. Families with 1 or 2 children have the highest poverty rate of 11.1%, comprising of 4 families. On the other hand, families with 3 or 4 children have the lowest poverty rate of 0.0%, which includes 0 families.
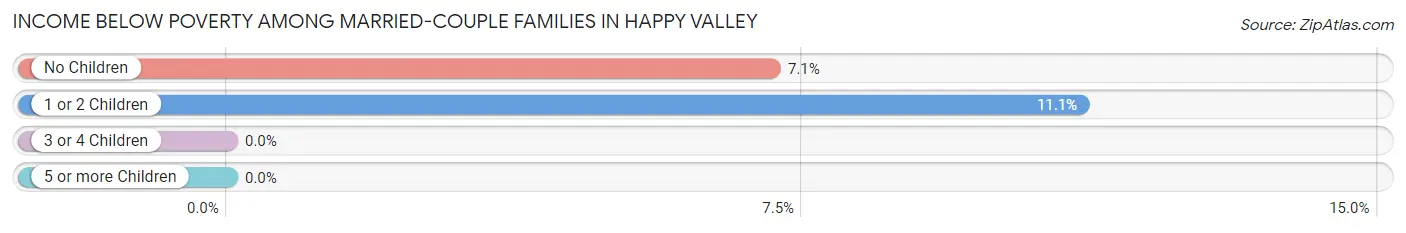
| Children | Above Poverty | Below Poverty |
| No Children | 118 (92.9%) | 9 (7.1%) |
| 1 or 2 Children | 32 (88.9%) | 4 (11.1%) |
| 3 or 4 Children | 10 (100.0%) | 0 (0.0%) |
| 5 or more Children | 5 (100.0%) | 0 (0.0%) |
| Total | 165 (92.7%) | 13 (7.3%) |
Income Below Poverty Among Single-Parent Households in Happy Valley
| Children | Single Father | Single Mother |
| No Children | 0 (0.0%) | 0 (0.0%) |
| 1 or 2 Children | 0 (0.0%) | 0 (0.0%) |
| 3 or 4 Children | 0 (0.0%) | 0 (0.0%) |
| 5 or more Children | 0 (0.0%) | 0 (0.0%) |
| Total | 0 (0.0%) | 0 (0.0%) |
Income Below Poverty Among Married-Couple vs Single-Parent Households in Happy Valley
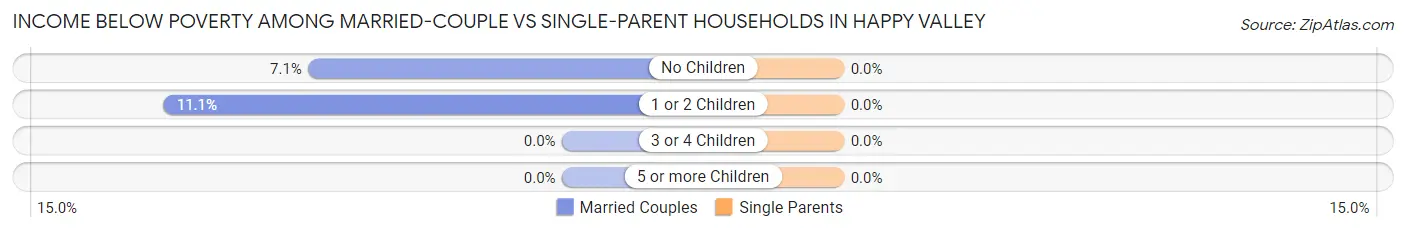
| Children | Married-Couple Families | Single-Parent Households |
| No Children | 9 (7.1%) | 0 (0.0%) |
| 1 or 2 Children | 4 (11.1%) | 0 (0.0%) |
| 3 or 4 Children | 0 (0.0%) | 0 (0.0%) |
| 5 or more Children | 0 (0.0%) | 0 (0.0%) |
| Total | 13 (7.3%) | 0 (0.0%) |
Race in Happy Valley
The most populous races in Happy Valley are White / Caucasian (621 | 83.0%), Native / Alaskan (67 | 9.0%), and Two or more Races (38 | 5.1%).
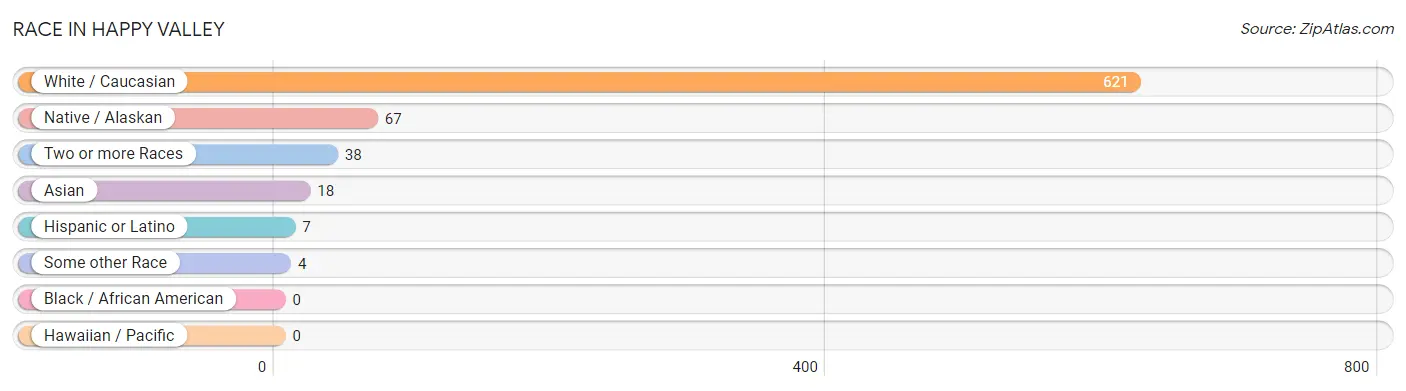
| Race | # Population | % Population |
| Asian | 18 | 2.4% |
| Black / African American | 0 | 0.0% |
| Hawaiian / Pacific | 0 | 0.0% |
| Hispanic or Latino | 7 | 0.9% |
| Native / Alaskan | 67 | 9.0% |
| White / Caucasian | 621 | 83.0% |
| Two or more Races | 38 | 5.1% |
| Some other Race | 4 | 0.5% |
| Total | 748 | 100.0% |
Ancestry in Happy Valley
The most populous ancestries reported in Happy Valley are German (134 | 17.9%), Irish (124 | 16.6%), English (100 | 13.4%), Scottish (47 | 6.3%), and Italian (30 | 4.0%), together accounting for 58.2% of all Happy Valley residents.
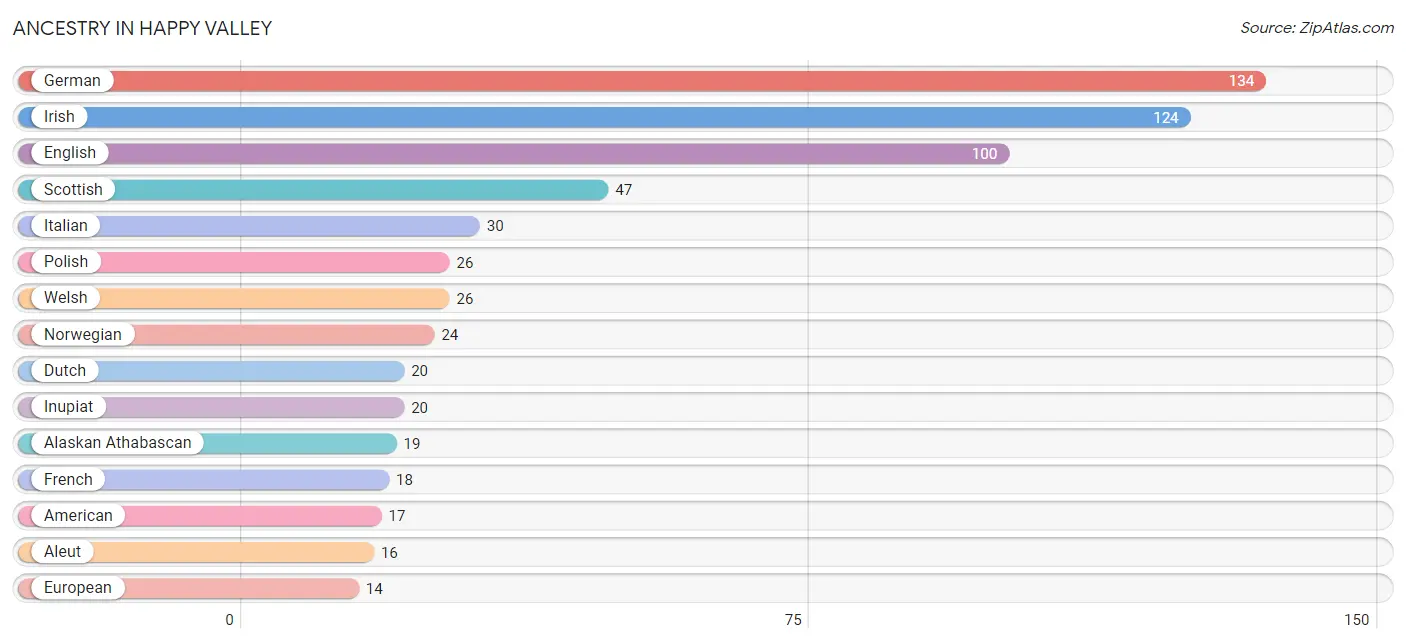
| Ancestry | # Population | % Population |
| Alaskan Athabascan | 19 | 2.5% |
| Aleut | 16 | 2.1% |
| American | 17 | 2.3% |
| Armenian | 5 | 0.7% |
| Belgian | 4 | 0.5% |
| Bhutanese | 12 | 1.6% |
| Cherokee | 7 | 0.9% |
| Czech | 4 | 0.5% |
| Dutch | 20 | 2.7% |
| English | 100 | 13.4% |
| European | 14 | 1.9% |
| Finnish | 5 | 0.7% |
| French | 18 | 2.4% |
| German | 134 | 17.9% |
| Indian (Asian) | 6 | 0.8% |
| Inupiat | 20 | 2.7% |
| Irish | 124 | 16.6% |
| Italian | 30 | 4.0% |
| Norwegian | 24 | 3.2% |
| Polish | 26 | 3.5% |
| Russian | 2 | 0.3% |
| Scotch-Irish | 5 | 0.7% |
| Scottish | 47 | 6.3% |
| Sioux | 3 | 0.4% |
| Spaniard | 4 | 0.5% |
| Spanish | 3 | 0.4% |
| Swedish | 4 | 0.5% |
| Tlingit-Haida | 6 | 0.8% |
| Welsh | 26 | 3.5% |
| Yup'ik | 7 | 0.9% | View All 30 Rows |
Immigrants in Happy Valley
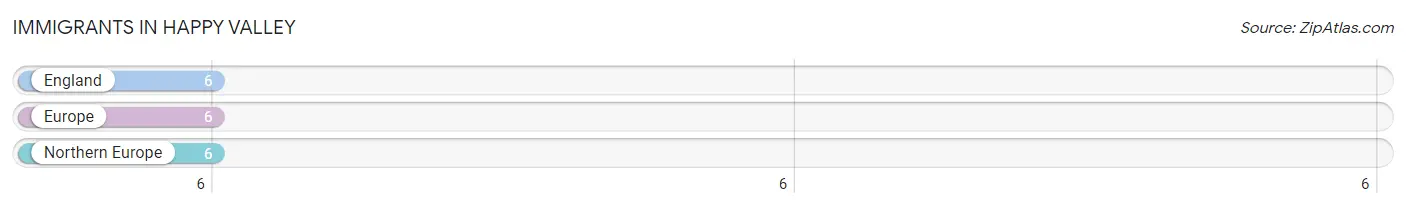
The most numerous immigrant groups reported in Happy Valley came from England (6 | 0.8%), Europe (6 | 0.8%), and Northern Europe (6 | 0.8%), together accounting for 2.4% of all Happy Valley residents.
| Immigration Origin | # Population | % Population |
| England | 6 | 0.8% |
| Europe | 6 | 0.8% |
| Northern Europe | 6 | 0.8% | View All 3 Rows |
Sex and Age in Happy Valley
Sex and Age in Happy Valley
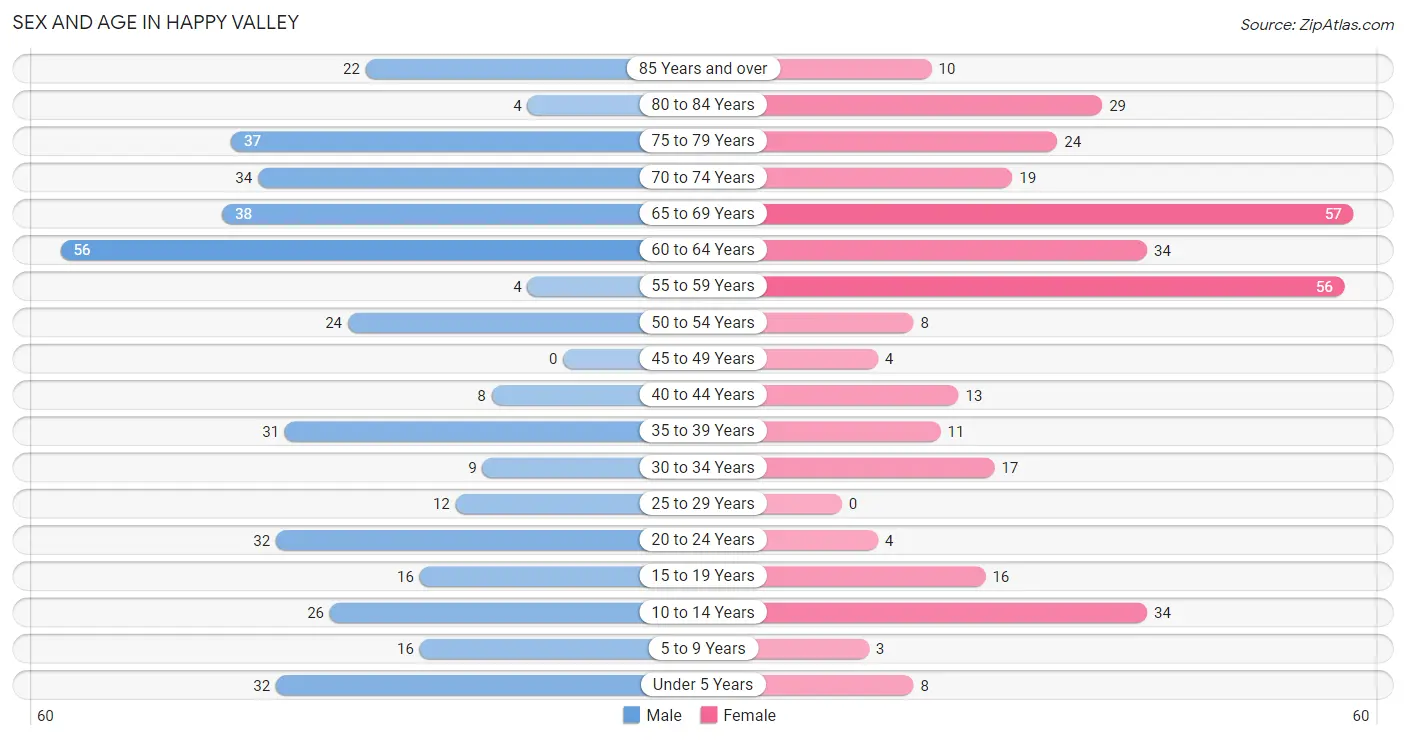
The most populous age groups in Happy Valley are 60 to 64 Years (56 | 14.0%) for men and 65 to 69 Years (57 | 16.4%) for women.
| Age Bracket | Male | Female |
| Under 5 Years | 32 (8.0%) | 8 (2.3%) |
| 5 to 9 Years | 16 (4.0%) | 3 (0.9%) |
| 10 to 14 Years | 26 (6.5%) | 34 (9.8%) |
| 15 to 19 Years | 16 (4.0%) | 16 (4.6%) |
| 20 to 24 Years | 32 (8.0%) | 4 (1.1%) |
| 25 to 29 Years | 12 (3.0%) | 0 (0.0%) |
| 30 to 34 Years | 9 (2.2%) | 17 (4.9%) |
| 35 to 39 Years | 31 (7.7%) | 11 (3.2%) |
| 40 to 44 Years | 8 (2.0%) | 13 (3.7%) |
| 45 to 49 Years | 0 (0.0%) | 4 (1.1%) |
| 50 to 54 Years | 24 (6.0%) | 8 (2.3%) |
| 55 to 59 Years | 4 (1.0%) | 56 (16.1%) |
| 60 to 64 Years | 56 (14.0%) | 34 (9.8%) |
| 65 to 69 Years | 38 (9.5%) | 57 (16.4%) |
| 70 to 74 Years | 34 (8.5%) | 19 (5.5%) |
| 75 to 79 Years | 37 (9.2%) | 24 (6.9%) |
| 80 to 84 Years | 4 (1.0%) | 29 (8.4%) |
| 85 Years and over | 22 (5.5%) | 10 (2.9%) |
| Total | 401 (100.0%) | 347 (100.0%) |
Families and Households in Happy Valley
Median Family Size in Happy Valley
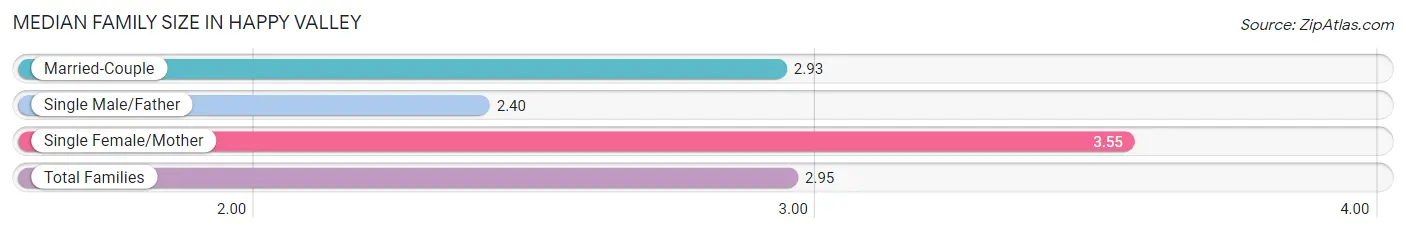
The median family size in Happy Valley is 2.95 persons per family, with single female/mother families (11 | 5.7%) accounting for the largest median family size of 3.55 persons per family. On the other hand, single male/father families (5 | 2.6%) represent the smallest median family size with 2.40 persons per family.
| Family Type | # Families | Family Size |
| Married-Couple | 178 (91.7%) | 2.93 |
| Single Male/Father | 5 (2.6%) | 2.40 |
| Single Female/Mother | 11 (5.7%) | 3.55 |
| Total Families | 194 (100.0%) | 2.95 |
Median Household Size in Happy Valley
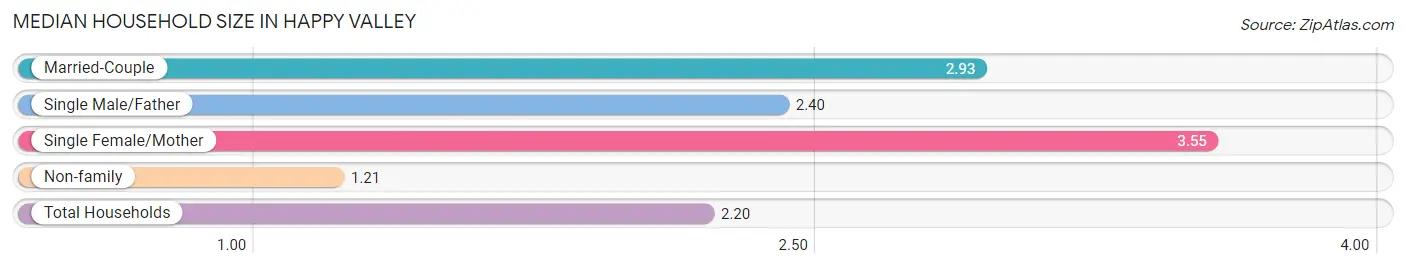
The median household size in Happy Valley is 2.20 persons per household, with single female/mother households (11 | 3.2%) accounting for the largest median household size of 3.55 persons per household. non-family households (146 | 42.9%) represent the smallest median household size with 1.21 persons per household.
| Household Type | # Households | Household Size |
| Married-Couple | 178 (52.3%) | 2.93 |
| Single Male/Father | 5 (1.5%) | 2.40 |
| Single Female/Mother | 11 (3.2%) | 3.55 |
| Non-family | 146 (42.9%) | 1.21 |
| Total Households | 340 (100.0%) | 2.20 |
Household Size by Marriage Status in Happy Valley
Out of a total of 340 households in Happy Valley, 194 (57.1%) are family households, while 146 (42.9%) are nonfamily households. The most numerous type of family households are 2-person households, comprising 141, and the most common type of nonfamily households are 1-person households, comprising 129.
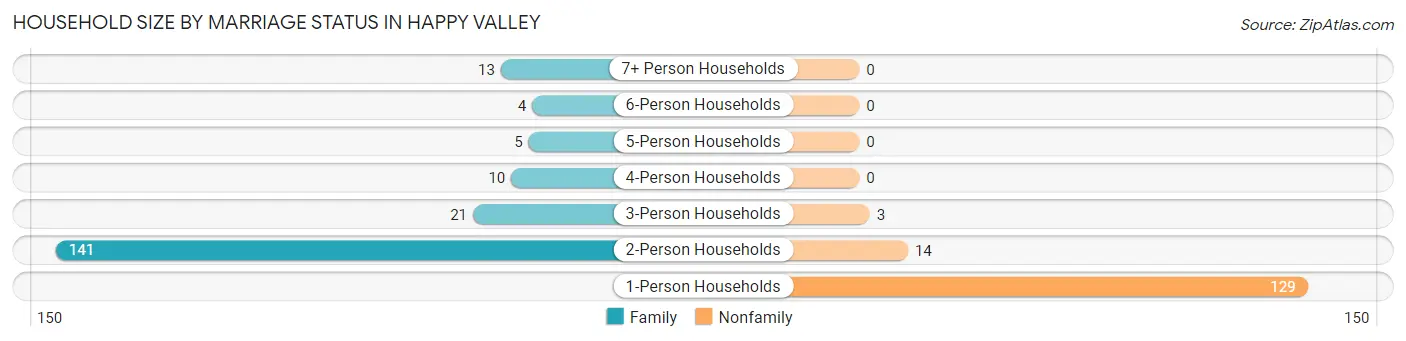
| Household Size | Family Households | Nonfamily Households |
| 1-Person Households | - | 129 (37.9%) |
| 2-Person Households | 141 (41.5%) | 14 (4.1%) |
| 3-Person Households | 21 (6.2%) | 3 (0.9%) |
| 4-Person Households | 10 (2.9%) | 0 (0.0%) |
| 5-Person Households | 5 (1.5%) | 0 (0.0%) |
| 6-Person Households | 4 (1.2%) | 0 (0.0%) |
| 7+ Person Households | 13 (3.8%) | 0 (0.0%) |
| Total | 194 (57.1%) | 146 (42.9%) |
Female Fertility in Happy Valley
Fertility by Age in Happy Valley
Average fertility rate in Happy Valley is 77.0 births per 1,000 women. Women in the age bracket of 20 to 34 years have the highest fertility rate with 238.0 births per 1,000 women. Women in the age bracket of 20 to 34 years acount for 100.0% of all women with births.
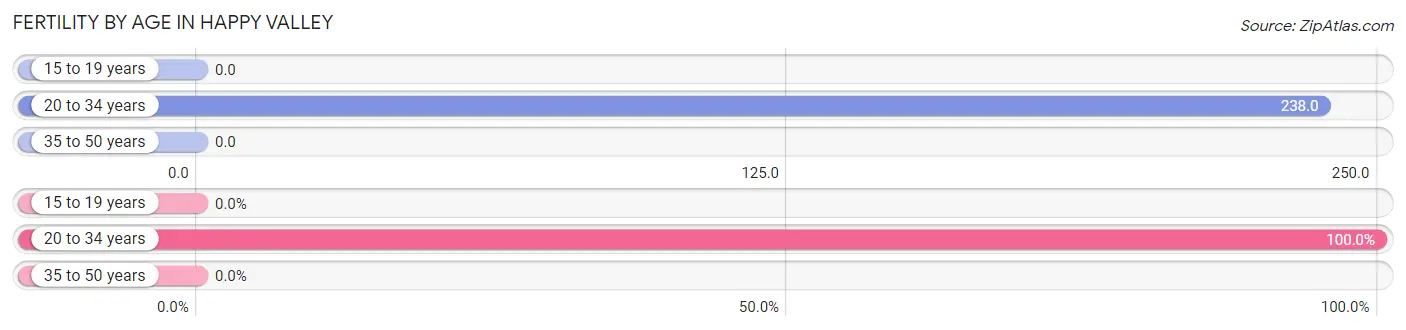
| Age Bracket | Women with Births | Births / 1,000 Women |
| 15 to 19 years | 0 (0.0%) | 0.0 |
| 20 to 34 years | 5 (100.0%) | 238.0 |
| 35 to 50 years | 0 (0.0%) | 0.0 |
| Total | 5 (100.0%) | 77.0 |
Fertility by Age by Marriage Status in Happy Valley
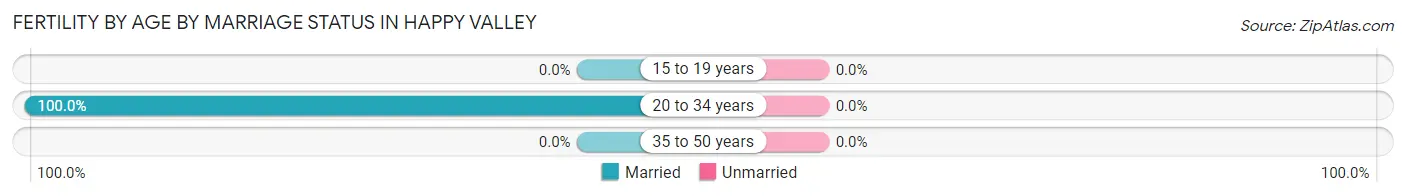
| Age Bracket | Married | Unmarried |
| 15 to 19 years | 0 (0.0%) | 0 (0.0%) |
| 20 to 34 years | 5 (100.0%) | 0 (0.0%) |
| 35 to 50 years | 0 (0.0%) | 0 (0.0%) |
| Total | 5 (100.0%) | 0 (0.0%) |
Fertility by Education in Happy Valley
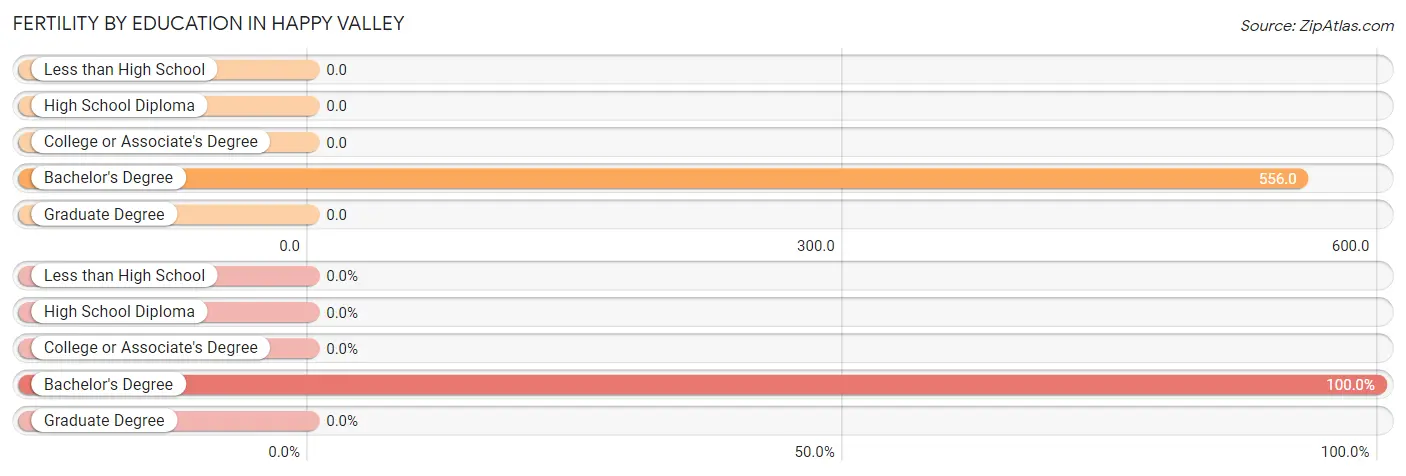
| Educational Attainment | Women with Births | Births / 1,000 Women |
| Less than High School | 0 (0.0%) | 0.0 |
| High School Diploma | 0 (0.0%) | 0.0 |
| College or Associate's Degree | 0 (0.0%) | 0.0 |
| Bachelor's Degree | 5 (100.0%) | 556.0 |
| Graduate Degree | 0 (0.0%) | 0.0 |
| Total | 5 (100.0%) | 77.0 |
Fertility by Education by Marriage Status in Happy Valley
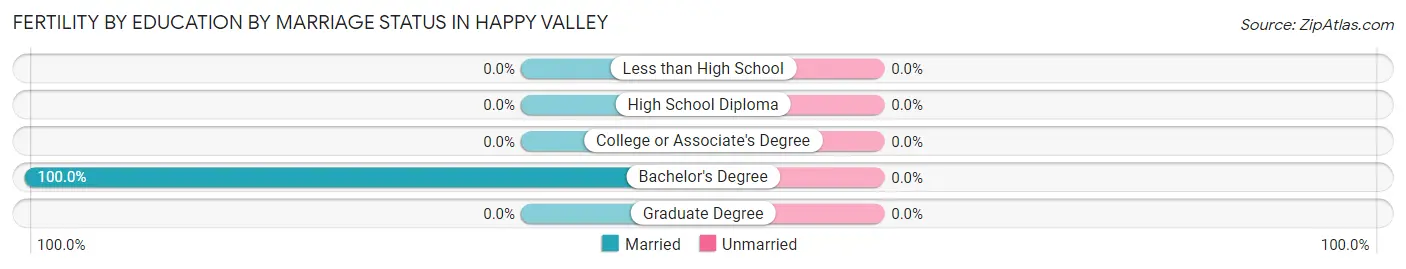
| Educational Attainment | Married | Unmarried |
| Less than High School | 0 (0.0%) | 0 (0.0%) |
| High School Diploma | 0 (0.0%) | 0 (0.0%) |
| College or Associate's Degree | 0 (0.0%) | 0 (0.0%) |
| Bachelor's Degree | 5 (100.0%) | 0 (0.0%) |
| Graduate Degree | 0 (0.0%) | 0 (0.0%) |
| Total | 5 (100.0%) | 0 (0.0%) |
Employment Characteristics in Happy Valley
Employment by Class of Employer in Happy Valley
Among the 224 employed individuals in Happy Valley, private company employees (126 | 56.2%), self-employed (not incorporated) (35 | 15.6%), and local government employees (29 | 13.0%) make up the most common classes of employment.
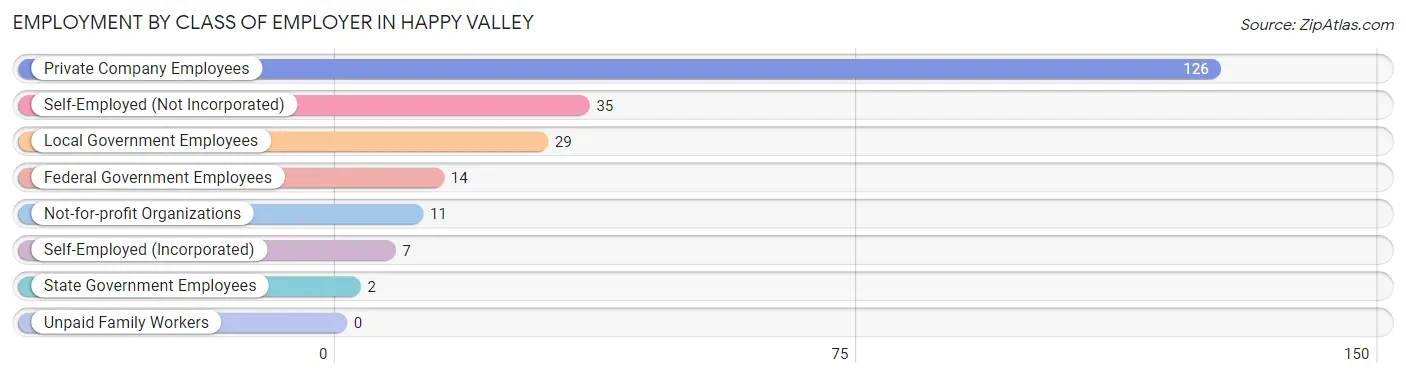
| Employer Class | # Employees | % Employees |
| Private Company Employees | 126 | 56.2% |
| Self-Employed (Incorporated) | 7 | 3.1% |
| Self-Employed (Not Incorporated) | 35 | 15.6% |
| Not-for-profit Organizations | 11 | 4.9% |
| Local Government Employees | 29 | 13.0% |
| State Government Employees | 2 | 0.9% |
| Federal Government Employees | 14 | 6.2% |
| Unpaid Family Workers | 0 | 0.0% |
| Total | 224 | 100.0% |
Employment Status by Age in Happy Valley
According to the labor force statistics for Happy Valley, out of the total population over 16 years of age (629), 38.8% or 244 individuals are in the labor force, with 8.2% or 20 of them unemployed. The age group with the highest labor force participation rate is 25 to 29 years, with 100.0% or 12 individuals in the labor force. Within the labor force, the 35 to 44 years age range has the highest percentage of unemployed individuals, with 24.4% or 11 of them being unemployed.
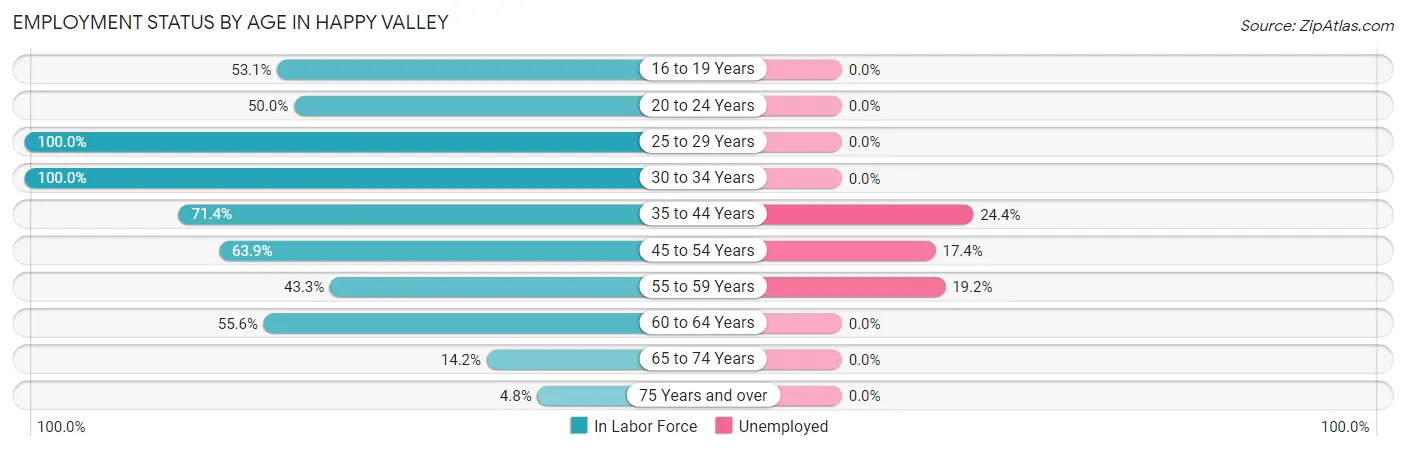
| Age Bracket | In Labor Force | Unemployed |
| 16 to 19 Years | 17 (53.1%) | 0 (0.0%) |
| 20 to 24 Years | 18 (50.0%) | 0 (0.0%) |
| 25 to 29 Years | 12 (100.0%) | 0 (0.0%) |
| 30 to 34 Years | 26 (100.0%) | 0 (0.0%) |
| 35 to 44 Years | 45 (71.4%) | 11 (24.4%) |
| 45 to 54 Years | 23 (63.9%) | 4 (17.4%) |
| 55 to 59 Years | 26 (43.3%) | 5 (19.2%) |
| 60 to 64 Years | 50 (55.6%) | 0 (0.0%) |
| 65 to 74 Years | 21 (14.2%) | 0 (0.0%) |
| 75 Years and over | 6 (4.8%) | 0 (0.0%) |
| Total | 244 (38.8%) | 20 (8.2%) |
Employment Status by Educational Attainment in Happy Valley
According to labor force statistics for Happy Valley, 63.4% of individuals (182) out of the total population between 25 and 64 years of age (287) are in the labor force, with 11.0% or 20 of them being unemployed. The group with the highest labor force participation rate are those with the educational attainment of college / associate degree, with 80.2% or 81 individuals in the labor force. Within the labor force, individuals with college / associate degree education have the highest percentage of unemployment, with 24.7% or 20 of them being unemployed.
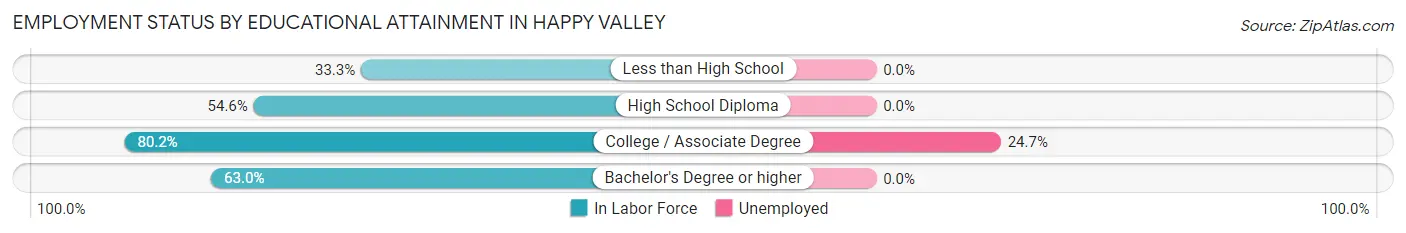
| Educational Attainment | In Labor Force | Unemployed |
| Less than High School | 8 (33.3%) | 0 (0.0%) |
| High School Diploma | 59 (54.6%) | 0 (0.0%) |
| College / Associate Degree | 81 (80.2%) | 25 (24.7%) |
| Bachelor's Degree or higher | 34 (63.0%) | 0 (0.0%) |
| Total | 182 (63.4%) | 32 (11.0%) |
Employment Occupations by Sex in Happy Valley
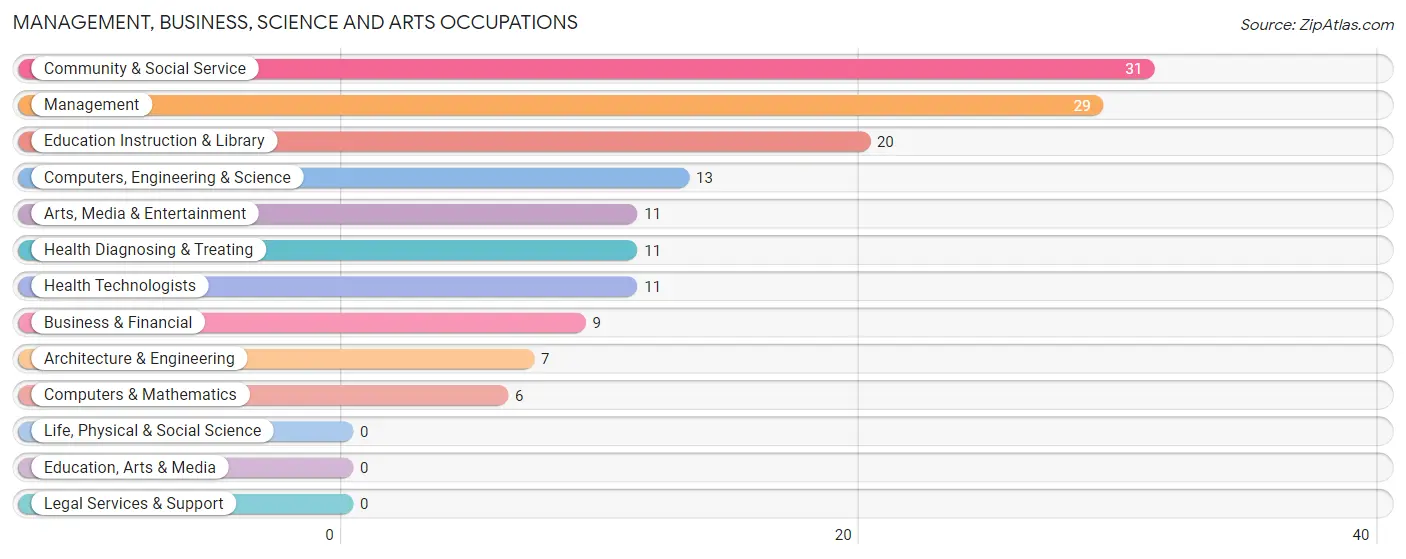
Management, Business, Science and Arts Occupations
The most common Management, Business, Science and Arts occupations in Happy Valley are Community & Social Service (31 | 13.8%), Management (29 | 13.0%), Education Instruction & Library (20 | 8.9%), Computers, Engineering & Science (13 | 5.8%), and Arts, Media & Entertainment (11 | 4.9%).
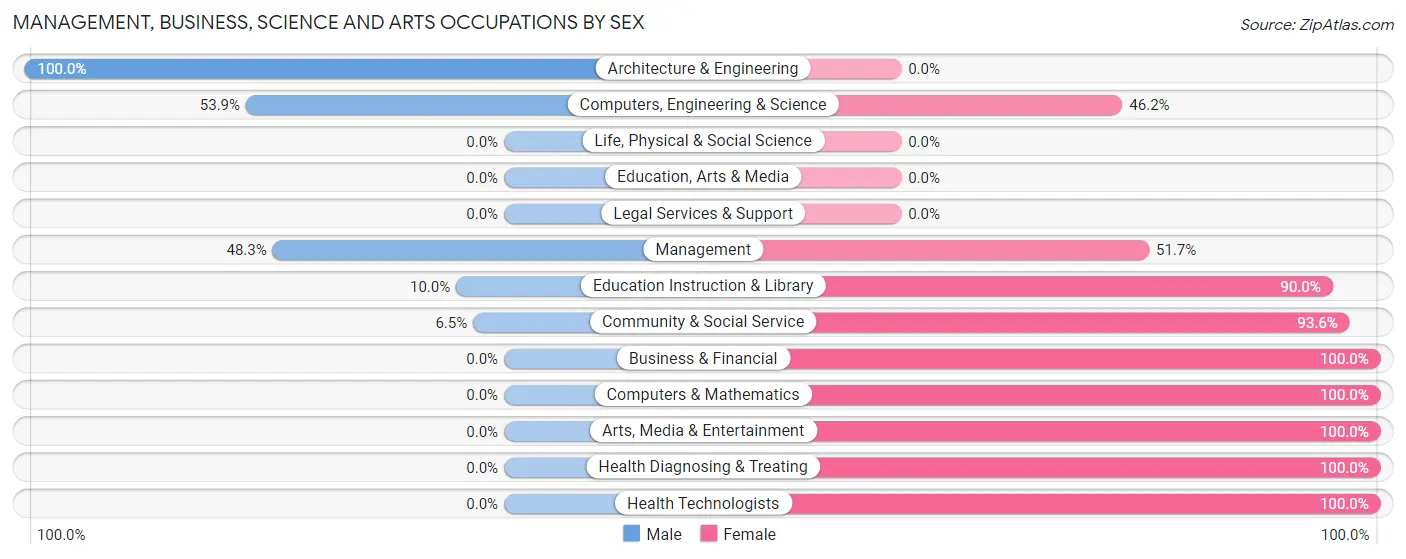
Management, Business, Science and Arts Occupations by Sex
Within the Management, Business, Science and Arts occupations in Happy Valley, the most male-oriented occupations are Architecture & Engineering (100.0%), Computers, Engineering & Science (53.8%), and Management (48.3%), while the most female-oriented occupations are Business & Financial (100.0%), Computers & Mathematics (100.0%), and Arts, Media & Entertainment (100.0%).
| Occupation | Male | Female |
| Management | 14 (48.3%) | 15 (51.7%) |
| Business & Financial | 0 (0.0%) | 9 (100.0%) |
| Computers, Engineering & Science | 7 (53.8%) | 6 (46.2%) |
| Computers & Mathematics | 0 (0.0%) | 6 (100.0%) |
| Architecture & Engineering | 7 (100.0%) | 0 (0.0%) |
| Life, Physical & Social Science | 0 (0.0%) | 0 (0.0%) |
| Community & Social Service | 2 (6.5%) | 29 (93.5%) |
| Education, Arts & Media | 0 (0.0%) | 0 (0.0%) |
| Legal Services & Support | 0 (0.0%) | 0 (0.0%) |
| Education Instruction & Library | 2 (10.0%) | 18 (90.0%) |
| Arts, Media & Entertainment | 0 (0.0%) | 11 (100.0%) |
| Health Diagnosing & Treating | 0 (0.0%) | 11 (100.0%) |
| Health Technologists | 0 (0.0%) | 11 (100.0%) |
| Total (Category) | 23 (24.7%) | 70 (75.3%) |
| Total (Overall) | 118 (52.7%) | 106 (47.3%) |
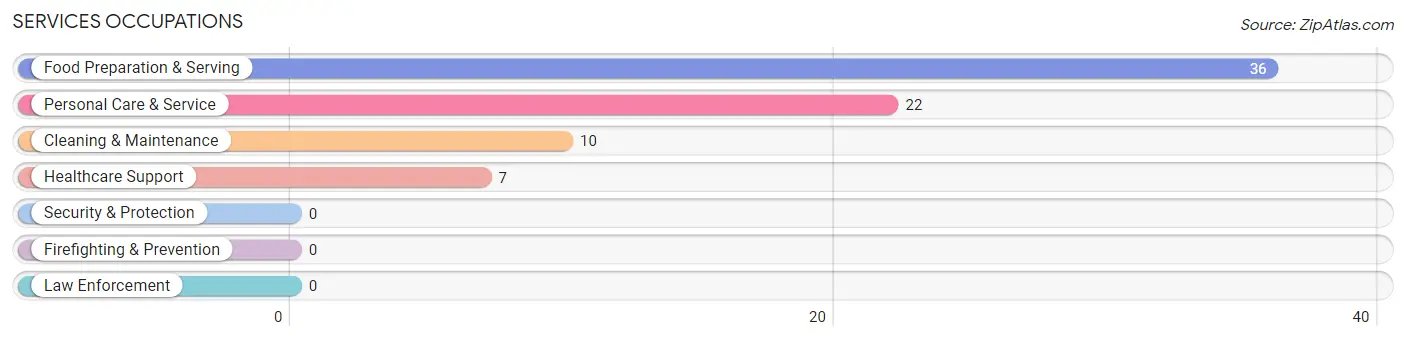
Services Occupations
The most common Services occupations in Happy Valley are Food Preparation & Serving (36 | 16.1%), Personal Care & Service (22 | 9.8%), Cleaning & Maintenance (10 | 4.5%), and Healthcare Support (7 | 3.1%).
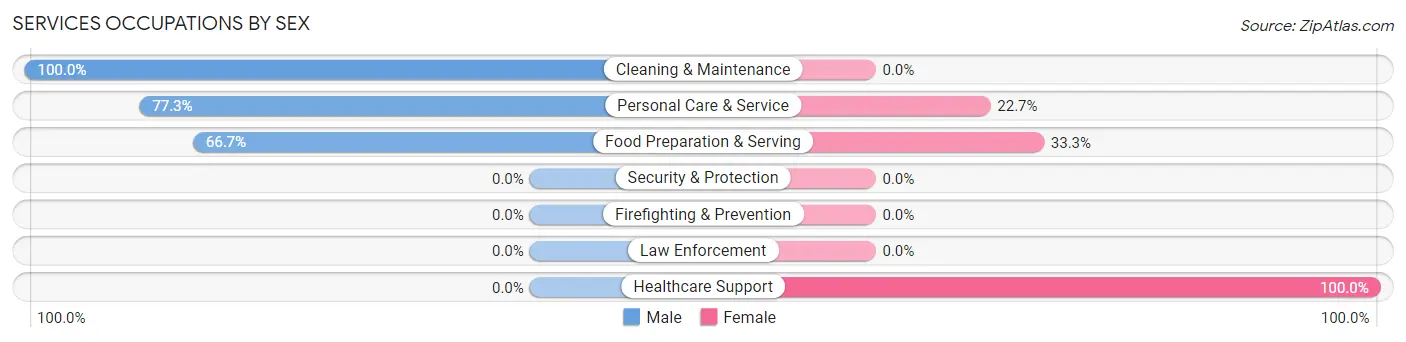
Services Occupations by Sex
Within the Services occupations in Happy Valley, the most male-oriented occupations are Cleaning & Maintenance (100.0%), Personal Care & Service (77.3%), and Food Preparation & Serving (66.7%), while the most female-oriented occupations are Healthcare Support (100.0%), Food Preparation & Serving (33.3%), and Personal Care & Service (22.7%).
| Occupation | Male | Female |
| Healthcare Support | 0 (0.0%) | 7 (100.0%) |
| Security & Protection | 0 (0.0%) | 0 (0.0%) |
| Firefighting & Prevention | 0 (0.0%) | 0 (0.0%) |
| Law Enforcement | 0 (0.0%) | 0 (0.0%) |
| Food Preparation & Serving | 24 (66.7%) | 12 (33.3%) |
| Cleaning & Maintenance | 10 (100.0%) | 0 (0.0%) |
| Personal Care & Service | 17 (77.3%) | 5 (22.7%) |
| Total (Category) | 51 (68.0%) | 24 (32.0%) |
| Total (Overall) | 118 (52.7%) | 106 (47.3%) |
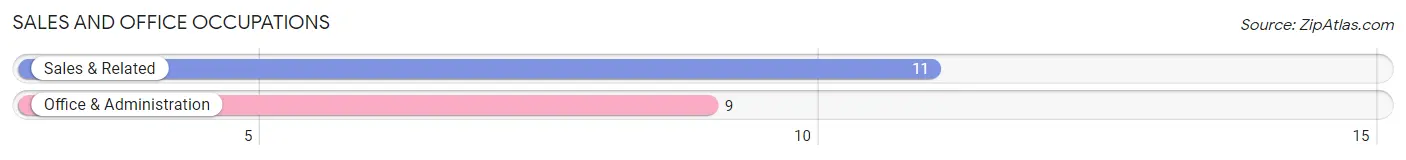
Sales and Office Occupations
The most common Sales and Office occupations in Happy Valley are Sales & Related (11 | 4.9%), and Office & Administration (9 | 4.0%).
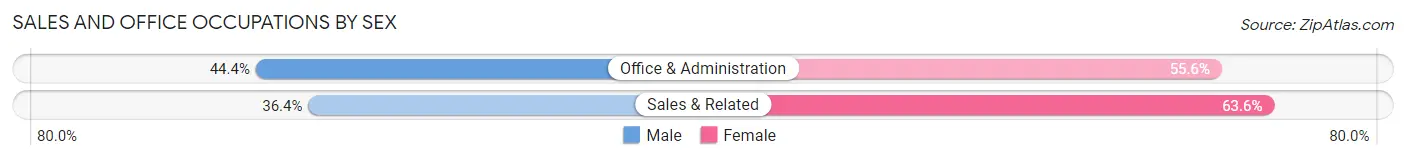
Sales and Office Occupations by Sex
| Occupation | Male | Female |
| Sales & Related | 4 (36.4%) | 7 (63.6%) |
| Office & Administration | 4 (44.4%) | 5 (55.6%) |
| Total (Category) | 8 (40.0%) | 12 (60.0%) |
| Total (Overall) | 118 (52.7%) | 106 (47.3%) |
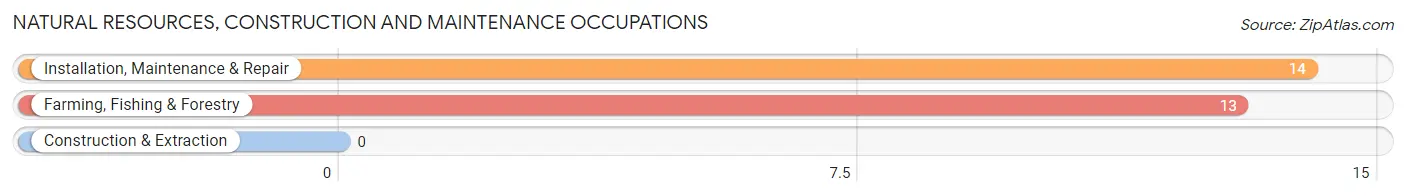
Natural Resources, Construction and Maintenance Occupations
The most common Natural Resources, Construction and Maintenance occupations in Happy Valley are Installation, Maintenance & Repair (14 | 6.2%), and Farming, Fishing & Forestry (13 | 5.8%).
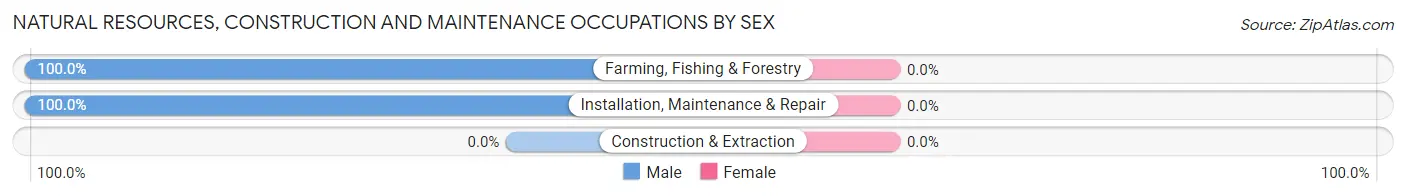
Natural Resources, Construction and Maintenance Occupations by Sex
| Occupation | Male | Female |
| Farming, Fishing & Forestry | 13 (100.0%) | 0 (0.0%) |
| Construction & Extraction | 0 (0.0%) | 0 (0.0%) |
| Installation, Maintenance & Repair | 14 (100.0%) | 0 (0.0%) |
| Total (Category) | 27 (100.0%) | 0 (0.0%) |
| Total (Overall) | 118 (52.7%) | 106 (47.3%) |
Production, Transportation and Moving Occupations
The most common Production, Transportation and Moving occupations in Happy Valley are , and Transportation (9 | 4.0%).
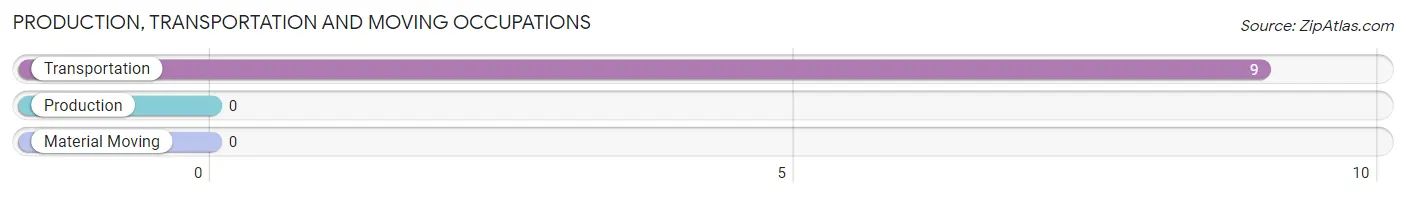
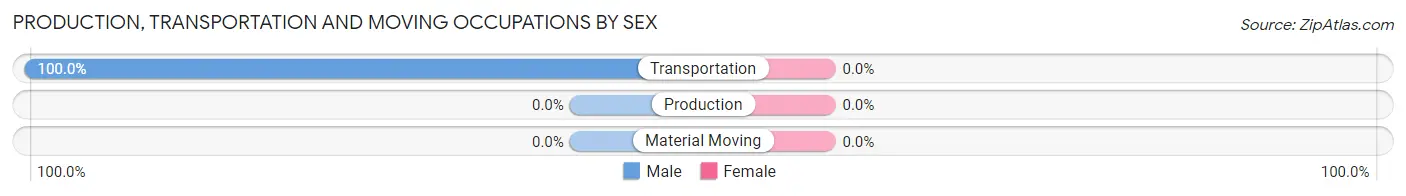
Production, Transportation and Moving Occupations by Sex
| Occupation | Male | Female |
| Production | 0 (0.0%) | 0 (0.0%) |
| Transportation | 9 (100.0%) | 0 (0.0%) |
| Material Moving | 0 (0.0%) | 0 (0.0%) |
| Total (Category) | 9 (100.0%) | 0 (0.0%) |
| Total (Overall) | 118 (52.7%) | 106 (47.3%) |
Employment Industries by Sex in Happy Valley
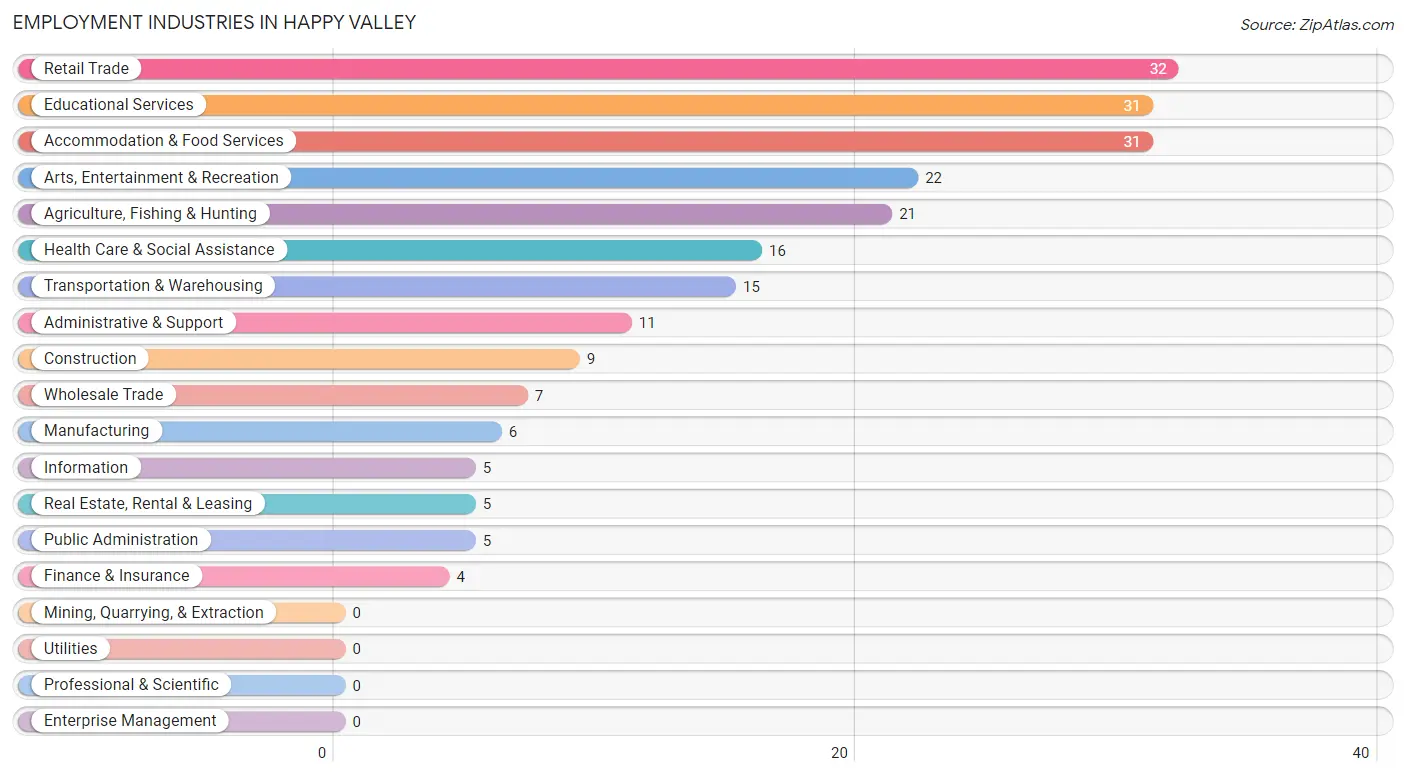
Employment Industries in Happy Valley
The major employment industries in Happy Valley include Retail Trade (32 | 14.3%), Educational Services (31 | 13.8%), Accommodation & Food Services (31 | 13.8%), Arts, Entertainment & Recreation (22 | 9.8%), and Agriculture, Fishing & Hunting (21 | 9.4%).
Employment Industries by Sex in Happy Valley
The Happy Valley industries that see more men than women are Agriculture, Fishing & Hunting (100.0%), Construction (100.0%), and Wholesale Trade (100.0%), whereas the industries that tend to have a higher number of women are Manufacturing (100.0%), Finance & Insurance (100.0%), and Real Estate, Rental & Leasing (100.0%).
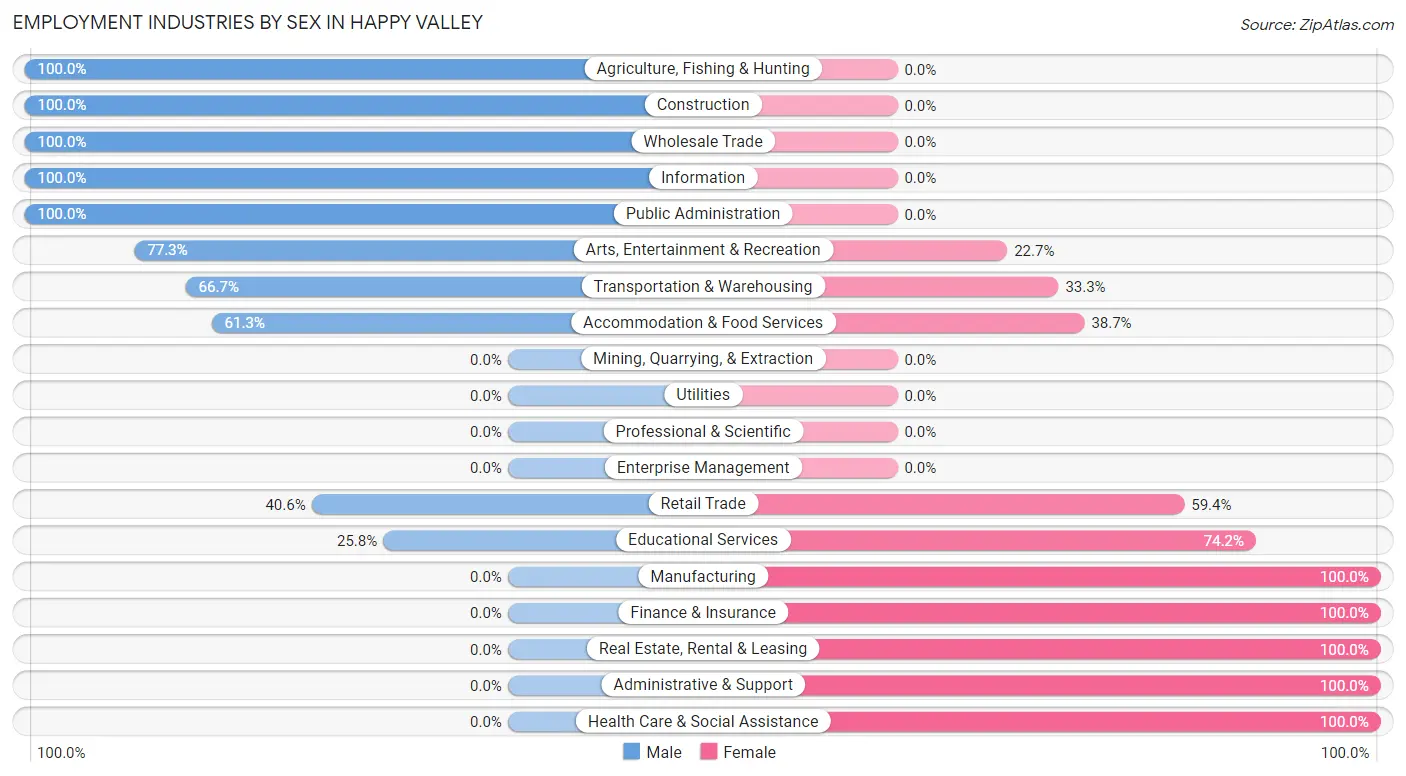
| Industry | Male | Female |
| Agriculture, Fishing & Hunting | 21 (100.0%) | 0 (0.0%) |
| Mining, Quarrying, & Extraction | 0 (0.0%) | 0 (0.0%) |
| Construction | 9 (100.0%) | 0 (0.0%) |
| Manufacturing | 0 (0.0%) | 6 (100.0%) |
| Wholesale Trade | 7 (100.0%) | 0 (0.0%) |
| Retail Trade | 13 (40.6%) | 19 (59.4%) |
| Transportation & Warehousing | 10 (66.7%) | 5 (33.3%) |
| Utilities | 0 (0.0%) | 0 (0.0%) |
| Information | 5 (100.0%) | 0 (0.0%) |
| Finance & Insurance | 0 (0.0%) | 4 (100.0%) |
| Real Estate, Rental & Leasing | 0 (0.0%) | 5 (100.0%) |
| Professional & Scientific | 0 (0.0%) | 0 (0.0%) |
| Enterprise Management | 0 (0.0%) | 0 (0.0%) |
| Administrative & Support | 0 (0.0%) | 11 (100.0%) |
| Educational Services | 8 (25.8%) | 23 (74.2%) |
| Health Care & Social Assistance | 0 (0.0%) | 16 (100.0%) |
| Arts, Entertainment & Recreation | 17 (77.3%) | 5 (22.7%) |
| Accommodation & Food Services | 19 (61.3%) | 12 (38.7%) |
| Public Administration | 5 (100.0%) | 0 (0.0%) |
| Total | 118 (52.7%) | 106 (47.3%) |
Education in Happy Valley
School Enrollment in Happy Valley
The most common levels of schooling among the 127 students in Happy Valley are middle school (41 | 32.3%), high school (33 | 26.0%), and elementary school (24 | 18.9%).
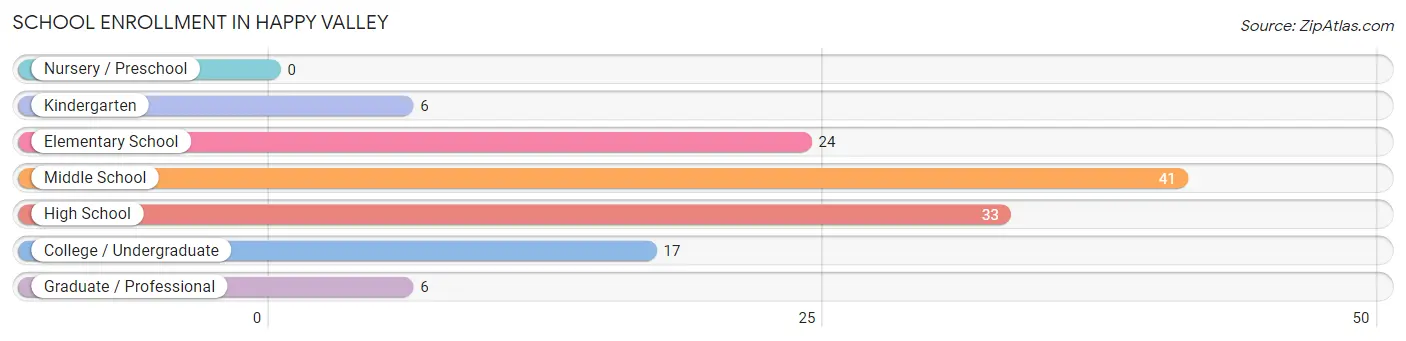
| School Level | # Students | % Students |
| Nursery / Preschool | 0 | 0.0% |
| Kindergarten | 6 | 4.7% |
| Elementary School | 24 | 18.9% |
| Middle School | 41 | 32.3% |
| High School | 33 | 26.0% |
| College / Undergraduate | 17 | 13.4% |
| Graduate / Professional | 6 | 4.7% |
| Total | 127 | 100.0% |
School Enrollment by Age by Funding Source in Happy Valley
Out of a total of 127 students who are enrolled in schools in Happy Valley, 36 (28.3%) attend a private institution, while the remaining 91 (71.7%) are enrolled in public schools. The age group of 5 to 9 year old has the highest likelihood of being enrolled in private schools, with 12 (63.2% in the age bracket) enrolled. Conversely, the age group of 15 to 17 year olds has the lowest likelihood of being enrolled in a private school, with 12 (100.0% in the age bracket) attending a public institution.
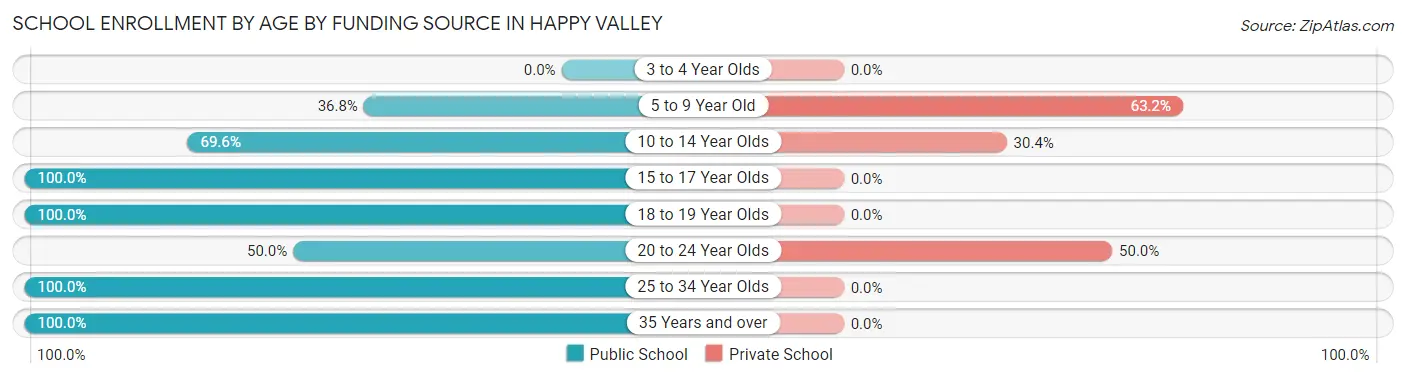
| Age Bracket | Public School | Private School |
| 3 to 4 Year Olds | 0 (0.0%) | 0 (0.0%) |
| 5 to 9 Year Old | 7 (36.8%) | 12 (63.2%) |
| 10 to 14 Year Olds | 39 (69.6%) | 17 (30.4%) |
| 15 to 17 Year Olds | 12 (100.0%) | 0 (0.0%) |
| 18 to 19 Year Olds | 6 (100.0%) | 0 (0.0%) |
| 20 to 24 Year Olds | 7 (50.0%) | 7 (50.0%) |
| 25 to 34 Year Olds | 4 (100.0%) | 0 (0.0%) |
| 35 Years and over | 16 (100.0%) | 0 (0.0%) |
| Total | 91 (71.7%) | 36 (28.3%) |
Educational Attainment by Field of Study in Happy Valley
Education (26 | 21.5%), business (21 | 17.4%), bio, nature & agricultural (19 | 15.7%), science & technology (16 | 13.2%), and arts & humanities (12 | 9.9%) are the most common fields of study among 121 individuals in Happy Valley who have obtained a bachelor's degree or higher.
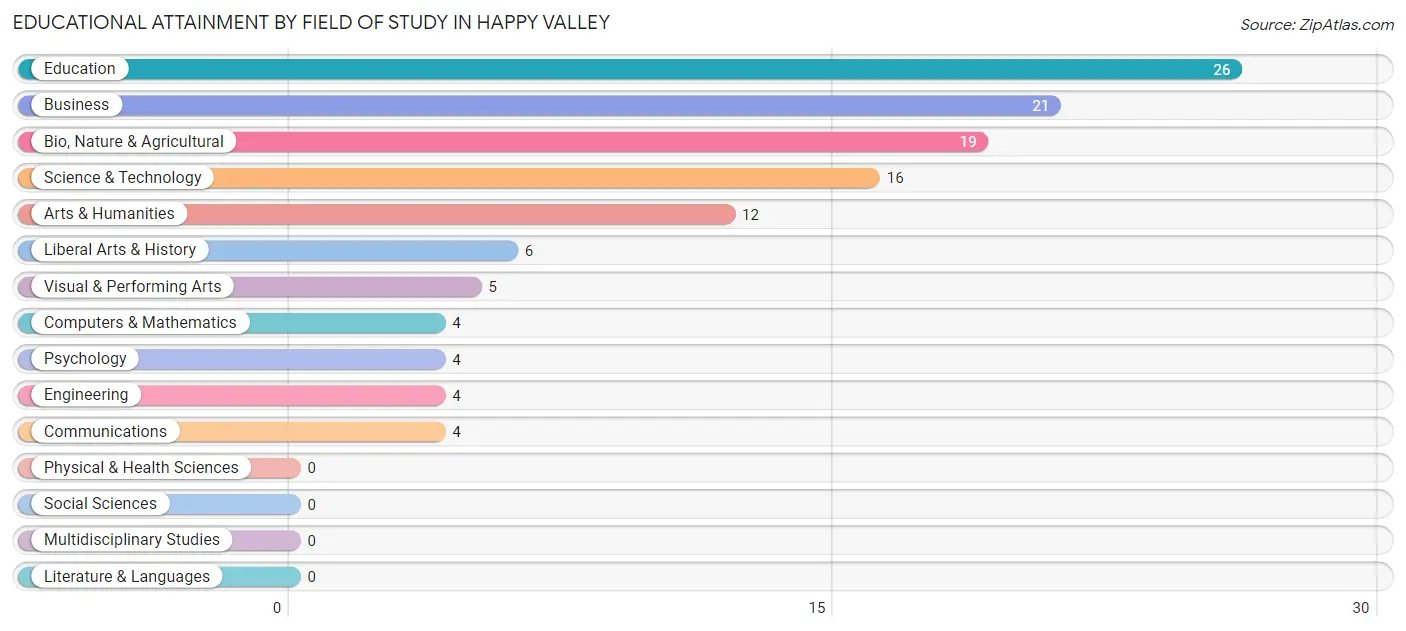
| Field of Study | # Graduates | % Graduates |
| Computers & Mathematics | 4 | 3.3% |
| Bio, Nature & Agricultural | 19 | 15.7% |
| Physical & Health Sciences | 0 | 0.0% |
| Psychology | 4 | 3.3% |
| Social Sciences | 0 | 0.0% |
| Engineering | 4 | 3.3% |
| Multidisciplinary Studies | 0 | 0.0% |
| Science & Technology | 16 | 13.2% |
| Business | 21 | 17.4% |
| Education | 26 | 21.5% |
| Literature & Languages | 0 | 0.0% |
| Liberal Arts & History | 6 | 5.0% |
| Visual & Performing Arts | 5 | 4.1% |
| Communications | 4 | 3.3% |
| Arts & Humanities | 12 | 9.9% |
| Total | 121 | 100.0% |
Transportation & Commute in Happy Valley
Vehicle Availability by Sex in Happy Valley
The most prevalent vehicle ownership categories in Happy Valley are males with 2 vehicles (36, accounting for 30.5%) and females with 2 vehicles (58, making up 34.0%).
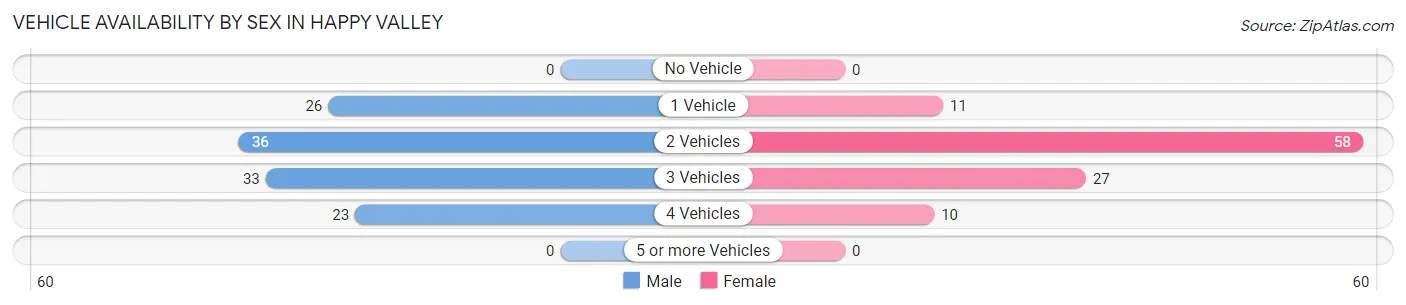
| Vehicles Available | Male | Female |
| No Vehicle | 0 (0.0%) | 0 (0.0%) |
| 1 Vehicle | 26 (22.0%) | 11 (10.4%) |
| 2 Vehicles | 36 (30.5%) | 58 (54.7%) |
| 3 Vehicles | 33 (28.0%) | 27 (25.5%) |
| 4 Vehicles | 23 (19.5%) | 10 (9.4%) |
| 5 or more Vehicles | 0 (0.0%) | 0 (0.0%) |
| Total | 118 (100.0%) | 106 (100.0%) |
Commute Time in Happy Valley
The most frequently occuring commute durations in Happy Valley are 10 to 14 minutes (40 commuters, 21.5%), 5 to 9 minutes (33 commuters, 17.7%), and 15 to 19 minutes (33 commuters, 17.7%).
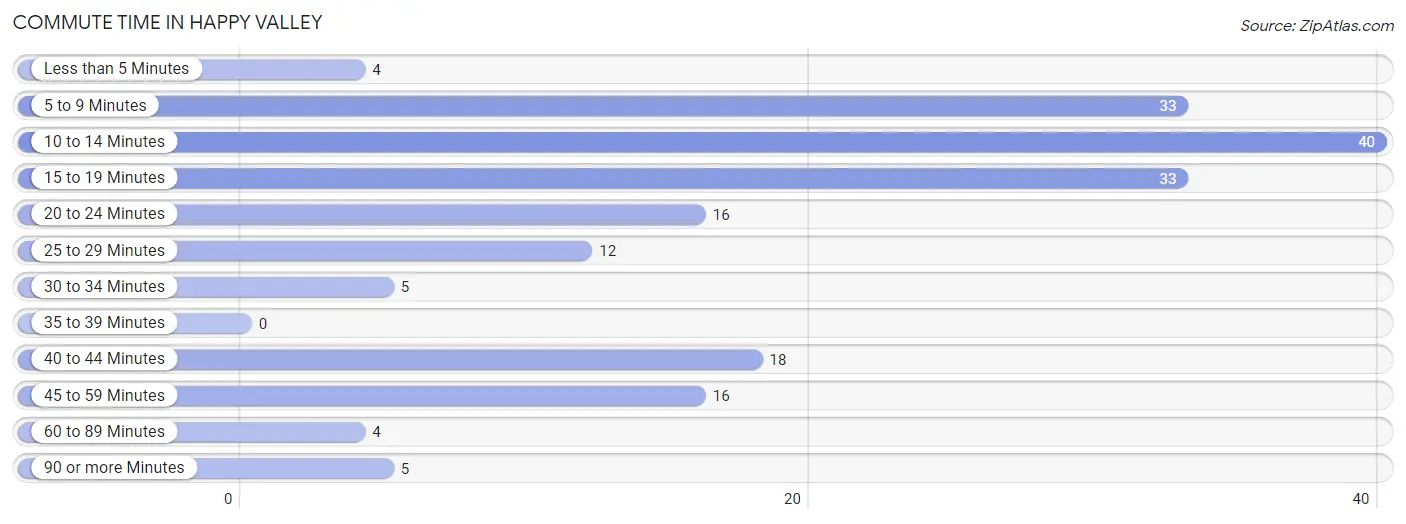
| Commute Time | # Commuters | % Commuters |
| Less than 5 Minutes | 4 | 2.1% |
| 5 to 9 Minutes | 33 | 17.7% |
| 10 to 14 Minutes | 40 | 21.5% |
| 15 to 19 Minutes | 33 | 17.7% |
| 20 to 24 Minutes | 16 | 8.6% |
| 25 to 29 Minutes | 12 | 6.5% |
| 30 to 34 Minutes | 5 | 2.7% |
| 35 to 39 Minutes | 0 | 0.0% |
| 40 to 44 Minutes | 18 | 9.7% |
| 45 to 59 Minutes | 16 | 8.6% |
| 60 to 89 Minutes | 4 | 2.1% |
| 90 or more Minutes | 5 | 2.7% |
Commute Time by Sex in Happy Valley
The most common commute times in Happy Valley are 15 to 19 minutes (28 commuters, 26.9%) for males and 10 to 14 minutes (23 commuters, 28.1%) for females.
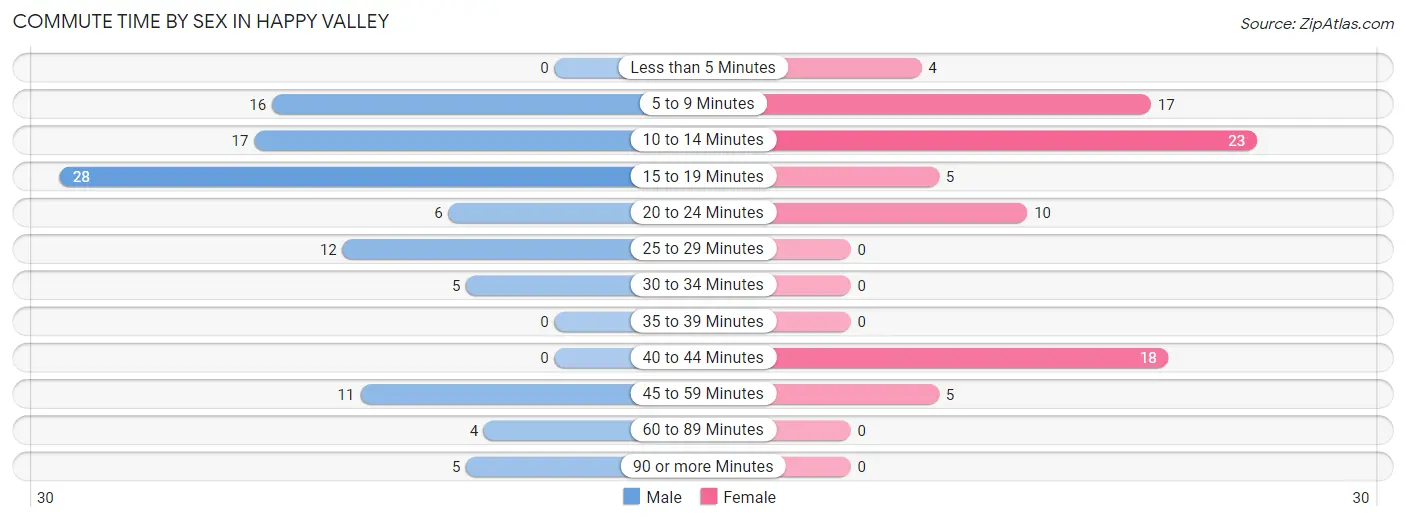
| Commute Time | Male | Female |
| Less than 5 Minutes | 0 (0.0%) | 4 (4.9%) |
| 5 to 9 Minutes | 16 (15.4%) | 17 (20.7%) |
| 10 to 14 Minutes | 17 (16.4%) | 23 (28.1%) |
| 15 to 19 Minutes | 28 (26.9%) | 5 (6.1%) |
| 20 to 24 Minutes | 6 (5.8%) | 10 (12.2%) |
| 25 to 29 Minutes | 12 (11.5%) | 0 (0.0%) |
| 30 to 34 Minutes | 5 (4.8%) | 0 (0.0%) |
| 35 to 39 Minutes | 0 (0.0%) | 0 (0.0%) |
| 40 to 44 Minutes | 0 (0.0%) | 18 (22.0%) |
| 45 to 59 Minutes | 11 (10.6%) | 5 (6.1%) |
| 60 to 89 Minutes | 4 (3.8%) | 0 (0.0%) |
| 90 or more Minutes | 5 (4.8%) | 0 (0.0%) |
Time of Departure to Work by Sex in Happy Valley
The most frequent times of departure to work in Happy Valley are 7:00 AM to 7:29 AM (38, 36.5%) for males and 8:00 AM to 8:29 AM (34, 41.5%) for females.
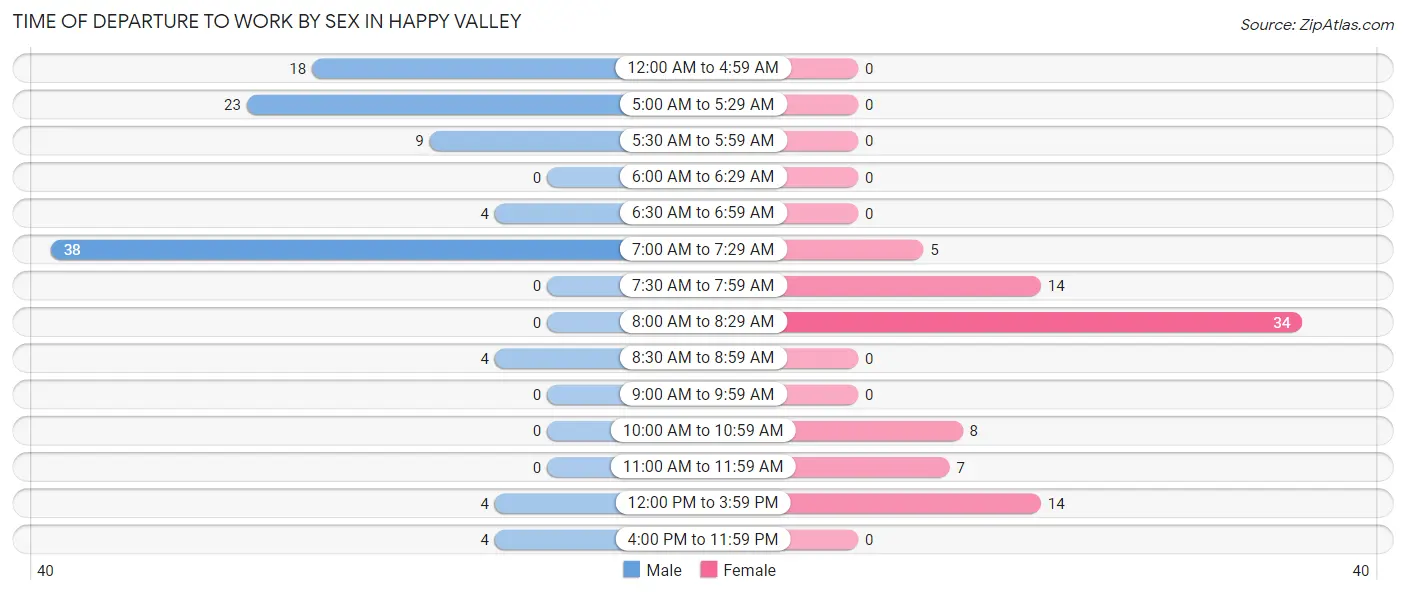
| Time of Departure | Male | Female |
| 12:00 AM to 4:59 AM | 18 (17.3%) | 0 (0.0%) |
| 5:00 AM to 5:29 AM | 23 (22.1%) | 0 (0.0%) |
| 5:30 AM to 5:59 AM | 9 (8.6%) | 0 (0.0%) |
| 6:00 AM to 6:29 AM | 0 (0.0%) | 0 (0.0%) |
| 6:30 AM to 6:59 AM | 4 (3.8%) | 0 (0.0%) |
| 7:00 AM to 7:29 AM | 38 (36.5%) | 5 (6.1%) |
| 7:30 AM to 7:59 AM | 0 (0.0%) | 14 (17.1%) |
| 8:00 AM to 8:29 AM | 0 (0.0%) | 34 (41.5%) |
| 8:30 AM to 8:59 AM | 4 (3.8%) | 0 (0.0%) |
| 9:00 AM to 9:59 AM | 0 (0.0%) | 0 (0.0%) |
| 10:00 AM to 10:59 AM | 0 (0.0%) | 8 (9.8%) |
| 11:00 AM to 11:59 AM | 0 (0.0%) | 7 (8.5%) |
| 12:00 PM to 3:59 PM | 4 (3.8%) | 14 (17.1%) |
| 4:00 PM to 11:59 PM | 4 (3.8%) | 0 (0.0%) |
| Total | 104 (100.0%) | 82 (100.0%) |
Housing Occupancy in Happy Valley
Occupancy by Ownership in Happy Valley
Of the total 340 dwellings in Happy Valley, owner-occupied units account for 309 (90.9%), while renter-occupied units make up 31 (9.1%).
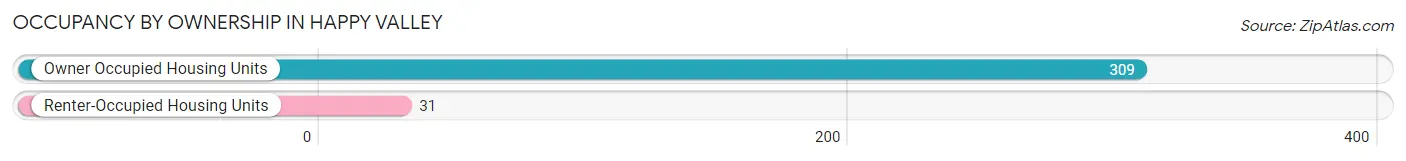
| Occupancy | # Housing Units | % Housing Units |
| Owner Occupied Housing Units | 309 | 90.9% |
| Renter-Occupied Housing Units | 31 | 9.1% |
| Total Occupied Housing Units | 340 | 100.0% |
Occupancy by Household Size in Happy Valley
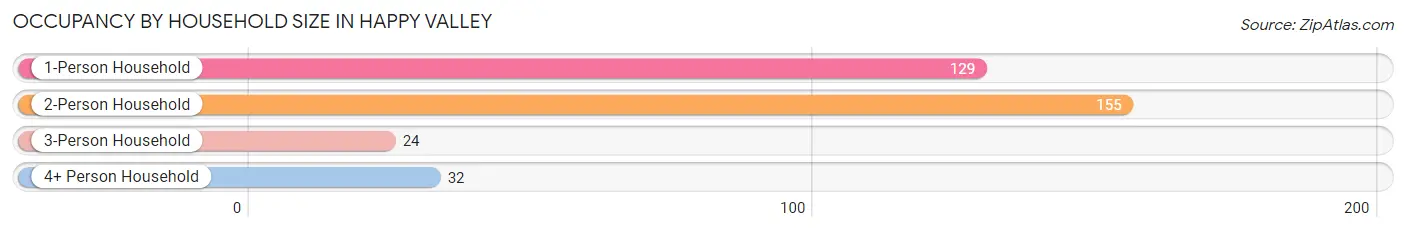
| Household Size | # Housing Units | % Housing Units |
| 1-Person Household | 129 | 37.9% |
| 2-Person Household | 155 | 45.6% |
| 3-Person Household | 24 | 7.1% |
| 4+ Person Household | 32 | 9.4% |
| Total Housing Units | 340 | 100.0% |
Occupancy by Ownership by Household Size in Happy Valley
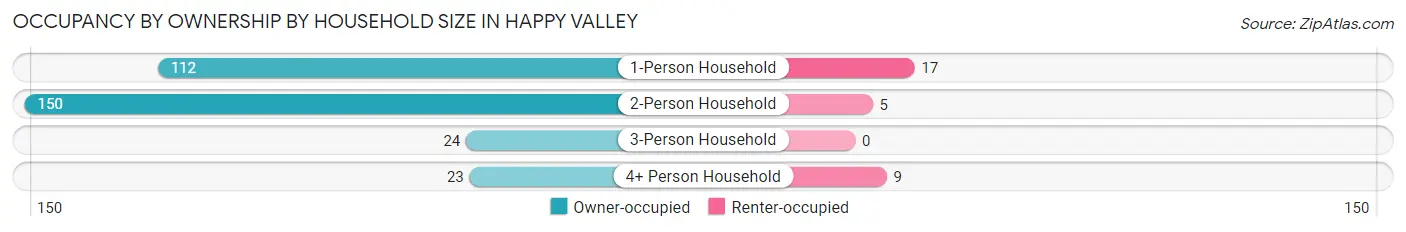
| Household Size | Owner-occupied | Renter-occupied |
| 1-Person Household | 112 (86.8%) | 17 (13.2%) |
| 2-Person Household | 150 (96.8%) | 5 (3.2%) |
| 3-Person Household | 24 (100.0%) | 0 (0.0%) |
| 4+ Person Household | 23 (71.9%) | 9 (28.1%) |
| Total Housing Units | 309 (90.9%) | 31 (9.1%) |
Occupancy by Educational Attainment in Happy Valley
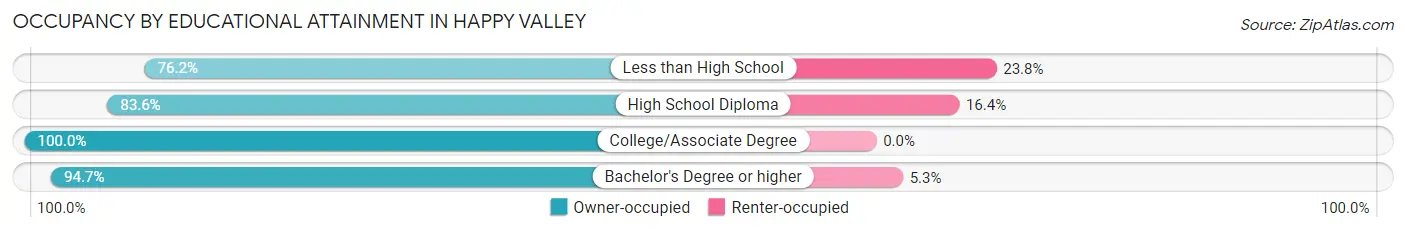
| Household Size | Owner-occupied | Renter-occupied |
| Less than High School | 16 (76.2%) | 5 (23.8%) |
| High School Diploma | 112 (83.6%) | 22 (16.4%) |
| College/Associate Degree | 109 (100.0%) | 0 (0.0%) |
| Bachelor's Degree or higher | 72 (94.7%) | 4 (5.3%) |
Occupancy by Age of Householder in Happy Valley
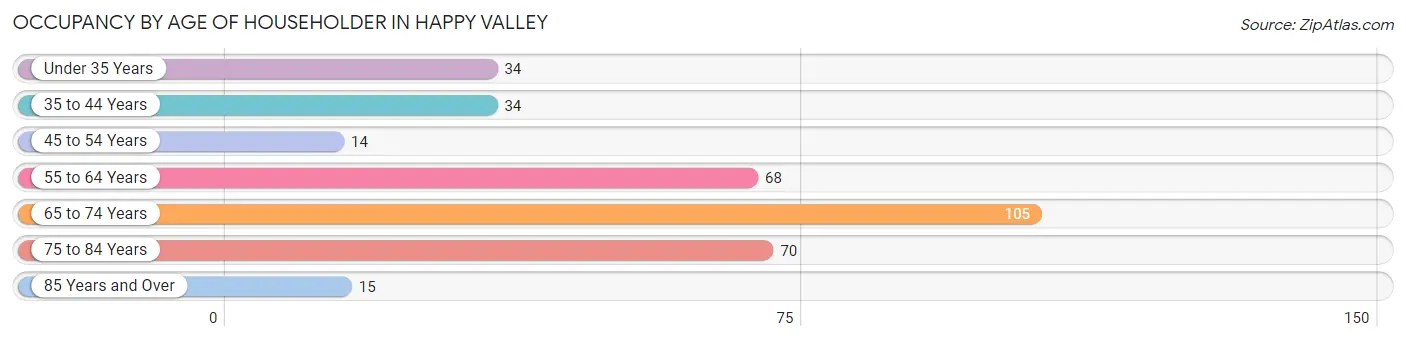
| Age Bracket | # Households | % Households |
| Under 35 Years | 34 | 10.0% |
| 35 to 44 Years | 34 | 10.0% |
| 45 to 54 Years | 14 | 4.1% |
| 55 to 64 Years | 68 | 20.0% |
| 65 to 74 Years | 105 | 30.9% |
| 75 to 84 Years | 70 | 20.6% |
| 85 Years and Over | 15 | 4.4% |
| Total | 340 | 100.0% |
Housing Finances in Happy Valley
Median Income by Occupancy in Happy Valley
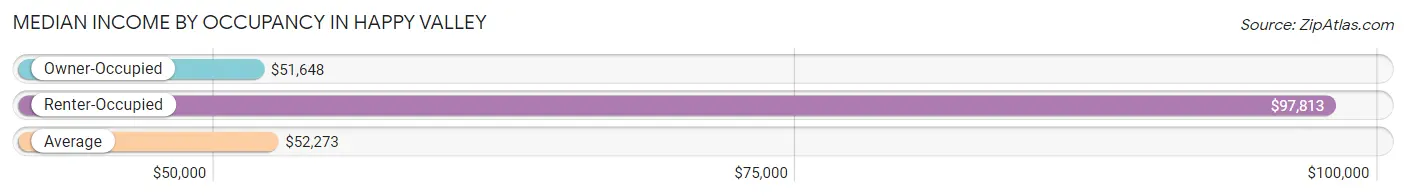
| Occupancy Type | # Households | Median Income |
| Owner-Occupied | 309 (90.9%) | $51,648 |
| Renter-Occupied | 31 (9.1%) | $97,813 |
| Average | 340 (100.0%) | $52,273 |
Occupancy by Householder Income Bracket in Happy Valley
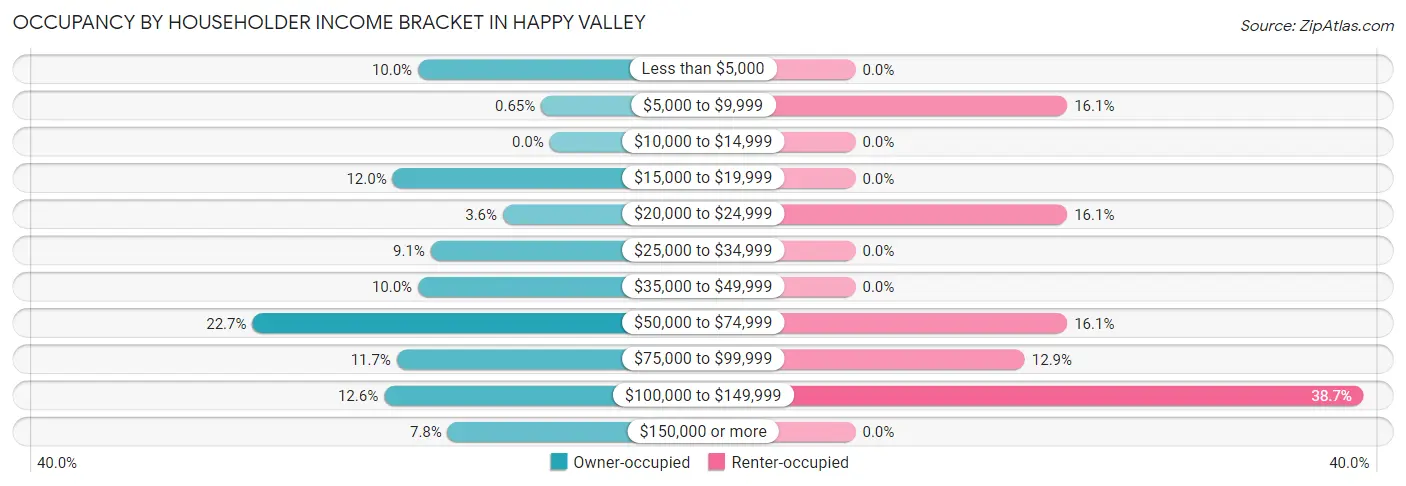
| Income Bracket | Owner-occupied | Renter-occupied |
| Less than $5,000 | 31 (10.0%) | 0 (0.0%) |
| $5,000 to $9,999 | 2 (0.6%) | 5 (16.1%) |
| $10,000 to $14,999 | 0 (0.0%) | 0 (0.0%) |
| $15,000 to $19,999 | 37 (12.0%) | 0 (0.0%) |
| $20,000 to $24,999 | 11 (3.6%) | 5 (16.1%) |
| $25,000 to $34,999 | 28 (9.1%) | 0 (0.0%) |
| $35,000 to $49,999 | 31 (10.0%) | 0 (0.0%) |
| $50,000 to $74,999 | 70 (22.7%) | 5 (16.1%) |
| $75,000 to $99,999 | 36 (11.7%) | 4 (12.9%) |
| $100,000 to $149,999 | 39 (12.6%) | 12 (38.7%) |
| $150,000 or more | 24 (7.8%) | 0 (0.0%) |
| Total | 309 (100.0%) | 31 (100.0%) |
Monthly Housing Cost Tiers in Happy Valley
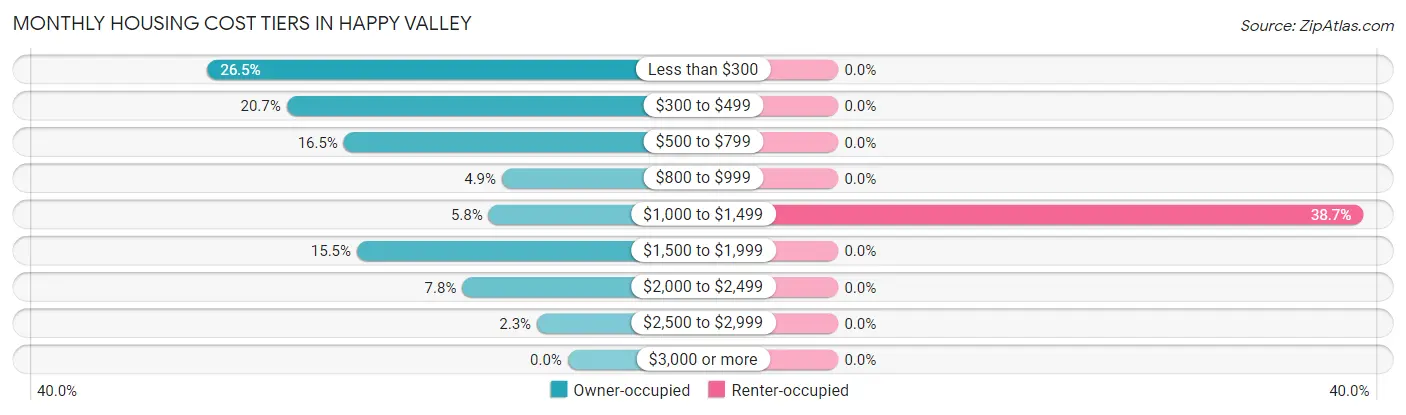
| Monthly Cost | Owner-occupied | Renter-occupied |
| Less than $300 | 82 (26.5%) | 0 (0.0%) |
| $300 to $499 | 64 (20.7%) | 0 (0.0%) |
| $500 to $799 | 51 (16.5%) | 0 (0.0%) |
| $800 to $999 | 15 (4.9%) | 0 (0.0%) |
| $1,000 to $1,499 | 18 (5.8%) | 12 (38.7%) |
| $1,500 to $1,999 | 48 (15.5%) | 0 (0.0%) |
| $2,000 to $2,499 | 24 (7.8%) | 0 (0.0%) |
| $2,500 to $2,999 | 7 (2.3%) | 0 (0.0%) |
| $3,000 or more | 0 (0.0%) | 0 (0.0%) |
| Total | 309 (100.0%) | 31 (100.0%) |
Physical Housing Characteristics in Happy Valley
Housing Structures in Happy Valley
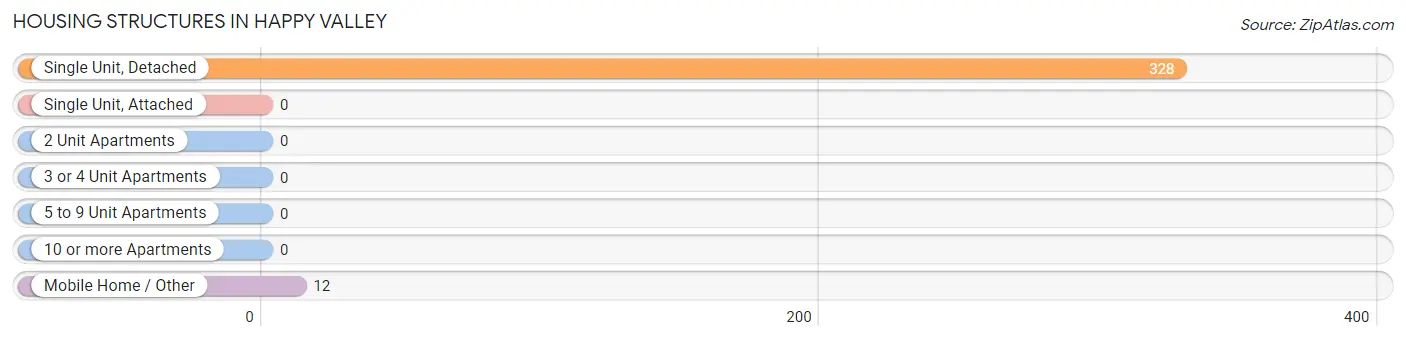
| Structure Type | # Housing Units | % Housing Units |
| Single Unit, Detached | 328 | 96.5% |
| Single Unit, Attached | 0 | 0.0% |
| 2 Unit Apartments | 0 | 0.0% |
| 3 or 4 Unit Apartments | 0 | 0.0% |
| 5 to 9 Unit Apartments | 0 | 0.0% |
| 10 or more Apartments | 0 | 0.0% |
| Mobile Home / Other | 12 | 3.5% |
| Total | 340 | 100.0% |
Housing Structures by Occupancy in Happy Valley
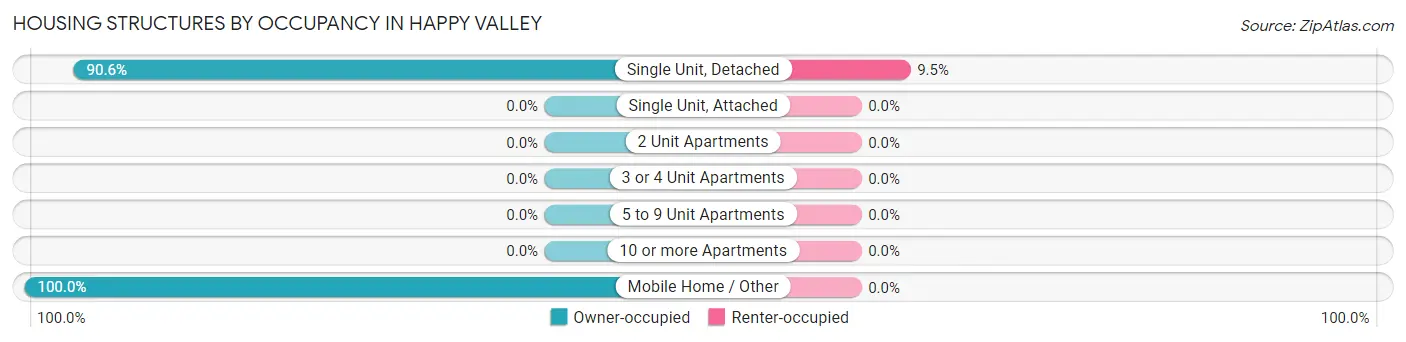
| Structure Type | Owner-occupied | Renter-occupied |
| Single Unit, Detached | 297 (90.5%) | 31 (9.5%) |
| Single Unit, Attached | 0 (0.0%) | 0 (0.0%) |
| 2 Unit Apartments | 0 (0.0%) | 0 (0.0%) |
| 3 or 4 Unit Apartments | 0 (0.0%) | 0 (0.0%) |
| 5 to 9 Unit Apartments | 0 (0.0%) | 0 (0.0%) |
| 10 or more Apartments | 0 (0.0%) | 0 (0.0%) |
| Mobile Home / Other | 12 (100.0%) | 0 (0.0%) |
| Total | 309 (90.9%) | 31 (9.1%) |
Housing Structures by Number of Rooms in Happy Valley
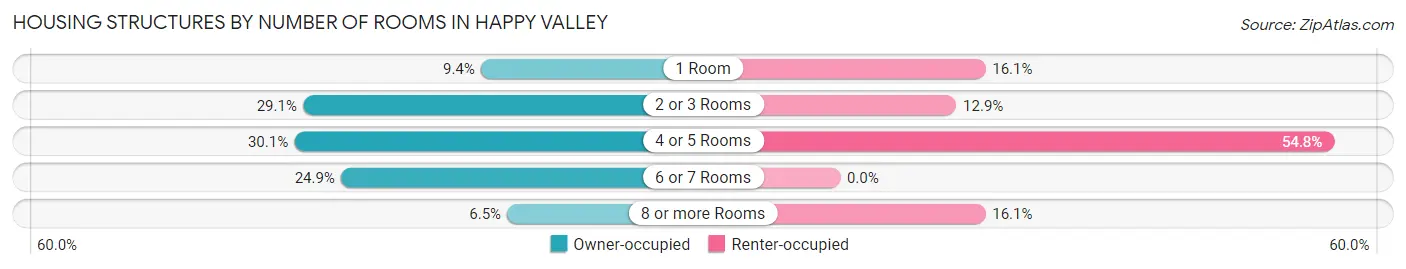
| Number of Rooms | Owner-occupied | Renter-occupied |
| 1 Room | 29 (9.4%) | 5 (16.1%) |
| 2 or 3 Rooms | 90 (29.1%) | 4 (12.9%) |
| 4 or 5 Rooms | 93 (30.1%) | 17 (54.8%) |
| 6 or 7 Rooms | 77 (24.9%) | 0 (0.0%) |
| 8 or more Rooms | 20 (6.5%) | 5 (16.1%) |
| Total | 309 (100.0%) | 31 (100.0%) |
Housing Structure by Heating Type in Happy Valley
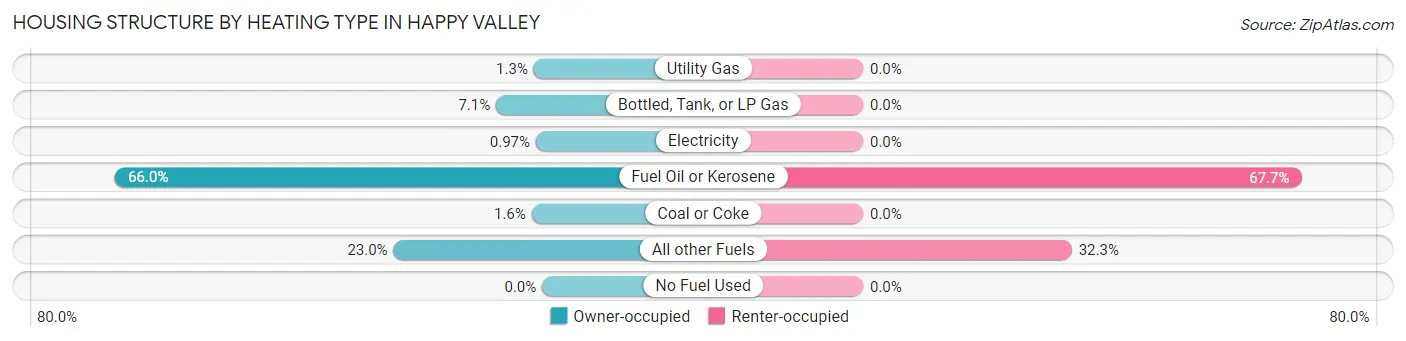
| Heating Type | Owner-occupied | Renter-occupied |
| Utility Gas | 4 (1.3%) | 0 (0.0%) |
| Bottled, Tank, or LP Gas | 22 (7.1%) | 0 (0.0%) |
| Electricity | 3 (1.0%) | 0 (0.0%) |
| Fuel Oil or Kerosene | 204 (66.0%) | 21 (67.7%) |
| Coal or Coke | 5 (1.6%) | 0 (0.0%) |
| All other Fuels | 71 (23.0%) | 10 (32.3%) |
| No Fuel Used | 0 (0.0%) | 0 (0.0%) |
| Total | 309 (100.0%) | 31 (100.0%) |
Household Vehicle Usage in Happy Valley
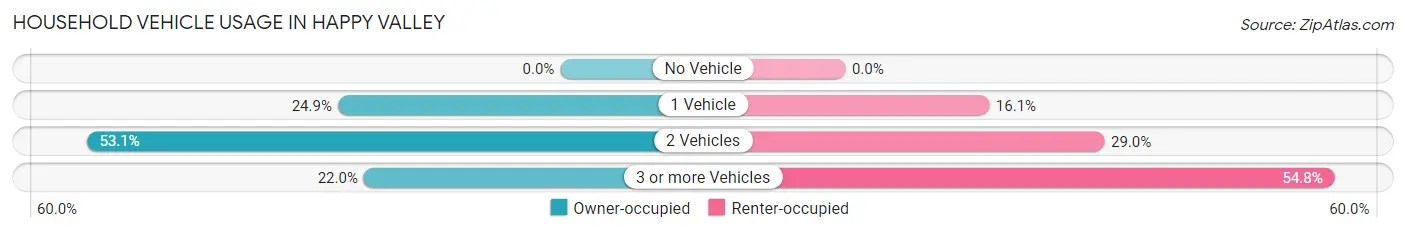
| Vehicles per Household | Owner-occupied | Renter-occupied |
| No Vehicle | 0 (0.0%) | 0 (0.0%) |
| 1 Vehicle | 77 (24.9%) | 5 (16.1%) |
| 2 Vehicles | 164 (53.1%) | 9 (29.0%) |
| 3 or more Vehicles | 68 (22.0%) | 17 (54.8%) |
| Total | 309 (100.0%) | 31 (100.0%) |
Real Estate & Mortgages in Happy Valley
Real Estate and Mortgage Overview in Happy Valley
| Characteristic | Without Mortgage | With Mortgage |
| Housing Units | 197 | 112 |
| Median Property Value | $165,900 | $263,600 |
| Median Household Income | $44,219 | $13 |
| Monthly Housing Costs | $333 | $0 |
| Real Estate Taxes | $759 | $39 |
Property Value by Mortgage Status in Happy Valley
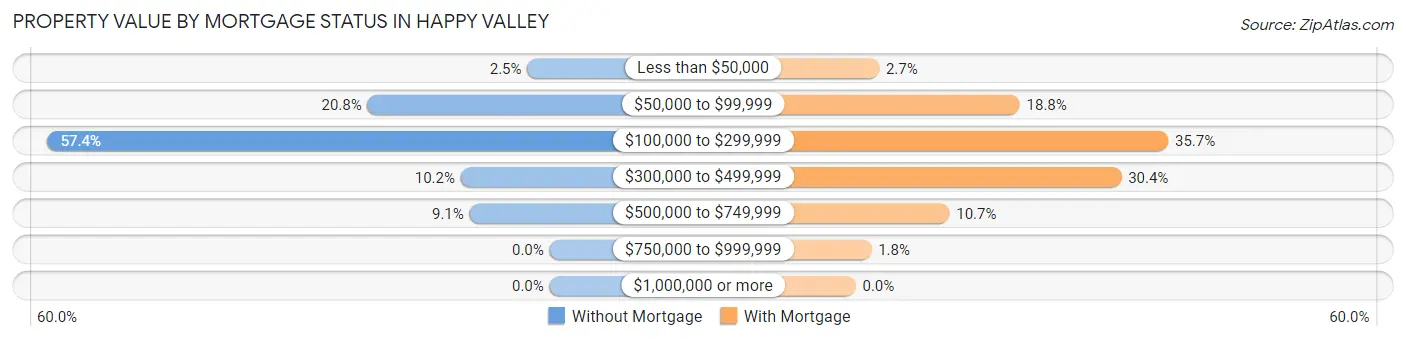
| Property Value | Without Mortgage | With Mortgage |
| Less than $50,000 | 5 (2.5%) | 3 (2.7%) |
| $50,000 to $99,999 | 41 (20.8%) | 21 (18.8%) |
| $100,000 to $299,999 | 113 (57.4%) | 40 (35.7%) |
| $300,000 to $499,999 | 20 (10.2%) | 34 (30.4%) |
| $500,000 to $749,999 | 18 (9.1%) | 12 (10.7%) |
| $750,000 to $999,999 | 0 (0.0%) | 2 (1.8%) |
| $1,000,000 or more | 0 (0.0%) | 0 (0.0%) |
| Total | 197 (100.0%) | 112 (100.0%) |
Household Income by Mortgage Status in Happy Valley
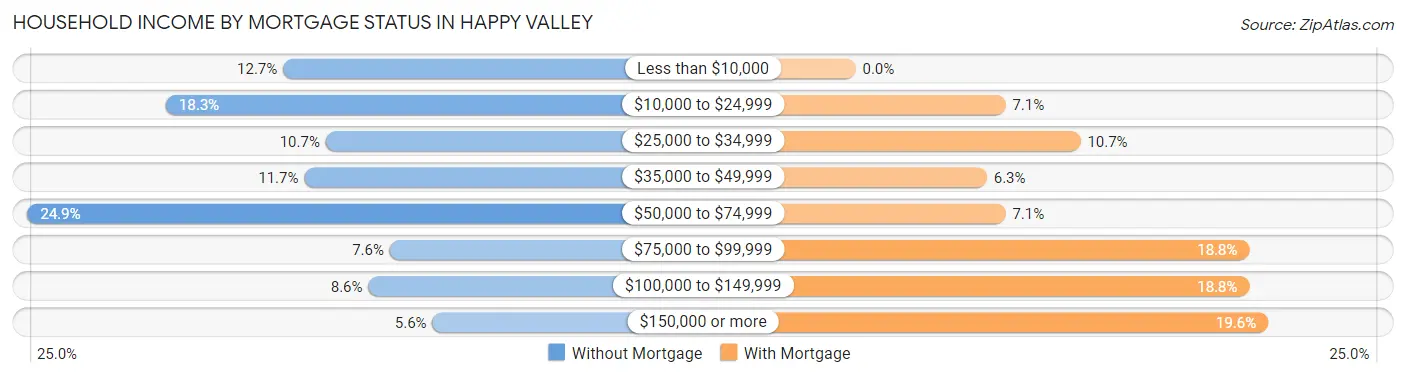
| Household Income | Without Mortgage | With Mortgage |
| Less than $10,000 | 25 (12.7%) | 0 (0.0%) |
| $10,000 to $24,999 | 36 (18.3%) | 8 (7.1%) |
| $25,000 to $34,999 | 21 (10.7%) | 12 (10.7%) |
| $35,000 to $49,999 | 23 (11.7%) | 7 (6.2%) |
| $50,000 to $74,999 | 49 (24.9%) | 8 (7.1%) |
| $75,000 to $99,999 | 15 (7.6%) | 21 (18.8%) |
| $100,000 to $149,999 | 17 (8.6%) | 21 (18.8%) |
| $150,000 or more | 11 (5.6%) | 22 (19.6%) |
| Total | 197 (100.0%) | 112 (100.0%) |
Property Value to Household Income Ratio in Happy Valley
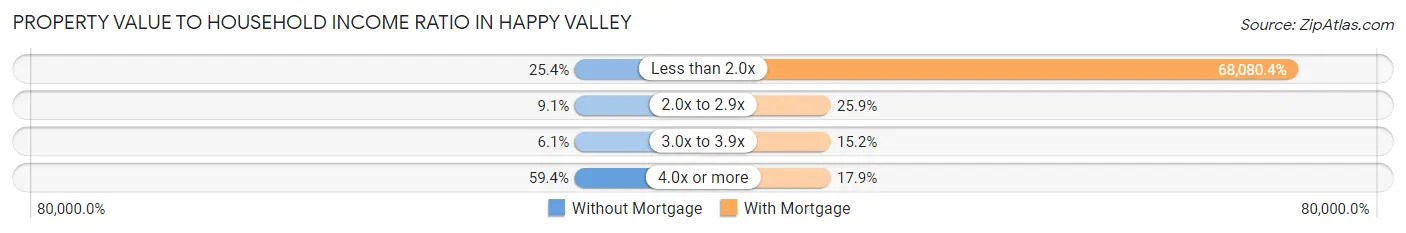
| Value-to-Income Ratio | Without Mortgage | With Mortgage |
| Less than 2.0x | 50 (25.4%) | 76,250 (68,080.4%) |
| 2.0x to 2.9x | 18 (9.1%) | 29 (25.9%) |
| 3.0x to 3.9x | 12 (6.1%) | 17 (15.2%) |
| 4.0x or more | 117 (59.4%) | 20 (17.9%) |
| Total | 197 (100.0%) | 112 (100.0%) |
Real Estate Taxes by Mortgage Status in Happy Valley
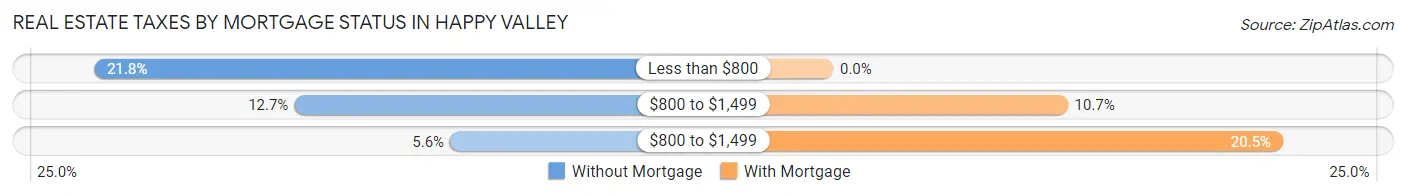
| Property Taxes | Without Mortgage | With Mortgage |
| Less than $800 | 43 (21.8%) | 0 (0.0%) |
| $800 to $1,499 | 25 (12.7%) | 12 (10.7%) |
| $800 to $1,499 | 11 (5.6%) | 23 (20.5%) |
| Total | 197 (100.0%) | 112 (100.0%) |
Health & Disability in Happy Valley
Health Insurance Coverage by Age in Happy Valley
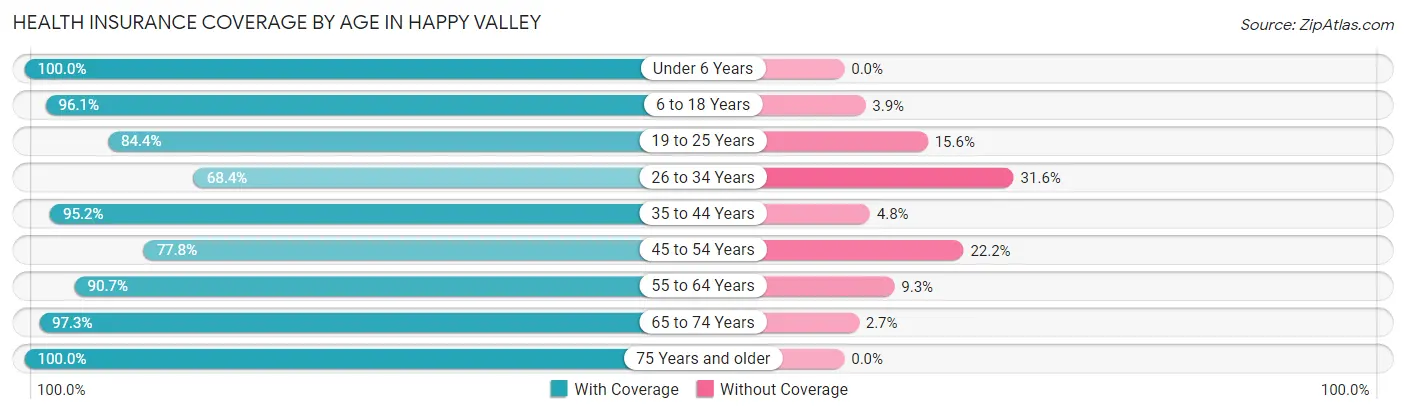
| Age Bracket | With Coverage | Without Coverage |
| Under 6 Years | 40 (100.0%) | 0 (0.0%) |
| 6 to 18 Years | 98 (96.1%) | 4 (3.9%) |
| 19 to 25 Years | 38 (84.4%) | 7 (15.6%) |
| 26 to 34 Years | 26 (68.4%) | 12 (31.6%) |
| 35 to 44 Years | 60 (95.2%) | 3 (4.8%) |
| 45 to 54 Years | 28 (77.8%) | 8 (22.2%) |
| 55 to 64 Years | 136 (90.7%) | 14 (9.3%) |
| 65 to 74 Years | 144 (97.3%) | 4 (2.7%) |
| 75 Years and older | 126 (100.0%) | 0 (0.0%) |
| Total | 696 (93.0%) | 52 (7.0%) |
Health Insurance Coverage by Citizenship Status in Happy Valley
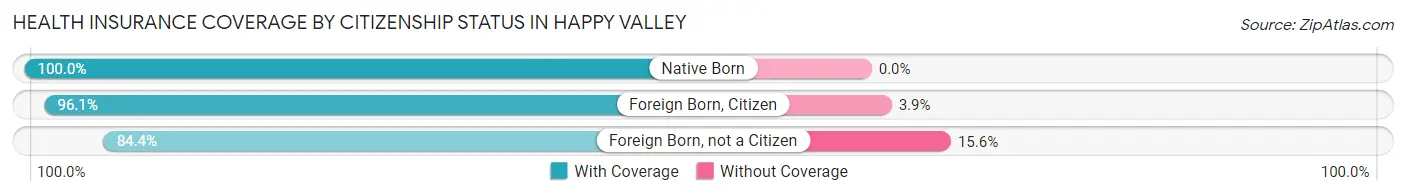
| Citizenship Status | With Coverage | Without Coverage |
| Native Born | 40 (100.0%) | 0 (0.0%) |
| Foreign Born, Citizen | 98 (96.1%) | 4 (3.9%) |
| Foreign Born, not a Citizen | 38 (84.4%) | 7 (15.6%) |
Health Insurance Coverage by Household Income in Happy Valley
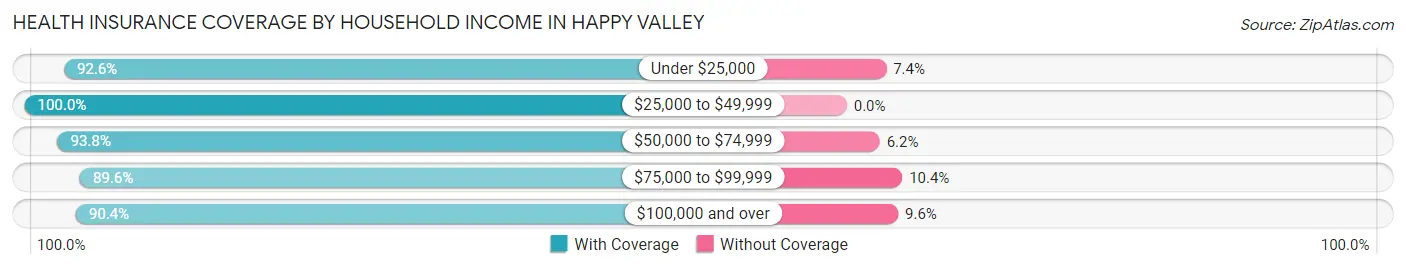
| Household Income | With Coverage | Without Coverage |
| Under $25,000 | 113 (92.6%) | 9 (7.4%) |
| $25,000 to $49,999 | 129 (100.0%) | 0 (0.0%) |
| $50,000 to $74,999 | 152 (93.8%) | 10 (6.2%) |
| $75,000 to $99,999 | 95 (89.6%) | 11 (10.4%) |
| $100,000 and over | 207 (90.4%) | 22 (9.6%) |
Public vs Private Health Insurance Coverage by Age in Happy Valley
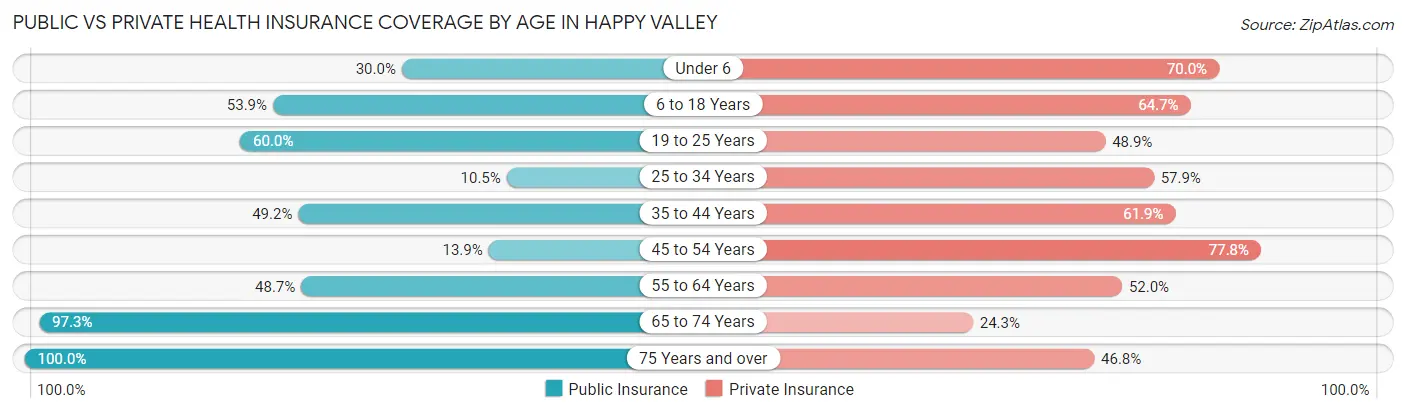
| Age Bracket | Public Insurance | Private Insurance |
| Under 6 | 12 (30.0%) | 28 (70.0%) |
| 6 to 18 Years | 55 (53.9%) | 66 (64.7%) |
| 19 to 25 Years | 27 (60.0%) | 22 (48.9%) |
| 25 to 34 Years | 4 (10.5%) | 22 (57.9%) |
| 35 to 44 Years | 31 (49.2%) | 39 (61.9%) |
| 45 to 54 Years | 5 (13.9%) | 28 (77.8%) |
| 55 to 64 Years | 73 (48.7%) | 78 (52.0%) |
| 65 to 74 Years | 144 (97.3%) | 36 (24.3%) |
| 75 Years and over | 126 (100.0%) | 59 (46.8%) |
| Total | 477 (63.8%) | 378 (50.5%) |
Disability Status by Sex by Age in Happy Valley
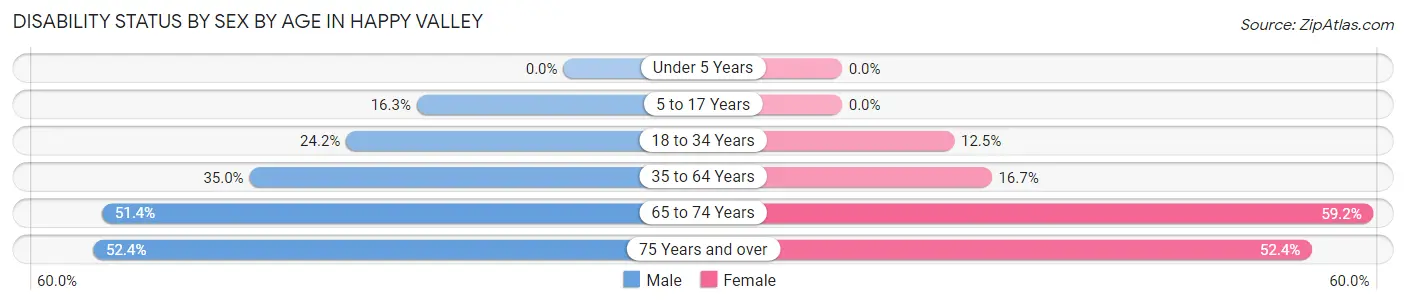
| Age Bracket | Male | Female |
| Under 5 Years | 0 (0.0%) | 0 (0.0%) |
| 5 to 17 Years | 8 (16.3%) | 0 (0.0%) |
| 18 to 34 Years | 15 (24.2%) | 4 (12.5%) |
| 35 to 64 Years | 43 (35.0%) | 21 (16.7%) |
| 65 to 74 Years | 37 (51.4%) | 45 (59.2%) |
| 75 Years and over | 33 (52.4%) | 33 (52.4%) |
Disability Class by Sex by Age in Happy Valley
Disability Class: Hearing Difficulty
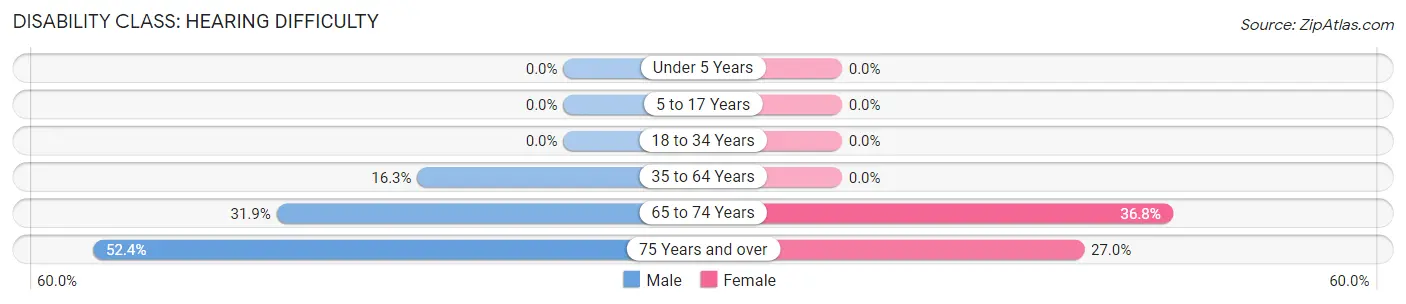
| Age Bracket | Male | Female |
| Under 5 Years | 0 (0.0%) | 0 (0.0%) |
| 5 to 17 Years | 0 (0.0%) | 0 (0.0%) |
| 18 to 34 Years | 0 (0.0%) | 0 (0.0%) |
| 35 to 64 Years | 20 (16.3%) | 0 (0.0%) |
| 65 to 74 Years | 23 (31.9%) | 28 (36.8%) |
| 75 Years and over | 33 (52.4%) | 17 (27.0%) |
Disability Class: Vision Difficulty
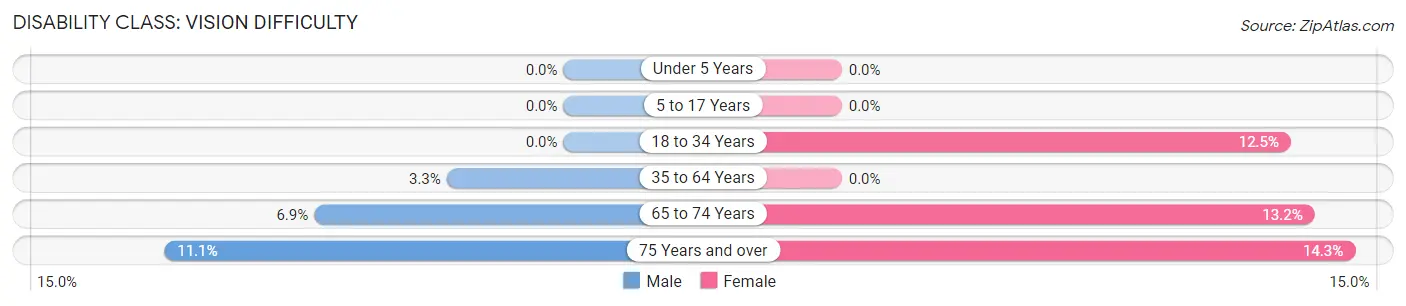
| Age Bracket | Male | Female |
| Under 5 Years | 0 (0.0%) | 0 (0.0%) |
| 5 to 17 Years | 0 (0.0%) | 0 (0.0%) |
| 18 to 34 Years | 0 (0.0%) | 4 (12.5%) |
| 35 to 64 Years | 4 (3.3%) | 0 (0.0%) |
| 65 to 74 Years | 5 (6.9%) | 10 (13.2%) |
| 75 Years and over | 7 (11.1%) | 9 (14.3%) |
Disability Class: Cognitive Difficulty
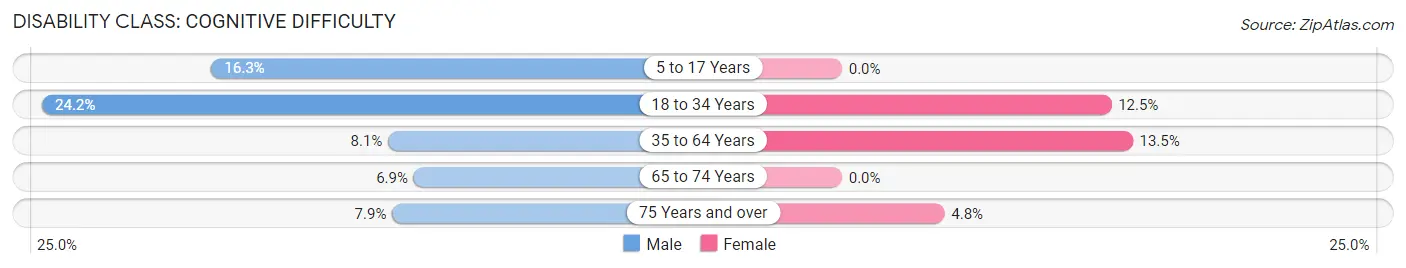
| Age Bracket | Male | Female |
| 5 to 17 Years | 8 (16.3%) | 0 (0.0%) |
| 18 to 34 Years | 15 (24.2%) | 4 (12.5%) |
| 35 to 64 Years | 10 (8.1%) | 17 (13.5%) |
| 65 to 74 Years | 5 (6.9%) | 0 (0.0%) |
| 75 Years and over | 5 (7.9%) | 3 (4.8%) |
Disability Class: Ambulatory Difficulty
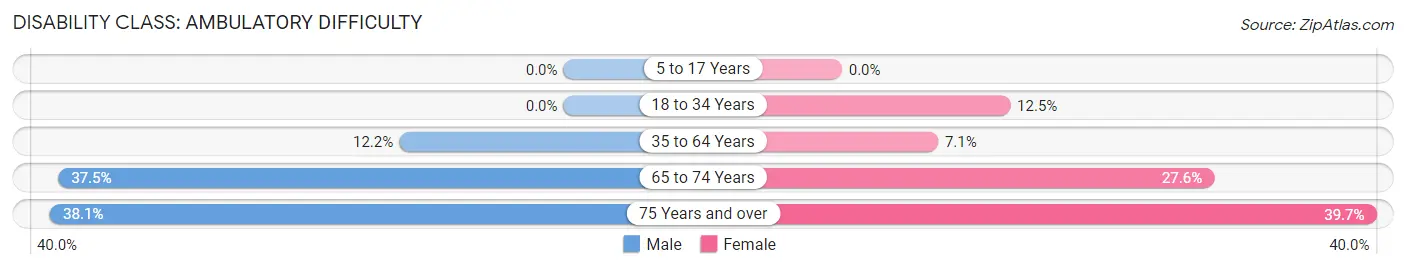
| Age Bracket | Male | Female |
| 5 to 17 Years | 0 (0.0%) | 0 (0.0%) |
| 18 to 34 Years | 0 (0.0%) | 4 (12.5%) |
| 35 to 64 Years | 15 (12.2%) | 9 (7.1%) |
| 65 to 74 Years | 27 (37.5%) | 21 (27.6%) |
| 75 Years and over | 24 (38.1%) | 25 (39.7%) |
Disability Class: Self-Care Difficulty
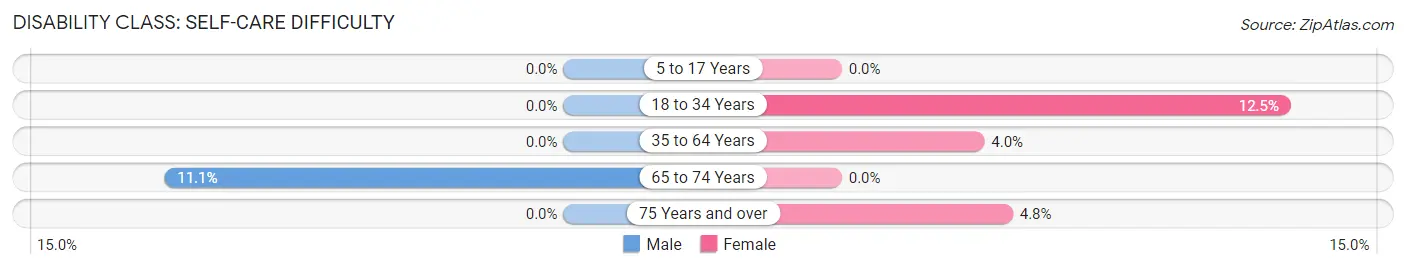
| Age Bracket | Male | Female |
| 5 to 17 Years | 0 (0.0%) | 0 (0.0%) |
| 18 to 34 Years | 0 (0.0%) | 4 (12.5%) |
| 35 to 64 Years | 0 (0.0%) | 5 (4.0%) |
| 65 to 74 Years | 8 (11.1%) | 0 (0.0%) |
| 75 Years and over | 0 (0.0%) | 3 (4.8%) |
Technology Access in Happy Valley
Computing Device Access in Happy Valley
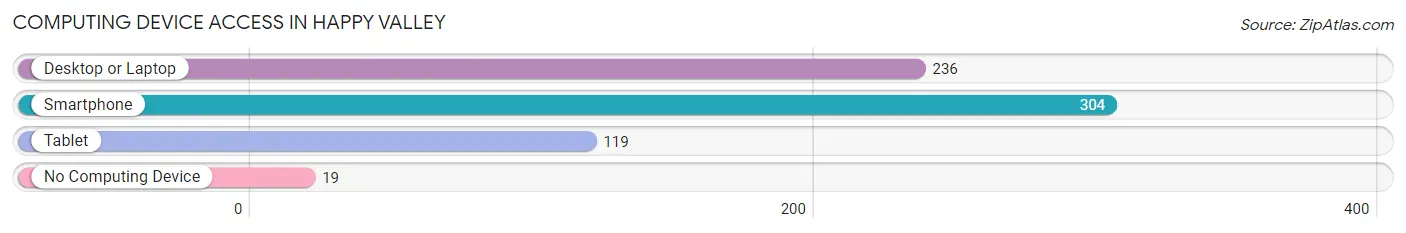
| Device Type | # Households | % Households |
| Desktop or Laptop | 236 | 69.4% |
| Smartphone | 304 | 89.4% |
| Tablet | 119 | 35.0% |
| No Computing Device | 19 | 5.6% |
| Total | 340 | 100.0% |
Internet Access in Happy Valley
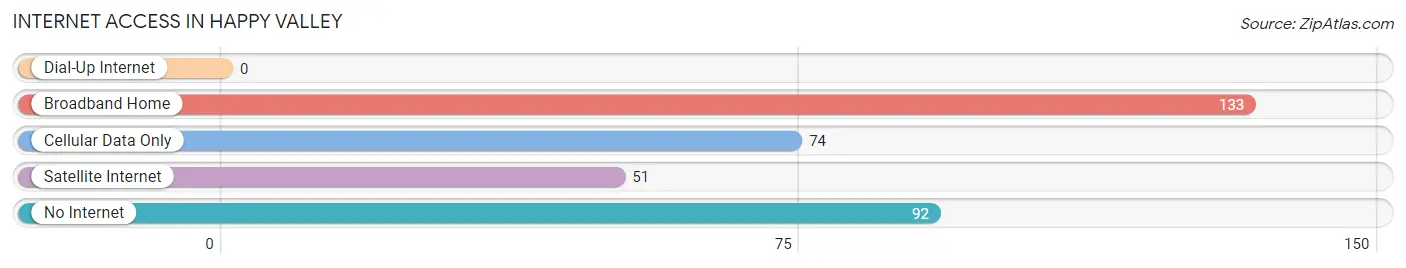
| Internet Type | # Households | % Households |
| Dial-Up Internet | 0 | 0.0% |
| Broadband Home | 133 | 39.1% |
| Cellular Data Only | 74 | 21.8% |
| Satellite Internet | 51 | 15.0% |
| No Internet | 92 | 27.1% |
| Total | 340 | 100.0% |
Happy Valley Summary
History
Happy Valley is a small unincorporated community located in the Matanuska-Susitna Borough of Alaska. It is located on the south side of the Knik Arm of Cook Inlet, about 25 miles northeast of Anchorage. The area was first settled in the early 1900s by homesteaders who were attracted to the area by its abundant natural resources. The community was originally known as "Happy Valley Settlement" and was later shortened to "Happy Valley".
The area was first explored by Russian fur traders in the late 1700s. In the early 1900s, the area was settled by homesteaders who were attracted to the area by its abundant natural resources. The homesteaders built cabins and cleared land for farming and ranching. The area was also known for its coal mining operations, which began in the early 1900s and continued until the late 1950s.
The community was officially incorporated in 1953 and has since grown to include a population of approximately 1,000 people. The community is served by a post office, a general store, a gas station, and a few restaurants.
Geography
Happy Valley is located in the Matanuska-Susitna Borough of Alaska. It is situated on the south side of the Knik Arm of Cook Inlet, about 25 miles northeast of Anchorage. The area is characterized by rolling hills, forests, and wetlands. The climate is generally mild, with temperatures ranging from the mid-30s in the winter to the mid-60s in the summer.
The area is home to a variety of wildlife, including moose, bear, and caribou. The nearby Knik River is a popular destination for fishing and boating.
Economy
The economy of Happy Valley is largely based on tourism and recreation. The area is home to several popular tourist attractions, including the Knik River, the Knik Glacier, and the Matanuska Glacier. The area is also popular for its outdoor activities, such as fishing, hunting, and camping.
The area is also home to several small businesses, including restaurants, gas stations, and general stores. The community is also home to a post office and a few small manufacturing businesses.
Demographics
As of the 2010 census, the population of Happy Valley was 1,000. The racial makeup of the community was 95.2% White, 0.7% Native American, 0.7% Asian, 0.3% Pacific Islander, 0.3% from other races, and 2.1% from two or more races. The median household income was $50,000, and the median family income was $55,000. The per capita income was $25,000.
Conclusion
Happy Valley is a small unincorporated community located in the Matanuska-Susitna Borough of Alaska. It is situated on the south side of the Knik Arm of Cook Inlet, about 25 miles northeast of Anchorage. The area was first settled in the early 1900s by homesteaders who were attracted to the area by its abundant natural resources. The economy of Happy Valley is largely based on tourism and recreation, and the area is home to a population of approximately 1,000 people. The area is characterized by rolling hills, forests, and wetlands, and is home to a variety of wildlife. The community is served by a post office, a general store, a gas station, and a few restaurants.
Common Questions
What is Per Capita Income in Happy Valley?
Per Capita income in Happy Valley is $33,440.
What is the Median Family Income in Happy Valley?
Median Family Income in Happy Valley is $67,857.
What is the Median Household income in Happy Valley?
Median Household Income in Happy Valley is $52,273.
What is Income or Wage Gap in Happy Valley?
Income or Wage Gap in Happy Valley is 48.5%.
Women in Happy Valley earn 51.5 cents for every dollar earned by a man.
What is Family Income Deficit in Happy Valley?
Family Income Deficit in Happy Valley is $3,277.
Families that are below poverty line in Happy Valley earn $3,277 less on average than the poverty threshold level.
What is Inequality or Gini Index in Happy Valley?
Inequality or Gini Index in Happy Valley is 0.47.
What is the Total Population of Happy Valley?
Total Population of Happy Valley is 748.
What is the Total Male Population of Happy Valley?
Total Male Population of Happy Valley is 401.
What is the Total Female Population of Happy Valley?
Total Female Population of Happy Valley is 347.
What is the Ratio of Males per 100 Females in Happy Valley?
There are 115.56 Males per 100 Females in Happy Valley.
What is the Ratio of Females per 100 Males in Happy Valley?
There are 86.53 Females per 100 Males in Happy Valley.
What is the Median Population Age in Happy Valley?
Median Population Age in Happy Valley is 58.5 Years.
What is the Average Family Size in Happy Valley
Average Family Size in Happy Valley is 3.0 People.
What is the Average Household Size in Happy Valley
Average Household Size in Happy Valley is 2.2 People.
How Large is the Labor Force in Happy Valley?
There are 244 People in the Labor Forcein in Happy Valley.
What is the Percentage of People in the Labor Force in Happy Valley?
38.8% of People are in the Labor Force in Happy Valley.
What is the Unemployment Rate in Happy Valley?
Unemployment Rate in Happy Valley is 8.2%.