Waimea CDP Hawaii County, HI Map & Demographics
Waimea CDP Hawaii County Overview
$45,188
PER CAPITA INCOME
$126,107
AVG FAMILY INCOME
$100,075
AVG HOUSEHOLD INCOME
23.3%
WAGE / INCOME GAP [ % ]
76.7¢/ $1
WAGE / INCOME GAP [ $ ]
$7,490
FAMILY INCOME DEFICIT
0.48
INEQUALITY / GINI INDEX
10,458
TOTAL POPULATION
5,001
MALE POPULATION
5,457
FEMALE POPULATION
91.64
MALES / 100 FEMALES
109.12
FEMALES / 100 MALES
38.4
MEDIAN AGE
3.5
AVG FAMILY SIZE
2.9
AVG HOUSEHOLD SIZE
5,415
LABOR FORCE [ PEOPLE ]
67.7%
PERCENT IN LABOR FORCE
5.7%
UNEMPLOYMENT RATE
Income in Waimea CDP Hawaii County
Income Overview in Waimea CDP Hawaii County
Per Capita Income in Waimea CDP Hawaii County is $45,188, while median incomes of families and households are $126,107 and $100,075 respectively.
| Characteristic | Number | Measure |
| Per Capita Income | 10,458 | $45,188 |
| Median Family Income | 2,444 | $126,107 |
| Mean Family Income | 2,444 | $151,814 |
| Median Household Income | 3,588 | $100,075 |
| Mean Household Income | 3,588 | $127,766 |
| Income Deficit | 2,444 | $7,490 |
| Wage / Income Gap (%) | 10,458 | 23.31% |
| Wage / Income Gap ($) | 10,458 | 76.69¢ per $1 |
| Gini / Inequality Index | 10,458 | 0.48 |
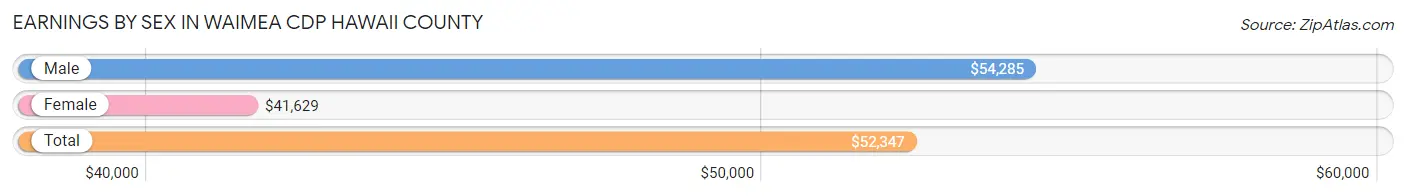
Earnings by Sex in Waimea CDP Hawaii County
Average Earnings in Waimea CDP Hawaii County are $52,347, $54,285 for men and $41,629 for women, a difference of 23.3%.
| Sex | Number | Average Earnings |
| Male | 2,575 (46.4%) | $54,285 |
| Female | 2,972 (53.6%) | $41,629 |
| Total | 5,547 (100.0%) | $52,347 |
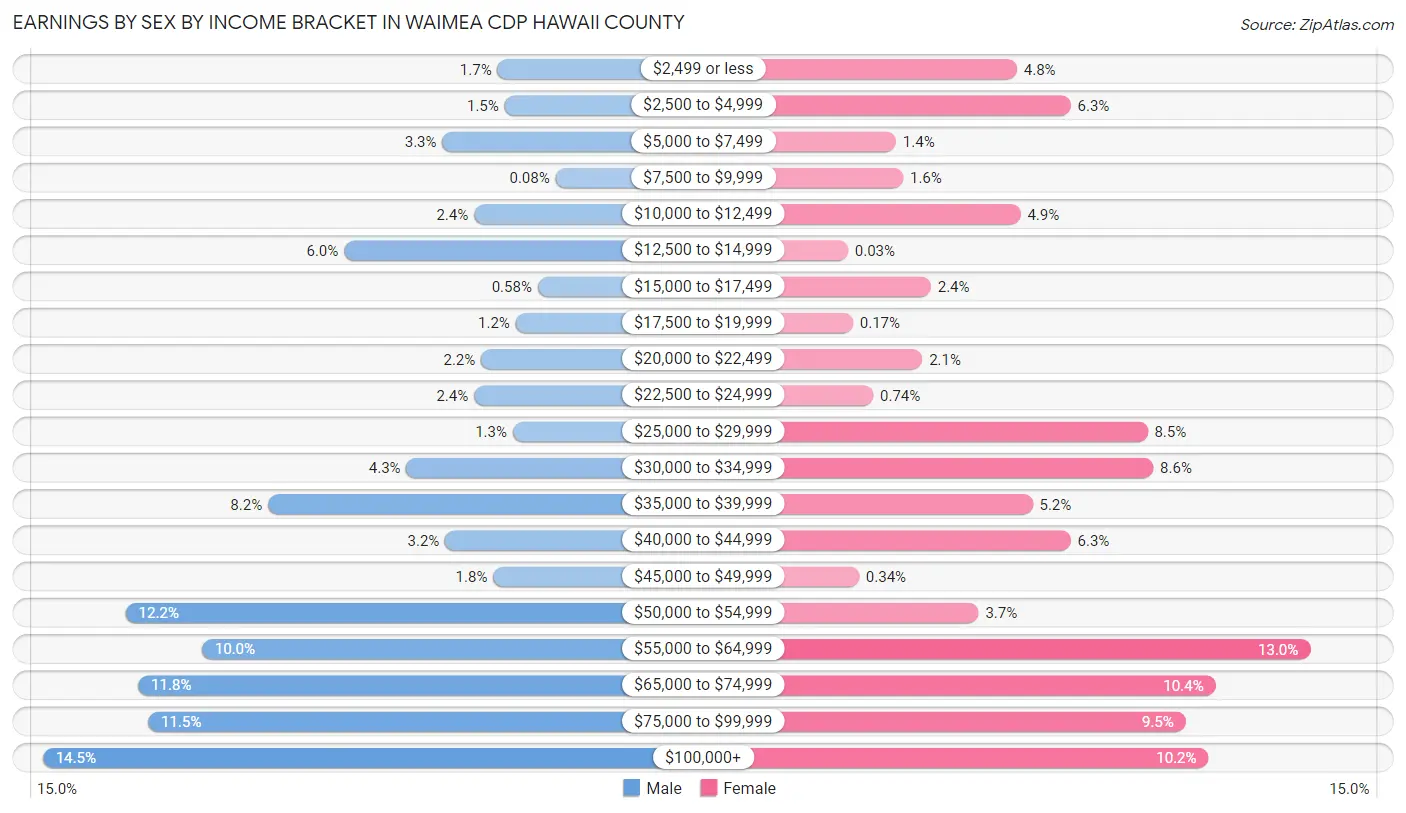
Earnings by Sex by Income Bracket in Waimea CDP Hawaii County
The most common earnings brackets in Waimea CDP Hawaii County are $100,000+ for men (373 | 14.5%) and $55,000 to $64,999 for women (387 | 13.0%).
| Income | Male | Female |
| $2,499 or less | 44 (1.7%) | 142 (4.8%) |
| $2,500 to $4,999 | 39 (1.5%) | 187 (6.3%) |
| $5,000 to $7,499 | 84 (3.3%) | 41 (1.4%) |
| $7,500 to $9,999 | 2 (0.1%) | 47 (1.6%) |
| $10,000 to $12,499 | 61 (2.4%) | 145 (4.9%) |
| $12,500 to $14,999 | 155 (6.0%) | 1 (0.0%) |
| $15,000 to $17,499 | 15 (0.6%) | 70 (2.4%) |
| $17,500 to $19,999 | 31 (1.2%) | 5 (0.2%) |
| $20,000 to $22,499 | 56 (2.2%) | 63 (2.1%) |
| $22,500 to $24,999 | 61 (2.4%) | 22 (0.7%) |
| $25,000 to $29,999 | 33 (1.3%) | 251 (8.5%) |
| $30,000 to $34,999 | 110 (4.3%) | 256 (8.6%) |
| $35,000 to $39,999 | 210 (8.2%) | 155 (5.2%) |
| $40,000 to $44,999 | 82 (3.2%) | 187 (6.3%) |
| $45,000 to $49,999 | 47 (1.8%) | 10 (0.3%) |
| $50,000 to $54,999 | 313 (12.2%) | 110 (3.7%) |
| $55,000 to $64,999 | 258 (10.0%) | 387 (13.0%) |
| $65,000 to $74,999 | 304 (11.8%) | 308 (10.4%) |
| $75,000 to $99,999 | 297 (11.5%) | 283 (9.5%) |
| $100,000+ | 373 (14.5%) | 302 (10.2%) |
| Total | 2,575 (100.0%) | 2,972 (100.0%) |
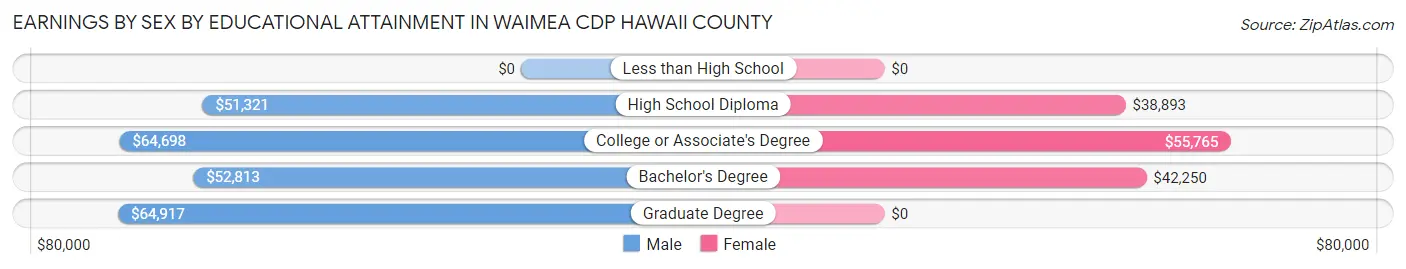
Earnings by Sex by Educational Attainment in Waimea CDP Hawaii County
Average earnings in Waimea CDP Hawaii County are $54,285 for men and $43,672 for women, a difference of 19.6%. Men with an educational attainment of graduate degree enjoy the highest average annual earnings of $64,917, while those with high school diploma education earn the least with $51,321. Women with an educational attainment of college or associate's degree earn the most with the average annual earnings of $55,765, while those with high school diploma education have the smallest earnings of $38,893.
| Educational Attainment | Male Income | Female Income |
| Less than High School | - | - |
| High School Diploma | $51,321 | $38,893 |
| College or Associate's Degree | $64,698 | $55,765 |
| Bachelor's Degree | $52,813 | $42,250 |
| Graduate Degree | $64,917 | $0 |
| Total | $54,285 | $43,672 |
Family Income in Waimea CDP Hawaii County
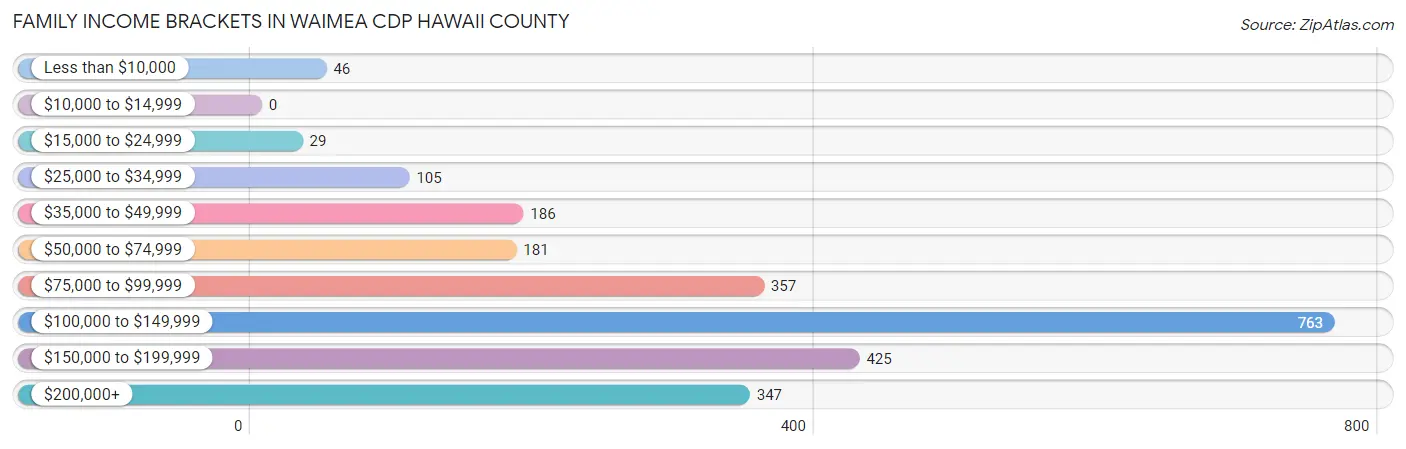
Family Income Brackets in Waimea CDP Hawaii County
According to the Waimea CDP Hawaii County family income data, there are 763 families falling into the $100,000 to $149,999 income range, which is the most common income bracket and makes up 31.2% of all families.
| Income Bracket | # Families | % Families |
| Less than $10,000 | 46 | 1.9% |
| $10,000 to $14,999 | 0 | 0.0% |
| $15,000 to $24,999 | 29 | 1.2% |
| $25,000 to $34,999 | 105 | 4.3% |
| $35,000 to $49,999 | 186 | 7.6% |
| $50,000 to $74,999 | 181 | 7.4% |
| $75,000 to $99,999 | 357 | 14.6% |
| $100,000 to $149,999 | 763 | 31.2% |
| $150,000 to $199,999 | 425 | 17.4% |
| $200,000+ | 347 | 14.2% |
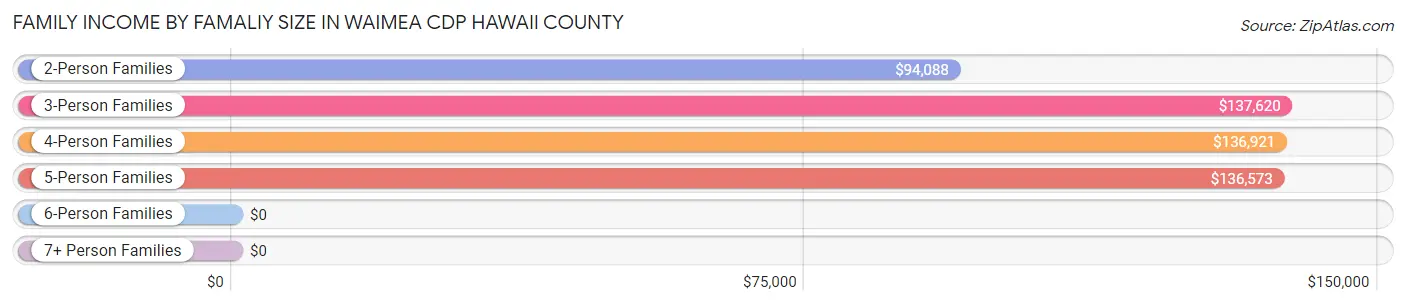
Family Income by Famaliy Size in Waimea CDP Hawaii County
3-person families (619 | 25.3%) account for the highest median family income in Waimea CDP Hawaii County with $137,620 per family, while 2-person families (943 | 38.6%) have the highest median income of $47,044 per family member.
| Income Bracket | # Families | Median Income |
| 2-Person Families | 943 (38.6%) | $94,088 |
| 3-Person Families | 619 (25.3%) | $137,620 |
| 4-Person Families | 407 (16.7%) | $136,921 |
| 5-Person Families | 259 (10.6%) | $136,573 |
| 6-Person Families | 68 (2.8%) | $0 |
| 7+ Person Families | 148 (6.1%) | $0 |
| Total | 2,444 (100.0%) | $126,107 |
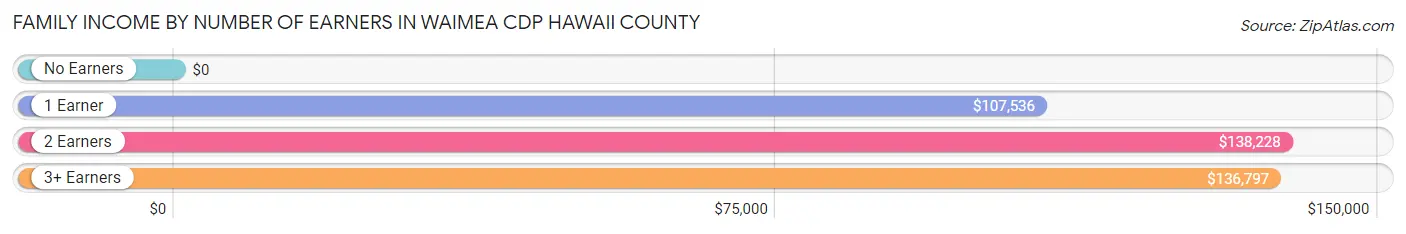
Family Income by Number of Earners in Waimea CDP Hawaii County
| Number of Earners | # Families | Median Income |
| No Earners | 235 (9.6%) | $0 |
| 1 Earner | 901 (36.9%) | $107,536 |
| 2 Earners | 989 (40.5%) | $138,228 |
| 3+ Earners | 319 (13.1%) | $136,797 |
| Total | 2,444 (100.0%) | $126,107 |
Household Income in Waimea CDP Hawaii County
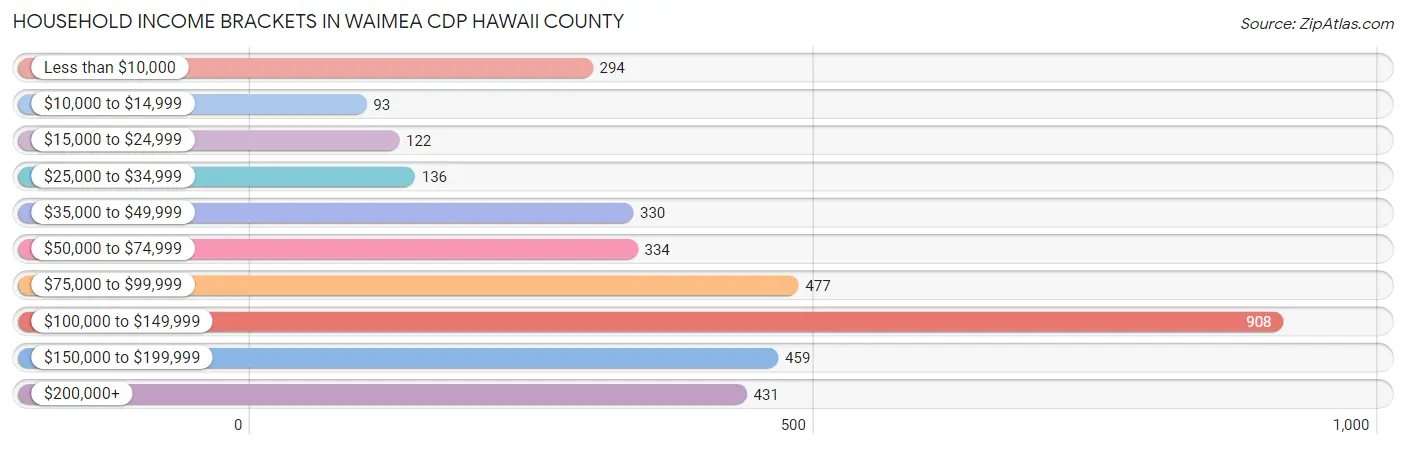
Household Income Brackets in Waimea CDP Hawaii County
With 908 households falling in the category, the $100,000 to $149,999 income range is the most frequent in Waimea CDP Hawaii County, accounting for 25.3% of all households. In contrast, only 93 households (2.6%) fall into the $10,000 to $14,999 income bracket, making it the least populous group.
| Income Bracket | # Households | % Households |
| Less than $10,000 | 294 | 8.2% |
| $10,000 to $14,999 | 93 | 2.6% |
| $15,000 to $24,999 | 122 | 3.4% |
| $25,000 to $34,999 | 136 | 3.8% |
| $35,000 to $49,999 | 330 | 9.2% |
| $50,000 to $74,999 | 334 | 9.3% |
| $75,000 to $99,999 | 477 | 13.3% |
| $100,000 to $149,999 | 908 | 25.3% |
| $150,000 to $199,999 | 459 | 12.8% |
| $200,000+ | 431 | 12.0% |
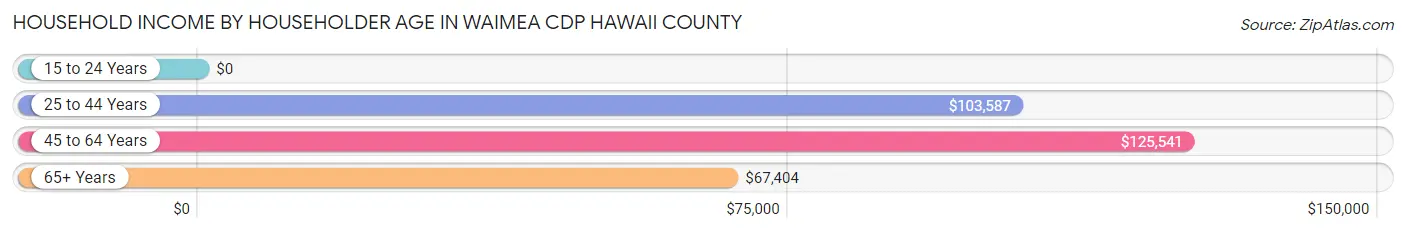
Household Income by Householder Age in Waimea CDP Hawaii County
The median household income in Waimea CDP Hawaii County is $100,075, with the highest median household income of $125,541 found in the 45 to 64 years age bracket for the primary householder. A total of 991 households (27.6%) fall into this category. Meanwhile, the 15 to 24 years age bracket for the primary householder has the lowest median household income of $0, with 21 households (0.6%) in this group.
| Income Bracket | # Households | Median Income |
| 15 to 24 Years | 21 (0.6%) | $0 |
| 25 to 44 Years | 1,430 (39.9%) | $103,587 |
| 45 to 64 Years | 991 (27.6%) | $125,541 |
| 65+ Years | 1,146 (31.9%) | $67,404 |
| Total | 3,588 (100.0%) | $100,075 |
Poverty in Waimea CDP Hawaii County
Income Below Poverty by Sex and Age in Waimea CDP Hawaii County
With 7.7% poverty level for males and 17.6% for females among the residents of Waimea CDP Hawaii County, 6 to 11 year old males and 12 to 14 year old females are the most vulnerable to poverty, with 139 males (27.6%) and 89 females (60.5%) in their respective age groups living below the poverty level.
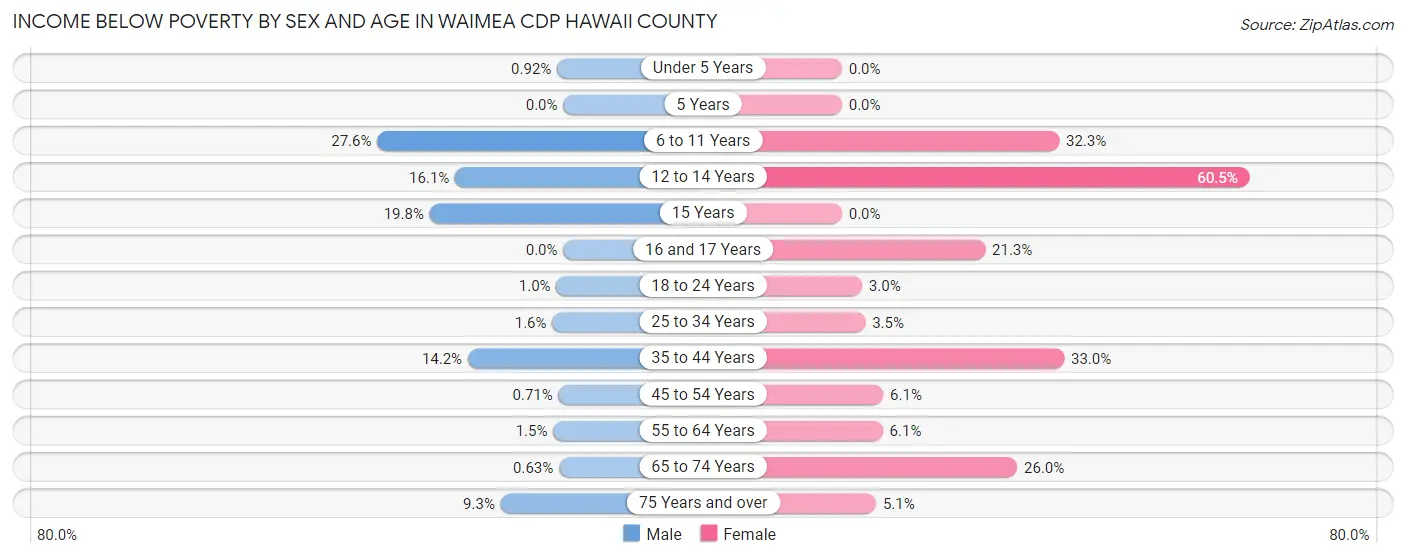
| Age Bracket | Male | Female |
| Under 5 Years | 5 (0.9%) | 0 (0.0%) |
| 5 Years | 0 (0.0%) | 0 (0.0%) |
| 6 to 11 Years | 139 (27.6%) | 191 (32.3%) |
| 12 to 14 Years | 18 (16.1%) | 89 (60.5%) |
| 15 Years | 49 (19.8%) | 0 (0.0%) |
| 16 and 17 Years | 0 (0.0%) | 50 (21.3%) |
| 18 to 24 Years | 2 (1.0%) | 4 (3.0%) |
| 25 to 34 Years | 8 (1.6%) | 25 (3.5%) |
| 35 to 44 Years | 109 (14.2%) | 330 (33.0%) |
| 45 to 54 Years | 5 (0.7%) | 35 (6.1%) |
| 55 to 64 Years | 6 (1.5%) | 39 (6.1%) |
| 65 to 74 Years | 3 (0.6%) | 170 (26.0%) |
| 75 Years and over | 40 (9.3%) | 25 (5.1%) |
| Total | 384 (7.7%) | 958 (17.6%) |
Income Above Poverty by Sex and Age in Waimea CDP Hawaii County
According to the poverty statistics in Waimea CDP Hawaii County, males aged 5 years and females aged under 5 years are the age groups that are most secure financially, with 100.0% of males and 100.0% of females in these age groups living above the poverty line.
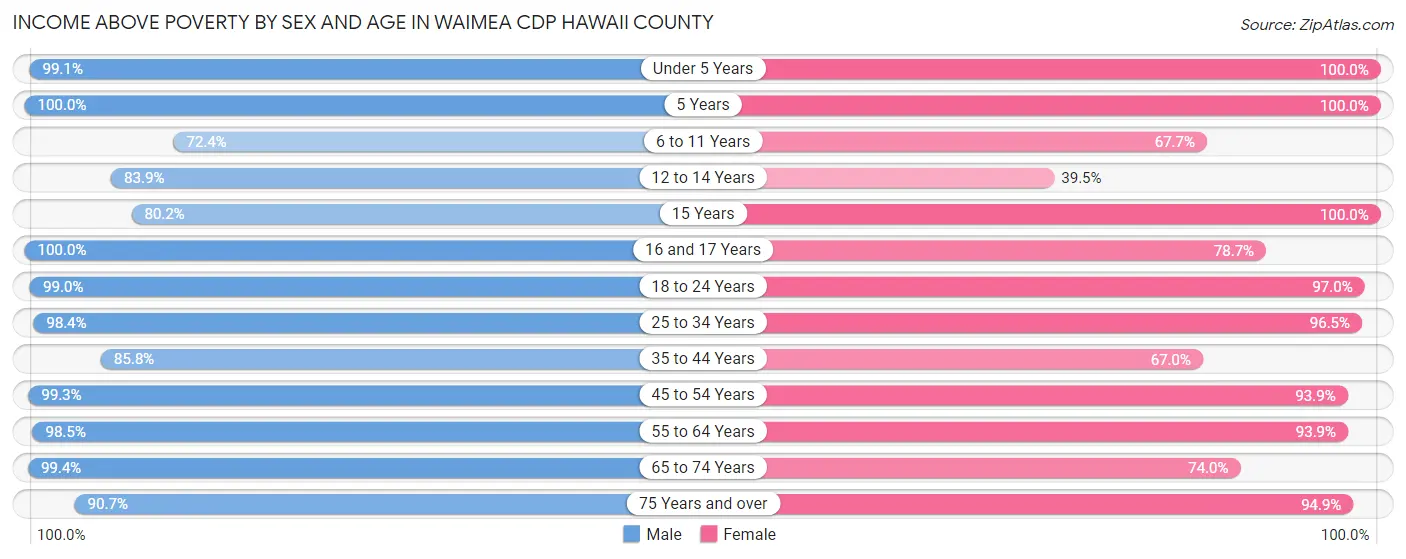
| Age Bracket | Male | Female |
| Under 5 Years | 541 (99.1%) | 162 (100.0%) |
| 5 Years | 54 (100.0%) | 31 (100.0%) |
| 6 to 11 Years | 364 (72.4%) | 401 (67.7%) |
| 12 to 14 Years | 94 (83.9%) | 58 (39.5%) |
| 15 Years | 198 (80.2%) | 65 (100.0%) |
| 16 and 17 Years | 56 (100.0%) | 185 (78.7%) |
| 18 to 24 Years | 192 (99.0%) | 130 (97.0%) |
| 25 to 34 Years | 484 (98.4%) | 694 (96.5%) |
| 35 to 44 Years | 660 (85.8%) | 670 (67.0%) |
| 45 to 54 Years | 703 (99.3%) | 535 (93.9%) |
| 55 to 64 Years | 397 (98.5%) | 604 (93.9%) |
| 65 to 74 Years | 470 (99.4%) | 483 (74.0%) |
| 75 Years and over | 390 (90.7%) | 467 (94.9%) |
| Total | 4,603 (92.3%) | 4,485 (82.4%) |
Income Below Poverty Among Married-Couple Families in Waimea CDP Hawaii County
The poverty statistics for married-couple families in Waimea CDP Hawaii County show that 5.5% or 101 of the total 1,832 families live below the poverty line. Families with 5 or more children have the highest poverty rate of 62.8%, comprising of 54 families. On the other hand, families with 3 or 4 children have the lowest poverty rate of 0.0%, which includes 0 families.
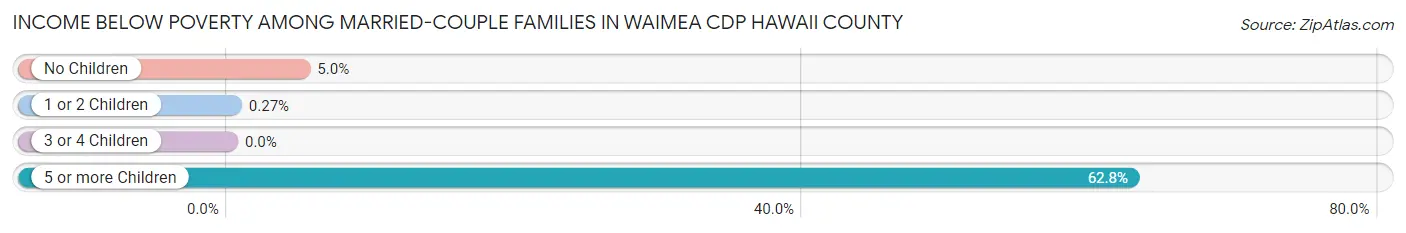
| Children | Above Poverty | Below Poverty |
| No Children | 847 (95.0%) | 45 (5.0%) |
| 1 or 2 Children | 747 (99.7%) | 2 (0.3%) |
| 3 or 4 Children | 105 (100.0%) | 0 (0.0%) |
| 5 or more Children | 32 (37.2%) | 54 (62.8%) |
| Total | 1,731 (94.5%) | 101 (5.5%) |
Income Below Poverty Among Single-Parent Households in Waimea CDP Hawaii County
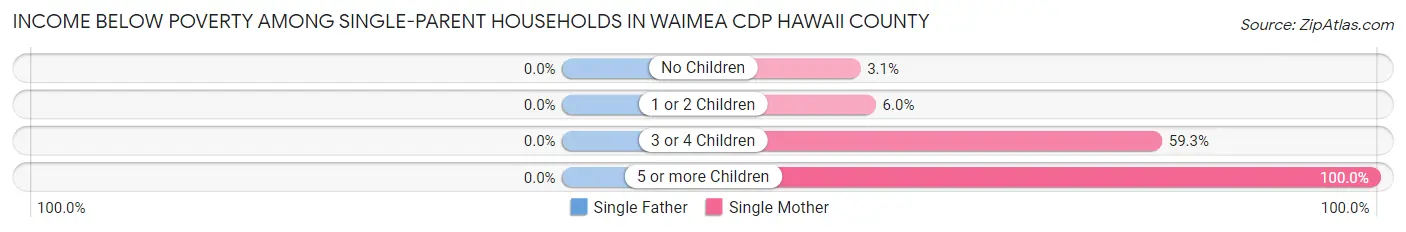
| Children | Single Father | Single Mother |
| No Children | 0 (0.0%) | 6 (3.1%) |
| 1 or 2 Children | 0 (0.0%) | 14 (6.0%) |
| 3 or 4 Children | 0 (0.0%) | 16 (59.3%) |
| 5 or more Children | 0 (0.0%) | 49 (100.0%) |
| Total | 0 (0.0%) | 85 (16.8%) |
Income Below Poverty Among Married-Couple vs Single-Parent Households in Waimea CDP Hawaii County
The poverty data for Waimea CDP Hawaii County shows that 101 of the married-couple family households (5.5%) and 85 of the single-parent households (13.9%) are living below the poverty level. Within the married-couple family households, those with 5 or more children have the highest poverty rate, with 54 households (62.8%) falling below the poverty line. Among the single-parent households, those with 5 or more children have the highest poverty rate, with 49 household (100.0%) living below poverty.
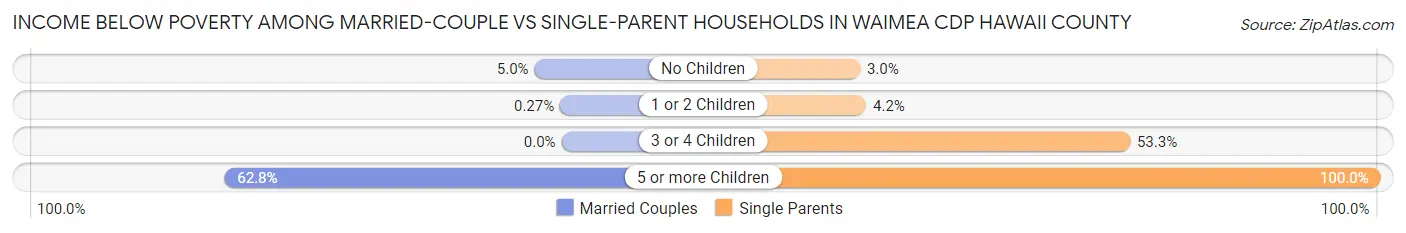
| Children | Married-Couple Families | Single-Parent Households |
| No Children | 45 (5.0%) | 6 (3.0%) |
| 1 or 2 Children | 2 (0.3%) | 14 (4.2%) |
| 3 or 4 Children | 0 (0.0%) | 16 (53.3%) |
| 5 or more Children | 54 (62.8%) | 49 (100.0%) |
| Total | 101 (5.5%) | 85 (13.9%) |
Race in Waimea CDP Hawaii County
The most populous races in Waimea CDP Hawaii County are Two or more Races (4,323 | 41.3%), Asian (2,343 | 22.4%), and White / Caucasian (2,214 | 21.2%).
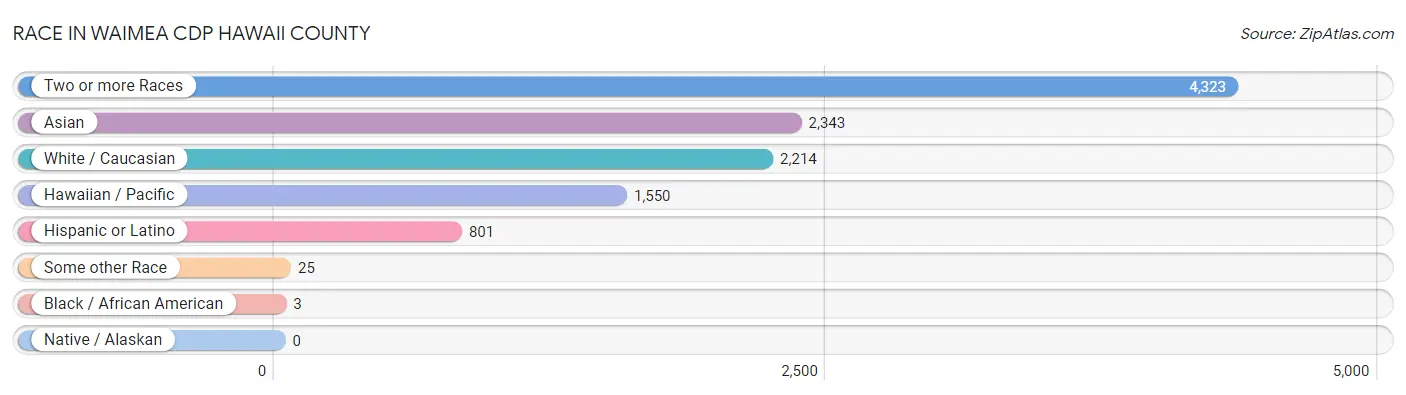
| Race | # Population | % Population |
| Asian | 2,343 | 22.4% |
| Black / African American | 3 | 0.0% |
| Hawaiian / Pacific | 1,550 | 14.8% |
| Hispanic or Latino | 801 | 7.7% |
| Native / Alaskan | 0 | 0.0% |
| White / Caucasian | 2,214 | 21.2% |
| Two or more Races | 4,323 | 41.3% |
| Some other Race | 25 | 0.2% |
| Total | 10,458 | 100.0% |
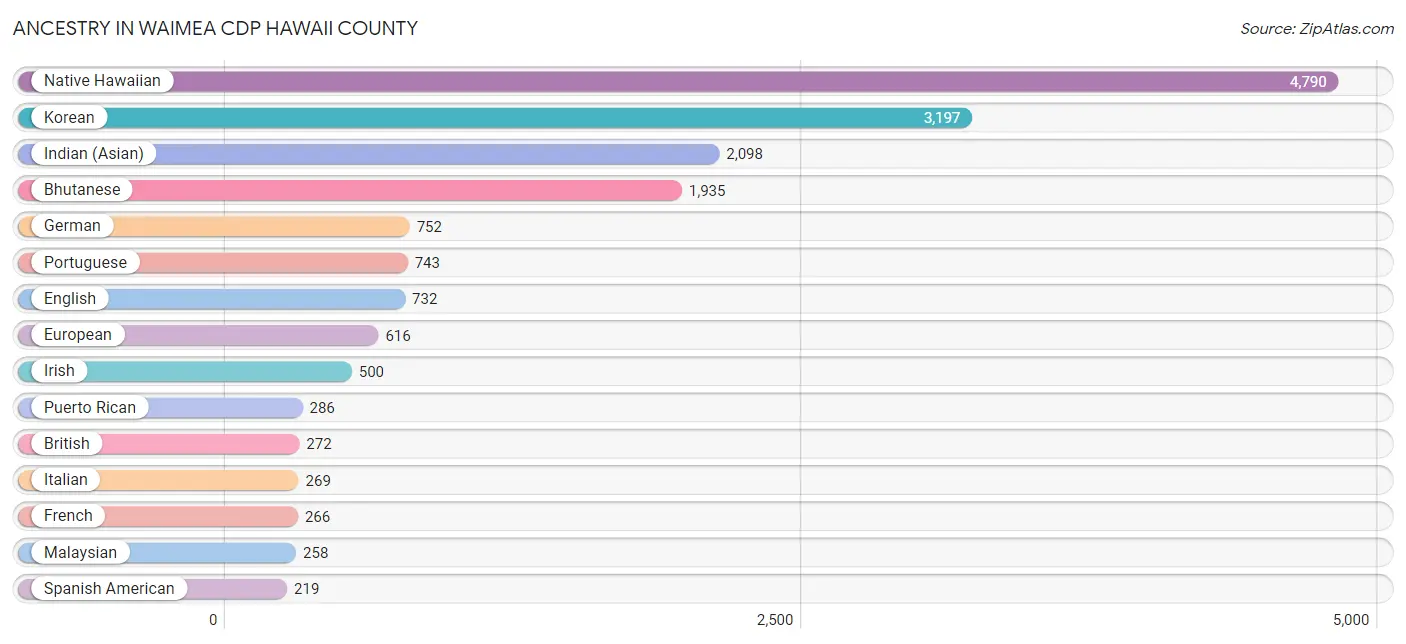
Ancestry in Waimea CDP Hawaii County
The most populous ancestries reported in Waimea CDP Hawaii County are Native Hawaiian (4,790 | 45.8%), Korean (3,197 | 30.6%), Indian (Asian) (2,098 | 20.1%), Bhutanese (1,935 | 18.5%), and German (752 | 7.2%), together accounting for 122.1% of all Waimea CDP Hawaii County residents.
| Ancestry | # Population | % Population |
| Alaskan Athabascan | 62 | 0.6% |
| American | 10 | 0.1% |
| Arab | 11 | 0.1% |
| Australian | 4 | 0.0% |
| Basque | 21 | 0.2% |
| Bhutanese | 1,935 | 18.5% |
| Blackfeet | 94 | 0.9% |
| British | 272 | 2.6% |
| Burmese | 8 | 0.1% |
| Cajun | 6 | 0.1% |
| Canadian | 6 | 0.1% |
| Cherokee | 106 | 1.0% |
| Chickasaw | 36 | 0.3% |
| Chinese | 18 | 0.2% |
| Colombian | 19 | 0.2% |
| Dutch | 30 | 0.3% |
| Eastern European | 33 | 0.3% |
| English | 732 | 7.0% |
| European | 616 | 5.9% |
| Fijian | 14 | 0.1% |
| Finnish | 19 | 0.2% |
| French | 266 | 2.5% |
| French Canadian | 33 | 0.3% |
| German | 752 | 7.2% |
| Guamanian / Chamorro | 57 | 0.5% |
| Indian (Asian) | 2,098 | 20.1% |
| Irish | 500 | 4.8% |
| Iroquois | 72 | 0.7% |
| Italian | 269 | 2.6% |
| Japanese | 2 | 0.0% |
| Korean | 3,197 | 30.6% |
| Malaysian | 258 | 2.5% |
| Mexican | 71 | 0.7% |
| Mongolian | 4 | 0.0% |
| Native Hawaiian | 4,790 | 45.8% |
| Northern European | 63 | 0.6% |
| Norwegian | 110 | 1.1% |
| Pakistani | 6 | 0.1% |
| Polish | 45 | 0.4% |
| Portuguese | 743 | 7.1% |
| Puerto Rican | 286 | 2.7% |
| Russian | 17 | 0.2% |
| Samoan | 92 | 0.9% |
| Scandinavian | 2 | 0.0% |
| Scotch-Irish | 25 | 0.2% |
| Scottish | 33 | 0.3% |
| Slovak | 10 | 0.1% |
| South American | 19 | 0.2% |
| Spaniard | 105 | 1.0% |
| Spanish | 44 | 0.4% |
| Spanish American | 219 | 2.1% |
| Swedish | 124 | 1.2% |
| Swiss | 113 | 1.1% |
| Syrian | 11 | 0.1% |
| Tlingit-Haida | 60 | 0.6% |
| Tongan | 64 | 0.6% |
| Turkish | 51 | 0.5% |
| Welsh | 4 | 0.0% | View All 58 Rows |
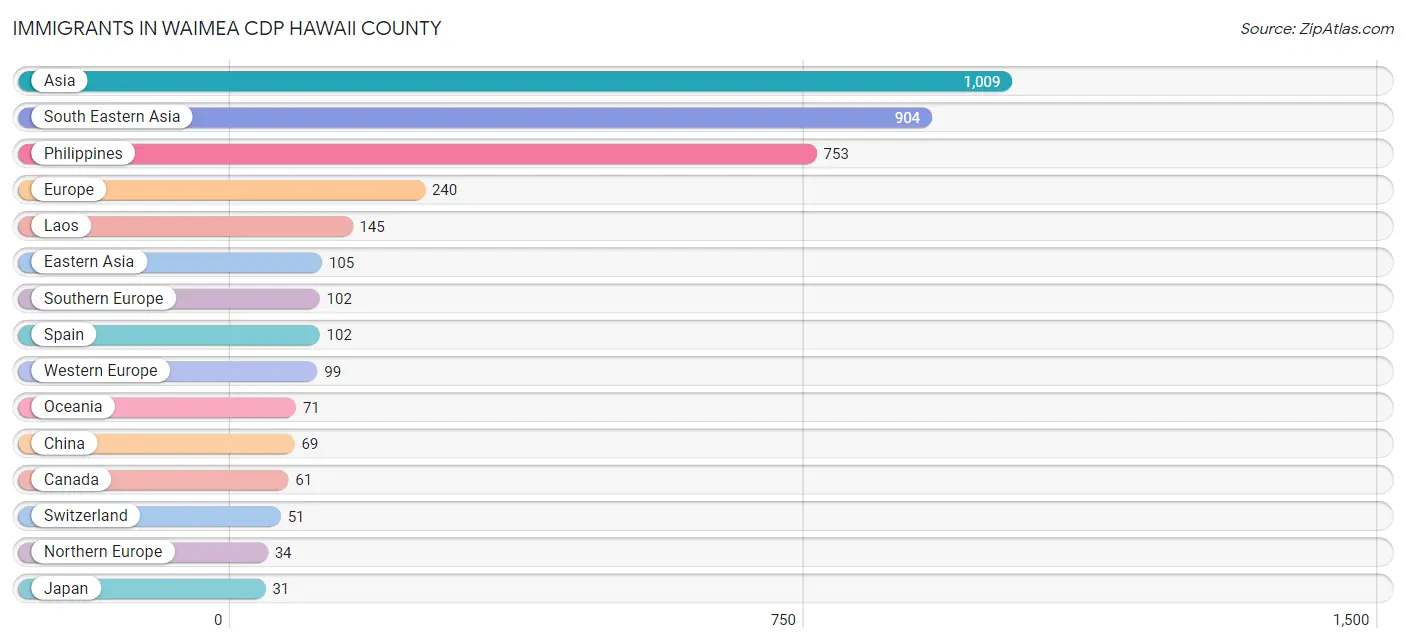
Immigrants in Waimea CDP Hawaii County
The most numerous immigrant groups reported in Waimea CDP Hawaii County came from Asia (1,009 | 9.7%), South Eastern Asia (904 | 8.6%), Philippines (753 | 7.2%), Europe (240 | 2.3%), and Laos (145 | 1.4%), together accounting for 29.2% of all Waimea CDP Hawaii County residents.
| Immigration Origin | # Population | % Population |
| Asia | 1,009 | 9.7% |
| Australia | 4 | 0.0% |
| Belgium | 12 | 0.1% |
| Canada | 61 | 0.6% |
| Caribbean | 4 | 0.0% |
| Central America | 14 | 0.1% |
| China | 69 | 0.7% |
| Czechoslovakia | 5 | 0.1% |
| Eastern Asia | 105 | 1.0% |
| Eastern Europe | 5 | 0.1% |
| Europe | 240 | 2.3% |
| France | 14 | 0.1% |
| Hong Kong | 14 | 0.1% |
| Jamaica | 4 | 0.0% |
| Japan | 31 | 0.3% |
| Korea | 5 | 0.1% |
| Laos | 145 | 1.4% |
| Latin America | 18 | 0.2% |
| Mexico | 14 | 0.1% |
| Micronesia | 22 | 0.2% |
| Netherlands | 22 | 0.2% |
| Northern Europe | 34 | 0.3% |
| Oceania | 71 | 0.7% |
| Philippines | 753 | 7.2% |
| South Eastern Asia | 904 | 8.6% |
| Southern Europe | 102 | 1.0% |
| Spain | 102 | 1.0% |
| Switzerland | 51 | 0.5% |
| Thailand | 6 | 0.1% |
| Western Europe | 99 | 0.9% | View All 30 Rows |
Sex and Age in Waimea CDP Hawaii County
Sex and Age in Waimea CDP Hawaii County
The most populous age groups in Waimea CDP Hawaii County are 35 to 39 Years (600 | 12.0%) for men and 35 to 39 Years (556 | 10.2%) for women.
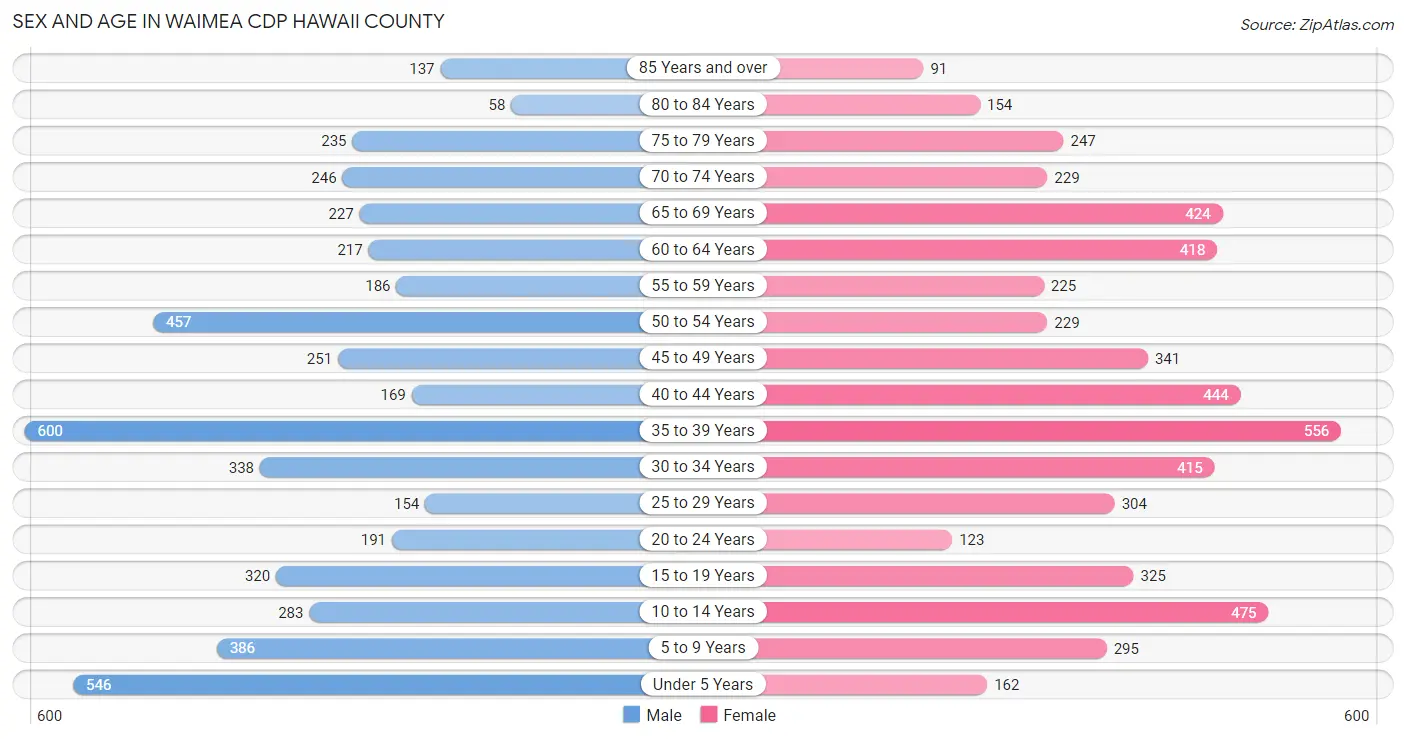
| Age Bracket | Male | Female |
| Under 5 Years | 546 (10.9%) | 162 (3.0%) |
| 5 to 9 Years | 386 (7.7%) | 295 (5.4%) |
| 10 to 14 Years | 283 (5.7%) | 475 (8.7%) |
| 15 to 19 Years | 320 (6.4%) | 325 (6.0%) |
| 20 to 24 Years | 191 (3.8%) | 123 (2.2%) |
| 25 to 29 Years | 154 (3.1%) | 304 (5.6%) |
| 30 to 34 Years | 338 (6.8%) | 415 (7.6%) |
| 35 to 39 Years | 600 (12.0%) | 556 (10.2%) |
| 40 to 44 Years | 169 (3.4%) | 444 (8.1%) |
| 45 to 49 Years | 251 (5.0%) | 341 (6.2%) |
| 50 to 54 Years | 457 (9.1%) | 229 (4.2%) |
| 55 to 59 Years | 186 (3.7%) | 225 (4.1%) |
| 60 to 64 Years | 217 (4.3%) | 418 (7.7%) |
| 65 to 69 Years | 227 (4.5%) | 424 (7.8%) |
| 70 to 74 Years | 246 (4.9%) | 229 (4.2%) |
| 75 to 79 Years | 235 (4.7%) | 247 (4.5%) |
| 80 to 84 Years | 58 (1.2%) | 154 (2.8%) |
| 85 Years and over | 137 (2.7%) | 91 (1.7%) |
| Total | 5,001 (100.0%) | 5,457 (100.0%) |
Families and Households in Waimea CDP Hawaii County
Median Family Size in Waimea CDP Hawaii County
The median family size in Waimea CDP Hawaii County is 3.53 persons per family, with single female/mother families (506 | 20.7%) accounting for the largest median family size of 3.73 persons per family. On the other hand, single male/father families (106 | 4.3%) represent the smallest median family size with 2.67 persons per family.
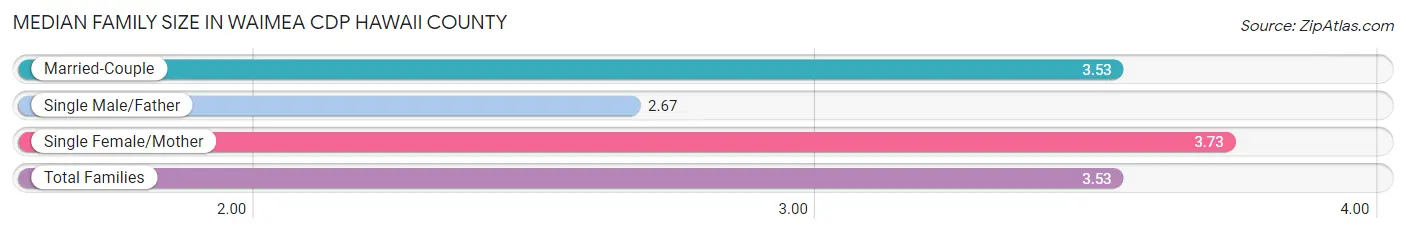
| Family Type | # Families | Family Size |
| Married-Couple | 1,832 (75.0%) | 3.53 |
| Single Male/Father | 106 (4.3%) | 2.67 |
| Single Female/Mother | 506 (20.7%) | 3.73 |
| Total Families | 2,444 (100.0%) | 3.53 |
Median Household Size in Waimea CDP Hawaii County
The median household size in Waimea CDP Hawaii County is 2.88 persons per household, with single female/mother households (506 | 14.1%) accounting for the largest median household size of 4.25 persons per household. non-family households (1,144 | 31.9%) represent the smallest median household size with 1.21 persons per household.
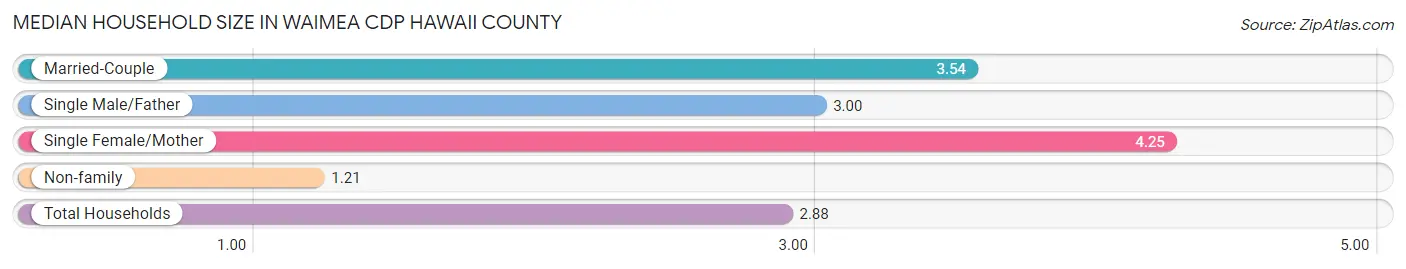
| Household Type | # Households | Household Size |
| Married-Couple | 1,832 (51.1%) | 3.54 |
| Single Male/Father | 106 (2.9%) | 3.00 |
| Single Female/Mother | 506 (14.1%) | 4.25 |
| Non-family | 1,144 (31.9%) | 1.21 |
| Total Households | 3,588 (100.0%) | 2.88 |
Household Size by Marriage Status in Waimea CDP Hawaii County
Out of a total of 3,588 households in Waimea CDP Hawaii County, 2,444 (68.1%) are family households, while 1,144 (31.9%) are nonfamily households. The most numerous type of family households are 2-person households, comprising 764, and the most common type of nonfamily households are 1-person households, comprising 917.
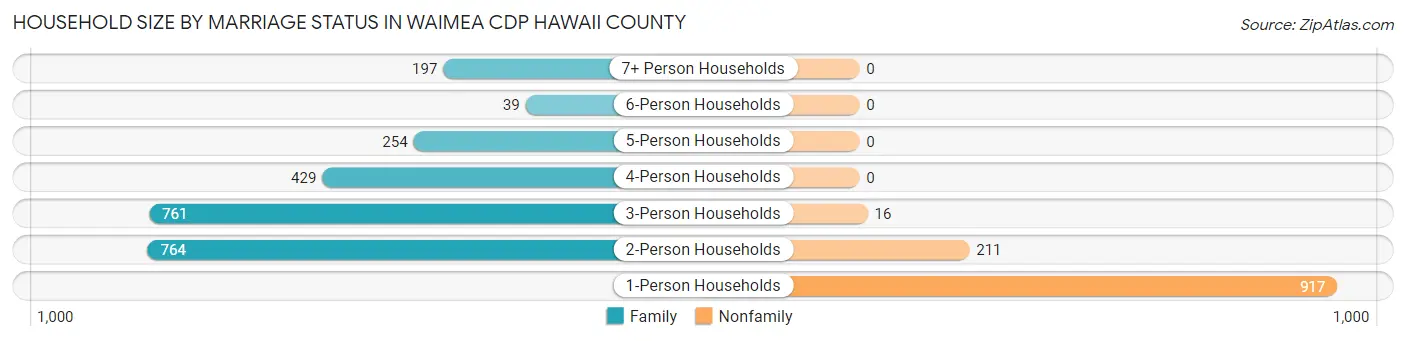
| Household Size | Family Households | Nonfamily Households |
| 1-Person Households | - | 917 (25.6%) |
| 2-Person Households | 764 (21.3%) | 211 (5.9%) |
| 3-Person Households | 761 (21.2%) | 16 (0.4%) |
| 4-Person Households | 429 (12.0%) | 0 (0.0%) |
| 5-Person Households | 254 (7.1%) | 0 (0.0%) |
| 6-Person Households | 39 (1.1%) | 0 (0.0%) |
| 7+ Person Households | 197 (5.5%) | 0 (0.0%) |
| Total | 2,444 (68.1%) | 1,144 (31.9%) |
Female Fertility in Waimea CDP Hawaii County
Fertility by Age in Waimea CDP Hawaii County
Average fertility rate in Waimea CDP Hawaii County is 96.0 births per 1,000 women. Women in the age bracket of 20 to 34 years have the highest fertility rate with 289.0 births per 1,000 women. Women in the age bracket of 20 to 34 years acount for 100.0% of all women with births.
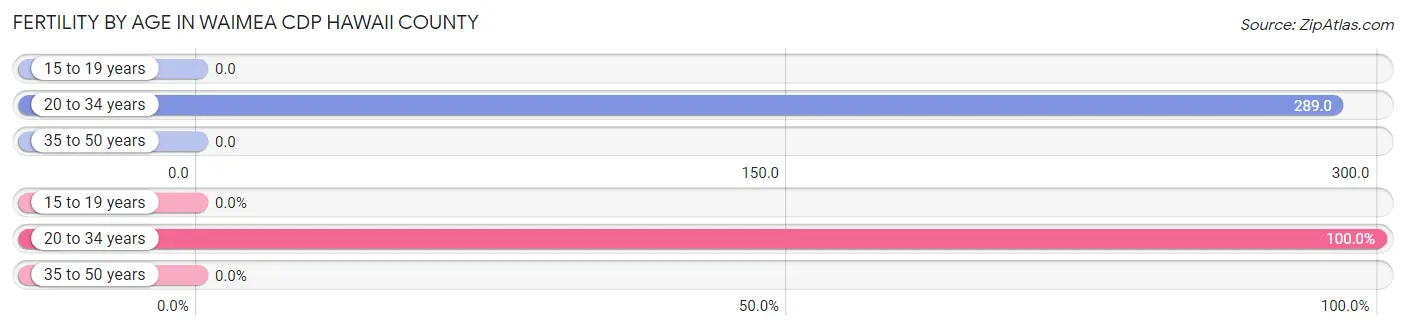
| Age Bracket | Women with Births | Births / 1,000 Women |
| 15 to 19 years | 0 (0.0%) | 0.0 |
| 20 to 34 years | 243 (100.0%) | 289.0 |
| 35 to 50 years | 0 (0.0%) | 0.0 |
| Total | 243 (100.0%) | 96.0 |
Fertility by Age by Marriage Status in Waimea CDP Hawaii County
91.8% of women with births (243) in Waimea CDP Hawaii County are married. The highest percentage of unmarried women with births falls into 20 to 34 years age bracket with 8.2% of them unmarried at the time of birth, while the lowest percentage of unmarried women with births belong to 20 to 34 years age bracket with 8.2% of them unmarried.
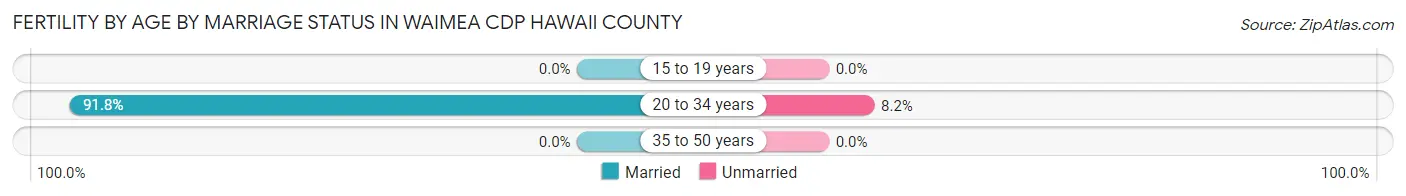
| Age Bracket | Married | Unmarried |
| 15 to 19 years | 0 (0.0%) | 0 (0.0%) |
| 20 to 34 years | 223 (91.8%) | 20 (8.2%) |
| 35 to 50 years | 0 (0.0%) | 0 (0.0%) |
| Total | 223 (91.8%) | 20 (8.2%) |
Fertility by Education in Waimea CDP Hawaii County
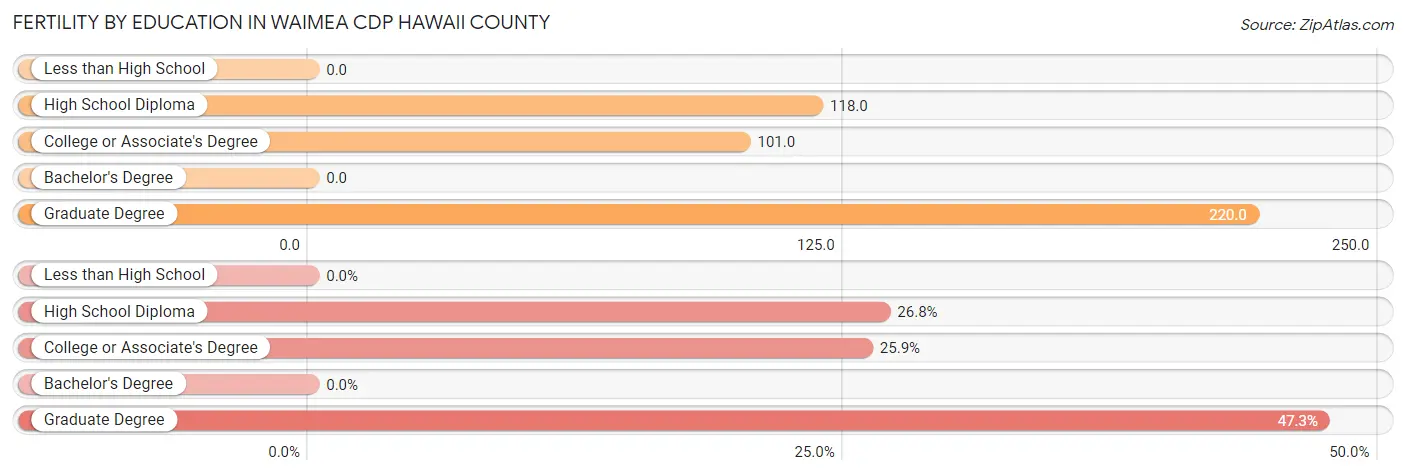
| Educational Attainment | Women with Births | Births / 1,000 Women |
| Less than High School | 0 (0.0%) | 0.0 |
| High School Diploma | 65 (26.8%) | 118.0 |
| College or Associate's Degree | 63 (25.9%) | 101.0 |
| Bachelor's Degree | 0 (0.0%) | 0.0 |
| Graduate Degree | 115 (47.3%) | 220.0 |
| Total | 243 (100.0%) | 96.0 |
Fertility by Education by Marriage Status in Waimea CDP Hawaii County
8.2% of women with births in Waimea CDP Hawaii County are unmarried. Women with the educational attainment of college or associate's degree are most likely to be married with 100.0% of them married at childbirth, while women with the educational attainment of high school diploma are least likely to be married with 30.8% of them unmarried at childbirth.
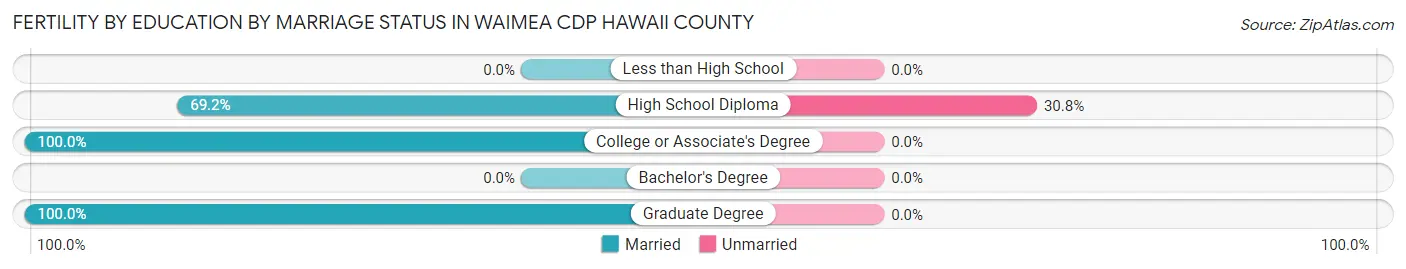
| Educational Attainment | Married | Unmarried |
| Less than High School | 0 (0.0%) | 0 (0.0%) |
| High School Diploma | 45 (69.2%) | 20 (30.8%) |
| College or Associate's Degree | 63 (100.0%) | 0 (0.0%) |
| Bachelor's Degree | 0 (0.0%) | 0 (0.0%) |
| Graduate Degree | 115 (100.0%) | 0 (0.0%) |
| Total | 223 (91.8%) | 20 (8.2%) |
Employment Characteristics in Waimea CDP Hawaii County
Employment by Class of Employer in Waimea CDP Hawaii County
Among the 4,996 employed individuals in Waimea CDP Hawaii County, private company employees (2,618 | 52.4%), not-for-profit organizations (729 | 14.6%), and state government employees (555 | 11.1%) make up the most common classes of employment.
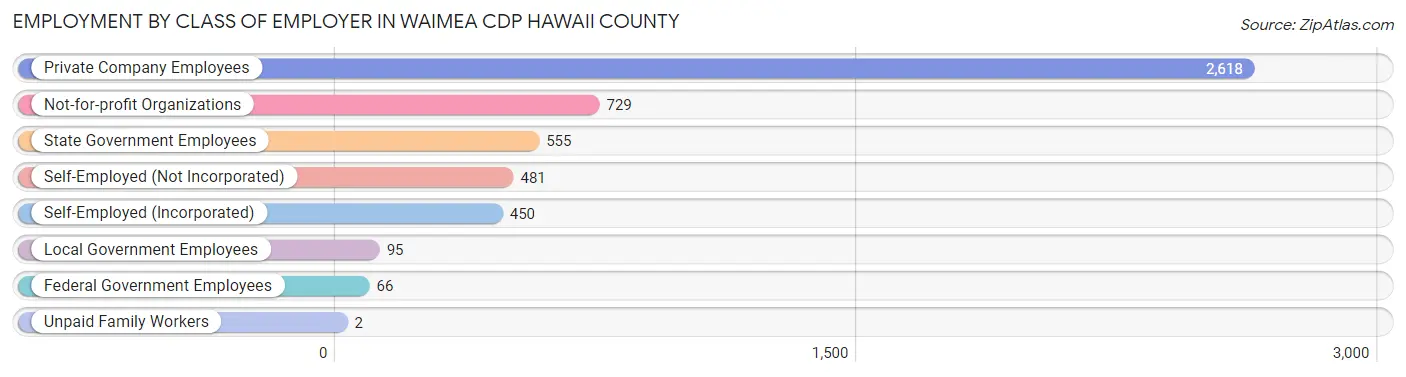
| Employer Class | # Employees | % Employees |
| Private Company Employees | 2,618 | 52.4% |
| Self-Employed (Incorporated) | 450 | 9.0% |
| Self-Employed (Not Incorporated) | 481 | 9.6% |
| Not-for-profit Organizations | 729 | 14.6% |
| Local Government Employees | 95 | 1.9% |
| State Government Employees | 555 | 11.1% |
| Federal Government Employees | 66 | 1.3% |
| Unpaid Family Workers | 2 | 0.0% |
| Total | 4,996 | 100.0% |
Employment Status by Age in Waimea CDP Hawaii County
According to the labor force statistics for Waimea CDP Hawaii County, out of the total population over 16 years of age (7,999), 67.7% or 5,415 individuals are in the labor force, with 5.7% or 309 of them unemployed. The age group with the highest labor force participation rate is 35 to 44 years, with 96.0% or 1,698 individuals in the labor force. Within the labor force, the 20 to 24 years age range has the highest percentage of unemployed individuals, with 36.3% or 104 of them being unemployed.
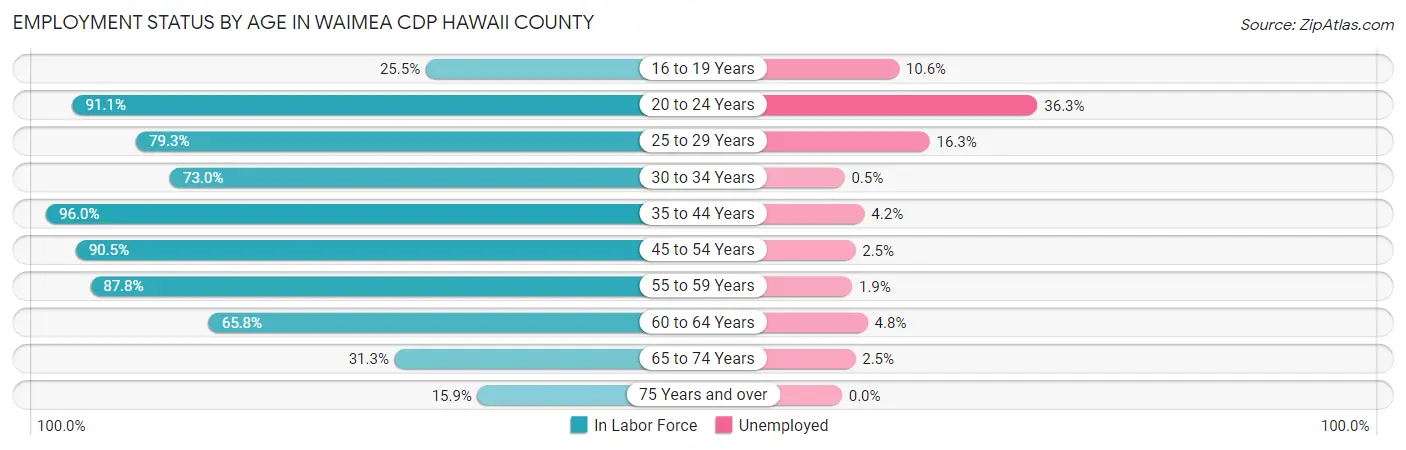
| Age Bracket | In Labor Force | Unemployed |
| 16 to 19 Years | 85 (25.5%) | 9 (10.6%) |
| 20 to 24 Years | 286 (91.1%) | 104 (36.3%) |
| 25 to 29 Years | 363 (79.3%) | 59 (16.3%) |
| 30 to 34 Years | 550 (73.0%) | 3 (0.5%) |
| 35 to 44 Years | 1,698 (96.0%) | 71 (4.2%) |
| 45 to 54 Years | 1,157 (90.5%) | 29 (2.5%) |
| 55 to 59 Years | 361 (87.8%) | 7 (1.9%) |
| 60 to 64 Years | 418 (65.8%) | 20 (4.8%) |
| 65 to 74 Years | 352 (31.3%) | 9 (2.5%) |
| 75 Years and over | 147 (15.9%) | 0 (0.0%) |
| Total | 5,415 (67.7%) | 309 (5.7%) |
Employment Status by Educational Attainment in Waimea CDP Hawaii County
According to labor force statistics for Waimea CDP Hawaii County, 85.7% of individuals (4,546) out of the total population between 25 and 64 years of age (5,304) are in the labor force, with 4.2% or 191 of them being unemployed. The group with the highest labor force participation rate are those with the educational attainment of college / associate degree, with 87.6% or 1,290 individuals in the labor force. Within the labor force, individuals with high school diploma education have the highest percentage of unemployment, with 12.2% or 147 of them being unemployed.
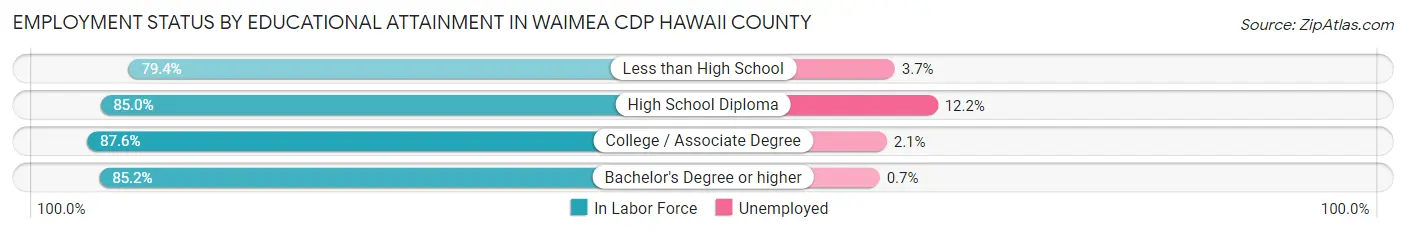
| Educational Attainment | In Labor Force | Unemployed |
| Less than High School | 81 (79.4%) | 4 (3.7%) |
| High School Diploma | 1,205 (85.0%) | 173 (12.2%) |
| College / Associate Degree | 1,290 (87.6%) | 31 (2.1%) |
| Bachelor's Degree or higher | 1,969 (85.2%) | 16 (0.7%) |
| Total | 4,546 (85.7%) | 223 (4.2%) |
Employment Occupations by Sex in Waimea CDP Hawaii County
Management, Business, Science and Arts Occupations
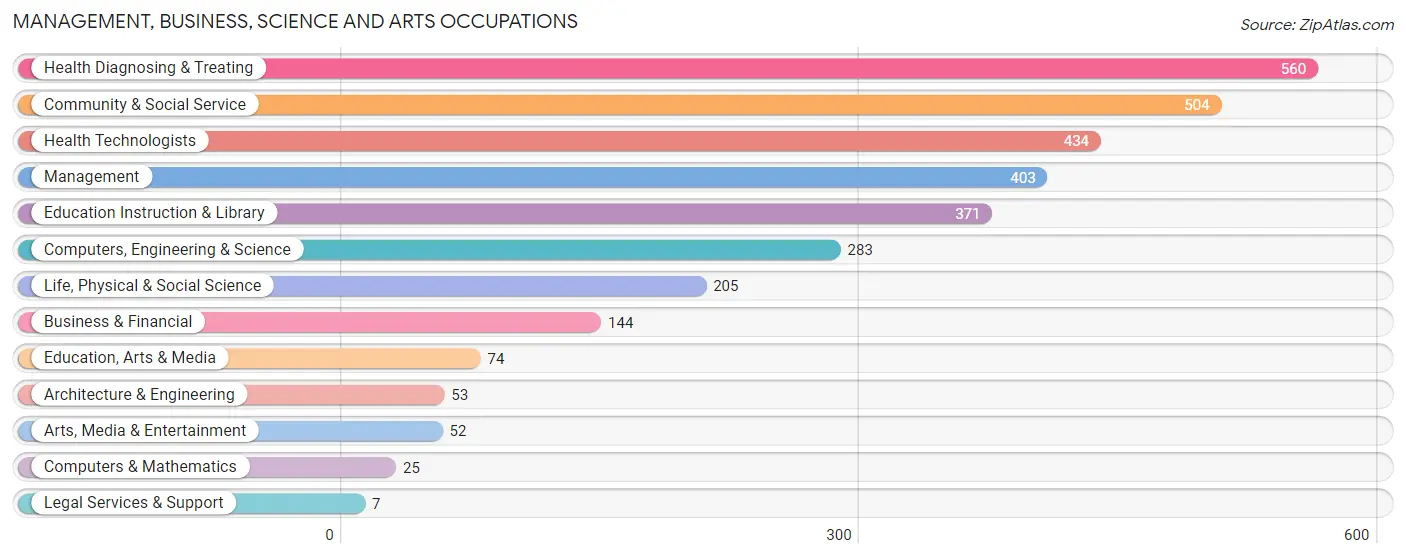
The most common Management, Business, Science and Arts occupations in Waimea CDP Hawaii County are Health Diagnosing & Treating (560 | 11.0%), Community & Social Service (504 | 9.9%), Health Technologists (434 | 8.5%), Management (403 | 7.9%), and Education Instruction & Library (371 | 7.3%).
Management, Business, Science and Arts Occupations by Sex
Within the Management, Business, Science and Arts occupations in Waimea CDP Hawaii County, the most male-oriented occupations are Computers & Mathematics (80.0%), Arts, Media & Entertainment (71.2%), and Business & Financial (65.3%), while the most female-oriented occupations are Education, Arts & Media (94.6%), Health Technologists (83.2%), and Health Diagnosing & Treating (83.0%).
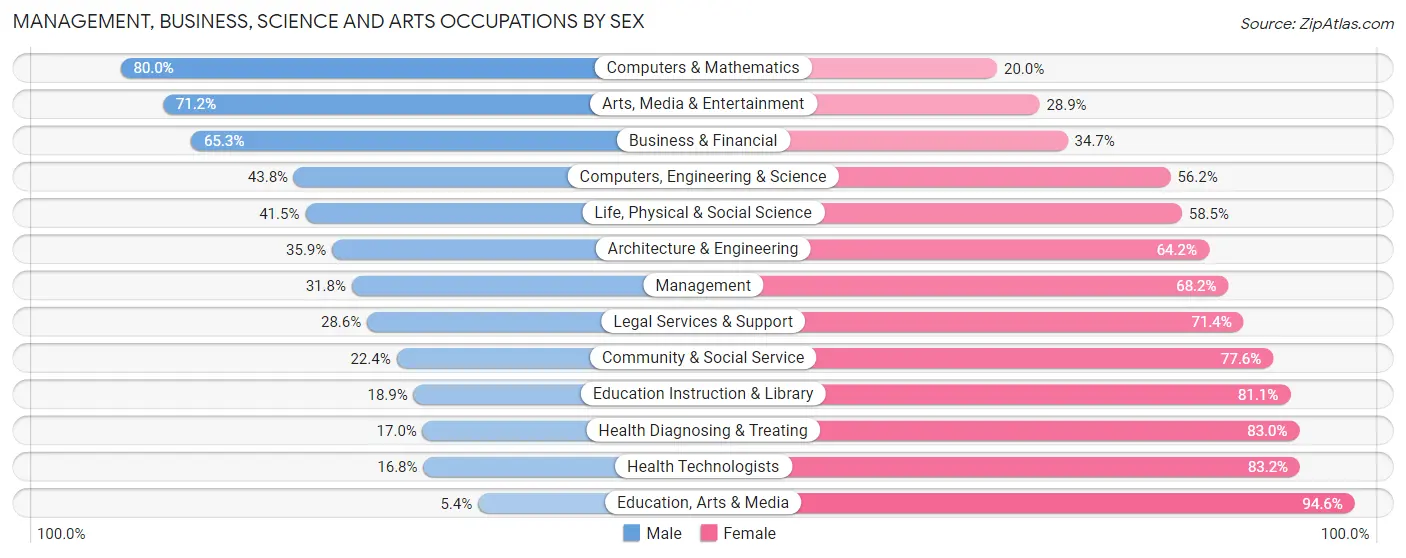
| Occupation | Male | Female |
| Management | 128 (31.8%) | 275 (68.2%) |
| Business & Financial | 94 (65.3%) | 50 (34.7%) |
| Computers, Engineering & Science | 124 (43.8%) | 159 (56.2%) |
| Computers & Mathematics | 20 (80.0%) | 5 (20.0%) |
| Architecture & Engineering | 19 (35.8%) | 34 (64.1%) |
| Life, Physical & Social Science | 85 (41.5%) | 120 (58.5%) |
| Community & Social Service | 113 (22.4%) | 391 (77.6%) |
| Education, Arts & Media | 4 (5.4%) | 70 (94.6%) |
| Legal Services & Support | 2 (28.6%) | 5 (71.4%) |
| Education Instruction & Library | 70 (18.9%) | 301 (81.1%) |
| Arts, Media & Entertainment | 37 (71.2%) | 15 (28.8%) |
| Health Diagnosing & Treating | 95 (17.0%) | 465 (83.0%) |
| Health Technologists | 73 (16.8%) | 361 (83.2%) |
| Total (Category) | 554 (29.2%) | 1,340 (70.8%) |
| Total (Overall) | 2,298 (45.0%) | 2,804 (55.0%) |
Services Occupations
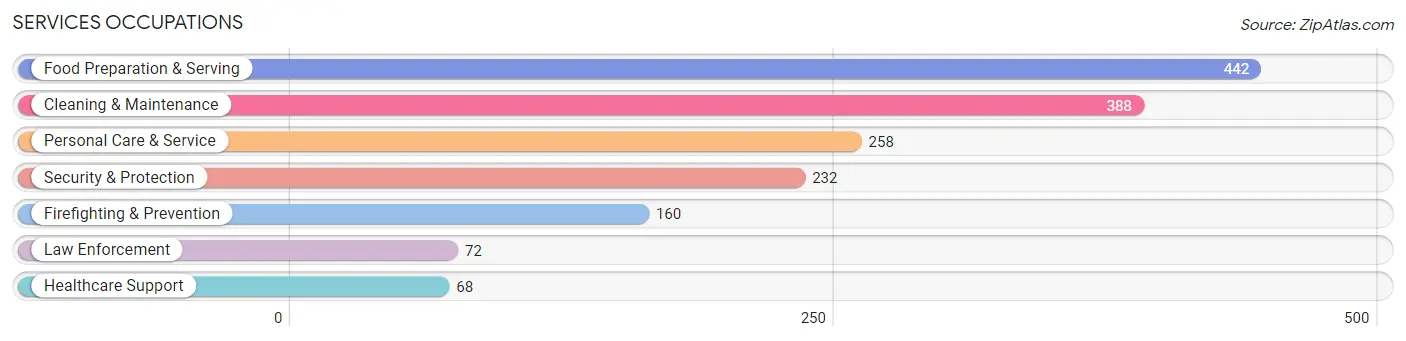
The most common Services occupations in Waimea CDP Hawaii County are Food Preparation & Serving (442 | 8.7%), Cleaning & Maintenance (388 | 7.6%), Personal Care & Service (258 | 5.1%), Security & Protection (232 | 4.5%), and Firefighting & Prevention (160 | 3.1%).
Services Occupations by Sex
Within the Services occupations in Waimea CDP Hawaii County, the most male-oriented occupations are Law Enforcement (100.0%), Personal Care & Service (72.1%), and Security & Protection (47.0%), while the most female-oriented occupations are Healthcare Support (79.4%), Firefighting & Prevention (76.9%), and Food Preparation & Serving (64.0%).
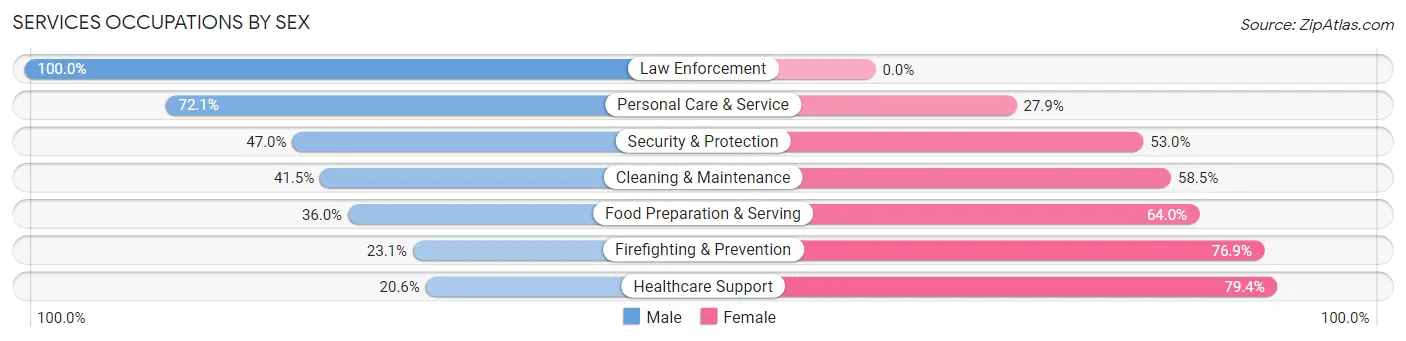
| Occupation | Male | Female |
| Healthcare Support | 14 (20.6%) | 54 (79.4%) |
| Security & Protection | 109 (47.0%) | 123 (53.0%) |
| Firefighting & Prevention | 37 (23.1%) | 123 (76.9%) |
| Law Enforcement | 72 (100.0%) | 0 (0.0%) |
| Food Preparation & Serving | 159 (36.0%) | 283 (64.0%) |
| Cleaning & Maintenance | 161 (41.5%) | 227 (58.5%) |
| Personal Care & Service | 186 (72.1%) | 72 (27.9%) |
| Total (Category) | 629 (45.3%) | 759 (54.7%) |
| Total (Overall) | 2,298 (45.0%) | 2,804 (55.0%) |
Sales and Office Occupations
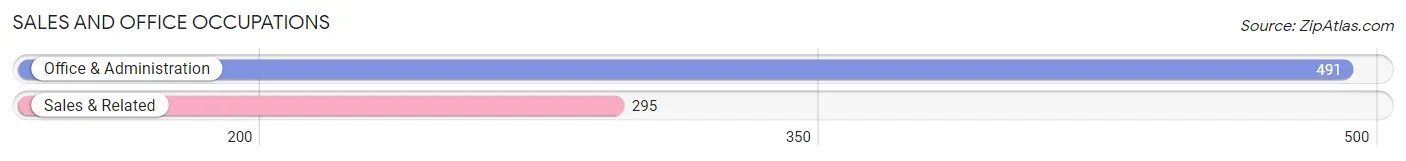
The most common Sales and Office occupations in Waimea CDP Hawaii County are Office & Administration (491 | 9.6%), and Sales & Related (295 | 5.8%).
Sales and Office Occupations by Sex
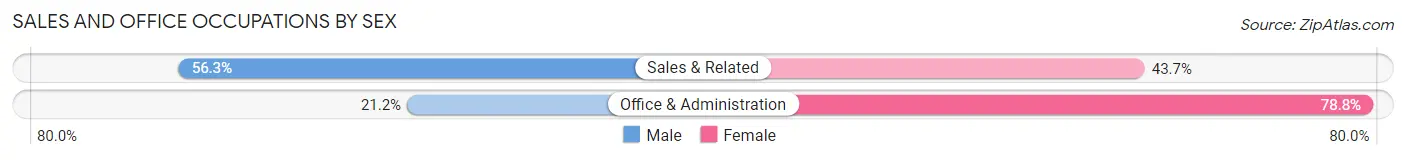
| Occupation | Male | Female |
| Sales & Related | 166 (56.3%) | 129 (43.7%) |
| Office & Administration | 104 (21.2%) | 387 (78.8%) |
| Total (Category) | 270 (34.4%) | 516 (65.6%) |
| Total (Overall) | 2,298 (45.0%) | 2,804 (55.0%) |
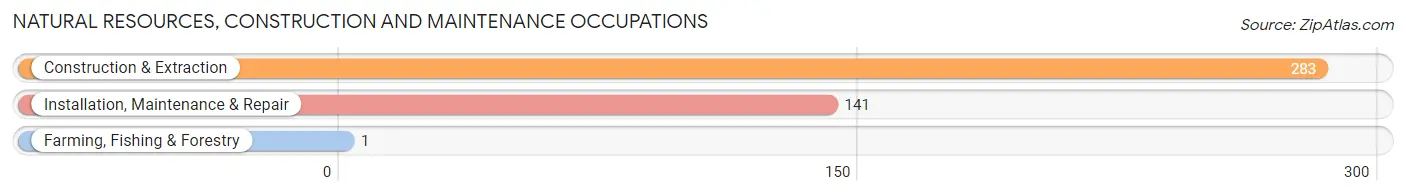
Natural Resources, Construction and Maintenance Occupations
The most common Natural Resources, Construction and Maintenance occupations in Waimea CDP Hawaii County are Construction & Extraction (283 | 5.6%), Installation, Maintenance & Repair (141 | 2.8%), and Farming, Fishing & Forestry (1 | 0.0%).
Natural Resources, Construction and Maintenance Occupations by Sex
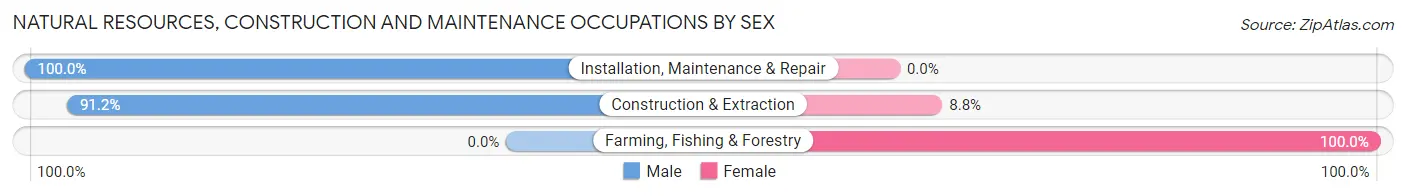
| Occupation | Male | Female |
| Farming, Fishing & Forestry | 0 (0.0%) | 1 (100.0%) |
| Construction & Extraction | 258 (91.2%) | 25 (8.8%) |
| Installation, Maintenance & Repair | 141 (100.0%) | 0 (0.0%) |
| Total (Category) | 399 (93.9%) | 26 (6.1%) |
| Total (Overall) | 2,298 (45.0%) | 2,804 (55.0%) |
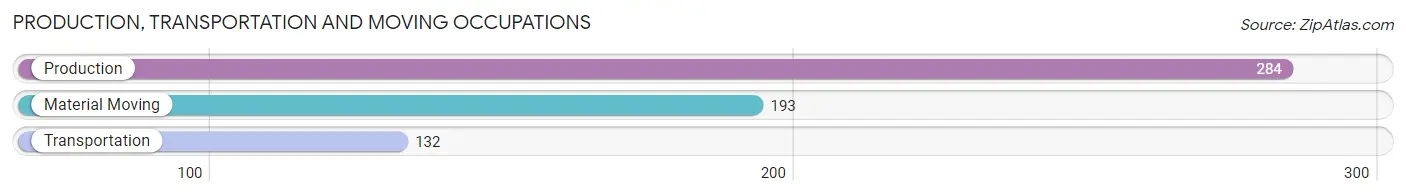
Production, Transportation and Moving Occupations
The most common Production, Transportation and Moving occupations in Waimea CDP Hawaii County are Production (284 | 5.6%), Material Moving (193 | 3.8%), and Transportation (132 | 2.6%).
Production, Transportation and Moving Occupations by Sex
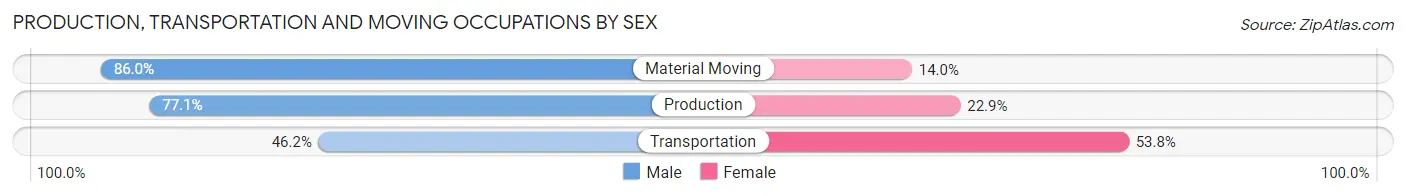
| Occupation | Male | Female |
| Production | 219 (77.1%) | 65 (22.9%) |
| Transportation | 61 (46.2%) | 71 (53.8%) |
| Material Moving | 166 (86.0%) | 27 (14.0%) |
| Total (Category) | 446 (73.2%) | 163 (26.8%) |
| Total (Overall) | 2,298 (45.0%) | 2,804 (55.0%) |
Employment Industries by Sex in Waimea CDP Hawaii County
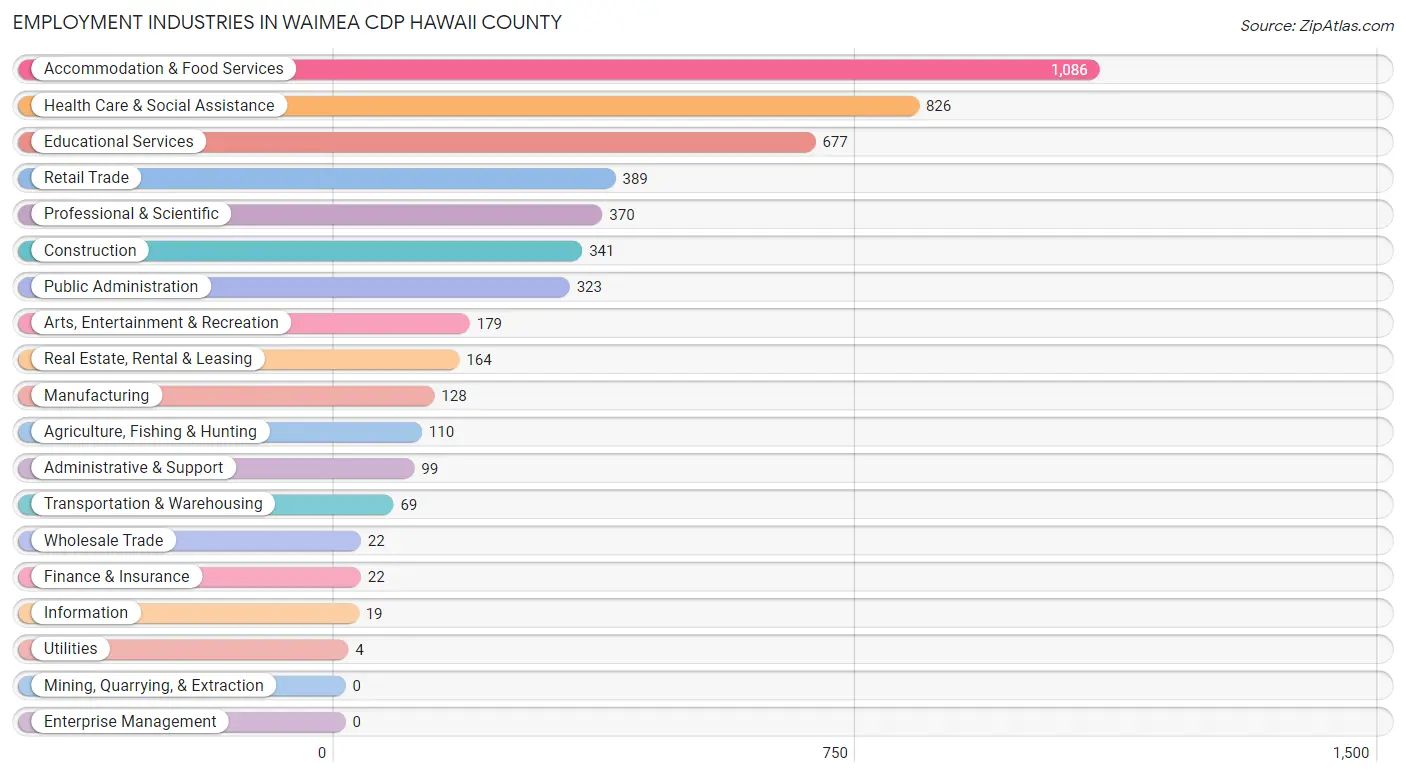
Employment Industries in Waimea CDP Hawaii County
The major employment industries in Waimea CDP Hawaii County include Accommodation & Food Services (1,086 | 21.3%), Health Care & Social Assistance (826 | 16.2%), Educational Services (677 | 13.3%), Retail Trade (389 | 7.6%), and Professional & Scientific (370 | 7.2%).
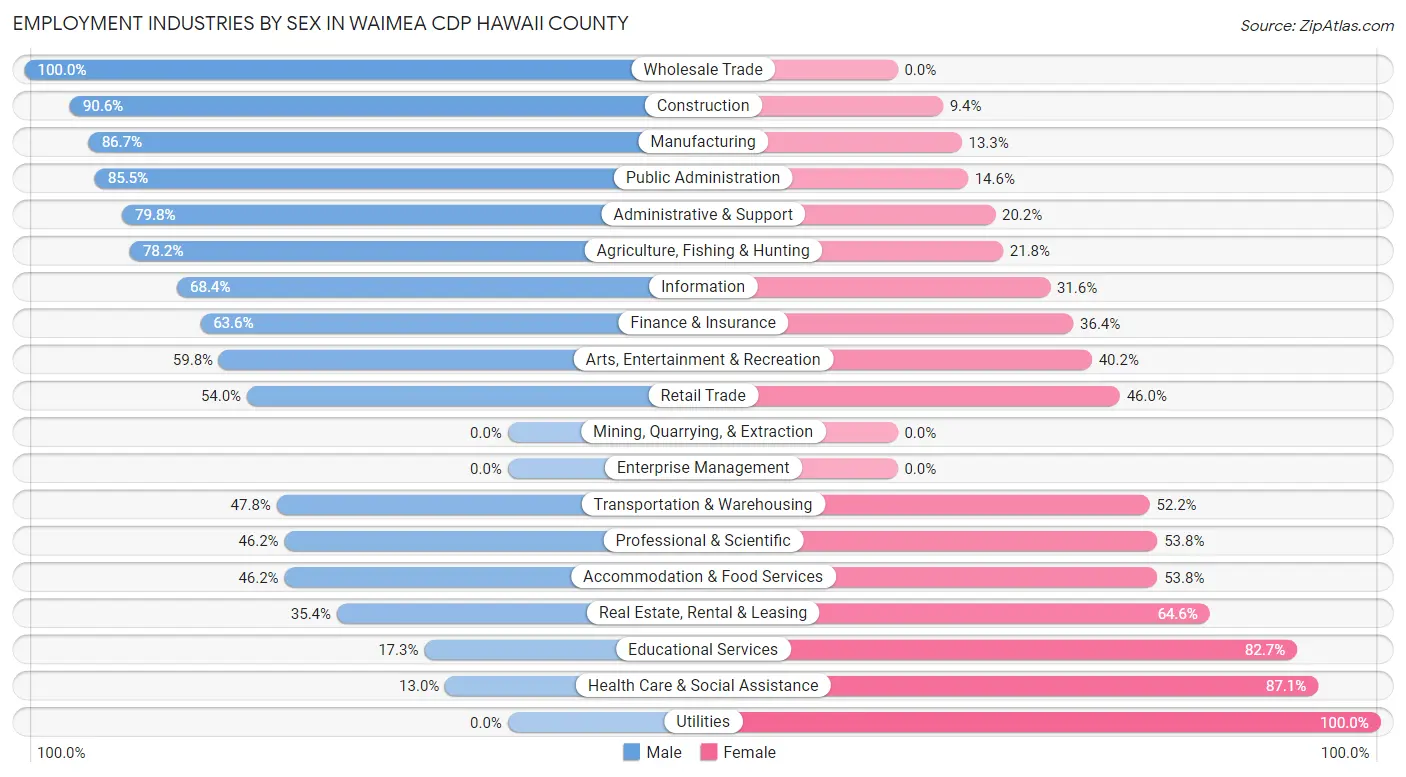
Employment Industries by Sex in Waimea CDP Hawaii County
The Waimea CDP Hawaii County industries that see more men than women are Wholesale Trade (100.0%), Construction (90.6%), and Manufacturing (86.7%), whereas the industries that tend to have a higher number of women are Utilities (100.0%), Health Care & Social Assistance (87.1%), and Educational Services (82.7%).
| Industry | Male | Female |
| Agriculture, Fishing & Hunting | 86 (78.2%) | 24 (21.8%) |
| Mining, Quarrying, & Extraction | 0 (0.0%) | 0 (0.0%) |
| Construction | 309 (90.6%) | 32 (9.4%) |
| Manufacturing | 111 (86.7%) | 17 (13.3%) |
| Wholesale Trade | 22 (100.0%) | 0 (0.0%) |
| Retail Trade | 210 (54.0%) | 179 (46.0%) |
| Transportation & Warehousing | 33 (47.8%) | 36 (52.2%) |
| Utilities | 0 (0.0%) | 4 (100.0%) |
| Information | 13 (68.4%) | 6 (31.6%) |
| Finance & Insurance | 14 (63.6%) | 8 (36.4%) |
| Real Estate, Rental & Leasing | 58 (35.4%) | 106 (64.6%) |
| Professional & Scientific | 171 (46.2%) | 199 (53.8%) |
| Enterprise Management | 0 (0.0%) | 0 (0.0%) |
| Administrative & Support | 79 (79.8%) | 20 (20.2%) |
| Educational Services | 117 (17.3%) | 560 (82.7%) |
| Health Care & Social Assistance | 107 (13.0%) | 719 (87.1%) |
| Arts, Entertainment & Recreation | 107 (59.8%) | 72 (40.2%) |
| Accommodation & Food Services | 502 (46.2%) | 584 (53.8%) |
| Public Administration | 276 (85.5%) | 47 (14.5%) |
| Total | 2,298 (45.0%) | 2,804 (55.0%) |
Education in Waimea CDP Hawaii County
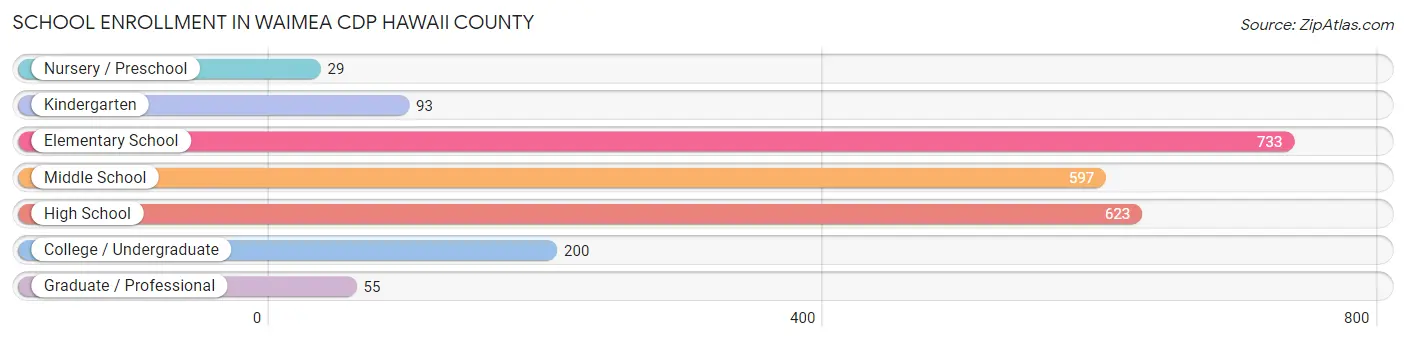
School Enrollment in Waimea CDP Hawaii County
The most common levels of schooling among the 2,330 students in Waimea CDP Hawaii County are elementary school (733 | 31.5%), high school (623 | 26.7%), and middle school (597 | 25.6%).
| School Level | # Students | % Students |
| Nursery / Preschool | 29 | 1.2% |
| Kindergarten | 93 | 4.0% |
| Elementary School | 733 | 31.5% |
| Middle School | 597 | 25.6% |
| High School | 623 | 26.7% |
| College / Undergraduate | 200 | 8.6% |
| Graduate / Professional | 55 | 2.4% |
| Total | 2,330 | 100.0% |
School Enrollment by Age by Funding Source in Waimea CDP Hawaii County
Out of a total of 2,330 students who are enrolled in schools in Waimea CDP Hawaii County, 555 (23.8%) attend a private institution, while the remaining 1,775 (76.2%) are enrolled in public schools. The age group of 3 to 4 year olds has the highest likelihood of being enrolled in private schools, with 27 (93.1% in the age bracket) enrolled. Conversely, the age group of 18 to 19 year olds has the lowest likelihood of being enrolled in a private school, with 19 (100.0% in the age bracket) attending a public institution.
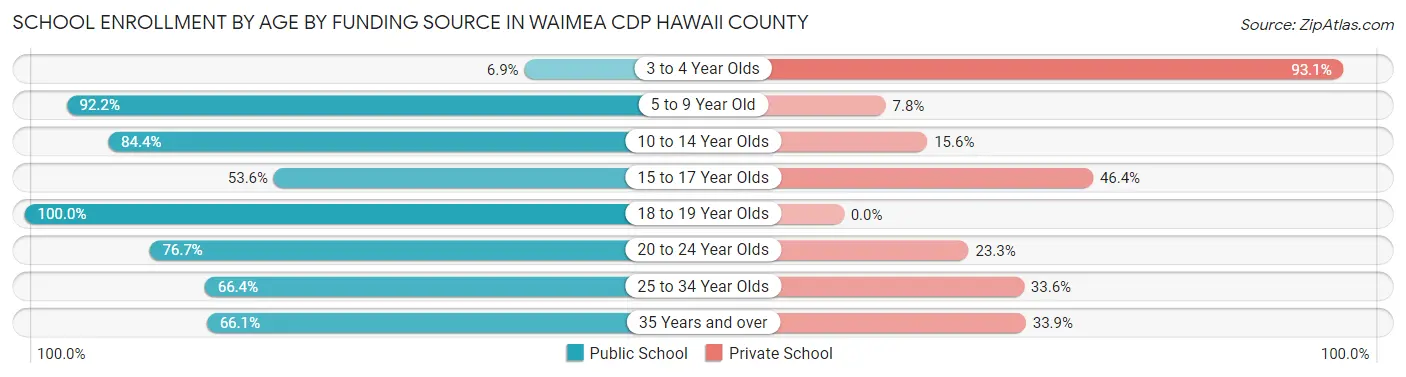
| Age Bracket | Public School | Private School |
| 3 to 4 Year Olds | 2 (6.9%) | 27 (93.1%) |
| 5 to 9 Year Old | 626 (92.2%) | 53 (7.8%) |
| 10 to 14 Year Olds | 640 (84.4%) | 118 (15.6%) |
| 15 to 17 Year Olds | 323 (53.6%) | 280 (46.4%) |
| 18 to 19 Year Olds | 19 (100.0%) | 0 (0.0%) |
| 20 to 24 Year Olds | 33 (76.7%) | 10 (23.3%) |
| 25 to 34 Year Olds | 95 (66.4%) | 48 (33.6%) |
| 35 Years and over | 37 (66.1%) | 19 (33.9%) |
| Total | 1,775 (76.2%) | 555 (23.8%) |
Educational Attainment by Field of Study in Waimea CDP Hawaii County
Bio, nature & agricultural (579 | 17.3%), social sciences (522 | 15.6%), business (425 | 12.7%), education (415 | 12.4%), and science & technology (272 | 8.1%) are the most common fields of study among 3,349 individuals in Waimea CDP Hawaii County who have obtained a bachelor's degree or higher.
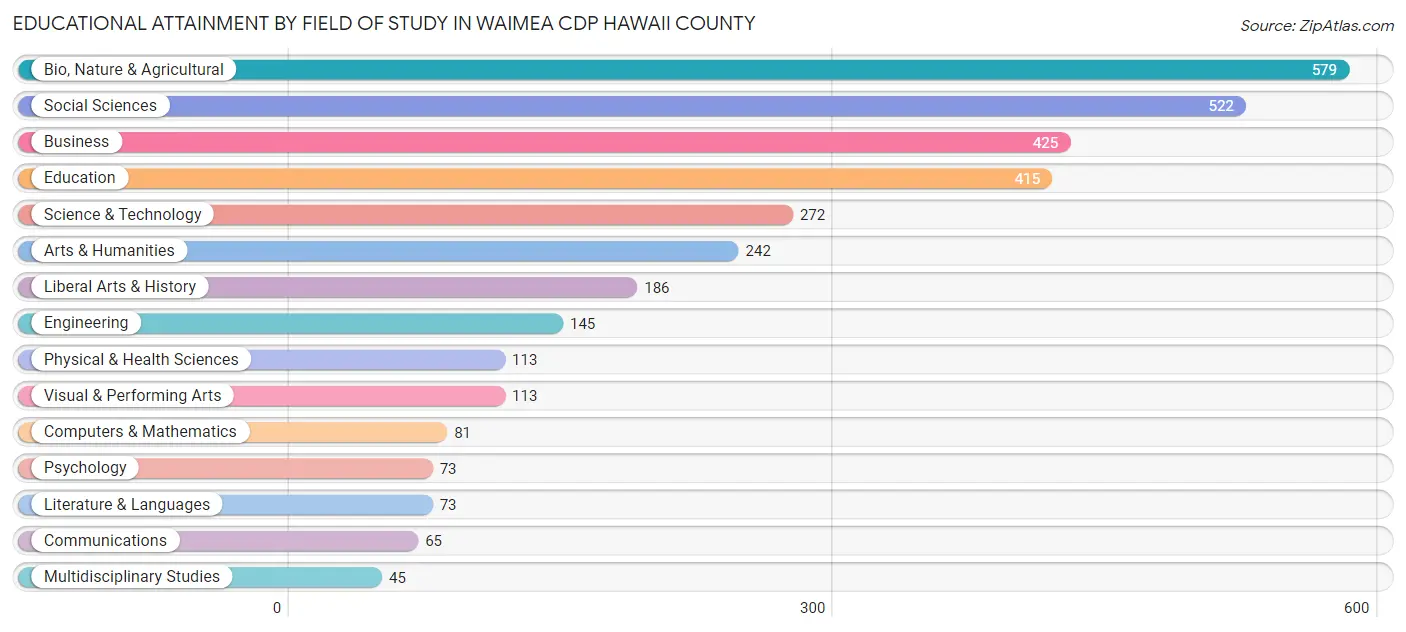
| Field of Study | # Graduates | % Graduates |
| Computers & Mathematics | 81 | 2.4% |
| Bio, Nature & Agricultural | 579 | 17.3% |
| Physical & Health Sciences | 113 | 3.4% |
| Psychology | 73 | 2.2% |
| Social Sciences | 522 | 15.6% |
| Engineering | 145 | 4.3% |
| Multidisciplinary Studies | 45 | 1.3% |
| Science & Technology | 272 | 8.1% |
| Business | 425 | 12.7% |
| Education | 415 | 12.4% |
| Literature & Languages | 73 | 2.2% |
| Liberal Arts & History | 186 | 5.6% |
| Visual & Performing Arts | 113 | 3.4% |
| Communications | 65 | 1.9% |
| Arts & Humanities | 242 | 7.2% |
| Total | 3,349 | 100.0% |
Transportation & Commute in Waimea CDP Hawaii County
Vehicle Availability by Sex in Waimea CDP Hawaii County
The most prevalent vehicle ownership categories in Waimea CDP Hawaii County are males with 2 vehicles (866, accounting for 37.8%) and females with 2 vehicles (1,204, making up 32.7%).
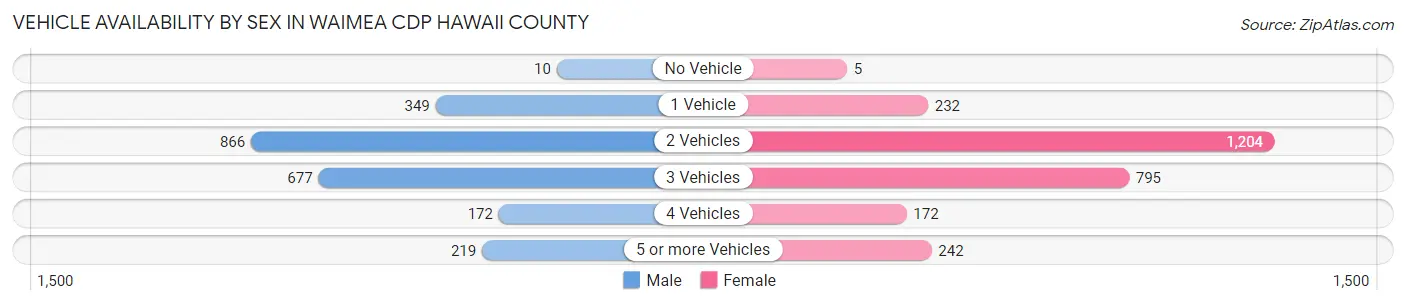
| Vehicles Available | Male | Female |
| No Vehicle | 10 (0.4%) | 5 (0.2%) |
| 1 Vehicle | 349 (15.2%) | 232 (8.7%) |
| 2 Vehicles | 866 (37.8%) | 1,204 (45.4%) |
| 3 Vehicles | 677 (29.5%) | 795 (30.0%) |
| 4 Vehicles | 172 (7.5%) | 172 (6.5%) |
| 5 or more Vehicles | 219 (9.6%) | 242 (9.1%) |
| Total | 2,293 (100.0%) | 2,650 (100.0%) |
Commute Time in Waimea CDP Hawaii County
The most frequently occuring commute durations in Waimea CDP Hawaii County are 10 to 14 minutes (817 commuters, 19.2%), 45 to 59 minutes (814 commuters, 19.1%), and 15 to 19 minutes (476 commuters, 11.2%).
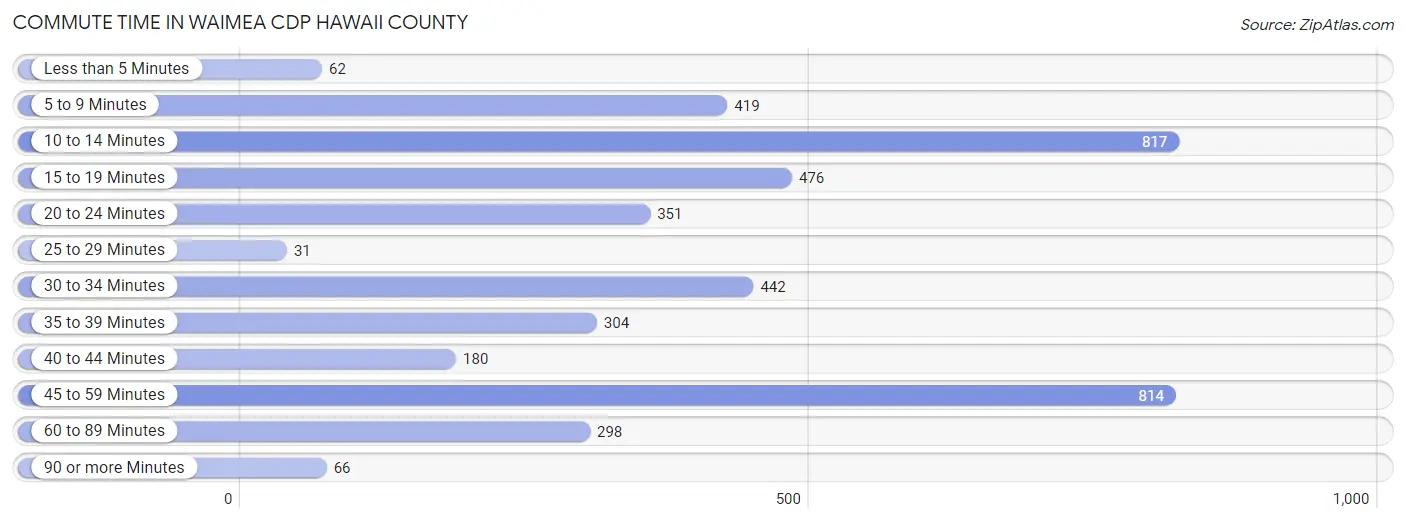
| Commute Time | # Commuters | % Commuters |
| Less than 5 Minutes | 62 | 1.5% |
| 5 to 9 Minutes | 419 | 9.8% |
| 10 to 14 Minutes | 817 | 19.2% |
| 15 to 19 Minutes | 476 | 11.2% |
| 20 to 24 Minutes | 351 | 8.2% |
| 25 to 29 Minutes | 31 | 0.7% |
| 30 to 34 Minutes | 442 | 10.4% |
| 35 to 39 Minutes | 304 | 7.1% |
| 40 to 44 Minutes | 180 | 4.2% |
| 45 to 59 Minutes | 814 | 19.1% |
| 60 to 89 Minutes | 298 | 7.0% |
| 90 or more Minutes | 66 | 1.5% |
Commute Time by Sex in Waimea CDP Hawaii County
The most common commute times in Waimea CDP Hawaii County are 45 to 59 minutes (393 commuters, 19.9%) for males and 10 to 14 minutes (543 commuters, 23.8%) for females.
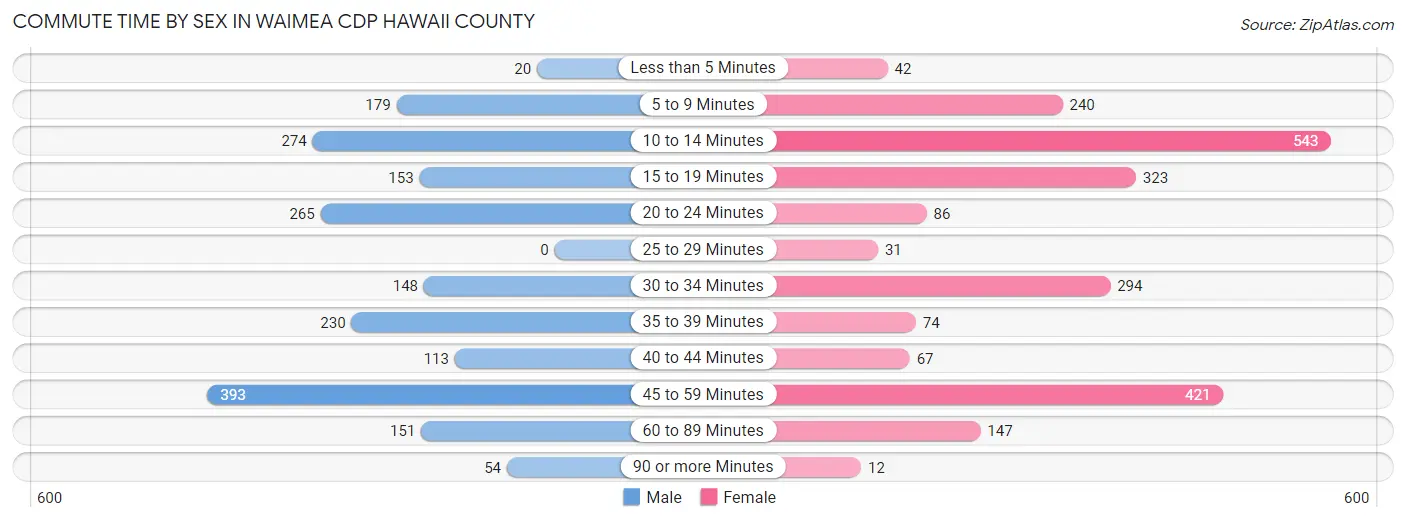
| Commute Time | Male | Female |
| Less than 5 Minutes | 20 (1.0%) | 42 (1.8%) |
| 5 to 9 Minutes | 179 (9.0%) | 240 (10.5%) |
| 10 to 14 Minutes | 274 (13.8%) | 543 (23.8%) |
| 15 to 19 Minutes | 153 (7.7%) | 323 (14.2%) |
| 20 to 24 Minutes | 265 (13.4%) | 86 (3.8%) |
| 25 to 29 Minutes | 0 (0.0%) | 31 (1.4%) |
| 30 to 34 Minutes | 148 (7.5%) | 294 (12.9%) |
| 35 to 39 Minutes | 230 (11.6%) | 74 (3.3%) |
| 40 to 44 Minutes | 113 (5.7%) | 67 (2.9%) |
| 45 to 59 Minutes | 393 (19.9%) | 421 (18.5%) |
| 60 to 89 Minutes | 151 (7.6%) | 147 (6.5%) |
| 90 or more Minutes | 54 (2.7%) | 12 (0.5%) |
Time of Departure to Work by Sex in Waimea CDP Hawaii County
The most frequent times of departure to work in Waimea CDP Hawaii County are 6:00 AM to 6:29 AM (287, 14.5%) for males and 7:00 AM to 7:29 AM (468, 20.5%) for females.
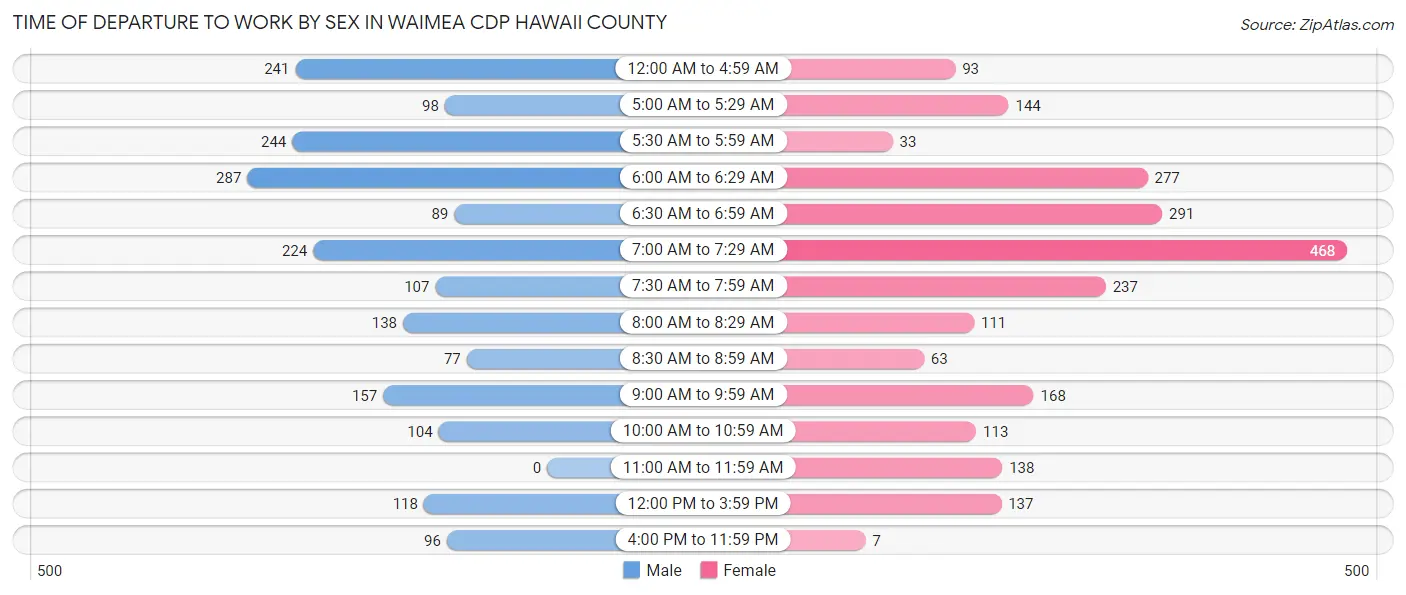
| Time of Departure | Male | Female |
| 12:00 AM to 4:59 AM | 241 (12.2%) | 93 (4.1%) |
| 5:00 AM to 5:29 AM | 98 (5.0%) | 144 (6.3%) |
| 5:30 AM to 5:59 AM | 244 (12.3%) | 33 (1.5%) |
| 6:00 AM to 6:29 AM | 287 (14.5%) | 277 (12.1%) |
| 6:30 AM to 6:59 AM | 89 (4.5%) | 291 (12.8%) |
| 7:00 AM to 7:29 AM | 224 (11.3%) | 468 (20.5%) |
| 7:30 AM to 7:59 AM | 107 (5.4%) | 237 (10.4%) |
| 8:00 AM to 8:29 AM | 138 (7.0%) | 111 (4.9%) |
| 8:30 AM to 8:59 AM | 77 (3.9%) | 63 (2.8%) |
| 9:00 AM to 9:59 AM | 157 (7.9%) | 168 (7.4%) |
| 10:00 AM to 10:59 AM | 104 (5.2%) | 113 (5.0%) |
| 11:00 AM to 11:59 AM | 0 (0.0%) | 138 (6.0%) |
| 12:00 PM to 3:59 PM | 118 (6.0%) | 137 (6.0%) |
| 4:00 PM to 11:59 PM | 96 (4.9%) | 7 (0.3%) |
| Total | 1,980 (100.0%) | 2,280 (100.0%) |
Housing Occupancy in Waimea CDP Hawaii County
Occupancy by Ownership in Waimea CDP Hawaii County
Of the total 3,588 dwellings in Waimea CDP Hawaii County, owner-occupied units account for 2,483 (69.2%), while renter-occupied units make up 1,105 (30.8%).
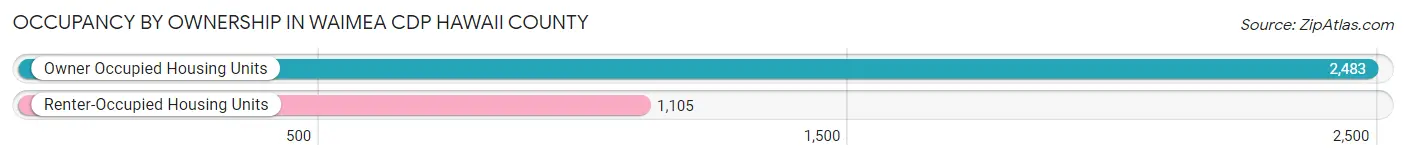
| Occupancy | # Housing Units | % Housing Units |
| Owner Occupied Housing Units | 2,483 | 69.2% |
| Renter-Occupied Housing Units | 1,105 | 30.8% |
| Total Occupied Housing Units | 3,588 | 100.0% |
Occupancy by Household Size in Waimea CDP Hawaii County
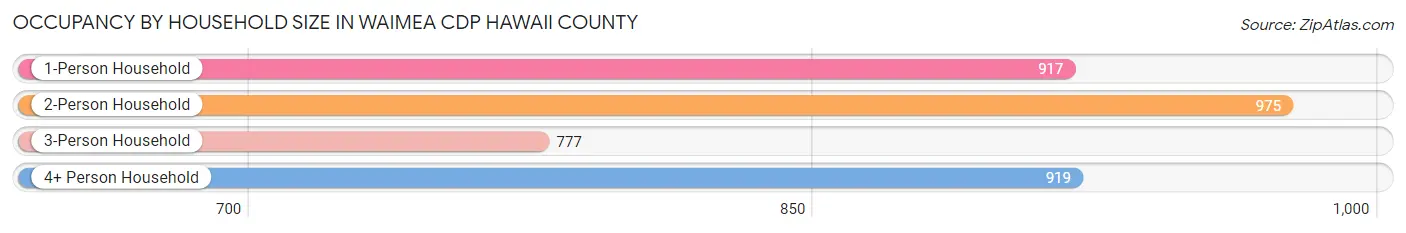
| Household Size | # Housing Units | % Housing Units |
| 1-Person Household | 917 | 25.6% |
| 2-Person Household | 975 | 27.2% |
| 3-Person Household | 777 | 21.7% |
| 4+ Person Household | 919 | 25.6% |
| Total Housing Units | 3,588 | 100.0% |
Occupancy by Ownership by Household Size in Waimea CDP Hawaii County
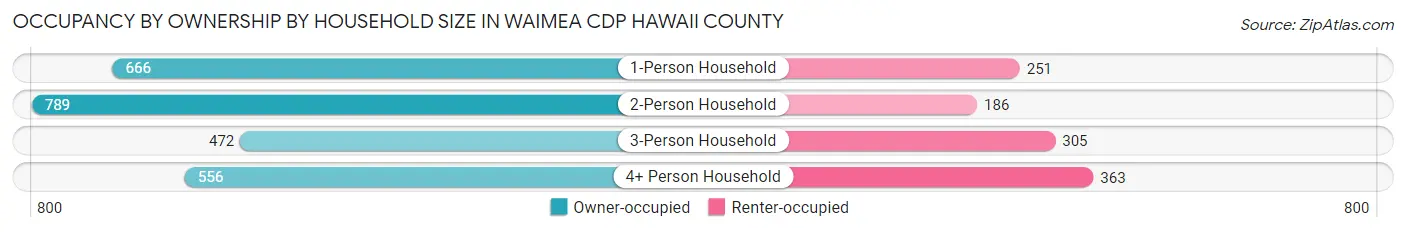
| Household Size | Owner-occupied | Renter-occupied |
| 1-Person Household | 666 (72.6%) | 251 (27.4%) |
| 2-Person Household | 789 (80.9%) | 186 (19.1%) |
| 3-Person Household | 472 (60.8%) | 305 (39.3%) |
| 4+ Person Household | 556 (60.5%) | 363 (39.5%) |
| Total Housing Units | 2,483 (69.2%) | 1,105 (30.8%) |
Occupancy by Educational Attainment in Waimea CDP Hawaii County
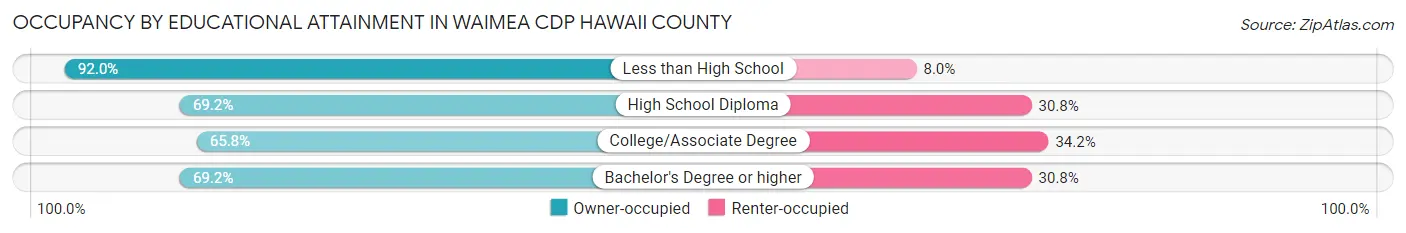
| Household Size | Owner-occupied | Renter-occupied |
| Less than High School | 138 (92.0%) | 12 (8.0%) |
| High School Diploma | 557 (69.2%) | 248 (30.8%) |
| College/Associate Degree | 661 (65.8%) | 343 (34.2%) |
| Bachelor's Degree or higher | 1,127 (69.2%) | 502 (30.8%) |
Occupancy by Age of Householder in Waimea CDP Hawaii County
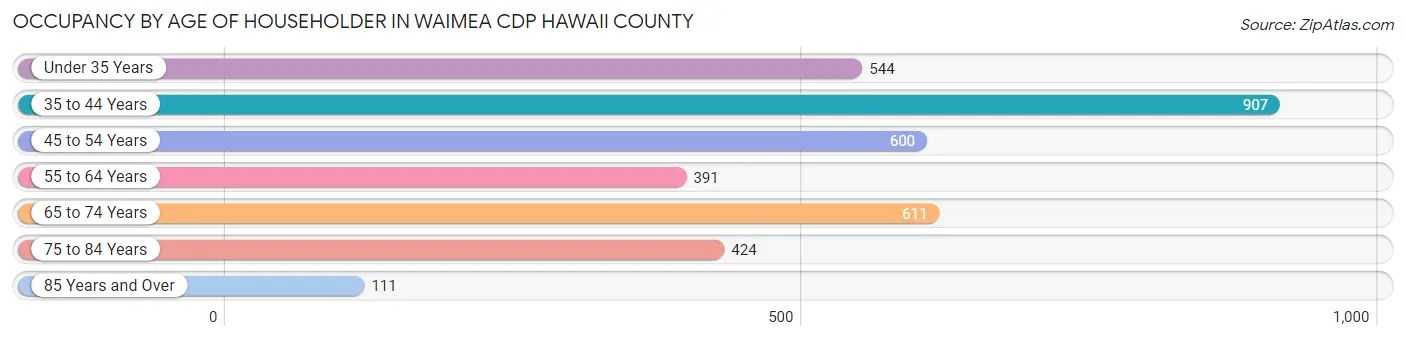
| Age Bracket | # Households | % Households |
| Under 35 Years | 544 | 15.2% |
| 35 to 44 Years | 907 | 25.3% |
| 45 to 54 Years | 600 | 16.7% |
| 55 to 64 Years | 391 | 10.9% |
| 65 to 74 Years | 611 | 17.0% |
| 75 to 84 Years | 424 | 11.8% |
| 85 Years and Over | 111 | 3.1% |
| Total | 3,588 | 100.0% |
Housing Finances in Waimea CDP Hawaii County
Median Income by Occupancy in Waimea CDP Hawaii County
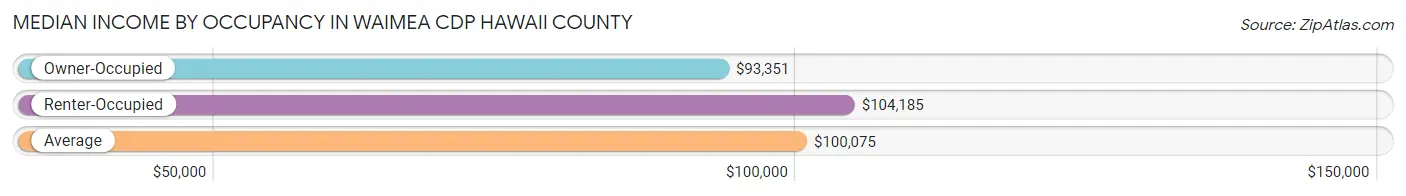
| Occupancy Type | # Households | Median Income |
| Owner-Occupied | 2,483 (69.2%) | $93,351 |
| Renter-Occupied | 1,105 (30.8%) | $104,185 |
| Average | 3,588 (100.0%) | $100,075 |
Occupancy by Householder Income Bracket in Waimea CDP Hawaii County
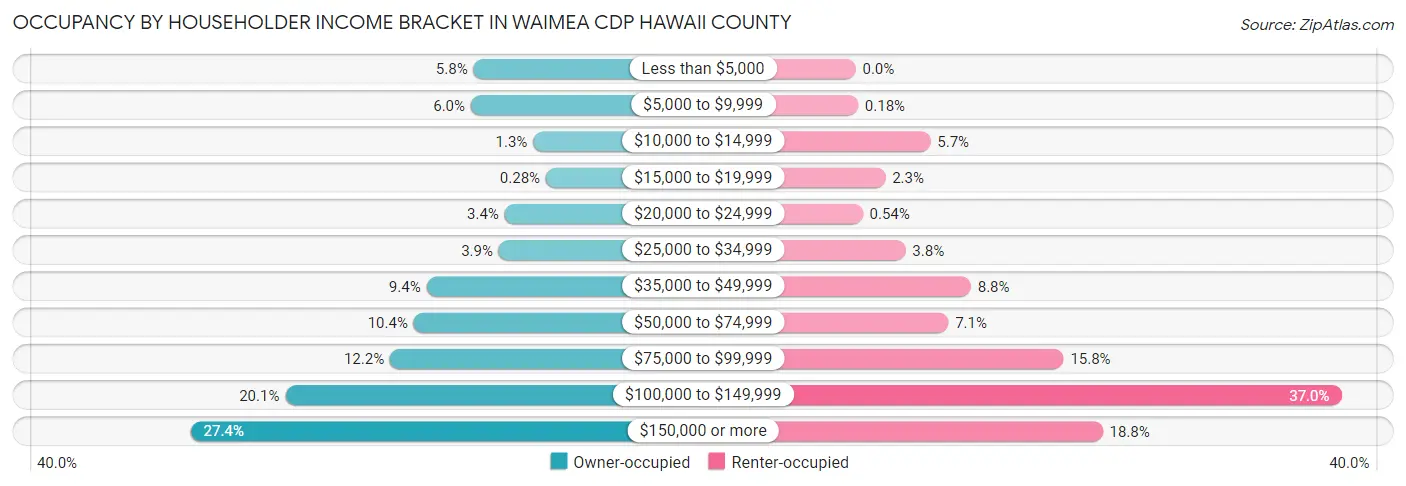
| Income Bracket | Owner-occupied | Renter-occupied |
| Less than $5,000 | 144 (5.8%) | 0 (0.0%) |
| $5,000 to $9,999 | 149 (6.0%) | 2 (0.2%) |
| $10,000 to $14,999 | 31 (1.3%) | 63 (5.7%) |
| $15,000 to $19,999 | 7 (0.3%) | 25 (2.3%) |
| $20,000 to $24,999 | 85 (3.4%) | 6 (0.5%) |
| $25,000 to $34,999 | 96 (3.9%) | 42 (3.8%) |
| $35,000 to $49,999 | 233 (9.4%) | 97 (8.8%) |
| $50,000 to $74,999 | 257 (10.3%) | 78 (7.1%) |
| $75,000 to $99,999 | 302 (12.2%) | 175 (15.8%) |
| $100,000 to $149,999 | 500 (20.1%) | 409 (37.0%) |
| $150,000 or more | 679 (27.4%) | 208 (18.8%) |
| Total | 2,483 (100.0%) | 1,105 (100.0%) |
Monthly Housing Cost Tiers in Waimea CDP Hawaii County
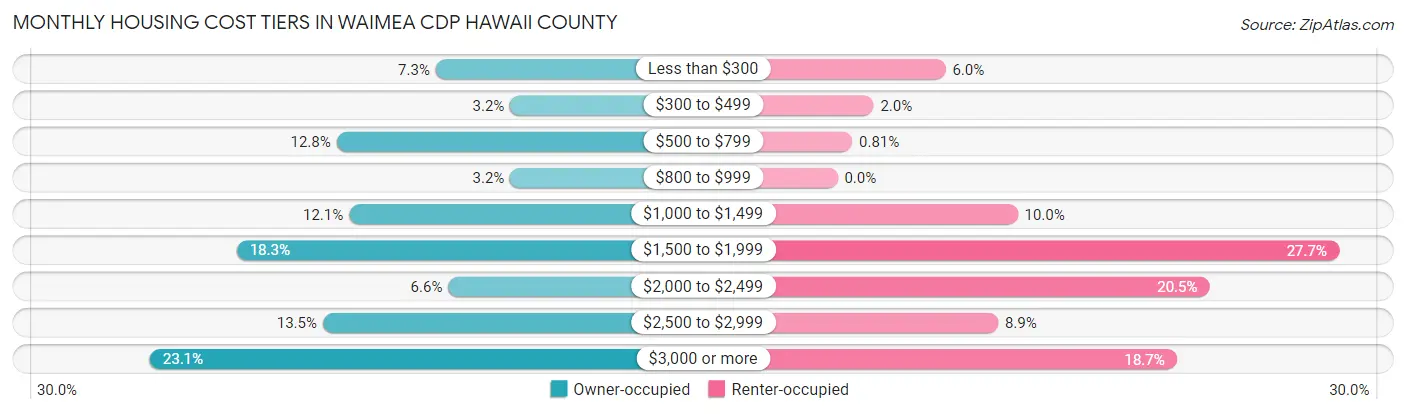
| Monthly Cost | Owner-occupied | Renter-occupied |
| Less than $300 | 181 (7.3%) | 66 (6.0%) |
| $300 to $499 | 79 (3.2%) | 22 (2.0%) |
| $500 to $799 | 317 (12.8%) | 9 (0.8%) |
| $800 to $999 | 79 (3.2%) | 0 (0.0%) |
| $1,000 to $1,499 | 300 (12.1%) | 110 (10.0%) |
| $1,500 to $1,999 | 454 (18.3%) | 306 (27.7%) |
| $2,000 to $2,499 | 164 (6.6%) | 227 (20.5%) |
| $2,500 to $2,999 | 336 (13.5%) | 98 (8.9%) |
| $3,000 or more | 573 (23.1%) | 207 (18.7%) |
| Total | 2,483 (100.0%) | 1,105 (100.0%) |
Physical Housing Characteristics in Waimea CDP Hawaii County
Housing Structures in Waimea CDP Hawaii County
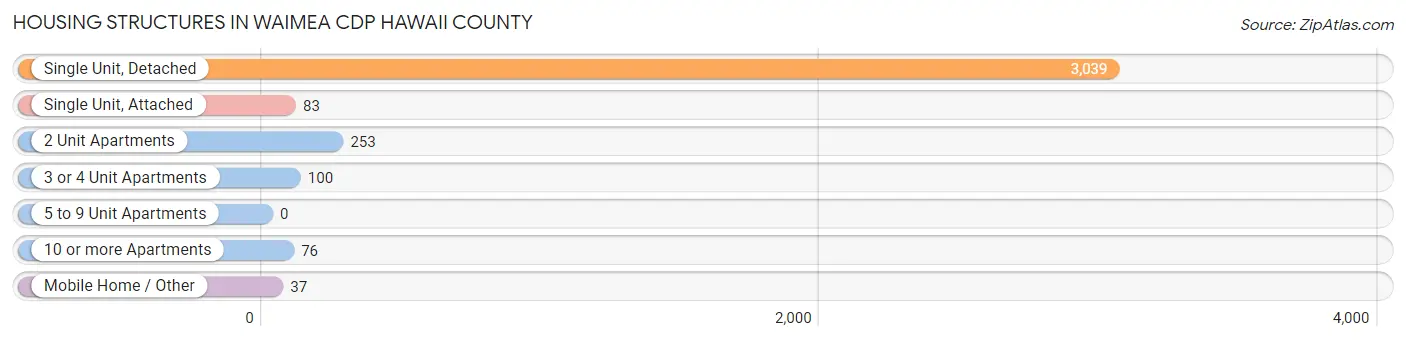
| Structure Type | # Housing Units | % Housing Units |
| Single Unit, Detached | 3,039 | 84.7% |
| Single Unit, Attached | 83 | 2.3% |
| 2 Unit Apartments | 253 | 7.0% |
| 3 or 4 Unit Apartments | 100 | 2.8% |
| 5 to 9 Unit Apartments | 0 | 0.0% |
| 10 or more Apartments | 76 | 2.1% |
| Mobile Home / Other | 37 | 1.0% |
| Total | 3,588 | 100.0% |
Housing Structures by Occupancy in Waimea CDP Hawaii County
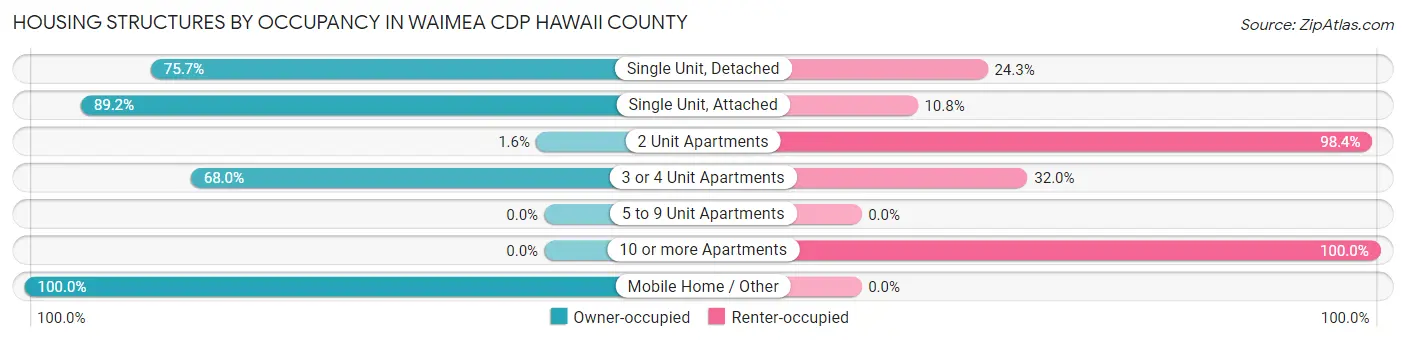
| Structure Type | Owner-occupied | Renter-occupied |
| Single Unit, Detached | 2,300 (75.7%) | 739 (24.3%) |
| Single Unit, Attached | 74 (89.2%) | 9 (10.8%) |
| 2 Unit Apartments | 4 (1.6%) | 249 (98.4%) |
| 3 or 4 Unit Apartments | 68 (68.0%) | 32 (32.0%) |
| 5 to 9 Unit Apartments | 0 (0.0%) | 0 (0.0%) |
| 10 or more Apartments | 0 (0.0%) | 76 (100.0%) |
| Mobile Home / Other | 37 (100.0%) | 0 (0.0%) |
| Total | 2,483 (69.2%) | 1,105 (30.8%) |
Housing Structures by Number of Rooms in Waimea CDP Hawaii County
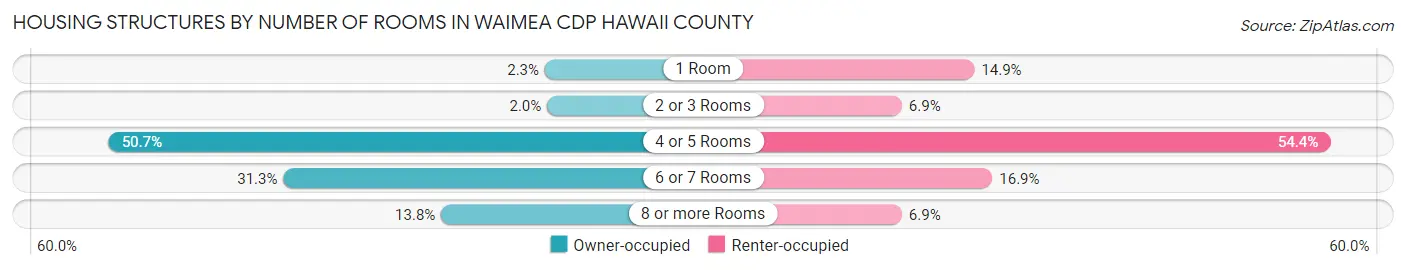
| Number of Rooms | Owner-occupied | Renter-occupied |
| 1 Room | 56 (2.3%) | 165 (14.9%) |
| 2 or 3 Rooms | 50 (2.0%) | 76 (6.9%) |
| 4 or 5 Rooms | 1,258 (50.7%) | 601 (54.4%) |
| 6 or 7 Rooms | 777 (31.3%) | 187 (16.9%) |
| 8 or more Rooms | 342 (13.8%) | 76 (6.9%) |
| Total | 2,483 (100.0%) | 1,105 (100.0%) |
Housing Structure by Heating Type in Waimea CDP Hawaii County
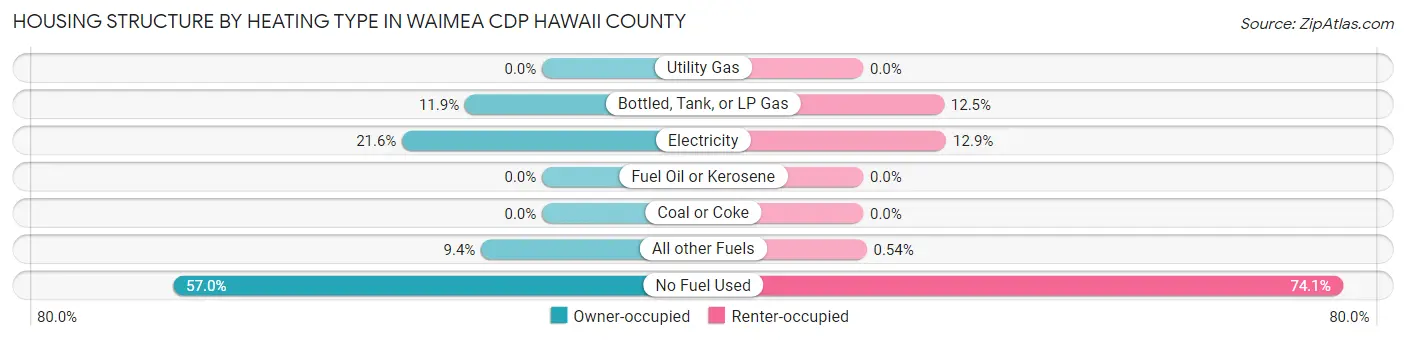
| Heating Type | Owner-occupied | Renter-occupied |
| Utility Gas | 0 (0.0%) | 0 (0.0%) |
| Bottled, Tank, or LP Gas | 296 (11.9%) | 138 (12.5%) |
| Electricity | 537 (21.6%) | 142 (12.9%) |
| Fuel Oil or Kerosene | 0 (0.0%) | 0 (0.0%) |
| Coal or Coke | 0 (0.0%) | 0 (0.0%) |
| All other Fuels | 234 (9.4%) | 6 (0.5%) |
| No Fuel Used | 1,416 (57.0%) | 819 (74.1%) |
| Total | 2,483 (100.0%) | 1,105 (100.0%) |
Household Vehicle Usage in Waimea CDP Hawaii County
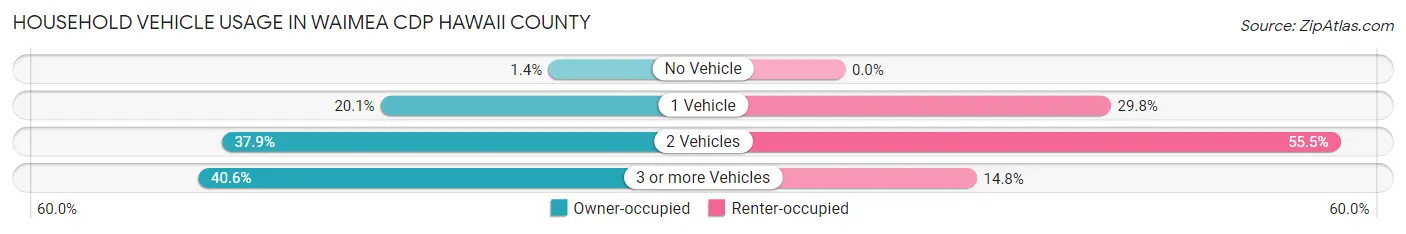
| Vehicles per Household | Owner-occupied | Renter-occupied |
| No Vehicle | 34 (1.4%) | 0 (0.0%) |
| 1 Vehicle | 500 (20.1%) | 329 (29.8%) |
| 2 Vehicles | 942 (37.9%) | 613 (55.5%) |
| 3 or more Vehicles | 1,007 (40.6%) | 163 (14.7%) |
| Total | 2,483 (100.0%) | 1,105 (100.0%) |
Real Estate & Mortgages in Waimea CDP Hawaii County
Real Estate and Mortgage Overview in Waimea CDP Hawaii County
| Characteristic | Without Mortgage | With Mortgage |
| Housing Units | 584 | 1,899 |
| Median Property Value | $580,100 | $624,700 |
| Median Household Income | $93,041 | $511 |
| Monthly Housing Costs | $531 | $568 |
| Real Estate Taxes | $1,366 | $67 |
Property Value by Mortgage Status in Waimea CDP Hawaii County
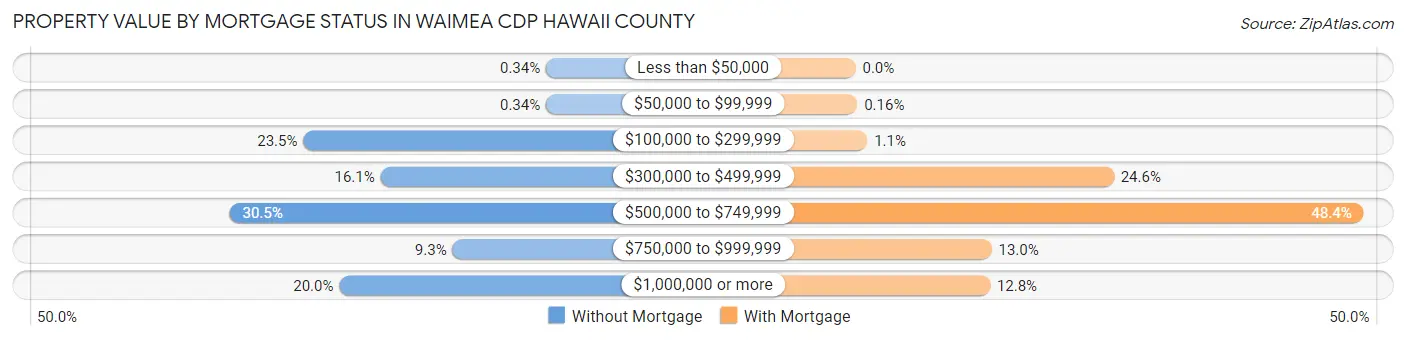
| Property Value | Without Mortgage | With Mortgage |
| Less than $50,000 | 2 (0.3%) | 0 (0.0%) |
| $50,000 to $99,999 | 2 (0.3%) | 3 (0.2%) |
| $100,000 to $299,999 | 137 (23.5%) | 21 (1.1%) |
| $300,000 to $499,999 | 94 (16.1%) | 467 (24.6%) |
| $500,000 to $749,999 | 178 (30.5%) | 919 (48.4%) |
| $750,000 to $999,999 | 54 (9.2%) | 246 (13.0%) |
| $1,000,000 or more | 117 (20.0%) | 243 (12.8%) |
| Total | 584 (100.0%) | 1,899 (100.0%) |
Household Income by Mortgage Status in Waimea CDP Hawaii County
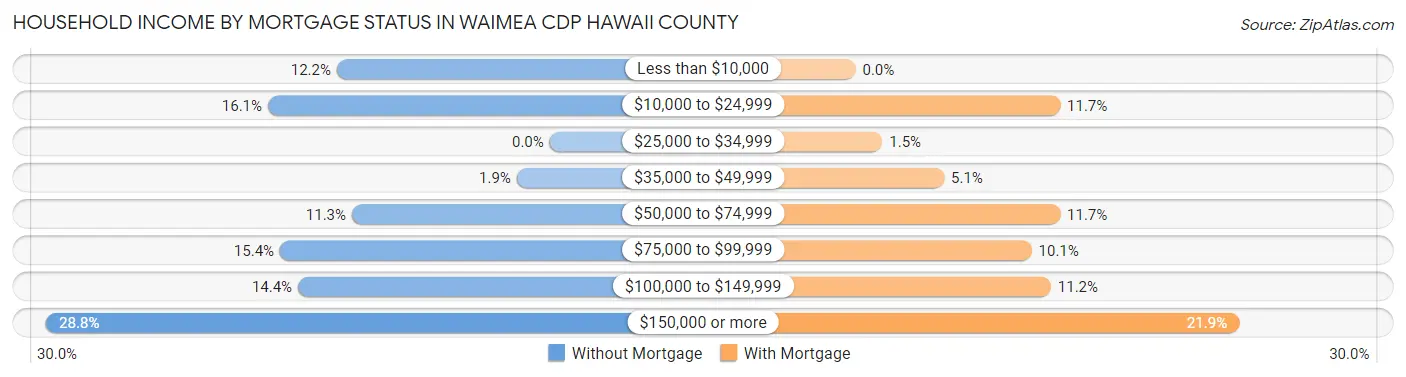
| Household Income | Without Mortgage | With Mortgage |
| Less than $10,000 | 71 (12.2%) | 0 (0.0%) |
| $10,000 to $24,999 | 94 (16.1%) | 222 (11.7%) |
| $25,000 to $34,999 | 0 (0.0%) | 29 (1.5%) |
| $35,000 to $49,999 | 11 (1.9%) | 96 (5.1%) |
| $50,000 to $74,999 | 66 (11.3%) | 222 (11.7%) |
| $75,000 to $99,999 | 90 (15.4%) | 191 (10.1%) |
| $100,000 to $149,999 | 84 (14.4%) | 212 (11.2%) |
| $150,000 or more | 168 (28.8%) | 416 (21.9%) |
| Total | 584 (100.0%) | 1,899 (100.0%) |
Property Value to Household Income Ratio in Waimea CDP Hawaii County
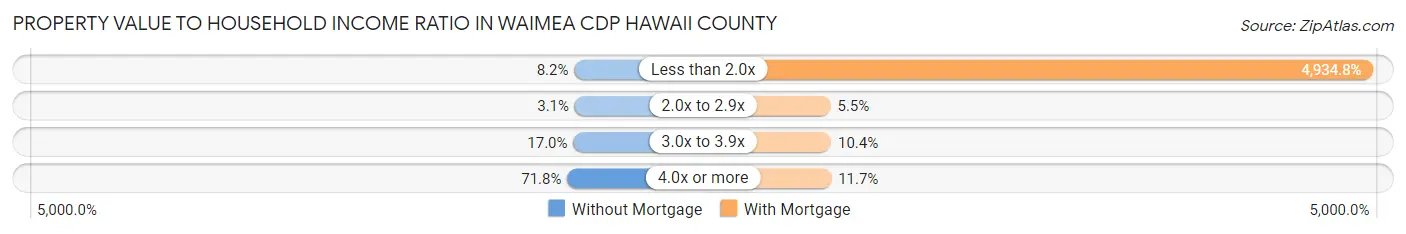
| Value-to-Income Ratio | Without Mortgage | With Mortgage |
| Less than 2.0x | 48 (8.2%) | 93,711 (4,934.8%) |
| 2.0x to 2.9x | 18 (3.1%) | 104 (5.5%) |
| 3.0x to 3.9x | 99 (17.0%) | 198 (10.4%) |
| 4.0x or more | 419 (71.8%) | 222 (11.7%) |
| Total | 584 (100.0%) | 1,899 (100.0%) |
Real Estate Taxes by Mortgage Status in Waimea CDP Hawaii County
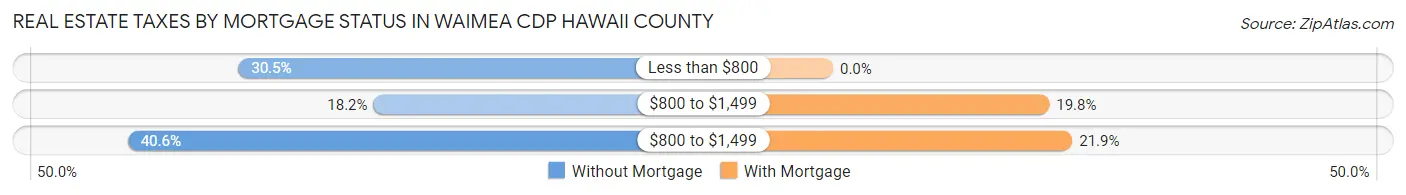
| Property Taxes | Without Mortgage | With Mortgage |
| Less than $800 | 178 (30.5%) | 0 (0.0%) |
| $800 to $1,499 | 106 (18.1%) | 375 (19.8%) |
| $800 to $1,499 | 237 (40.6%) | 415 (21.8%) |
| Total | 584 (100.0%) | 1,899 (100.0%) |
Health & Disability in Waimea CDP Hawaii County
Health Insurance Coverage by Age in Waimea CDP Hawaii County
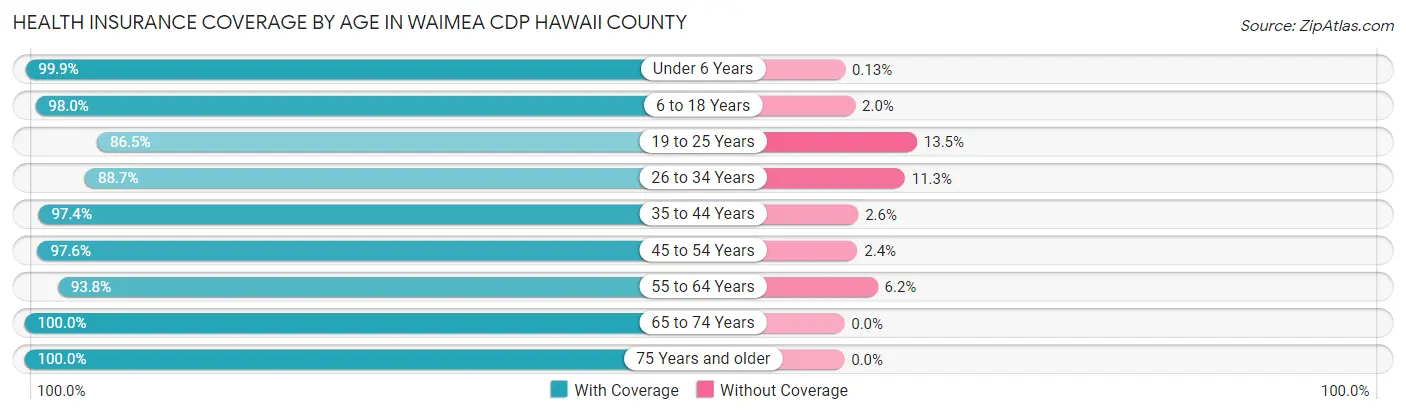
| Age Bracket | With Coverage | Without Coverage |
| Under 6 Years | 792 (99.9%) | 1 (0.1%) |
| 6 to 18 Years | 1,940 (98.0%) | 40 (2.0%) |
| 19 to 25 Years | 345 (86.5%) | 54 (13.5%) |
| 26 to 34 Years | 1,014 (88.7%) | 129 (11.3%) |
| 35 to 44 Years | 1,721 (97.4%) | 46 (2.6%) |
| 45 to 54 Years | 1,247 (97.6%) | 31 (2.4%) |
| 55 to 64 Years | 981 (93.8%) | 65 (6.2%) |
| 65 to 74 Years | 1,126 (100.0%) | 0 (0.0%) |
| 75 Years and older | 922 (100.0%) | 0 (0.0%) |
| Total | 10,088 (96.5%) | 366 (3.5%) |
Health Insurance Coverage by Citizenship Status in Waimea CDP Hawaii County
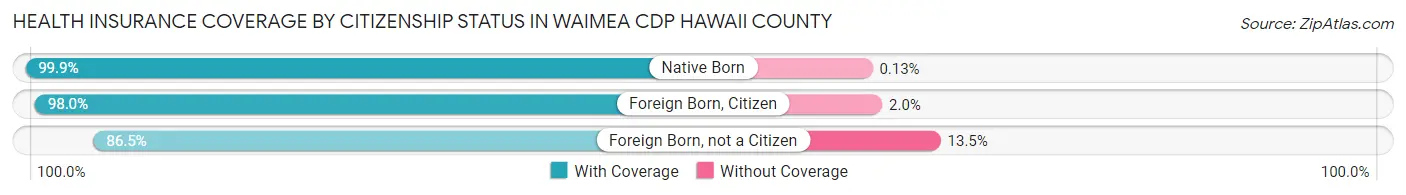
| Citizenship Status | With Coverage | Without Coverage |
| Native Born | 792 (99.9%) | 1 (0.1%) |
| Foreign Born, Citizen | 1,940 (98.0%) | 40 (2.0%) |
| Foreign Born, not a Citizen | 345 (86.5%) | 54 (13.5%) |
Health Insurance Coverage by Household Income in Waimea CDP Hawaii County
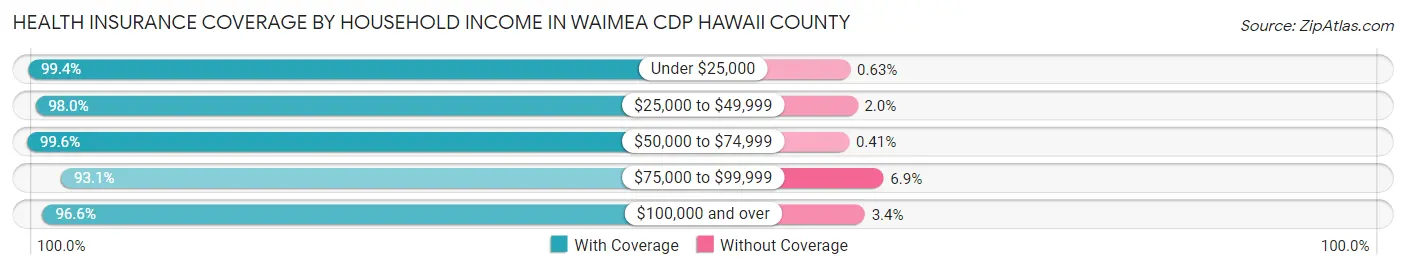
| Household Income | With Coverage | Without Coverage |
| Under $25,000 | 631 (99.4%) | 4 (0.6%) |
| $25,000 to $49,999 | 1,076 (98.0%) | 22 (2.0%) |
| $50,000 to $74,999 | 734 (99.6%) | 3 (0.4%) |
| $75,000 to $99,999 | 1,005 (93.1%) | 74 (6.9%) |
| $100,000 and over | 6,549 (96.6%) | 228 (3.4%) |
Public vs Private Health Insurance Coverage by Age in Waimea CDP Hawaii County
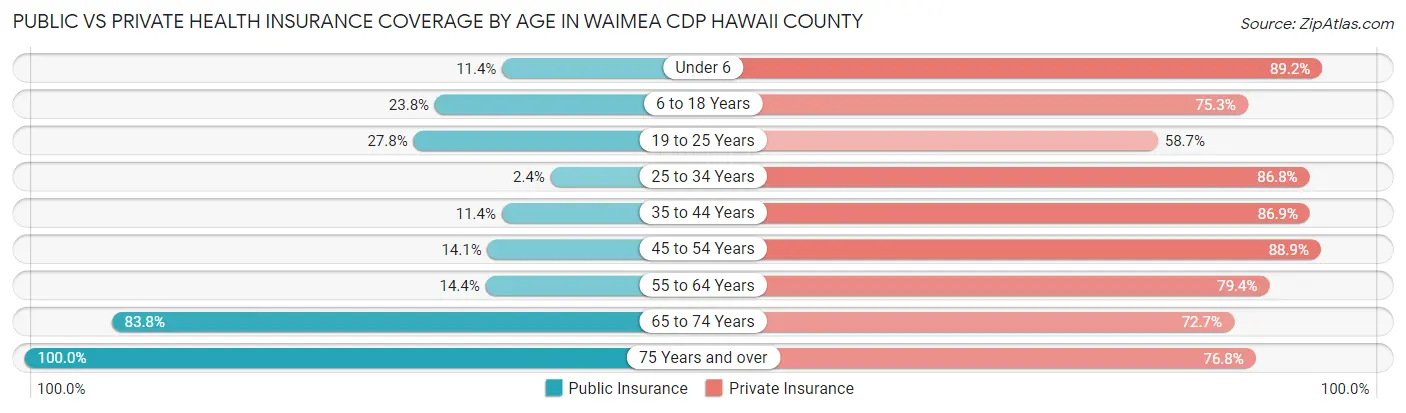
| Age Bracket | Public Insurance | Private Insurance |
| Under 6 | 90 (11.4%) | 707 (89.2%) |
| 6 to 18 Years | 472 (23.8%) | 1,491 (75.3%) |
| 19 to 25 Years | 111 (27.8%) | 234 (58.7%) |
| 25 to 34 Years | 27 (2.4%) | 992 (86.8%) |
| 35 to 44 Years | 202 (11.4%) | 1,535 (86.9%) |
| 45 to 54 Years | 180 (14.1%) | 1,136 (88.9%) |
| 55 to 64 Years | 151 (14.4%) | 830 (79.3%) |
| 65 to 74 Years | 944 (83.8%) | 819 (72.7%) |
| 75 Years and over | 922 (100.0%) | 708 (76.8%) |
| Total | 3,099 (29.6%) | 8,452 (80.8%) |
Disability Status by Sex by Age in Waimea CDP Hawaii County
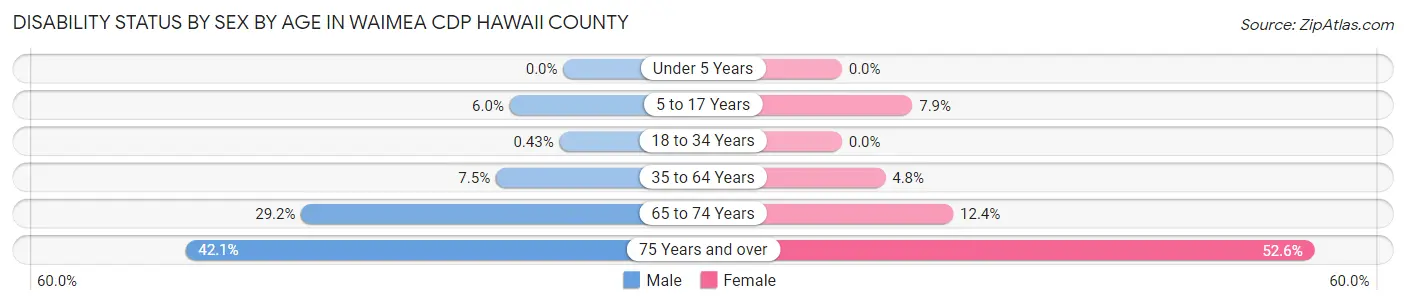
| Age Bracket | Male | Female |
| Under 5 Years | 0 (0.0%) | 0 (0.0%) |
| 5 to 17 Years | 58 (6.0%) | 84 (7.9%) |
| 18 to 34 Years | 3 (0.4%) | 0 (0.0%) |
| 35 to 64 Years | 141 (7.5%) | 107 (4.8%) |
| 65 to 74 Years | 138 (29.2%) | 81 (12.4%) |
| 75 Years and over | 181 (42.1%) | 259 (52.6%) |
Disability Class by Sex by Age in Waimea CDP Hawaii County
Disability Class: Hearing Difficulty
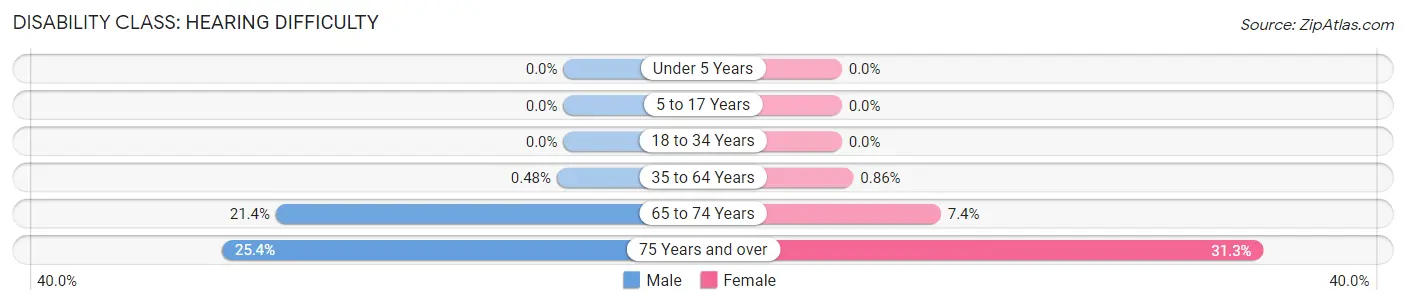
| Age Bracket | Male | Female |
| Under 5 Years | 0 (0.0%) | 0 (0.0%) |
| 5 to 17 Years | 0 (0.0%) | 0 (0.0%) |
| 18 to 34 Years | 0 (0.0%) | 0 (0.0%) |
| 35 to 64 Years | 9 (0.5%) | 19 (0.9%) |
| 65 to 74 Years | 101 (21.3%) | 48 (7.3%) |
| 75 Years and over | 109 (25.4%) | 154 (31.3%) |
Disability Class: Vision Difficulty
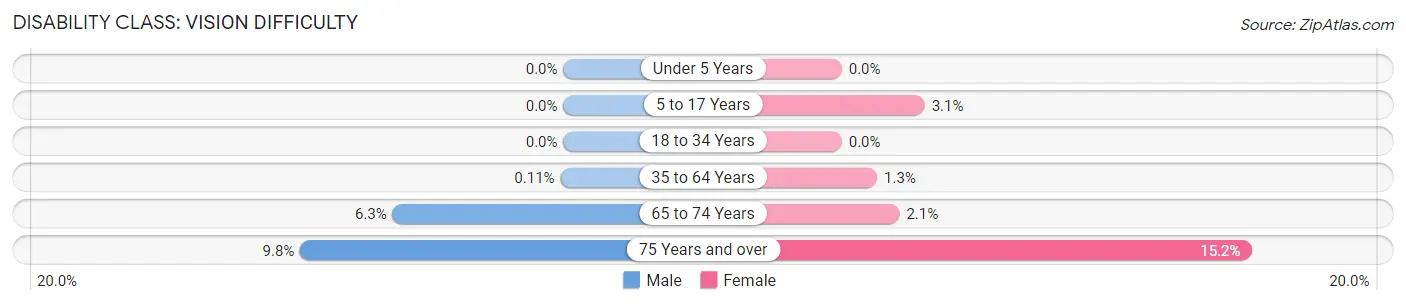
| Age Bracket | Male | Female |
| Under 5 Years | 0 (0.0%) | 0 (0.0%) |
| 5 to 17 Years | 0 (0.0%) | 33 (3.1%) |
| 18 to 34 Years | 0 (0.0%) | 0 (0.0%) |
| 35 to 64 Years | 2 (0.1%) | 29 (1.3%) |
| 65 to 74 Years | 30 (6.3%) | 14 (2.1%) |
| 75 Years and over | 42 (9.8%) | 75 (15.2%) |
Disability Class: Cognitive Difficulty
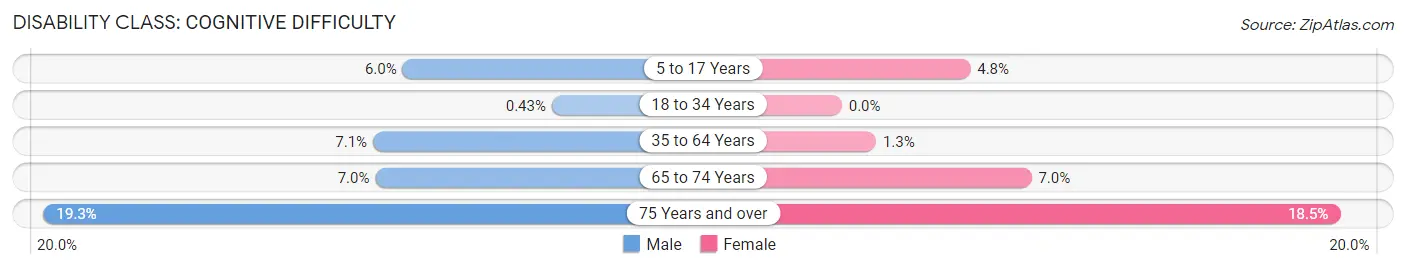
| Age Bracket | Male | Female |
| 5 to 17 Years | 58 (6.0%) | 51 (4.8%) |
| 18 to 34 Years | 3 (0.4%) | 0 (0.0%) |
| 35 to 64 Years | 133 (7.1%) | 28 (1.3%) |
| 65 to 74 Years | 33 (7.0%) | 46 (7.0%) |
| 75 Years and over | 83 (19.3%) | 91 (18.5%) |
Disability Class: Ambulatory Difficulty
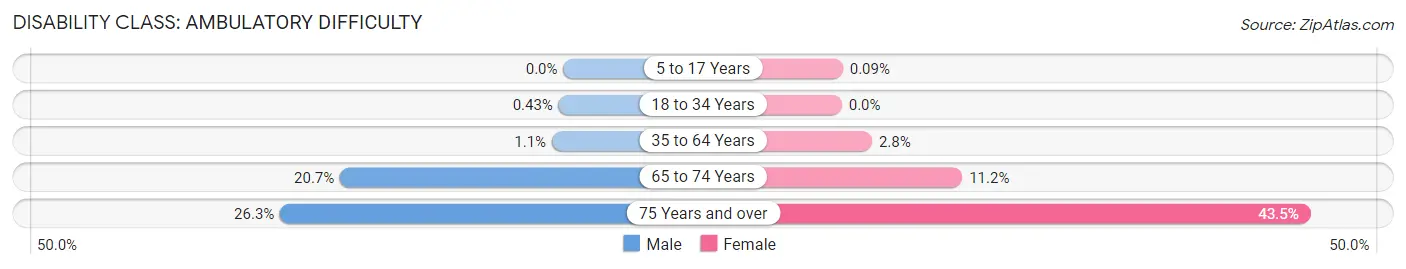
| Age Bracket | Male | Female |
| 5 to 17 Years | 0 (0.0%) | 1 (0.1%) |
| 18 to 34 Years | 3 (0.4%) | 0 (0.0%) |
| 35 to 64 Years | 20 (1.1%) | 62 (2.8%) |
| 65 to 74 Years | 98 (20.7%) | 73 (11.2%) |
| 75 Years and over | 113 (26.3%) | 214 (43.5%) |
Disability Class: Self-Care Difficulty
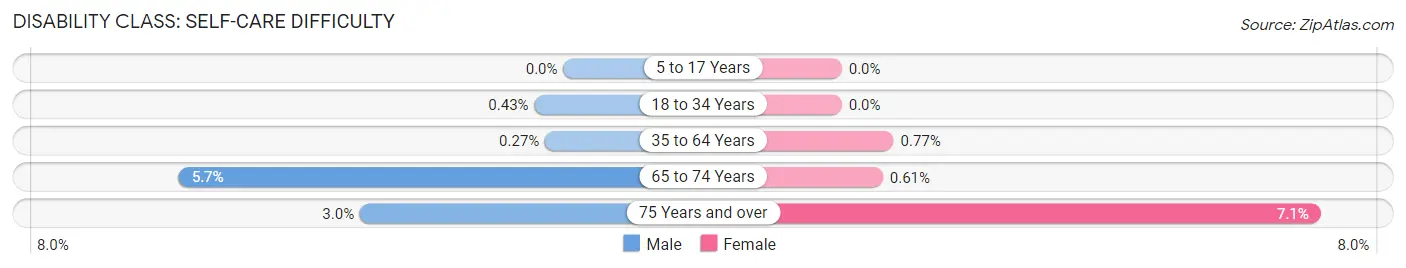
| Age Bracket | Male | Female |
| 5 to 17 Years | 0 (0.0%) | 0 (0.0%) |
| 18 to 34 Years | 3 (0.4%) | 0 (0.0%) |
| 35 to 64 Years | 5 (0.3%) | 17 (0.8%) |
| 65 to 74 Years | 27 (5.7%) | 4 (0.6%) |
| 75 Years and over | 13 (3.0%) | 35 (7.1%) |
Technology Access in Waimea CDP Hawaii County
Computing Device Access in Waimea CDP Hawaii County
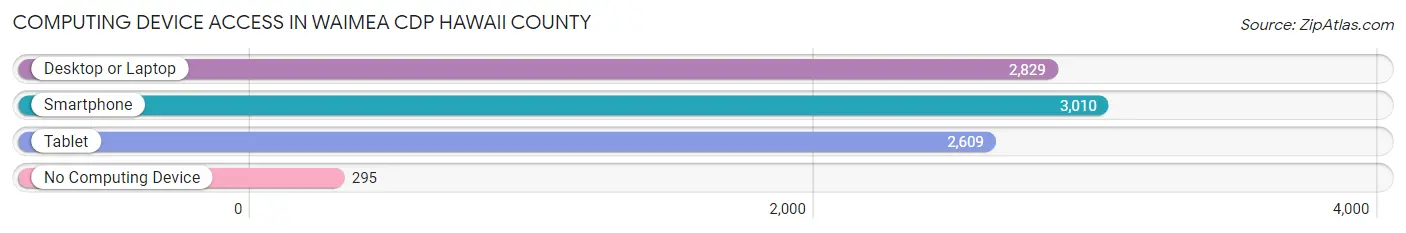
| Device Type | # Households | % Households |
| Desktop or Laptop | 2,829 | 78.8% |
| Smartphone | 3,010 | 83.9% |
| Tablet | 2,609 | 72.7% |
| No Computing Device | 295 | 8.2% |
| Total | 3,588 | 100.0% |
Internet Access in Waimea CDP Hawaii County
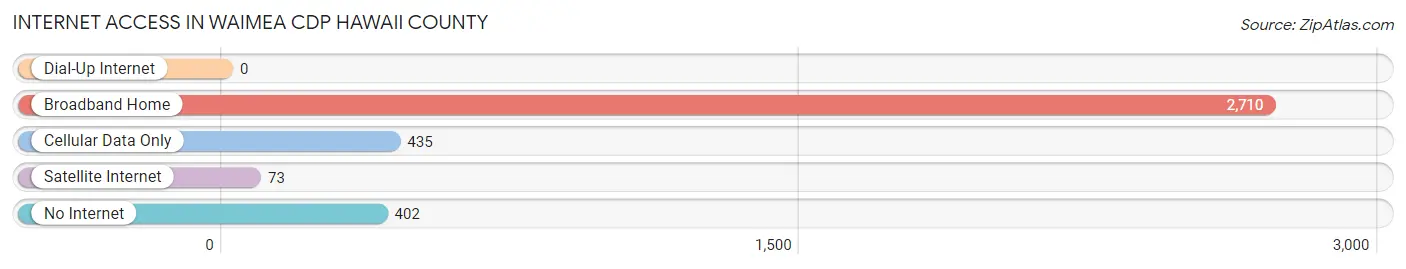
| Internet Type | # Households | % Households |
| Dial-Up Internet | 0 | 0.0% |
| Broadband Home | 2,710 | 75.5% |
| Cellular Data Only | 435 | 12.1% |
| Satellite Internet | 73 | 2.0% |
| No Internet | 402 | 11.2% |
| Total | 3,588 | 100.0% |
Waimea CDP Hawaii County Summary
Waimea Cdp Hawaii County, HI is a census-designated place (CDP) located in Hawaii County, Hawaii, United States. The population was 8,788 at the 2010 census, up from 7,028 at the 2000 census. Waimea Cdp is located on the western side of the Big Island of Hawaii, and is the largest town in the county.
History
Waimea Cdp has a long and rich history. The area was first settled by Polynesian voyagers in the late 1700s, and the first European settlers arrived in the early 1800s. The town was originally known as Waimea, and was the site of the first Christian mission in Hawaii. The mission was established in 1820 by Reverend William Ellis, and the town was renamed Waimea Cdp in 1832.
The town was an important center of commerce and culture in the early days of Hawaii. It was the site of the first sugar mill in the islands, and the first newspaper was published here in 1834. The town was also the site of the first public school in Hawaii, established in 1839.
In the late 1800s, Waimea Cdp became a center of the cattle industry in Hawaii. The town was home to several large ranches, and the cattle industry was a major source of income for the town.
In the early 1900s, Waimea Cdp became a popular tourist destination. The town was home to several resorts, and the area was known for its beautiful scenery and outdoor activities.
Geography
Waimea Cdp is located on the western side of the Big Island of Hawaii, at 19°55'N, 155°45'W (19.917, -155.750). The town is situated at the base of Mauna Kea, the highest mountain in Hawaii.
The town is bordered to the north by the Waimea River, to the east by the Waipio Valley, and to the south by the Pacific Ocean. The town is located about 25 miles (40 km) north of Hilo, the county seat of Hawaii County.
The total area of Waimea Cdp is 8.3 square miles (21.5 km2), of which 8.2 square miles (21.3 km2) is land and 0.1 square miles (0.2 km2) is water.
Economy
The economy of Waimea Cdp is largely based on tourism and agriculture. The town is home to several resorts and hotels, and is a popular destination for visitors to the Big Island.
Agriculture is also an important part of the local economy. The town is home to several large ranches, and the cattle industry is a major source of income for the town. Other agricultural products grown in the area include macadamia nuts, coffee, and tropical fruits.
Demographics
As of the 2010 census, there were 8,788 people, 2,845 households, and 2,072 families residing in Waimea Cdp. The population density was 1,062.3 people per square mile (409.7/km2). There were 3,093 housing units at an average density of 375.3 per square mile (144.9/km2).
The racial makeup of the town was 57.2% White, 0.7% African American, 0.3% Native American, 15.2% Asian, 0.2% Pacific Islander, 22.2% from other races, and 4.2% from two or more races. Hispanic or Latino of any race were 33.2% of the population.
The median income for a household in Waimea Cdp was $50,938, and the median income for a family was $58,938. Males had a median income of $41,938 versus $30,938 for females. The per capita income for the town was $22,938. About 8.2% of families and 11.2% of the population were below the poverty line, including 15.2% of those under age 18 and 6.2% of those age 65 or over.
Common Questions
What is Per Capita Income in Waimea CDP Hawaii County?
Per Capita income in Waimea CDP Hawaii County is $45,188.
What is the Median Family Income in Waimea CDP Hawaii County?
Median Family Income in Waimea CDP Hawaii County is $126,107.
What is the Median Household income in Waimea CDP Hawaii County?
Median Household Income in Waimea CDP Hawaii County is $100,075.
What is Income or Wage Gap in Waimea CDP Hawaii County?
Income or Wage Gap in Waimea CDP Hawaii County is 23.3%.
Women in Waimea CDP Hawaii County earn 76.7 cents for every dollar earned by a man.
What is Family Income Deficit in Waimea CDP Hawaii County?
Family Income Deficit in Waimea CDP Hawaii County is $7,490.
Families that are below poverty line in Waimea CDP Hawaii County earn $7,490 less on average than the poverty threshold level.
What is Inequality or Gini Index in Waimea CDP Hawaii County?
Inequality or Gini Index in Waimea CDP Hawaii County is 0.48.
What is the Total Population of Waimea CDP Hawaii County?
Total Population of Waimea CDP Hawaii County is 10,458.
What is the Total Male Population of Waimea CDP Hawaii County?
Total Male Population of Waimea CDP Hawaii County is 5,001.
What is the Total Female Population of Waimea CDP Hawaii County?
Total Female Population of Waimea CDP Hawaii County is 5,457.
What is the Ratio of Males per 100 Females in Waimea CDP Hawaii County?
There are 91.64 Males per 100 Females in Waimea CDP Hawaii County.
What is the Ratio of Females per 100 Males in Waimea CDP Hawaii County?
There are 109.12 Females per 100 Males in Waimea CDP Hawaii County.
What is the Median Population Age in Waimea CDP Hawaii County?
Median Population Age in Waimea CDP Hawaii County is 38.4 Years.
What is the Average Family Size in Waimea CDP Hawaii County
Average Family Size in Waimea CDP Hawaii County is 3.5 People.
What is the Average Household Size in Waimea CDP Hawaii County
Average Household Size in Waimea CDP Hawaii County is 2.9 People.
How Large is the Labor Force in Waimea CDP Hawaii County?
There are 5,415 People in the Labor Forcein in Waimea CDP Hawaii County.
What is the Percentage of People in the Labor Force in Waimea CDP Hawaii County?
67.7% of People are in the Labor Force in Waimea CDP Hawaii County.
What is the Unemployment Rate in Waimea CDP Hawaii County?
Unemployment Rate in Waimea CDP Hawaii County is 5.7%.