Bear Creek, AK Map & Demographics
Bear Creek Map
Bear Creek Overview
$37,364
PER CAPITA INCOME
$118,878
AVG FAMILY INCOME
$70,156
AVG HOUSEHOLD INCOME
16.9%
WAGE / INCOME GAP [ % ]
83.1¢/ $1
WAGE / INCOME GAP [ $ ]
0.41
INEQUALITY / GINI INDEX
1,283
TOTAL POPULATION
699
MALE POPULATION
584
FEMALE POPULATION
119.69
MALES / 100 FEMALES
83.55
FEMALES / 100 MALES
44.9
MEDIAN AGE
3.5
AVG FAMILY SIZE
2.7
AVG HOUSEHOLD SIZE
583
LABOR FORCE [ PEOPLE ]
58.7%
PERCENT IN LABOR FORCE
Income in Bear Creek
Income Overview in Bear Creek
Per Capita Income in Bear Creek is $37,364, while median incomes of families and households are $118,878 and $70,156 respectively.
| Characteristic | Number | Measure |
| Per Capita Income | 1,283 | $37,364 |
| Median Family Income | 289 | $118,878 |
| Mean Family Income | 289 | $124,865 |
| Median Household Income | 461 | $70,156 |
| Mean Household Income | 461 | $92,930 |
| Income Deficit | 289 | $0 |
| Wage / Income Gap (%) | 1,283 | 16.94% |
| Wage / Income Gap ($) | 1,283 | 83.06¢ per $1 |
| Gini / Inequality Index | 1,283 | 0.41 |
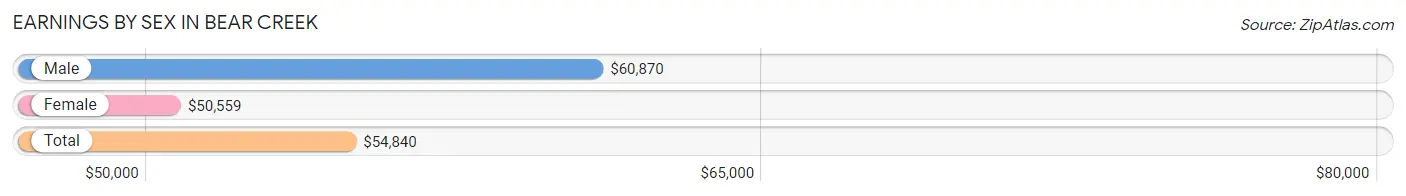
Earnings by Sex in Bear Creek
Average Earnings in Bear Creek are $54,840, $60,870 for men and $50,559 for women, a difference of 16.9%.
| Sex | Number | Average Earnings |
| Male | 352 (47.1%) | $60,870 |
| Female | 395 (52.9%) | $50,559 |
| Total | 747 (100.0%) | $54,840 |
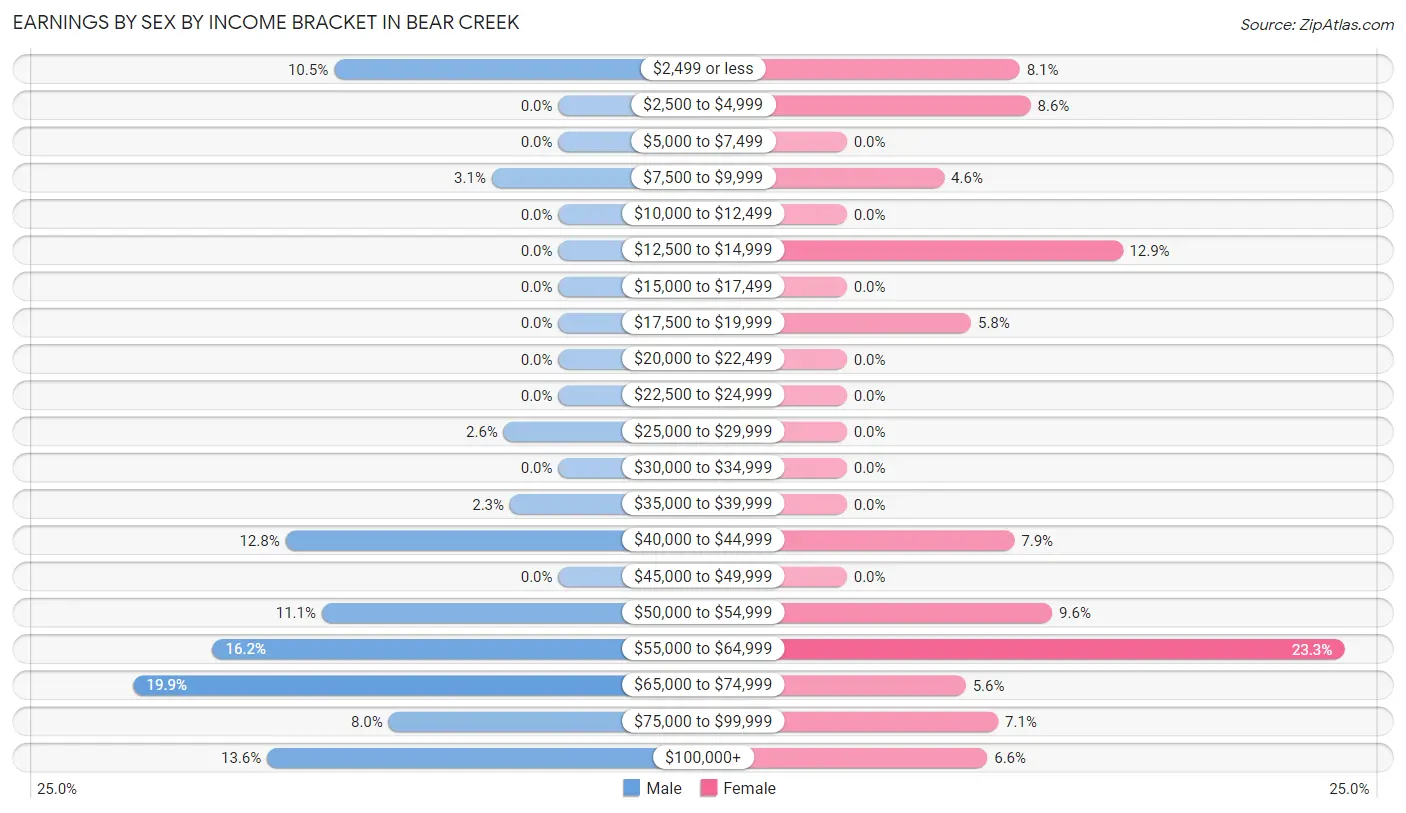
Earnings by Sex by Income Bracket in Bear Creek
The most common earnings brackets in Bear Creek are $65,000 to $74,999 for men (70 | 19.9%) and $55,000 to $64,999 for women (92 | 23.3%).
| Income | Male | Female |
| $2,499 or less | 37 (10.5%) | 32 (8.1%) |
| $2,500 to $4,999 | 0 (0.0%) | 34 (8.6%) |
| $5,000 to $7,499 | 0 (0.0%) | 0 (0.0%) |
| $7,500 to $9,999 | 11 (3.1%) | 18 (4.6%) |
| $10,000 to $12,499 | 0 (0.0%) | 0 (0.0%) |
| $12,500 to $14,999 | 0 (0.0%) | 51 (12.9%) |
| $15,000 to $17,499 | 0 (0.0%) | 0 (0.0%) |
| $17,500 to $19,999 | 0 (0.0%) | 23 (5.8%) |
| $20,000 to $22,499 | 0 (0.0%) | 0 (0.0%) |
| $22,500 to $24,999 | 0 (0.0%) | 0 (0.0%) |
| $25,000 to $29,999 | 9 (2.6%) | 0 (0.0%) |
| $30,000 to $34,999 | 0 (0.0%) | 0 (0.0%) |
| $35,000 to $39,999 | 8 (2.3%) | 0 (0.0%) |
| $40,000 to $44,999 | 45 (12.8%) | 31 (7.9%) |
| $45,000 to $49,999 | 0 (0.0%) | 0 (0.0%) |
| $50,000 to $54,999 | 39 (11.1%) | 38 (9.6%) |
| $55,000 to $64,999 | 57 (16.2%) | 92 (23.3%) |
| $65,000 to $74,999 | 70 (19.9%) | 22 (5.6%) |
| $75,000 to $99,999 | 28 (8.0%) | 28 (7.1%) |
| $100,000+ | 48 (13.6%) | 26 (6.6%) |
| Total | 352 (100.0%) | 395 (100.0%) |
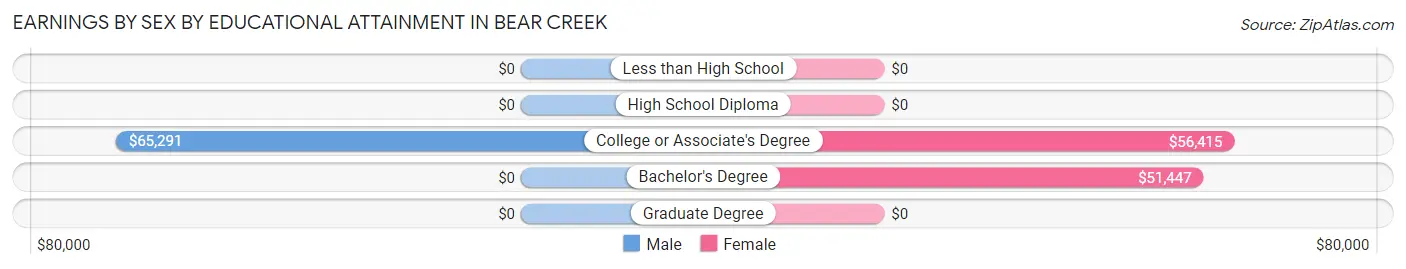
Earnings by Sex by Educational Attainment in Bear Creek
Average earnings in Bear Creek are $60,870 for men and $55,236 for women, a difference of 9.3%. Men with an educational attainment of college or associate's degree enjoy the highest average annual earnings of $65,291, while those with college or associate's degree education earn the least with $65,291. Women with an educational attainment of college or associate's degree earn the most with the average annual earnings of $56,415, while those with bachelor's degree education have the smallest earnings of $51,447.
| Educational Attainment | Male Income | Female Income |
| Less than High School | - | - |
| High School Diploma | - | - |
| College or Associate's Degree | $65,291 | $56,415 |
| Bachelor's Degree | - | - |
| Graduate Degree | - | - |
| Total | $60,870 | $55,236 |
Family Income in Bear Creek
Family Income Brackets in Bear Creek
According to the Bear Creek family income data, there are 92 families falling into the $100,000 to $149,999 income range, which is the most common income bracket and makes up 31.8% of all families.
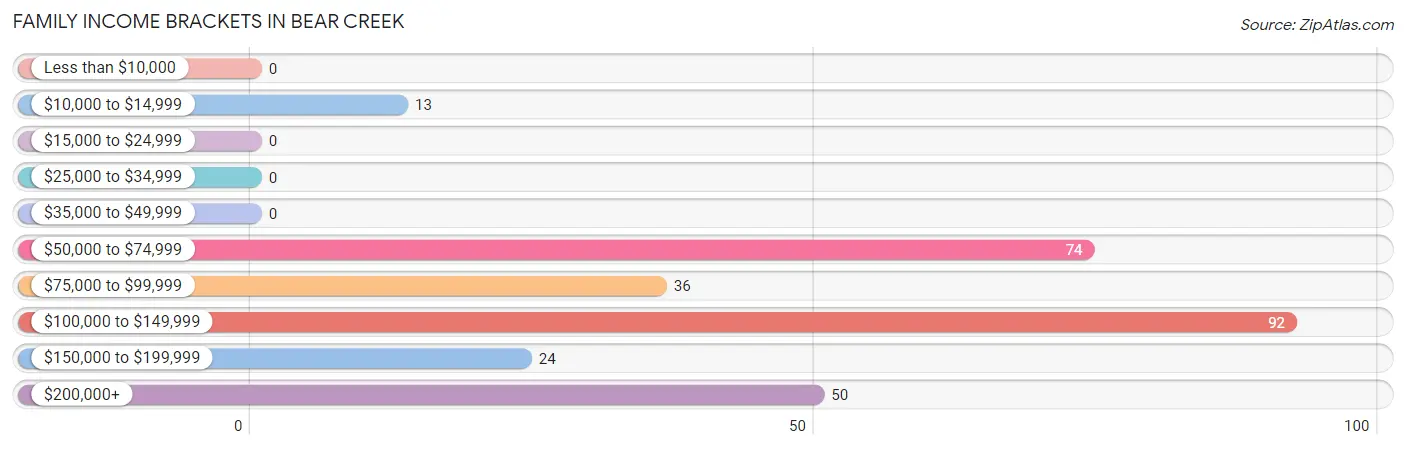
| Income Bracket | # Families | % Families |
| Less than $10,000 | 0 | 0.0% |
| $10,000 to $14,999 | 13 | 4.5% |
| $15,000 to $24,999 | 0 | 0.0% |
| $25,000 to $34,999 | 0 | 0.0% |
| $35,000 to $49,999 | 0 | 0.0% |
| $50,000 to $74,999 | 74 | 25.6% |
| $75,000 to $99,999 | 36 | 12.5% |
| $100,000 to $149,999 | 92 | 31.8% |
| $150,000 to $199,999 | 24 | 8.3% |
| $200,000+ | 50 | 17.3% |
Family Income by Famaliy Size in Bear Creek
3-person families (77 | 26.6%) account for the highest median family income in Bear Creek with $167,981 per family, while 2-person families (88 | 30.4%) have the highest median income of $59,070 per family member.
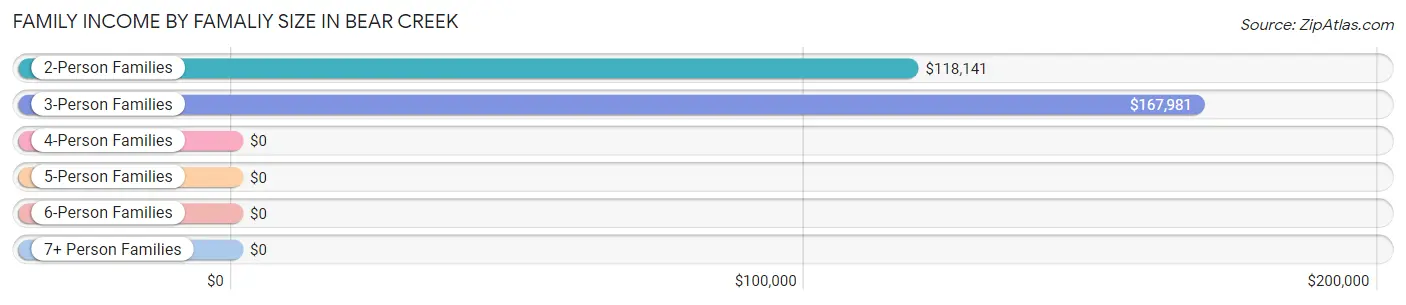
| Income Bracket | # Families | Median Income |
| 2-Person Families | 88 (30.4%) | $118,141 |
| 3-Person Families | 77 (26.6%) | $167,981 |
| 4-Person Families | 106 (36.7%) | $0 |
| 5-Person Families | 0 (0.0%) | $0 |
| 6-Person Families | 18 (6.2%) | $0 |
| 7+ Person Families | 0 (0.0%) | $0 |
| Total | 289 (100.0%) | $118,878 |
Family Income by Number of Earners in Bear Creek
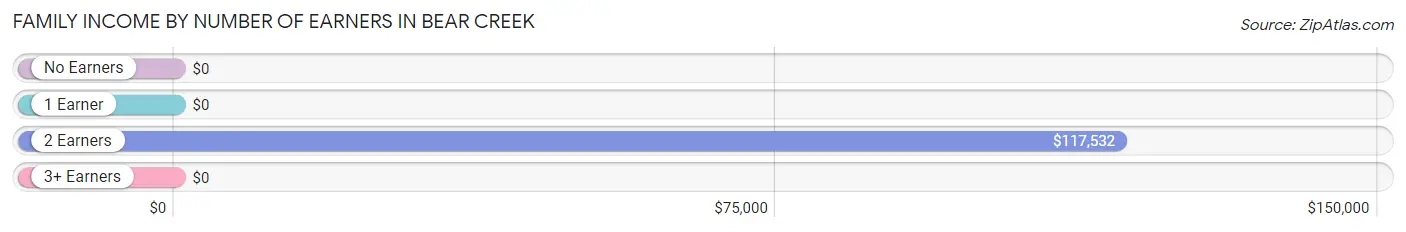
| Number of Earners | # Families | Median Income |
| No Earners | 13 (4.5%) | $0 |
| 1 Earner | 73 (25.3%) | $0 |
| 2 Earners | 133 (46.0%) | $117,532 |
| 3+ Earners | 70 (24.2%) | $0 |
| Total | 289 (100.0%) | $118,878 |
Household Income in Bear Creek
Household Income Brackets in Bear Creek
With 113 households falling in the category, the $100,000 to $149,999 income range is the most frequent in Bear Creek, accounting for 24.5% of all households.
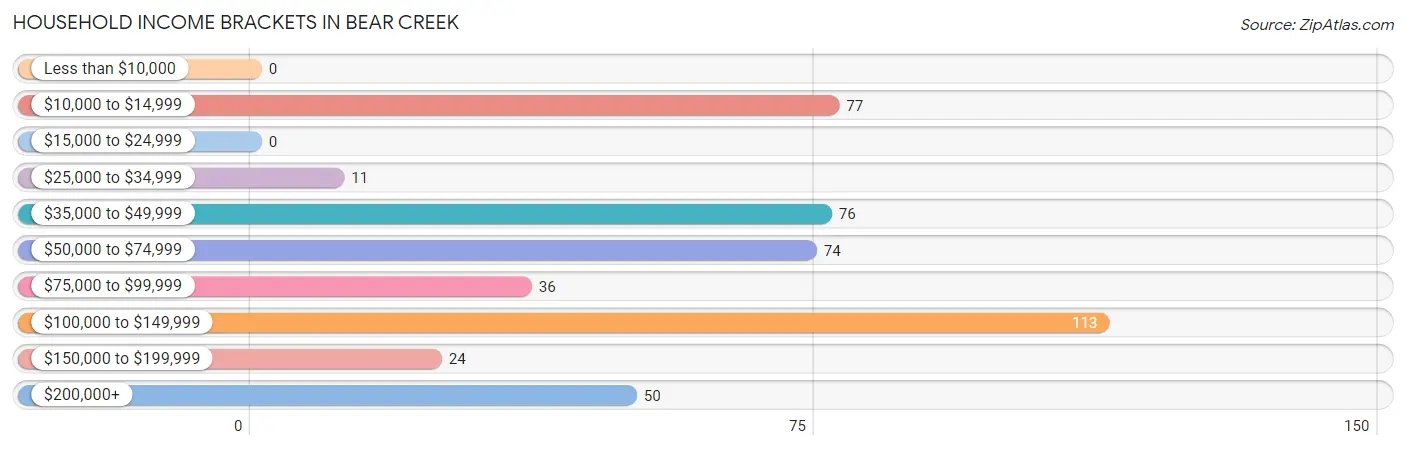
| Income Bracket | # Households | % Households |
| Less than $10,000 | 0 | 0.0% |
| $10,000 to $14,999 | 77 | 16.7% |
| $15,000 to $24,999 | 0 | 0.0% |
| $25,000 to $34,999 | 11 | 2.4% |
| $35,000 to $49,999 | 76 | 16.5% |
| $50,000 to $74,999 | 74 | 16.1% |
| $75,000 to $99,999 | 36 | 7.8% |
| $100,000 to $149,999 | 113 | 24.5% |
| $150,000 to $199,999 | 24 | 5.2% |
| $200,000+ | 50 | 10.8% |
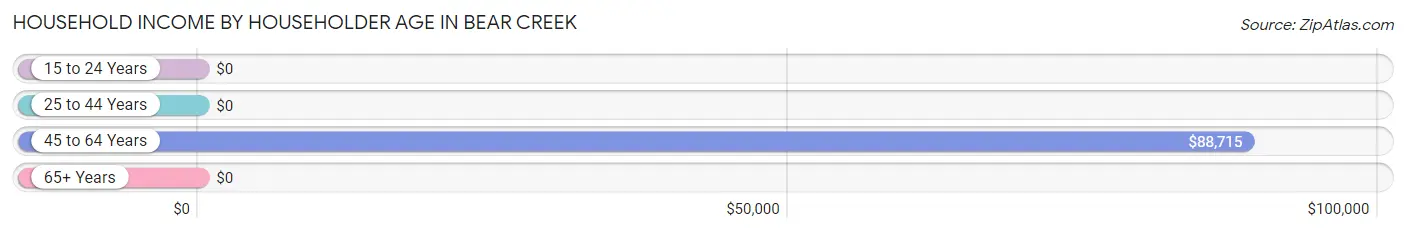
Household Income by Householder Age in Bear Creek
The median household income in Bear Creek is $70,156, with the highest median household income of $88,715 found in the 45 to 64 years age bracket for the primary householder. A total of 239 households (51.8%) fall into this category.
| Income Bracket | # Households | Median Income |
| 15 to 24 Years | 0 (0.0%) | $0 |
| 25 to 44 Years | 150 (32.5%) | $0 |
| 45 to 64 Years | 239 (51.8%) | $88,715 |
| 65+ Years | 72 (15.6%) | $0 |
| Total | 461 (100.0%) | $70,156 |
Poverty in Bear Creek
Income Below Poverty by Sex and Age in Bear Creek
With 7.2% poverty level for males and 12.2% for females among the residents of Bear Creek, 12 to 14 year old males and 55 to 64 year old females are the most vulnerable to poverty, with 16 males (18.4%) and 59 females (62.1%) in their respective age groups living below the poverty level.
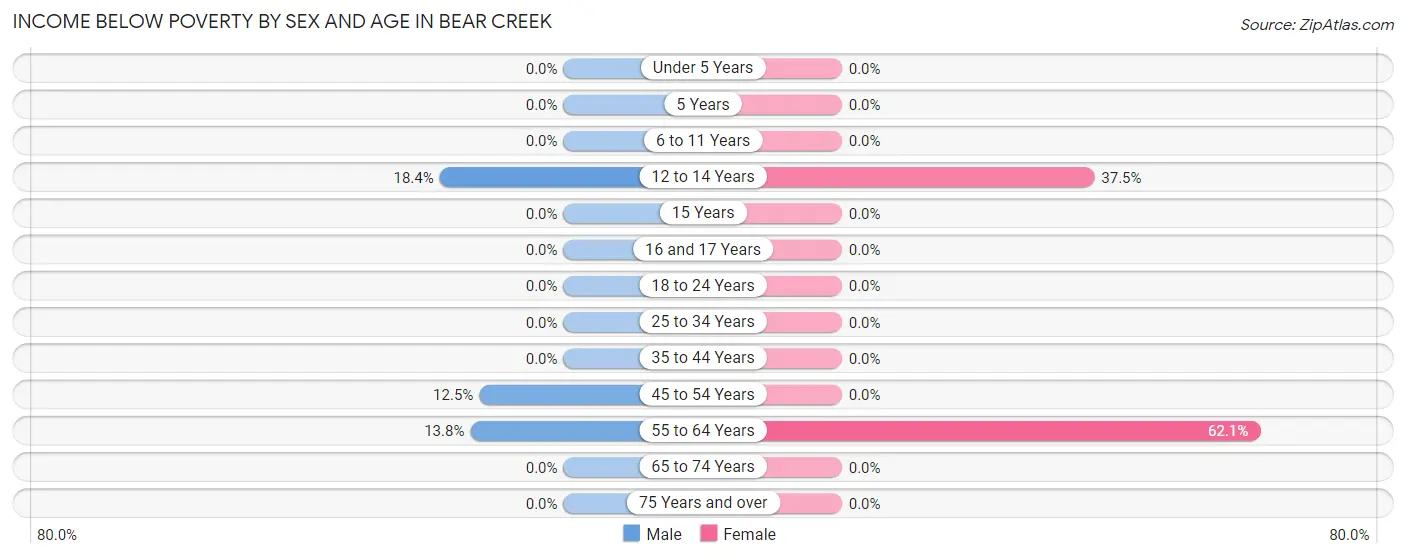
| Age Bracket | Male | Female |
| Under 5 Years | 0 (0.0%) | 0 (0.0%) |
| 5 Years | 0 (0.0%) | 0 (0.0%) |
| 6 to 11 Years | 0 (0.0%) | 0 (0.0%) |
| 12 to 14 Years | 16 (18.4%) | 12 (37.5%) |
| 15 Years | 0 (0.0%) | 0 (0.0%) |
| 16 and 17 Years | 0 (0.0%) | 0 (0.0%) |
| 18 to 24 Years | 0 (0.0%) | 0 (0.0%) |
| 25 to 34 Years | 0 (0.0%) | 0 (0.0%) |
| 35 to 44 Years | 0 (0.0%) | 0 (0.0%) |
| 45 to 54 Years | 21 (12.5%) | 0 (0.0%) |
| 55 to 64 Years | 13 (13.8%) | 59 (62.1%) |
| 65 to 74 Years | 0 (0.0%) | 0 (0.0%) |
| 75 Years and over | 0 (0.0%) | 0 (0.0%) |
| Total | 50 (7.2%) | 71 (12.2%) |
Income Above Poverty by Sex and Age in Bear Creek
According to the poverty statistics in Bear Creek, males aged under 5 years and females aged 6 to 11 years are the age groups that are most secure financially, with 100.0% of males and 100.0% of females in these age groups living above the poverty line.
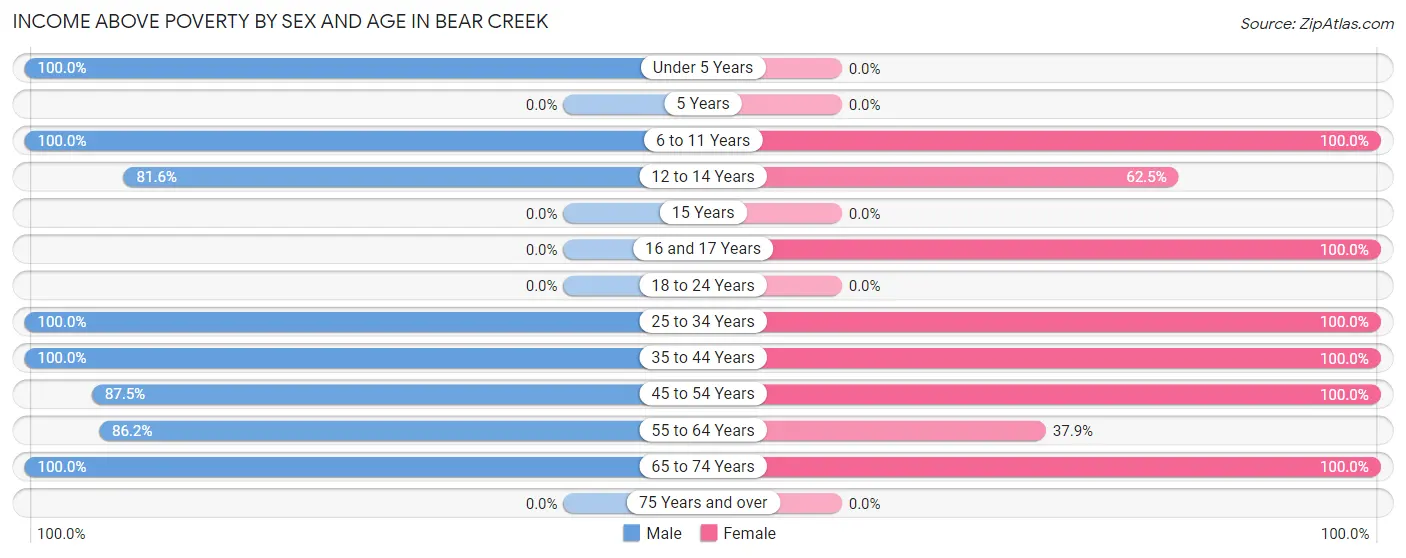
| Age Bracket | Male | Female |
| Under 5 Years | 82 (100.0%) | 0 (0.0%) |
| 5 Years | 0 (0.0%) | 0 (0.0%) |
| 6 to 11 Years | 64 (100.0%) | 25 (100.0%) |
| 12 to 14 Years | 71 (81.6%) | 20 (62.5%) |
| 15 Years | 0 (0.0%) | 0 (0.0%) |
| 16 and 17 Years | 0 (0.0%) | 69 (100.0%) |
| 18 to 24 Years | 0 (0.0%) | 0 (0.0%) |
| 25 to 34 Years | 11 (100.0%) | 98 (100.0%) |
| 35 to 44 Years | 86 (100.0%) | 93 (100.0%) |
| 45 to 54 Years | 147 (87.5%) | 78 (100.0%) |
| 55 to 64 Years | 81 (86.2%) | 36 (37.9%) |
| 65 to 74 Years | 105 (100.0%) | 94 (100.0%) |
| 75 Years and over | 0 (0.0%) | 0 (0.0%) |
| Total | 647 (92.8%) | 513 (87.8%) |
Income Below Poverty Among Married-Couple Families in Bear Creek
The poverty statistics for married-couple families in Bear Creek show that 4.6% or 13 of the total 281 families live below the poverty line. Families with 1 or 2 children have the highest poverty rate of 9.3%, comprising of 13 families. On the other hand, families with no children have the lowest poverty rate of 0.0%, which includes 0 families.
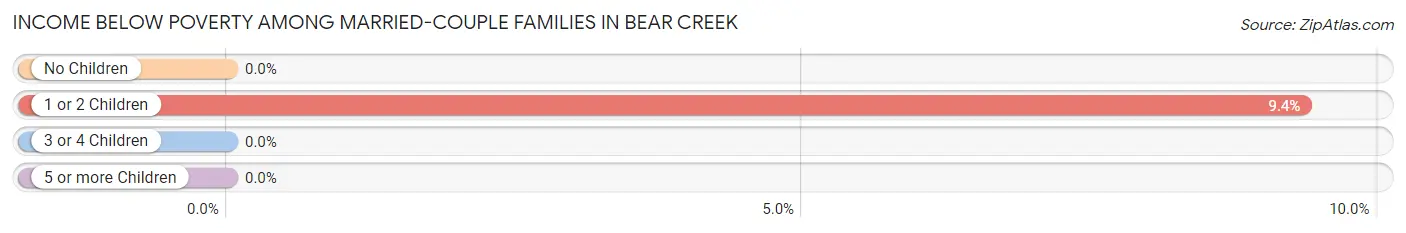
| Children | Above Poverty | Below Poverty |
| No Children | 124 (100.0%) | 0 (0.0%) |
| 1 or 2 Children | 126 (90.6%) | 13 (9.3%) |
| 3 or 4 Children | 18 (100.0%) | 0 (0.0%) |
| 5 or more Children | 0 (0.0%) | 0 (0.0%) |
| Total | 268 (95.4%) | 13 (4.6%) |
Income Below Poverty Among Single-Parent Households in Bear Creek
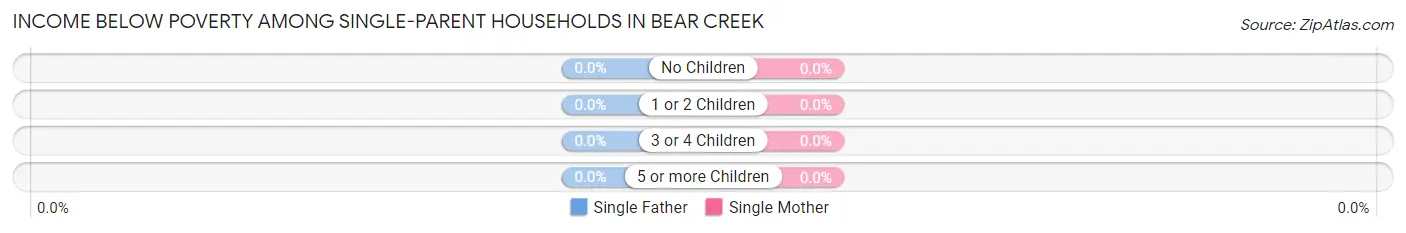
| Children | Single Father | Single Mother |
| No Children | 0 (0.0%) | 0 (0.0%) |
| 1 or 2 Children | 0 (0.0%) | 0 (0.0%) |
| 3 or 4 Children | 0 (0.0%) | 0 (0.0%) |
| 5 or more Children | 0 (0.0%) | 0 (0.0%) |
| Total | 0 (0.0%) | 0 (0.0%) |
Income Below Poverty Among Married-Couple vs Single-Parent Households in Bear Creek
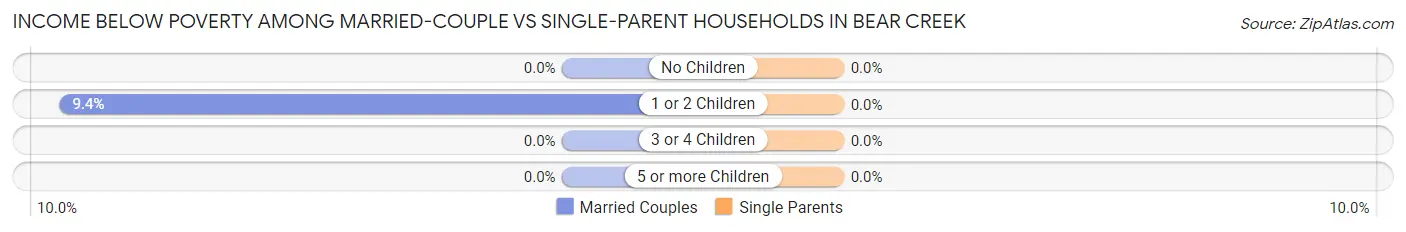
| Children | Married-Couple Families | Single-Parent Households |
| No Children | 0 (0.0%) | 0 (0.0%) |
| 1 or 2 Children | 13 (9.3%) | 0 (0.0%) |
| 3 or 4 Children | 0 (0.0%) | 0 (0.0%) |
| 5 or more Children | 0 (0.0%) | 0 (0.0%) |
| Total | 13 (4.6%) | 0 (0.0%) |
Race in Bear Creek
The most populous races in Bear Creek are White / Caucasian (1,109 | 86.4%), Two or more Races (103 | 8.0%), and Native / Alaskan (52 | 4.1%).
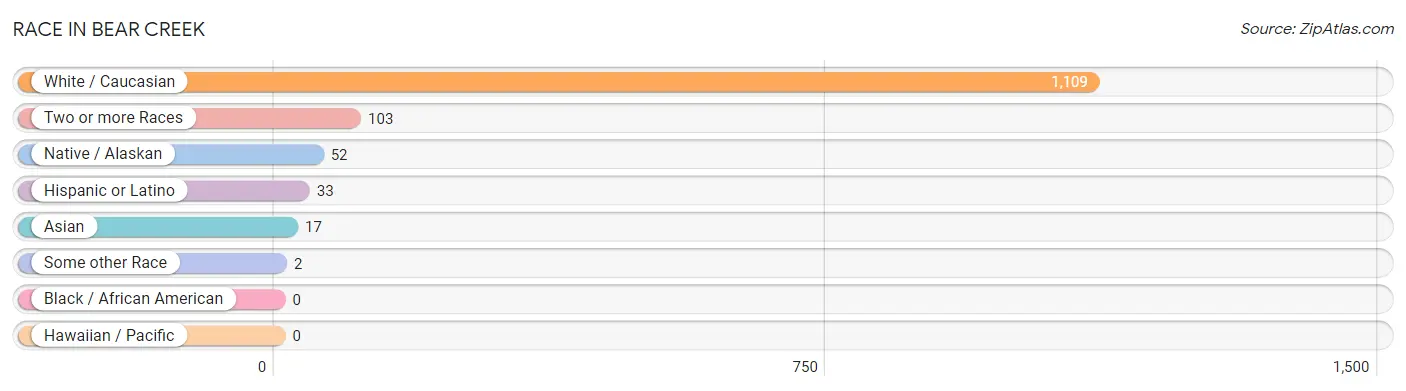
| Race | # Population | % Population |
| Asian | 17 | 1.3% |
| Black / African American | 0 | 0.0% |
| Hawaiian / Pacific | 0 | 0.0% |
| Hispanic or Latino | 33 | 2.6% |
| Native / Alaskan | 52 | 4.1% |
| White / Caucasian | 1,109 | 86.4% |
| Two or more Races | 103 | 8.0% |
| Some other Race | 2 | 0.2% |
| Total | 1,283 | 100.0% |
Ancestry in Bear Creek
The most populous ancestries reported in Bear Creek are German (390 | 30.4%), Irish (203 | 15.8%), English (166 | 12.9%), Korean (45 | 3.5%), and Canadian (44 | 3.4%), together accounting for 66.1% of all Bear Creek residents.
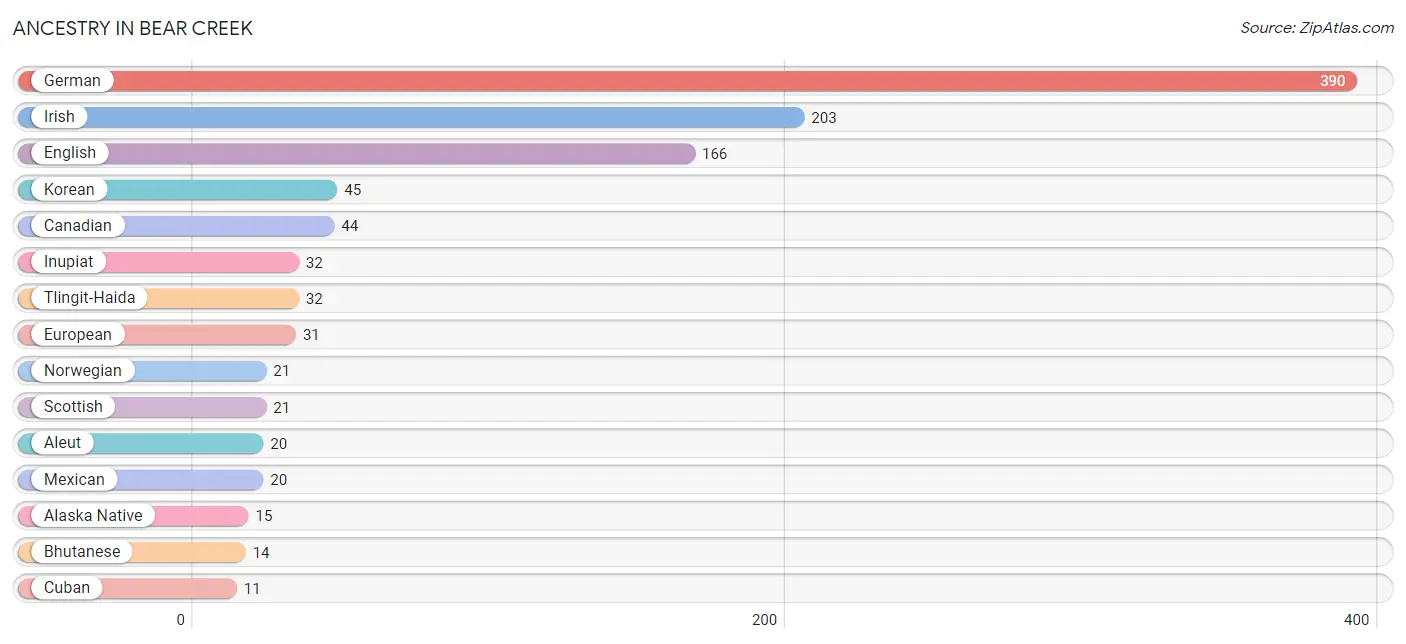
| Ancestry | # Population | % Population |
| Alaska Native | 15 | 1.2% |
| Aleut | 20 | 1.6% |
| Bhutanese | 14 | 1.1% |
| Canadian | 44 | 3.4% |
| Cuban | 11 | 0.9% |
| English | 166 | 12.9% |
| European | 31 | 2.4% |
| German | 390 | 30.4% |
| Inupiat | 32 | 2.5% |
| Irish | 203 | 15.8% |
| Korean | 45 | 3.5% |
| Mexican | 20 | 1.6% |
| Norwegian | 21 | 1.6% |
| Scottish | 21 | 1.6% |
| Tlingit-Haida | 32 | 2.5% | View All 15 Rows |
Immigrants in Bear Creek
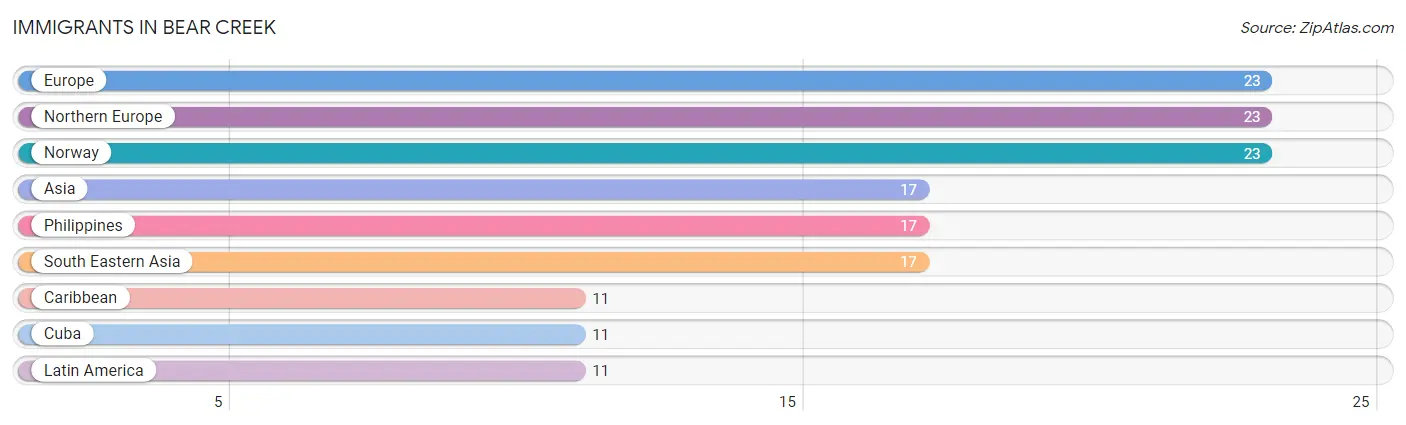
The most numerous immigrant groups reported in Bear Creek came from Europe (23 | 1.8%), Northern Europe (23 | 1.8%), Norway (23 | 1.8%), Asia (17 | 1.3%), and Philippines (17 | 1.3%), together accounting for 8.0% of all Bear Creek residents.
| Immigration Origin | # Population | % Population |
| Asia | 17 | 1.3% |
| Caribbean | 11 | 0.9% |
| Cuba | 11 | 0.9% |
| Europe | 23 | 1.8% |
| Latin America | 11 | 0.9% |
| Northern Europe | 23 | 1.8% |
| Norway | 23 | 1.8% |
| Philippines | 17 | 1.3% |
| South Eastern Asia | 17 | 1.3% | View All 9 Rows |
Sex and Age in Bear Creek
Sex and Age in Bear Creek
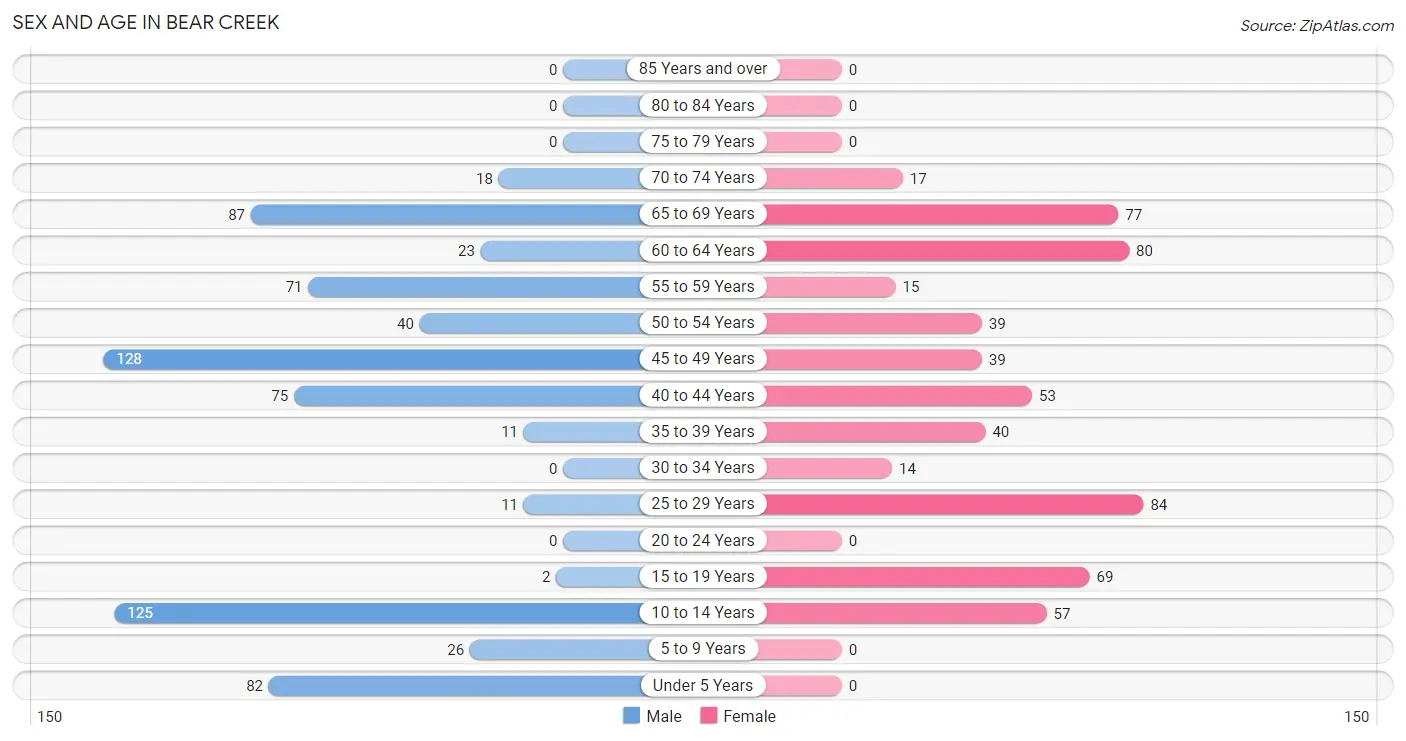
The most populous age groups in Bear Creek are 45 to 49 Years (128 | 18.3%) for men and 25 to 29 Years (84 | 14.4%) for women.
| Age Bracket | Male | Female |
| Under 5 Years | 82 (11.7%) | 0 (0.0%) |
| 5 to 9 Years | 26 (3.7%) | 0 (0.0%) |
| 10 to 14 Years | 125 (17.9%) | 57 (9.8%) |
| 15 to 19 Years | 2 (0.3%) | 69 (11.8%) |
| 20 to 24 Years | 0 (0.0%) | 0 (0.0%) |
| 25 to 29 Years | 11 (1.6%) | 84 (14.4%) |
| 30 to 34 Years | 0 (0.0%) | 14 (2.4%) |
| 35 to 39 Years | 11 (1.6%) | 40 (6.9%) |
| 40 to 44 Years | 75 (10.7%) | 53 (9.1%) |
| 45 to 49 Years | 128 (18.3%) | 39 (6.7%) |
| 50 to 54 Years | 40 (5.7%) | 39 (6.7%) |
| 55 to 59 Years | 71 (10.2%) | 15 (2.6%) |
| 60 to 64 Years | 23 (3.3%) | 80 (13.7%) |
| 65 to 69 Years | 87 (12.4%) | 77 (13.2%) |
| 70 to 74 Years | 18 (2.6%) | 17 (2.9%) |
| 75 to 79 Years | 0 (0.0%) | 0 (0.0%) |
| 80 to 84 Years | 0 (0.0%) | 0 (0.0%) |
| 85 Years and over | 0 (0.0%) | 0 (0.0%) |
| Total | 699 (100.0%) | 584 (100.0%) |
Families and Households in Bear Creek
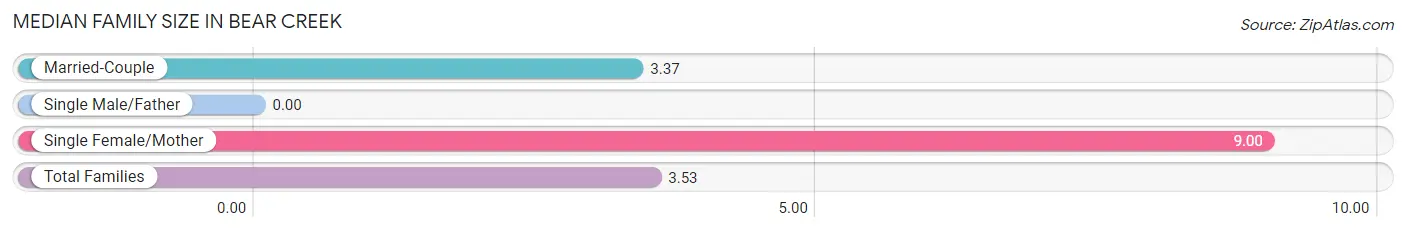
Median Family Size in Bear Creek
| Family Type | # Families | Family Size |
| Married-Couple | 281 (97.2%) | 3.37 |
| Single Male/Father | 0 (0.0%) | - |
| Single Female/Mother | 8 (2.8%) | 9.00 |
| Total Families | 289 (100.0%) | 3.53 |
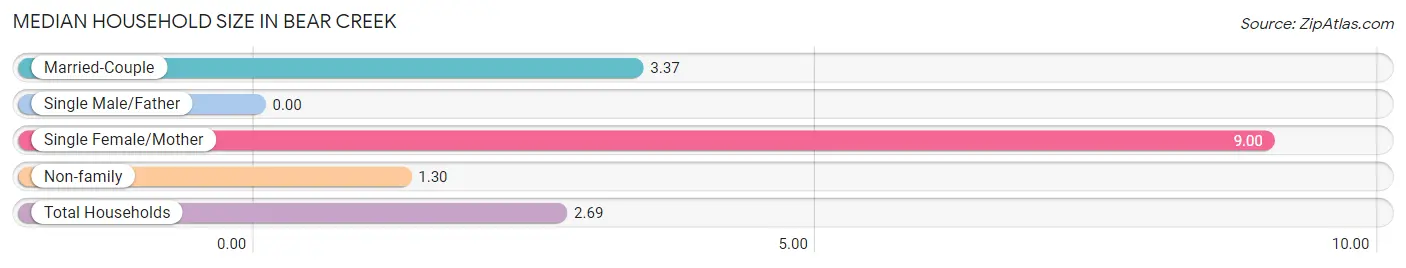
Median Household Size in Bear Creek
| Household Type | # Households | Household Size |
| Married-Couple | 281 (61.0%) | 3.37 |
| Single Male/Father | 0 (0.0%) | - |
| Single Female/Mother | 8 (1.7%) | 9.00 |
| Non-family | 172 (37.3%) | 1.30 |
| Total Households | 461 (100.0%) | 2.69 |
Household Size by Marriage Status in Bear Creek
Out of a total of 461 households in Bear Creek, 289 (62.7%) are family households, while 172 (37.3%) are nonfamily households. The most numerous type of family households are 4-person households, comprising 106, and the most common type of nonfamily households are 1-person households, comprising 151.
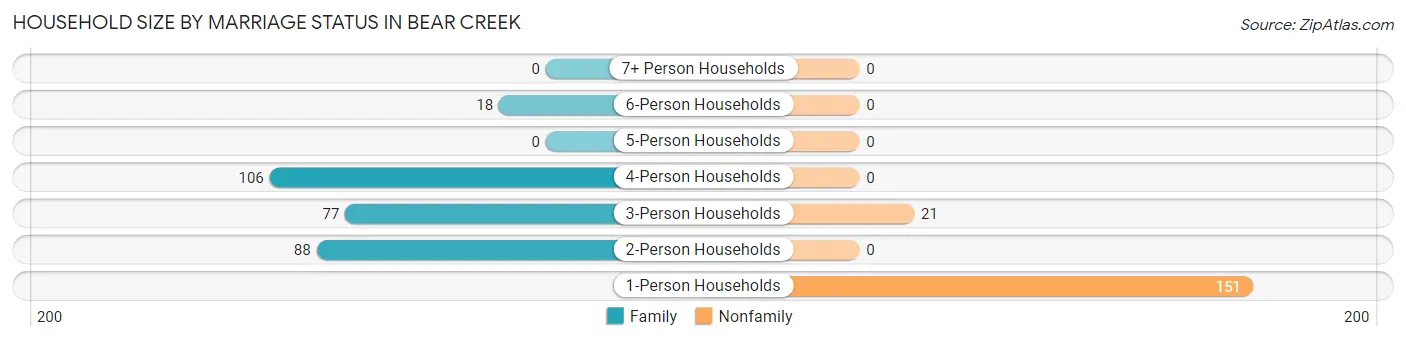
| Household Size | Family Households | Nonfamily Households |
| 1-Person Households | - | 151 (32.8%) |
| 2-Person Households | 88 (19.1%) | 0 (0.0%) |
| 3-Person Households | 77 (16.7%) | 21 (4.6%) |
| 4-Person Households | 106 (23.0%) | 0 (0.0%) |
| 5-Person Households | 0 (0.0%) | 0 (0.0%) |
| 6-Person Households | 18 (3.9%) | 0 (0.0%) |
| 7+ Person Households | 0 (0.0%) | 0 (0.0%) |
| Total | 289 (62.7%) | 172 (37.3%) |
Female Fertility in Bear Creek
Fertility by Age in Bear Creek
| Age Bracket | Women with Births | Births / 1,000 Women |
| 15 to 19 years | 0 (0.0%) | 0.0 |
| 20 to 34 years | 0 (0.0%) | 0.0 |
| 35 to 50 years | 0 (0.0%) | 0.0 |
| Total | 0 (0.0%) | 0.0 |
Fertility by Age by Marriage Status in Bear Creek
| Age Bracket | Married | Unmarried |
| 15 to 19 years | 0 (0.0%) | 0 (0.0%) |
| 20 to 34 years | 0 (0.0%) | 0 (0.0%) |
| 35 to 50 years | 0 (0.0%) | 0 (0.0%) |
| Total | 0 (0.0%) | 0 (0.0%) |
Fertility by Education in Bear Creek
| Educational Attainment | Women with Births | Births / 1,000 Women |
| Less than High School | 0 (0.0%) | 0.0 |
| High School Diploma | 0 (0.0%) | 0.0 |
| College or Associate's Degree | 0 (0.0%) | 0.0 |
| Bachelor's Degree | 0 (0.0%) | 0.0 |
| Graduate Degree | 0 (0.0%) | 0.0 |
| Total | 0 (0.0%) | 0.0 |
Fertility by Education by Marriage Status in Bear Creek
| Educational Attainment | Married | Unmarried |
| Less than High School | 0 (0.0%) | 0 (0.0%) |
| High School Diploma | 0 (0.0%) | 0 (0.0%) |
| College or Associate's Degree | 0 (0.0%) | 0 (0.0%) |
| Bachelor's Degree | 0 (0.0%) | 0 (0.0%) |
| Graduate Degree | 0 (0.0%) | 0 (0.0%) |
| Total | 0 (0.0%) | 0 (0.0%) |
Employment Characteristics in Bear Creek
Employment by Class of Employer in Bear Creek
Among the 549 employed individuals in Bear Creek, private company employees (406 | 74.0%), local government employees (69 | 12.6%), and self-employed (not incorporated) (25 | 4.5%) make up the most common classes of employment.
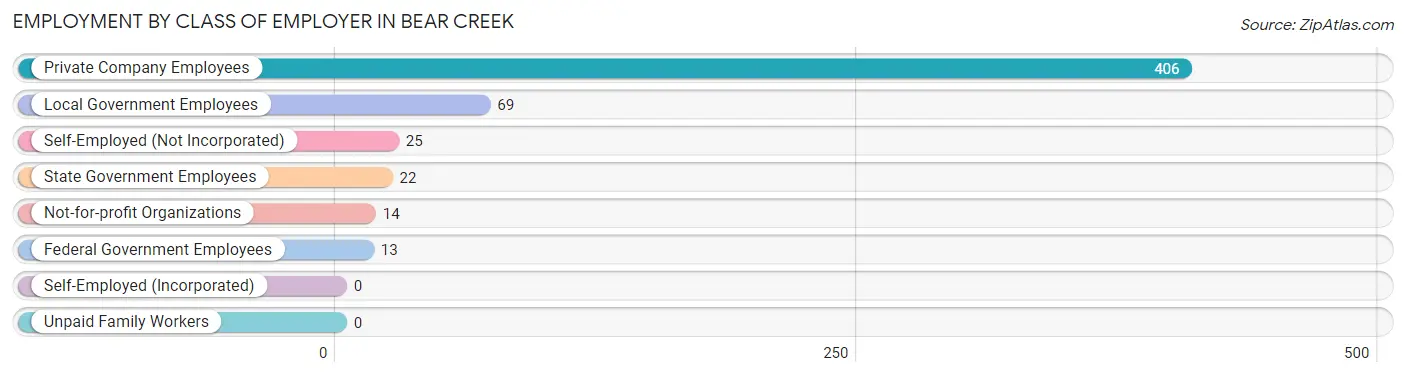
| Employer Class | # Employees | % Employees |
| Private Company Employees | 406 | 74.0% |
| Self-Employed (Incorporated) | 0 | 0.0% |
| Self-Employed (Not Incorporated) | 25 | 4.5% |
| Not-for-profit Organizations | 14 | 2.5% |
| Local Government Employees | 69 | 12.6% |
| State Government Employees | 22 | 4.0% |
| Federal Government Employees | 13 | 2.4% |
| Unpaid Family Workers | 0 | 0.0% |
| Total | 549 | 100.0% |
Employment Status by Age in Bear Creek
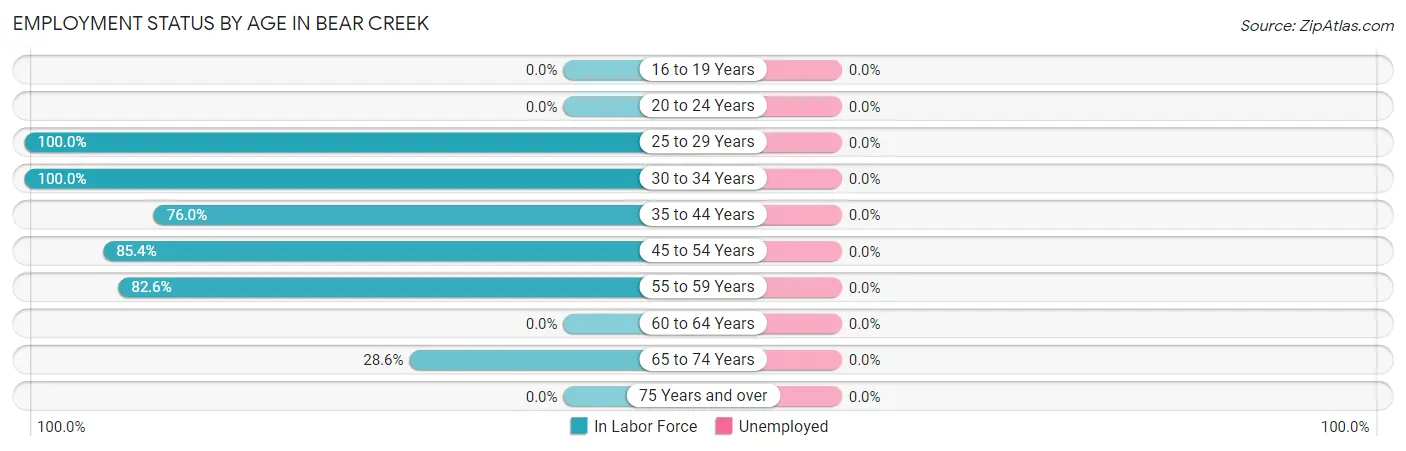
| Age Bracket | In Labor Force | Unemployed |
| 16 to 19 Years | 0 (0.0%) | 0 (0.0%) |
| 20 to 24 Years | 0 (0.0%) | 0 (0.0%) |
| 25 to 29 Years | 95 (100.0%) | 0 (0.0%) |
| 30 to 34 Years | 14 (100.0%) | 0 (0.0%) |
| 35 to 44 Years | 136 (76.0%) | 0 (0.0%) |
| 45 to 54 Years | 210 (85.4%) | 0 (0.0%) |
| 55 to 59 Years | 71 (82.6%) | 0 (0.0%) |
| 60 to 64 Years | 0 (0.0%) | 0 (0.0%) |
| 65 to 74 Years | 57 (28.6%) | 0 (0.0%) |
| 75 Years and over | 0 (0.0%) | 0 (0.0%) |
| Total | 583 (58.7%) | 0 (0.0%) |
Employment Status by Educational Attainment in Bear Creek
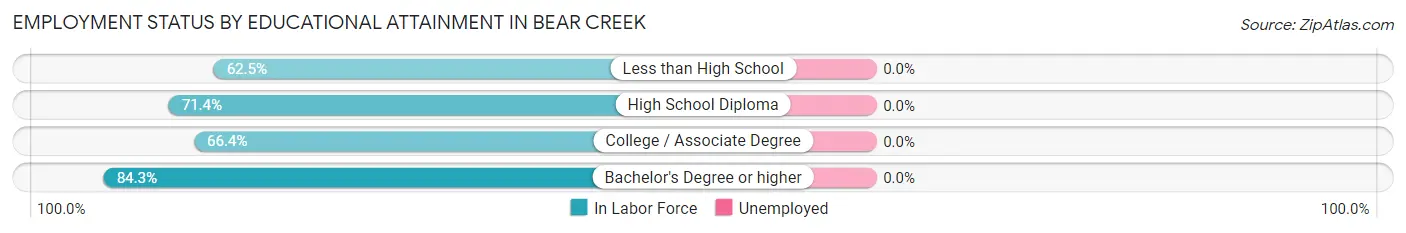
| Educational Attainment | In Labor Force | Unemployed |
| Less than High School | 25 (62.5%) | 0 (0.0%) |
| High School Diploma | 95 (71.4%) | 0 (0.0%) |
| College / Associate Degree | 213 (66.4%) | 0 (0.0%) |
| Bachelor's Degree or higher | 193 (84.3%) | 0 (0.0%) |
| Total | 526 (72.8%) | 0 (0.0%) |
Employment Occupations by Sex in Bear Creek
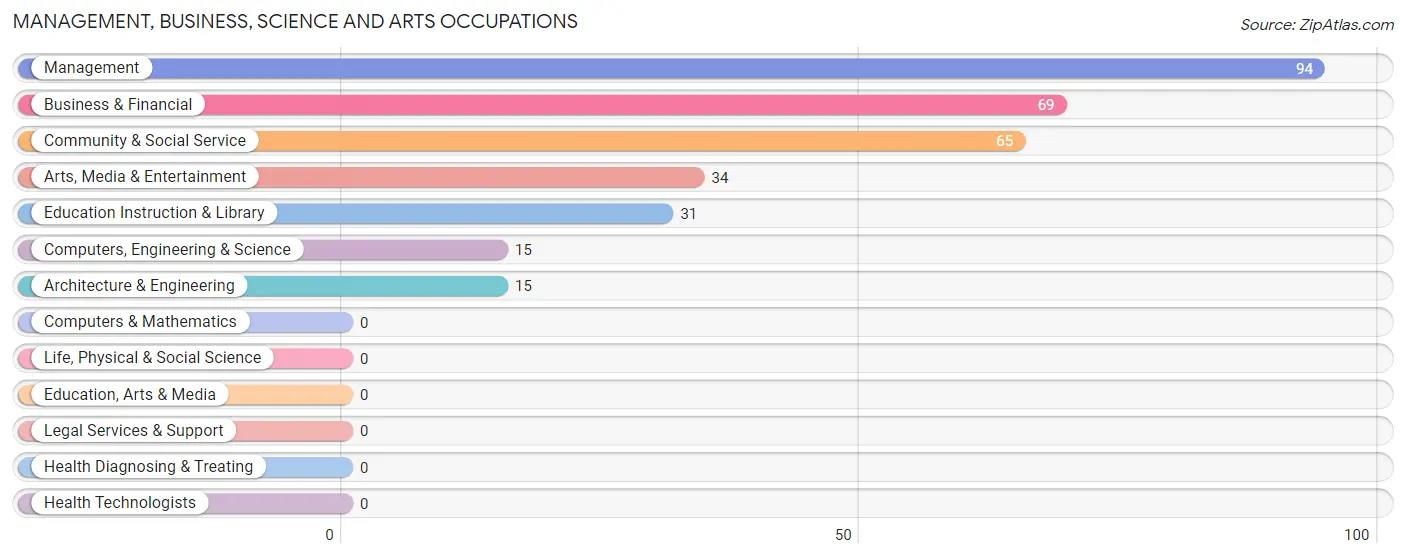
Management, Business, Science and Arts Occupations
The most common Management, Business, Science and Arts occupations in Bear Creek are Management (94 | 16.1%), Business & Financial (69 | 11.8%), Community & Social Service (65 | 11.2%), Arts, Media & Entertainment (34 | 5.8%), and Education Instruction & Library (31 | 5.3%).
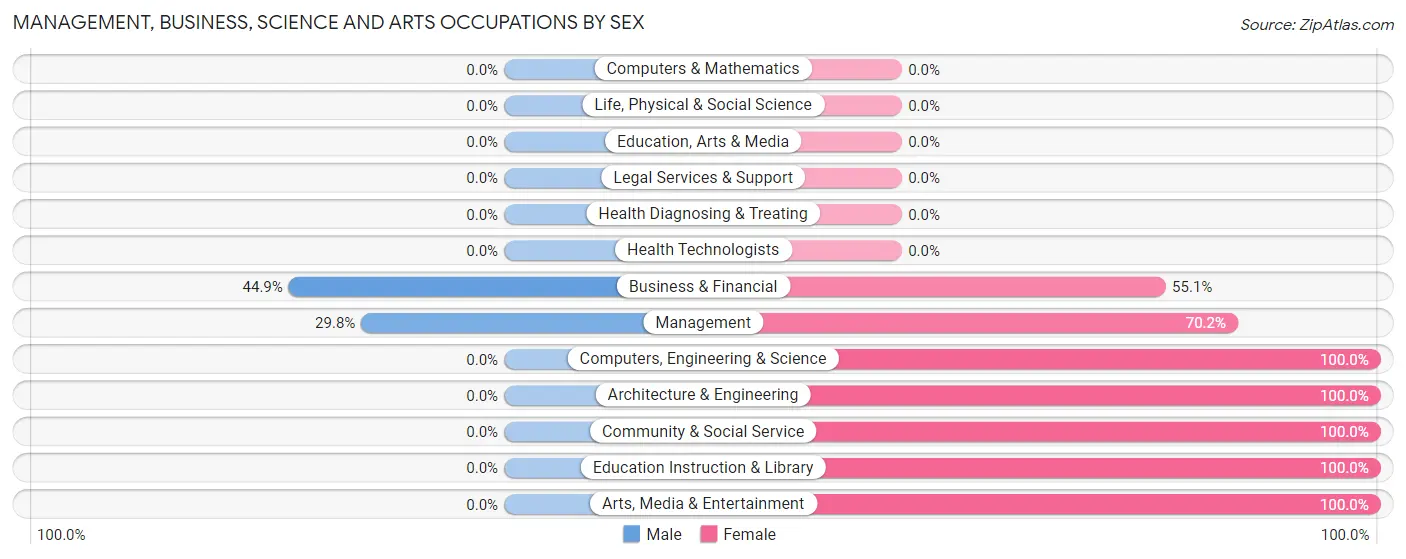
Management, Business, Science and Arts Occupations by Sex
Within the Management, Business, Science and Arts occupations in Bear Creek, the most male-oriented occupations are Business & Financial (44.9%), and Management (29.8%), while the most female-oriented occupations are Computers, Engineering & Science (100.0%), Architecture & Engineering (100.0%), and Community & Social Service (100.0%).
| Occupation | Male | Female |
| Management | 28 (29.8%) | 66 (70.2%) |
| Business & Financial | 31 (44.9%) | 38 (55.1%) |
| Computers, Engineering & Science | 0 (0.0%) | 15 (100.0%) |
| Computers & Mathematics | 0 (0.0%) | 0 (0.0%) |
| Architecture & Engineering | 0 (0.0%) | 15 (100.0%) |
| Life, Physical & Social Science | 0 (0.0%) | 0 (0.0%) |
| Community & Social Service | 0 (0.0%) | 65 (100.0%) |
| Education, Arts & Media | 0 (0.0%) | 0 (0.0%) |
| Legal Services & Support | 0 (0.0%) | 0 (0.0%) |
| Education Instruction & Library | 0 (0.0%) | 31 (100.0%) |
| Arts, Media & Entertainment | 0 (0.0%) | 34 (100.0%) |
| Health Diagnosing & Treating | 0 (0.0%) | 0 (0.0%) |
| Health Technologists | 0 (0.0%) | 0 (0.0%) |
| Total (Category) | 59 (24.3%) | 184 (75.7%) |
| Total (Overall) | 304 (52.1%) | 279 (47.9%) |
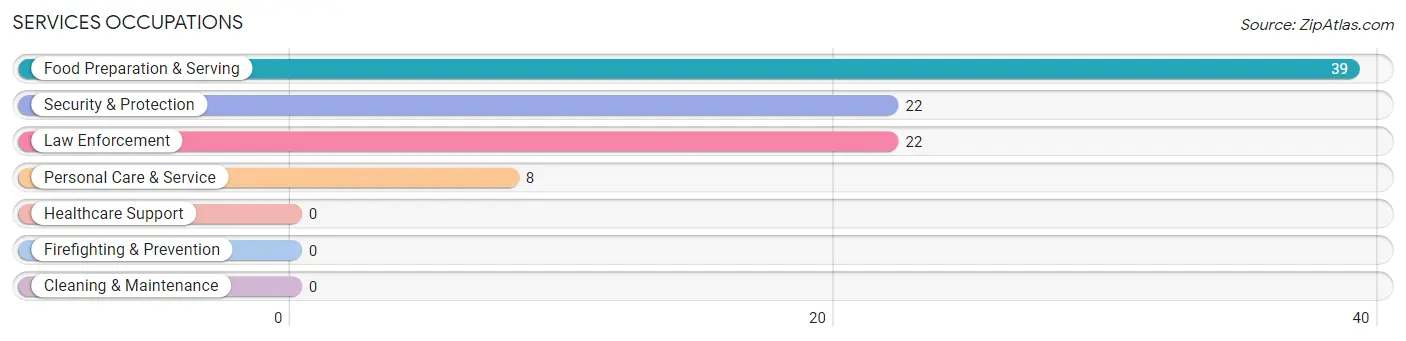
Services Occupations
The most common Services occupations in Bear Creek are Food Preparation & Serving (39 | 6.7%), Security & Protection (22 | 3.8%), Law Enforcement (22 | 3.8%), and Personal Care & Service (8 | 1.4%).
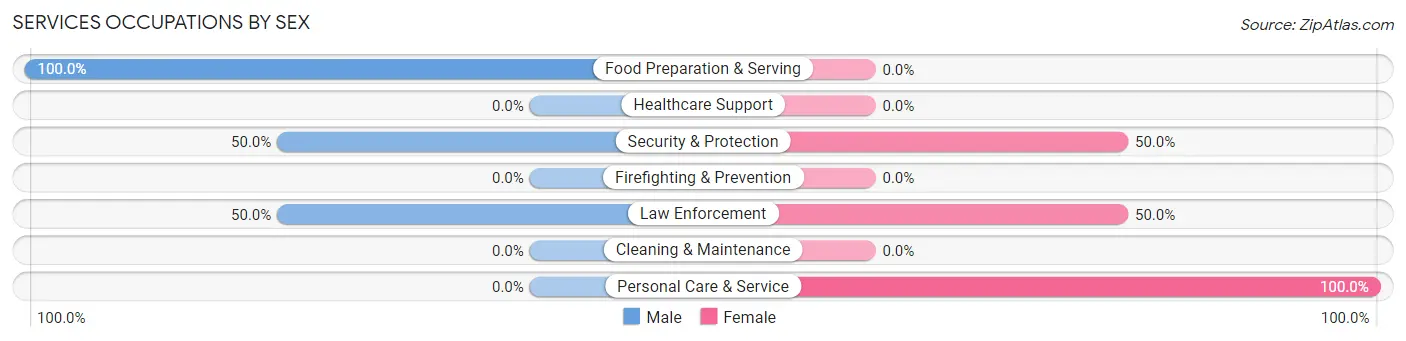
Services Occupations by Sex
Within the Services occupations in Bear Creek, the most male-oriented occupations are Food Preparation & Serving (100.0%), Security & Protection (50.0%), and Law Enforcement (50.0%), while the most female-oriented occupations are Personal Care & Service (100.0%), Security & Protection (50.0%), and Law Enforcement (50.0%).
| Occupation | Male | Female |
| Healthcare Support | 0 (0.0%) | 0 (0.0%) |
| Security & Protection | 11 (50.0%) | 11 (50.0%) |
| Firefighting & Prevention | 0 (0.0%) | 0 (0.0%) |
| Law Enforcement | 11 (50.0%) | 11 (50.0%) |
| Food Preparation & Serving | 39 (100.0%) | 0 (0.0%) |
| Cleaning & Maintenance | 0 (0.0%) | 0 (0.0%) |
| Personal Care & Service | 0 (0.0%) | 8 (100.0%) |
| Total (Category) | 50 (72.5%) | 19 (27.5%) |
| Total (Overall) | 304 (52.1%) | 279 (47.9%) |
Sales and Office Occupations
The most common Sales and Office occupations in Bear Creek are , and Office & Administration (98 | 16.8%).
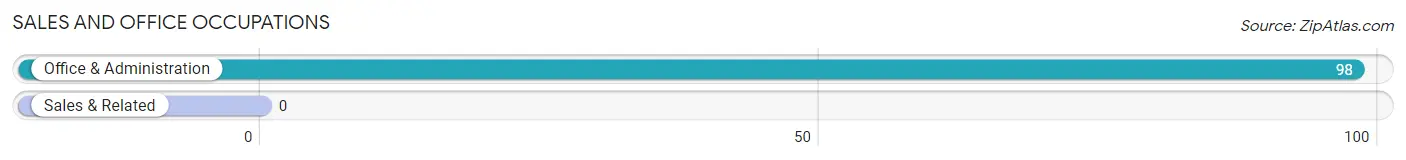
Sales and Office Occupations by Sex
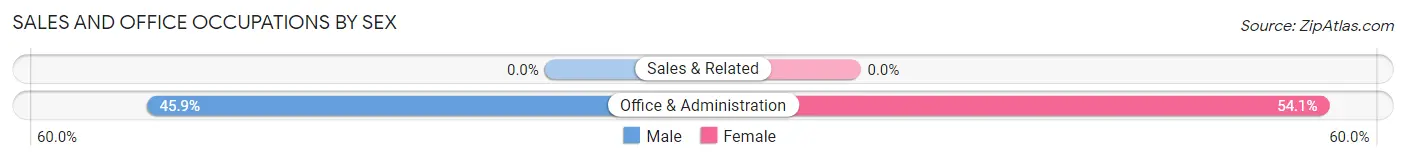
| Occupation | Male | Female |
| Sales & Related | 0 (0.0%) | 0 (0.0%) |
| Office & Administration | 45 (45.9%) | 53 (54.1%) |
| Total (Category) | 45 (45.9%) | 53 (54.1%) |
| Total (Overall) | 304 (52.1%) | 279 (47.9%) |
Natural Resources, Construction and Maintenance Occupations
The most common Natural Resources, Construction and Maintenance occupations in Bear Creek are Construction & Extraction (140 | 24.0%), and Installation, Maintenance & Repair (16 | 2.7%).

Natural Resources, Construction and Maintenance Occupations by Sex
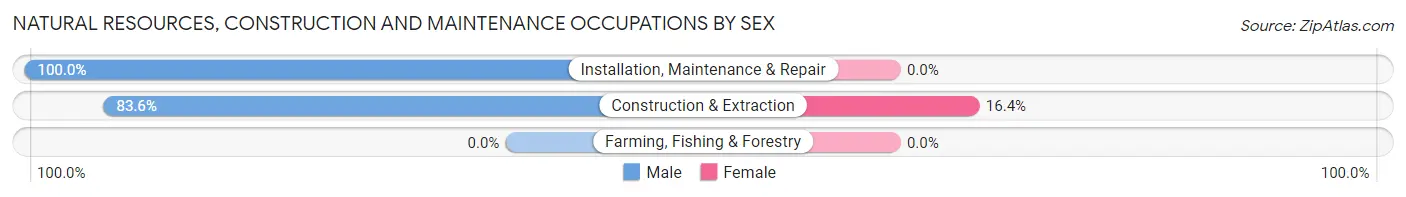
| Occupation | Male | Female |
| Farming, Fishing & Forestry | 0 (0.0%) | 0 (0.0%) |
| Construction & Extraction | 117 (83.6%) | 23 (16.4%) |
| Installation, Maintenance & Repair | 16 (100.0%) | 0 (0.0%) |
| Total (Category) | 133 (85.3%) | 23 (14.7%) |
| Total (Overall) | 304 (52.1%) | 279 (47.9%) |
Production, Transportation and Moving Occupations
The most common Production, Transportation and Moving occupations in Bear Creek are Material Moving (9 | 1.5%), and Production (8 | 1.4%).
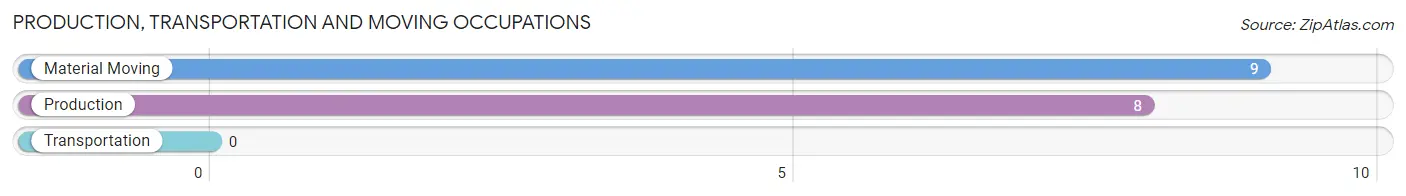
Production, Transportation and Moving Occupations by Sex
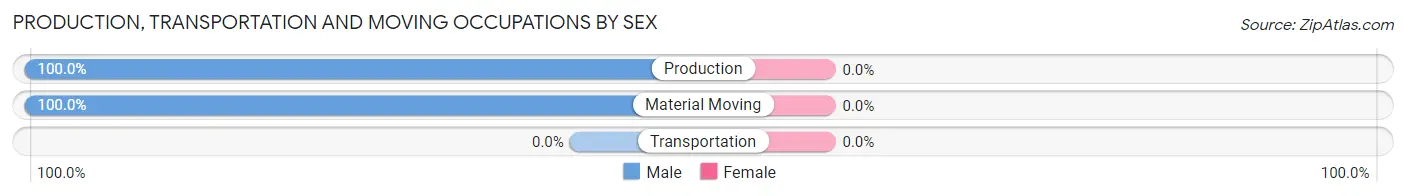
| Occupation | Male | Female |
| Production | 8 (100.0%) | 0 (0.0%) |
| Transportation | 0 (0.0%) | 0 (0.0%) |
| Material Moving | 9 (100.0%) | 0 (0.0%) |
| Total (Category) | 17 (100.0%) | 0 (0.0%) |
| Total (Overall) | 304 (52.1%) | 279 (47.9%) |
Employment Industries by Sex in Bear Creek
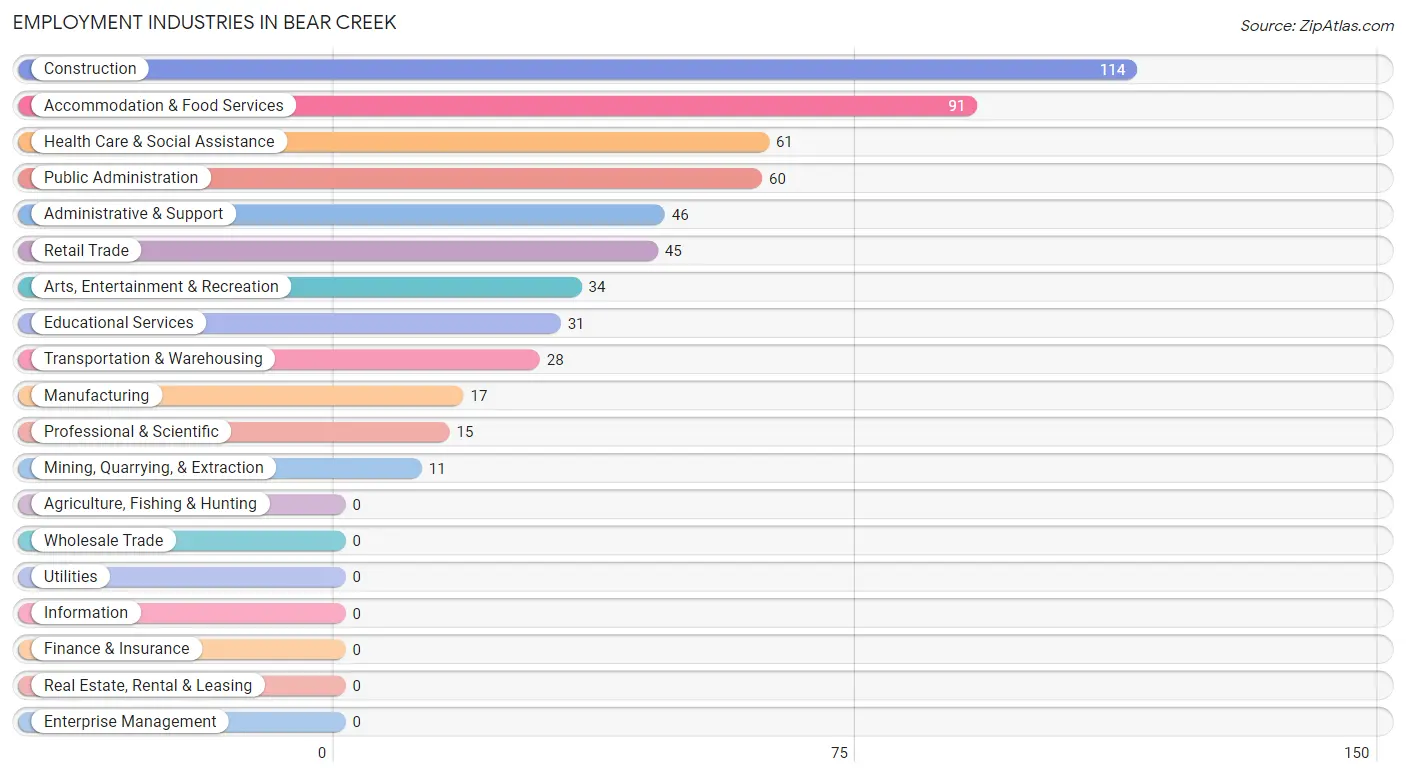
Employment Industries in Bear Creek
The major employment industries in Bear Creek include Construction (114 | 19.6%), Accommodation & Food Services (91 | 15.6%), Health Care & Social Assistance (61 | 10.5%), Public Administration (60 | 10.3%), and Administrative & Support (46 | 7.9%).
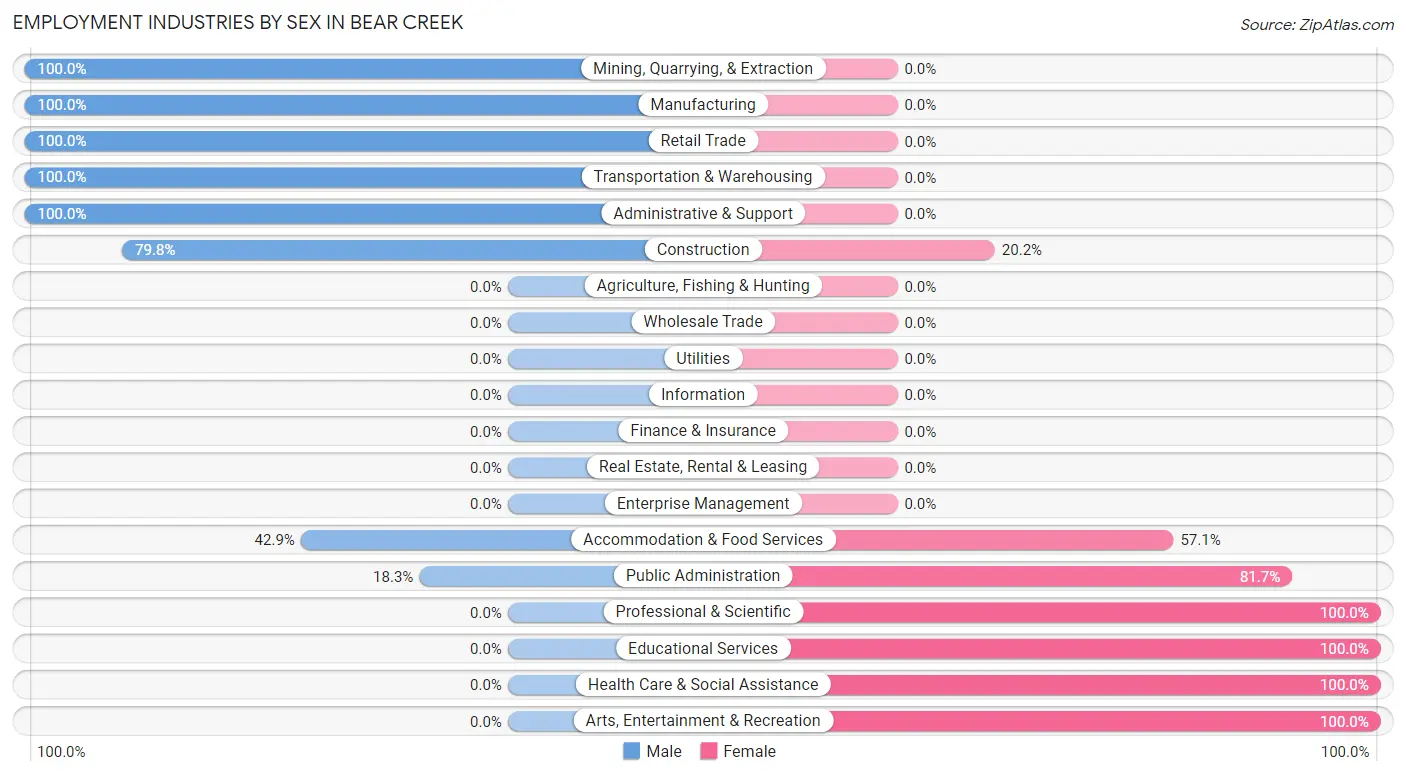
Employment Industries by Sex in Bear Creek
The Bear Creek industries that see more men than women are Mining, Quarrying, & Extraction (100.0%), Manufacturing (100.0%), and Retail Trade (100.0%), whereas the industries that tend to have a higher number of women are Professional & Scientific (100.0%), Educational Services (100.0%), and Health Care & Social Assistance (100.0%).
| Industry | Male | Female |
| Agriculture, Fishing & Hunting | 0 (0.0%) | 0 (0.0%) |
| Mining, Quarrying, & Extraction | 11 (100.0%) | 0 (0.0%) |
| Construction | 91 (79.8%) | 23 (20.2%) |
| Manufacturing | 17 (100.0%) | 0 (0.0%) |
| Wholesale Trade | 0 (0.0%) | 0 (0.0%) |
| Retail Trade | 45 (100.0%) | 0 (0.0%) |
| Transportation & Warehousing | 28 (100.0%) | 0 (0.0%) |
| Utilities | 0 (0.0%) | 0 (0.0%) |
| Information | 0 (0.0%) | 0 (0.0%) |
| Finance & Insurance | 0 (0.0%) | 0 (0.0%) |
| Real Estate, Rental & Leasing | 0 (0.0%) | 0 (0.0%) |
| Professional & Scientific | 0 (0.0%) | 15 (100.0%) |
| Enterprise Management | 0 (0.0%) | 0 (0.0%) |
| Administrative & Support | 46 (100.0%) | 0 (0.0%) |
| Educational Services | 0 (0.0%) | 31 (100.0%) |
| Health Care & Social Assistance | 0 (0.0%) | 61 (100.0%) |
| Arts, Entertainment & Recreation | 0 (0.0%) | 34 (100.0%) |
| Accommodation & Food Services | 39 (42.9%) | 52 (57.1%) |
| Public Administration | 11 (18.3%) | 49 (81.7%) |
| Total | 304 (52.1%) | 279 (47.9%) |
Education in Bear Creek
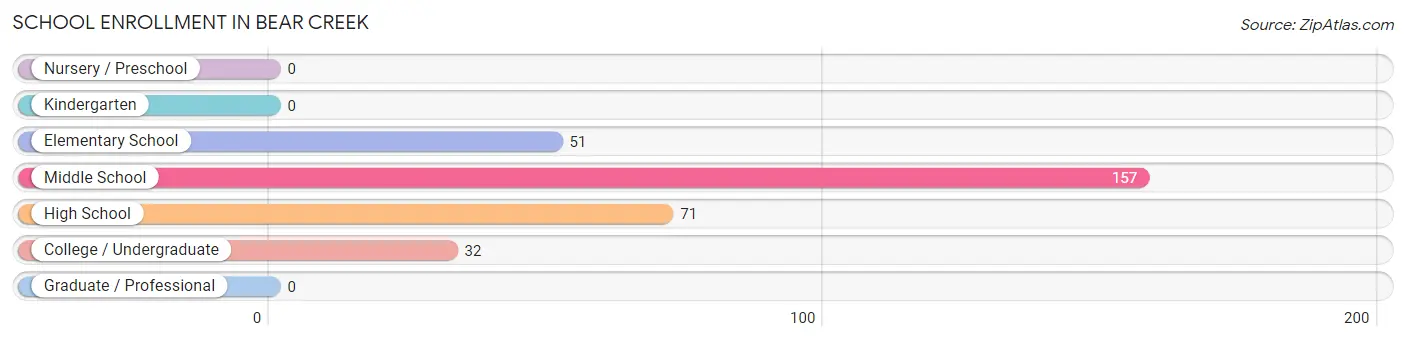
School Enrollment in Bear Creek
The most common levels of schooling among the 311 students in Bear Creek are middle school (157 | 50.5%), high school (71 | 22.8%), and elementary school (51 | 16.4%).
| School Level | # Students | % Students |
| Nursery / Preschool | 0 | 0.0% |
| Kindergarten | 0 | 0.0% |
| Elementary School | 51 | 16.4% |
| Middle School | 157 | 50.5% |
| High School | 71 | 22.8% |
| College / Undergraduate | 32 | 10.3% |
| Graduate / Professional | 0 | 0.0% |
| Total | 311 | 100.0% |
School Enrollment by Age by Funding Source in Bear Creek
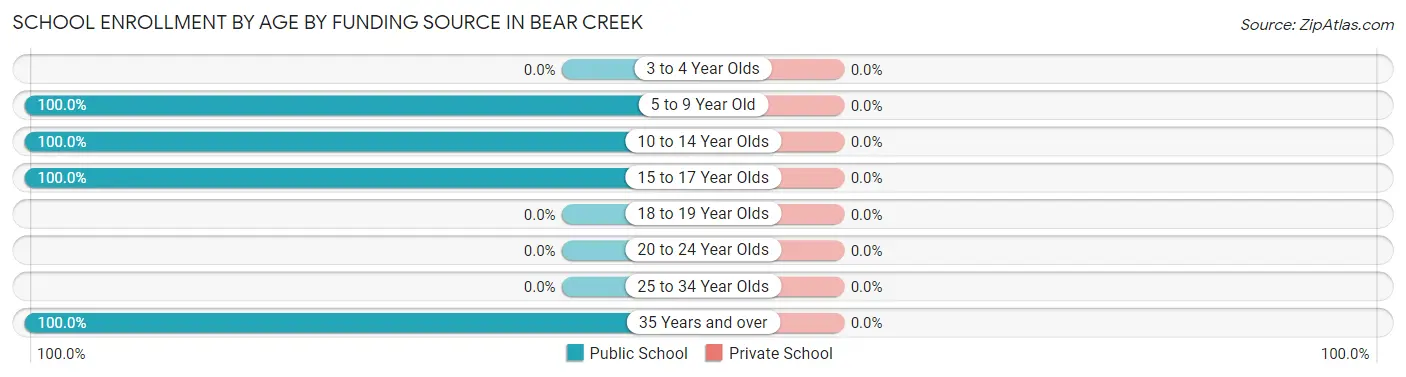
| Age Bracket | Public School | Private School |
| 3 to 4 Year Olds | 0 (0.0%) | 0 (0.0%) |
| 5 to 9 Year Old | 26 (100.0%) | 0 (0.0%) |
| 10 to 14 Year Olds | 182 (100.0%) | 0 (0.0%) |
| 15 to 17 Year Olds | 71 (100.0%) | 0 (0.0%) |
| 18 to 19 Year Olds | 0 (0.0%) | 0 (0.0%) |
| 20 to 24 Year Olds | 0 (0.0%) | 0 (0.0%) |
| 25 to 34 Year Olds | 0 (0.0%) | 0 (0.0%) |
| 35 Years and over | 32 (100.0%) | 0 (0.0%) |
| Total | 311 (100.0%) | 0 (0.0%) |
Educational Attainment by Field of Study in Bear Creek
Education (140 | 35.3%), business (84 | 21.2%), engineering (53 | 13.4%), visual & performing arts (34 | 8.6%), and bio, nature & agricultural (31 | 7.8%) are the most common fields of study among 396 individuals in Bear Creek who have obtained a bachelor's degree or higher.
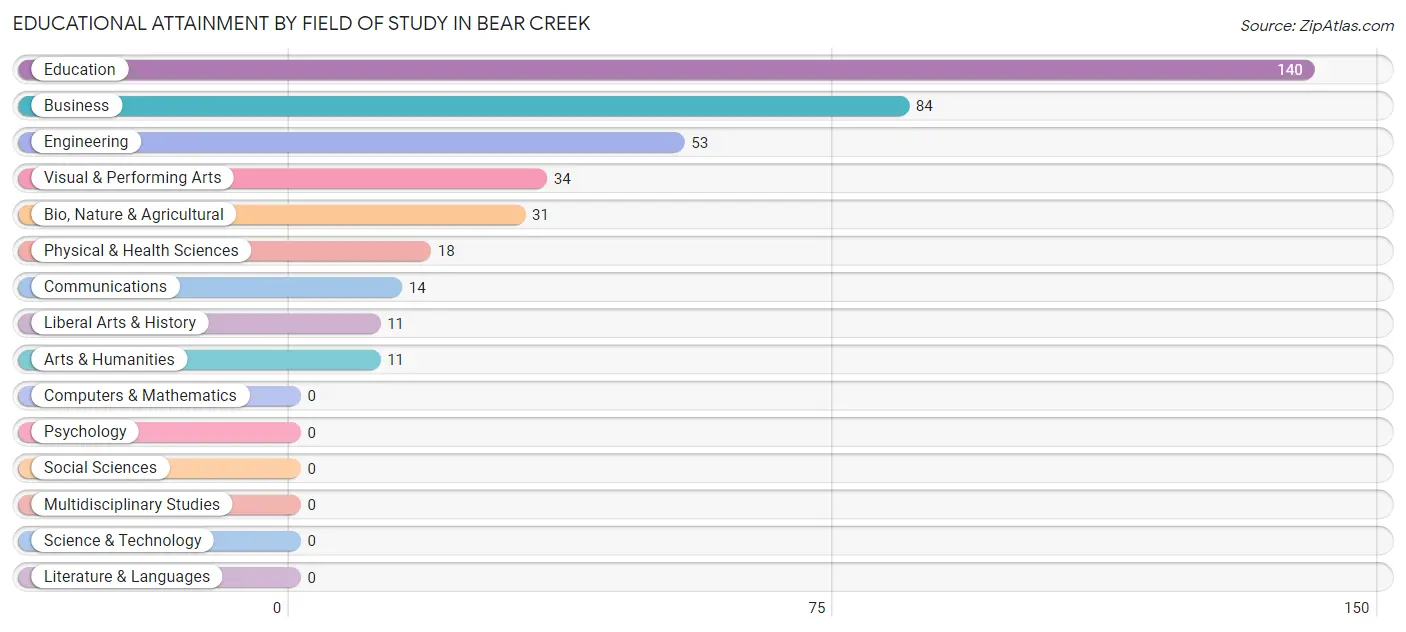
| Field of Study | # Graduates | % Graduates |
| Computers & Mathematics | 0 | 0.0% |
| Bio, Nature & Agricultural | 31 | 7.8% |
| Physical & Health Sciences | 18 | 4.5% |
| Psychology | 0 | 0.0% |
| Social Sciences | 0 | 0.0% |
| Engineering | 53 | 13.4% |
| Multidisciplinary Studies | 0 | 0.0% |
| Science & Technology | 0 | 0.0% |
| Business | 84 | 21.2% |
| Education | 140 | 35.3% |
| Literature & Languages | 0 | 0.0% |
| Liberal Arts & History | 11 | 2.8% |
| Visual & Performing Arts | 34 | 8.6% |
| Communications | 14 | 3.5% |
| Arts & Humanities | 11 | 2.8% |
| Total | 396 | 100.0% |
Transportation & Commute in Bear Creek
Vehicle Availability by Sex in Bear Creek
The most prevalent vehicle ownership categories in Bear Creek are males with 2 vehicles (129, accounting for 48.7%) and females with 2 vehicles (206, making up 52.6%).
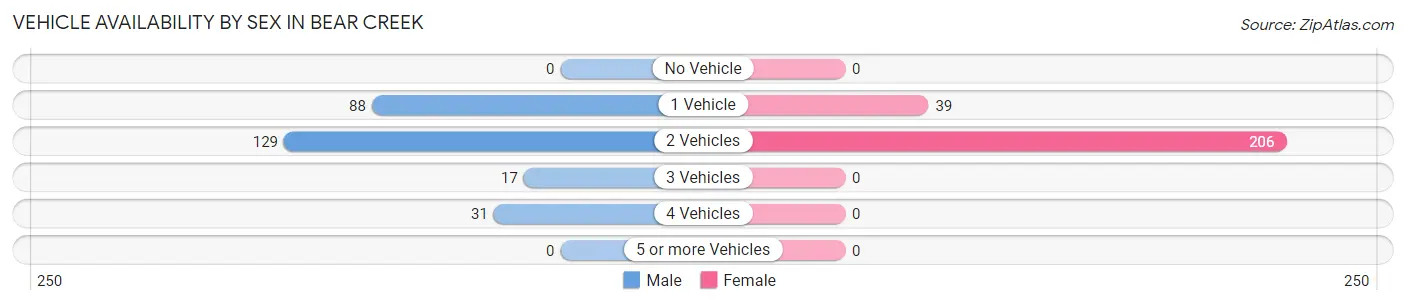
| Vehicles Available | Male | Female |
| No Vehicle | 0 (0.0%) | 0 (0.0%) |
| 1 Vehicle | 88 (33.2%) | 39 (15.9%) |
| 2 Vehicles | 129 (48.7%) | 206 (84.1%) |
| 3 Vehicles | 17 (6.4%) | 0 (0.0%) |
| 4 Vehicles | 31 (11.7%) | 0 (0.0%) |
| 5 or more Vehicles | 0 (0.0%) | 0 (0.0%) |
| Total | 265 (100.0%) | 245 (100.0%) |
Commute Time in Bear Creek
The most frequently occuring commute durations in Bear Creek are 10 to 14 minutes (226 commuters, 44.9%), 5 to 9 minutes (200 commuters, 39.8%), and 15 to 19 minutes (69 commuters, 13.7%).
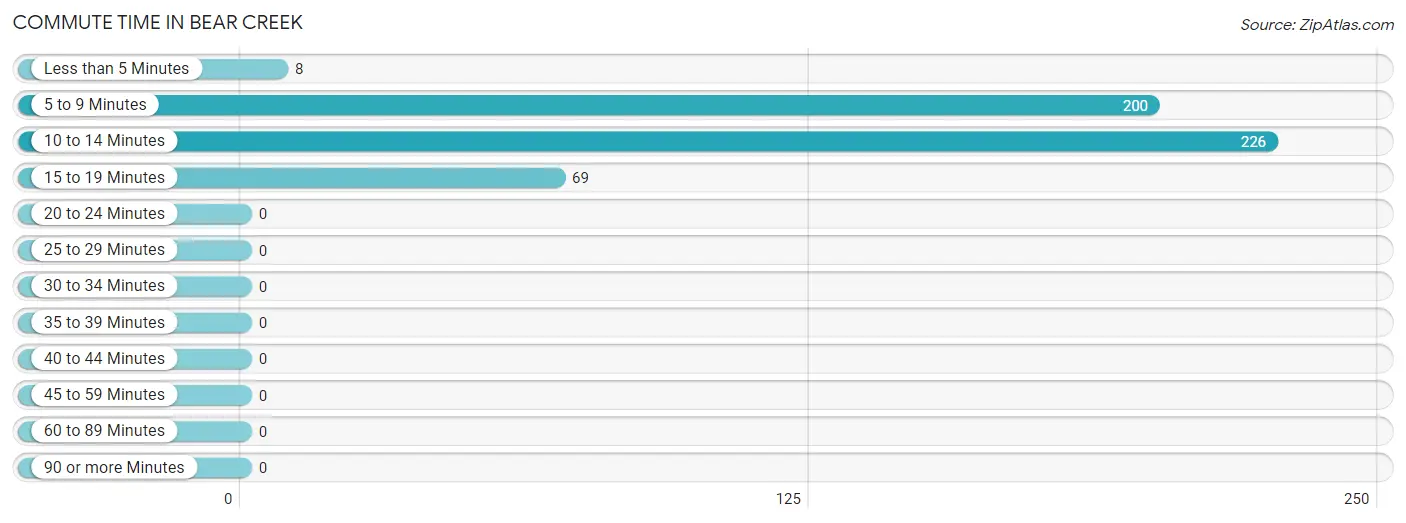
| Commute Time | # Commuters | % Commuters |
| Less than 5 Minutes | 8 | 1.6% |
| 5 to 9 Minutes | 200 | 39.8% |
| 10 to 14 Minutes | 226 | 44.9% |
| 15 to 19 Minutes | 69 | 13.7% |
| 20 to 24 Minutes | 0 | 0.0% |
| 25 to 29 Minutes | 0 | 0.0% |
| 30 to 34 Minutes | 0 | 0.0% |
| 35 to 39 Minutes | 0 | 0.0% |
| 40 to 44 Minutes | 0 | 0.0% |
| 45 to 59 Minutes | 0 | 0.0% |
| 60 to 89 Minutes | 0 | 0.0% |
| 90 or more Minutes | 0 | 0.0% |
Commute Time by Sex in Bear Creek
The most common commute times in Bear Creek are 5 to 9 minutes (161 commuters, 53.0%) for males and 10 to 14 minutes (107 commuters, 53.8%) for females.
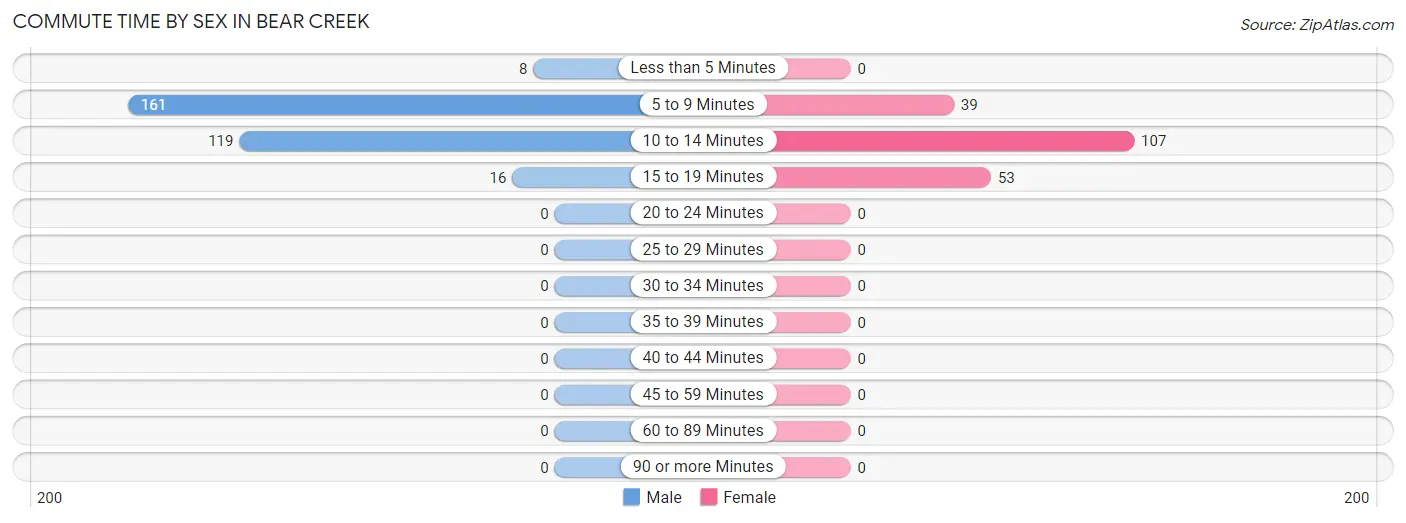
| Commute Time | Male | Female |
| Less than 5 Minutes | 8 (2.6%) | 0 (0.0%) |
| 5 to 9 Minutes | 161 (53.0%) | 39 (19.6%) |
| 10 to 14 Minutes | 119 (39.1%) | 107 (53.8%) |
| 15 to 19 Minutes | 16 (5.3%) | 53 (26.6%) |
| 20 to 24 Minutes | 0 (0.0%) | 0 (0.0%) |
| 25 to 29 Minutes | 0 (0.0%) | 0 (0.0%) |
| 30 to 34 Minutes | 0 (0.0%) | 0 (0.0%) |
| 35 to 39 Minutes | 0 (0.0%) | 0 (0.0%) |
| 40 to 44 Minutes | 0 (0.0%) | 0 (0.0%) |
| 45 to 59 Minutes | 0 (0.0%) | 0 (0.0%) |
| 60 to 89 Minutes | 0 (0.0%) | 0 (0.0%) |
| 90 or more Minutes | 0 (0.0%) | 0 (0.0%) |
Time of Departure to Work by Sex in Bear Creek
The most frequent times of departure to work in Bear Creek are 7:30 AM to 7:59 AM (133, 43.8%) for males and 7:30 AM to 7:59 AM (95, 47.7%) for females.
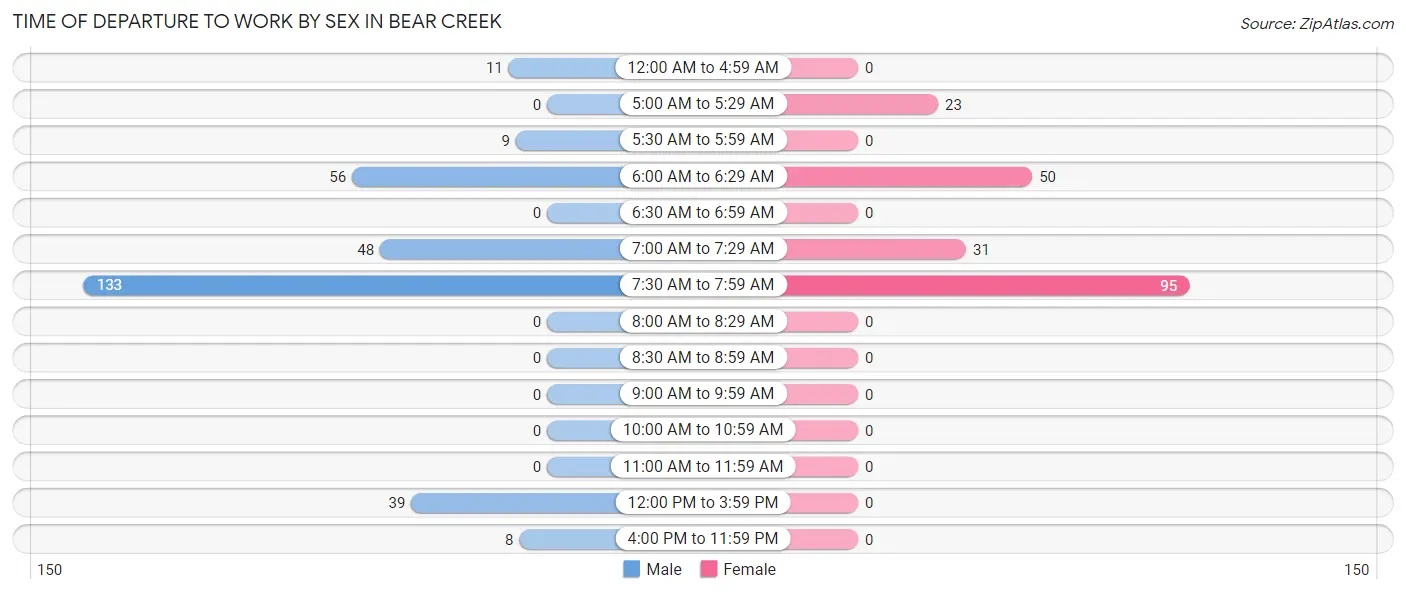
| Time of Departure | Male | Female |
| 12:00 AM to 4:59 AM | 11 (3.6%) | 0 (0.0%) |
| 5:00 AM to 5:29 AM | 0 (0.0%) | 23 (11.6%) |
| 5:30 AM to 5:59 AM | 9 (3.0%) | 0 (0.0%) |
| 6:00 AM to 6:29 AM | 56 (18.4%) | 50 (25.1%) |
| 6:30 AM to 6:59 AM | 0 (0.0%) | 0 (0.0%) |
| 7:00 AM to 7:29 AM | 48 (15.8%) | 31 (15.6%) |
| 7:30 AM to 7:59 AM | 133 (43.8%) | 95 (47.7%) |
| 8:00 AM to 8:29 AM | 0 (0.0%) | 0 (0.0%) |
| 8:30 AM to 8:59 AM | 0 (0.0%) | 0 (0.0%) |
| 9:00 AM to 9:59 AM | 0 (0.0%) | 0 (0.0%) |
| 10:00 AM to 10:59 AM | 0 (0.0%) | 0 (0.0%) |
| 11:00 AM to 11:59 AM | 0 (0.0%) | 0 (0.0%) |
| 12:00 PM to 3:59 PM | 39 (12.8%) | 0 (0.0%) |
| 4:00 PM to 11:59 PM | 8 (2.6%) | 0 (0.0%) |
| Total | 304 (100.0%) | 199 (100.0%) |
Housing Occupancy in Bear Creek
Occupancy by Ownership in Bear Creek
Of the total 461 dwellings in Bear Creek, owner-occupied units account for 288 (62.5%), while renter-occupied units make up 173 (37.5%).
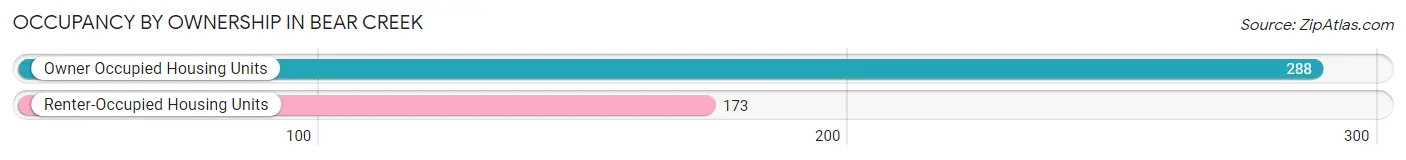
| Occupancy | # Housing Units | % Housing Units |
| Owner Occupied Housing Units | 288 | 62.5% |
| Renter-Occupied Housing Units | 173 | 37.5% |
| Total Occupied Housing Units | 461 | 100.0% |
Occupancy by Household Size in Bear Creek
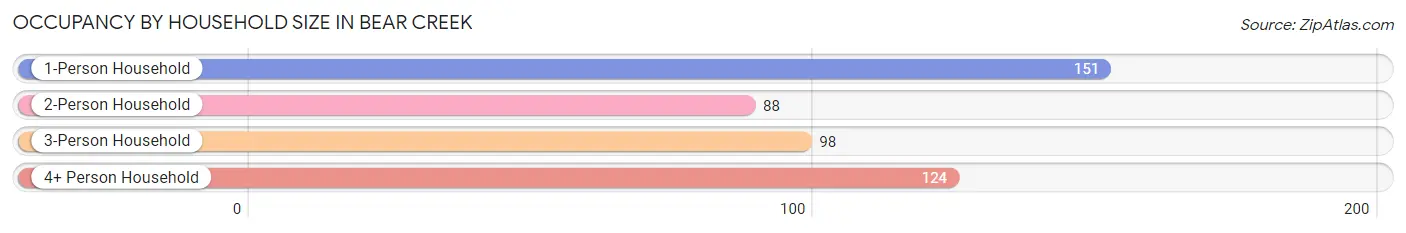
| Household Size | # Housing Units | % Housing Units |
| 1-Person Household | 151 | 32.8% |
| 2-Person Household | 88 | 19.1% |
| 3-Person Household | 98 | 21.3% |
| 4+ Person Household | 124 | 26.9% |
| Total Housing Units | 461 | 100.0% |
Occupancy by Ownership by Household Size in Bear Creek
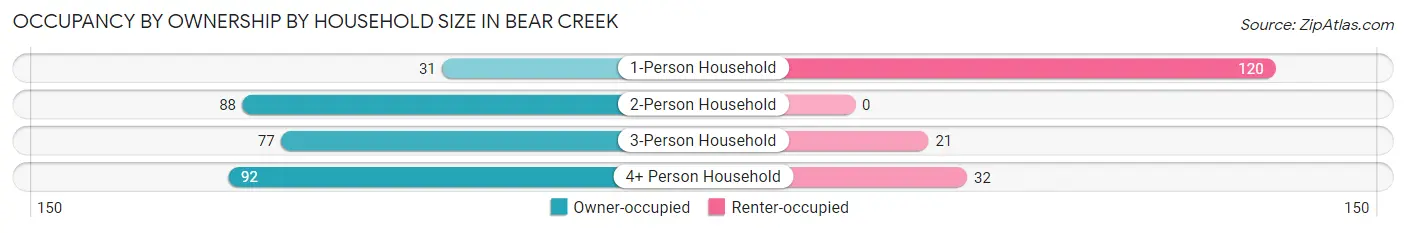
| Household Size | Owner-occupied | Renter-occupied |
| 1-Person Household | 31 (20.5%) | 120 (79.5%) |
| 2-Person Household | 88 (100.0%) | 0 (0.0%) |
| 3-Person Household | 77 (78.6%) | 21 (21.4%) |
| 4+ Person Household | 92 (74.2%) | 32 (25.8%) |
| Total Housing Units | 288 (62.5%) | 173 (37.5%) |
Occupancy by Educational Attainment in Bear Creek
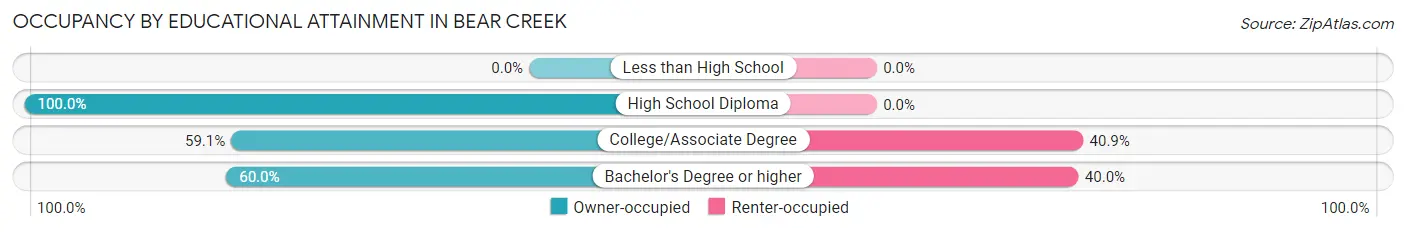
| Household Size | Owner-occupied | Renter-occupied |
| Less than High School | 0 (0.0%) | 0 (0.0%) |
| High School Diploma | 34 (100.0%) | 0 (0.0%) |
| College/Associate Degree | 140 (59.1%) | 97 (40.9%) |
| Bachelor's Degree or higher | 114 (60.0%) | 76 (40.0%) |
Occupancy by Age of Householder in Bear Creek
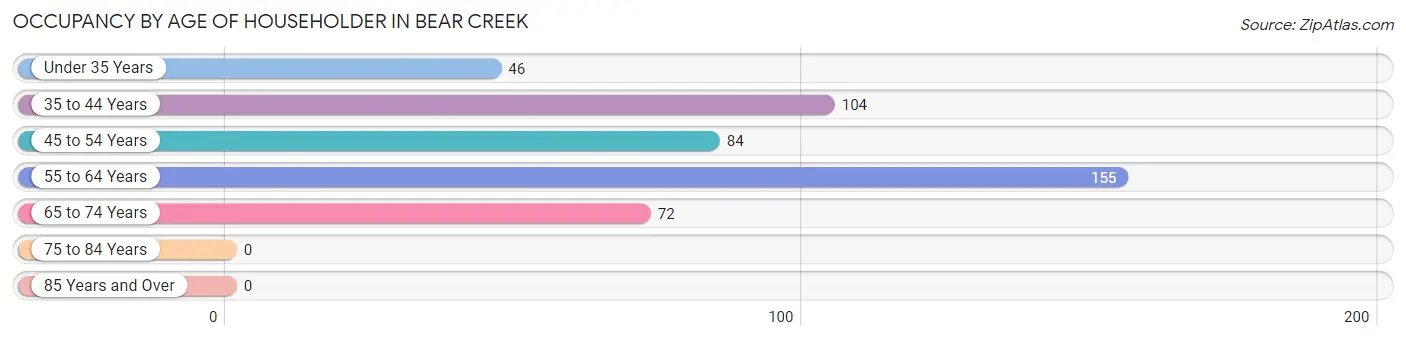
| Age Bracket | # Households | % Households |
| Under 35 Years | 46 | 10.0% |
| 35 to 44 Years | 104 | 22.6% |
| 45 to 54 Years | 84 | 18.2% |
| 55 to 64 Years | 155 | 33.6% |
| 65 to 74 Years | 72 | 15.6% |
| 75 to 84 Years | 0 | 0.0% |
| 85 Years and Over | 0 | 0.0% |
| Total | 461 | 100.0% |
Housing Finances in Bear Creek
Median Income by Occupancy in Bear Creek
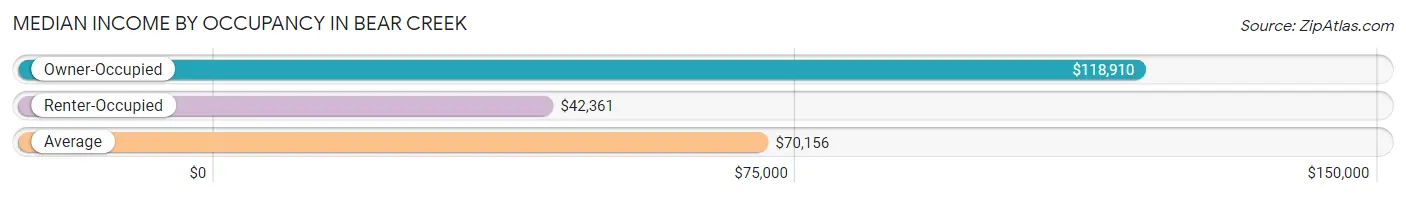
| Occupancy Type | # Households | Median Income |
| Owner-Occupied | 288 (62.5%) | $118,910 |
| Renter-Occupied | 173 (37.5%) | $42,361 |
| Average | 461 (100.0%) | $70,156 |
Occupancy by Householder Income Bracket in Bear Creek
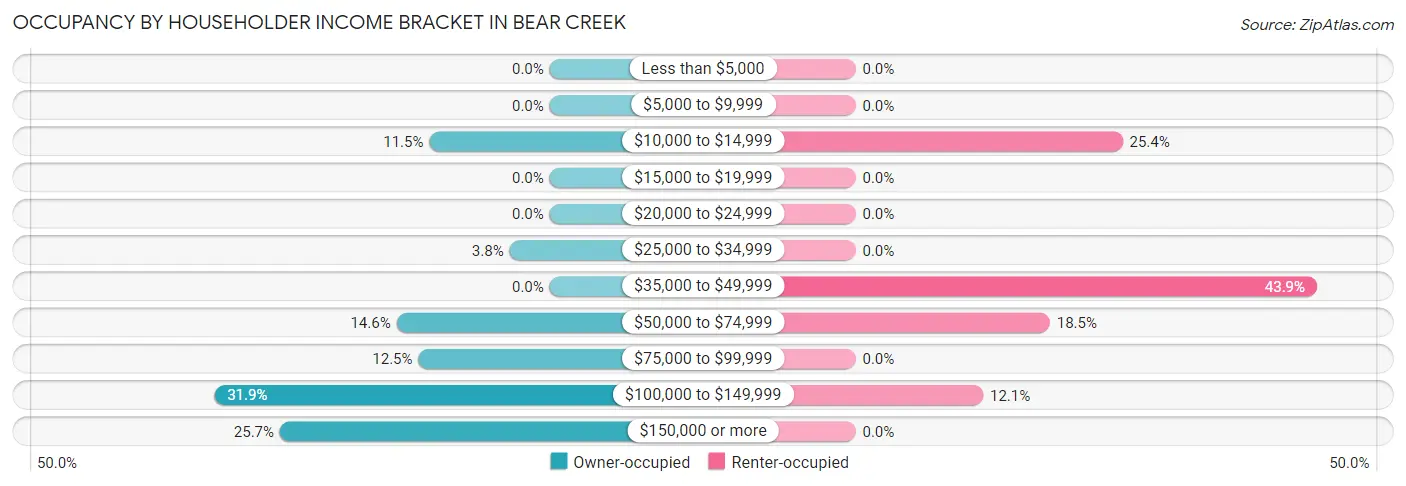
| Income Bracket | Owner-occupied | Renter-occupied |
| Less than $5,000 | 0 (0.0%) | 0 (0.0%) |
| $5,000 to $9,999 | 0 (0.0%) | 0 (0.0%) |
| $10,000 to $14,999 | 33 (11.5%) | 44 (25.4%) |
| $15,000 to $19,999 | 0 (0.0%) | 0 (0.0%) |
| $20,000 to $24,999 | 0 (0.0%) | 0 (0.0%) |
| $25,000 to $34,999 | 11 (3.8%) | 0 (0.0%) |
| $35,000 to $49,999 | 0 (0.0%) | 76 (43.9%) |
| $50,000 to $74,999 | 42 (14.6%) | 32 (18.5%) |
| $75,000 to $99,999 | 36 (12.5%) | 0 (0.0%) |
| $100,000 to $149,999 | 92 (31.9%) | 21 (12.1%) |
| $150,000 or more | 74 (25.7%) | 0 (0.0%) |
| Total | 288 (100.0%) | 173 (100.0%) |
Monthly Housing Cost Tiers in Bear Creek
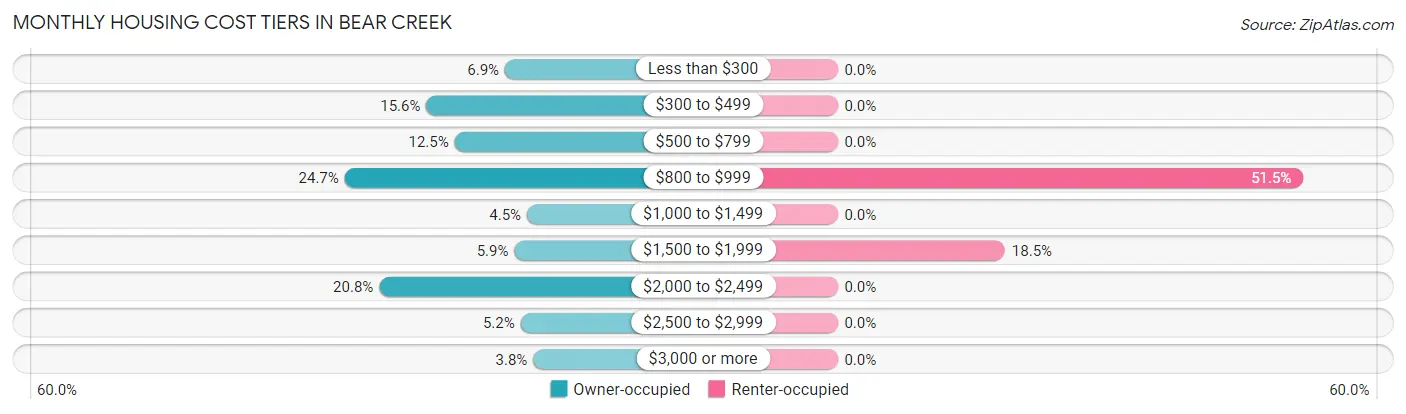
| Monthly Cost | Owner-occupied | Renter-occupied |
| Less than $300 | 20 (6.9%) | 0 (0.0%) |
| $300 to $499 | 45 (15.6%) | 0 (0.0%) |
| $500 to $799 | 36 (12.5%) | 0 (0.0%) |
| $800 to $999 | 71 (24.6%) | 89 (51.4%) |
| $1,000 to $1,499 | 13 (4.5%) | 0 (0.0%) |
| $1,500 to $1,999 | 17 (5.9%) | 32 (18.5%) |
| $2,000 to $2,499 | 60 (20.8%) | 0 (0.0%) |
| $2,500 to $2,999 | 15 (5.2%) | 0 (0.0%) |
| $3,000 or more | 11 (3.8%) | 0 (0.0%) |
| Total | 288 (100.0%) | 173 (100.0%) |
Physical Housing Characteristics in Bear Creek
Housing Structures in Bear Creek
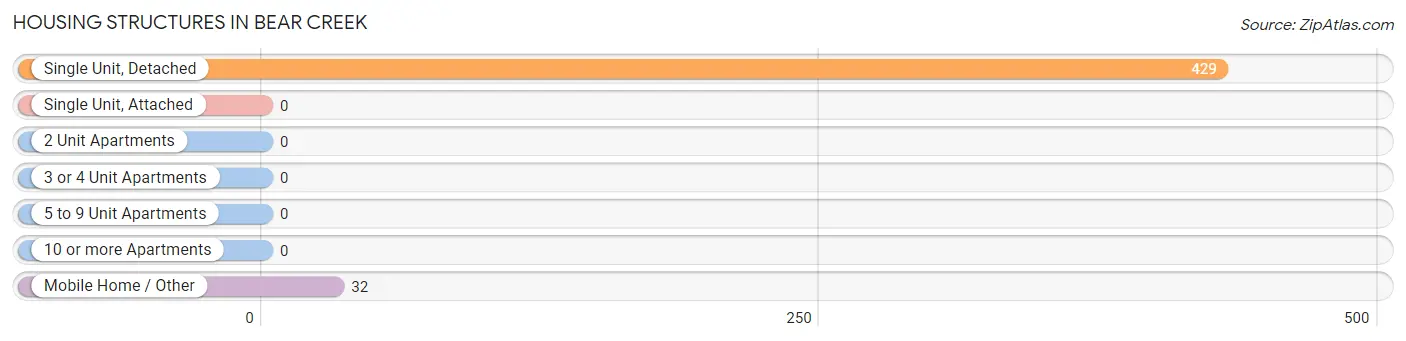
| Structure Type | # Housing Units | % Housing Units |
| Single Unit, Detached | 429 | 93.1% |
| Single Unit, Attached | 0 | 0.0% |
| 2 Unit Apartments | 0 | 0.0% |
| 3 or 4 Unit Apartments | 0 | 0.0% |
| 5 to 9 Unit Apartments | 0 | 0.0% |
| 10 or more Apartments | 0 | 0.0% |
| Mobile Home / Other | 32 | 6.9% |
| Total | 461 | 100.0% |
Housing Structures by Occupancy in Bear Creek
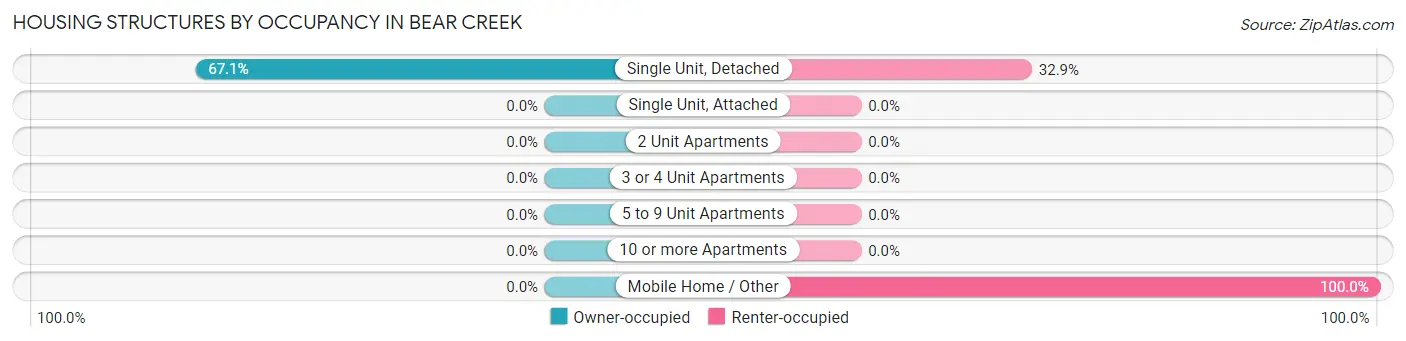
| Structure Type | Owner-occupied | Renter-occupied |
| Single Unit, Detached | 288 (67.1%) | 141 (32.9%) |
| Single Unit, Attached | 0 (0.0%) | 0 (0.0%) |
| 2 Unit Apartments | 0 (0.0%) | 0 (0.0%) |
| 3 or 4 Unit Apartments | 0 (0.0%) | 0 (0.0%) |
| 5 to 9 Unit Apartments | 0 (0.0%) | 0 (0.0%) |
| 10 or more Apartments | 0 (0.0%) | 0 (0.0%) |
| Mobile Home / Other | 0 (0.0%) | 32 (100.0%) |
| Total | 288 (62.5%) | 173 (37.5%) |
Housing Structures by Number of Rooms in Bear Creek
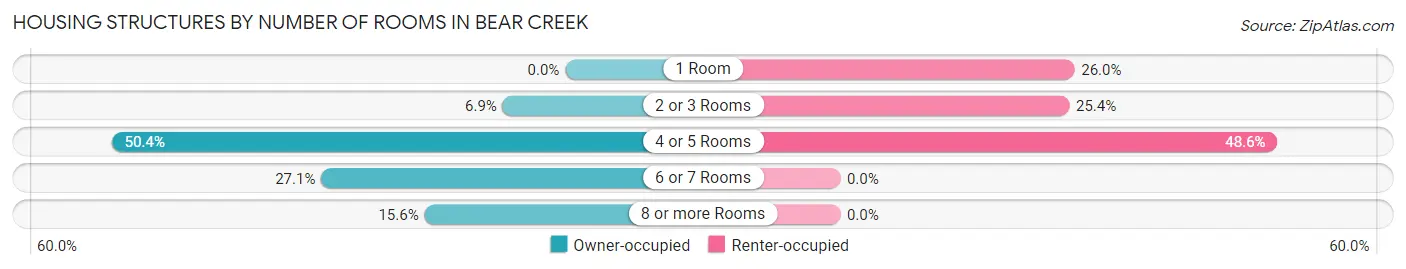
| Number of Rooms | Owner-occupied | Renter-occupied |
| 1 Room | 0 (0.0%) | 45 (26.0%) |
| 2 or 3 Rooms | 20 (6.9%) | 44 (25.4%) |
| 4 or 5 Rooms | 145 (50.3%) | 84 (48.5%) |
| 6 or 7 Rooms | 78 (27.1%) | 0 (0.0%) |
| 8 or more Rooms | 45 (15.6%) | 0 (0.0%) |
| Total | 288 (100.0%) | 173 (100.0%) |
Housing Structure by Heating Type in Bear Creek
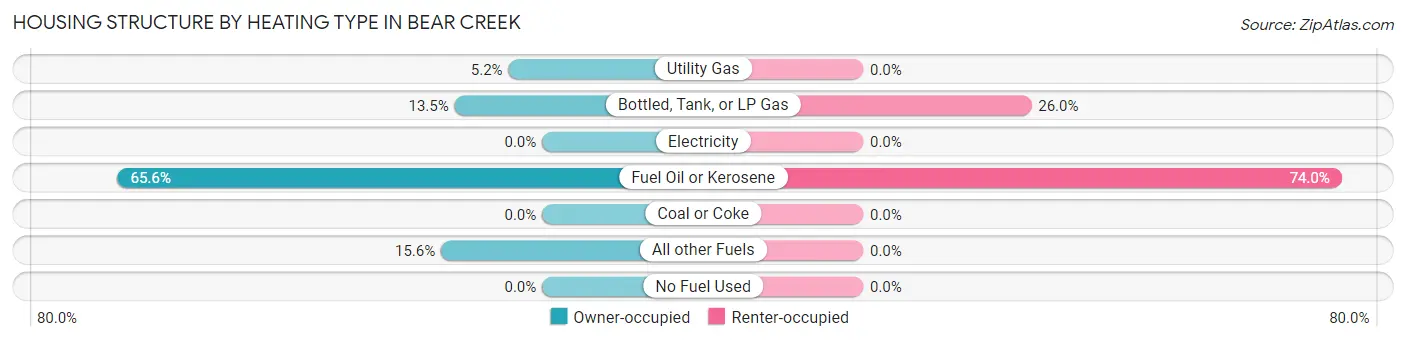
| Heating Type | Owner-occupied | Renter-occupied |
| Utility Gas | 15 (5.2%) | 0 (0.0%) |
| Bottled, Tank, or LP Gas | 39 (13.5%) | 45 (26.0%) |
| Electricity | 0 (0.0%) | 0 (0.0%) |
| Fuel Oil or Kerosene | 189 (65.6%) | 128 (74.0%) |
| Coal or Coke | 0 (0.0%) | 0 (0.0%) |
| All other Fuels | 45 (15.6%) | 0 (0.0%) |
| No Fuel Used | 0 (0.0%) | 0 (0.0%) |
| Total | 288 (100.0%) | 173 (100.0%) |
Household Vehicle Usage in Bear Creek
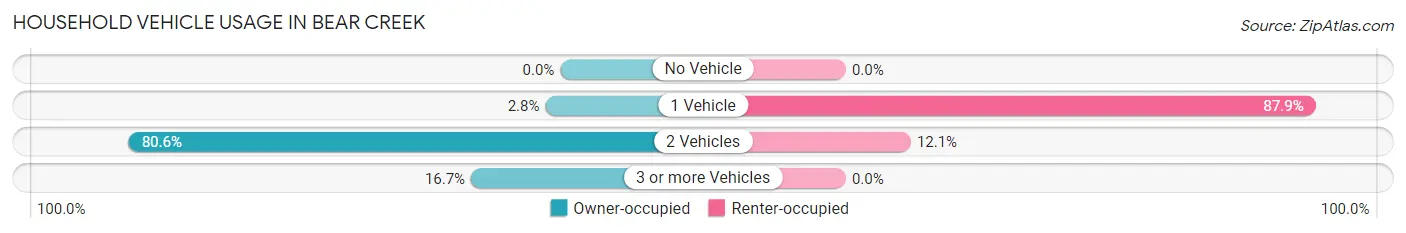
| Vehicles per Household | Owner-occupied | Renter-occupied |
| No Vehicle | 0 (0.0%) | 0 (0.0%) |
| 1 Vehicle | 8 (2.8%) | 152 (87.9%) |
| 2 Vehicles | 232 (80.6%) | 21 (12.1%) |
| 3 or more Vehicles | 48 (16.7%) | 0 (0.0%) |
| Total | 288 (100.0%) | 173 (100.0%) |
Real Estate & Mortgages in Bear Creek
Real Estate and Mortgage Overview in Bear Creek
| Characteristic | Without Mortgage | With Mortgage |
| Housing Units | 185 | 103 |
| Median Property Value | $230,800 | $434,800 |
| Median Household Income | $88,507 | $56 |
| Monthly Housing Costs | $776 | $11 |
| Real Estate Taxes | $1,646 | $15 |
Property Value by Mortgage Status in Bear Creek
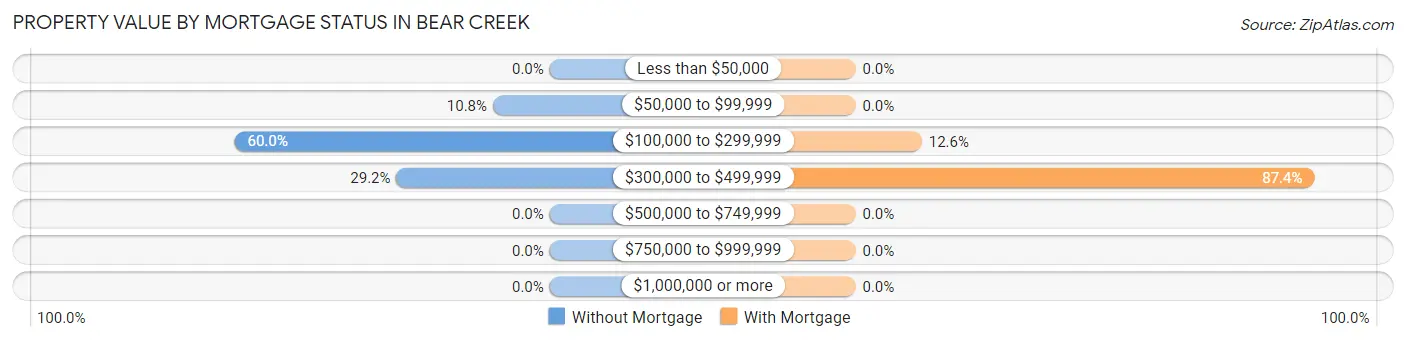
| Property Value | Without Mortgage | With Mortgage |
| Less than $50,000 | 0 (0.0%) | 0 (0.0%) |
| $50,000 to $99,999 | 20 (10.8%) | 0 (0.0%) |
| $100,000 to $299,999 | 111 (60.0%) | 13 (12.6%) |
| $300,000 to $499,999 | 54 (29.2%) | 90 (87.4%) |
| $500,000 to $749,999 | 0 (0.0%) | 0 (0.0%) |
| $750,000 to $999,999 | 0 (0.0%) | 0 (0.0%) |
| $1,000,000 or more | 0 (0.0%) | 0 (0.0%) |
| Total | 185 (100.0%) | 103 (100.0%) |
Household Income by Mortgage Status in Bear Creek
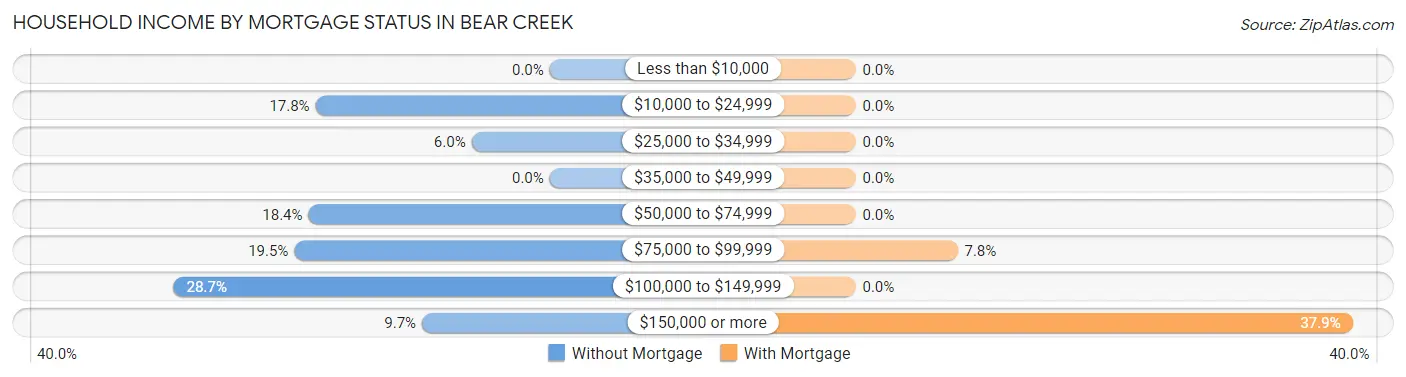
| Household Income | Without Mortgage | With Mortgage |
| Less than $10,000 | 0 (0.0%) | 0 (0.0%) |
| $10,000 to $24,999 | 33 (17.8%) | 0 (0.0%) |
| $25,000 to $34,999 | 11 (5.9%) | 0 (0.0%) |
| $35,000 to $49,999 | 0 (0.0%) | 0 (0.0%) |
| $50,000 to $74,999 | 34 (18.4%) | 0 (0.0%) |
| $75,000 to $99,999 | 36 (19.5%) | 8 (7.8%) |
| $100,000 to $149,999 | 53 (28.6%) | 0 (0.0%) |
| $150,000 or more | 18 (9.7%) | 39 (37.9%) |
| Total | 185 (100.0%) | 103 (100.0%) |
Property Value to Household Income Ratio in Bear Creek
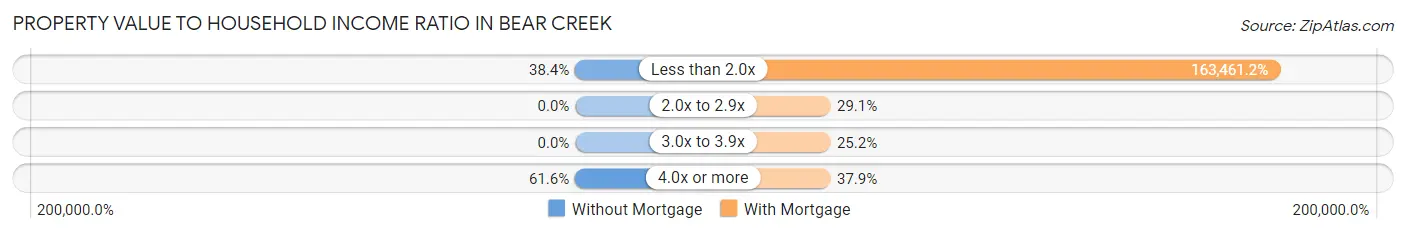
| Value-to-Income Ratio | Without Mortgage | With Mortgage |
| Less than 2.0x | 71 (38.4%) | 168,365 (163,461.2%) |
| 2.0x to 2.9x | 0 (0.0%) | 30 (29.1%) |
| 3.0x to 3.9x | 0 (0.0%) | 26 (25.2%) |
| 4.0x or more | 114 (61.6%) | 39 (37.9%) |
| Total | 185 (100.0%) | 103 (100.0%) |
Real Estate Taxes by Mortgage Status in Bear Creek
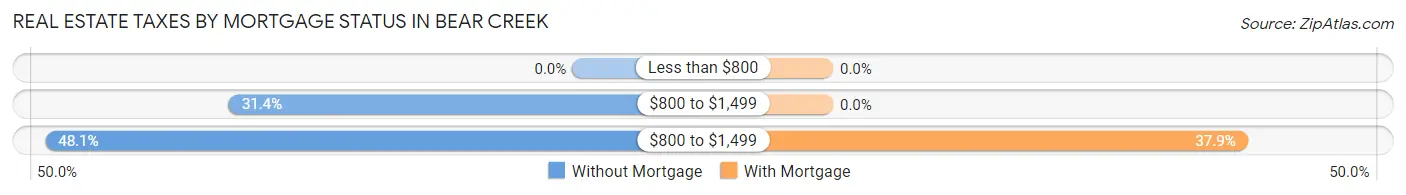
| Property Taxes | Without Mortgage | With Mortgage |
| Less than $800 | 0 (0.0%) | 0 (0.0%) |
| $800 to $1,499 | 58 (31.4%) | 0 (0.0%) |
| $800 to $1,499 | 89 (48.1%) | 39 (37.9%) |
| Total | 185 (100.0%) | 103 (100.0%) |
Health & Disability in Bear Creek
Health Insurance Coverage by Age in Bear Creek
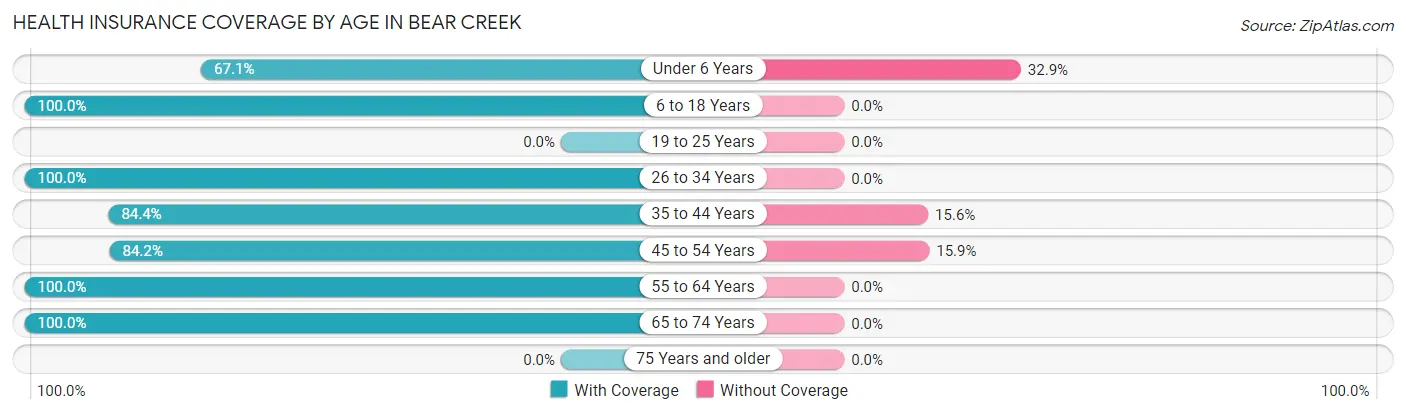
| Age Bracket | With Coverage | Without Coverage |
| Under 6 Years | 55 (67.1%) | 27 (32.9%) |
| 6 to 18 Years | 277 (100.0%) | 0 (0.0%) |
| 19 to 25 Years | 0 (0.0%) | 0 (0.0%) |
| 26 to 34 Years | 109 (100.0%) | 0 (0.0%) |
| 35 to 44 Years | 151 (84.4%) | 28 (15.6%) |
| 45 to 54 Years | 207 (84.2%) | 39 (15.9%) |
| 55 to 64 Years | 189 (100.0%) | 0 (0.0%) |
| 65 to 74 Years | 199 (100.0%) | 0 (0.0%) |
| 75 Years and older | 0 (0.0%) | 0 (0.0%) |
| Total | 1,187 (92.7%) | 94 (7.3%) |
Health Insurance Coverage by Citizenship Status in Bear Creek
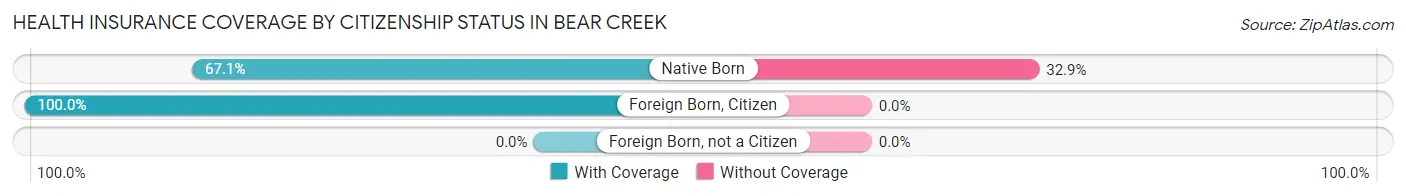
| Citizenship Status | With Coverage | Without Coverage |
| Native Born | 55 (67.1%) | 27 (32.9%) |
| Foreign Born, Citizen | 277 (100.0%) | 0 (0.0%) |
| Foreign Born, not a Citizen | 0 (0.0%) | 0 (0.0%) |
Health Insurance Coverage by Household Income in Bear Creek
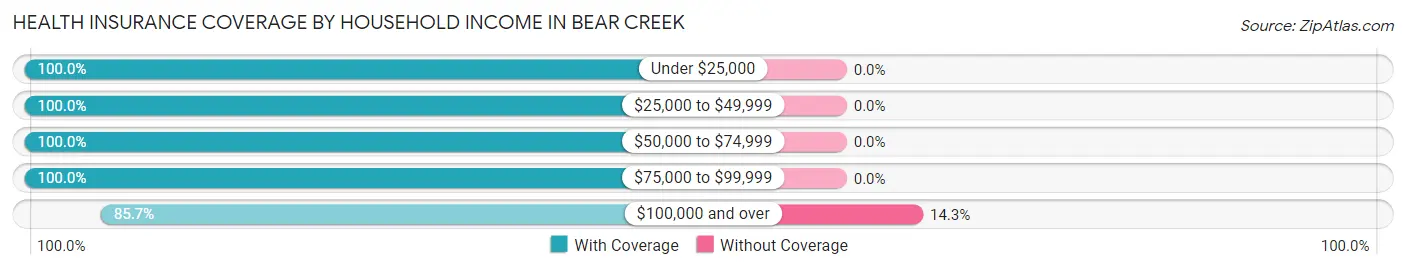
| Household Income | With Coverage | Without Coverage |
| Under $25,000 | 120 (100.0%) | 0 (0.0%) |
| $25,000 to $49,999 | 87 (100.0%) | 0 (0.0%) |
| $50,000 to $74,999 | 253 (100.0%) | 0 (0.0%) |
| $75,000 to $99,999 | 124 (100.0%) | 0 (0.0%) |
| $100,000 and over | 564 (85.7%) | 94 (14.3%) |
Public vs Private Health Insurance Coverage by Age in Bear Creek
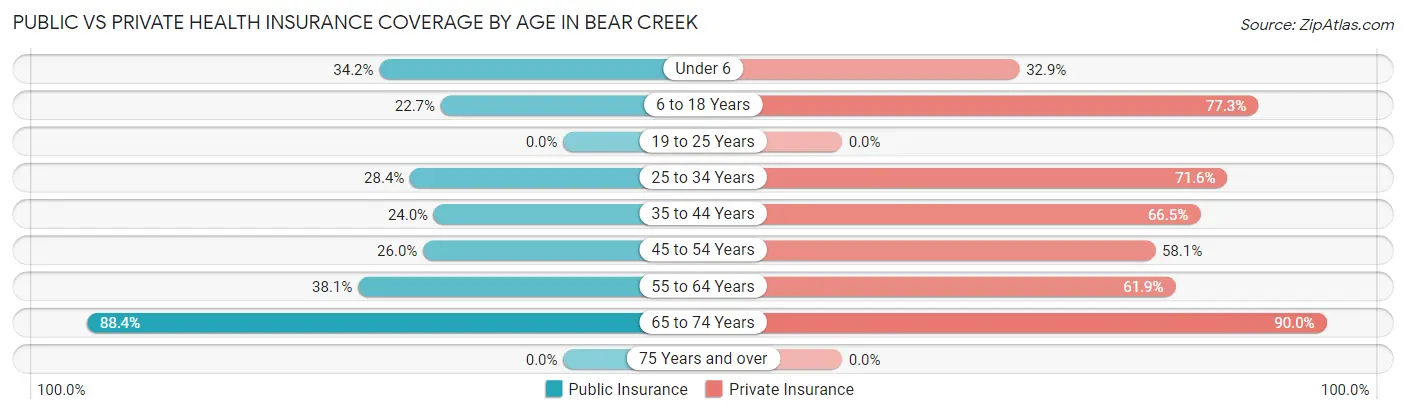
| Age Bracket | Public Insurance | Private Insurance |
| Under 6 | 28 (34.2%) | 27 (32.9%) |
| 6 to 18 Years | 63 (22.7%) | 214 (77.3%) |
| 19 to 25 Years | 0 (0.0%) | 0 (0.0%) |
| 25 to 34 Years | 31 (28.4%) | 78 (71.6%) |
| 35 to 44 Years | 43 (24.0%) | 119 (66.5%) |
| 45 to 54 Years | 64 (26.0%) | 143 (58.1%) |
| 55 to 64 Years | 72 (38.1%) | 117 (61.9%) |
| 65 to 74 Years | 176 (88.4%) | 179 (89.9%) |
| 75 Years and over | 0 (0.0%) | 0 (0.0%) |
| Total | 477 (37.2%) | 877 (68.5%) |
Disability Status by Sex by Age in Bear Creek
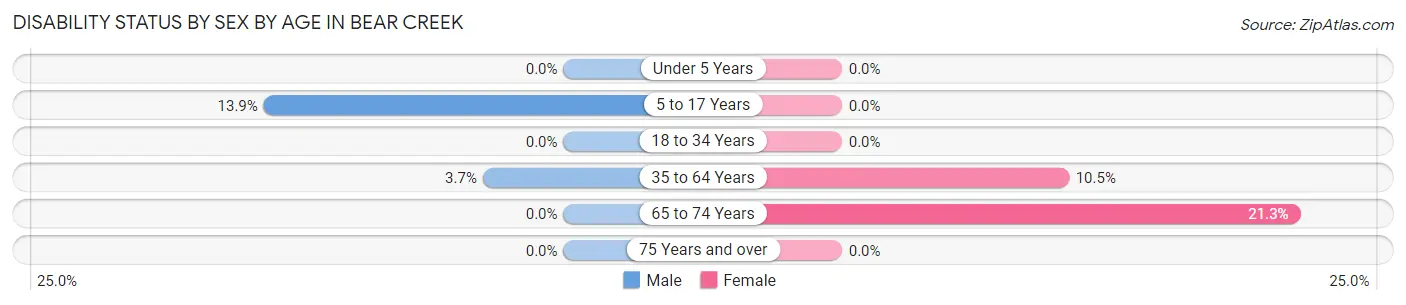
| Age Bracket | Male | Female |
| Under 5 Years | 0 (0.0%) | 0 (0.0%) |
| 5 to 17 Years | 21 (13.9%) | 0 (0.0%) |
| 18 to 34 Years | 0 (0.0%) | 0 (0.0%) |
| 35 to 64 Years | 13 (3.7%) | 28 (10.5%) |
| 65 to 74 Years | 0 (0.0%) | 20 (21.3%) |
| 75 Years and over | 0 (0.0%) | 0 (0.0%) |
Disability Class by Sex by Age in Bear Creek
Disability Class: Hearing Difficulty
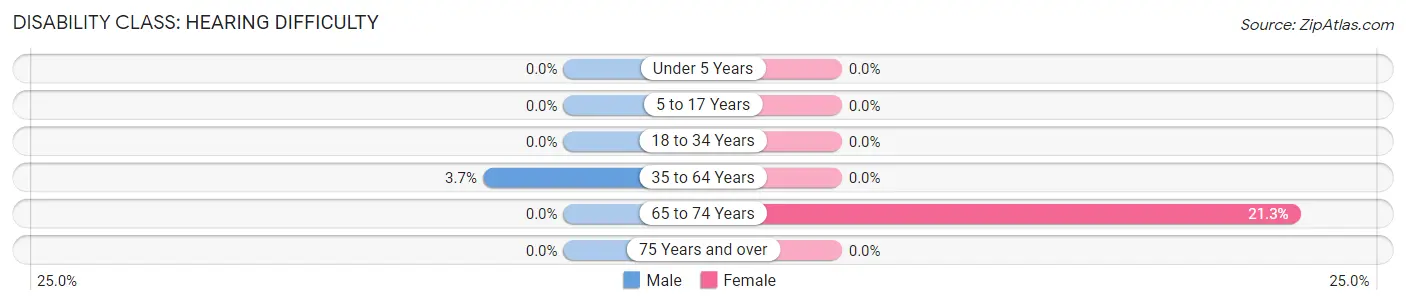
| Age Bracket | Male | Female |
| Under 5 Years | 0 (0.0%) | 0 (0.0%) |
| 5 to 17 Years | 0 (0.0%) | 0 (0.0%) |
| 18 to 34 Years | 0 (0.0%) | 0 (0.0%) |
| 35 to 64 Years | 13 (3.7%) | 0 (0.0%) |
| 65 to 74 Years | 0 (0.0%) | 20 (21.3%) |
| 75 Years and over | 0 (0.0%) | 0 (0.0%) |
Disability Class: Vision Difficulty
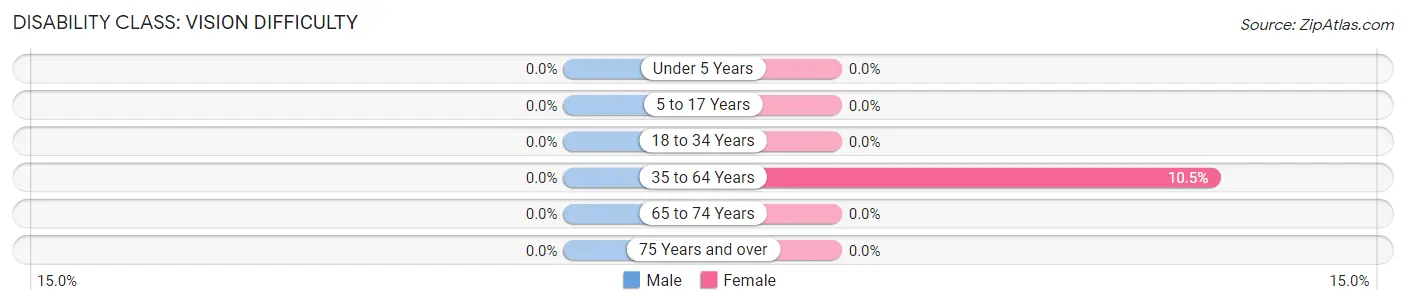
| Age Bracket | Male | Female |
| Under 5 Years | 0 (0.0%) | 0 (0.0%) |
| 5 to 17 Years | 0 (0.0%) | 0 (0.0%) |
| 18 to 34 Years | 0 (0.0%) | 0 (0.0%) |
| 35 to 64 Years | 0 (0.0%) | 28 (10.5%) |
| 65 to 74 Years | 0 (0.0%) | 0 (0.0%) |
| 75 Years and over | 0 (0.0%) | 0 (0.0%) |
Disability Class: Cognitive Difficulty
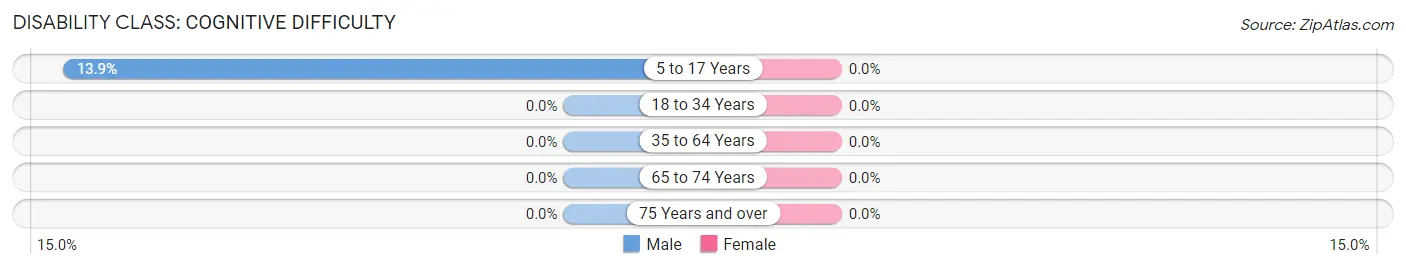
| Age Bracket | Male | Female |
| 5 to 17 Years | 21 (13.9%) | 0 (0.0%) |
| 18 to 34 Years | 0 (0.0%) | 0 (0.0%) |
| 35 to 64 Years | 0 (0.0%) | 0 (0.0%) |
| 65 to 74 Years | 0 (0.0%) | 0 (0.0%) |
| 75 Years and over | 0 (0.0%) | 0 (0.0%) |
Disability Class: Ambulatory Difficulty
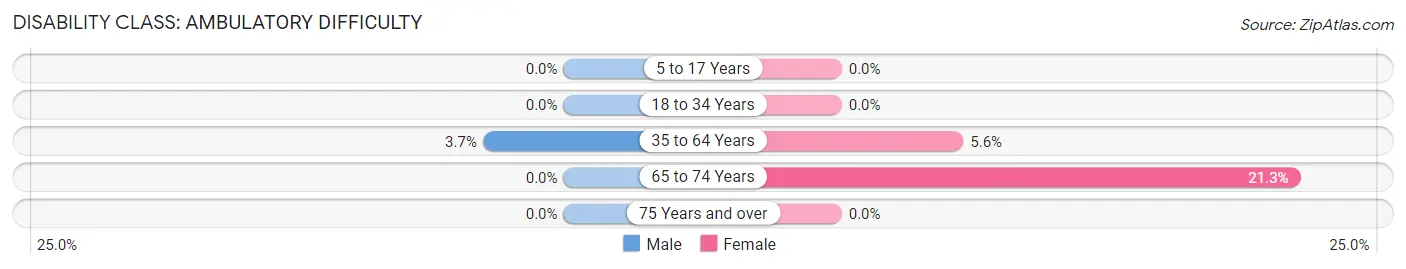
| Age Bracket | Male | Female |
| 5 to 17 Years | 0 (0.0%) | 0 (0.0%) |
| 18 to 34 Years | 0 (0.0%) | 0 (0.0%) |
| 35 to 64 Years | 13 (3.7%) | 15 (5.6%) |
| 65 to 74 Years | 0 (0.0%) | 20 (21.3%) |
| 75 Years and over | 0 (0.0%) | 0 (0.0%) |
Disability Class: Self-Care Difficulty
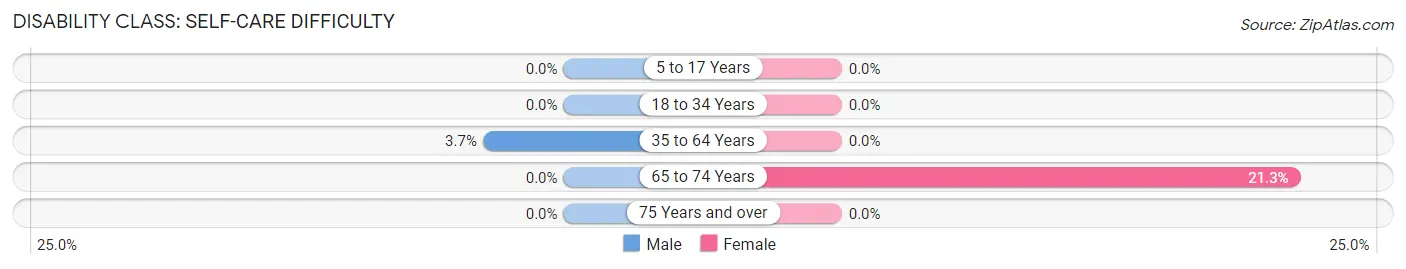
| Age Bracket | Male | Female |
| 5 to 17 Years | 0 (0.0%) | 0 (0.0%) |
| 18 to 34 Years | 0 (0.0%) | 0 (0.0%) |
| 35 to 64 Years | 13 (3.7%) | 0 (0.0%) |
| 65 to 74 Years | 0 (0.0%) | 20 (21.3%) |
| 75 Years and over | 0 (0.0%) | 0 (0.0%) |
Technology Access in Bear Creek
Computing Device Access in Bear Creek
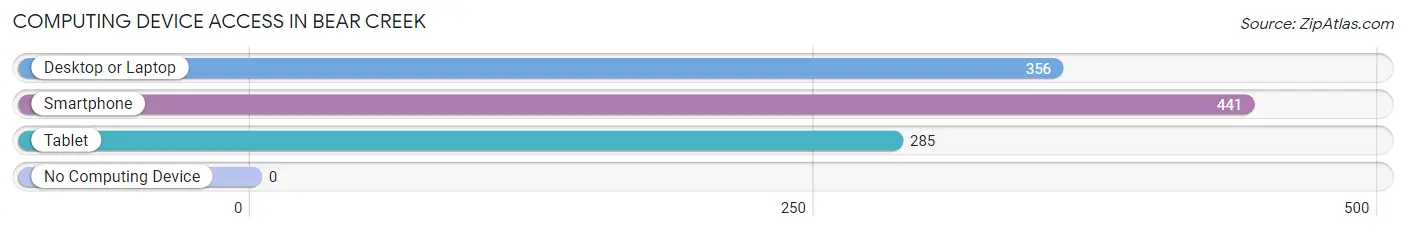
| Device Type | # Households | % Households |
| Desktop or Laptop | 356 | 77.2% |
| Smartphone | 441 | 95.7% |
| Tablet | 285 | 61.8% |
| No Computing Device | 0 | 0.0% |
| Total | 461 | 100.0% |
Internet Access in Bear Creek
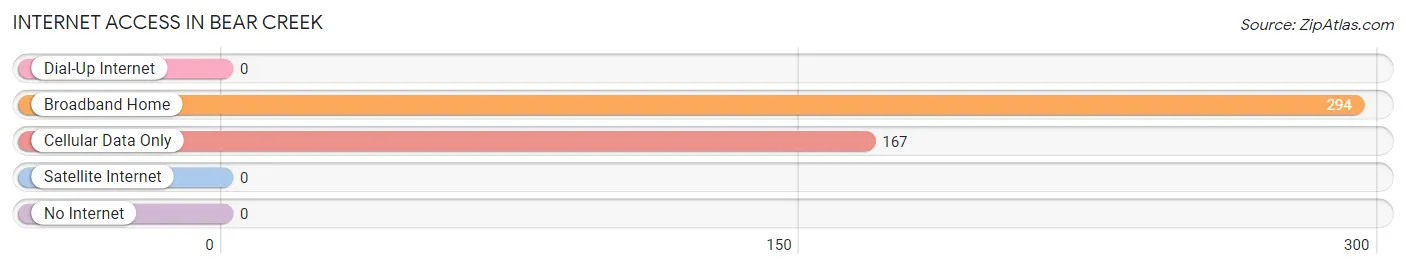
| Internet Type | # Households | % Households |
| Dial-Up Internet | 0 | 0.0% |
| Broadband Home | 294 | 63.8% |
| Cellular Data Only | 167 | 36.2% |
| Satellite Internet | 0 | 0.0% |
| No Internet | 0 | 0.0% |
| Total | 461 | 100.0% |
Bear Creek Summary
Introduction
Bear Creek is a small unincorporated community located in the Matanuska-Susitna Borough of Alaska. It is situated on the banks of the Matanuska River, about 25 miles northeast of Palmer and about 50 miles northeast of Anchorage. The community is home to about 200 people and is a popular destination for outdoor recreation, including fishing, hunting, and camping.
History
The area around Bear Creek has been inhabited for thousands of years by the Dena’ina Athabascan people. The Dena’ina were semi-nomadic, living off the land and relying on the resources of the Matanuska River and its tributaries. The Dena’ina were known for their fishing and hunting skills, and their knowledge of the land and its resources.
The first non-native settlers arrived in the area in the early 1900s. These settlers were mostly miners and trappers, looking to make a living off the land. The area was also home to a few homesteaders, who built cabins and farmed the land.
In the 1950s, the area around Bear Creek began to be developed for recreational use. The Matanuska River was dammed to create a lake, and the area around the lake became a popular destination for fishing, camping, and other outdoor activities.
Geography
Bear Creek is located in the Matanuska-Susitna Borough of Alaska. It is situated on the banks of the Matanuska River, about 25 miles northeast of Palmer and about 50 miles northeast of Anchorage. The community is surrounded by the Chugach Mountains to the east and the Talkeetna Mountains to the west.
The climate in Bear Creek is generally mild, with temperatures ranging from the mid-30s in the winter to the mid-60s in the summer. The area receives an average of about 20 inches of precipitation per year, mostly in the form of snow.
Economy
The economy of Bear Creek is largely based on tourism and outdoor recreation. The area is a popular destination for fishing, hunting, camping, and other outdoor activities. The Matanuska River is a popular destination for fishing, and the area is also home to several hunting lodges.
In addition to tourism and outdoor recreation, Bear Creek is also home to several small businesses, including a general store, a gas station, and a few restaurants. The community is also home to a few small farms, which produce vegetables, eggs, and other products for local consumption.
Demographics
As of the 2010 census, the population of Bear Creek was estimated to be around 200 people. The racial makeup of the community was 95.5% White, 0.5% Native American, 0.5% Asian, and 3.5% from other races. The median household income in Bear Creek was estimated to be $50,000, and the median age was estimated to be around 40 years old.
Conclusion
Bear Creek is a small unincorporated community located in the Matanuska-Susitna Borough of Alaska. It is situated on the banks of the Matanuska River, about 25 miles northeast of Palmer and about 50 miles northeast of Anchorage. The community is home to about 200 people and is a popular destination for outdoor recreation, including fishing, hunting, and camping. The economy of Bear Creek is largely based on tourism and outdoor recreation, and the population is mostly White, with a small percentage of Native American and Asian residents.
Common Questions
What is Per Capita Income in Bear Creek?
Per Capita income in Bear Creek is $37,364.
What is the Median Family Income in Bear Creek?
Median Family Income in Bear Creek is $118,878.
What is the Median Household income in Bear Creek?
Median Household Income in Bear Creek is $70,156.
What is Income or Wage Gap in Bear Creek?
Income or Wage Gap in Bear Creek is 16.9%.
Women in Bear Creek earn 83.1 cents for every dollar earned by a man.
What is Inequality or Gini Index in Bear Creek?
Inequality or Gini Index in Bear Creek is 0.41.
What is the Total Population of Bear Creek?
Total Population of Bear Creek is 1,283.
What is the Total Male Population of Bear Creek?
Total Male Population of Bear Creek is 699.
What is the Total Female Population of Bear Creek?
Total Female Population of Bear Creek is 584.
What is the Ratio of Males per 100 Females in Bear Creek?
There are 119.69 Males per 100 Females in Bear Creek.
What is the Ratio of Females per 100 Males in Bear Creek?
There are 83.55 Females per 100 Males in Bear Creek.
What is the Median Population Age in Bear Creek?
Median Population Age in Bear Creek is 44.9 Years.
What is the Average Family Size in Bear Creek
Average Family Size in Bear Creek is 3.5 People.
What is the Average Household Size in Bear Creek
Average Household Size in Bear Creek is 2.7 People.
How Large is the Labor Force in Bear Creek?
There are 583 People in the Labor Forcein in Bear Creek.
What is the Percentage of People in the Labor Force in Bear Creek?
58.7% of People are in the Labor Force in Bear Creek.