Hardwick, VT Map & Demographics
Hardwick Map
Hardwick Overview
$31,453
PER CAPITA INCOME
$77,891
AVG FAMILY INCOME
$57,798
AVG HOUSEHOLD INCOME
40.5%
WAGE / INCOME GAP [ % ]
59.5¢/ $1
WAGE / INCOME GAP [ $ ]
0.38
INEQUALITY / GINI INDEX
1,247
TOTAL POPULATION
576
MALE POPULATION
671
FEMALE POPULATION
85.84
MALES / 100 FEMALES
116.49
FEMALES / 100 MALES
34.1
MEDIAN AGE
2.9
AVG FAMILY SIZE
2.2
AVG HOUSEHOLD SIZE
638
LABOR FORCE [ PEOPLE ]
61.8%
PERCENT IN LABOR FORCE
1.6%
UNEMPLOYMENT RATE
Hardwick Zip Codes
Hardwick Area Codes
Income in Hardwick
Income Overview in Hardwick
Per Capita Income in Hardwick is $31,453, while median incomes of families and households are $77,891 and $57,798 respectively.
| Characteristic | Number | Measure |
| Per Capita Income | 1,247 | $31,453 |
| Median Family Income | 286 | $77,891 |
| Mean Family Income | 286 | $84,787 |
| Median Household Income | 553 | $57,798 |
| Mean Household Income | 553 | $69,958 |
| Income Deficit | 286 | $0 |
| Wage / Income Gap (%) | 1,247 | 40.47% |
| Wage / Income Gap ($) | 1,247 | 59.53¢ per $1 |
| Gini / Inequality Index | 1,247 | 0.38 |
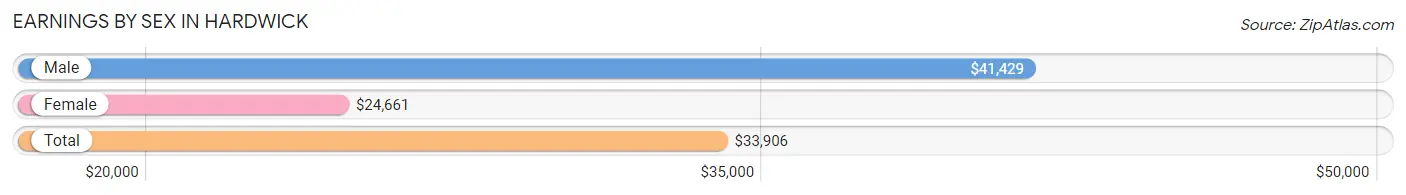
Earnings by Sex in Hardwick
Average Earnings in Hardwick are $33,906, $41,429 for men and $24,661 for women, a difference of 40.5%.
| Sex | Number | Average Earnings |
| Male | 274 (42.5%) | $41,429 |
| Female | 371 (57.5%) | $24,661 |
| Total | 645 (100.0%) | $33,906 |
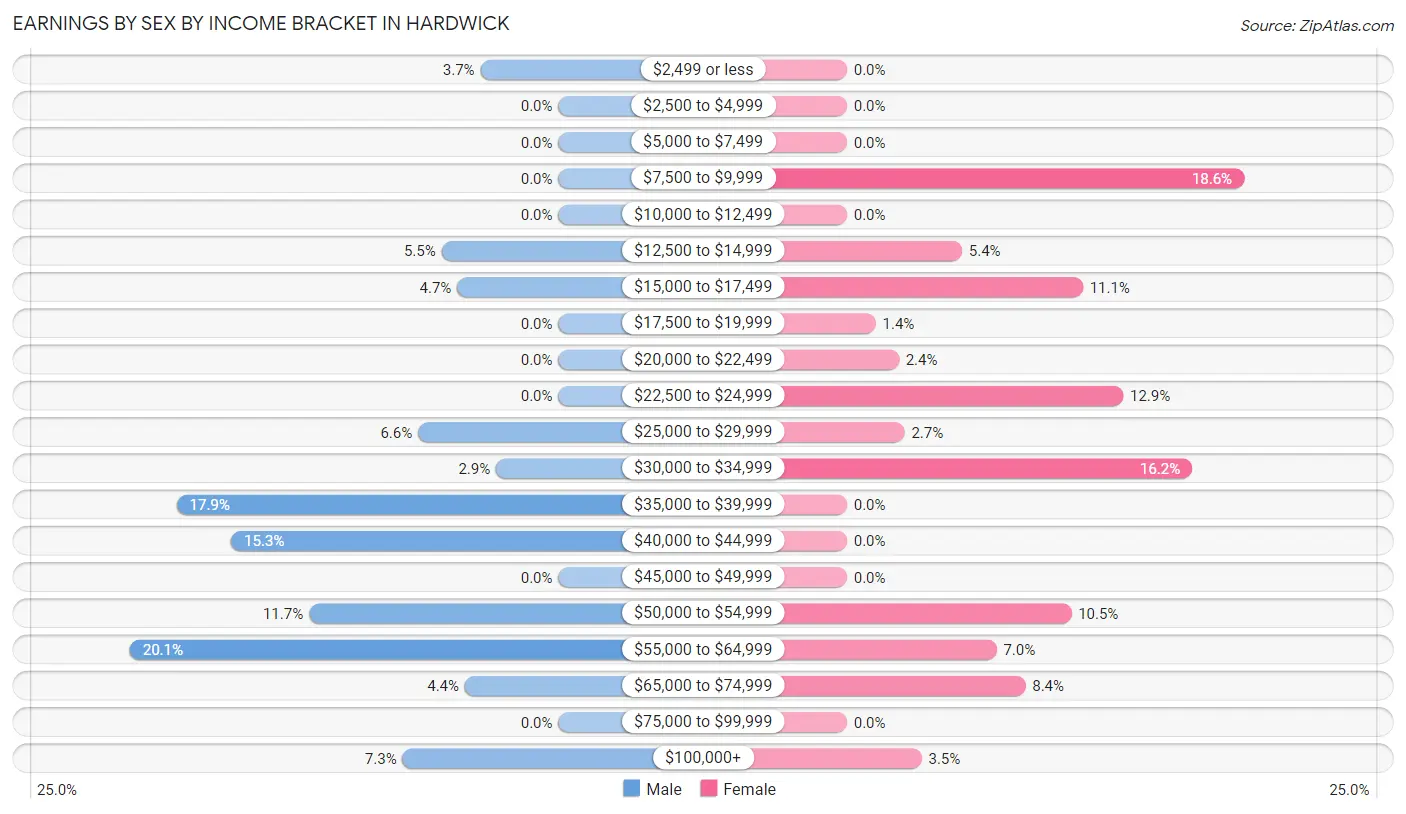
Earnings by Sex by Income Bracket in Hardwick
The most common earnings brackets in Hardwick are $55,000 to $64,999 for men (55 | 20.1%) and $7,500 to $9,999 for women (69 | 18.6%).
| Income | Male | Female |
| $2,499 or less | 10 (3.6%) | 0 (0.0%) |
| $2,500 to $4,999 | 0 (0.0%) | 0 (0.0%) |
| $5,000 to $7,499 | 0 (0.0%) | 0 (0.0%) |
| $7,500 to $9,999 | 0 (0.0%) | 69 (18.6%) |
| $10,000 to $12,499 | 0 (0.0%) | 0 (0.0%) |
| $12,500 to $14,999 | 15 (5.5%) | 20 (5.4%) |
| $15,000 to $17,499 | 13 (4.7%) | 41 (11.1%) |
| $17,500 to $19,999 | 0 (0.0%) | 5 (1.3%) |
| $20,000 to $22,499 | 0 (0.0%) | 9 (2.4%) |
| $22,500 to $24,999 | 0 (0.0%) | 48 (12.9%) |
| $25,000 to $29,999 | 18 (6.6%) | 10 (2.7%) |
| $30,000 to $34,999 | 8 (2.9%) | 60 (16.2%) |
| $35,000 to $39,999 | 49 (17.9%) | 0 (0.0%) |
| $40,000 to $44,999 | 42 (15.3%) | 0 (0.0%) |
| $45,000 to $49,999 | 0 (0.0%) | 0 (0.0%) |
| $50,000 to $54,999 | 32 (11.7%) | 39 (10.5%) |
| $55,000 to $64,999 | 55 (20.1%) | 26 (7.0%) |
| $65,000 to $74,999 | 12 (4.4%) | 31 (8.4%) |
| $75,000 to $99,999 | 0 (0.0%) | 0 (0.0%) |
| $100,000+ | 20 (7.3%) | 13 (3.5%) |
| Total | 274 (100.0%) | 371 (100.0%) |
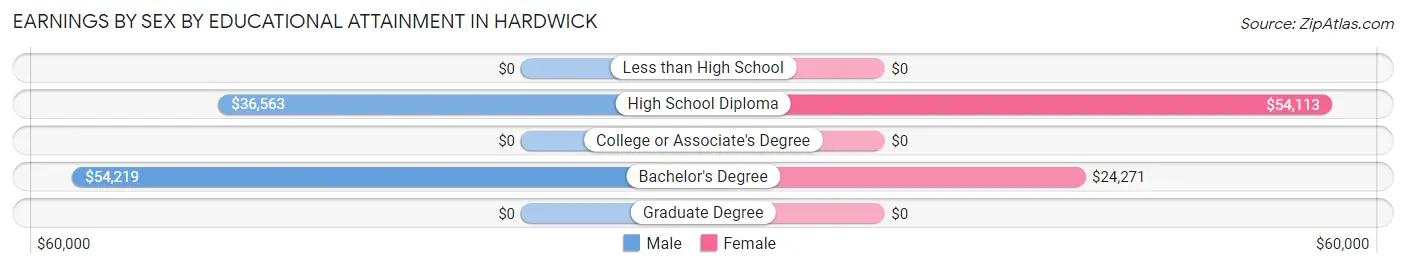
Earnings by Sex by Educational Attainment in Hardwick
| Educational Attainment | Male Income | Female Income |
| Less than High School | - | - |
| High School Diploma | $36,563 | $54,113 |
| College or Associate's Degree | - | - |
| Bachelor's Degree | $54,219 | $24,271 |
| Graduate Degree | - | - |
| Total | $41,905 | $0 |
Family Income in Hardwick
Family Income Brackets in Hardwick
According to the Hardwick family income data, there are 96 families falling into the $75,000 to $99,999 income range, which is the most common income bracket and makes up 33.6% of all families.
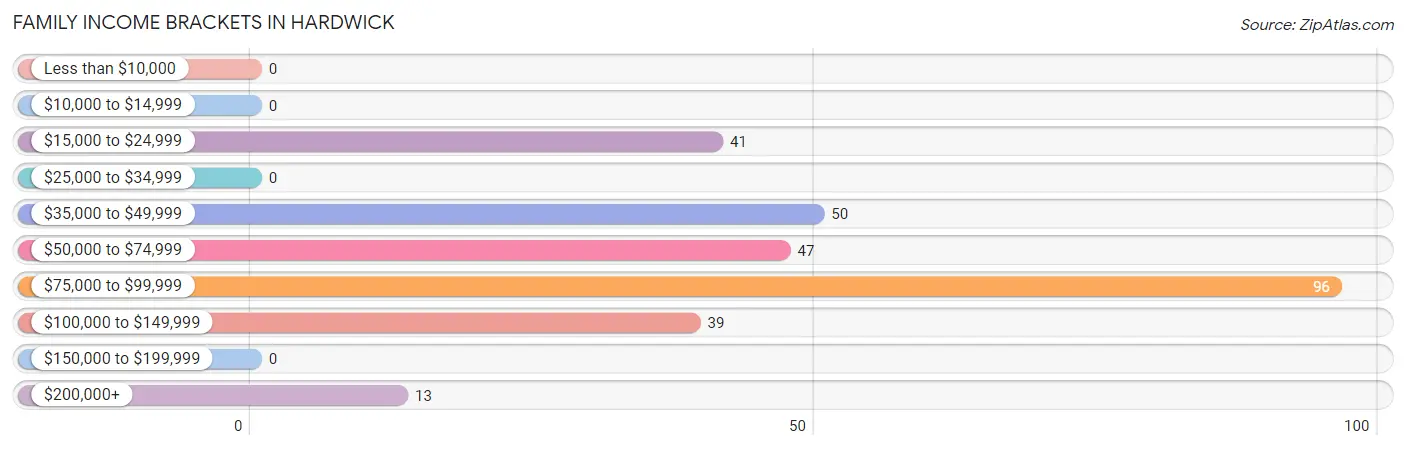
| Income Bracket | # Families | % Families |
| Less than $10,000 | 0 | 0.0% |
| $10,000 to $14,999 | 0 | 0.0% |
| $15,000 to $24,999 | 41 | 14.3% |
| $25,000 to $34,999 | 0 | 0.0% |
| $35,000 to $49,999 | 50 | 17.5% |
| $50,000 to $74,999 | 47 | 16.4% |
| $75,000 to $99,999 | 96 | 33.6% |
| $100,000 to $149,999 | 39 | 13.6% |
| $150,000 to $199,999 | 0 | 0.0% |
| $200,000+ | 13 | 4.5% |
Family Income by Famaliy Size in Hardwick
3-person families (76 | 26.6%) account for the highest median family income in Hardwick with $79,766 per family, while 3-person families (76 | 26.6%) have the highest median income of $26,589 per family member.
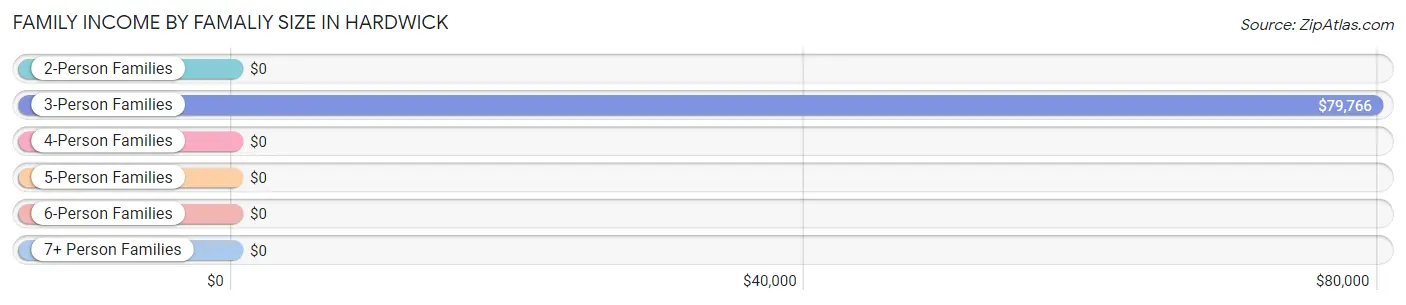
| Income Bracket | # Families | Median Income |
| 2-Person Families | 174 (60.8%) | $0 |
| 3-Person Families | 76 (26.6%) | $79,766 |
| 4-Person Families | 4 (1.4%) | $0 |
| 5-Person Families | 32 (11.2%) | $0 |
| 6-Person Families | 0 (0.0%) | $0 |
| 7+ Person Families | 0 (0.0%) | $0 |
| Total | 286 (100.0%) | $77,891 |
Family Income by Number of Earners in Hardwick
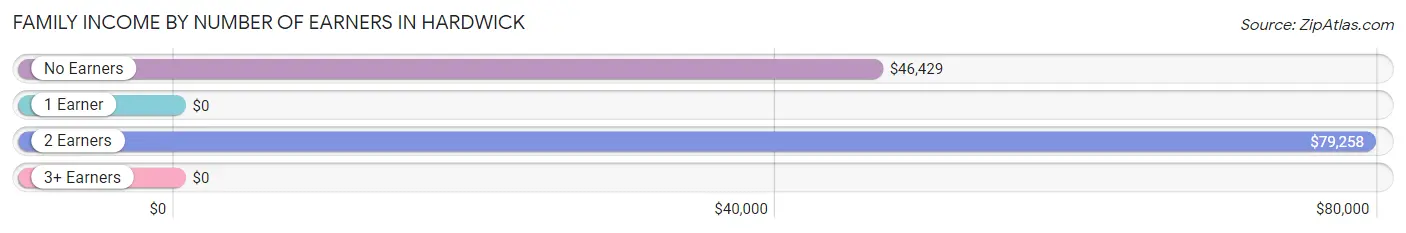
| Number of Earners | # Families | Median Income |
| No Earners | 28 (9.8%) | $46,429 |
| 1 Earner | 123 (43.0%) | $0 |
| 2 Earners | 135 (47.2%) | $79,258 |
| 3+ Earners | 0 (0.0%) | $0 |
| Total | 286 (100.0%) | $77,891 |
Household Income in Hardwick
Household Income Brackets in Hardwick
With 121 households falling in the category, the $25,000 to $34,999 income range is the most frequent in Hardwick, accounting for 21.9% of all households.
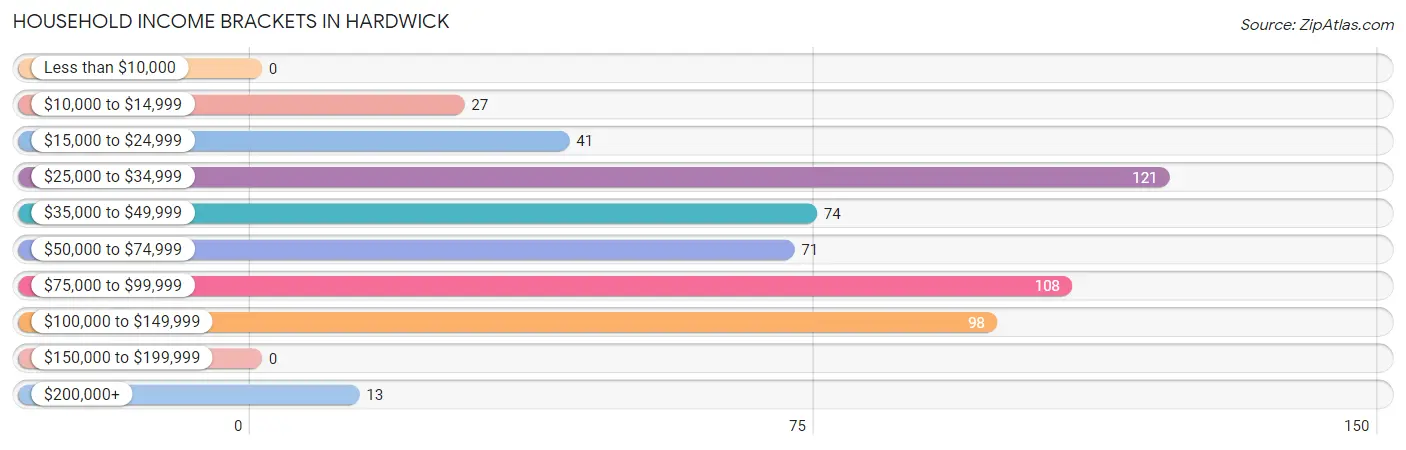
| Income Bracket | # Households | % Households |
| Less than $10,000 | 0 | 0.0% |
| $10,000 to $14,999 | 27 | 4.9% |
| $15,000 to $24,999 | 41 | 7.4% |
| $25,000 to $34,999 | 121 | 21.9% |
| $35,000 to $49,999 | 74 | 13.4% |
| $50,000 to $74,999 | 71 | 12.8% |
| $75,000 to $99,999 | 108 | 19.5% |
| $100,000 to $149,999 | 98 | 17.7% |
| $150,000 to $199,999 | 0 | 0.0% |
| $200,000+ | 13 | 2.4% |
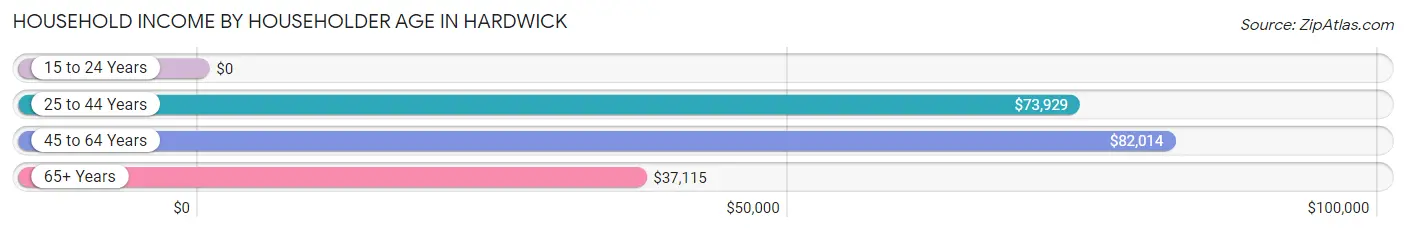
Household Income by Householder Age in Hardwick
The median household income in Hardwick is $57,798, with the highest median household income of $82,014 found in the 45 to 64 years age bracket for the primary householder. A total of 156 households (28.2%) fall into this category. Meanwhile, the 15 to 24 years age bracket for the primary householder has the lowest median household income of $0, with 41 households (7.4%) in this group.
| Income Bracket | # Households | Median Income |
| 15 to 24 Years | 41 (7.4%) | $0 |
| 25 to 44 Years | 100 (18.1%) | $73,929 |
| 45 to 64 Years | 156 (28.2%) | $82,014 |
| 65+ Years | 256 (46.3%) | $37,115 |
| Total | 553 (100.0%) | $57,798 |
Poverty in Hardwick
Income Below Poverty by Sex and Age in Hardwick
With 9.9% poverty level for males and 14.7% for females among the residents of Hardwick, 65 to 74 year old males and 18 to 24 year old females are the most vulnerable to poverty, with 40 males (34.8%) and 89 females (68.5%) in their respective age groups living below the poverty level.
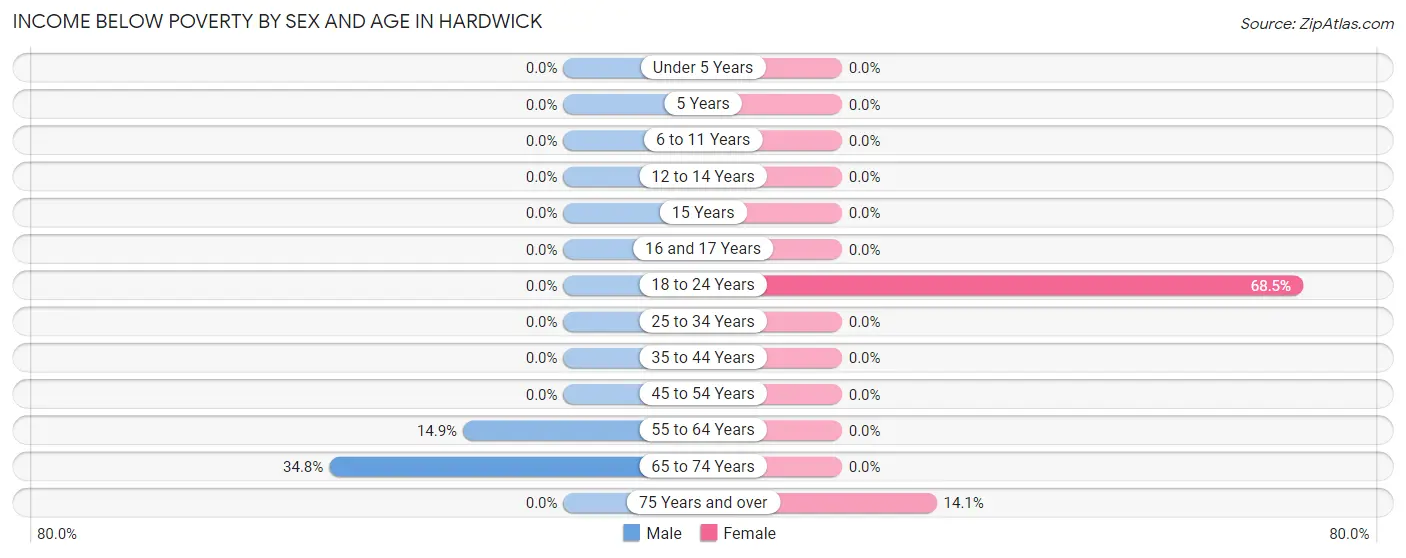
| Age Bracket | Male | Female |
| Under 5 Years | 0 (0.0%) | 0 (0.0%) |
| 5 Years | 0 (0.0%) | 0 (0.0%) |
| 6 to 11 Years | 0 (0.0%) | 0 (0.0%) |
| 12 to 14 Years | 0 (0.0%) | 0 (0.0%) |
| 15 Years | 0 (0.0%) | 0 (0.0%) |
| 16 and 17 Years | 0 (0.0%) | 0 (0.0%) |
| 18 to 24 Years | 0 (0.0%) | 89 (68.5%) |
| 25 to 34 Years | 0 (0.0%) | 0 (0.0%) |
| 35 to 44 Years | 0 (0.0%) | 0 (0.0%) |
| 45 to 54 Years | 0 (0.0%) | 0 (0.0%) |
| 55 to 64 Years | 17 (14.9%) | 0 (0.0%) |
| 65 to 74 Years | 40 (34.8%) | 0 (0.0%) |
| 75 Years and over | 0 (0.0%) | 10 (14.1%) |
| Total | 57 (9.9%) | 99 (14.7%) |
Income Above Poverty by Sex and Age in Hardwick
According to the poverty statistics in Hardwick, males aged under 5 years and females aged under 5 years are the age groups that are most secure financially, with 100.0% of males and 100.0% of females in these age groups living above the poverty line.
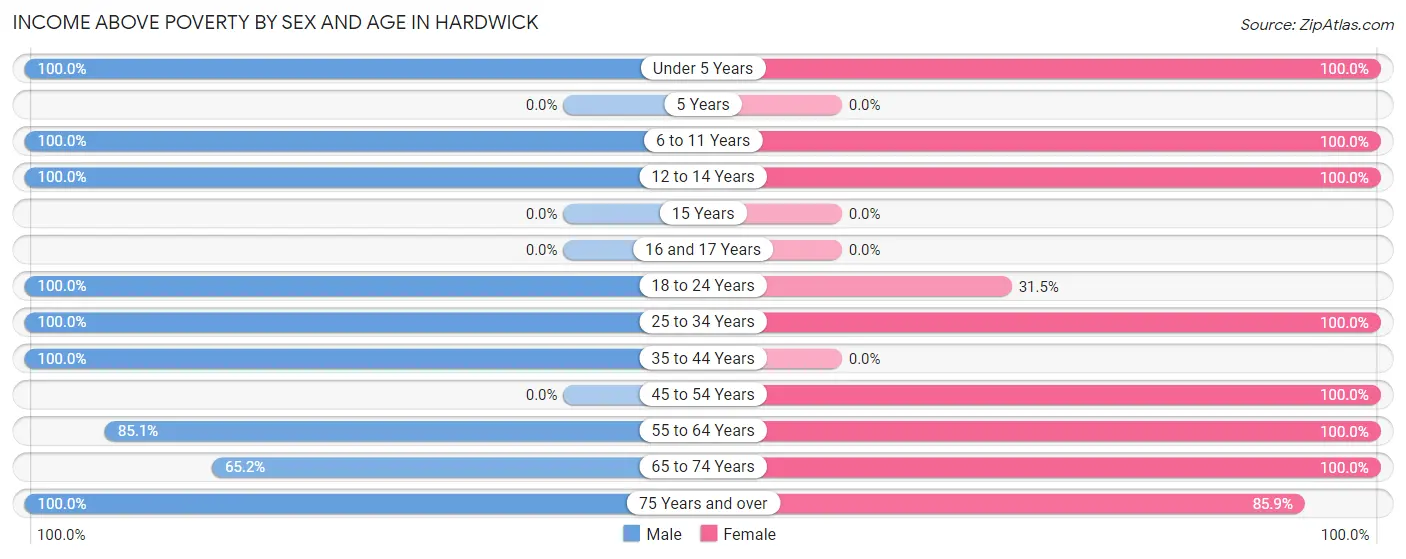
| Age Bracket | Male | Female |
| Under 5 Years | 51 (100.0%) | 37 (100.0%) |
| 5 Years | 0 (0.0%) | 0 (0.0%) |
| 6 to 11 Years | 34 (100.0%) | 52 (100.0%) |
| 12 to 14 Years | 36 (100.0%) | 4 (100.0%) |
| 15 Years | 0 (0.0%) | 0 (0.0%) |
| 16 and 17 Years | 0 (0.0%) | 0 (0.0%) |
| 18 to 24 Years | 66 (100.0%) | 41 (31.5%) |
| 25 to 34 Years | 101 (100.0%) | 134 (100.0%) |
| 35 to 44 Years | 28 (100.0%) | 0 (0.0%) |
| 45 to 54 Years | 0 (0.0%) | 21 (100.0%) |
| 55 to 64 Years | 97 (85.1%) | 80 (100.0%) |
| 65 to 74 Years | 75 (65.2%) | 142 (100.0%) |
| 75 Years and over | 31 (100.0%) | 61 (85.9%) |
| Total | 519 (90.1%) | 572 (85.3%) |
Income Below Poverty Among Married-Couple Families in Hardwick
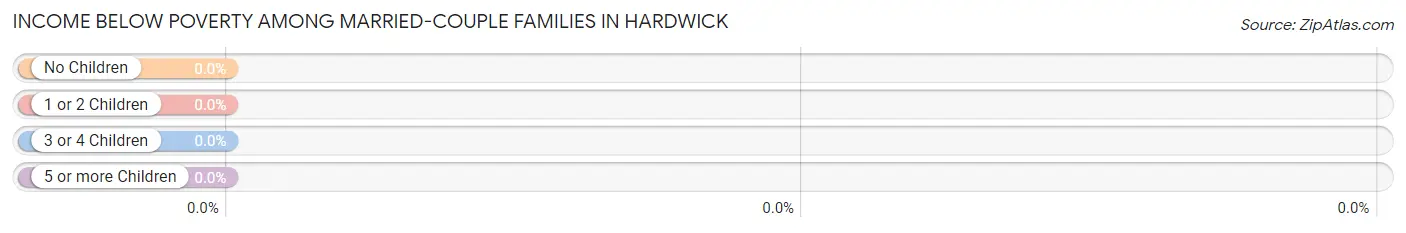
| Children | Above Poverty | Below Poverty |
| No Children | 88 (100.0%) | 0 (0.0%) |
| 1 or 2 Children | 45 (100.0%) | 0 (0.0%) |
| 3 or 4 Children | 32 (100.0%) | 0 (0.0%) |
| 5 or more Children | 0 (0.0%) | 0 (0.0%) |
| Total | 165 (100.0%) | 0 (0.0%) |
Income Below Poverty Among Single-Parent Households in Hardwick
| Children | Single Father | Single Mother |
| No Children | 0 (0.0%) | 0 (0.0%) |
| 1 or 2 Children | 0 (0.0%) | 0 (0.0%) |
| 3 or 4 Children | 0 (0.0%) | 0 (0.0%) |
| 5 or more Children | 0 (0.0%) | 0 (0.0%) |
| Total | 0 (0.0%) | 0 (0.0%) |
Income Below Poverty Among Married-Couple vs Single-Parent Households in Hardwick
| Children | Married-Couple Families | Single-Parent Households |
| No Children | 0 (0.0%) | 0 (0.0%) |
| 1 or 2 Children | 0 (0.0%) | 0 (0.0%) |
| 3 or 4 Children | 0 (0.0%) | 0 (0.0%) |
| 5 or more Children | 0 (0.0%) | 0 (0.0%) |
| Total | 0 (0.0%) | 0 (0.0%) |
Race in Hardwick
The most populous races in Hardwick are White / Caucasian (1,043 | 83.6%), Two or more Races (155 | 12.4%), and Black / African American (49 | 3.9%).
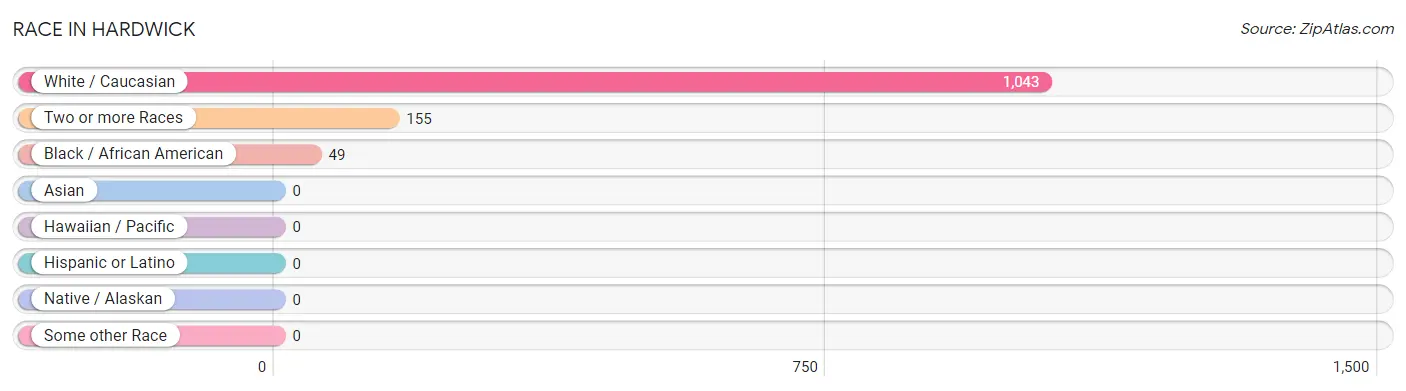
| Race | # Population | % Population |
| Asian | 0 | 0.0% |
| Black / African American | 49 | 3.9% |
| Hawaiian / Pacific | 0 | 0.0% |
| Hispanic or Latino | 0 | 0.0% |
| Native / Alaskan | 0 | 0.0% |
| White / Caucasian | 1,043 | 83.6% |
| Two or more Races | 155 | 12.4% |
| Some other Race | 0 | 0.0% |
| Total | 1,247 | 100.0% |
Ancestry in Hardwick
The most populous ancestries reported in Hardwick are English (322 | 25.8%), American (153 | 12.3%), Irish (99 | 7.9%), European (94 | 7.5%), and French Canadian (62 | 5.0%), together accounting for 58.5% of all Hardwick residents.
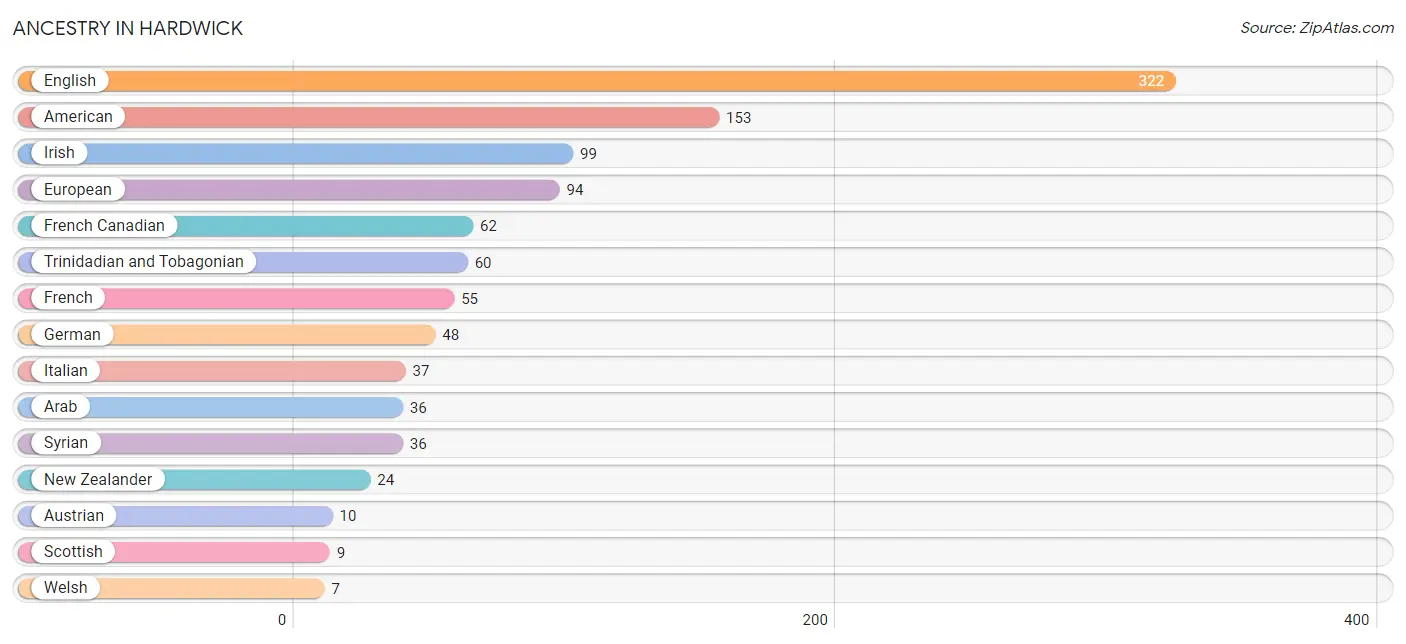
| Ancestry | # Population | % Population |
| American | 153 | 12.3% |
| Arab | 36 | 2.9% |
| Austrian | 10 | 0.8% |
| English | 322 | 25.8% |
| European | 94 | 7.5% |
| French | 55 | 4.4% |
| French Canadian | 62 | 5.0% |
| German | 48 | 3.8% |
| Irish | 99 | 7.9% |
| Italian | 37 | 3.0% |
| New Zealander | 24 | 1.9% |
| Scottish | 9 | 0.7% |
| Syrian | 36 | 2.9% |
| Trinidadian and Tobagonian | 60 | 4.8% |
| Welsh | 7 | 0.6% | View All 15 Rows |
Immigrants in Hardwick
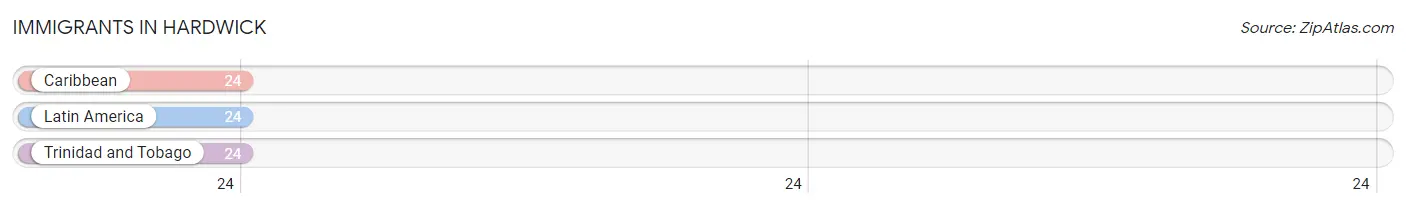
The most numerous immigrant groups reported in Hardwick came from Caribbean (24 | 1.9%), Latin America (24 | 1.9%), and Trinidad and Tobago (24 | 1.9%), together accounting for 5.8% of all Hardwick residents.
| Immigration Origin | # Population | % Population |
| Caribbean | 24 | 1.9% |
| Latin America | 24 | 1.9% |
| Trinidad and Tobago | 24 | 1.9% | View All 3 Rows |
Sex and Age in Hardwick
Sex and Age in Hardwick
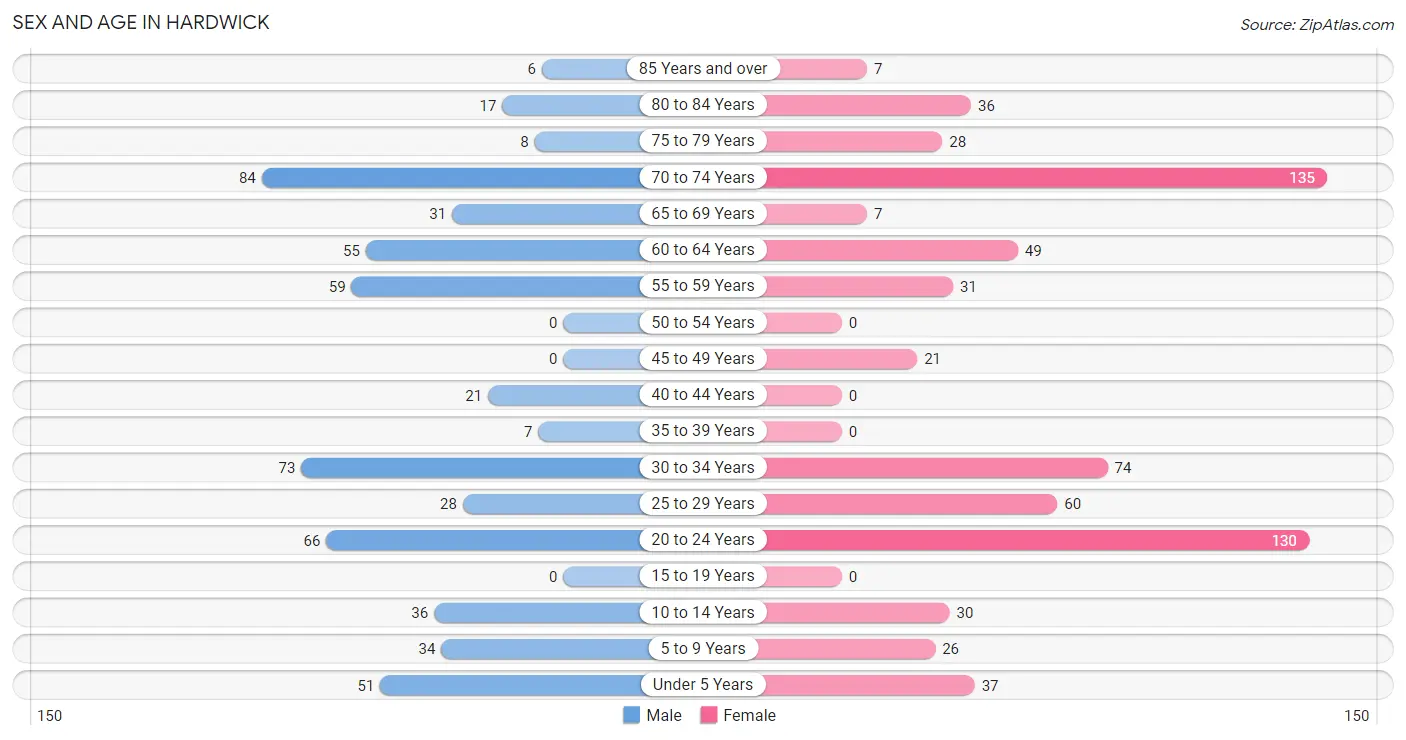
The most populous age groups in Hardwick are 70 to 74 Years (84 | 14.6%) for men and 70 to 74 Years (135 | 20.1%) for women.
| Age Bracket | Male | Female |
| Under 5 Years | 51 (8.8%) | 37 (5.5%) |
| 5 to 9 Years | 34 (5.9%) | 26 (3.9%) |
| 10 to 14 Years | 36 (6.2%) | 30 (4.5%) |
| 15 to 19 Years | 0 (0.0%) | 0 (0.0%) |
| 20 to 24 Years | 66 (11.5%) | 130 (19.4%) |
| 25 to 29 Years | 28 (4.9%) | 60 (8.9%) |
| 30 to 34 Years | 73 (12.7%) | 74 (11.0%) |
| 35 to 39 Years | 7 (1.2%) | 0 (0.0%) |
| 40 to 44 Years | 21 (3.6%) | 0 (0.0%) |
| 45 to 49 Years | 0 (0.0%) | 21 (3.1%) |
| 50 to 54 Years | 0 (0.0%) | 0 (0.0%) |
| 55 to 59 Years | 59 (10.2%) | 31 (4.6%) |
| 60 to 64 Years | 55 (9.6%) | 49 (7.3%) |
| 65 to 69 Years | 31 (5.4%) | 7 (1.0%) |
| 70 to 74 Years | 84 (14.6%) | 135 (20.1%) |
| 75 to 79 Years | 8 (1.4%) | 28 (4.2%) |
| 80 to 84 Years | 17 (2.9%) | 36 (5.4%) |
| 85 Years and over | 6 (1.0%) | 7 (1.0%) |
| Total | 576 (100.0%) | 671 (100.0%) |
Families and Households in Hardwick
Median Family Size in Hardwick
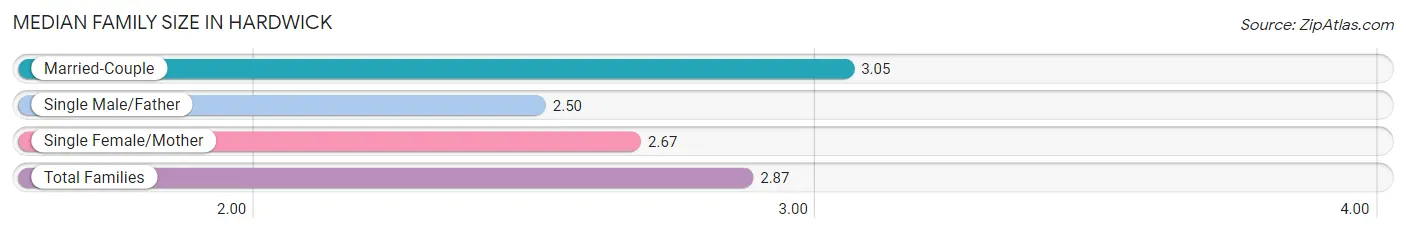
The median family size in Hardwick is 2.87 persons per family, with married-couple families (165 | 57.7%) accounting for the largest median family size of 3.05 persons per family. On the other hand, single male/father families (24 | 8.4%) represent the smallest median family size with 2.50 persons per family.
| Family Type | # Families | Family Size |
| Married-Couple | 165 (57.7%) | 3.05 |
| Single Male/Father | 24 (8.4%) | 2.50 |
| Single Female/Mother | 97 (33.9%) | 2.67 |
| Total Families | 286 (100.0%) | 2.87 |
Median Household Size in Hardwick
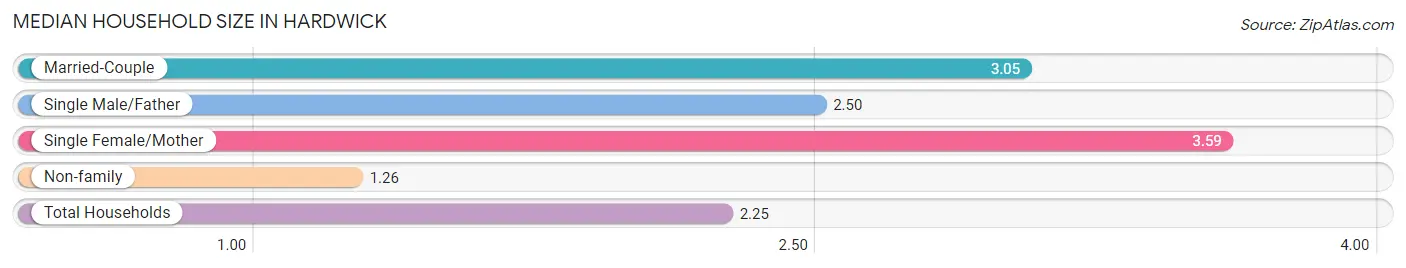
The median household size in Hardwick is 2.25 persons per household, with single female/mother households (97 | 17.5%) accounting for the largest median household size of 3.59 persons per household. non-family households (267 | 48.3%) represent the smallest median household size with 1.26 persons per household.
| Household Type | # Households | Household Size |
| Married-Couple | 165 (29.8%) | 3.05 |
| Single Male/Father | 24 (4.3%) | 2.50 |
| Single Female/Mother | 97 (17.5%) | 3.59 |
| Non-family | 267 (48.3%) | 1.26 |
| Total Households | 553 (100.0%) | 2.25 |
Household Size by Marriage Status in Hardwick
Out of a total of 553 households in Hardwick, 286 (51.7%) are family households, while 267 (48.3%) are nonfamily households. The most numerous type of family households are 2-person households, comprising 174, and the most common type of nonfamily households are 1-person households, comprising 192.
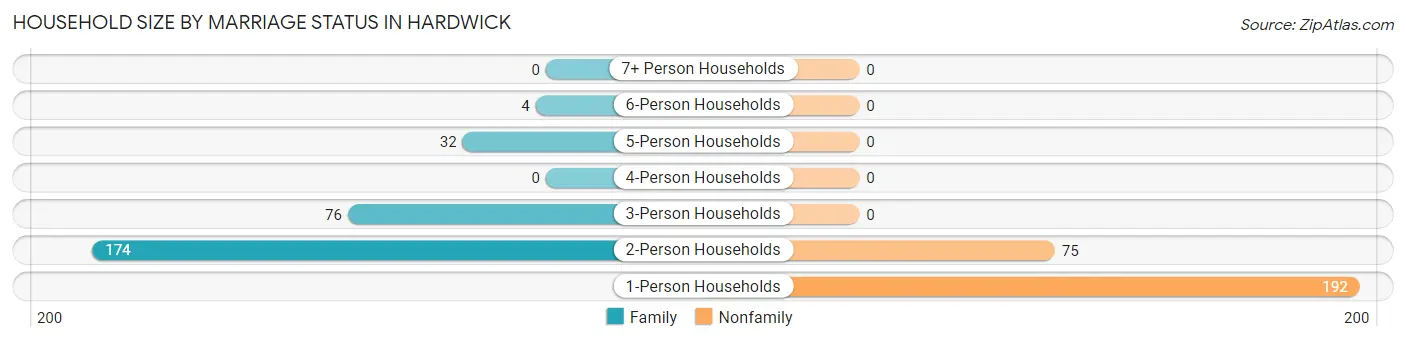
| Household Size | Family Households | Nonfamily Households |
| 1-Person Households | - | 192 (34.7%) |
| 2-Person Households | 174 (31.5%) | 75 (13.6%) |
| 3-Person Households | 76 (13.7%) | 0 (0.0%) |
| 4-Person Households | 0 (0.0%) | 0 (0.0%) |
| 5-Person Households | 32 (5.8%) | 0 (0.0%) |
| 6-Person Households | 4 (0.7%) | 0 (0.0%) |
| 7+ Person Households | 0 (0.0%) | 0 (0.0%) |
| Total | 286 (51.7%) | 267 (48.3%) |
Female Fertility in Hardwick
Fertility by Age in Hardwick
Average fertility rate in Hardwick is 161.0 births per 1,000 women. Women in the age bracket of 20 to 34 years have the highest fertility rate with 174.0 births per 1,000 women. Women in the age bracket of 20 to 34 years acount for 100.0% of all women with births.
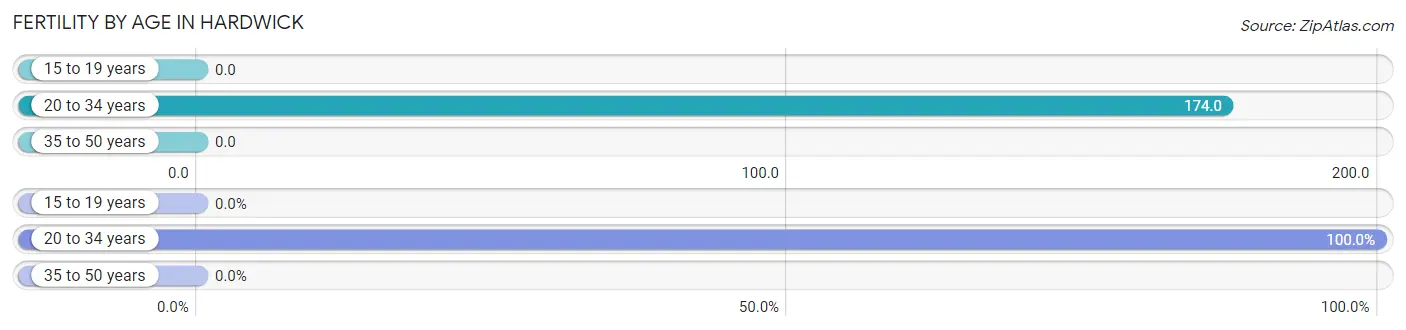
| Age Bracket | Women with Births | Births / 1,000 Women |
| 15 to 19 years | 0 (0.0%) | 0.0 |
| 20 to 34 years | 46 (100.0%) | 174.0 |
| 35 to 50 years | 0 (0.0%) | 0.0 |
| Total | 46 (100.0%) | 161.0 |
Fertility by Age by Marriage Status in Hardwick
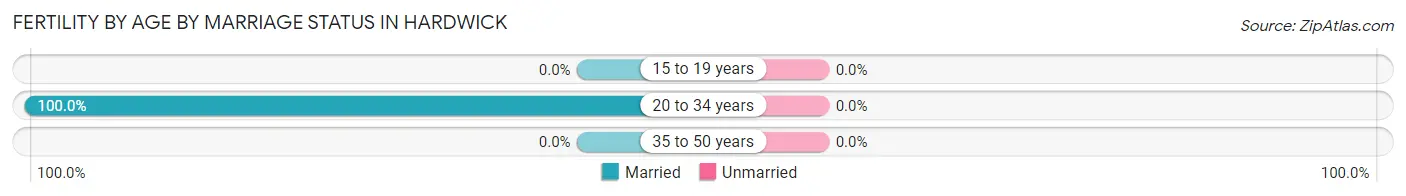
| Age Bracket | Married | Unmarried |
| 15 to 19 years | 0 (0.0%) | 0 (0.0%) |
| 20 to 34 years | 46 (100.0%) | 0 (0.0%) |
| 35 to 50 years | 0 (0.0%) | 0 (0.0%) |
| Total | 46 (100.0%) | 0 (0.0%) |
Fertility by Education in Hardwick
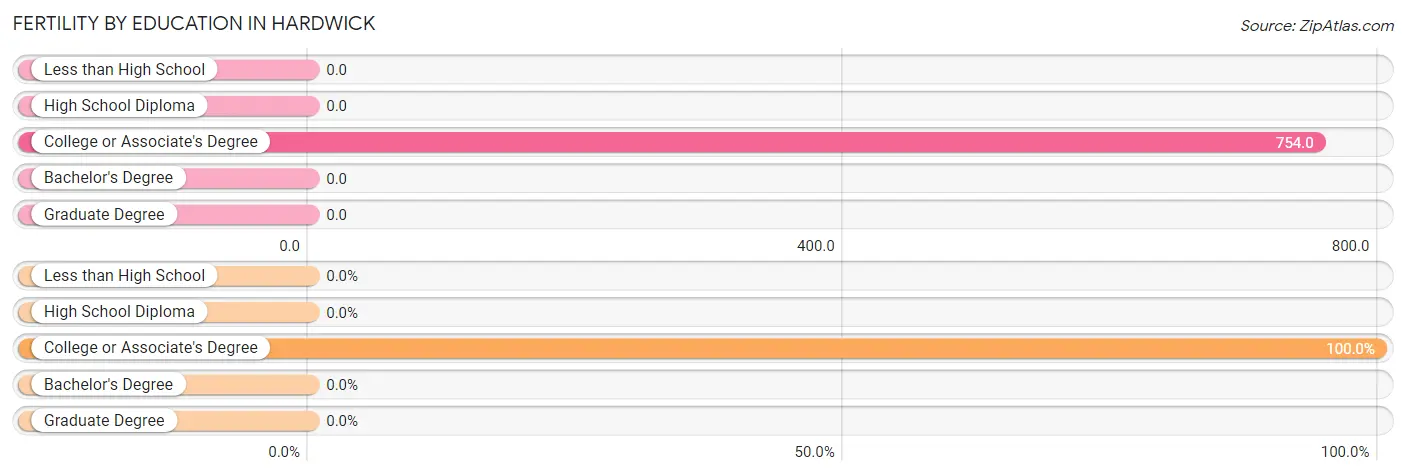
| Educational Attainment | Women with Births | Births / 1,000 Women |
| Less than High School | 0 (0.0%) | 0.0 |
| High School Diploma | 0 (0.0%) | 0.0 |
| College or Associate's Degree | 46 (100.0%) | 754.0 |
| Bachelor's Degree | 0 (0.0%) | 0.0 |
| Graduate Degree | 0 (0.0%) | 0.0 |
| Total | 46 (100.0%) | 161.0 |
Fertility by Education by Marriage Status in Hardwick
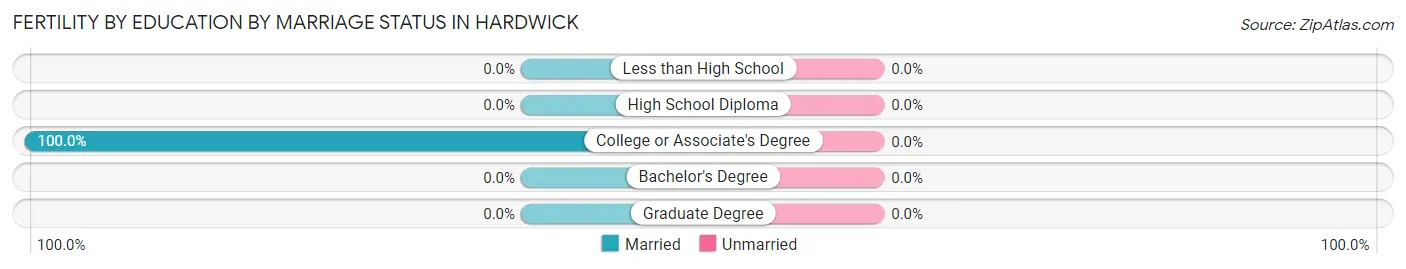
| Educational Attainment | Married | Unmarried |
| Less than High School | 0 (0.0%) | 0 (0.0%) |
| High School Diploma | 0 (0.0%) | 0 (0.0%) |
| College or Associate's Degree | 46 (100.0%) | 0 (0.0%) |
| Bachelor's Degree | 0 (0.0%) | 0 (0.0%) |
| Graduate Degree | 0 (0.0%) | 0 (0.0%) |
| Total | 46 (100.0%) | 0 (0.0%) |
Employment Characteristics in Hardwick
Employment by Class of Employer in Hardwick
Among the 609 employed individuals in Hardwick, private company employees (417 | 68.5%), not-for-profit organizations (57 | 9.4%), and self-employed (not incorporated) (54 | 8.9%) make up the most common classes of employment.
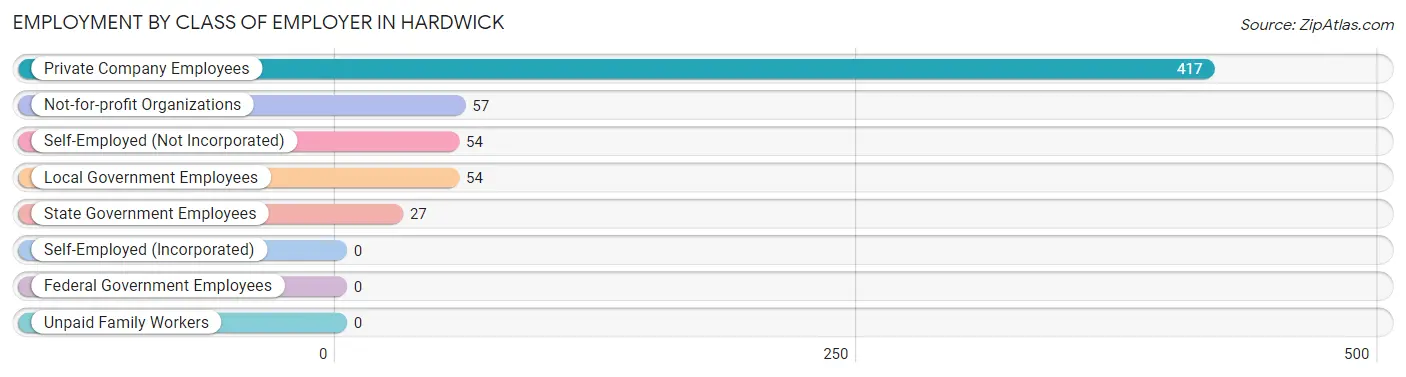
| Employer Class | # Employees | % Employees |
| Private Company Employees | 417 | 68.5% |
| Self-Employed (Incorporated) | 0 | 0.0% |
| Self-Employed (Not Incorporated) | 54 | 8.9% |
| Not-for-profit Organizations | 57 | 9.4% |
| Local Government Employees | 54 | 8.9% |
| State Government Employees | 27 | 4.4% |
| Federal Government Employees | 0 | 0.0% |
| Unpaid Family Workers | 0 | 0.0% |
| Total | 609 | 100.0% |
Employment Status by Age in Hardwick
According to the labor force statistics for Hardwick, out of the total population over 16 years of age (1,033), 61.8% or 638 individuals are in the labor force, with 1.6% or 10 of them unemployed. The age group with the highest labor force participation rate is 20 to 24 years, with 100.0% or 196 individuals in the labor force. Within the labor force, the 65 to 74 years age range has the highest percentage of unemployed individuals, with 23.3% or 10 of them being unemployed.
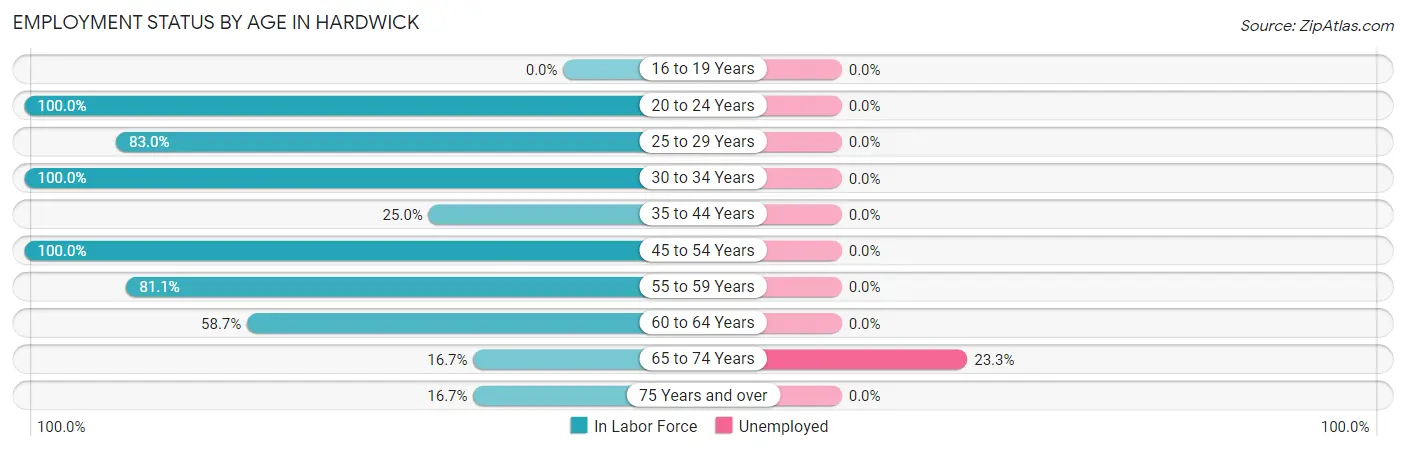
| Age Bracket | In Labor Force | Unemployed |
| 16 to 19 Years | 0 (0.0%) | 0 (0.0%) |
| 20 to 24 Years | 196 (100.0%) | 0 (0.0%) |
| 25 to 29 Years | 73 (83.0%) | 0 (0.0%) |
| 30 to 34 Years | 147 (100.0%) | 0 (0.0%) |
| 35 to 44 Years | 7 (25.0%) | 0 (0.0%) |
| 45 to 54 Years | 21 (100.0%) | 0 (0.0%) |
| 55 to 59 Years | 73 (81.1%) | 0 (0.0%) |
| 60 to 64 Years | 61 (58.7%) | 0 (0.0%) |
| 65 to 74 Years | 43 (16.7%) | 10 (23.3%) |
| 75 Years and over | 17 (16.7%) | 0 (0.0%) |
| Total | 638 (61.8%) | 10 (1.6%) |
Employment Status by Educational Attainment in Hardwick
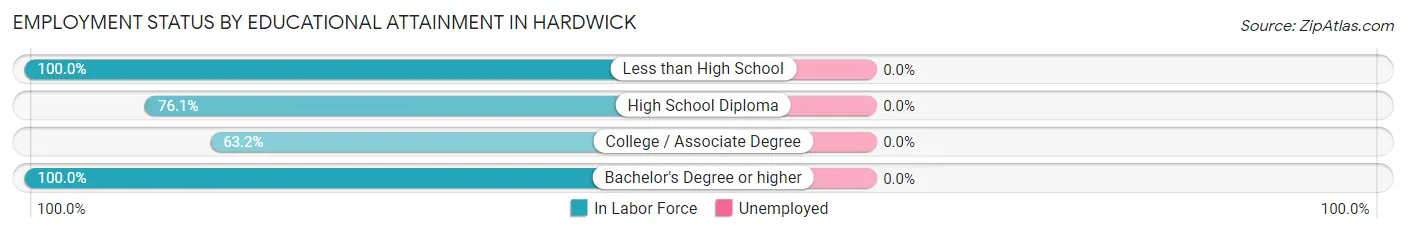
| Educational Attainment | In Labor Force | Unemployed |
| Less than High School | 24 (100.0%) | 0 (0.0%) |
| High School Diploma | 137 (76.1%) | 0 (0.0%) |
| College / Associate Degree | 91 (63.2%) | 0 (0.0%) |
| Bachelor's Degree or higher | 130 (100.0%) | 0 (0.0%) |
| Total | 382 (79.9%) | 0 (0.0%) |
Employment Occupations by Sex in Hardwick
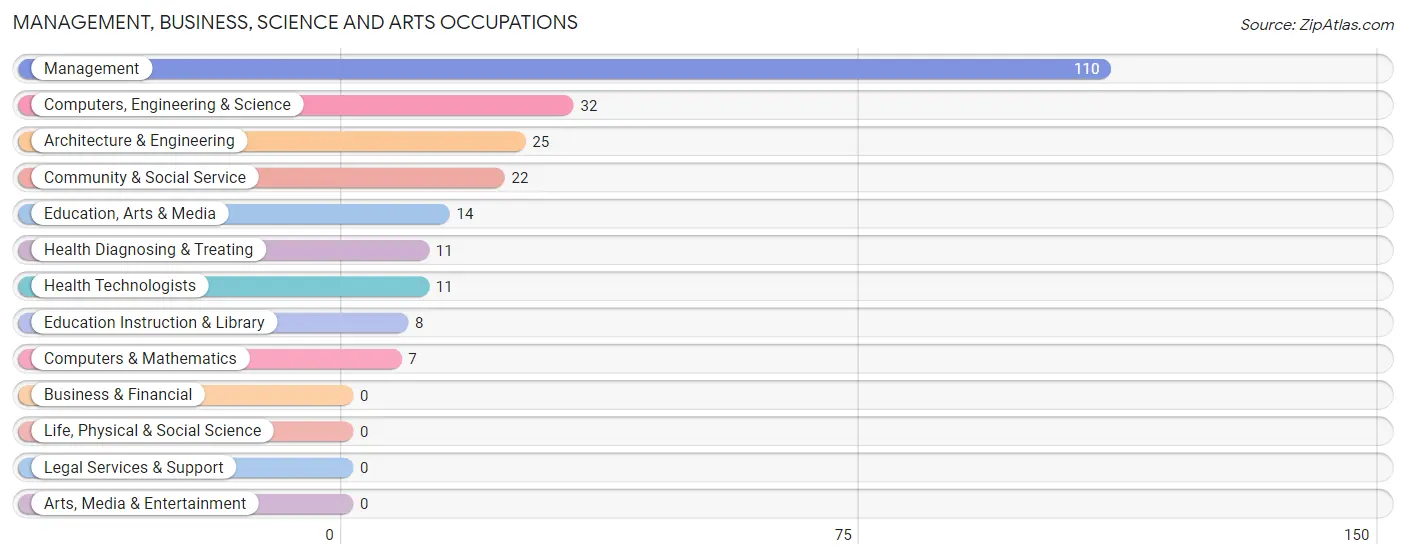
Management, Business, Science and Arts Occupations
The most common Management, Business, Science and Arts occupations in Hardwick are Management (110 | 17.5%), Computers, Engineering & Science (32 | 5.1%), Architecture & Engineering (25 | 4.0%), Community & Social Service (22 | 3.5%), and Education, Arts & Media (14 | 2.2%).
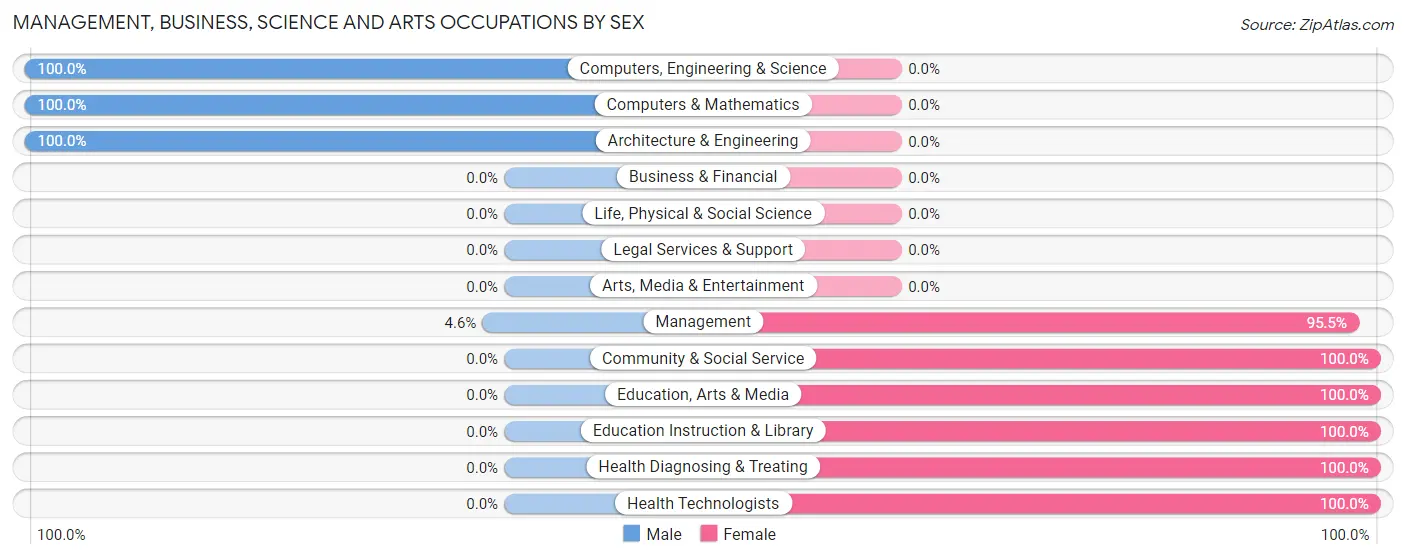
Management, Business, Science and Arts Occupations by Sex
Within the Management, Business, Science and Arts occupations in Hardwick, the most male-oriented occupations are Computers, Engineering & Science (100.0%), Computers & Mathematics (100.0%), and Architecture & Engineering (100.0%), while the most female-oriented occupations are Community & Social Service (100.0%), Education, Arts & Media (100.0%), and Education Instruction & Library (100.0%).
| Occupation | Male | Female |
| Management | 5 (4.5%) | 105 (95.5%) |
| Business & Financial | 0 (0.0%) | 0 (0.0%) |
| Computers, Engineering & Science | 32 (100.0%) | 0 (0.0%) |
| Computers & Mathematics | 7 (100.0%) | 0 (0.0%) |
| Architecture & Engineering | 25 (100.0%) | 0 (0.0%) |
| Life, Physical & Social Science | 0 (0.0%) | 0 (0.0%) |
| Community & Social Service | 0 (0.0%) | 22 (100.0%) |
| Education, Arts & Media | 0 (0.0%) | 14 (100.0%) |
| Legal Services & Support | 0 (0.0%) | 0 (0.0%) |
| Education Instruction & Library | 0 (0.0%) | 8 (100.0%) |
| Arts, Media & Entertainment | 0 (0.0%) | 0 (0.0%) |
| Health Diagnosing & Treating | 0 (0.0%) | 11 (100.0%) |
| Health Technologists | 0 (0.0%) | 11 (100.0%) |
| Total (Category) | 37 (21.1%) | 138 (78.9%) |
| Total (Overall) | 257 (40.9%) | 371 (59.1%) |
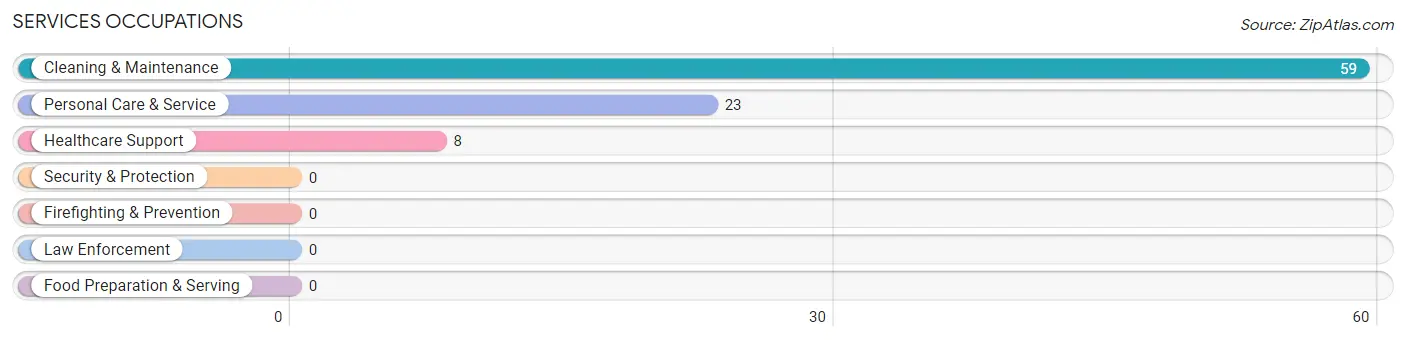
Services Occupations
The most common Services occupations in Hardwick are Cleaning & Maintenance (59 | 9.4%), Personal Care & Service (23 | 3.7%), and Healthcare Support (8 | 1.3%).
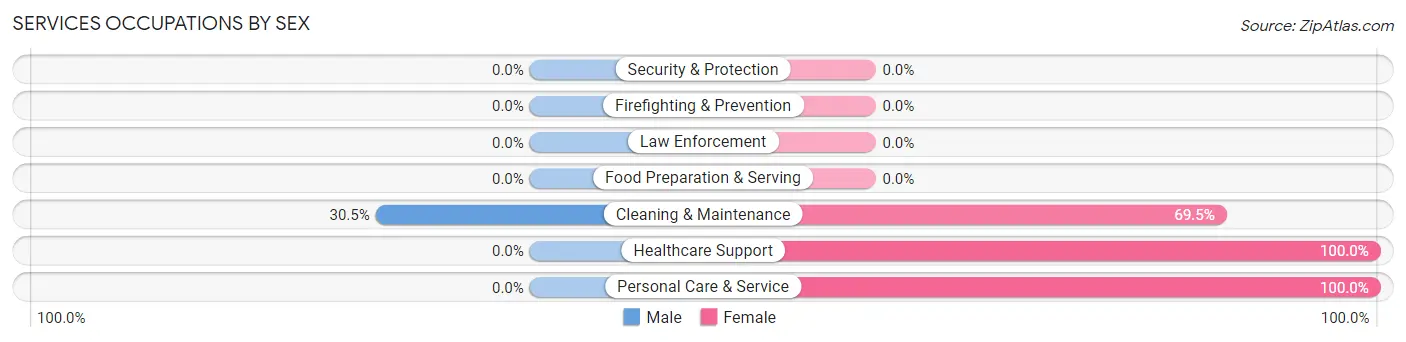
Services Occupations by Sex
| Occupation | Male | Female |
| Healthcare Support | 0 (0.0%) | 8 (100.0%) |
| Security & Protection | 0 (0.0%) | 0 (0.0%) |
| Firefighting & Prevention | 0 (0.0%) | 0 (0.0%) |
| Law Enforcement | 0 (0.0%) | 0 (0.0%) |
| Food Preparation & Serving | 0 (0.0%) | 0 (0.0%) |
| Cleaning & Maintenance | 18 (30.5%) | 41 (69.5%) |
| Personal Care & Service | 0 (0.0%) | 23 (100.0%) |
| Total (Category) | 18 (20.0%) | 72 (80.0%) |
| Total (Overall) | 257 (40.9%) | 371 (59.1%) |
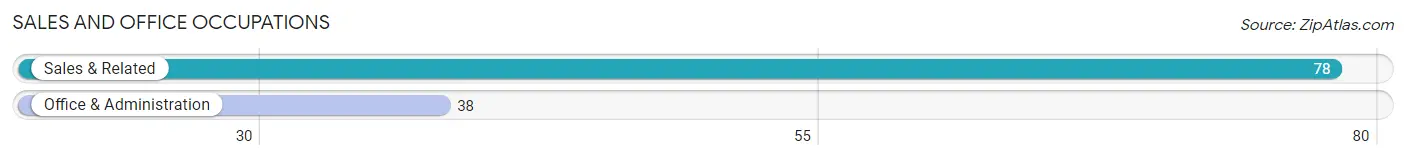
Sales and Office Occupations
The most common Sales and Office occupations in Hardwick are Sales & Related (78 | 12.4%), and Office & Administration (38 | 6.0%).
Sales and Office Occupations by Sex
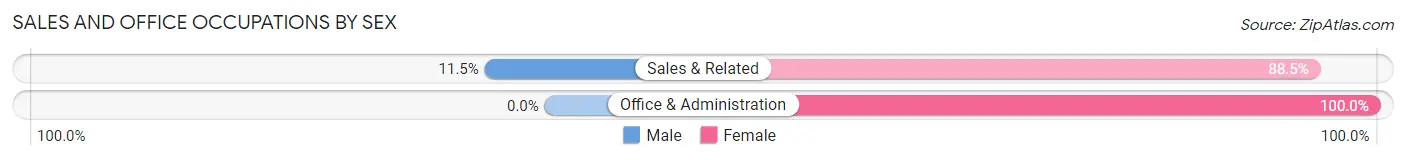
| Occupation | Male | Female |
| Sales & Related | 9 (11.5%) | 69 (88.5%) |
| Office & Administration | 0 (0.0%) | 38 (100.0%) |
| Total (Category) | 9 (7.8%) | 107 (92.2%) |
| Total (Overall) | 257 (40.9%) | 371 (59.1%) |
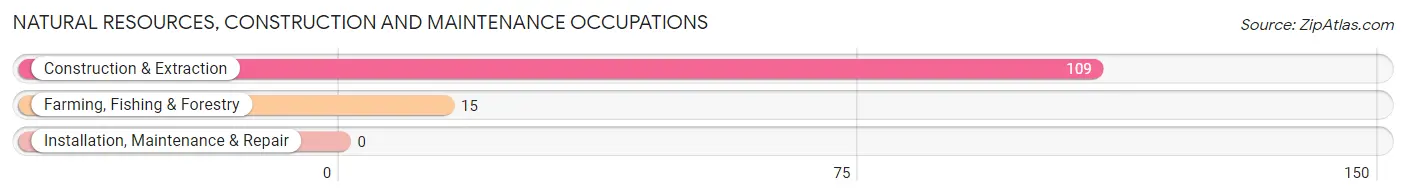
Natural Resources, Construction and Maintenance Occupations
The most common Natural Resources, Construction and Maintenance occupations in Hardwick are Construction & Extraction (109 | 17.4%), and Farming, Fishing & Forestry (15 | 2.4%).
Natural Resources, Construction and Maintenance Occupations by Sex
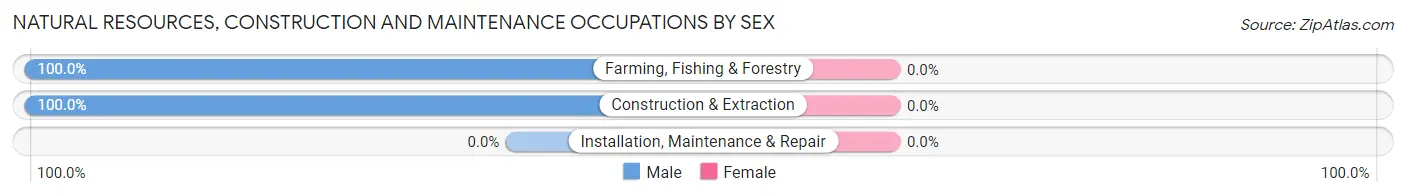
| Occupation | Male | Female |
| Farming, Fishing & Forestry | 15 (100.0%) | 0 (0.0%) |
| Construction & Extraction | 109 (100.0%) | 0 (0.0%) |
| Installation, Maintenance & Repair | 0 (0.0%) | 0 (0.0%) |
| Total (Category) | 124 (100.0%) | 0 (0.0%) |
| Total (Overall) | 257 (40.9%) | 371 (59.1%) |
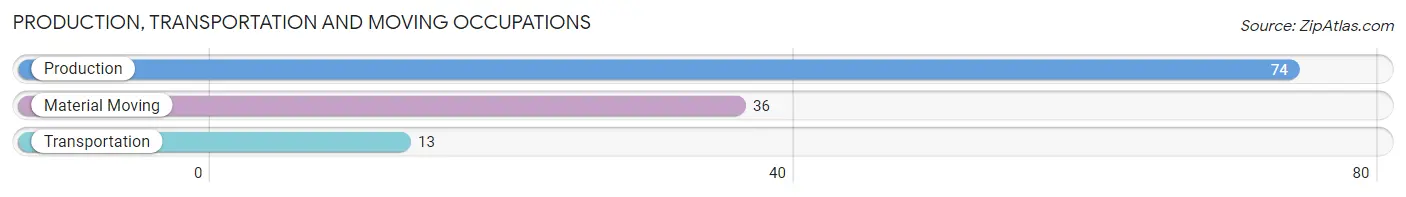
Production, Transportation and Moving Occupations
The most common Production, Transportation and Moving occupations in Hardwick are Production (74 | 11.8%), Material Moving (36 | 5.7%), and Transportation (13 | 2.1%).
Production, Transportation and Moving Occupations by Sex
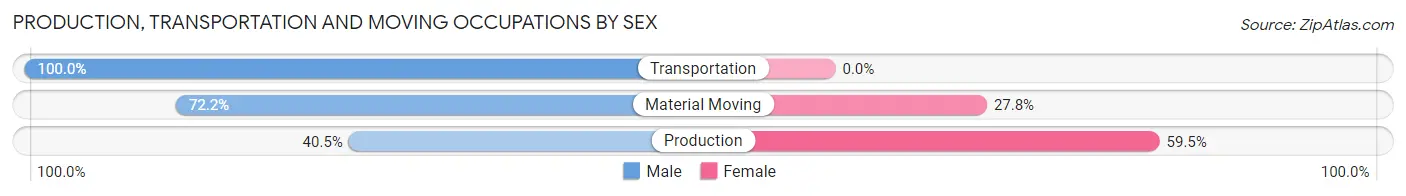
| Occupation | Male | Female |
| Production | 30 (40.5%) | 44 (59.5%) |
| Transportation | 13 (100.0%) | 0 (0.0%) |
| Material Moving | 26 (72.2%) | 10 (27.8%) |
| Total (Category) | 69 (56.1%) | 54 (43.9%) |
| Total (Overall) | 257 (40.9%) | 371 (59.1%) |
Employment Industries by Sex in Hardwick
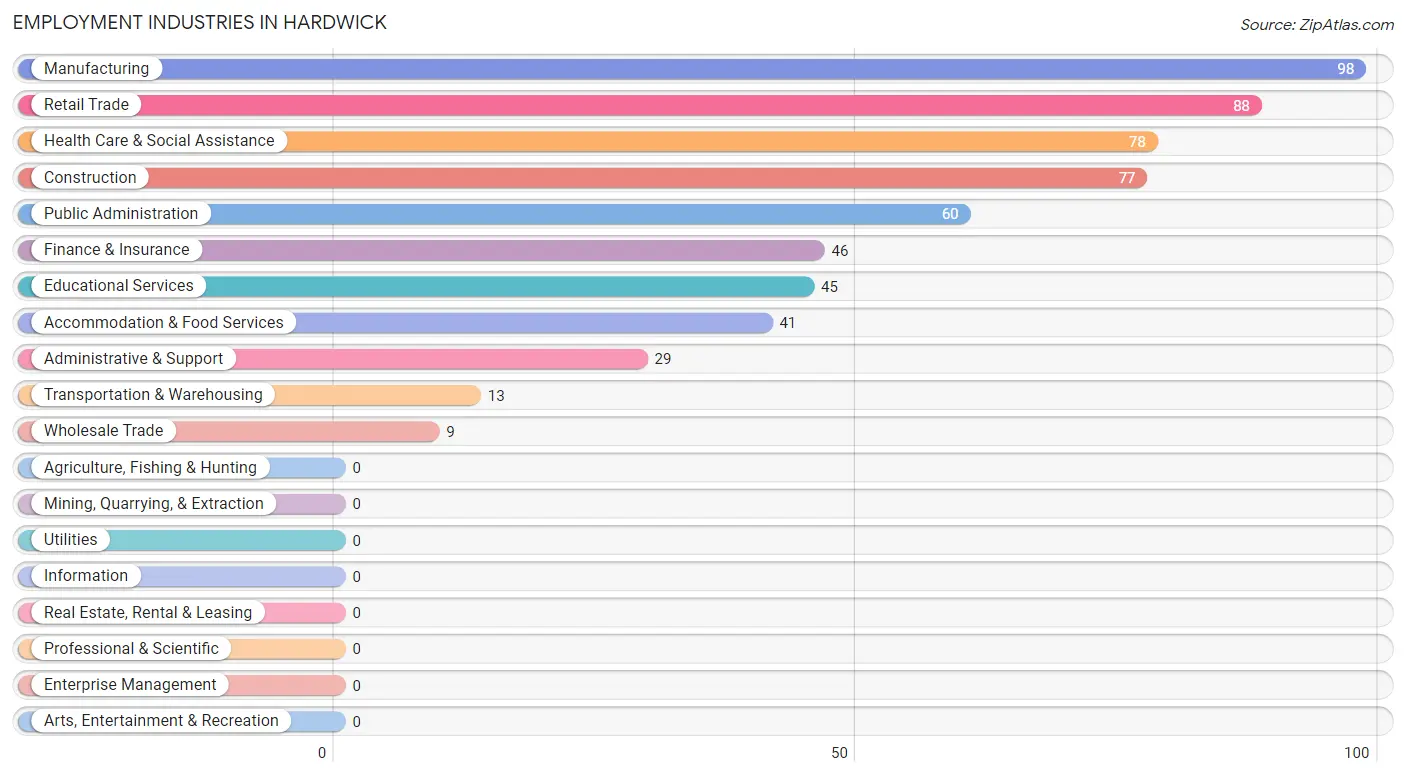
Employment Industries in Hardwick
The major employment industries in Hardwick include Manufacturing (98 | 15.6%), Retail Trade (88 | 14.0%), Health Care & Social Assistance (78 | 12.4%), Construction (77 | 12.3%), and Public Administration (60 | 9.6%).
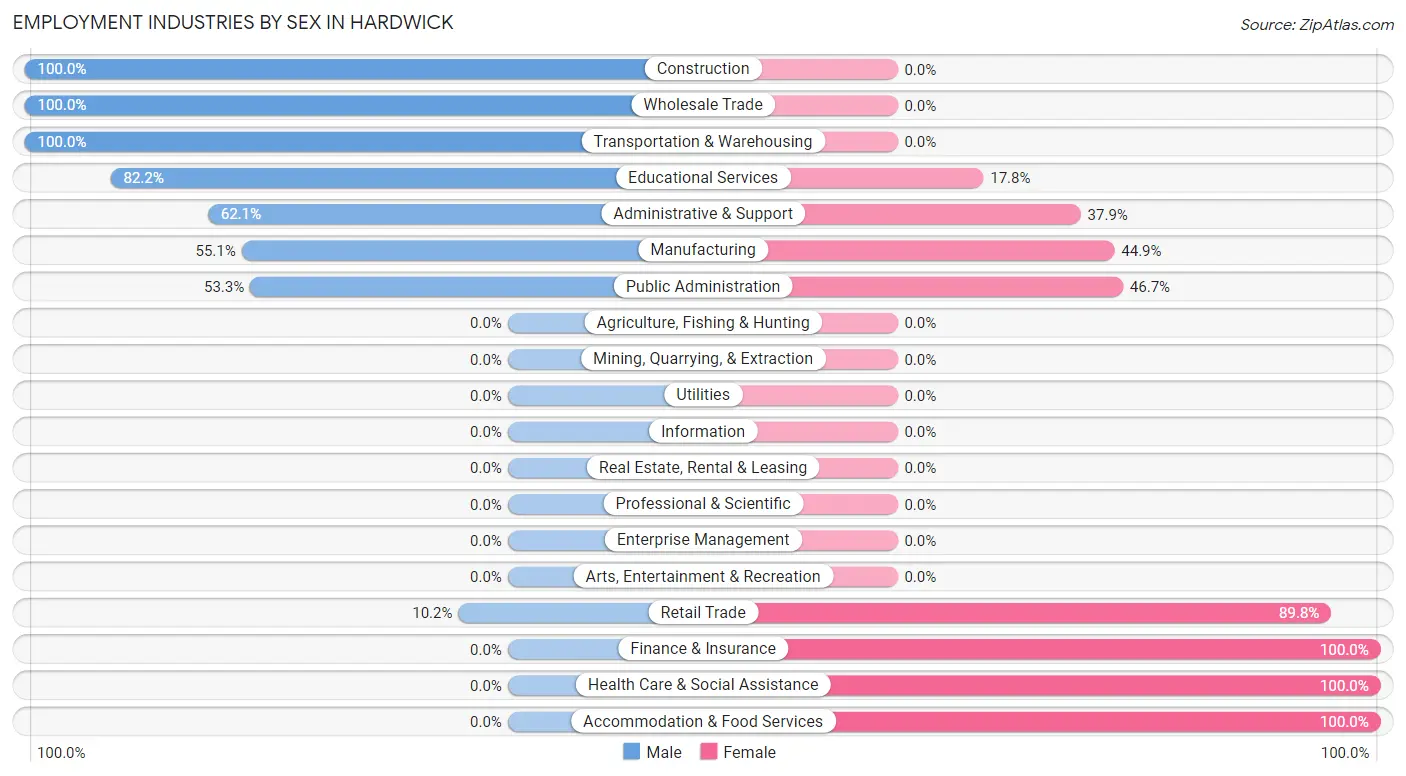
Employment Industries by Sex in Hardwick
The Hardwick industries that see more men than women are Construction (100.0%), Wholesale Trade (100.0%), and Transportation & Warehousing (100.0%), whereas the industries that tend to have a higher number of women are Finance & Insurance (100.0%), Health Care & Social Assistance (100.0%), and Accommodation & Food Services (100.0%).
| Industry | Male | Female |
| Agriculture, Fishing & Hunting | 0 (0.0%) | 0 (0.0%) |
| Mining, Quarrying, & Extraction | 0 (0.0%) | 0 (0.0%) |
| Construction | 77 (100.0%) | 0 (0.0%) |
| Manufacturing | 54 (55.1%) | 44 (44.9%) |
| Wholesale Trade | 9 (100.0%) | 0 (0.0%) |
| Retail Trade | 9 (10.2%) | 79 (89.8%) |
| Transportation & Warehousing | 13 (100.0%) | 0 (0.0%) |
| Utilities | 0 (0.0%) | 0 (0.0%) |
| Information | 0 (0.0%) | 0 (0.0%) |
| Finance & Insurance | 0 (0.0%) | 46 (100.0%) |
| Real Estate, Rental & Leasing | 0 (0.0%) | 0 (0.0%) |
| Professional & Scientific | 0 (0.0%) | 0 (0.0%) |
| Enterprise Management | 0 (0.0%) | 0 (0.0%) |
| Administrative & Support | 18 (62.1%) | 11 (37.9%) |
| Educational Services | 37 (82.2%) | 8 (17.8%) |
| Health Care & Social Assistance | 0 (0.0%) | 78 (100.0%) |
| Arts, Entertainment & Recreation | 0 (0.0%) | 0 (0.0%) |
| Accommodation & Food Services | 0 (0.0%) | 41 (100.0%) |
| Public Administration | 32 (53.3%) | 28 (46.7%) |
| Total | 257 (40.9%) | 371 (59.1%) |
Education in Hardwick
School Enrollment in Hardwick
The most common levels of schooling among the 216 students in Hardwick are elementary school (86 | 39.8%), nursery / preschool (51 | 23.6%), and middle school (40 | 18.5%).
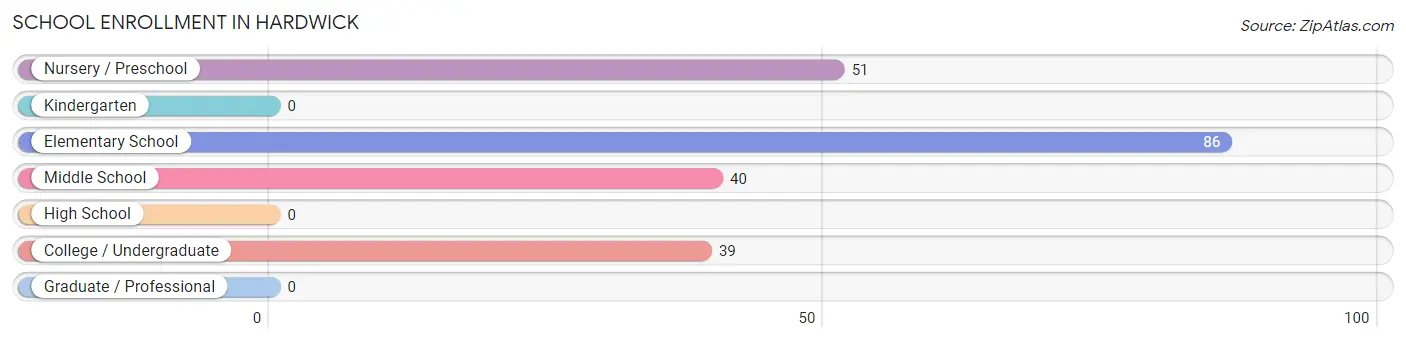
| School Level | # Students | % Students |
| Nursery / Preschool | 51 | 23.6% |
| Kindergarten | 0 | 0.0% |
| Elementary School | 86 | 39.8% |
| Middle School | 40 | 18.5% |
| High School | 0 | 0.0% |
| College / Undergraduate | 39 | 18.1% |
| Graduate / Professional | 0 | 0.0% |
| Total | 216 | 100.0% |
School Enrollment by Age by Funding Source in Hardwick
Out of a total of 216 students who are enrolled in schools in Hardwick, 25 (11.6%) attend a private institution, while the remaining 191 (88.4%) are enrolled in public schools. The age group of 20 to 24 year olds has the highest likelihood of being enrolled in private schools, with 25 (100.0% in the age bracket) enrolled. Conversely, the age group of 3 to 4 year olds has the lowest likelihood of being enrolled in a private school, with 51 (100.0% in the age bracket) attending a public institution.
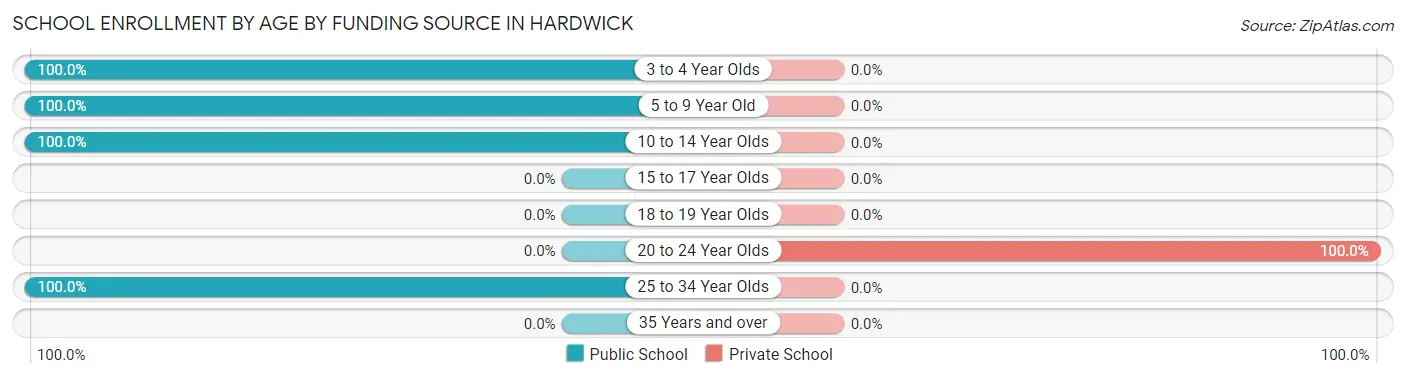
| Age Bracket | Public School | Private School |
| 3 to 4 Year Olds | 51 (100.0%) | 0 (0.0%) |
| 5 to 9 Year Old | 60 (100.0%) | 0 (0.0%) |
| 10 to 14 Year Olds | 66 (100.0%) | 0 (0.0%) |
| 15 to 17 Year Olds | 0 (0.0%) | 0 (0.0%) |
| 18 to 19 Year Olds | 0 (0.0%) | 0 (0.0%) |
| 20 to 24 Year Olds | 0 (0.0%) | 25 (100.0%) |
| 25 to 34 Year Olds | 14 (100.0%) | 0 (0.0%) |
| 35 Years and over | 0 (0.0%) | 0 (0.0%) |
| Total | 191 (88.4%) | 25 (11.6%) |
Educational Attainment by Field of Study in Hardwick
Literature & languages (61 | 37.2%), bio, nature & agricultural (32 | 19.5%), science & technology (25 | 15.2%), education (18 | 11.0%), and social sciences (10 | 6.1%) are the most common fields of study among 164 individuals in Hardwick who have obtained a bachelor's degree or higher.
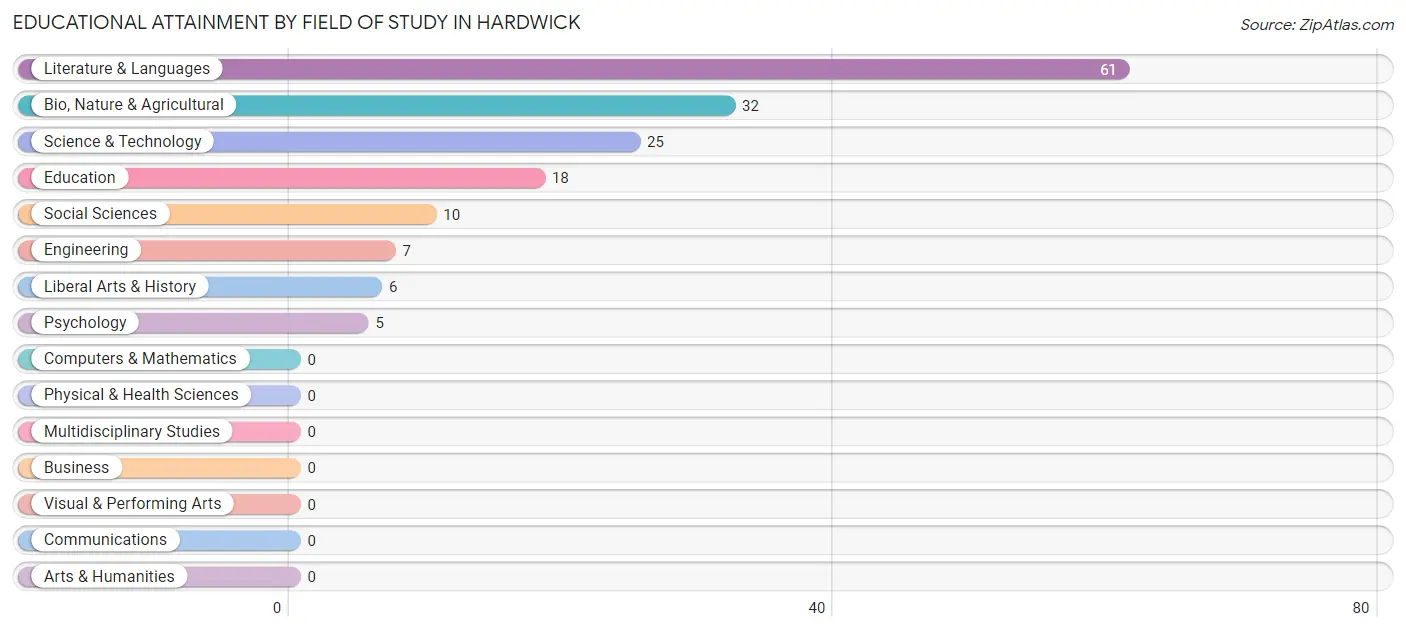
| Field of Study | # Graduates | % Graduates |
| Computers & Mathematics | 0 | 0.0% |
| Bio, Nature & Agricultural | 32 | 19.5% |
| Physical & Health Sciences | 0 | 0.0% |
| Psychology | 5 | 3.0% |
| Social Sciences | 10 | 6.1% |
| Engineering | 7 | 4.3% |
| Multidisciplinary Studies | 0 | 0.0% |
| Science & Technology | 25 | 15.2% |
| Business | 0 | 0.0% |
| Education | 18 | 11.0% |
| Literature & Languages | 61 | 37.2% |
| Liberal Arts & History | 6 | 3.7% |
| Visual & Performing Arts | 0 | 0.0% |
| Communications | 0 | 0.0% |
| Arts & Humanities | 0 | 0.0% |
| Total | 164 | 100.0% |
Transportation & Commute in Hardwick
Vehicle Availability by Sex in Hardwick
The most prevalent vehicle ownership categories in Hardwick are males with 1 vehicle (93, accounting for 36.2%) and females with 1 vehicle (72, making up 26.4%).
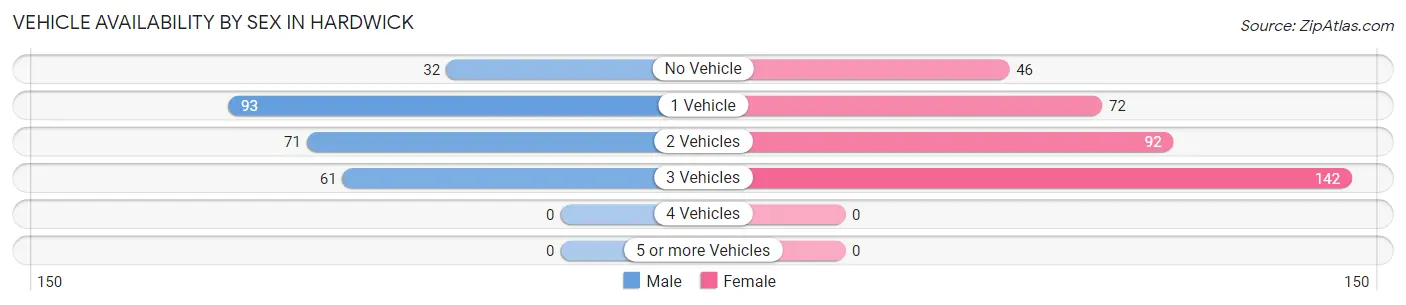
| Vehicles Available | Male | Female |
| No Vehicle | 32 (12.4%) | 46 (13.1%) |
| 1 Vehicle | 93 (36.2%) | 72 (20.4%) |
| 2 Vehicles | 71 (27.6%) | 92 (26.1%) |
| 3 Vehicles | 61 (23.7%) | 142 (40.3%) |
| 4 Vehicles | 0 (0.0%) | 0 (0.0%) |
| 5 or more Vehicles | 0 (0.0%) | 0 (0.0%) |
| Total | 257 (100.0%) | 352 (100.0%) |
Commute Time in Hardwick
The most frequently occuring commute durations in Hardwick are 45 to 59 minutes (94 commuters, 16.1%), 30 to 34 minutes (82 commuters, 14.1%), and 20 to 24 minutes (81 commuters, 13.9%).
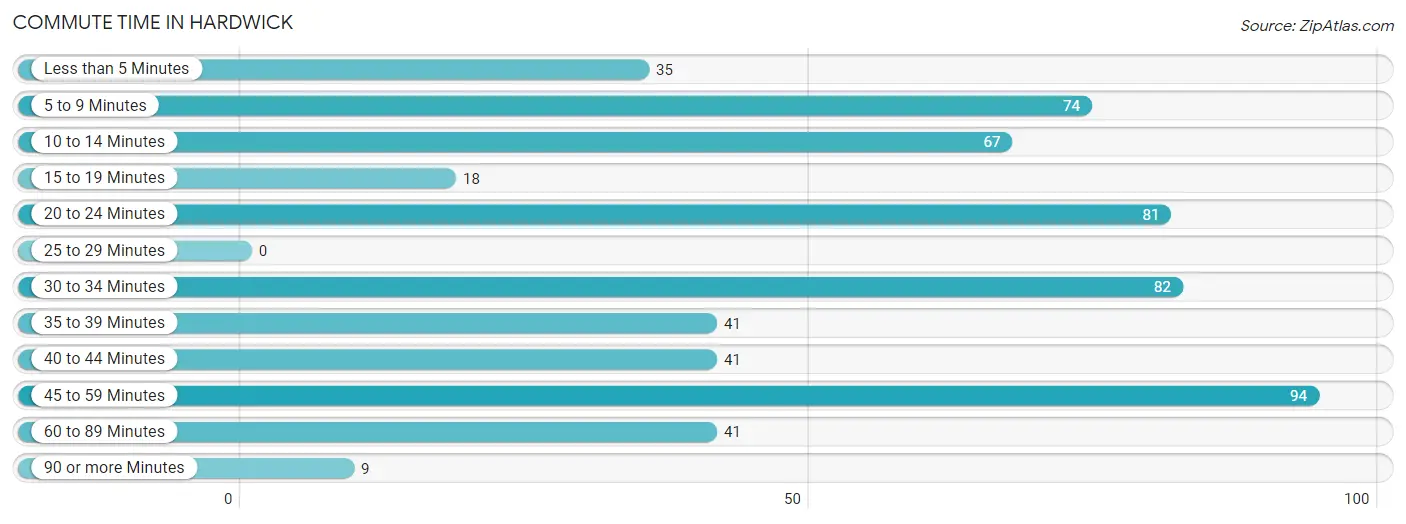
| Commute Time | # Commuters | % Commuters |
| Less than 5 Minutes | 35 | 6.0% |
| 5 to 9 Minutes | 74 | 12.7% |
| 10 to 14 Minutes | 67 | 11.5% |
| 15 to 19 Minutes | 18 | 3.1% |
| 20 to 24 Minutes | 81 | 13.9% |
| 25 to 29 Minutes | 0 | 0.0% |
| 30 to 34 Minutes | 82 | 14.1% |
| 35 to 39 Minutes | 41 | 7.0% |
| 40 to 44 Minutes | 41 | 7.0% |
| 45 to 59 Minutes | 94 | 16.1% |
| 60 to 89 Minutes | 41 | 7.0% |
| 90 or more Minutes | 9 | 1.5% |
Commute Time by Sex in Hardwick
The most common commute times in Hardwick are 30 to 34 minutes (53 commuters, 21.3%) for males and 45 to 59 minutes (77 commuters, 23.1%) for females.
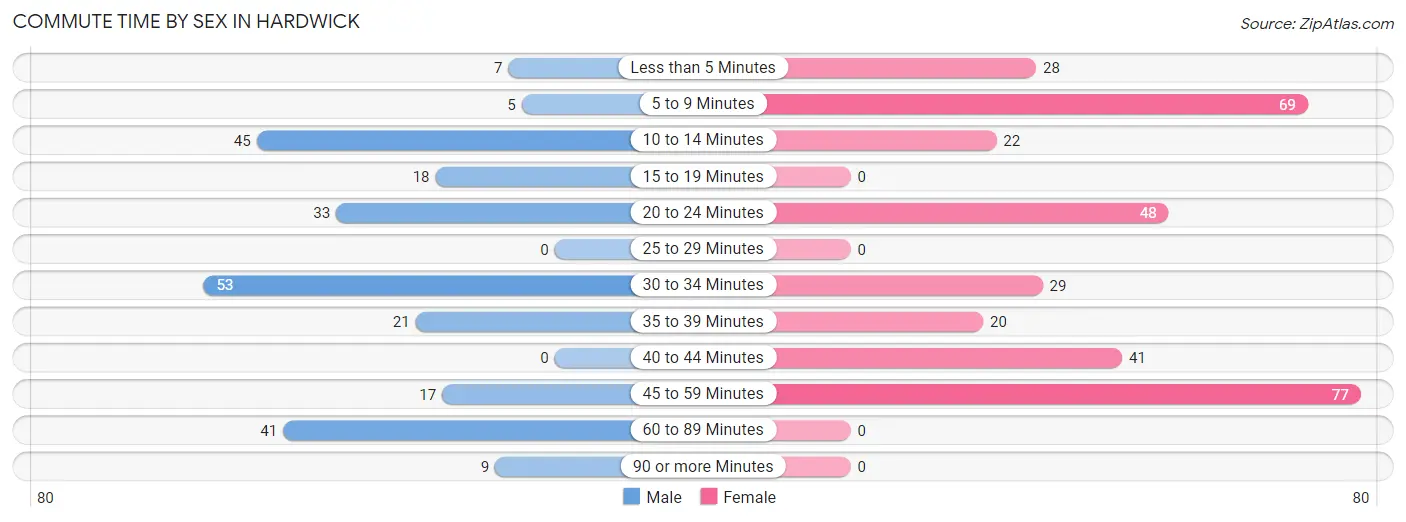
| Commute Time | Male | Female |
| Less than 5 Minutes | 7 (2.8%) | 28 (8.4%) |
| 5 to 9 Minutes | 5 (2.0%) | 69 (20.7%) |
| 10 to 14 Minutes | 45 (18.1%) | 22 (6.6%) |
| 15 to 19 Minutes | 18 (7.2%) | 0 (0.0%) |
| 20 to 24 Minutes | 33 (13.3%) | 48 (14.4%) |
| 25 to 29 Minutes | 0 (0.0%) | 0 (0.0%) |
| 30 to 34 Minutes | 53 (21.3%) | 29 (8.7%) |
| 35 to 39 Minutes | 21 (8.4%) | 20 (6.0%) |
| 40 to 44 Minutes | 0 (0.0%) | 41 (12.3%) |
| 45 to 59 Minutes | 17 (6.8%) | 77 (23.1%) |
| 60 to 89 Minutes | 41 (16.5%) | 0 (0.0%) |
| 90 or more Minutes | 9 (3.6%) | 0 (0.0%) |
Time of Departure to Work by Sex in Hardwick
The most frequent times of departure to work in Hardwick are 5:00 AM to 5:29 AM (95, 38.2%) for males and 6:00 AM to 6:29 AM (89, 26.7%) for females.
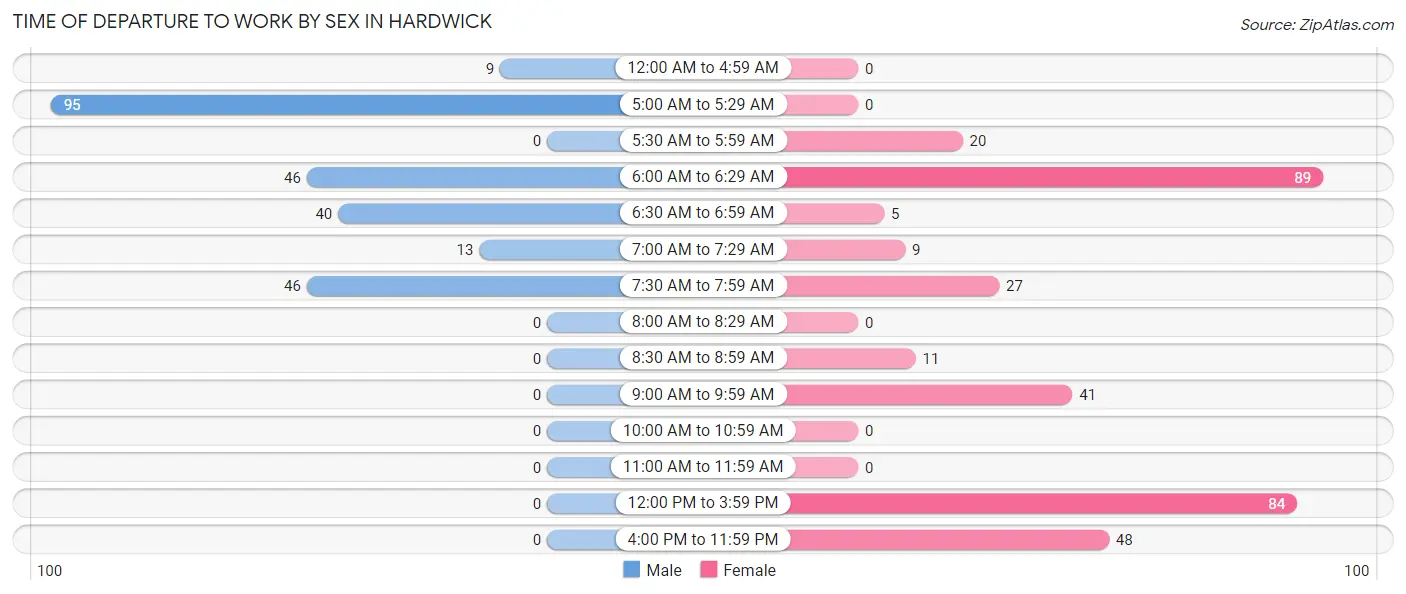
| Time of Departure | Male | Female |
| 12:00 AM to 4:59 AM | 9 (3.6%) | 0 (0.0%) |
| 5:00 AM to 5:29 AM | 95 (38.2%) | 0 (0.0%) |
| 5:30 AM to 5:59 AM | 0 (0.0%) | 20 (6.0%) |
| 6:00 AM to 6:29 AM | 46 (18.5%) | 89 (26.7%) |
| 6:30 AM to 6:59 AM | 40 (16.1%) | 5 (1.5%) |
| 7:00 AM to 7:29 AM | 13 (5.2%) | 9 (2.7%) |
| 7:30 AM to 7:59 AM | 46 (18.5%) | 27 (8.1%) |
| 8:00 AM to 8:29 AM | 0 (0.0%) | 0 (0.0%) |
| 8:30 AM to 8:59 AM | 0 (0.0%) | 11 (3.3%) |
| 9:00 AM to 9:59 AM | 0 (0.0%) | 41 (12.3%) |
| 10:00 AM to 10:59 AM | 0 (0.0%) | 0 (0.0%) |
| 11:00 AM to 11:59 AM | 0 (0.0%) | 0 (0.0%) |
| 12:00 PM to 3:59 PM | 0 (0.0%) | 84 (25.2%) |
| 4:00 PM to 11:59 PM | 0 (0.0%) | 48 (14.4%) |
| Total | 249 (100.0%) | 334 (100.0%) |
Housing Occupancy in Hardwick
Occupancy by Ownership in Hardwick
Of the total 553 dwellings in Hardwick, owner-occupied units account for 295 (53.3%), while renter-occupied units make up 258 (46.7%).
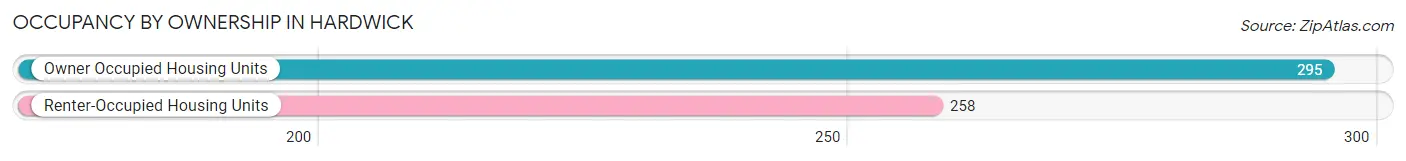
| Occupancy | # Housing Units | % Housing Units |
| Owner Occupied Housing Units | 295 | 53.3% |
| Renter-Occupied Housing Units | 258 | 46.7% |
| Total Occupied Housing Units | 553 | 100.0% |
Occupancy by Household Size in Hardwick
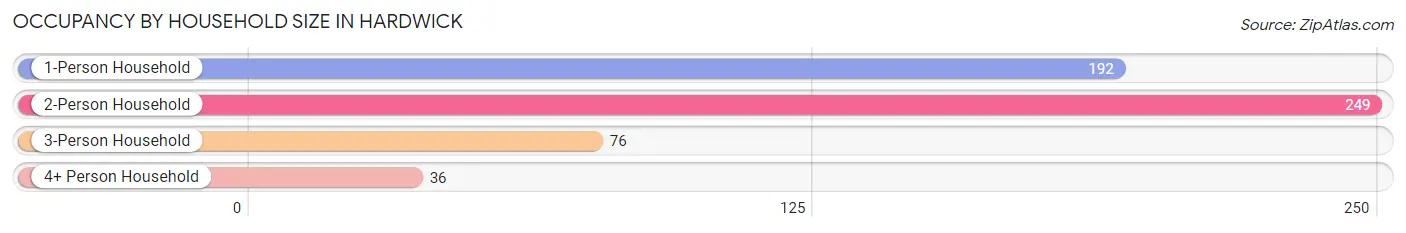
| Household Size | # Housing Units | % Housing Units |
| 1-Person Household | 192 | 34.7% |
| 2-Person Household | 249 | 45.0% |
| 3-Person Household | 76 | 13.7% |
| 4+ Person Household | 36 | 6.5% |
| Total Housing Units | 553 | 100.0% |
Occupancy by Ownership by Household Size in Hardwick
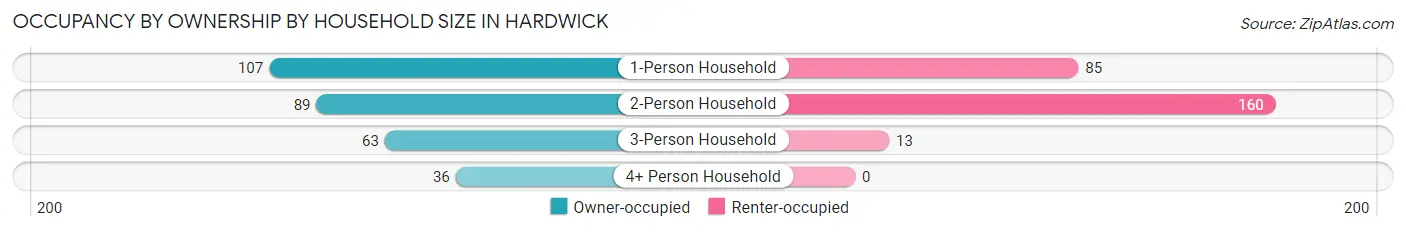
| Household Size | Owner-occupied | Renter-occupied |
| 1-Person Household | 107 (55.7%) | 85 (44.3%) |
| 2-Person Household | 89 (35.7%) | 160 (64.3%) |
| 3-Person Household | 63 (82.9%) | 13 (17.1%) |
| 4+ Person Household | 36 (100.0%) | 0 (0.0%) |
| Total Housing Units | 295 (53.3%) | 258 (46.7%) |
Occupancy by Educational Attainment in Hardwick
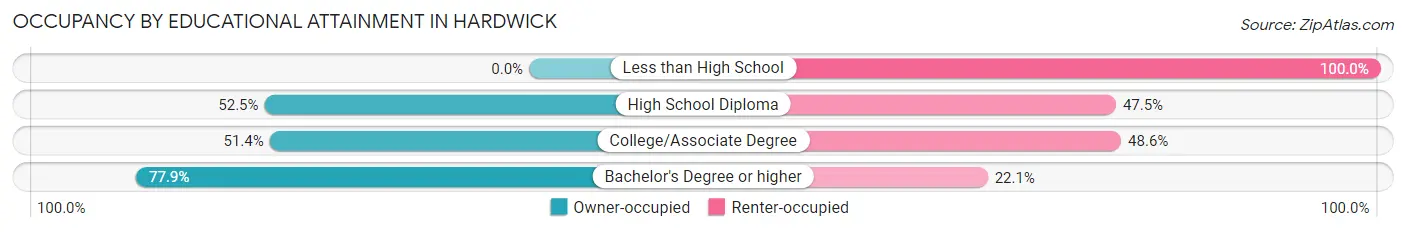
| Household Size | Owner-occupied | Renter-occupied |
| Less than High School | 0 (0.0%) | 34 (100.0%) |
| High School Diploma | 149 (52.5%) | 135 (47.5%) |
| College/Associate Degree | 72 (51.4%) | 68 (48.6%) |
| Bachelor's Degree or higher | 74 (77.9%) | 21 (22.1%) |
Occupancy by Age of Householder in Hardwick
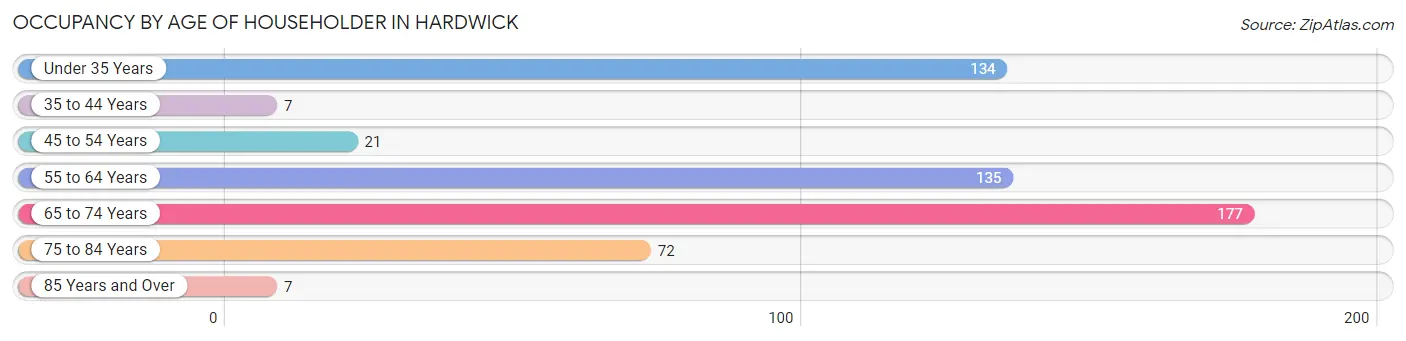
| Age Bracket | # Households | % Households |
| Under 35 Years | 134 | 24.2% |
| 35 to 44 Years | 7 | 1.3% |
| 45 to 54 Years | 21 | 3.8% |
| 55 to 64 Years | 135 | 24.4% |
| 65 to 74 Years | 177 | 32.0% |
| 75 to 84 Years | 72 | 13.0% |
| 85 Years and Over | 7 | 1.3% |
| Total | 553 | 100.0% |
Housing Finances in Hardwick
Median Income by Occupancy in Hardwick
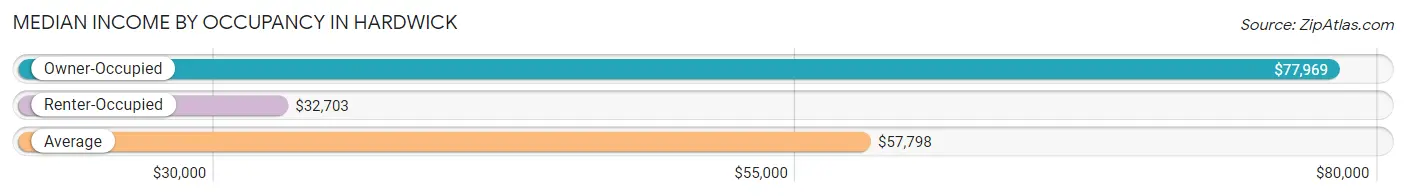
| Occupancy Type | # Households | Median Income |
| Owner-Occupied | 295 (53.3%) | $77,969 |
| Renter-Occupied | 258 (46.7%) | $32,703 |
| Average | 553 (100.0%) | $57,798 |
Occupancy by Householder Income Bracket in Hardwick
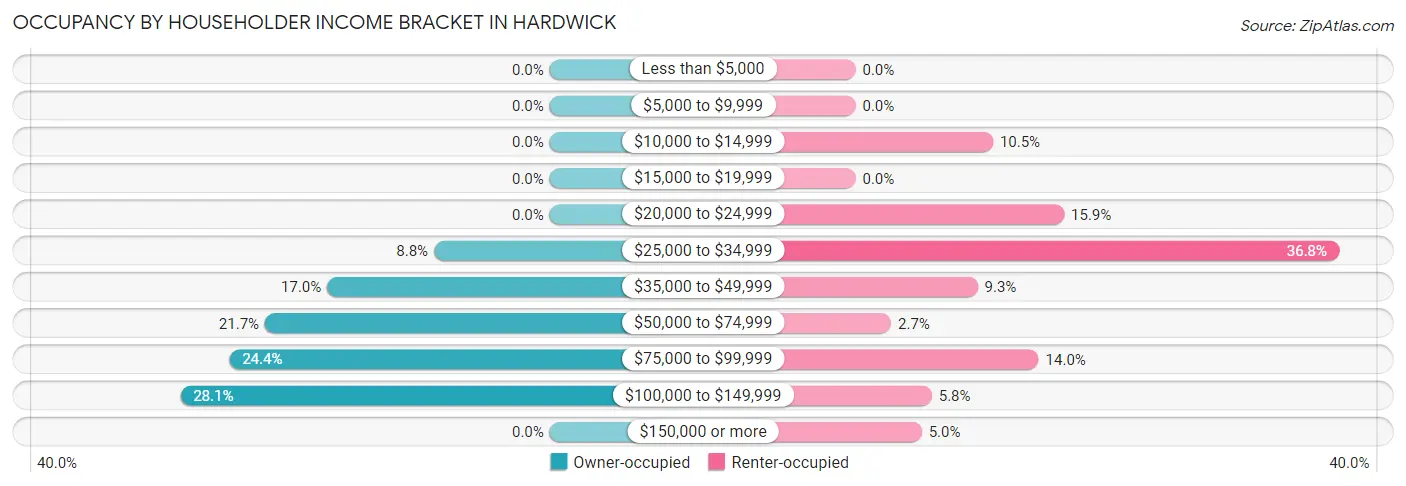
| Income Bracket | Owner-occupied | Renter-occupied |
| Less than $5,000 | 0 (0.0%) | 0 (0.0%) |
| $5,000 to $9,999 | 0 (0.0%) | 0 (0.0%) |
| $10,000 to $14,999 | 0 (0.0%) | 27 (10.5%) |
| $15,000 to $19,999 | 0 (0.0%) | 0 (0.0%) |
| $20,000 to $24,999 | 0 (0.0%) | 41 (15.9%) |
| $25,000 to $34,999 | 26 (8.8%) | 95 (36.8%) |
| $35,000 to $49,999 | 50 (17.0%) | 24 (9.3%) |
| $50,000 to $74,999 | 64 (21.7%) | 7 (2.7%) |
| $75,000 to $99,999 | 72 (24.4%) | 36 (14.0%) |
| $100,000 to $149,999 | 83 (28.1%) | 15 (5.8%) |
| $150,000 or more | 0 (0.0%) | 13 (5.0%) |
| Total | 295 (100.0%) | 258 (100.0%) |
Monthly Housing Cost Tiers in Hardwick
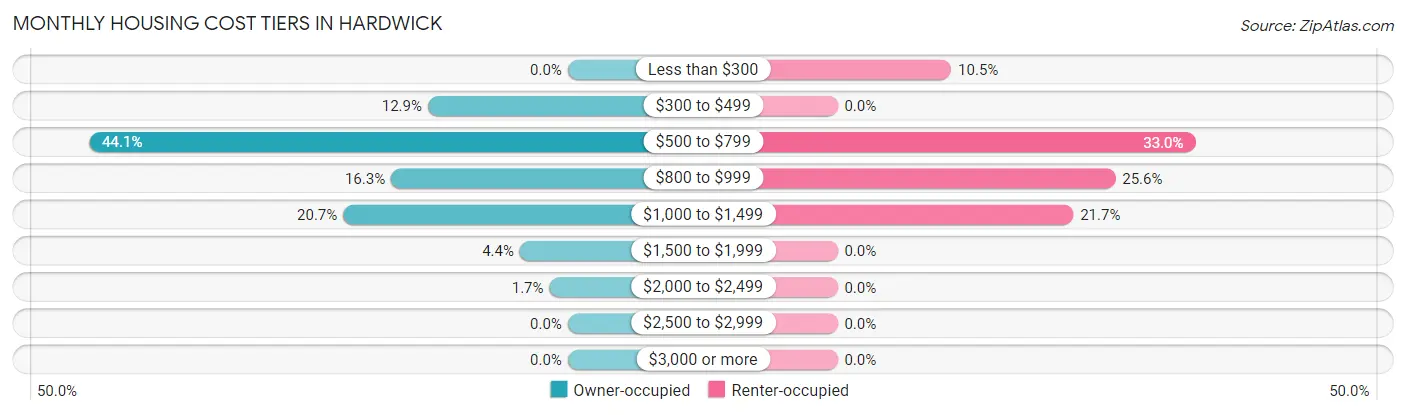
| Monthly Cost | Owner-occupied | Renter-occupied |
| Less than $300 | 0 (0.0%) | 27 (10.5%) |
| $300 to $499 | 38 (12.9%) | 0 (0.0%) |
| $500 to $799 | 130 (44.1%) | 85 (33.0%) |
| $800 to $999 | 48 (16.3%) | 66 (25.6%) |
| $1,000 to $1,499 | 61 (20.7%) | 56 (21.7%) |
| $1,500 to $1,999 | 13 (4.4%) | 0 (0.0%) |
| $2,000 to $2,499 | 5 (1.7%) | 0 (0.0%) |
| $2,500 to $2,999 | 0 (0.0%) | 0 (0.0%) |
| $3,000 or more | 0 (0.0%) | 0 (0.0%) |
| Total | 295 (100.0%) | 258 (100.0%) |
Physical Housing Characteristics in Hardwick
Housing Structures in Hardwick
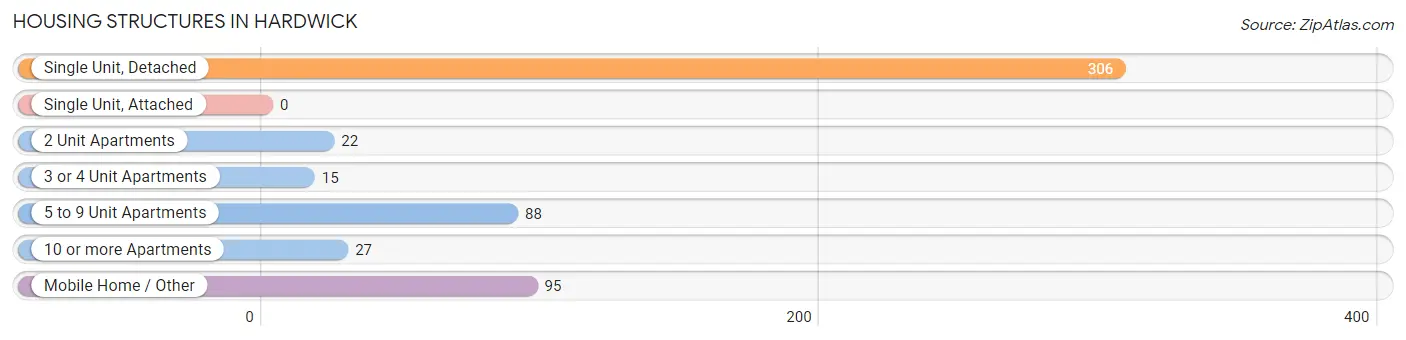
| Structure Type | # Housing Units | % Housing Units |
| Single Unit, Detached | 306 | 55.3% |
| Single Unit, Attached | 0 | 0.0% |
| 2 Unit Apartments | 22 | 4.0% |
| 3 or 4 Unit Apartments | 15 | 2.7% |
| 5 to 9 Unit Apartments | 88 | 15.9% |
| 10 or more Apartments | 27 | 4.9% |
| Mobile Home / Other | 95 | 17.2% |
| Total | 553 | 100.0% |
Housing Structures by Occupancy in Hardwick
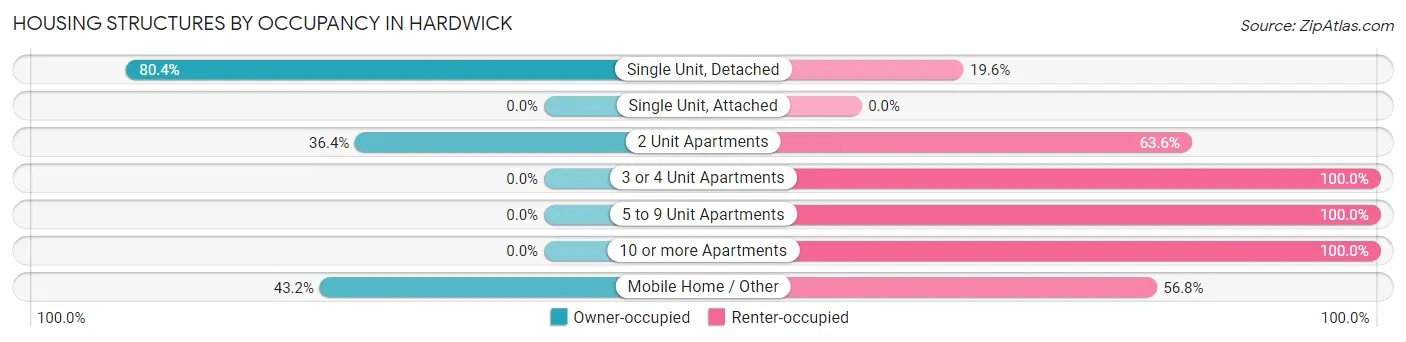
| Structure Type | Owner-occupied | Renter-occupied |
| Single Unit, Detached | 246 (80.4%) | 60 (19.6%) |
| Single Unit, Attached | 0 (0.0%) | 0 (0.0%) |
| 2 Unit Apartments | 8 (36.4%) | 14 (63.6%) |
| 3 or 4 Unit Apartments | 0 (0.0%) | 15 (100.0%) |
| 5 to 9 Unit Apartments | 0 (0.0%) | 88 (100.0%) |
| 10 or more Apartments | 0 (0.0%) | 27 (100.0%) |
| Mobile Home / Other | 41 (43.2%) | 54 (56.8%) |
| Total | 295 (53.3%) | 258 (46.7%) |
Housing Structures by Number of Rooms in Hardwick
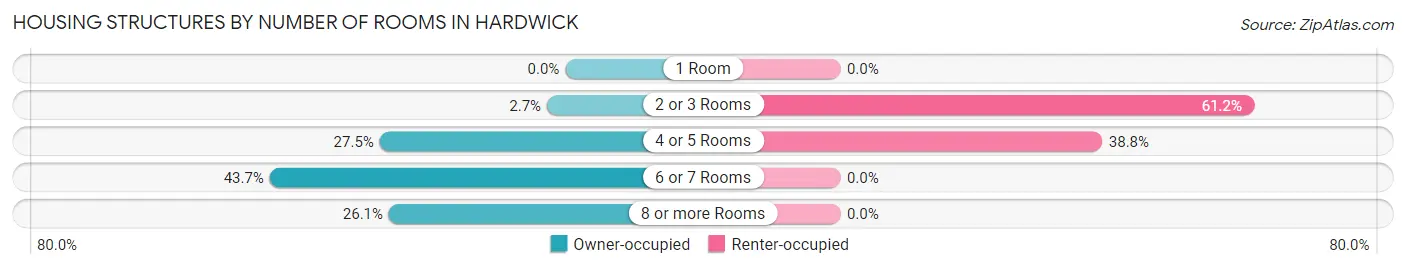
| Number of Rooms | Owner-occupied | Renter-occupied |
| 1 Room | 0 (0.0%) | 0 (0.0%) |
| 2 or 3 Rooms | 8 (2.7%) | 158 (61.2%) |
| 4 or 5 Rooms | 81 (27.5%) | 100 (38.8%) |
| 6 or 7 Rooms | 129 (43.7%) | 0 (0.0%) |
| 8 or more Rooms | 77 (26.1%) | 0 (0.0%) |
| Total | 295 (100.0%) | 258 (100.0%) |
Housing Structure by Heating Type in Hardwick
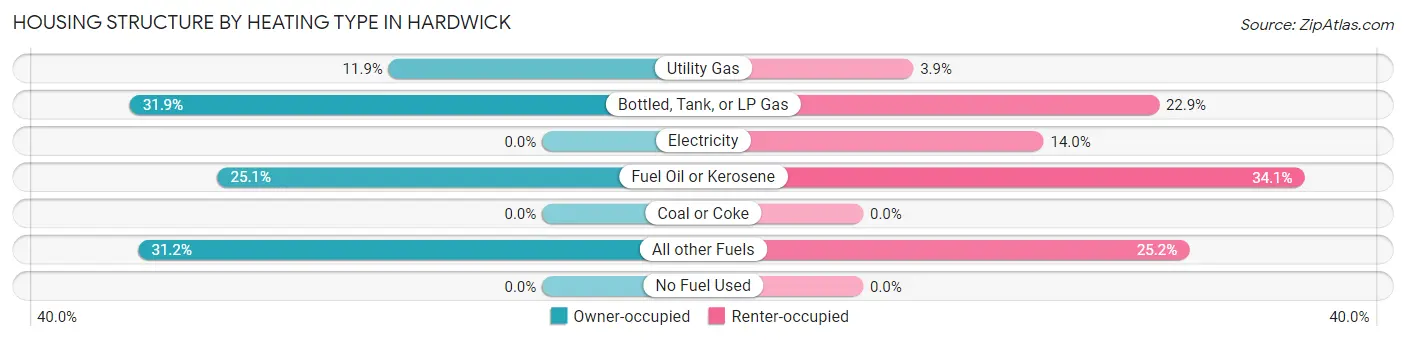
| Heating Type | Owner-occupied | Renter-occupied |
| Utility Gas | 35 (11.9%) | 10 (3.9%) |
| Bottled, Tank, or LP Gas | 94 (31.9%) | 59 (22.9%) |
| Electricity | 0 (0.0%) | 36 (14.0%) |
| Fuel Oil or Kerosene | 74 (25.1%) | 88 (34.1%) |
| Coal or Coke | 0 (0.0%) | 0 (0.0%) |
| All other Fuels | 92 (31.2%) | 65 (25.2%) |
| No Fuel Used | 0 (0.0%) | 0 (0.0%) |
| Total | 295 (100.0%) | 258 (100.0%) |
Household Vehicle Usage in Hardwick
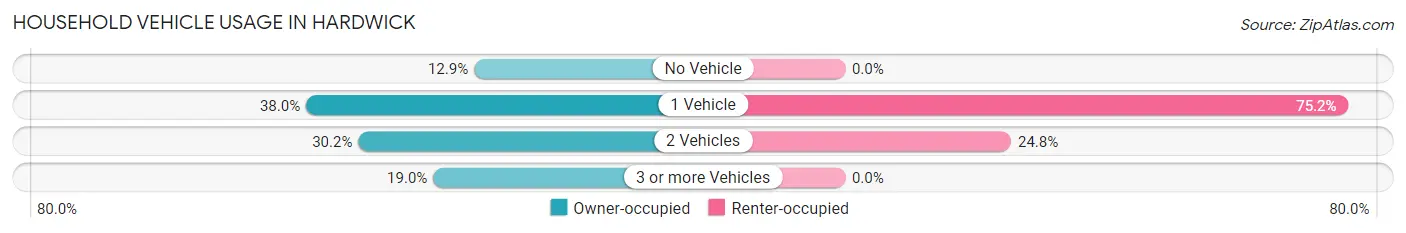
| Vehicles per Household | Owner-occupied | Renter-occupied |
| No Vehicle | 38 (12.9%) | 0 (0.0%) |
| 1 Vehicle | 112 (38.0%) | 194 (75.2%) |
| 2 Vehicles | 89 (30.2%) | 64 (24.8%) |
| 3 or more Vehicles | 56 (19.0%) | 0 (0.0%) |
| Total | 295 (100.0%) | 258 (100.0%) |
Real Estate & Mortgages in Hardwick
Real Estate and Mortgage Overview in Hardwick
| Characteristic | Without Mortgage | With Mortgage |
| Housing Units | 207 | 88 |
| Median Property Value | $155,600 | $121,100 |
| Median Household Income | $65,352 | $0 |
| Monthly Housing Costs | $642 | $0 |
| Real Estate Taxes | $3,179 | $0 |
Property Value by Mortgage Status in Hardwick
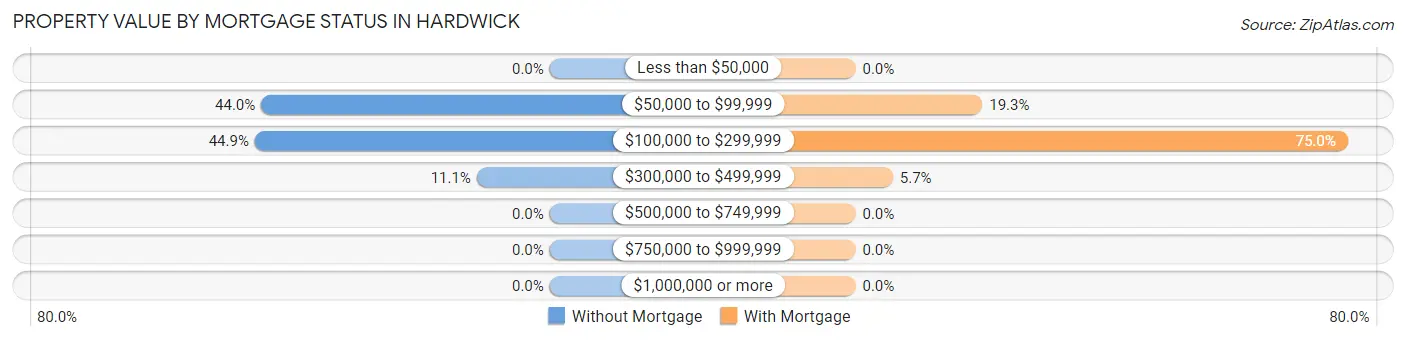
| Property Value | Without Mortgage | With Mortgage |
| Less than $50,000 | 0 (0.0%) | 0 (0.0%) |
| $50,000 to $99,999 | 91 (44.0%) | 17 (19.3%) |
| $100,000 to $299,999 | 93 (44.9%) | 66 (75.0%) |
| $300,000 to $499,999 | 23 (11.1%) | 5 (5.7%) |
| $500,000 to $749,999 | 0 (0.0%) | 0 (0.0%) |
| $750,000 to $999,999 | 0 (0.0%) | 0 (0.0%) |
| $1,000,000 or more | 0 (0.0%) | 0 (0.0%) |
| Total | 207 (100.0%) | 88 (100.0%) |
Household Income by Mortgage Status in Hardwick
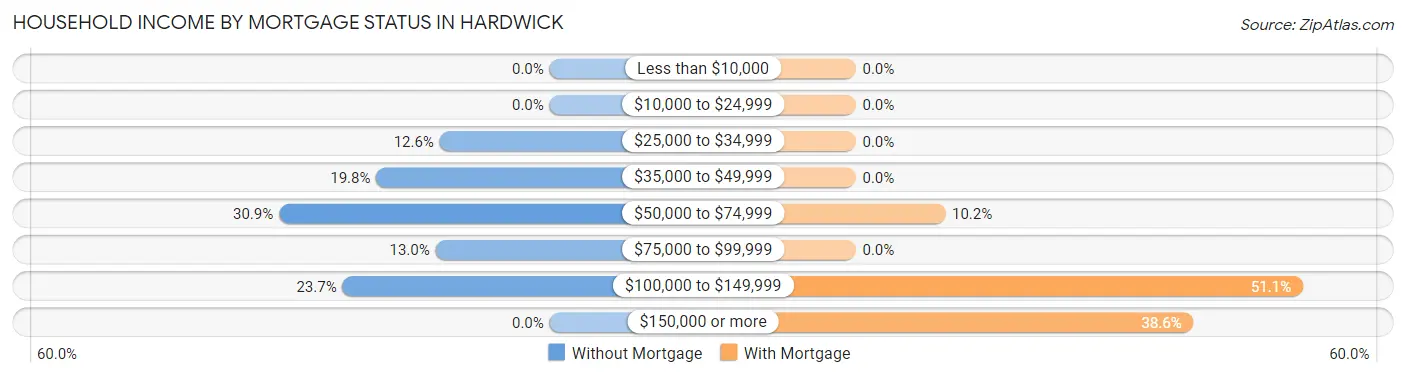
| Household Income | Without Mortgage | With Mortgage |
| Less than $10,000 | 0 (0.0%) | 0 (0.0%) |
| $10,000 to $24,999 | 0 (0.0%) | 0 (0.0%) |
| $25,000 to $34,999 | 26 (12.6%) | 0 (0.0%) |
| $35,000 to $49,999 | 41 (19.8%) | 0 (0.0%) |
| $50,000 to $74,999 | 64 (30.9%) | 9 (10.2%) |
| $75,000 to $99,999 | 27 (13.0%) | 0 (0.0%) |
| $100,000 to $149,999 | 49 (23.7%) | 45 (51.1%) |
| $150,000 or more | 0 (0.0%) | 34 (38.6%) |
| Total | 207 (100.0%) | 88 (100.0%) |
Property Value to Household Income Ratio in Hardwick
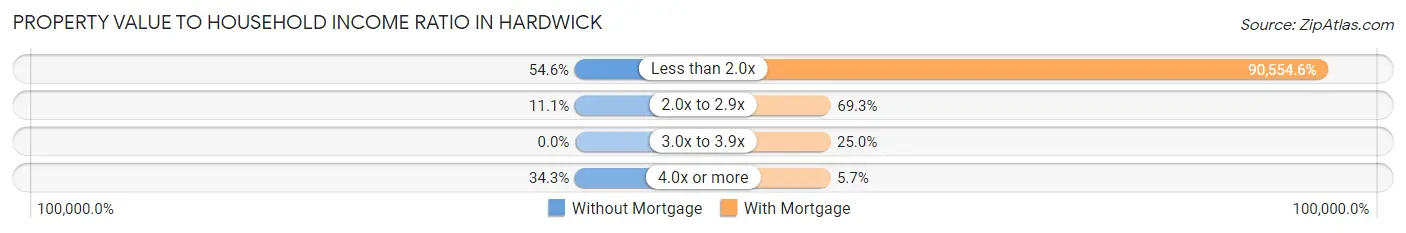
| Value-to-Income Ratio | Without Mortgage | With Mortgage |
| Less than 2.0x | 113 (54.6%) | 79,688 (90,554.5%) |
| 2.0x to 2.9x | 23 (11.1%) | 61 (69.3%) |
| 3.0x to 3.9x | 0 (0.0%) | 22 (25.0%) |
| 4.0x or more | 71 (34.3%) | 5 (5.7%) |
| Total | 207 (100.0%) | 88 (100.0%) |
Real Estate Taxes by Mortgage Status in Hardwick
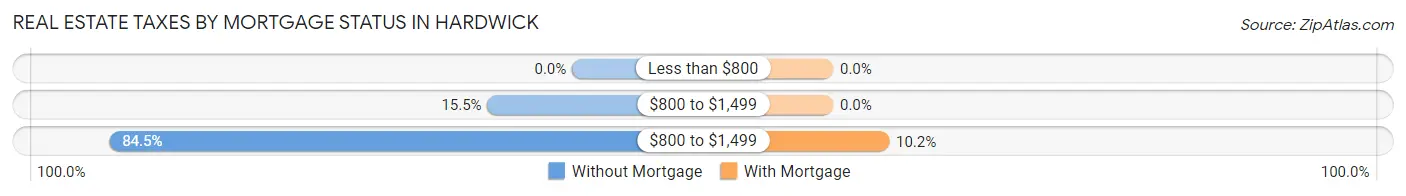
| Property Taxes | Without Mortgage | With Mortgage |
| Less than $800 | 0 (0.0%) | 0 (0.0%) |
| $800 to $1,499 | 32 (15.5%) | 0 (0.0%) |
| $800 to $1,499 | 175 (84.5%) | 9 (10.2%) |
| Total | 207 (100.0%) | 88 (100.0%) |
Health & Disability in Hardwick
Health Insurance Coverage by Age in Hardwick
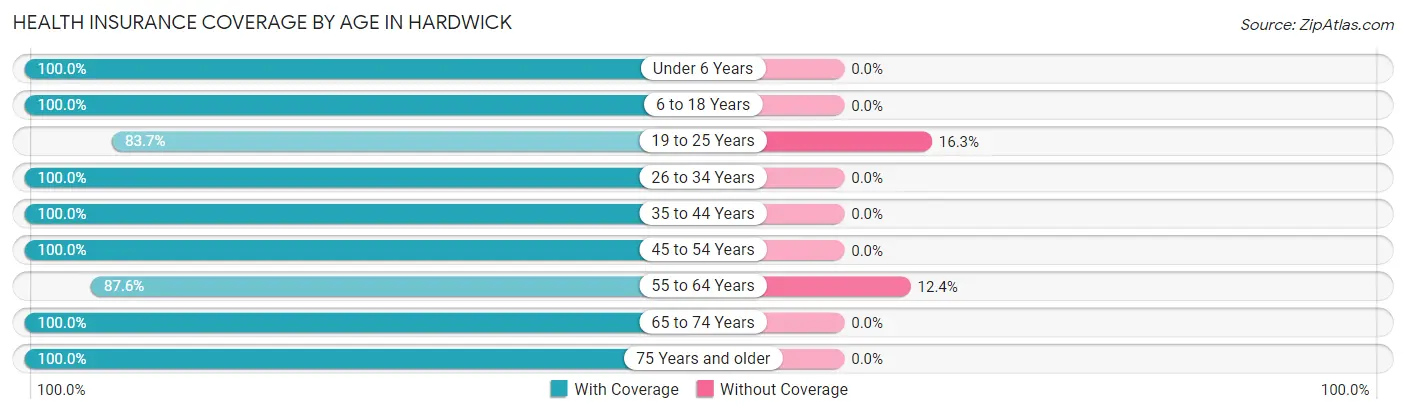
| Age Bracket | With Coverage | Without Coverage |
| Under 6 Years | 88 (100.0%) | 0 (0.0%) |
| 6 to 18 Years | 126 (100.0%) | 0 (0.0%) |
| 19 to 25 Years | 164 (83.7%) | 32 (16.3%) |
| 26 to 34 Years | 235 (100.0%) | 0 (0.0%) |
| 35 to 44 Years | 28 (100.0%) | 0 (0.0%) |
| 45 to 54 Years | 21 (100.0%) | 0 (0.0%) |
| 55 to 64 Years | 170 (87.6%) | 24 (12.4%) |
| 65 to 74 Years | 257 (100.0%) | 0 (0.0%) |
| 75 Years and older | 102 (100.0%) | 0 (0.0%) |
| Total | 1,191 (95.5%) | 56 (4.5%) |
Health Insurance Coverage by Citizenship Status in Hardwick
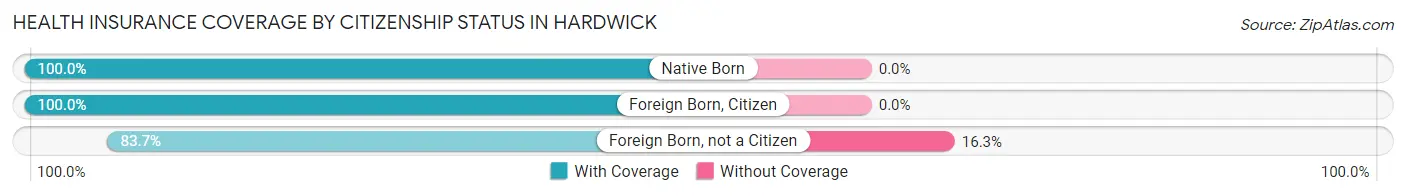
| Citizenship Status | With Coverage | Without Coverage |
| Native Born | 88 (100.0%) | 0 (0.0%) |
| Foreign Born, Citizen | 126 (100.0%) | 0 (0.0%) |
| Foreign Born, not a Citizen | 164 (83.7%) | 32 (16.3%) |
Health Insurance Coverage by Household Income in Hardwick
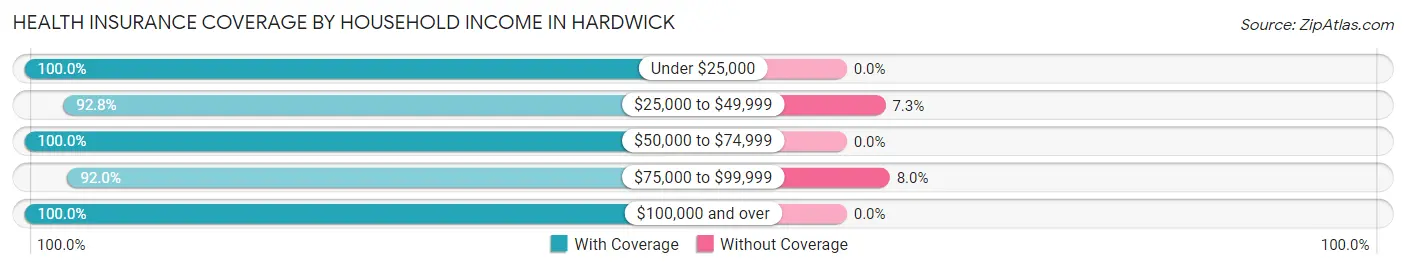
| Household Income | With Coverage | Without Coverage |
| Under $25,000 | 119 (100.0%) | 0 (0.0%) |
| $25,000 to $49,999 | 307 (92.7%) | 24 (7.2%) |
| $50,000 to $74,999 | 212 (100.0%) | 0 (0.0%) |
| $75,000 to $99,999 | 366 (92.0%) | 32 (8.0%) |
| $100,000 and over | 187 (100.0%) | 0 (0.0%) |
Public vs Private Health Insurance Coverage by Age in Hardwick
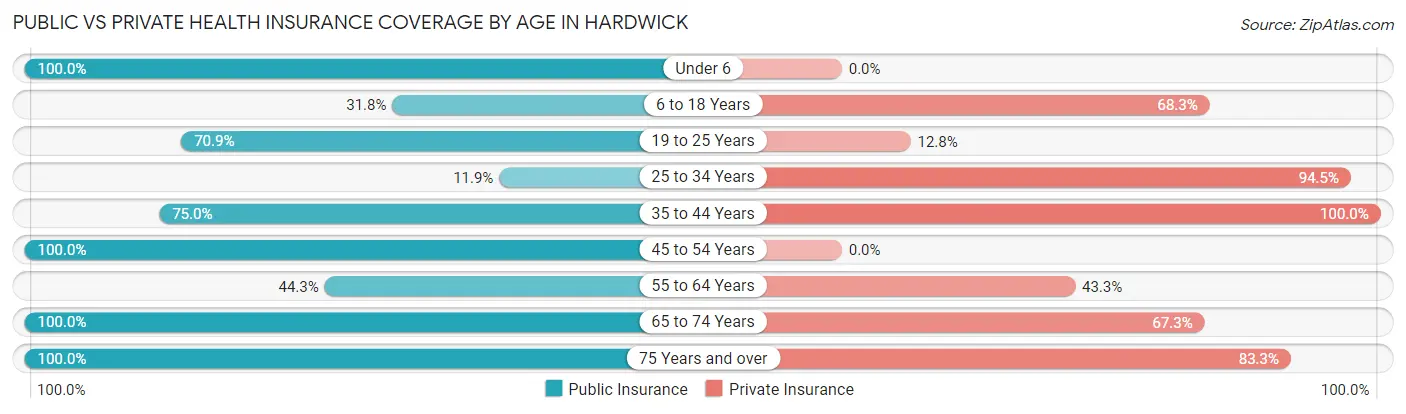
| Age Bracket | Public Insurance | Private Insurance |
| Under 6 | 88 (100.0%) | 0 (0.0%) |
| 6 to 18 Years | 40 (31.8%) | 86 (68.2%) |
| 19 to 25 Years | 139 (70.9%) | 25 (12.8%) |
| 25 to 34 Years | 28 (11.9%) | 222 (94.5%) |
| 35 to 44 Years | 21 (75.0%) | 28 (100.0%) |
| 45 to 54 Years | 21 (100.0%) | 0 (0.0%) |
| 55 to 64 Years | 86 (44.3%) | 84 (43.3%) |
| 65 to 74 Years | 257 (100.0%) | 173 (67.3%) |
| 75 Years and over | 102 (100.0%) | 85 (83.3%) |
| Total | 782 (62.7%) | 703 (56.4%) |
Disability Status by Sex by Age in Hardwick
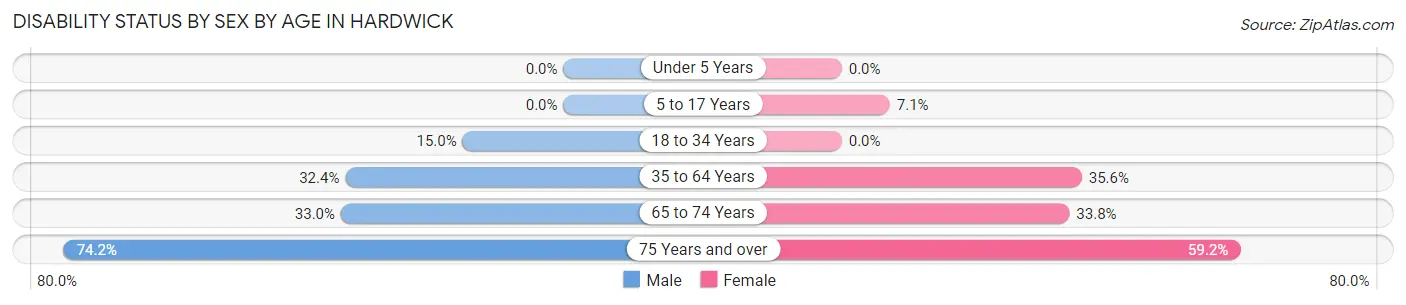
| Age Bracket | Male | Female |
| Under 5 Years | 0 (0.0%) | 0 (0.0%) |
| 5 to 17 Years | 0 (0.0%) | 4 (7.1%) |
| 18 to 34 Years | 25 (15.0%) | 0 (0.0%) |
| 35 to 64 Years | 46 (32.4%) | 36 (35.6%) |
| 65 to 74 Years | 38 (33.0%) | 48 (33.8%) |
| 75 Years and over | 23 (74.2%) | 42 (59.2%) |
Disability Class by Sex by Age in Hardwick
Disability Class: Hearing Difficulty
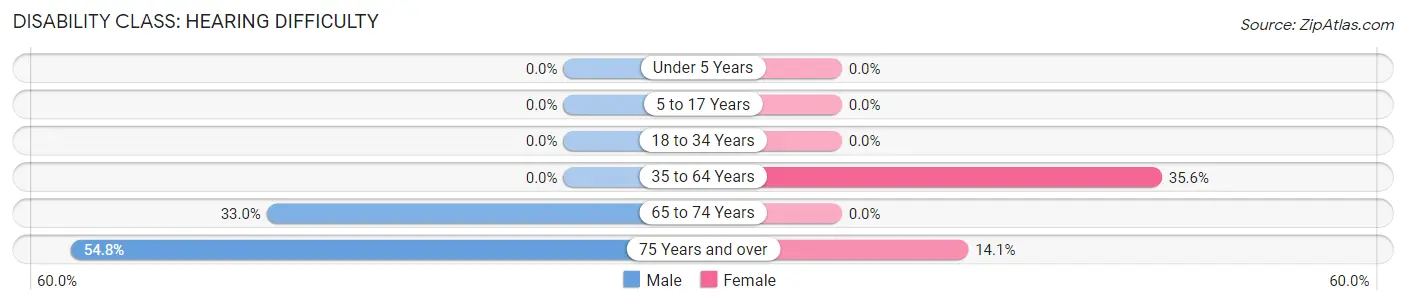
| Age Bracket | Male | Female |
| Under 5 Years | 0 (0.0%) | 0 (0.0%) |
| 5 to 17 Years | 0 (0.0%) | 0 (0.0%) |
| 18 to 34 Years | 0 (0.0%) | 0 (0.0%) |
| 35 to 64 Years | 0 (0.0%) | 36 (35.6%) |
| 65 to 74 Years | 38 (33.0%) | 0 (0.0%) |
| 75 Years and over | 17 (54.8%) | 10 (14.1%) |
Disability Class: Vision Difficulty
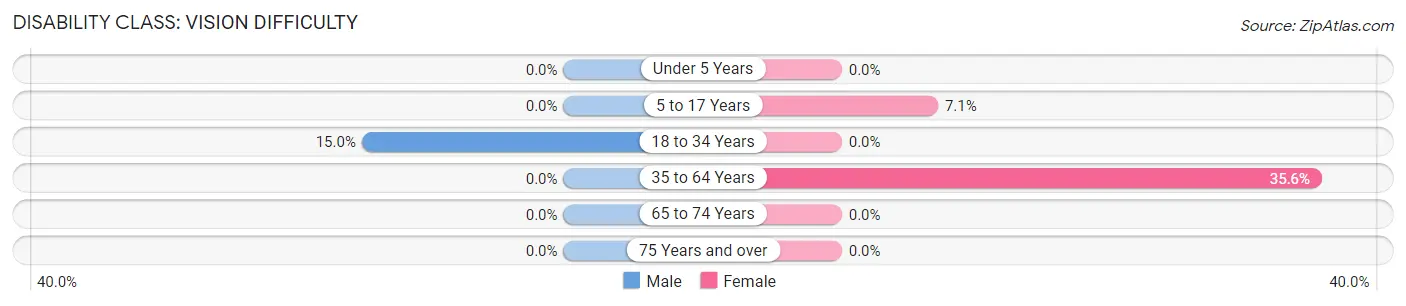
| Age Bracket | Male | Female |
| Under 5 Years | 0 (0.0%) | 0 (0.0%) |
| 5 to 17 Years | 0 (0.0%) | 4 (7.1%) |
| 18 to 34 Years | 25 (15.0%) | 0 (0.0%) |
| 35 to 64 Years | 0 (0.0%) | 36 (35.6%) |
| 65 to 74 Years | 0 (0.0%) | 0 (0.0%) |
| 75 Years and over | 0 (0.0%) | 0 (0.0%) |
Disability Class: Cognitive Difficulty
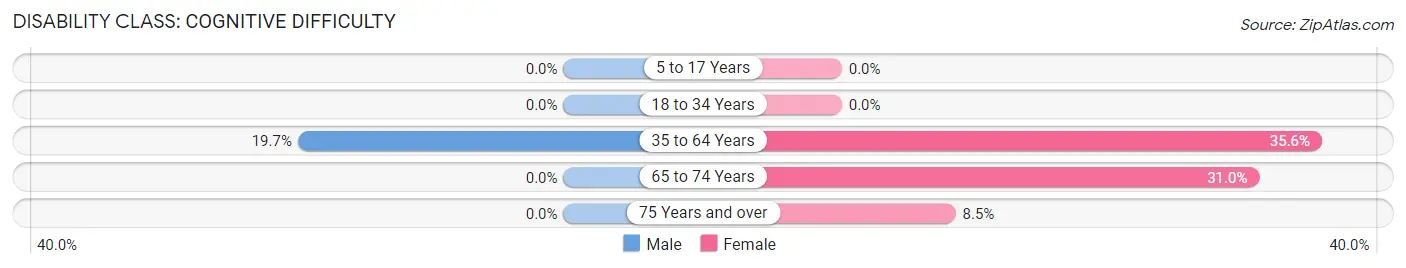
| Age Bracket | Male | Female |
| 5 to 17 Years | 0 (0.0%) | 0 (0.0%) |
| 18 to 34 Years | 0 (0.0%) | 0 (0.0%) |
| 35 to 64 Years | 28 (19.7%) | 36 (35.6%) |
| 65 to 74 Years | 0 (0.0%) | 44 (31.0%) |
| 75 Years and over | 0 (0.0%) | 6 (8.5%) |
Disability Class: Ambulatory Difficulty
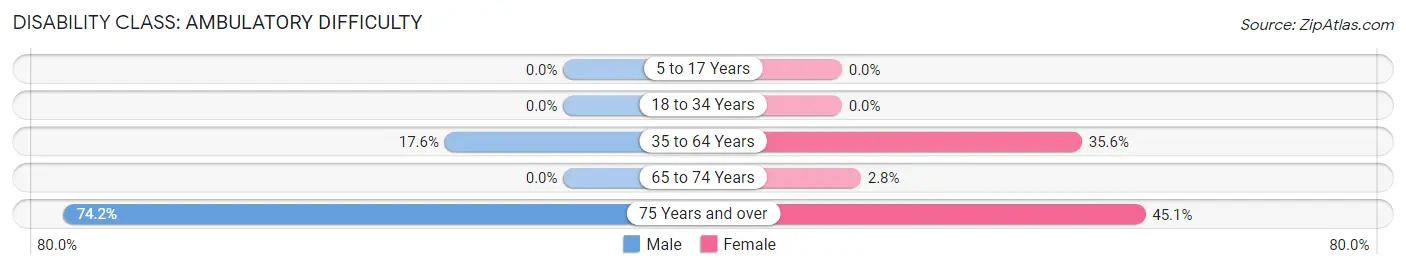
| Age Bracket | Male | Female |
| 5 to 17 Years | 0 (0.0%) | 0 (0.0%) |
| 18 to 34 Years | 0 (0.0%) | 0 (0.0%) |
| 35 to 64 Years | 25 (17.6%) | 36 (35.6%) |
| 65 to 74 Years | 0 (0.0%) | 4 (2.8%) |
| 75 Years and over | 23 (74.2%) | 32 (45.1%) |
Disability Class: Self-Care Difficulty
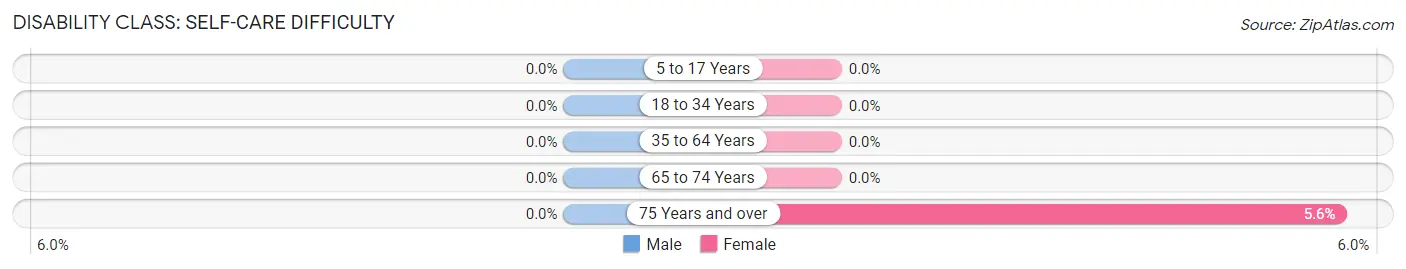
| Age Bracket | Male | Female |
| 5 to 17 Years | 0 (0.0%) | 0 (0.0%) |
| 18 to 34 Years | 0 (0.0%) | 0 (0.0%) |
| 35 to 64 Years | 0 (0.0%) | 0 (0.0%) |
| 65 to 74 Years | 0 (0.0%) | 0 (0.0%) |
| 75 Years and over | 0 (0.0%) | 4 (5.6%) |
Technology Access in Hardwick
Computing Device Access in Hardwick
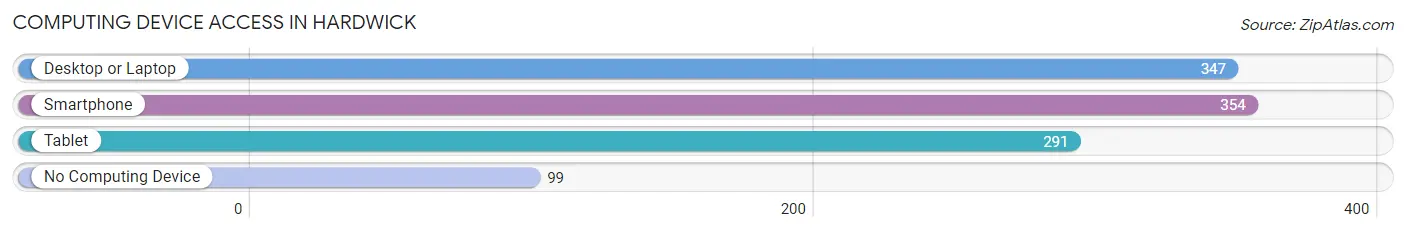
| Device Type | # Households | % Households |
| Desktop or Laptop | 347 | 62.7% |
| Smartphone | 354 | 64.0% |
| Tablet | 291 | 52.6% |
| No Computing Device | 99 | 17.9% |
| Total | 553 | 100.0% |
Internet Access in Hardwick
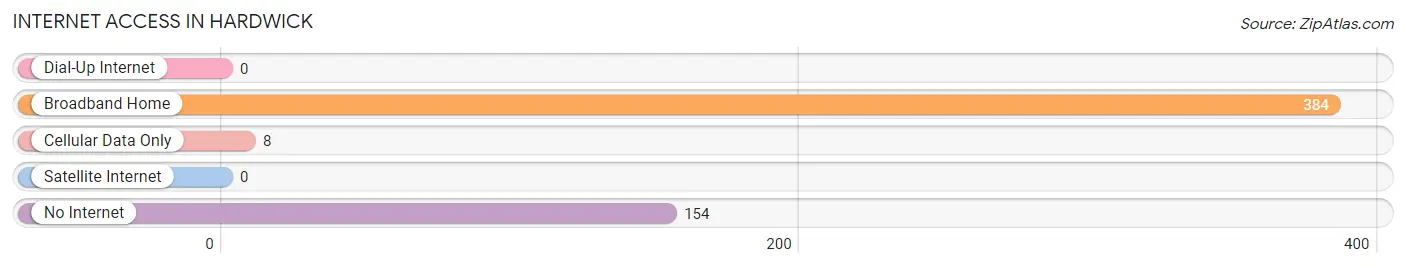
| Internet Type | # Households | % Households |
| Dial-Up Internet | 0 | 0.0% |
| Broadband Home | 384 | 69.4% |
| Cellular Data Only | 8 | 1.5% |
| Satellite Internet | 0 | 0.0% |
| No Internet | 154 | 27.9% |
| Total | 553 | 100.0% |
Hardwick Summary
History
Hardwick, Vermont is a small town located in the northeast corner of the state. It was first settled in 1780 by a group of settlers from Massachusetts. The town was named after the Hardwick family, who were among the first settlers. The town was incorporated in 1781 and has remained a small, rural community ever since.
The town has a rich history of farming and industry. In the early 19th century, the town was home to several sawmills, gristmills, and tanneries. The town also had a thriving dairy industry, with several local farms producing milk and cheese. In the late 19th century, the town was home to several marble quarries, which provided the stone for many of the buildings in the area.
The town has also been home to several notable people, including former Vermont Governor and U.S. Senator George Aiken, who was born in Hardwick in 1892. The town is also home to the Hardwick Historical Society, which was founded in 1891 and is dedicated to preserving the town’s history.
Geography
Hardwick is located in the northeast corner of Vermont, in Caledonia County. The town is bordered by the towns of Greensboro to the north, Walden to the east, Stannard to the south, and Craftsbury to the west. The town is situated in a rural area, with rolling hills and forests. The town is located in the Lamoille River Valley, and the Lamoille River runs through the town.
The town has a total area of 33.2 square miles, of which 32.9 square miles is land and 0.3 square miles is water. The highest point in the town is the summit of Bald Hill, which has an elevation of 1,890 feet.
Economy
The economy of Hardwick is largely based on agriculture and tourism. The town is home to several dairy farms, which produce milk and cheese for local consumption. The town is also home to several small businesses, including a brewery, a winery, and a distillery.
The town is also home to several tourist attractions, including the Hardwick Historical Society, the Hardwick Farmers’ Market, and the Hardwick Country Store. The town is also home to several outdoor recreation areas, including the Lamoille River Valley State Park and the Hardwick Mountain State Forest.
Demographics
As of the 2010 census, the town had a population of 2,521. The racial makeup of the town was 97.2% White, 0.4% African American, 0.3% Native American, 0.3% Asian, 0.1% Pacific Islander, 0.3% from other races, and 1.4% from two or more races. Hispanic or Latino of any race were 1.2% of the population.
The median income for a household in the town was $41,944, and the median income for a family was $50,000. The per capita income for the town was $20,945. About 8.3% of families and 11.2% of the population were below the poverty line, including 14.2% of those under age 18 and 8.2% of those age 65 or over.
Common Questions
What is Per Capita Income in Hardwick?
Per Capita income in Hardwick is $31,453.
What is the Median Family Income in Hardwick?
Median Family Income in Hardwick is $77,891.
What is the Median Household income in Hardwick?
Median Household Income in Hardwick is $57,798.
What is Income or Wage Gap in Hardwick?
Income or Wage Gap in Hardwick is 40.5%.
Women in Hardwick earn 59.5 cents for every dollar earned by a man.
What is Inequality or Gini Index in Hardwick?
Inequality or Gini Index in Hardwick is 0.38.
What is the Total Population of Hardwick?
Total Population of Hardwick is 1,247.
What is the Total Male Population of Hardwick?
Total Male Population of Hardwick is 576.
What is the Total Female Population of Hardwick?
Total Female Population of Hardwick is 671.
What is the Ratio of Males per 100 Females in Hardwick?
There are 85.84 Males per 100 Females in Hardwick.
What is the Ratio of Females per 100 Males in Hardwick?
There are 116.49 Females per 100 Males in Hardwick.
What is the Median Population Age in Hardwick?
Median Population Age in Hardwick is 34.1 Years.
What is the Average Family Size in Hardwick
Average Family Size in Hardwick is 2.9 People.
What is the Average Household Size in Hardwick
Average Household Size in Hardwick is 2.2 People.
How Large is the Labor Force in Hardwick?
There are 638 People in the Labor Forcein in Hardwick.
What is the Percentage of People in the Labor Force in Hardwick?
61.8% of People are in the Labor Force in Hardwick.
What is the Unemployment Rate in Hardwick?
Unemployment Rate in Hardwick is 1.6%.