Hamilton, ND Map & Demographics
Hamilton Map
Hamilton Overview
$44,420
PER CAPITA INCOME
$101,250
AVG FAMILY INCOME
$87,813
AVG HOUSEHOLD INCOME
0.29
INEQUALITY / GINI INDEX
30
TOTAL POPULATION
16
MALE POPULATION
14
FEMALE POPULATION
114.29
MALES / 100 FEMALES
87.50
FEMALES / 100 MALES
62.7
MEDIAN AGE
2.2
AVG FAMILY SIZE
1.8
AVG HOUSEHOLD SIZE
21
LABOR FORCE [ PEOPLE ]
72.4%
PERCENT IN LABOR FORCE
Hamilton Zip Codes
Hamilton Area Codes
Income in Hamilton
Income Overview in Hamilton
Per Capita Income in Hamilton is $44,420, while median incomes of families and households are $101,250 and $87,813 respectively.
| Characteristic | Number | Measure |
| Per Capita Income | 30 | $44,420 |
| Median Family Income | 10 | $101,250 |
| Mean Family Income | 10 | $86,680 |
| Median Household Income | 17 | $87,813 |
| Mean Household Income | 17 | $75,488 |
| Income Deficit | 10 | $0 |
| Wage / Income Gap (%) | 30 | 0.00% |
| Wage / Income Gap ($) | 30 | 100.00¢ per $1 |
| Gini / Inequality Index | 30 | 0.29 |
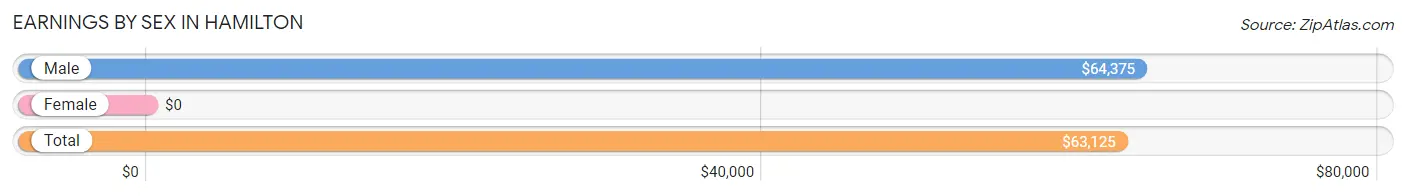
Earnings by Sex in Hamilton
| Sex | Number | Average Earnings |
| Male | 13 (61.9%) | $64,375 |
| Female | 8 (38.1%) | $0 |
| Total | 21 (100.0%) | $63,125 |
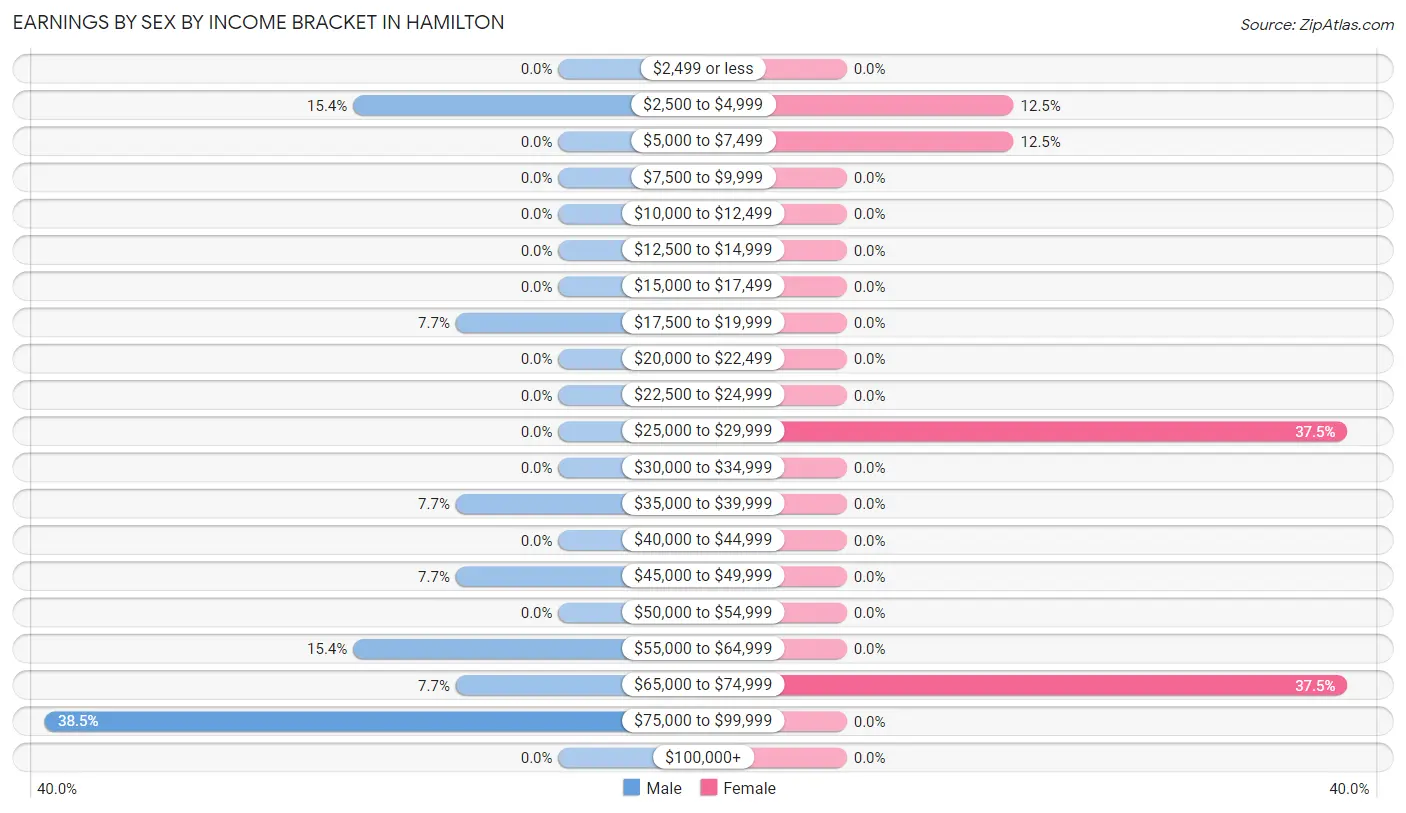
Earnings by Sex by Income Bracket in Hamilton
The most common earnings brackets in Hamilton are $75,000 to $99,999 for men (5 | 38.5%) and $25,000 to $29,999 for women (3 | 37.5%).
| Income | Male | Female |
| $2,499 or less | 0 (0.0%) | 0 (0.0%) |
| $2,500 to $4,999 | 2 (15.4%) | 1 (12.5%) |
| $5,000 to $7,499 | 0 (0.0%) | 1 (12.5%) |
| $7,500 to $9,999 | 0 (0.0%) | 0 (0.0%) |
| $10,000 to $12,499 | 0 (0.0%) | 0 (0.0%) |
| $12,500 to $14,999 | 0 (0.0%) | 0 (0.0%) |
| $15,000 to $17,499 | 0 (0.0%) | 0 (0.0%) |
| $17,500 to $19,999 | 1 (7.7%) | 0 (0.0%) |
| $20,000 to $22,499 | 0 (0.0%) | 0 (0.0%) |
| $22,500 to $24,999 | 0 (0.0%) | 0 (0.0%) |
| $25,000 to $29,999 | 0 (0.0%) | 3 (37.5%) |
| $30,000 to $34,999 | 0 (0.0%) | 0 (0.0%) |
| $35,000 to $39,999 | 1 (7.7%) | 0 (0.0%) |
| $40,000 to $44,999 | 0 (0.0%) | 0 (0.0%) |
| $45,000 to $49,999 | 1 (7.7%) | 0 (0.0%) |
| $50,000 to $54,999 | 0 (0.0%) | 0 (0.0%) |
| $55,000 to $64,999 | 2 (15.4%) | 0 (0.0%) |
| $65,000 to $74,999 | 1 (7.7%) | 3 (37.5%) |
| $75,000 to $99,999 | 5 (38.5%) | 0 (0.0%) |
| $100,000+ | 0 (0.0%) | 0 (0.0%) |
| Total | 13 (100.0%) | 8 (100.0%) |
Earnings by Sex by Educational Attainment in Hamilton
| Educational Attainment | Male Income | Female Income |
| Less than High School | - | - |
| High School Diploma | - | - |
| College or Associate's Degree | - | - |
| Bachelor's Degree | - | - |
| Graduate Degree | - | - |
| Total | $64,375 | $0 |
Family Income in Hamilton
Family Income Brackets in Hamilton
According to the Hamilton family income data, there are 5 families falling into the $100,000 to $149,999 income range, which is the most common income bracket and makes up 50.0% of all families.
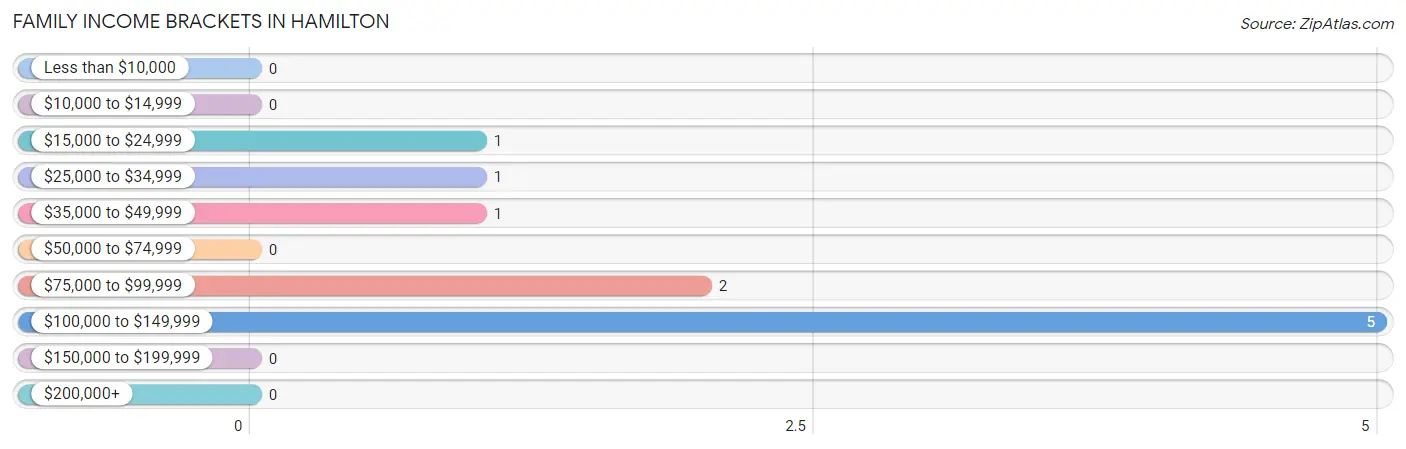
| Income Bracket | # Families | % Families |
| Less than $10,000 | 0 | 0.0% |
| $10,000 to $14,999 | 0 | 0.0% |
| $15,000 to $24,999 | 1 | 10.0% |
| $25,000 to $34,999 | 1 | 10.0% |
| $35,000 to $49,999 | 1 | 10.0% |
| $50,000 to $74,999 | 0 | 0.0% |
| $75,000 to $99,999 | 2 | 20.0% |
| $100,000 to $149,999 | 5 | 50.0% |
| $150,000 to $199,999 | 0 | 0.0% |
| $200,000+ | 0 | 0.0% |
Family Income by Famaliy Size in Hamilton
2-person families (10 | 100.0%) account for the highest median family income in Hamilton with $101,250 per family, while 2-person families (10 | 100.0%) have the highest median income of $50,625 per family member.
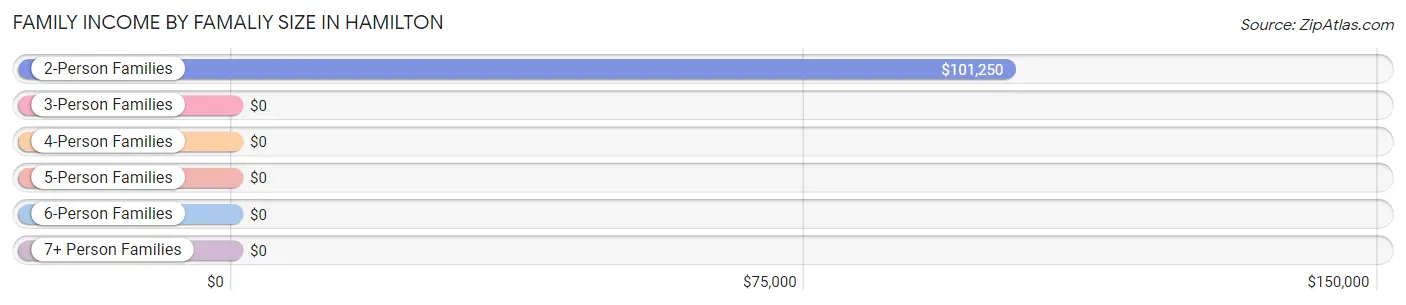
| Income Bracket | # Families | Median Income |
| 2-Person Families | 10 (100.0%) | $101,250 |
| 3-Person Families | 0 (0.0%) | $0 |
| 4-Person Families | 0 (0.0%) | $0 |
| 5-Person Families | 0 (0.0%) | $0 |
| 6-Person Families | 0 (0.0%) | $0 |
| 7+ Person Families | 0 (0.0%) | $0 |
| Total | 10 (100.0%) | $101,250 |
Family Income by Number of Earners in Hamilton
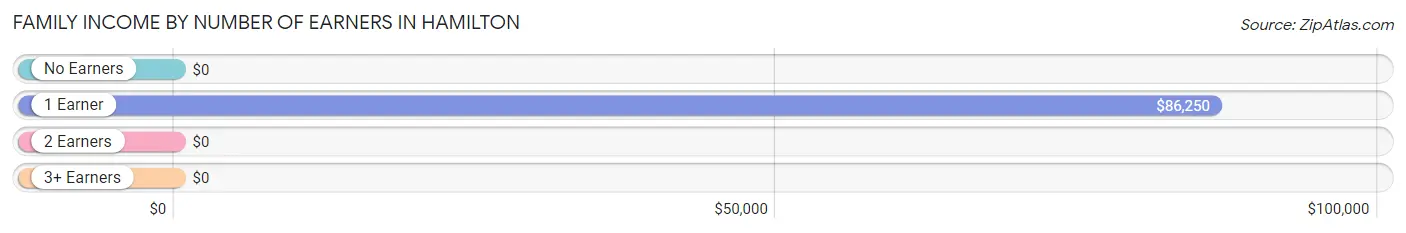
| Number of Earners | # Families | Median Income |
| No Earners | 2 (20.0%) | $0 |
| 1 Earner | 3 (30.0%) | $86,250 |
| 2 Earners | 5 (50.0%) | $0 |
| 3+ Earners | 0 (0.0%) | $0 |
| Total | 10 (100.0%) | $101,250 |
Household Income in Hamilton
Household Income Brackets in Hamilton
With 5 households falling in the category, the $75,000 to $99,999 income range is the most frequent in Hamilton, accounting for 29.4% of all households.
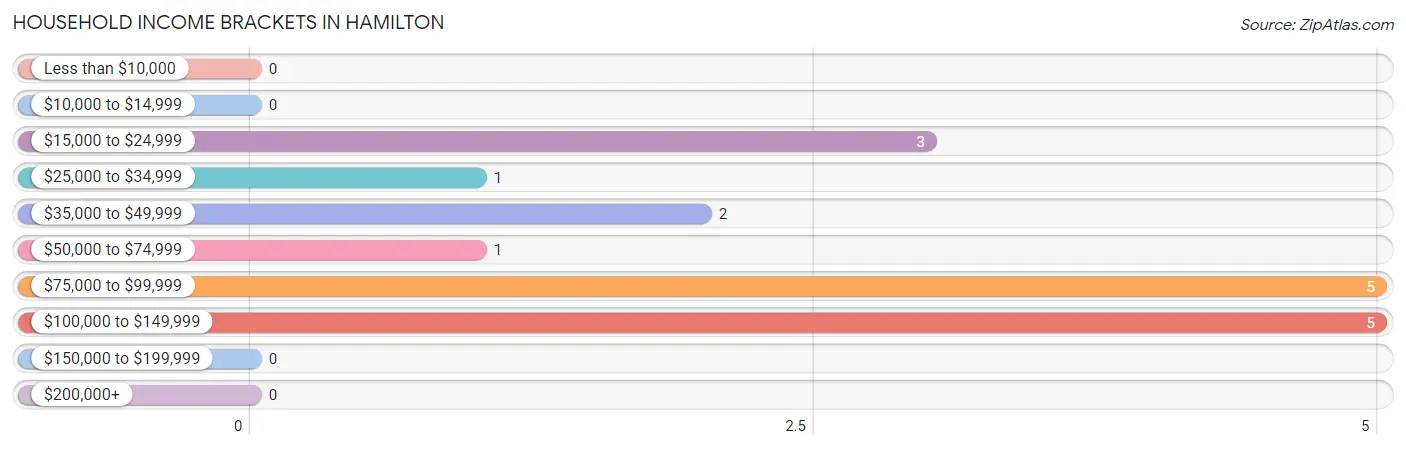
| Income Bracket | # Households | % Households |
| Less than $10,000 | 0 | 0.0% |
| $10,000 to $14,999 | 0 | 0.0% |
| $15,000 to $24,999 | 3 | 17.6% |
| $25,000 to $34,999 | 1 | 5.9% |
| $35,000 to $49,999 | 2 | 11.8% |
| $50,000 to $74,999 | 1 | 5.9% |
| $75,000 to $99,999 | 5 | 29.4% |
| $100,000 to $149,999 | 5 | 29.4% |
| $150,000 to $199,999 | 0 | 0.0% |
| $200,000+ | 0 | 0.0% |
Household Income by Householder Age in Hamilton
The median household income in Hamilton is $87,813, with the highest median household income of $101,250 found in the 45 to 64 years age bracket for the primary householder. A total of 8 households (47.1%) fall into this category.
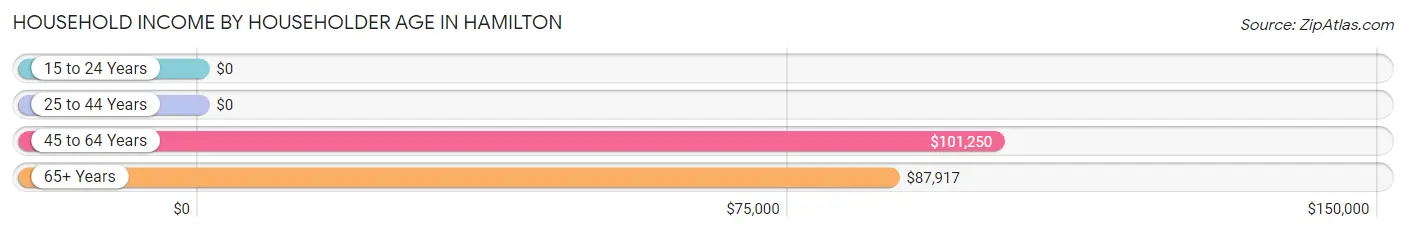
| Income Bracket | # Households | Median Income |
| 15 to 24 Years | 0 (0.0%) | $0 |
| 25 to 44 Years | 2 (11.8%) | $0 |
| 45 to 64 Years | 8 (47.1%) | $101,250 |
| 65+ Years | 7 (41.2%) | $87,917 |
| Total | 17 (100.0%) | $87,813 |
Poverty in Hamilton
Income Below Poverty by Sex and Age in Hamilton
With 12.5% poverty level for males and 14.3% for females among the residents of Hamilton, 55 to 64 year old males and 25 to 34 year old females are the most vulnerable to poverty, with 2 males (22.2%) and 1 females (100.0%) in their respective age groups living below the poverty level.
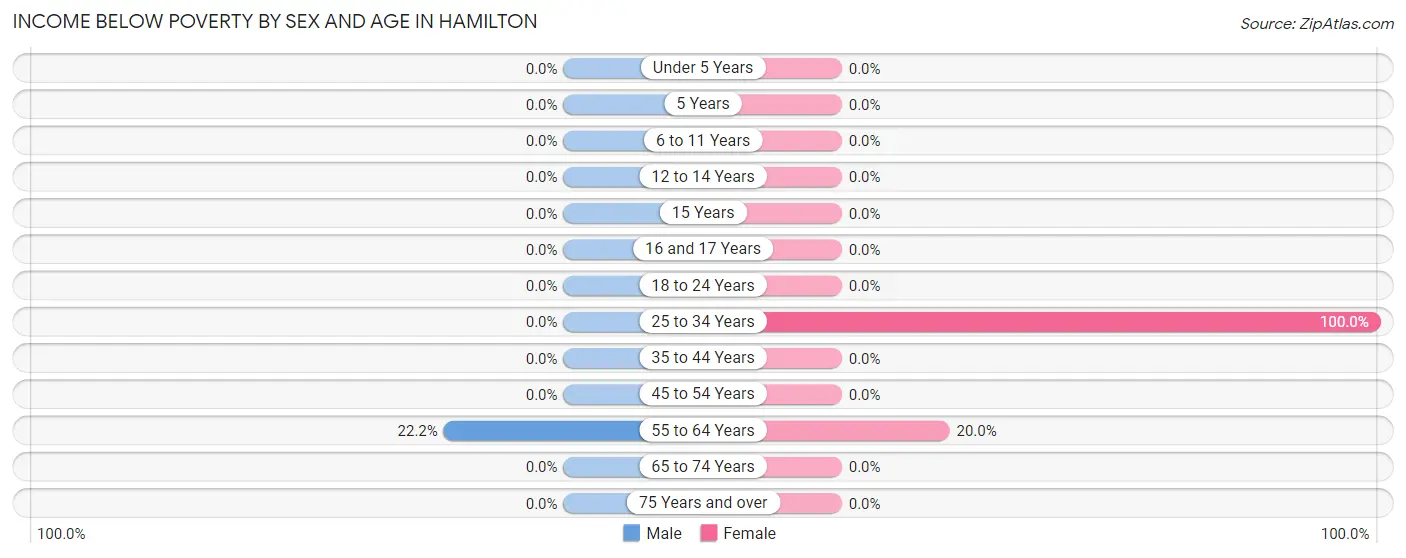
| Age Bracket | Male | Female |
| Under 5 Years | 0 (0.0%) | 0 (0.0%) |
| 5 Years | 0 (0.0%) | 0 (0.0%) |
| 6 to 11 Years | 0 (0.0%) | 0 (0.0%) |
| 12 to 14 Years | 0 (0.0%) | 0 (0.0%) |
| 15 Years | 0 (0.0%) | 0 (0.0%) |
| 16 and 17 Years | 0 (0.0%) | 0 (0.0%) |
| 18 to 24 Years | 0 (0.0%) | 0 (0.0%) |
| 25 to 34 Years | 0 (0.0%) | 1 (100.0%) |
| 35 to 44 Years | 0 (0.0%) | 0 (0.0%) |
| 45 to 54 Years | 0 (0.0%) | 0 (0.0%) |
| 55 to 64 Years | 2 (22.2%) | 1 (20.0%) |
| 65 to 74 Years | 0 (0.0%) | 0 (0.0%) |
| 75 Years and over | 0 (0.0%) | 0 (0.0%) |
| Total | 2 (12.5%) | 2 (14.3%) |
Income Above Poverty by Sex and Age in Hamilton
According to the poverty statistics in Hamilton, males aged 25 to 34 years and females aged under 5 years are the age groups that are most secure financially, with 100.0% of males and 100.0% of females in these age groups living above the poverty line.
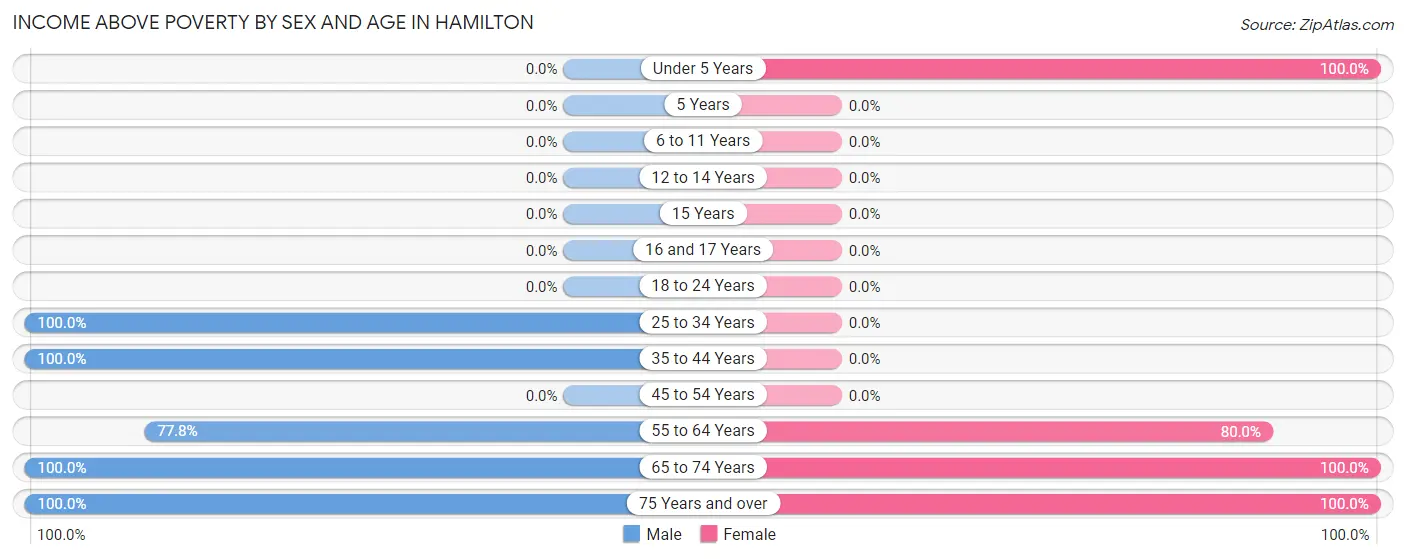
| Age Bracket | Male | Female |
| Under 5 Years | 0 (0.0%) | 1 (100.0%) |
| 5 Years | 0 (0.0%) | 0 (0.0%) |
| 6 to 11 Years | 0 (0.0%) | 0 (0.0%) |
| 12 to 14 Years | 0 (0.0%) | 0 (0.0%) |
| 15 Years | 0 (0.0%) | 0 (0.0%) |
| 16 and 17 Years | 0 (0.0%) | 0 (0.0%) |
| 18 to 24 Years | 0 (0.0%) | 0 (0.0%) |
| 25 to 34 Years | 2 (100.0%) | 0 (0.0%) |
| 35 to 44 Years | 2 (100.0%) | 0 (0.0%) |
| 45 to 54 Years | 0 (0.0%) | 0 (0.0%) |
| 55 to 64 Years | 7 (77.8%) | 4 (80.0%) |
| 65 to 74 Years | 1 (100.0%) | 6 (100.0%) |
| 75 Years and over | 2 (100.0%) | 1 (100.0%) |
| Total | 14 (87.5%) | 12 (85.7%) |
Income Below Poverty Among Married-Couple Families in Hamilton
The poverty statistics for married-couple families in Hamilton show that 12.5% or 1 of the total 8 families live below the poverty line. Families with no children have the highest poverty rate of 12.5%, comprising of 1 families. On the other hand, families with no children have the lowest poverty rate of 12.5%, which includes 1 families.
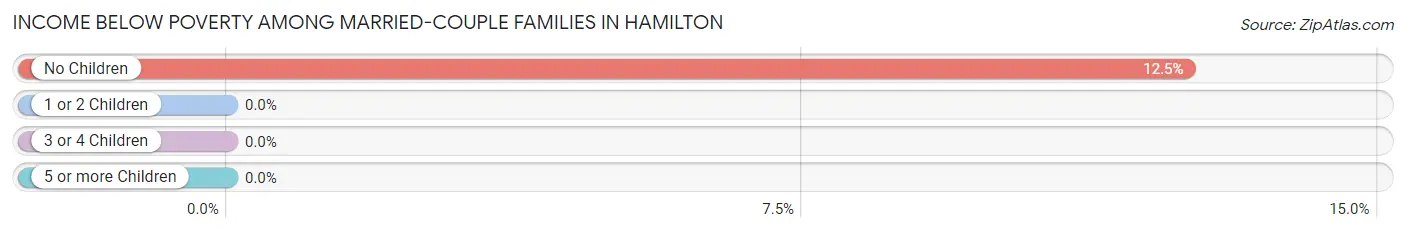
| Children | Above Poverty | Below Poverty |
| No Children | 7 (87.5%) | 1 (12.5%) |
| 1 or 2 Children | 0 (0.0%) | 0 (0.0%) |
| 3 or 4 Children | 0 (0.0%) | 0 (0.0%) |
| 5 or more Children | 0 (0.0%) | 0 (0.0%) |
| Total | 7 (87.5%) | 1 (12.5%) |
Income Below Poverty Among Single-Parent Households in Hamilton
| Children | Single Father | Single Mother |
| No Children | 0 (0.0%) | 0 (0.0%) |
| 1 or 2 Children | 0 (0.0%) | 0 (0.0%) |
| 3 or 4 Children | 0 (0.0%) | 0 (0.0%) |
| 5 or more Children | 0 (0.0%) | 0 (0.0%) |
| Total | 0 (0.0%) | 0 (0.0%) |
Income Below Poverty Among Married-Couple vs Single-Parent Households in Hamilton
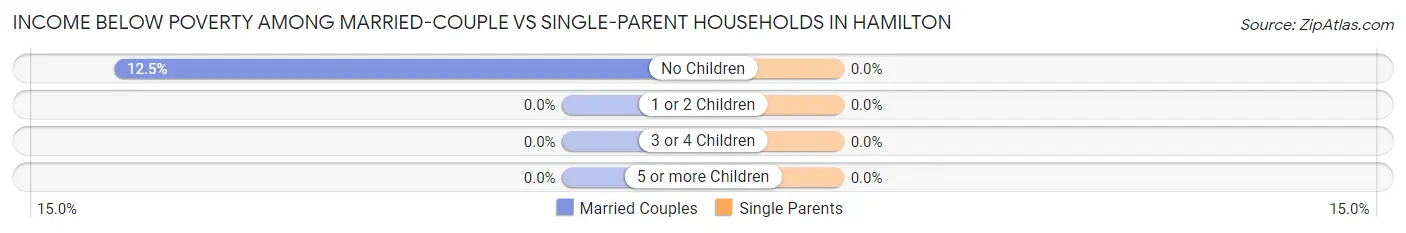
| Children | Married-Couple Families | Single-Parent Households |
| No Children | 1 (12.5%) | 0 (0.0%) |
| 1 or 2 Children | 0 (0.0%) | 0 (0.0%) |
| 3 or 4 Children | 0 (0.0%) | 0 (0.0%) |
| 5 or more Children | 0 (0.0%) | 0 (0.0%) |
| Total | 1 (12.5%) | 0 (0.0%) |
Race in Hamilton
The most populous races in Hamilton are , and White / Caucasian (30 | 100.0%).
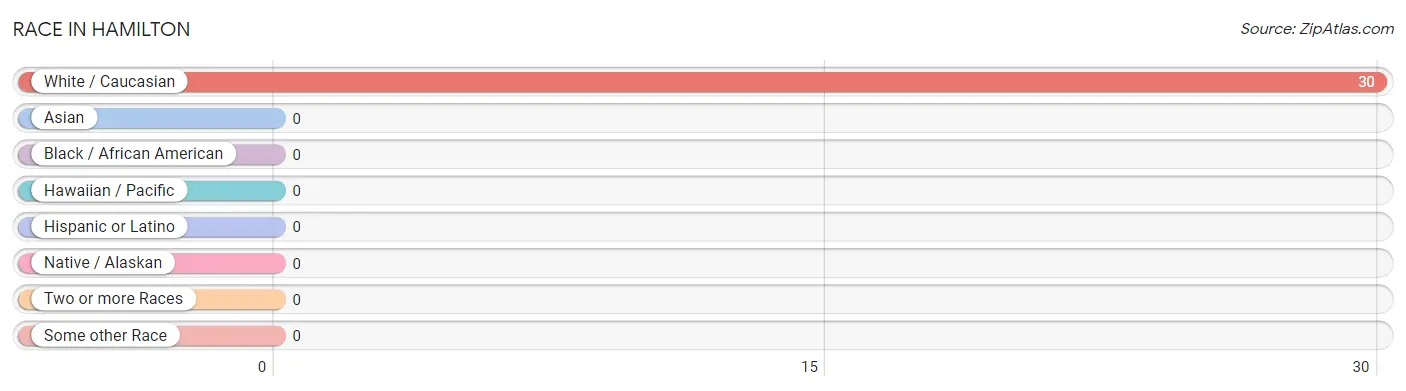
| Race | # Population | % Population |
| Asian | 0 | 0.0% |
| Black / African American | 0 | 0.0% |
| Hawaiian / Pacific | 0 | 0.0% |
| Hispanic or Latino | 0 | 0.0% |
| Native / Alaskan | 0 | 0.0% |
| White / Caucasian | 30 | 100.0% |
| Two or more Races | 0 | 0.0% |
| Some other Race | 0 | 0.0% |
| Total | 30 | 100.0% |
Ancestry in Hamilton
The most populous ancestries reported in Hamilton are Norwegian (9 | 30.0%), English (6 | 20.0%), Irish (5 | 16.7%), German (4 | 13.3%), and Scottish (4 | 13.3%), together accounting for 93.3% of all Hamilton residents.
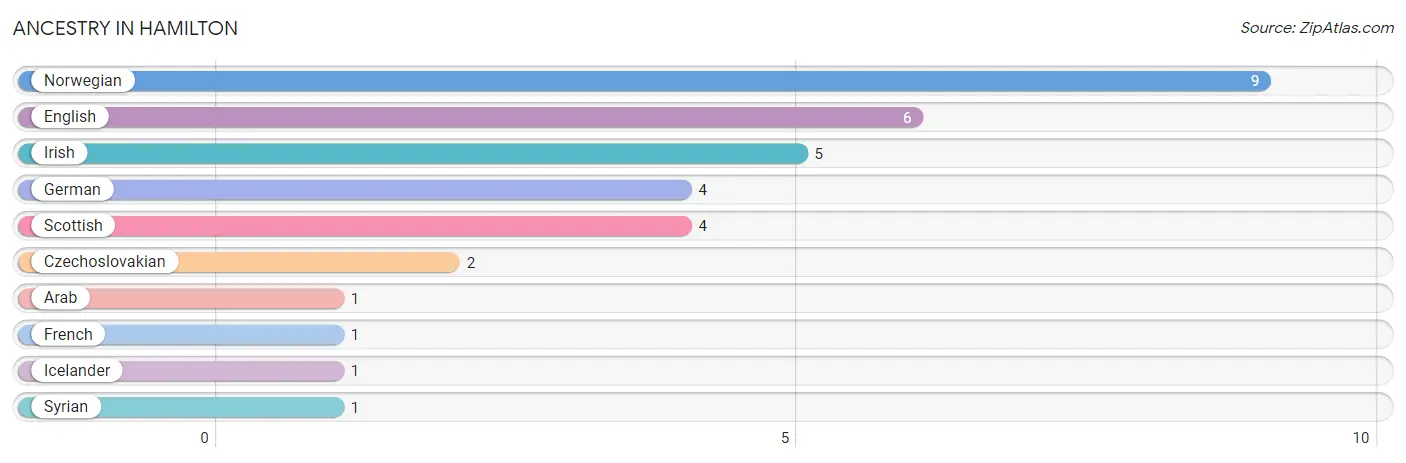
| Ancestry | # Population | % Population |
| Arab | 1 | 3.3% |
| Czechoslovakian | 2 | 6.7% |
| English | 6 | 20.0% |
| French | 1 | 3.3% |
| German | 4 | 13.3% |
| Icelander | 1 | 3.3% |
| Irish | 5 | 16.7% |
| Norwegian | 9 | 30.0% |
| Scottish | 4 | 13.3% |
| Syrian | 1 | 3.3% | View All 10 Rows |
Immigrants in Hamilton

| Immigration Origin | # Population | % Population | View All 0 Rows |
Sex and Age in Hamilton
Sex and Age in Hamilton
The most populous age groups in Hamilton are 55 to 59 Years (5 | 31.2%) for men and 60 to 64 Years (4 | 28.6%) for women.
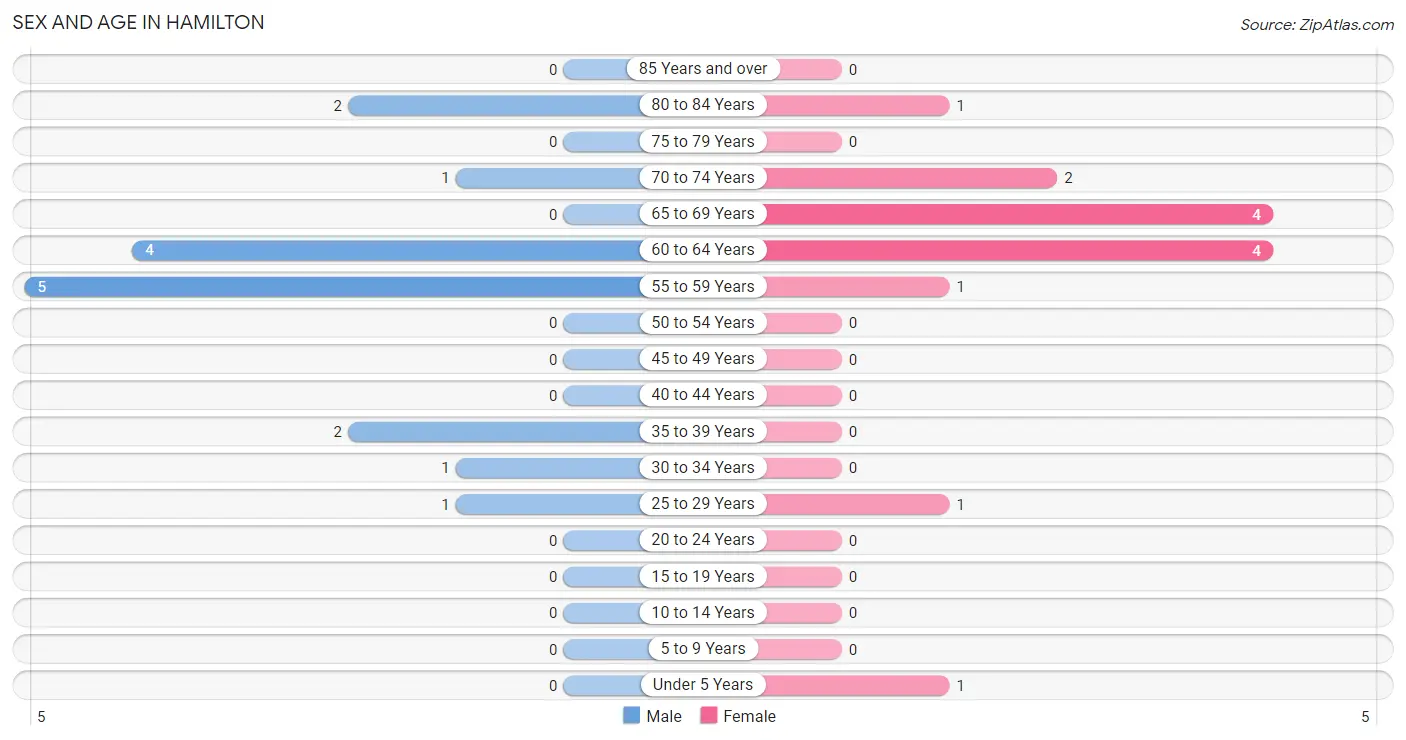
| Age Bracket | Male | Female |
| Under 5 Years | 0 (0.0%) | 1 (7.1%) |
| 5 to 9 Years | 0 (0.0%) | 0 (0.0%) |
| 10 to 14 Years | 0 (0.0%) | 0 (0.0%) |
| 15 to 19 Years | 0 (0.0%) | 0 (0.0%) |
| 20 to 24 Years | 0 (0.0%) | 0 (0.0%) |
| 25 to 29 Years | 1 (6.2%) | 1 (7.1%) |
| 30 to 34 Years | 1 (6.2%) | 0 (0.0%) |
| 35 to 39 Years | 2 (12.5%) | 0 (0.0%) |
| 40 to 44 Years | 0 (0.0%) | 0 (0.0%) |
| 45 to 49 Years | 0 (0.0%) | 0 (0.0%) |
| 50 to 54 Years | 0 (0.0%) | 0 (0.0%) |
| 55 to 59 Years | 5 (31.2%) | 1 (7.1%) |
| 60 to 64 Years | 4 (25.0%) | 4 (28.6%) |
| 65 to 69 Years | 0 (0.0%) | 4 (28.6%) |
| 70 to 74 Years | 1 (6.2%) | 2 (14.3%) |
| 75 to 79 Years | 0 (0.0%) | 0 (0.0%) |
| 80 to 84 Years | 2 (12.5%) | 1 (7.1%) |
| 85 Years and over | 0 (0.0%) | 0 (0.0%) |
| Total | 16 (100.0%) | 14 (100.0%) |
Families and Households in Hamilton
Median Family Size in Hamilton
The median family size in Hamilton is 2.20 persons per family, with single female/mother families (1 | 10.0%) accounting for the largest median family size of 3 persons per family. On the other hand, single male/father families (1 | 10.0%) represent the smallest median family size with 2.00 persons per family.
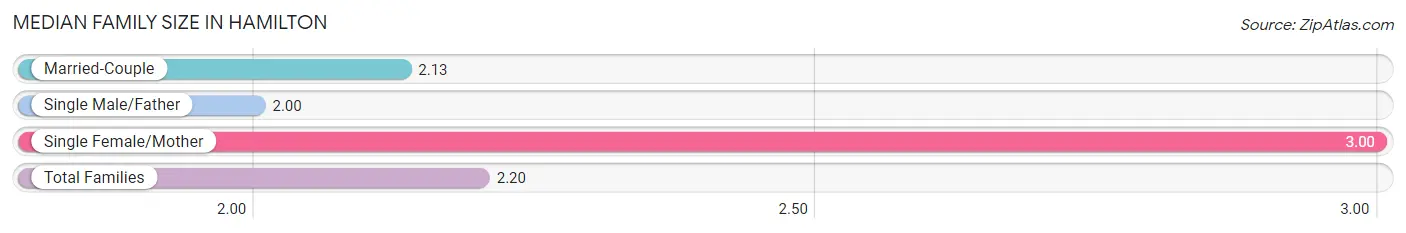
| Family Type | # Families | Family Size |
| Married-Couple | 8 (80.0%) | 2.13 |
| Single Male/Father | 1 (10.0%) | 2.00 |
| Single Female/Mother | 1 (10.0%) | 3.00 |
| Total Families | 10 (100.0%) | 2.20 |
Median Household Size in Hamilton
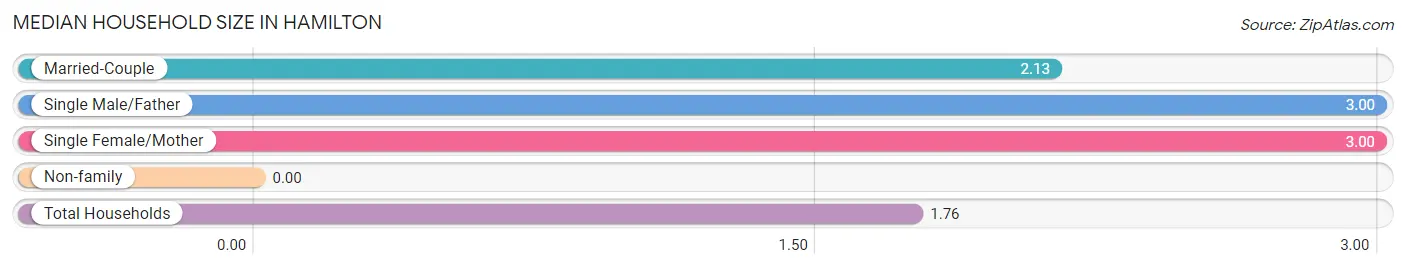
| Household Type | # Households | Household Size |
| Married-Couple | 8 (47.1%) | 2.13 |
| Single Male/Father | 1 (5.9%) | 3.00 |
| Single Female/Mother | 1 (5.9%) | 3.00 |
| Non-family | 7 (41.2%) | - |
| Total Households | 17 (100.0%) | 1.76 |
Household Size by Marriage Status in Hamilton
Out of a total of 17 households in Hamilton, 10 (58.8%) are family households, while 7 (41.2%) are nonfamily households. The most numerous type of family households are 2-person households, comprising 9, and the most common type of nonfamily households are 1-person households, comprising 7.
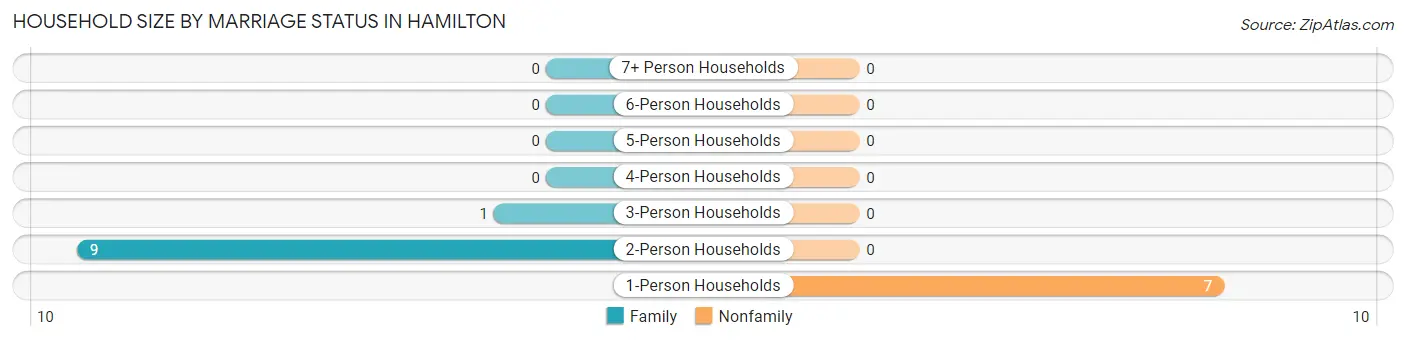
| Household Size | Family Households | Nonfamily Households |
| 1-Person Households | - | 7 (41.2%) |
| 2-Person Households | 9 (52.9%) | 0 (0.0%) |
| 3-Person Households | 1 (5.9%) | 0 (0.0%) |
| 4-Person Households | 0 (0.0%) | 0 (0.0%) |
| 5-Person Households | 0 (0.0%) | 0 (0.0%) |
| 6-Person Households | 0 (0.0%) | 0 (0.0%) |
| 7+ Person Households | 0 (0.0%) | 0 (0.0%) |
| Total | 10 (58.8%) | 7 (41.2%) |
Female Fertility in Hamilton
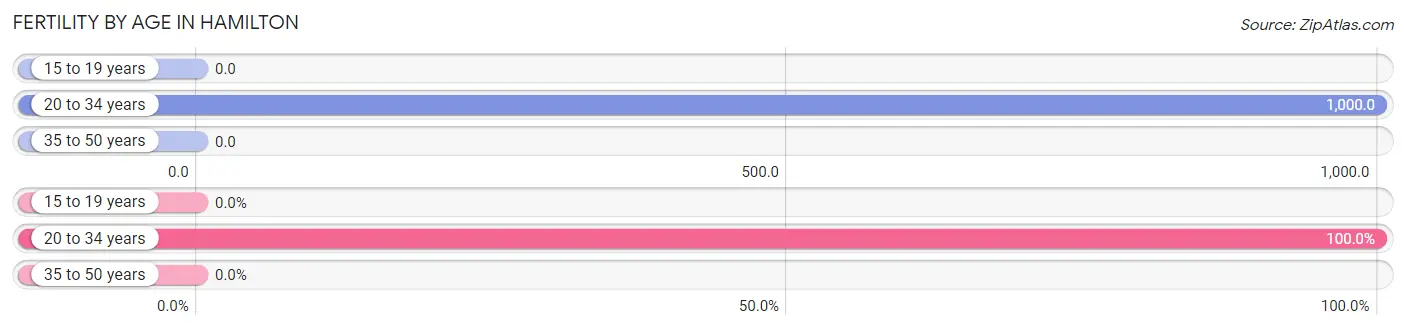
Fertility by Age in Hamilton
Average fertility rate in Hamilton is 1,000.0 births per 1,000 women. Women in the age bracket of 20 to 34 years have the highest fertility rate with 1,000.0 births per 1,000 women. Women in the age bracket of 20 to 34 years acount for 100.0% of all women with births.
| Age Bracket | Women with Births | Births / 1,000 Women |
| 15 to 19 years | 0 (0.0%) | 0.0 |
| 20 to 34 years | 1 (100.0%) | 1,000.0 |
| 35 to 50 years | 0 (0.0%) | 0.0 |
| Total | 1 (100.0%) | 1,000.0 |
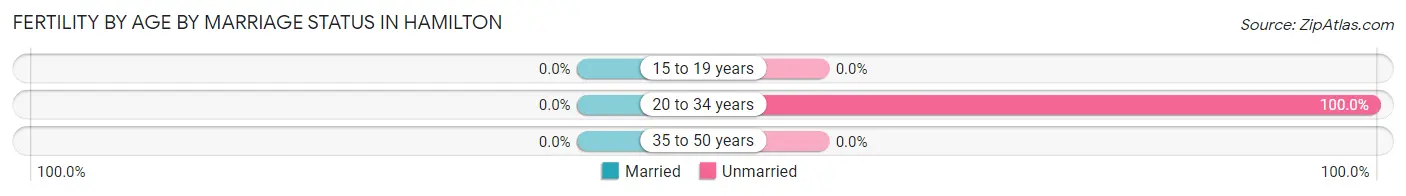
Fertility by Age by Marriage Status in Hamilton
| Age Bracket | Married | Unmarried |
| 15 to 19 years | 0 (0.0%) | 0 (0.0%) |
| 20 to 34 years | 0 (0.0%) | 1 (100.0%) |
| 35 to 50 years | 0 (0.0%) | 0 (0.0%) |
| Total | 0 (0.0%) | 1 (100.0%) |
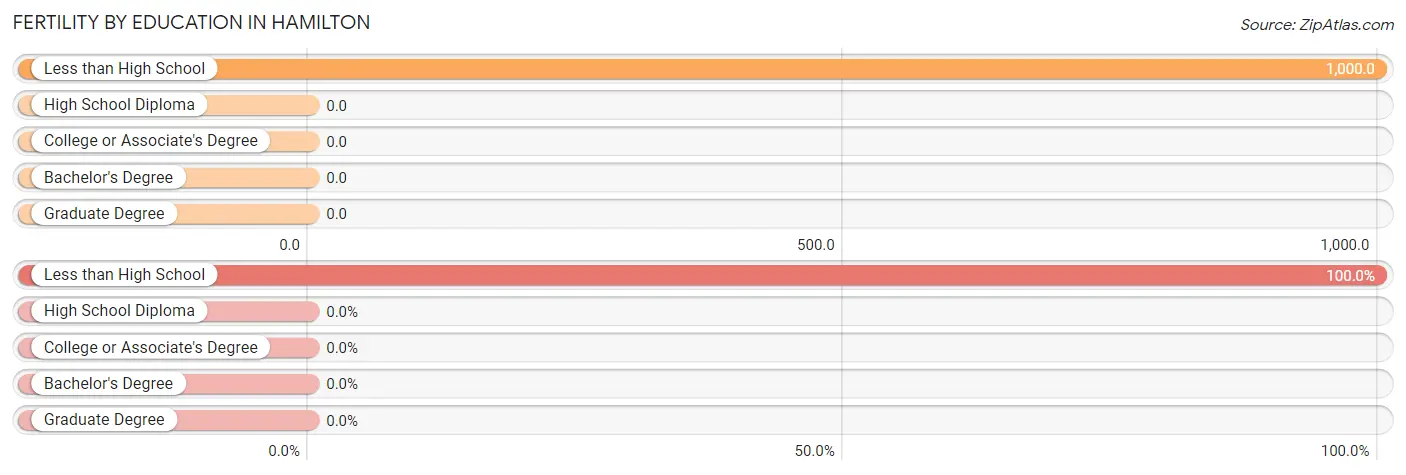
Fertility by Education in Hamilton
| Educational Attainment | Women with Births | Births / 1,000 Women |
| Less than High School | 1 (100.0%) | 1,000.0 |
| High School Diploma | 0 (0.0%) | 0.0 |
| College or Associate's Degree | 0 (0.0%) | 0.0 |
| Bachelor's Degree | 0 (0.0%) | 0.0 |
| Graduate Degree | 0 (0.0%) | 0.0 |
| Total | 1 (100.0%) | 1,000.0 |
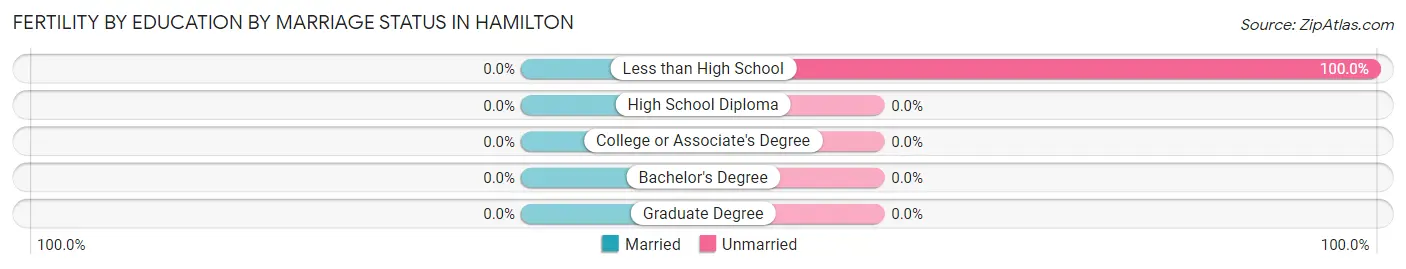
Fertility by Education by Marriage Status in Hamilton
| Educational Attainment | Married | Unmarried |
| Less than High School | 0 (0.0%) | 1 (100.0%) |
| High School Diploma | 0 (0.0%) | 0 (0.0%) |
| College or Associate's Degree | 0 (0.0%) | 0 (0.0%) |
| Bachelor's Degree | 0 (0.0%) | 0 (0.0%) |
| Graduate Degree | 0 (0.0%) | 0 (0.0%) |
| Total | 0 (0.0%) | 1 (100.0%) |
Employment Characteristics in Hamilton
Employment by Class of Employer in Hamilton
Among the 21 employed individuals in Hamilton, private company employees (17 | 80.9%), unpaid family workers (3 | 14.3%), and not-for-profit organizations (1 | 4.8%) make up the most common classes of employment.
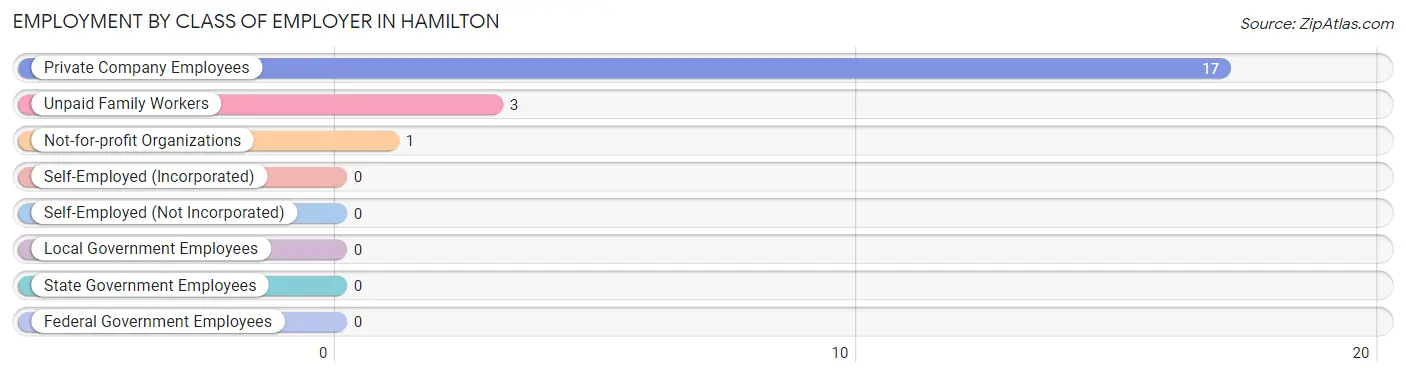
| Employer Class | # Employees | % Employees |
| Private Company Employees | 17 | 80.9% |
| Self-Employed (Incorporated) | 0 | 0.0% |
| Self-Employed (Not Incorporated) | 0 | 0.0% |
| Not-for-profit Organizations | 1 | 4.8% |
| Local Government Employees | 0 | 0.0% |
| State Government Employees | 0 | 0.0% |
| Federal Government Employees | 0 | 0.0% |
| Unpaid Family Workers | 3 | 14.3% |
| Total | 21 | 100.0% |
Employment Status by Age in Hamilton
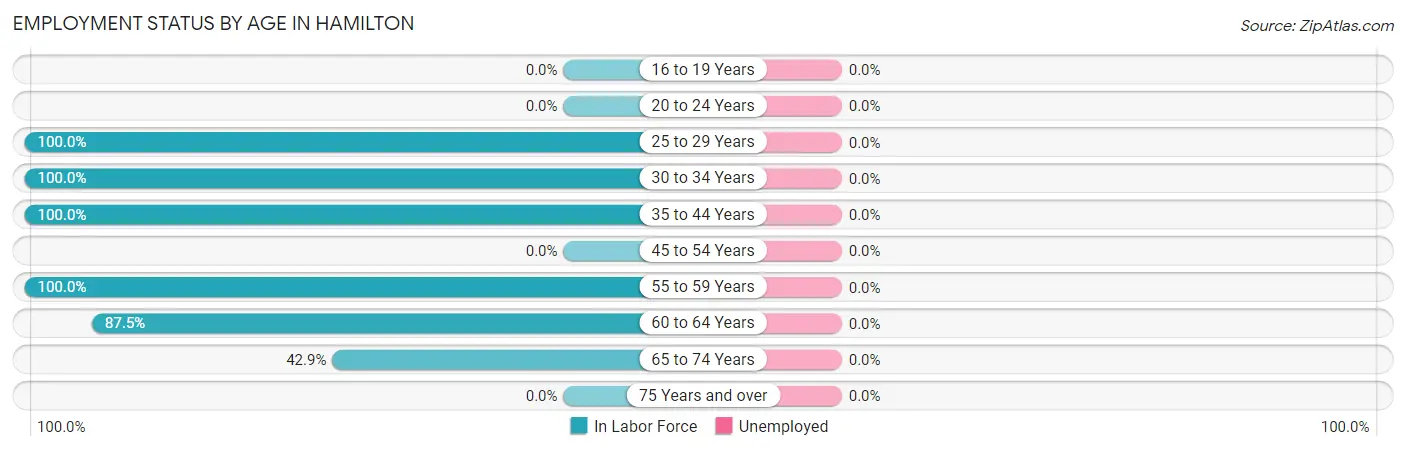
| Age Bracket | In Labor Force | Unemployed |
| 16 to 19 Years | 0 (0.0%) | 0 (0.0%) |
| 20 to 24 Years | 0 (0.0%) | 0 (0.0%) |
| 25 to 29 Years | 2 (100.0%) | 0 (0.0%) |
| 30 to 34 Years | 1 (100.0%) | 0 (0.0%) |
| 35 to 44 Years | 2 (100.0%) | 0 (0.0%) |
| 45 to 54 Years | 0 (0.0%) | 0 (0.0%) |
| 55 to 59 Years | 6 (100.0%) | 0 (0.0%) |
| 60 to 64 Years | 7 (87.5%) | 0 (0.0%) |
| 65 to 74 Years | 3 (42.9%) | 0 (0.0%) |
| 75 Years and over | 0 (0.0%) | 0 (0.0%) |
| Total | 21 (72.4%) | 0 (0.0%) |
Employment Status by Educational Attainment in Hamilton
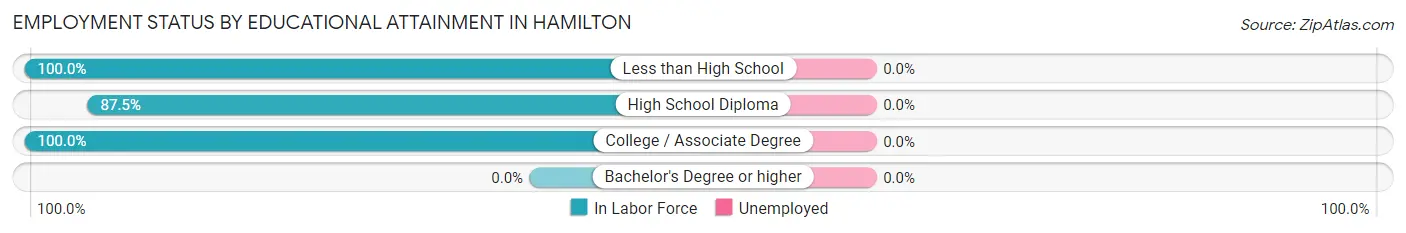
| Educational Attainment | In Labor Force | Unemployed |
| Less than High School | 1 (100.0%) | 0 (0.0%) |
| High School Diploma | 7 (87.5%) | 0 (0.0%) |
| College / Associate Degree | 10 (100.0%) | 0 (0.0%) |
| Bachelor's Degree or higher | 0 (0.0%) | 0 (0.0%) |
| Total | 18 (94.7%) | 0 (0.0%) |
Employment Occupations by Sex in Hamilton
Management, Business, Science and Arts Occupations
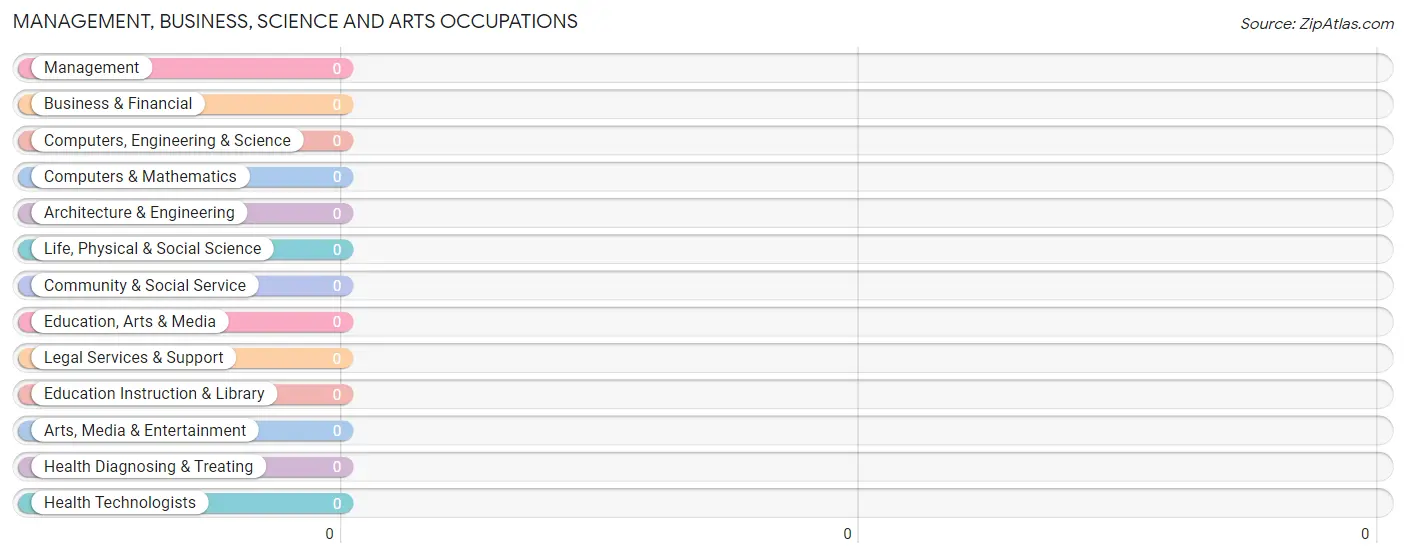
Management, Business, Science and Arts Occupations by Sex
| Occupation | Male | Female |
| Management | 0 (0.0%) | 0 (0.0%) |
| Business & Financial | 0 (0.0%) | 0 (0.0%) |
| Computers, Engineering & Science | 0 (0.0%) | 0 (0.0%) |
| Computers & Mathematics | 0 (0.0%) | 0 (0.0%) |
| Architecture & Engineering | 0 (0.0%) | 0 (0.0%) |
| Life, Physical & Social Science | 0 (0.0%) | 0 (0.0%) |
| Community & Social Service | 0 (0.0%) | 0 (0.0%) |
| Education, Arts & Media | 0 (0.0%) | 0 (0.0%) |
| Legal Services & Support | 0 (0.0%) | 0 (0.0%) |
| Education Instruction & Library | 0 (0.0%) | 0 (0.0%) |
| Arts, Media & Entertainment | 0 (0.0%) | 0 (0.0%) |
| Health Diagnosing & Treating | 0 (0.0%) | 0 (0.0%) |
| Health Technologists | 0 (0.0%) | 0 (0.0%) |
| Total (Category) | 0 (0.0%) | 0 (0.0%) |
| Total (Overall) | 13 (61.9%) | 8 (38.1%) |
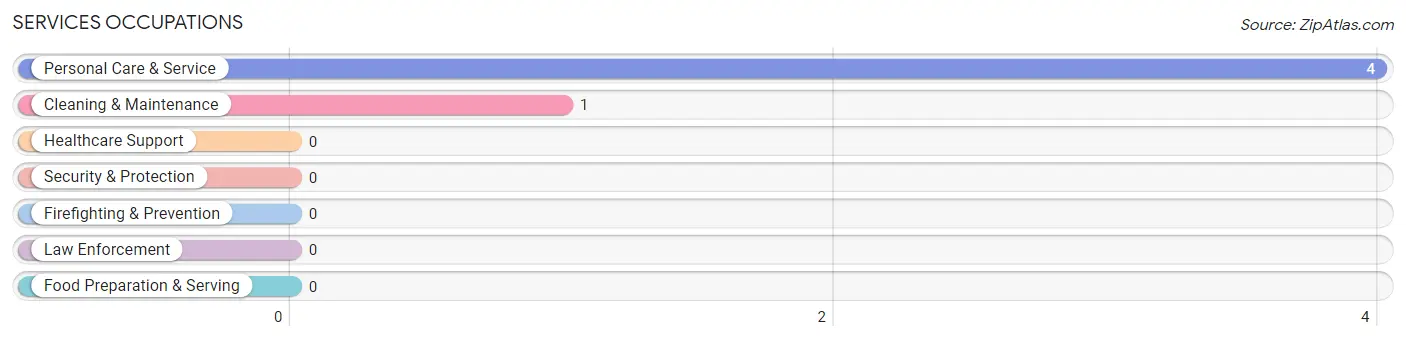
Services Occupations
The most common Services occupations in Hamilton are Personal Care & Service (4 | 19.1%), and Cleaning & Maintenance (1 | 4.8%).
Services Occupations by Sex
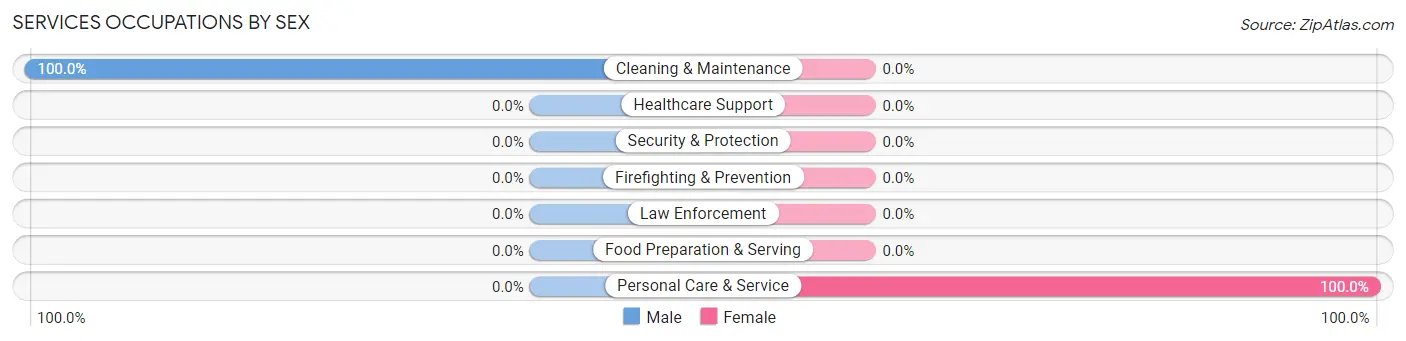
| Occupation | Male | Female |
| Healthcare Support | 0 (0.0%) | 0 (0.0%) |
| Security & Protection | 0 (0.0%) | 0 (0.0%) |
| Firefighting & Prevention | 0 (0.0%) | 0 (0.0%) |
| Law Enforcement | 0 (0.0%) | 0 (0.0%) |
| Food Preparation & Serving | 0 (0.0%) | 0 (0.0%) |
| Cleaning & Maintenance | 1 (100.0%) | 0 (0.0%) |
| Personal Care & Service | 0 (0.0%) | 4 (100.0%) |
| Total (Category) | 1 (20.0%) | 4 (80.0%) |
| Total (Overall) | 13 (61.9%) | 8 (38.1%) |
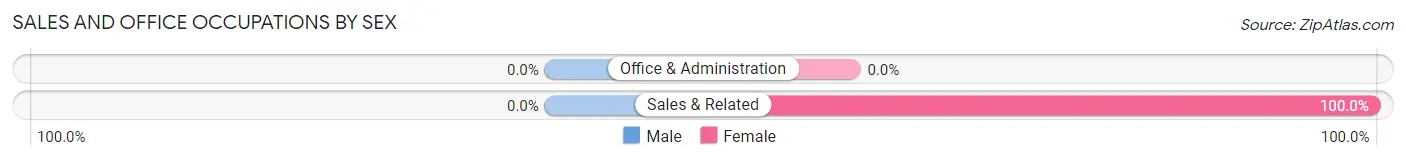
Sales and Office Occupations
The most common Sales and Office occupations in Hamilton are , and Sales & Related (4 | 19.1%).
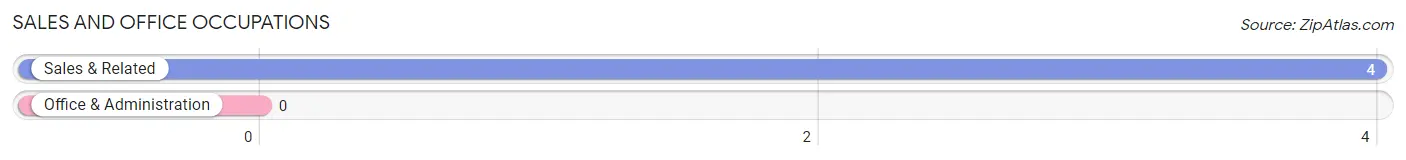
Sales and Office Occupations by Sex
| Occupation | Male | Female |
| Sales & Related | 0 (0.0%) | 4 (100.0%) |
| Office & Administration | 0 (0.0%) | 0 (0.0%) |
| Total (Category) | 0 (0.0%) | 4 (100.0%) |
| Total (Overall) | 13 (61.9%) | 8 (38.1%) |
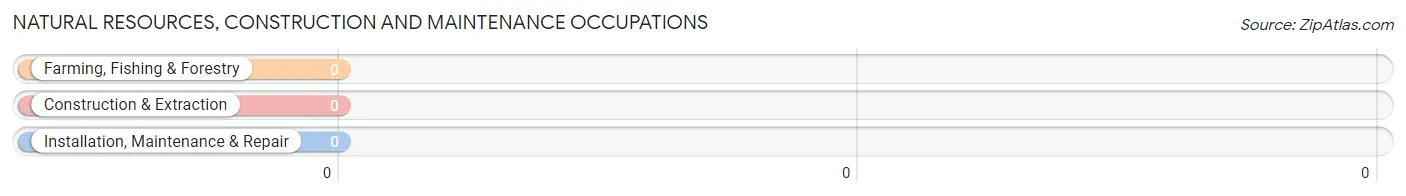
Natural Resources, Construction and Maintenance Occupations
Natural Resources, Construction and Maintenance Occupations by Sex
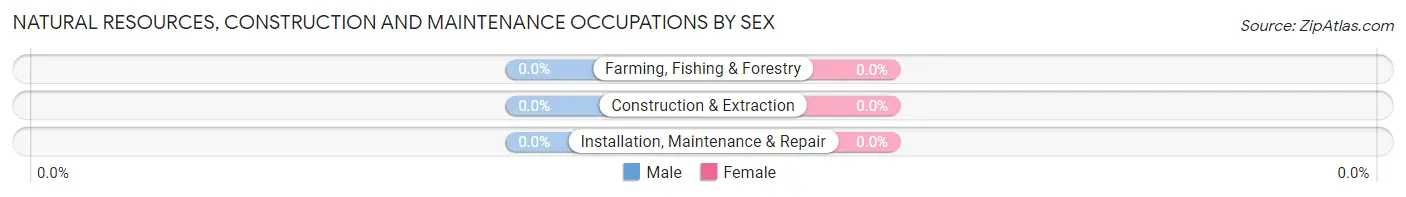
| Occupation | Male | Female |
| Farming, Fishing & Forestry | 0 (0.0%) | 0 (0.0%) |
| Construction & Extraction | 0 (0.0%) | 0 (0.0%) |
| Installation, Maintenance & Repair | 0 (0.0%) | 0 (0.0%) |
| Total (Category) | 0 (0.0%) | 0 (0.0%) |
| Total (Overall) | 13 (61.9%) | 8 (38.1%) |
Production, Transportation and Moving Occupations
The most common Production, Transportation and Moving occupations in Hamilton are Transportation (8 | 38.1%), Production (3 | 14.3%), and Material Moving (1 | 4.8%).
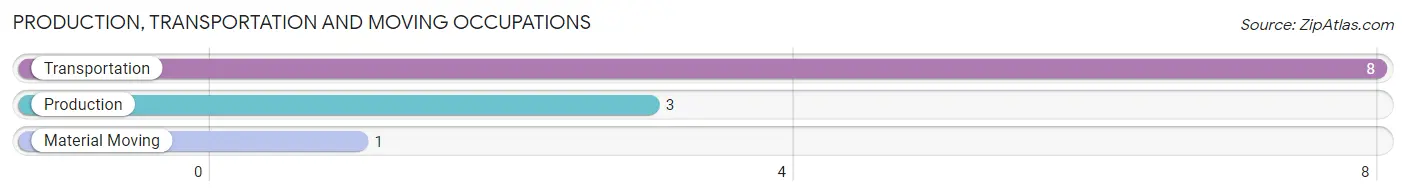
Production, Transportation and Moving Occupations by Sex
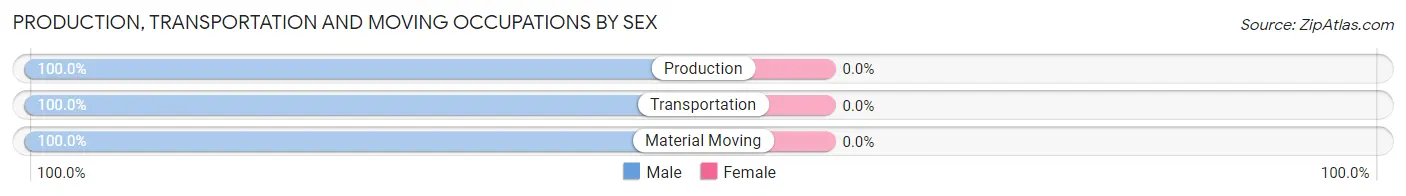
| Occupation | Male | Female |
| Production | 3 (100.0%) | 0 (0.0%) |
| Transportation | 8 (100.0%) | 0 (0.0%) |
| Material Moving | 1 (100.0%) | 0 (0.0%) |
| Total (Category) | 12 (100.0%) | 0 (0.0%) |
| Total (Overall) | 13 (61.9%) | 8 (38.1%) |
Employment Industries by Sex in Hamilton
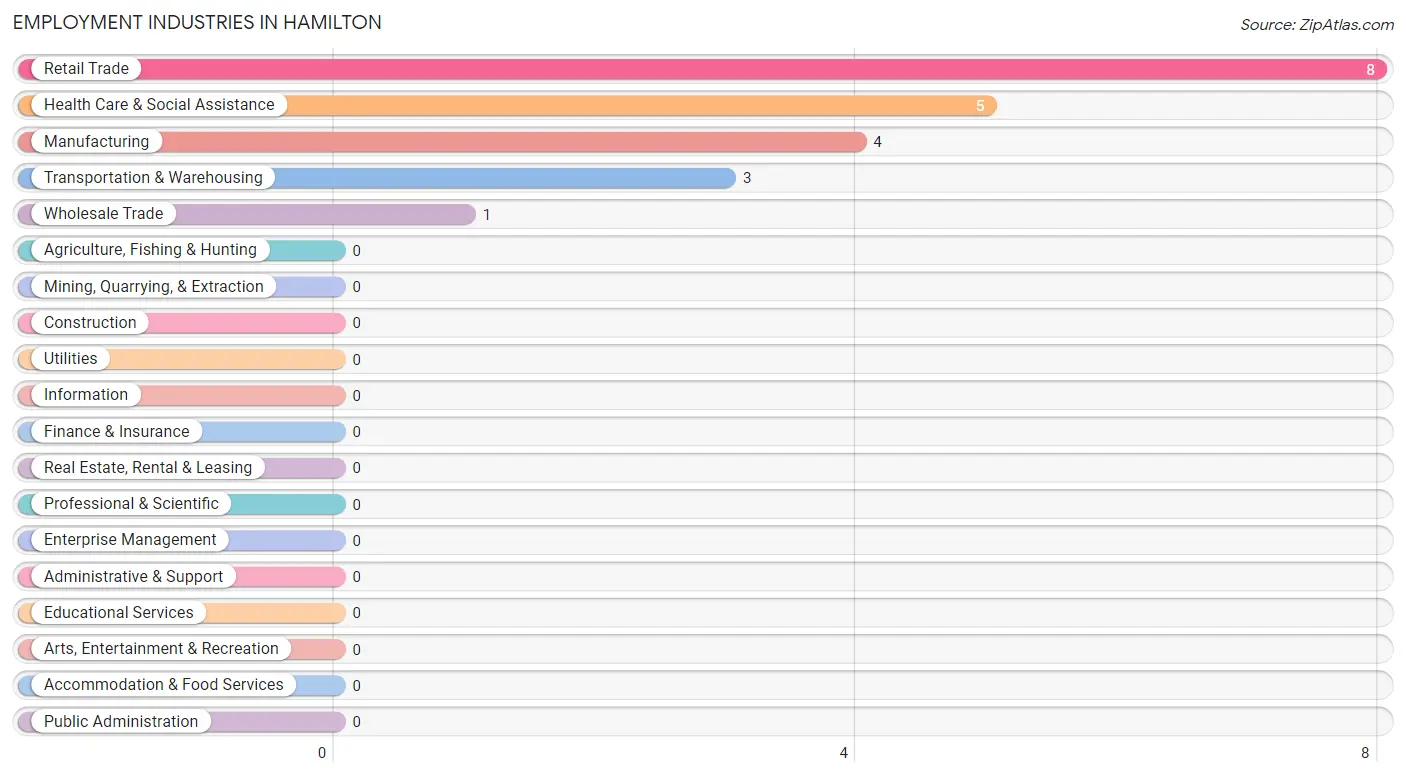
Employment Industries in Hamilton
The major employment industries in Hamilton include Retail Trade (8 | 38.1%), Health Care & Social Assistance (5 | 23.8%), Manufacturing (4 | 19.1%), Transportation & Warehousing (3 | 14.3%), and Wholesale Trade (1 | 4.8%).
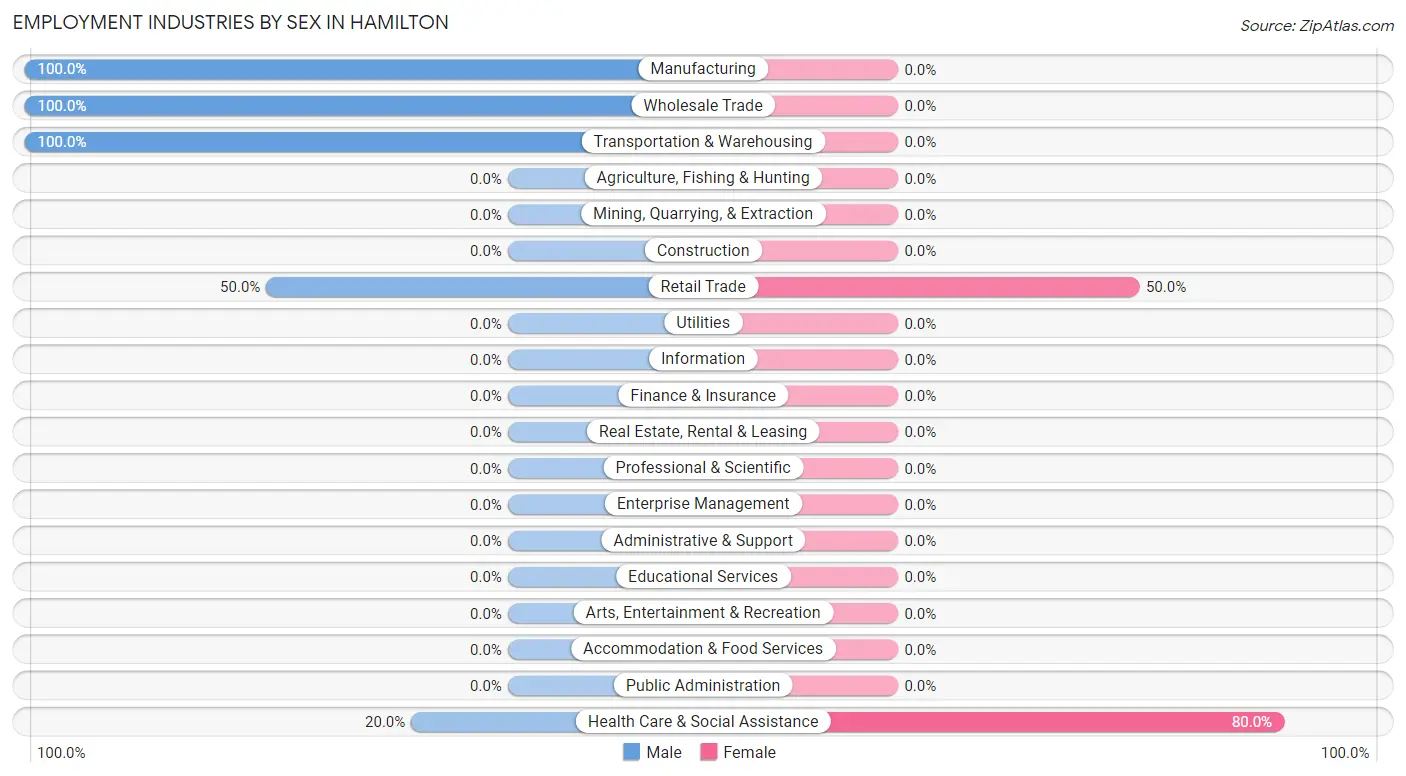
Employment Industries by Sex in Hamilton
The Hamilton industries that see more men than women are Manufacturing (100.0%), Wholesale Trade (100.0%), and Transportation & Warehousing (100.0%), whereas the industries that tend to have a higher number of women are Health Care & Social Assistance (80.0%), and Retail Trade (50.0%).
| Industry | Male | Female |
| Agriculture, Fishing & Hunting | 0 (0.0%) | 0 (0.0%) |
| Mining, Quarrying, & Extraction | 0 (0.0%) | 0 (0.0%) |
| Construction | 0 (0.0%) | 0 (0.0%) |
| Manufacturing | 4 (100.0%) | 0 (0.0%) |
| Wholesale Trade | 1 (100.0%) | 0 (0.0%) |
| Retail Trade | 4 (50.0%) | 4 (50.0%) |
| Transportation & Warehousing | 3 (100.0%) | 0 (0.0%) |
| Utilities | 0 (0.0%) | 0 (0.0%) |
| Information | 0 (0.0%) | 0 (0.0%) |
| Finance & Insurance | 0 (0.0%) | 0 (0.0%) |
| Real Estate, Rental & Leasing | 0 (0.0%) | 0 (0.0%) |
| Professional & Scientific | 0 (0.0%) | 0 (0.0%) |
| Enterprise Management | 0 (0.0%) | 0 (0.0%) |
| Administrative & Support | 0 (0.0%) | 0 (0.0%) |
| Educational Services | 0 (0.0%) | 0 (0.0%) |
| Health Care & Social Assistance | 1 (20.0%) | 4 (80.0%) |
| Arts, Entertainment & Recreation | 0 (0.0%) | 0 (0.0%) |
| Accommodation & Food Services | 0 (0.0%) | 0 (0.0%) |
| Public Administration | 0 (0.0%) | 0 (0.0%) |
| Total | 13 (61.9%) | 8 (38.1%) |
Education in Hamilton
School Enrollment in Hamilton
| School Level | # Students | % Students |
| Nursery / Preschool | 0 | 0.0% |
| Kindergarten | 0 | 0.0% |
| Elementary School | 0 | 0.0% |
| Middle School | 0 | 0.0% |
| High School | 0 | 0.0% |
| College / Undergraduate | 0 | 0.0% |
| Graduate / Professional | 0 | 0.0% |
| Total | 0 | 0.0% |
School Enrollment by Age by Funding Source in Hamilton
| Age Bracket | Public School | Private School |
| 3 to 4 Year Olds | 0 (0.0%) | 0 (0.0%) |
| 5 to 9 Year Old | 0 (0.0%) | 0 (0.0%) |
| 10 to 14 Year Olds | 0 (0.0%) | 0 (0.0%) |
| 15 to 17 Year Olds | 0 (0.0%) | 0 (0.0%) |
| 18 to 19 Year Olds | 0 (0.0%) | 0 (0.0%) |
| 20 to 24 Year Olds | 0 (0.0%) | 0 (0.0%) |
| 25 to 34 Year Olds | 0 (0.0%) | 0 (0.0%) |
| 35 Years and over | 0 (0.0%) | 0 (0.0%) |
| Total | 0 (0.0%) | 0 (0.0%) |
Educational Attainment by Field of Study in Hamilton
| Field of Study | # Graduates | % Graduates |
| Computers & Mathematics | 0 | 0.0% |
| Bio, Nature & Agricultural | 0 | 0.0% |
| Physical & Health Sciences | 0 | 0.0% |
| Psychology | 0 | 0.0% |
| Social Sciences | 0 | 0.0% |
| Engineering | 0 | 0.0% |
| Multidisciplinary Studies | 0 | 0.0% |
| Science & Technology | 0 | 0.0% |
| Business | 0 | 0.0% |
| Education | 0 | 0.0% |
| Literature & Languages | 0 | 0.0% |
| Liberal Arts & History | 0 | 0.0% |
| Visual & Performing Arts | 0 | 0.0% |
| Communications | 0 | 0.0% |
| Arts & Humanities | 0 | 0.0% |
| Total | 0 | 0.0% |
Transportation & Commute in Hamilton
Vehicle Availability by Sex in Hamilton
The most prevalent vehicle ownership categories in Hamilton are males with 5 or more vehicles (4, accounting for 30.8%) and females with 5 or more vehicles (3, making up 50.0%).
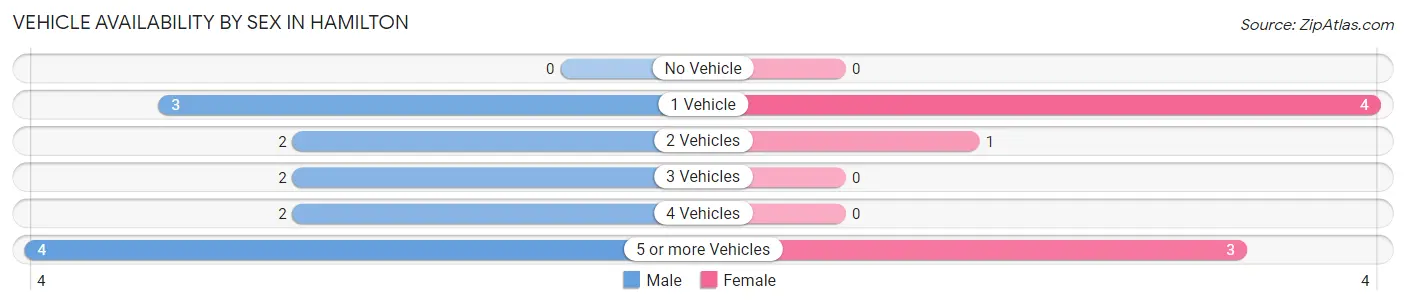
| Vehicles Available | Male | Female |
| No Vehicle | 0 (0.0%) | 0 (0.0%) |
| 1 Vehicle | 3 (23.1%) | 4 (50.0%) |
| 2 Vehicles | 2 (15.4%) | 1 (12.5%) |
| 3 Vehicles | 2 (15.4%) | 0 (0.0%) |
| 4 Vehicles | 2 (15.4%) | 0 (0.0%) |
| 5 or more Vehicles | 4 (30.8%) | 3 (37.5%) |
| Total | 13 (100.0%) | 8 (100.0%) |
Commute Time in Hamilton
The most frequently occuring commute durations in Hamilton are 5 to 9 minutes (5 commuters, 23.8%), 10 to 14 minutes (4 commuters, 19.1%), and 20 to 24 minutes (3 commuters, 14.3%).
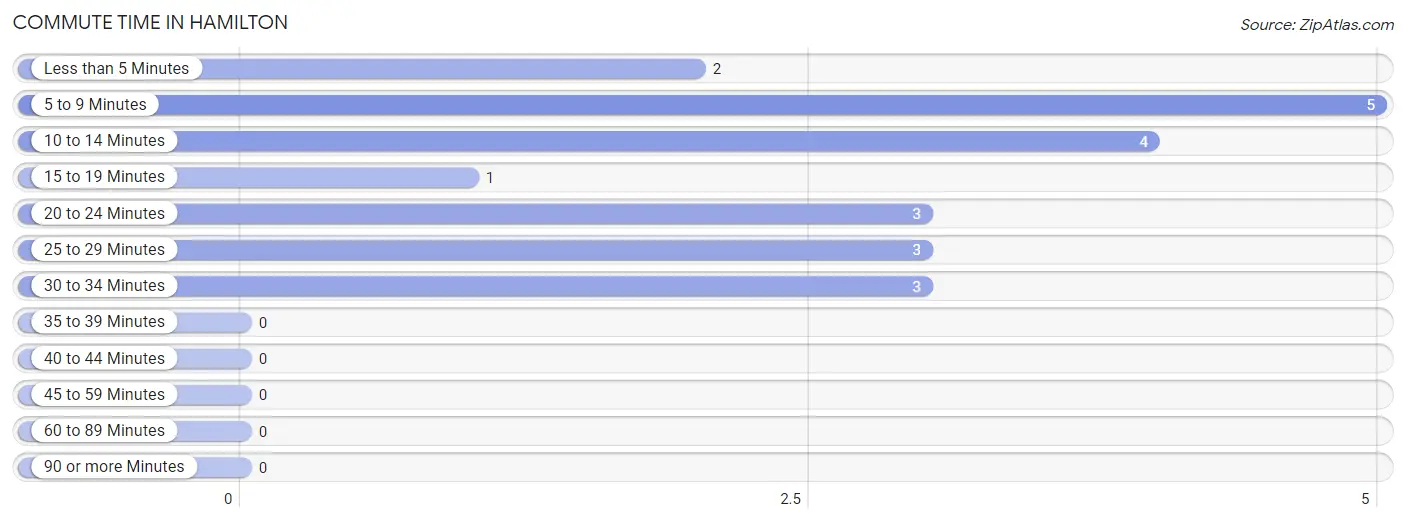
| Commute Time | # Commuters | % Commuters |
| Less than 5 Minutes | 2 | 9.5% |
| 5 to 9 Minutes | 5 | 23.8% |
| 10 to 14 Minutes | 4 | 19.1% |
| 15 to 19 Minutes | 1 | 4.8% |
| 20 to 24 Minutes | 3 | 14.3% |
| 25 to 29 Minutes | 3 | 14.3% |
| 30 to 34 Minutes | 3 | 14.3% |
| 35 to 39 Minutes | 0 | 0.0% |
| 40 to 44 Minutes | 0 | 0.0% |
| 45 to 59 Minutes | 0 | 0.0% |
| 60 to 89 Minutes | 0 | 0.0% |
| 90 or more Minutes | 0 | 0.0% |
Commute Time by Sex in Hamilton
The most common commute times in Hamilton are 5 to 9 minutes (5 commuters, 38.5%) for males and 10 to 14 minutes (4 commuters, 50.0%) for females.
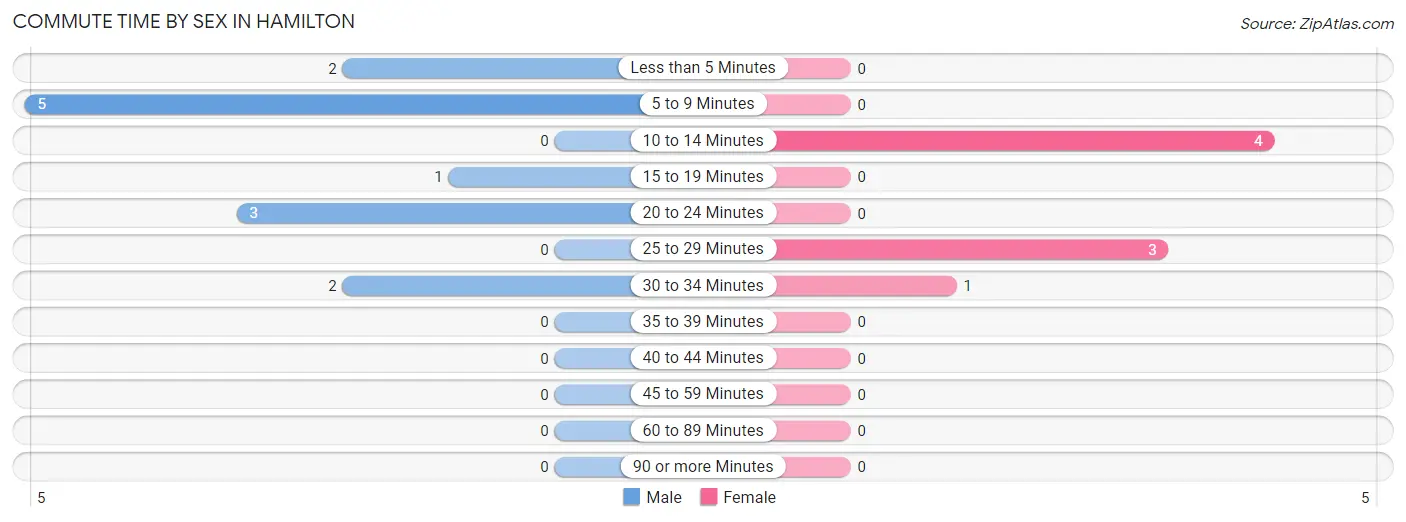
| Commute Time | Male | Female |
| Less than 5 Minutes | 2 (15.4%) | 0 (0.0%) |
| 5 to 9 Minutes | 5 (38.5%) | 0 (0.0%) |
| 10 to 14 Minutes | 0 (0.0%) | 4 (50.0%) |
| 15 to 19 Minutes | 1 (7.7%) | 0 (0.0%) |
| 20 to 24 Minutes | 3 (23.1%) | 0 (0.0%) |
| 25 to 29 Minutes | 0 (0.0%) | 3 (37.5%) |
| 30 to 34 Minutes | 2 (15.4%) | 1 (12.5%) |
| 35 to 39 Minutes | 0 (0.0%) | 0 (0.0%) |
| 40 to 44 Minutes | 0 (0.0%) | 0 (0.0%) |
| 45 to 59 Minutes | 0 (0.0%) | 0 (0.0%) |
| 60 to 89 Minutes | 0 (0.0%) | 0 (0.0%) |
| 90 or more Minutes | 0 (0.0%) | 0 (0.0%) |
Time of Departure to Work by Sex in Hamilton
The most frequent times of departure to work in Hamilton are 12:00 AM to 4:59 AM (6, 46.2%) for males and 7:30 AM to 7:59 AM (6, 75.0%) for females.
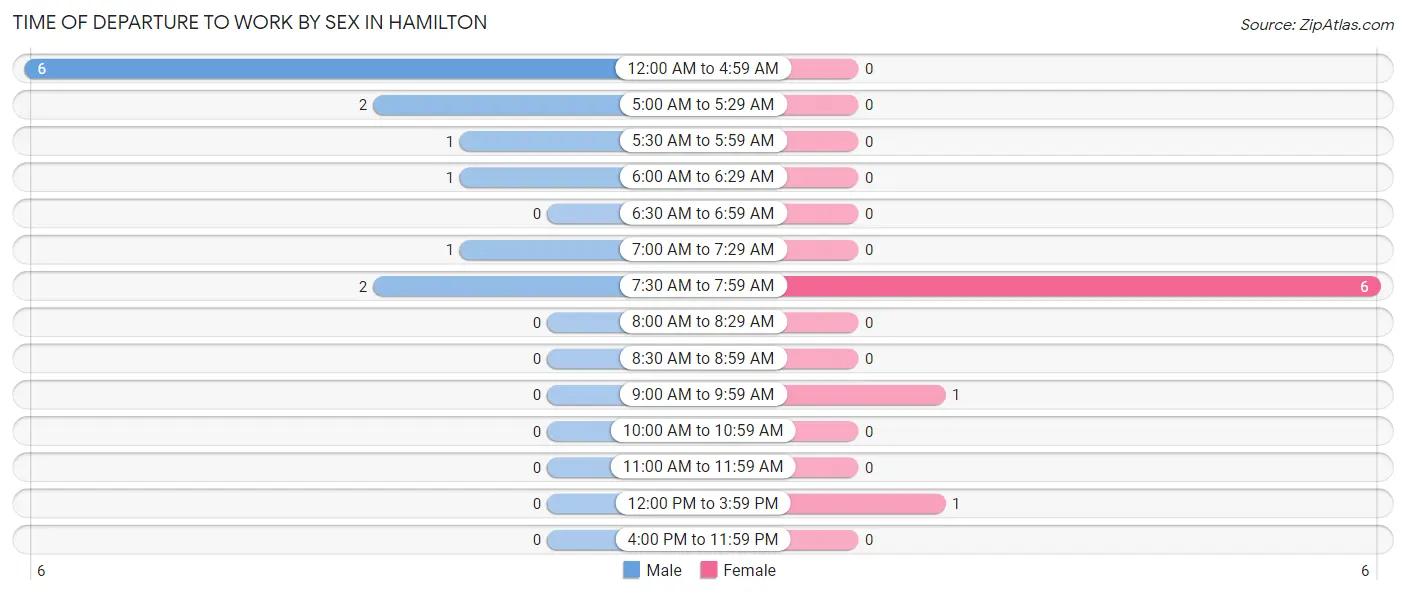
| Time of Departure | Male | Female |
| 12:00 AM to 4:59 AM | 6 (46.2%) | 0 (0.0%) |
| 5:00 AM to 5:29 AM | 2 (15.4%) | 0 (0.0%) |
| 5:30 AM to 5:59 AM | 1 (7.7%) | 0 (0.0%) |
| 6:00 AM to 6:29 AM | 1 (7.7%) | 0 (0.0%) |
| 6:30 AM to 6:59 AM | 0 (0.0%) | 0 (0.0%) |
| 7:00 AM to 7:29 AM | 1 (7.7%) | 0 (0.0%) |
| 7:30 AM to 7:59 AM | 2 (15.4%) | 6 (75.0%) |
| 8:00 AM to 8:29 AM | 0 (0.0%) | 0 (0.0%) |
| 8:30 AM to 8:59 AM | 0 (0.0%) | 0 (0.0%) |
| 9:00 AM to 9:59 AM | 0 (0.0%) | 1 (12.5%) |
| 10:00 AM to 10:59 AM | 0 (0.0%) | 0 (0.0%) |
| 11:00 AM to 11:59 AM | 0 (0.0%) | 0 (0.0%) |
| 12:00 PM to 3:59 PM | 0 (0.0%) | 1 (12.5%) |
| 4:00 PM to 11:59 PM | 0 (0.0%) | 0 (0.0%) |
| Total | 13 (100.0%) | 8 (100.0%) |
Housing Occupancy in Hamilton
Occupancy by Ownership in Hamilton
Of the total 17 dwellings in Hamilton, owner-occupied units account for 16 (94.1%), while renter-occupied units make up 1 (5.9%).
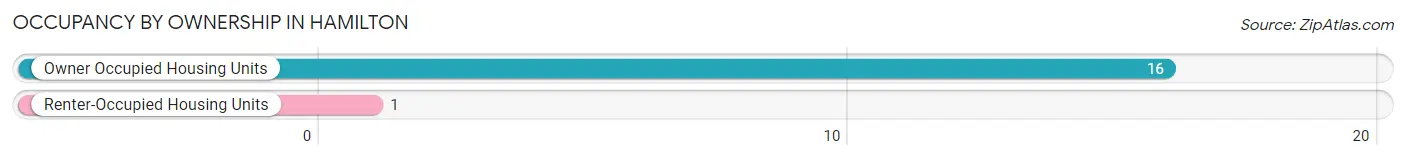
| Occupancy | # Housing Units | % Housing Units |
| Owner Occupied Housing Units | 16 | 94.1% |
| Renter-Occupied Housing Units | 1 | 5.9% |
| Total Occupied Housing Units | 17 | 100.0% |
Occupancy by Household Size in Hamilton
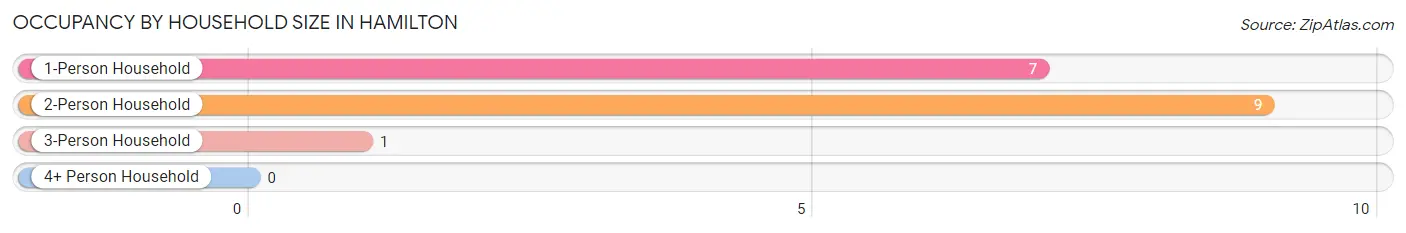
| Household Size | # Housing Units | % Housing Units |
| 1-Person Household | 7 | 41.2% |
| 2-Person Household | 9 | 52.9% |
| 3-Person Household | 1 | 5.9% |
| 4+ Person Household | 0 | 0.0% |
| Total Housing Units | 17 | 100.0% |
Occupancy by Ownership by Household Size in Hamilton
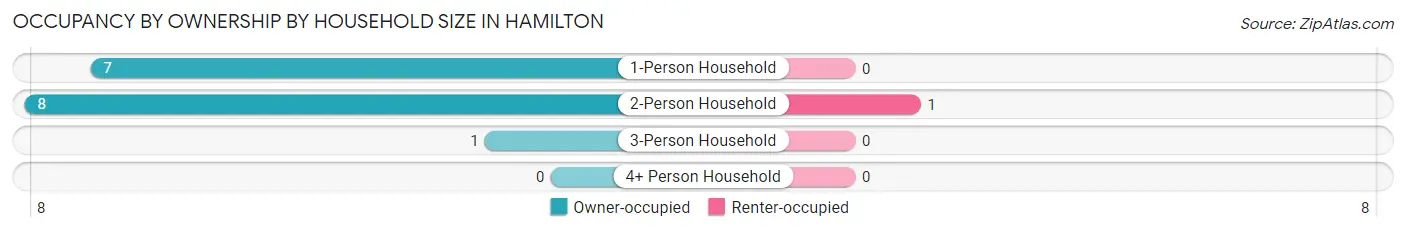
| Household Size | Owner-occupied | Renter-occupied |
| 1-Person Household | 7 (100.0%) | 0 (0.0%) |
| 2-Person Household | 8 (88.9%) | 1 (11.1%) |
| 3-Person Household | 1 (100.0%) | 0 (0.0%) |
| 4+ Person Household | 0 (0.0%) | 0 (0.0%) |
| Total Housing Units | 16 (94.1%) | 1 (5.9%) |
Occupancy by Educational Attainment in Hamilton
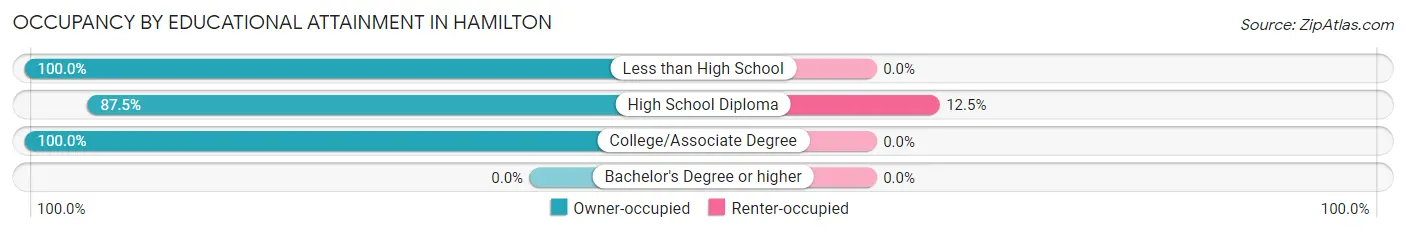
| Household Size | Owner-occupied | Renter-occupied |
| Less than High School | 1 (100.0%) | 0 (0.0%) |
| High School Diploma | 7 (87.5%) | 1 (12.5%) |
| College/Associate Degree | 8 (100.0%) | 0 (0.0%) |
| Bachelor's Degree or higher | 0 (0.0%) | 0 (0.0%) |
Occupancy by Age of Householder in Hamilton
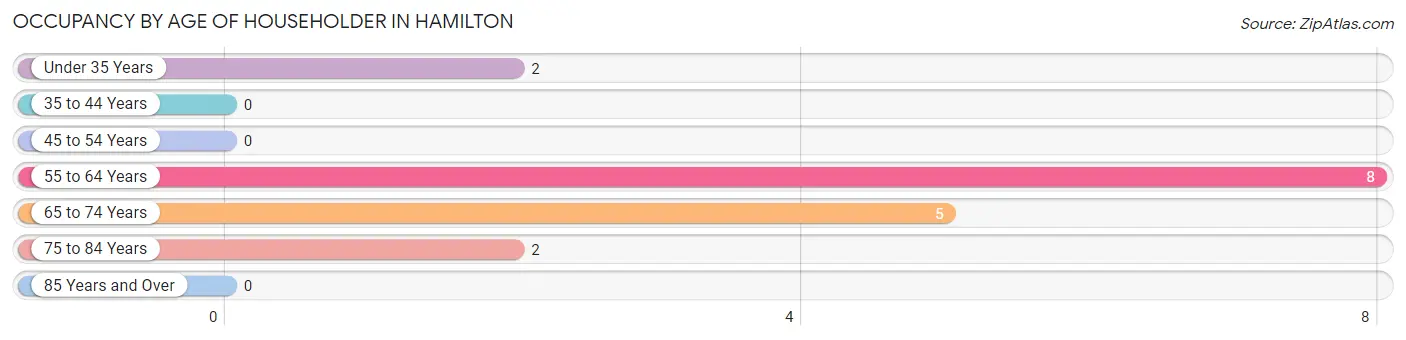
| Age Bracket | # Households | % Households |
| Under 35 Years | 2 | 11.8% |
| 35 to 44 Years | 0 | 0.0% |
| 45 to 54 Years | 0 | 0.0% |
| 55 to 64 Years | 8 | 47.1% |
| 65 to 74 Years | 5 | 29.4% |
| 75 to 84 Years | 2 | 11.8% |
| 85 Years and Over | 0 | 0.0% |
| Total | 17 | 100.0% |
Housing Finances in Hamilton
Median Income by Occupancy in Hamilton
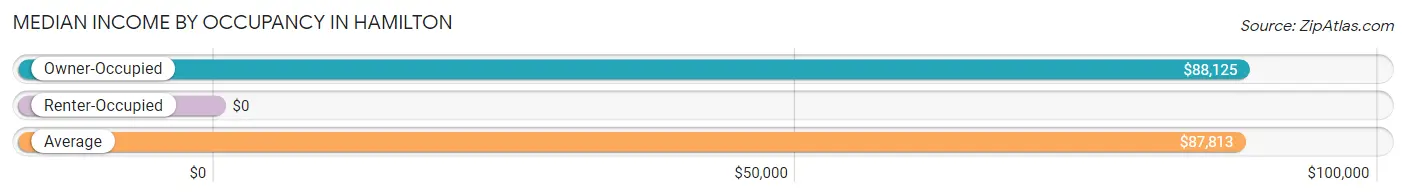
| Occupancy Type | # Households | Median Income |
| Owner-Occupied | 16 (94.1%) | $88,125 |
| Renter-Occupied | 1 (5.9%) | $0 |
| Average | 17 (100.0%) | $87,813 |
Occupancy by Householder Income Bracket in Hamilton
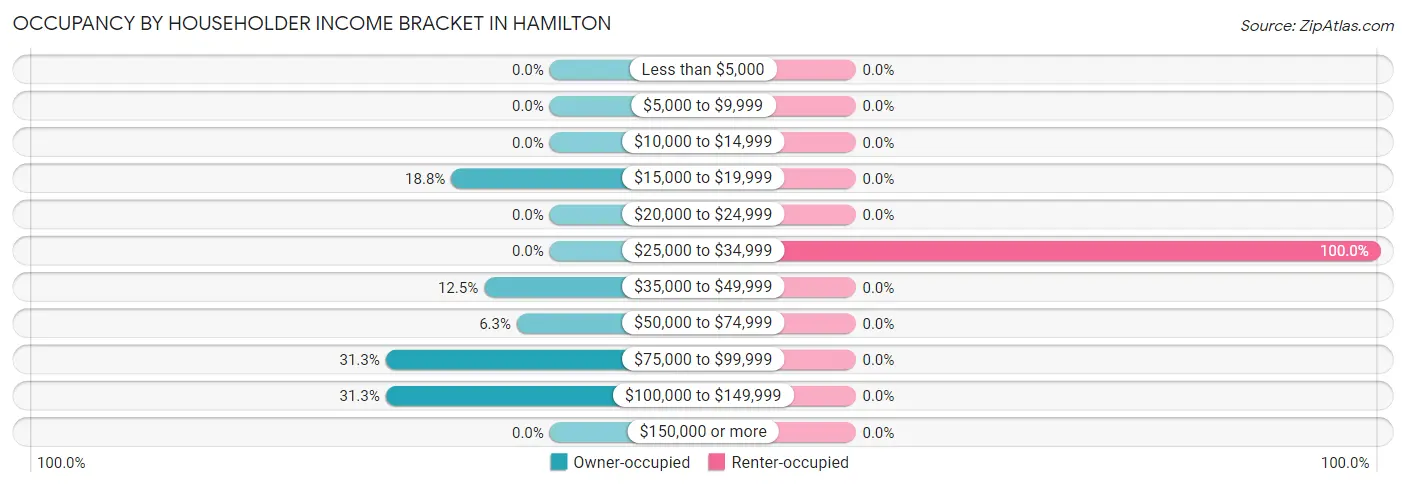
| Income Bracket | Owner-occupied | Renter-occupied |
| Less than $5,000 | 0 (0.0%) | 0 (0.0%) |
| $5,000 to $9,999 | 0 (0.0%) | 0 (0.0%) |
| $10,000 to $14,999 | 0 (0.0%) | 0 (0.0%) |
| $15,000 to $19,999 | 3 (18.8%) | 0 (0.0%) |
| $20,000 to $24,999 | 0 (0.0%) | 0 (0.0%) |
| $25,000 to $34,999 | 0 (0.0%) | 1 (100.0%) |
| $35,000 to $49,999 | 2 (12.5%) | 0 (0.0%) |
| $50,000 to $74,999 | 1 (6.2%) | 0 (0.0%) |
| $75,000 to $99,999 | 5 (31.2%) | 0 (0.0%) |
| $100,000 to $149,999 | 5 (31.2%) | 0 (0.0%) |
| $150,000 or more | 0 (0.0%) | 0 (0.0%) |
| Total | 16 (100.0%) | 1 (100.0%) |
Monthly Housing Cost Tiers in Hamilton
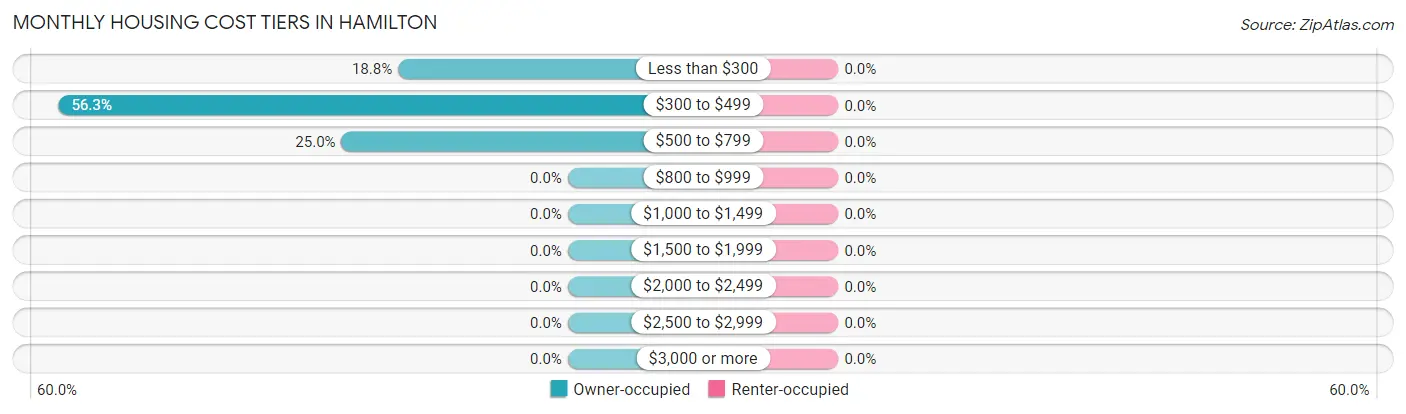
| Monthly Cost | Owner-occupied | Renter-occupied |
| Less than $300 | 3 (18.8%) | 0 (0.0%) |
| $300 to $499 | 9 (56.2%) | 0 (0.0%) |
| $500 to $799 | 4 (25.0%) | 0 (0.0%) |
| $800 to $999 | 0 (0.0%) | 0 (0.0%) |
| $1,000 to $1,499 | 0 (0.0%) | 0 (0.0%) |
| $1,500 to $1,999 | 0 (0.0%) | 0 (0.0%) |
| $2,000 to $2,499 | 0 (0.0%) | 0 (0.0%) |
| $2,500 to $2,999 | 0 (0.0%) | 0 (0.0%) |
| $3,000 or more | 0 (0.0%) | 0 (0.0%) |
| Total | 16 (100.0%) | 1 (100.0%) |
Physical Housing Characteristics in Hamilton
Housing Structures in Hamilton
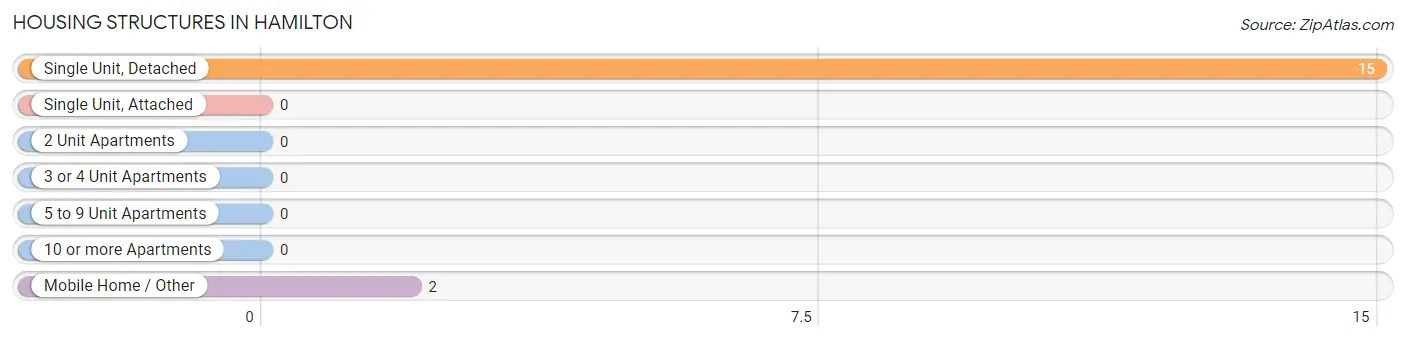
| Structure Type | # Housing Units | % Housing Units |
| Single Unit, Detached | 15 | 88.2% |
| Single Unit, Attached | 0 | 0.0% |
| 2 Unit Apartments | 0 | 0.0% |
| 3 or 4 Unit Apartments | 0 | 0.0% |
| 5 to 9 Unit Apartments | 0 | 0.0% |
| 10 or more Apartments | 0 | 0.0% |
| Mobile Home / Other | 2 | 11.8% |
| Total | 17 | 100.0% |
Housing Structures by Occupancy in Hamilton
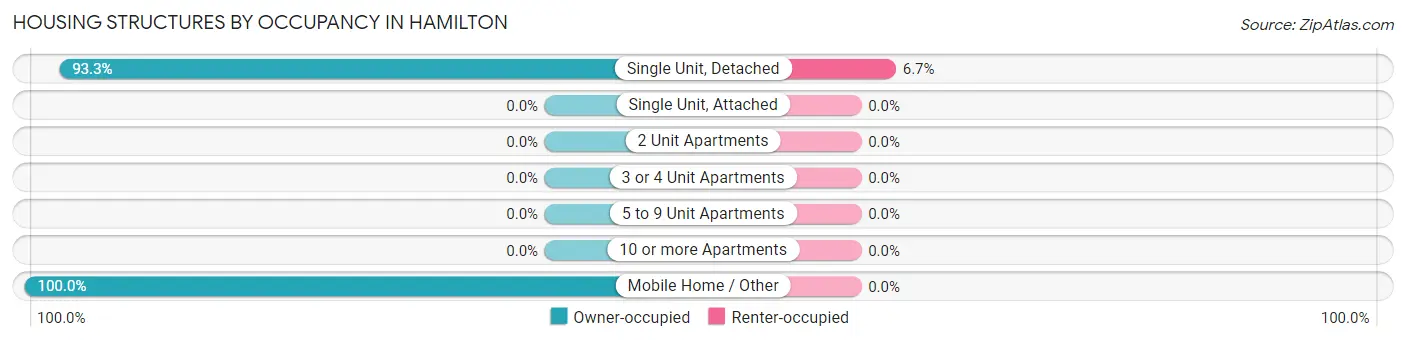
| Structure Type | Owner-occupied | Renter-occupied |
| Single Unit, Detached | 14 (93.3%) | 1 (6.7%) |
| Single Unit, Attached | 0 (0.0%) | 0 (0.0%) |
| 2 Unit Apartments | 0 (0.0%) | 0 (0.0%) |
| 3 or 4 Unit Apartments | 0 (0.0%) | 0 (0.0%) |
| 5 to 9 Unit Apartments | 0 (0.0%) | 0 (0.0%) |
| 10 or more Apartments | 0 (0.0%) | 0 (0.0%) |
| Mobile Home / Other | 2 (100.0%) | 0 (0.0%) |
| Total | 16 (94.1%) | 1 (5.9%) |
Housing Structures by Number of Rooms in Hamilton
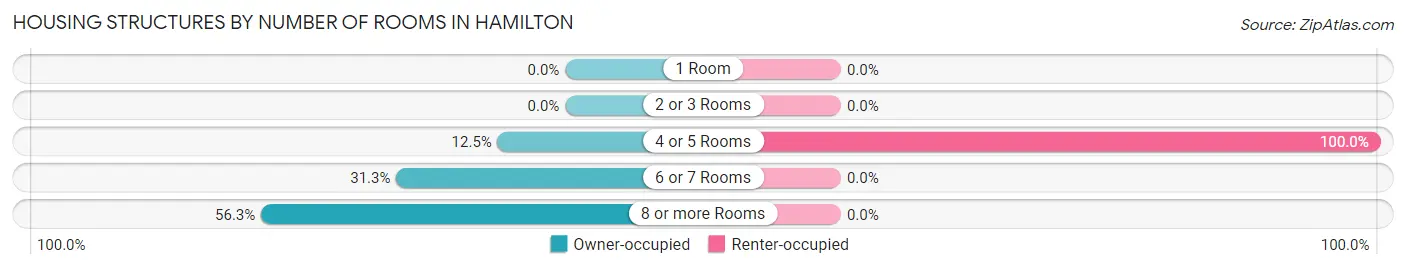
| Number of Rooms | Owner-occupied | Renter-occupied |
| 1 Room | 0 (0.0%) | 0 (0.0%) |
| 2 or 3 Rooms | 0 (0.0%) | 0 (0.0%) |
| 4 or 5 Rooms | 2 (12.5%) | 1 (100.0%) |
| 6 or 7 Rooms | 5 (31.2%) | 0 (0.0%) |
| 8 or more Rooms | 9 (56.2%) | 0 (0.0%) |
| Total | 16 (100.0%) | 1 (100.0%) |
Housing Structure by Heating Type in Hamilton
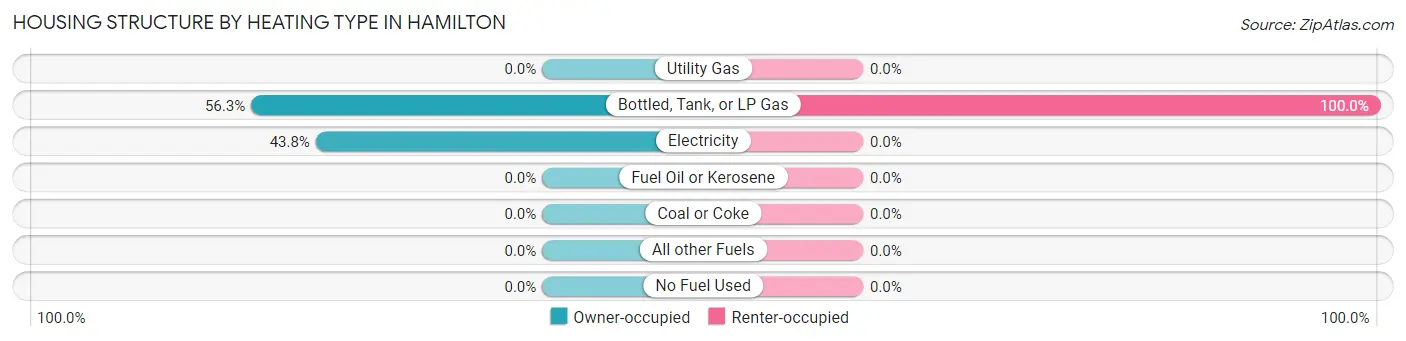
| Heating Type | Owner-occupied | Renter-occupied |
| Utility Gas | 0 (0.0%) | 0 (0.0%) |
| Bottled, Tank, or LP Gas | 9 (56.2%) | 1 (100.0%) |
| Electricity | 7 (43.8%) | 0 (0.0%) |
| Fuel Oil or Kerosene | 0 (0.0%) | 0 (0.0%) |
| Coal or Coke | 0 (0.0%) | 0 (0.0%) |
| All other Fuels | 0 (0.0%) | 0 (0.0%) |
| No Fuel Used | 0 (0.0%) | 0 (0.0%) |
| Total | 16 (100.0%) | 1 (100.0%) |
Household Vehicle Usage in Hamilton
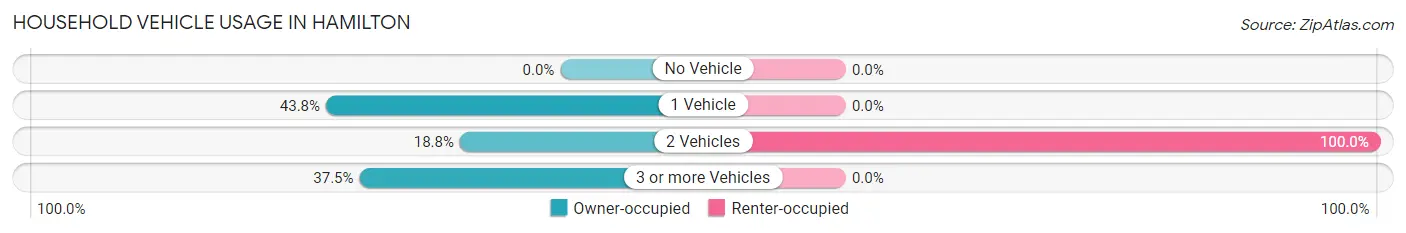
| Vehicles per Household | Owner-occupied | Renter-occupied |
| No Vehicle | 0 (0.0%) | 0 (0.0%) |
| 1 Vehicle | 7 (43.8%) | 0 (0.0%) |
| 2 Vehicles | 3 (18.8%) | 1 (100.0%) |
| 3 or more Vehicles | 6 (37.5%) | 0 (0.0%) |
| Total | 16 (100.0%) | 1 (100.0%) |
Real Estate & Mortgages in Hamilton
Real Estate and Mortgage Overview in Hamilton
| Characteristic | Without Mortgage | With Mortgage |
| Housing Units | 10 | 6 |
| Median Property Value | - | - |
| Median Household Income | $70,000 | $0 |
| Monthly Housing Costs | $375 | $0 |
| Real Estate Taxes | $300 | $0 |
Property Value by Mortgage Status in Hamilton
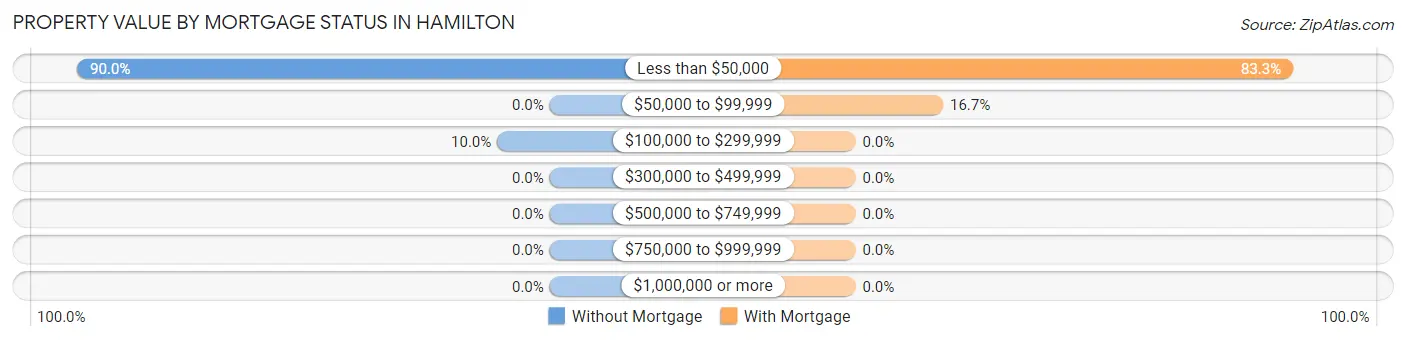
| Property Value | Without Mortgage | With Mortgage |
| Less than $50,000 | 9 (90.0%) | 5 (83.3%) |
| $50,000 to $99,999 | 0 (0.0%) | 1 (16.7%) |
| $100,000 to $299,999 | 1 (10.0%) | 0 (0.0%) |
| $300,000 to $499,999 | 0 (0.0%) | 0 (0.0%) |
| $500,000 to $749,999 | 0 (0.0%) | 0 (0.0%) |
| $750,000 to $999,999 | 0 (0.0%) | 0 (0.0%) |
| $1,000,000 or more | 0 (0.0%) | 0 (0.0%) |
| Total | 10 (100.0%) | 6 (100.0%) |
Household Income by Mortgage Status in Hamilton
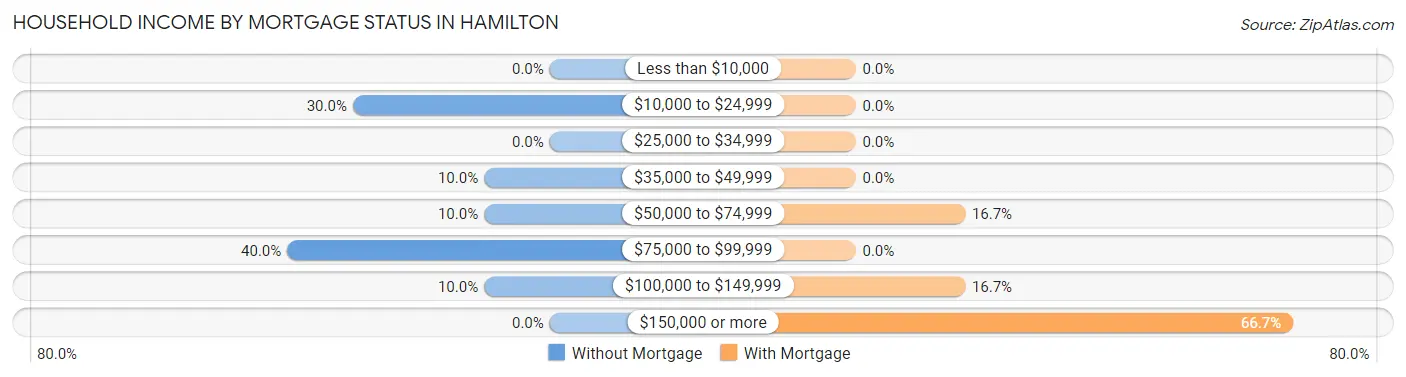
| Household Income | Without Mortgage | With Mortgage |
| Less than $10,000 | 0 (0.0%) | 0 (0.0%) |
| $10,000 to $24,999 | 3 (30.0%) | 0 (0.0%) |
| $25,000 to $34,999 | 0 (0.0%) | 0 (0.0%) |
| $35,000 to $49,999 | 1 (10.0%) | 0 (0.0%) |
| $50,000 to $74,999 | 1 (10.0%) | 1 (16.7%) |
| $75,000 to $99,999 | 4 (40.0%) | 0 (0.0%) |
| $100,000 to $149,999 | 1 (10.0%) | 1 (16.7%) |
| $150,000 or more | 0 (0.0%) | 4 (66.7%) |
| Total | 10 (100.0%) | 6 (100.0%) |
Property Value to Household Income Ratio in Hamilton
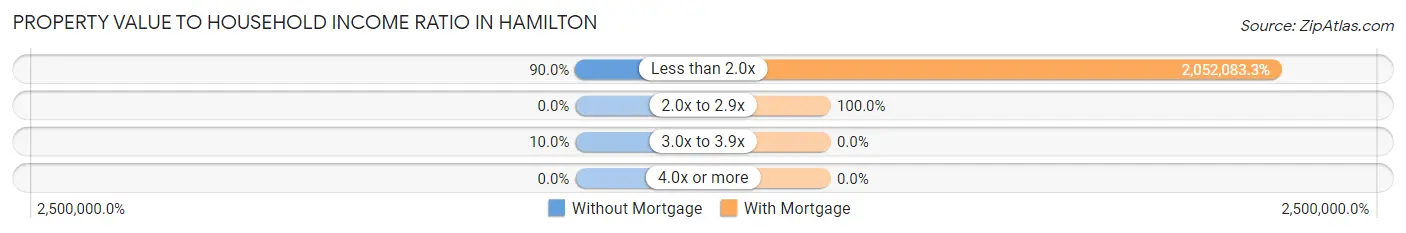
| Value-to-Income Ratio | Without Mortgage | With Mortgage |
| Less than 2.0x | 9 (90.0%) | 123,125 (2,052,083.3%) |
| 2.0x to 2.9x | 0 (0.0%) | 6 (100.0%) |
| 3.0x to 3.9x | 1 (10.0%) | 0 (0.0%) |
| 4.0x or more | 0 (0.0%) | 0 (0.0%) |
| Total | 10 (100.0%) | 6 (100.0%) |
Real Estate Taxes by Mortgage Status in Hamilton
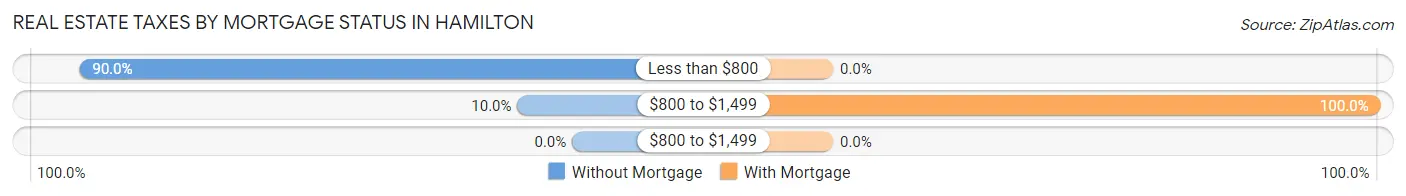
| Property Taxes | Without Mortgage | With Mortgage |
| Less than $800 | 9 (90.0%) | 0 (0.0%) |
| $800 to $1,499 | 1 (10.0%) | 6 (100.0%) |
| $800 to $1,499 | 0 (0.0%) | 0 (0.0%) |
| Total | 10 (100.0%) | 6 (100.0%) |
Health & Disability in Hamilton
Health Insurance Coverage by Age in Hamilton
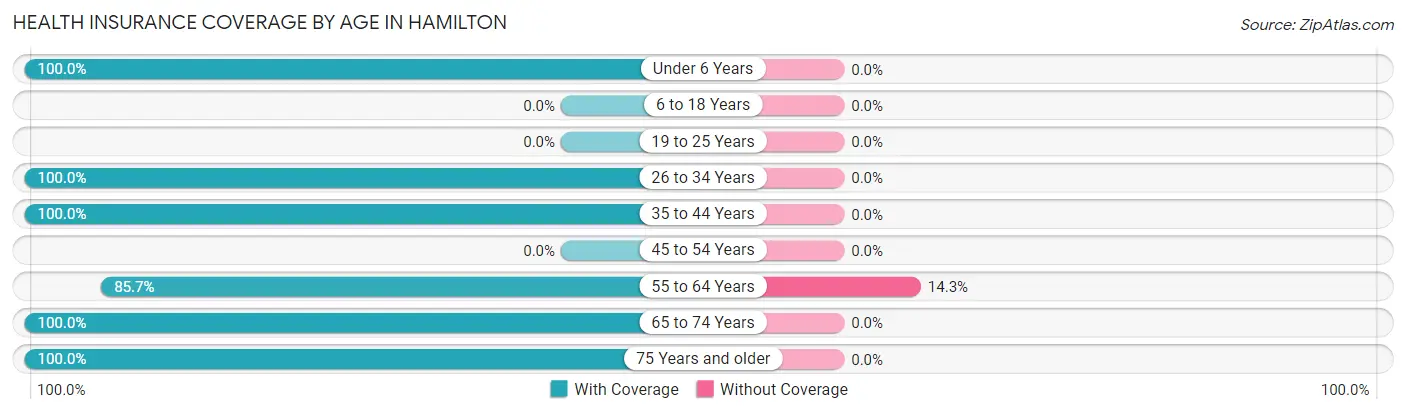
| Age Bracket | With Coverage | Without Coverage |
| Under 6 Years | 1 (100.0%) | 0 (0.0%) |
| 6 to 18 Years | 0 (0.0%) | 0 (0.0%) |
| 19 to 25 Years | 0 (0.0%) | 0 (0.0%) |
| 26 to 34 Years | 3 (100.0%) | 0 (0.0%) |
| 35 to 44 Years | 2 (100.0%) | 0 (0.0%) |
| 45 to 54 Years | 0 (0.0%) | 0 (0.0%) |
| 55 to 64 Years | 12 (85.7%) | 2 (14.3%) |
| 65 to 74 Years | 7 (100.0%) | 0 (0.0%) |
| 75 Years and older | 3 (100.0%) | 0 (0.0%) |
| Total | 28 (93.3%) | 2 (6.7%) |
Health Insurance Coverage by Citizenship Status in Hamilton
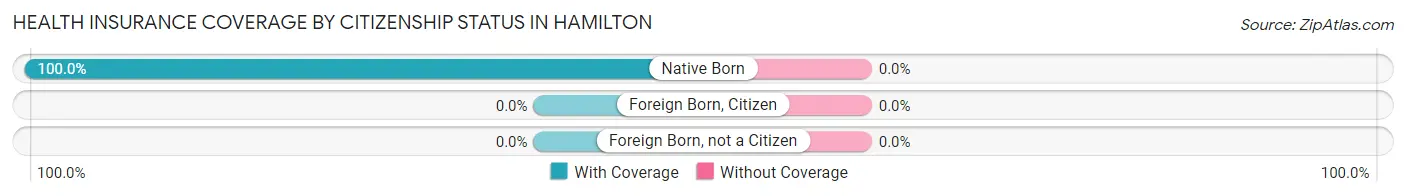
| Citizenship Status | With Coverage | Without Coverage |
| Native Born | 1 (100.0%) | 0 (0.0%) |
| Foreign Born, Citizen | 0 (0.0%) | 0 (0.0%) |
| Foreign Born, not a Citizen | 0 (0.0%) | 0 (0.0%) |
Health Insurance Coverage by Household Income in Hamilton
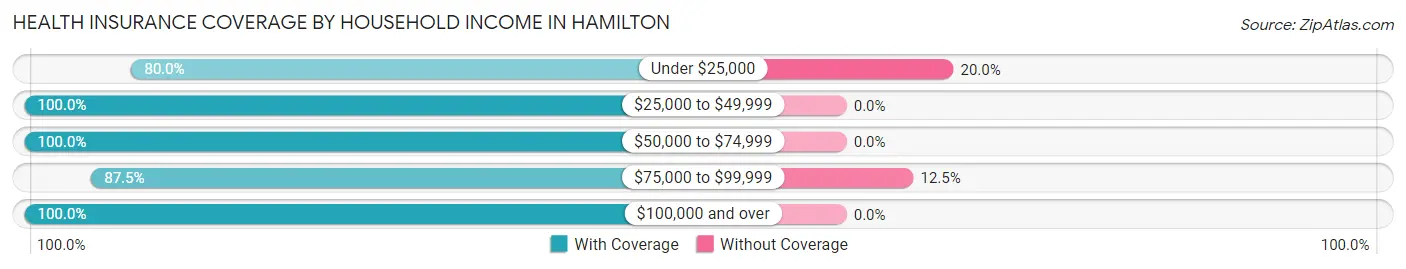
| Household Income | With Coverage | Without Coverage |
| Under $25,000 | 4 (80.0%) | 1 (20.0%) |
| $25,000 to $49,999 | 6 (100.0%) | 0 (0.0%) |
| $50,000 to $74,999 | 1 (100.0%) | 0 (0.0%) |
| $75,000 to $99,999 | 7 (87.5%) | 1 (12.5%) |
| $100,000 and over | 10 (100.0%) | 0 (0.0%) |
Public vs Private Health Insurance Coverage by Age in Hamilton
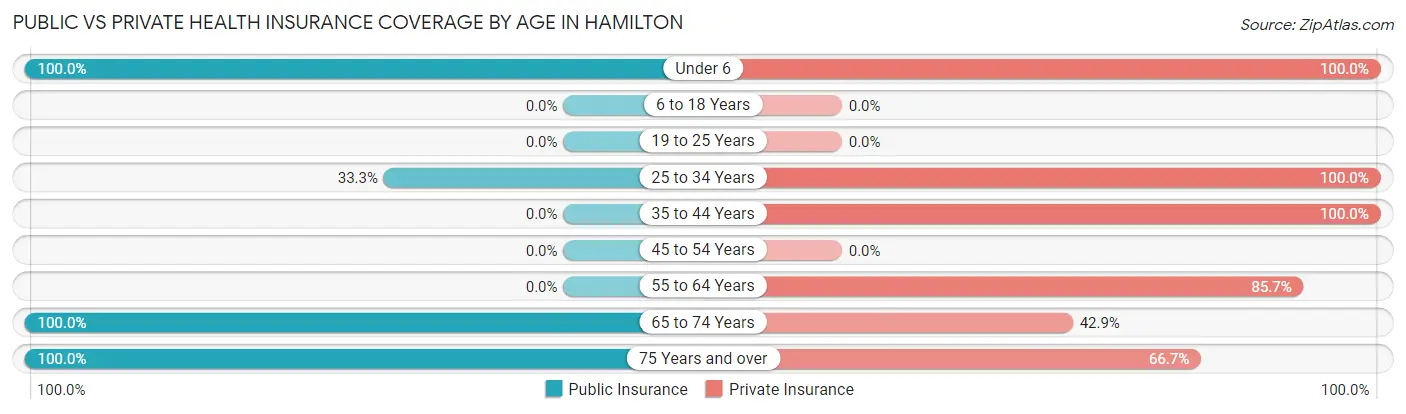
| Age Bracket | Public Insurance | Private Insurance |
| Under 6 | 1 (100.0%) | 1 (100.0%) |
| 6 to 18 Years | 0 (0.0%) | 0 (0.0%) |
| 19 to 25 Years | 0 (0.0%) | 0 (0.0%) |
| 25 to 34 Years | 1 (33.3%) | 3 (100.0%) |
| 35 to 44 Years | 0 (0.0%) | 2 (100.0%) |
| 45 to 54 Years | 0 (0.0%) | 0 (0.0%) |
| 55 to 64 Years | 0 (0.0%) | 12 (85.7%) |
| 65 to 74 Years | 7 (100.0%) | 3 (42.9%) |
| 75 Years and over | 3 (100.0%) | 2 (66.7%) |
| Total | 12 (40.0%) | 23 (76.7%) |
Disability Status by Sex by Age in Hamilton
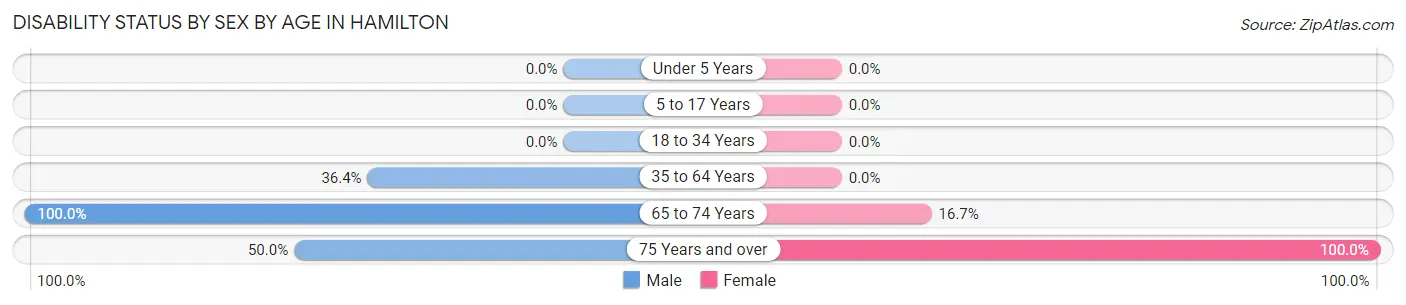
| Age Bracket | Male | Female |
| Under 5 Years | 0 (0.0%) | 0 (0.0%) |
| 5 to 17 Years | 0 (0.0%) | 0 (0.0%) |
| 18 to 34 Years | 0 (0.0%) | 0 (0.0%) |
| 35 to 64 Years | 4 (36.4%) | 0 (0.0%) |
| 65 to 74 Years | 1 (100.0%) | 1 (16.7%) |
| 75 Years and over | 1 (50.0%) | 1 (100.0%) |
Disability Class by Sex by Age in Hamilton
Disability Class: Hearing Difficulty
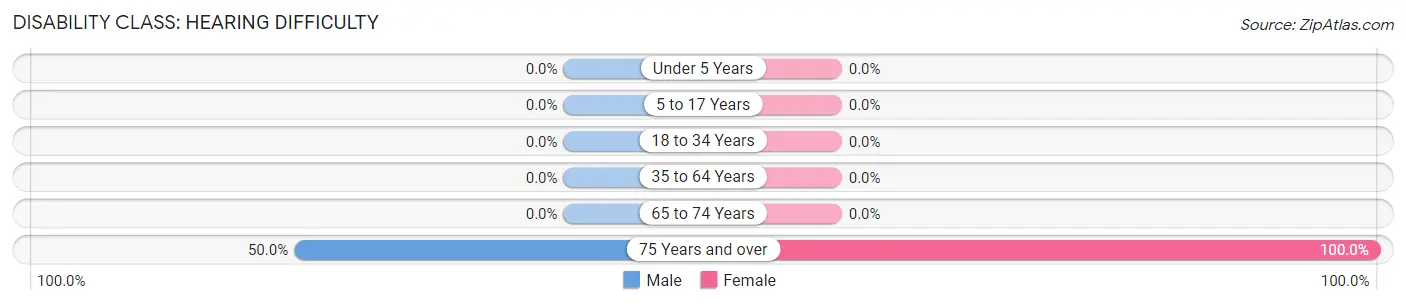
| Age Bracket | Male | Female |
| Under 5 Years | 0 (0.0%) | 0 (0.0%) |
| 5 to 17 Years | 0 (0.0%) | 0 (0.0%) |
| 18 to 34 Years | 0 (0.0%) | 0 (0.0%) |
| 35 to 64 Years | 0 (0.0%) | 0 (0.0%) |
| 65 to 74 Years | 0 (0.0%) | 0 (0.0%) |
| 75 Years and over | 1 (50.0%) | 1 (100.0%) |
Disability Class: Vision Difficulty
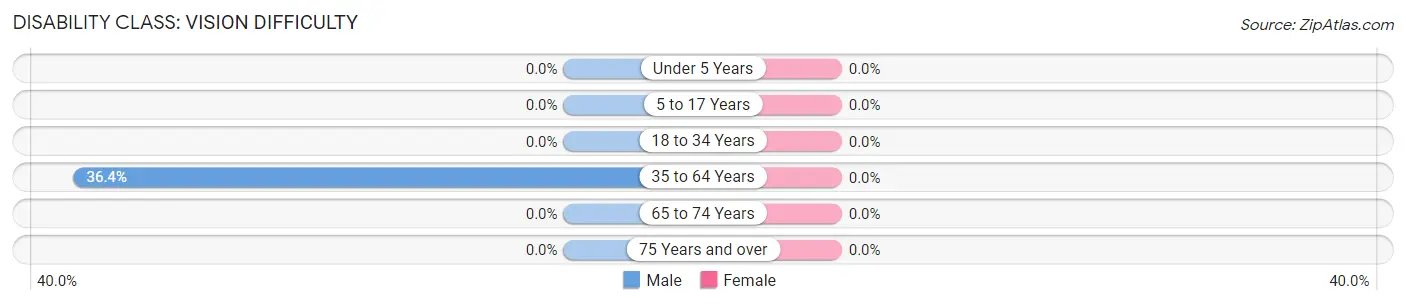
| Age Bracket | Male | Female |
| Under 5 Years | 0 (0.0%) | 0 (0.0%) |
| 5 to 17 Years | 0 (0.0%) | 0 (0.0%) |
| 18 to 34 Years | 0 (0.0%) | 0 (0.0%) |
| 35 to 64 Years | 4 (36.4%) | 0 (0.0%) |
| 65 to 74 Years | 0 (0.0%) | 0 (0.0%) |
| 75 Years and over | 0 (0.0%) | 0 (0.0%) |
Disability Class: Cognitive Difficulty
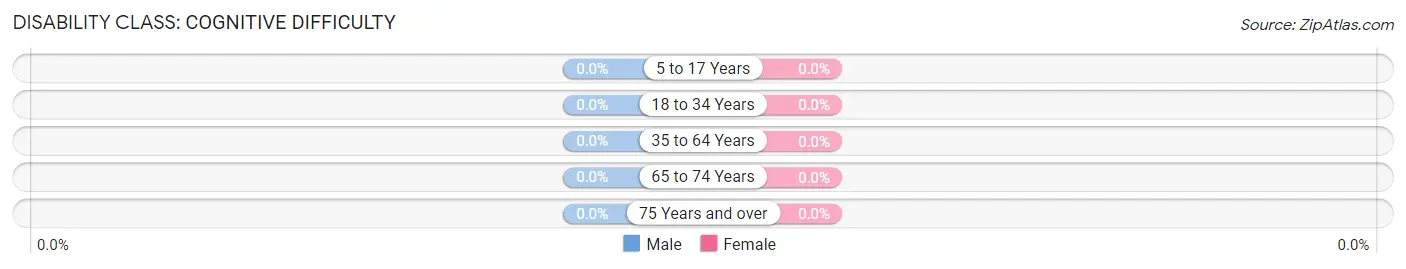
| Age Bracket | Male | Female |
| 5 to 17 Years | 0 (0.0%) | 0 (0.0%) |
| 18 to 34 Years | 0 (0.0%) | 0 (0.0%) |
| 35 to 64 Years | 0 (0.0%) | 0 (0.0%) |
| 65 to 74 Years | 0 (0.0%) | 0 (0.0%) |
| 75 Years and over | 0 (0.0%) | 0 (0.0%) |
Disability Class: Ambulatory Difficulty
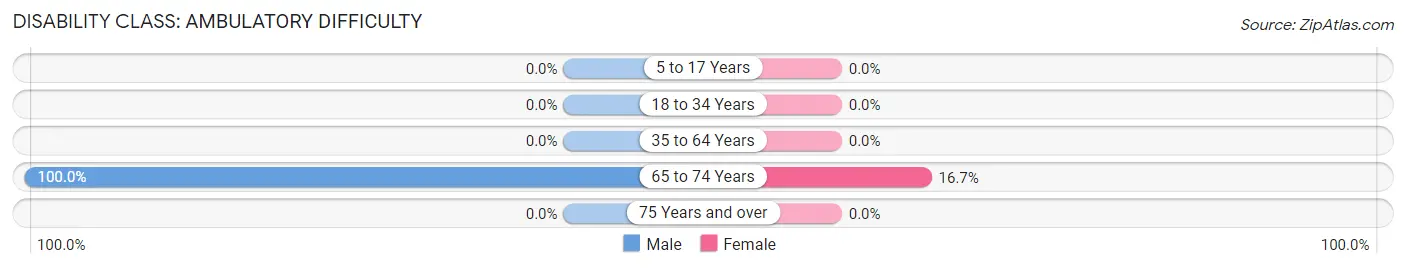
| Age Bracket | Male | Female |
| 5 to 17 Years | 0 (0.0%) | 0 (0.0%) |
| 18 to 34 Years | 0 (0.0%) | 0 (0.0%) |
| 35 to 64 Years | 0 (0.0%) | 0 (0.0%) |
| 65 to 74 Years | 1 (100.0%) | 1 (16.7%) |
| 75 Years and over | 0 (0.0%) | 0 (0.0%) |
Disability Class: Self-Care Difficulty
| Age Bracket | Male | Female |
| 5 to 17 Years | 0 (0.0%) | 0 (0.0%) |
| 18 to 34 Years | 0 (0.0%) | 0 (0.0%) |
| 35 to 64 Years | 0 (0.0%) | 0 (0.0%) |
| 65 to 74 Years | 0 (0.0%) | 0 (0.0%) |
| 75 Years and over | 0 (0.0%) | 0 (0.0%) |
Technology Access in Hamilton
Computing Device Access in Hamilton
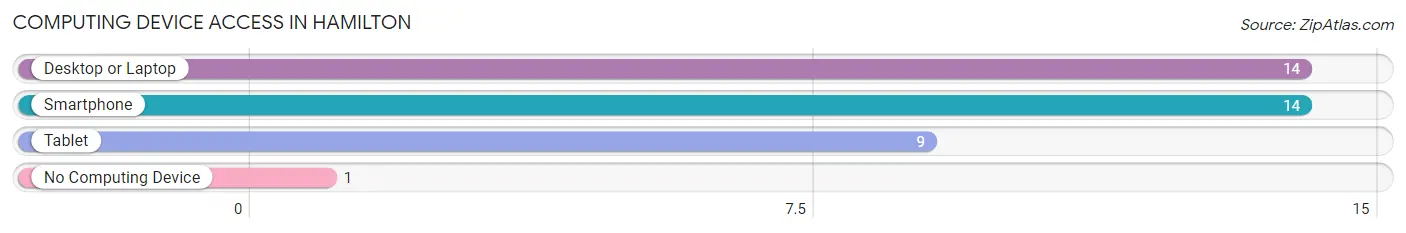
| Device Type | # Households | % Households |
| Desktop or Laptop | 14 | 82.4% |
| Smartphone | 14 | 82.4% |
| Tablet | 9 | 52.9% |
| No Computing Device | 1 | 5.9% |
| Total | 17 | 100.0% |
Internet Access in Hamilton
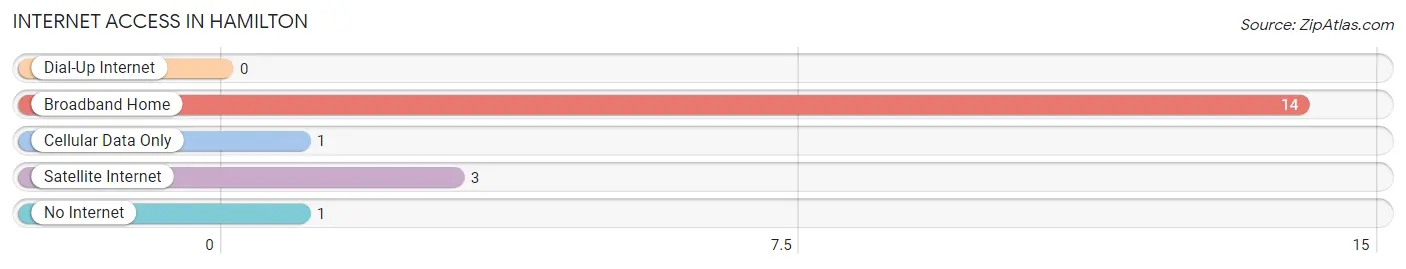
| Internet Type | # Households | % Households |
| Dial-Up Internet | 0 | 0.0% |
| Broadband Home | 14 | 82.4% |
| Cellular Data Only | 1 | 5.9% |
| Satellite Internet | 3 | 17.6% |
| No Internet | 1 | 5.9% |
| Total | 17 | 100.0% |
Hamilton Summary
Hamilton is a small city located in the state of North Dakota. It is located in the southwestern part of the state, about 25 miles from the Montana border. The city has a population of about 1,000 people and is the county seat of Mercer County.
The history of Hamilton dates back to the late 1800s when the Northern Pacific Railroad was built through the area. The city was founded in 1882 and was named after Alexander Hamilton, the first Secretary of the Treasury. The city was incorporated in 1883 and was the first city in North Dakota to be incorporated.
The economy of Hamilton is largely based on agriculture. The city is home to several large farms and ranches, as well as a number of smaller farms. The city also has a number of businesses, including a grocery store, a hardware store, a bank, and a few restaurants.
The geography of Hamilton is mostly flat, with some rolling hills in the area. The city is located in the Missouri River Valley, and the Missouri River runs through the city. The city is also located near the Badlands National Park, which is a popular tourist destination.
The demographics of Hamilton are mostly white, with a small percentage of African Americans, Native Americans, and Hispanics. The median household income in Hamilton is around $45,000, and the median home value is around $100,000. The city has a low unemployment rate, and the cost of living is relatively low.
Hamilton is a small city with a rich history and a strong economy. It is a great place to live and work, and it offers a variety of activities and attractions for visitors and residents alike. The city is a great place to raise a family, and it is a great place to visit for those looking for a quiet, rural lifestyle.
Common Questions
What is Per Capita Income in Hamilton?
Per Capita income in Hamilton is $44,420.
What is the Median Family Income in Hamilton?
Median Family Income in Hamilton is $101,250.
What is the Median Household income in Hamilton?
Median Household Income in Hamilton is $87,813.
What is Inequality or Gini Index in Hamilton?
Inequality or Gini Index in Hamilton is 0.29.
What is the Total Population of Hamilton?
Total Population of Hamilton is 30.
What is the Total Male Population of Hamilton?
Total Male Population of Hamilton is 16.
What is the Total Female Population of Hamilton?
Total Female Population of Hamilton is 14.
What is the Ratio of Males per 100 Females in Hamilton?
There are 114.29 Males per 100 Females in Hamilton.
What is the Ratio of Females per 100 Males in Hamilton?
There are 87.50 Females per 100 Males in Hamilton.
What is the Median Population Age in Hamilton?
Median Population Age in Hamilton is 62.7 Years.
What is the Average Family Size in Hamilton
Average Family Size in Hamilton is 2.2 People.
What is the Average Household Size in Hamilton
Average Household Size in Hamilton is 1.8 People.
How Large is the Labor Force in Hamilton?
There are 21 People in the Labor Forcein in Hamilton.
What is the Percentage of People in the Labor Force in Hamilton?
72.4% of People are in the Labor Force in Hamilton.