Fremont, IA Map & Demographics
Fremont Map
Fremont Overview
$31,243
PER CAPITA INCOME
$80,714
AVG FAMILY INCOME
$61,667
AVG HOUSEHOLD INCOME
29.2%
WAGE / INCOME GAP [ % ]
70.8¢/ $1
WAGE / INCOME GAP [ $ ]
0.41
INEQUALITY / GINI INDEX
810
TOTAL POPULATION
413
MALE POPULATION
397
FEMALE POPULATION
104.03
MALES / 100 FEMALES
96.13
FEMALES / 100 MALES
32.6
MEDIAN AGE
3.1
AVG FAMILY SIZE
2.6
AVG HOUSEHOLD SIZE
450
LABOR FORCE [ PEOPLE ]
76.1%
PERCENT IN LABOR FORCE
3.8%
UNEMPLOYMENT RATE
Fremont Zip Codes
Fremont Area Codes
Income in Fremont
Income Overview in Fremont
Per Capita Income in Fremont is $31,243, while median incomes of families and households are $80,714 and $61,667 respectively.
| Characteristic | Number | Measure |
| Per Capita Income | 810 | $31,243 |
| Median Family Income | 214 | $80,714 |
| Mean Family Income | 214 | $89,279 |
| Median Household Income | 308 | $61,667 |
| Mean Household Income | 308 | $79,764 |
| Income Deficit | 214 | $0 |
| Wage / Income Gap (%) | 810 | 29.22% |
| Wage / Income Gap ($) | 810 | 70.78¢ per $1 |
| Gini / Inequality Index | 810 | 0.41 |
Earnings by Sex in Fremont
Average Earnings in Fremont are $35,000, $41,944 for men and $29,688 for women, a difference of 29.2%.
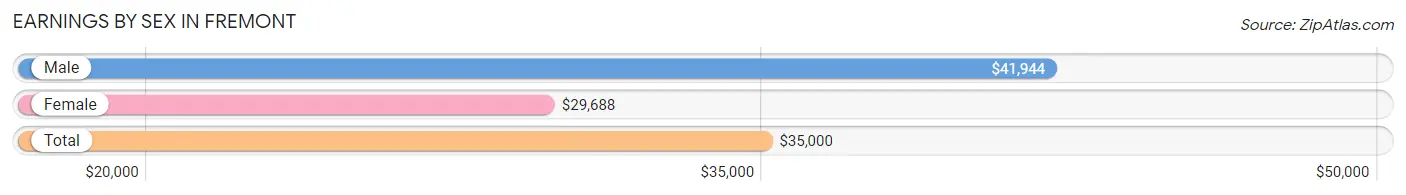
| Sex | Number | Average Earnings |
| Male | 260 (54.4%) | $41,944 |
| Female | 218 (45.6%) | $29,688 |
| Total | 478 (100.0%) | $35,000 |
Earnings by Sex by Income Bracket in Fremont
The most common earnings brackets in Fremont are $100,000+ for men (47 | 18.1%) and $25,000 to $29,999 for women (35 | 16.1%).
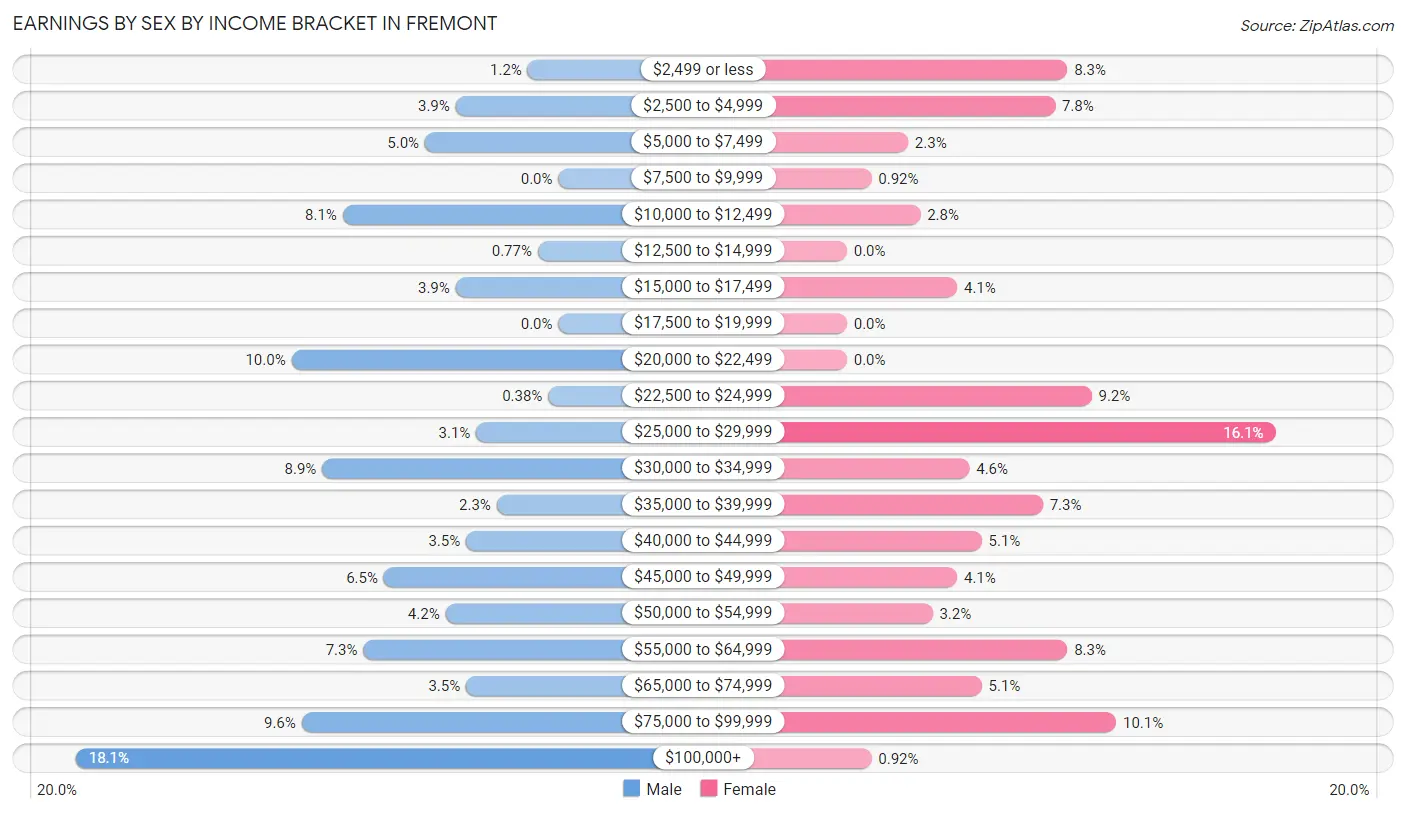
| Income | Male | Female |
| $2,499 or less | 3 (1.1%) | 18 (8.3%) |
| $2,500 to $4,999 | 10 (3.8%) | 17 (7.8%) |
| $5,000 to $7,499 | 13 (5.0%) | 5 (2.3%) |
| $7,500 to $9,999 | 0 (0.0%) | 2 (0.9%) |
| $10,000 to $12,499 | 21 (8.1%) | 6 (2.8%) |
| $12,500 to $14,999 | 2 (0.8%) | 0 (0.0%) |
| $15,000 to $17,499 | 10 (3.8%) | 9 (4.1%) |
| $17,500 to $19,999 | 0 (0.0%) | 0 (0.0%) |
| $20,000 to $22,499 | 26 (10.0%) | 0 (0.0%) |
| $22,500 to $24,999 | 1 (0.4%) | 20 (9.2%) |
| $25,000 to $29,999 | 8 (3.1%) | 35 (16.1%) |
| $30,000 to $34,999 | 23 (8.8%) | 10 (4.6%) |
| $35,000 to $39,999 | 6 (2.3%) | 16 (7.3%) |
| $40,000 to $44,999 | 9 (3.5%) | 11 (5.1%) |
| $45,000 to $49,999 | 17 (6.5%) | 9 (4.1%) |
| $50,000 to $54,999 | 11 (4.2%) | 7 (3.2%) |
| $55,000 to $64,999 | 19 (7.3%) | 18 (8.3%) |
| $65,000 to $74,999 | 9 (3.5%) | 11 (5.1%) |
| $75,000 to $99,999 | 25 (9.6%) | 22 (10.1%) |
| $100,000+ | 47 (18.1%) | 2 (0.9%) |
| Total | 260 (100.0%) | 218 (100.0%) |
Earnings by Sex by Educational Attainment in Fremont
Average earnings in Fremont are $49,500 for men and $36,000 for women, a difference of 27.3%. Men with an educational attainment of bachelor's degree enjoy the highest average annual earnings of $110,536, while those with high school diploma education earn the least with $31,250. Women with an educational attainment of graduate degree earn the most with the average annual earnings of $73,906, while those with high school diploma education have the smallest earnings of $28,359.
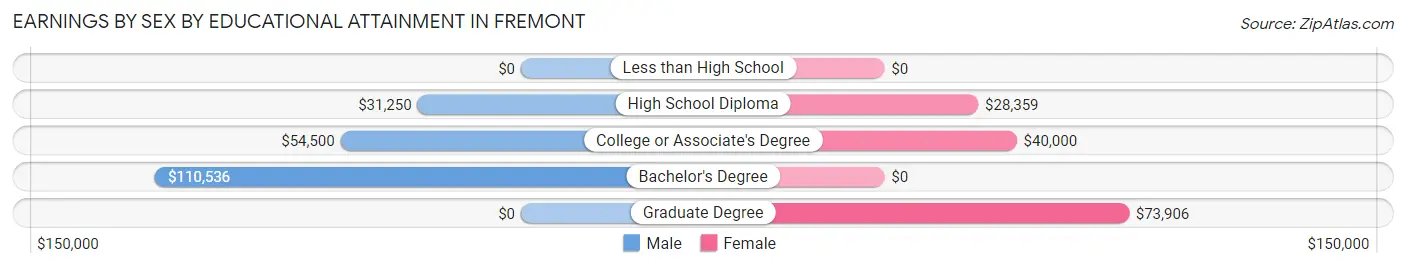
| Educational Attainment | Male Income | Female Income |
| Less than High School | - | - |
| High School Diploma | $31,250 | $28,359 |
| College or Associate's Degree | $54,500 | $40,000 |
| Bachelor's Degree | $110,536 | $0 |
| Graduate Degree | - | - |
| Total | $49,500 | $36,000 |
Family Income in Fremont
Family Income Brackets in Fremont
According to the Fremont family income data, there are 48 families falling into the $75,000 to $99,999 income range, which is the most common income bracket and makes up 22.4% of all families.
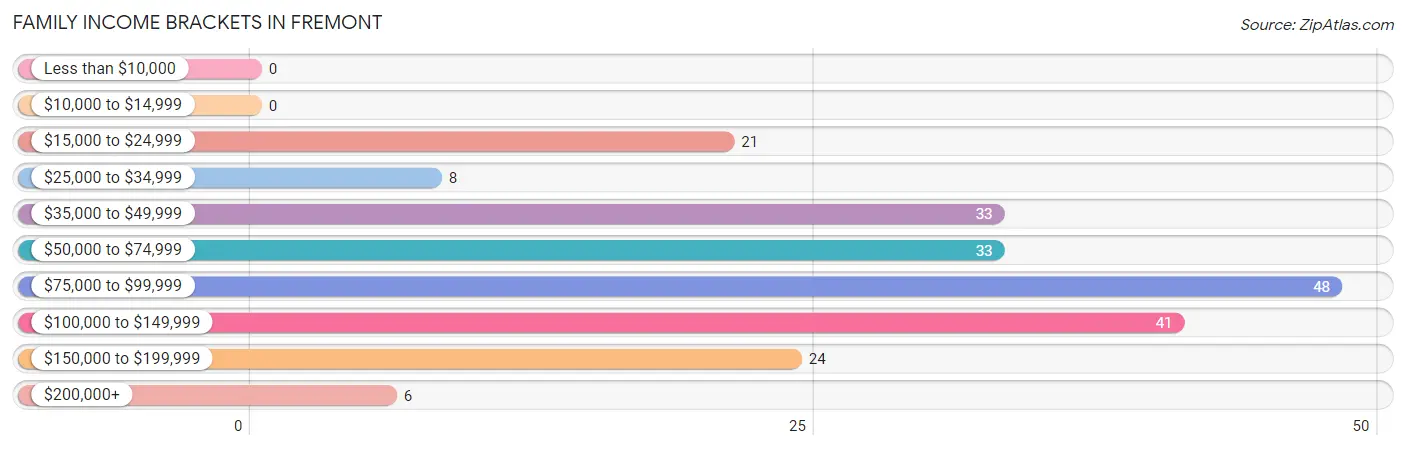
| Income Bracket | # Families | % Families |
| Less than $10,000 | 0 | 0.0% |
| $10,000 to $14,999 | 0 | 0.0% |
| $15,000 to $24,999 | 21 | 9.8% |
| $25,000 to $34,999 | 8 | 3.7% |
| $35,000 to $49,999 | 33 | 15.4% |
| $50,000 to $74,999 | 33 | 15.4% |
| $75,000 to $99,999 | 48 | 22.4% |
| $100,000 to $149,999 | 41 | 19.2% |
| $150,000 to $199,999 | 24 | 11.2% |
| $200,000+ | 6 | 2.8% |
Family Income by Famaliy Size in Fremont
4-person families (35 | 16.4%) account for the highest median family income in Fremont with $102,917 per family, while 2-person families (111 | 51.9%) have the highest median income of $33,438 per family member.
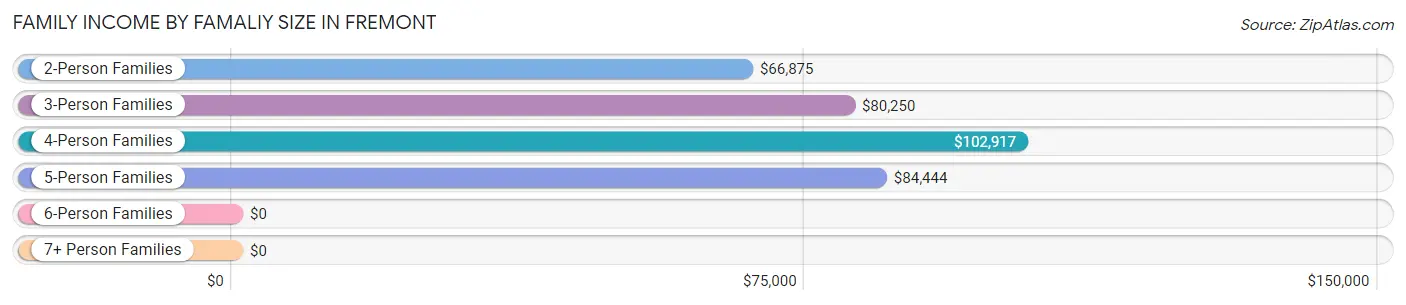
| Income Bracket | # Families | Median Income |
| 2-Person Families | 111 (51.9%) | $66,875 |
| 3-Person Families | 31 (14.5%) | $80,250 |
| 4-Person Families | 35 (16.4%) | $102,917 |
| 5-Person Families | 34 (15.9%) | $84,444 |
| 6-Person Families | 0 (0.0%) | $0 |
| 7+ Person Families | 3 (1.4%) | $0 |
| Total | 214 (100.0%) | $80,714 |
Family Income by Number of Earners in Fremont
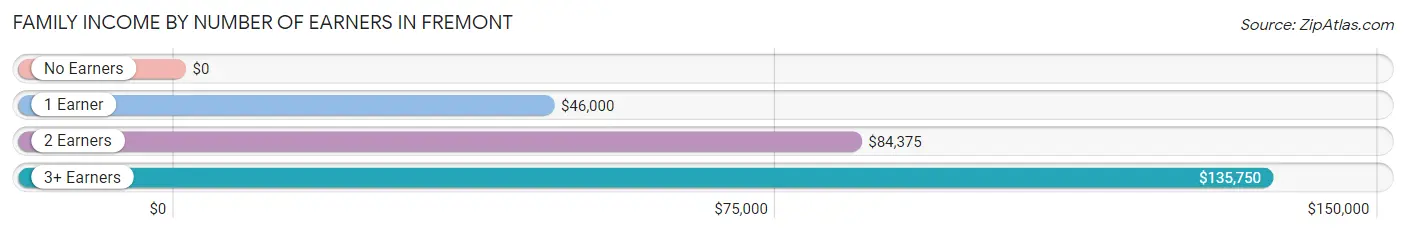
| Number of Earners | # Families | Median Income |
| No Earners | 12 (5.6%) | $0 |
| 1 Earner | 56 (26.2%) | $46,000 |
| 2 Earners | 128 (59.8%) | $84,375 |
| 3+ Earners | 18 (8.4%) | $135,750 |
| Total | 214 (100.0%) | $80,714 |
Household Income in Fremont
Household Income Brackets in Fremont
With 67 households falling in the category, the $100,000 to $149,999 income range is the most frequent in Fremont, accounting for 21.7% of all households. In contrast, only 4 households (1.3%) fall into the $10,000 to $14,999 income bracket, making it the least populous group.
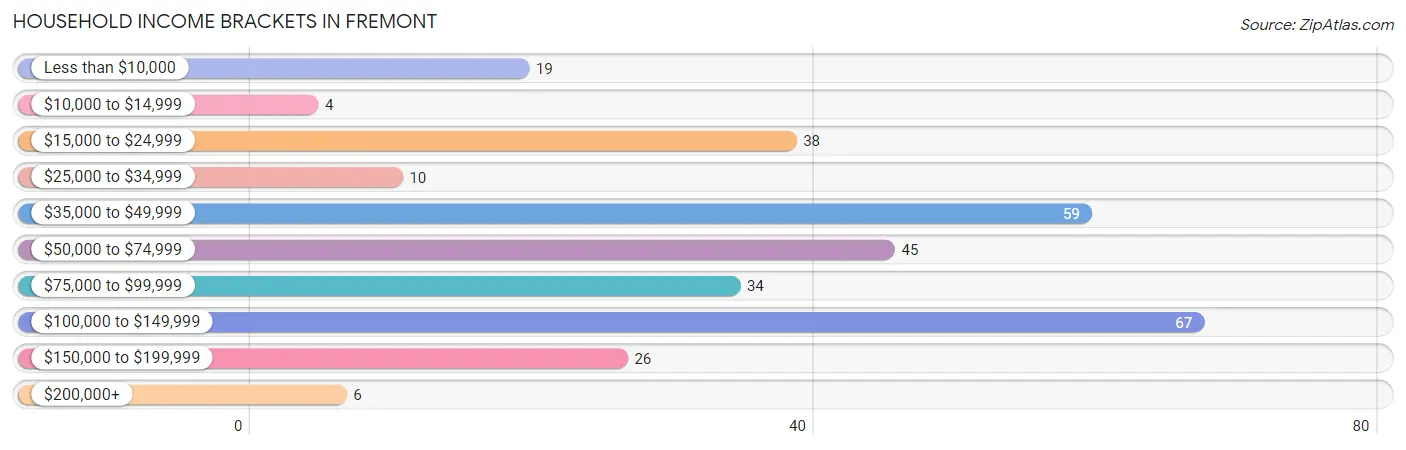
| Income Bracket | # Households | % Households |
| Less than $10,000 | 19 | 6.2% |
| $10,000 to $14,999 | 4 | 1.3% |
| $15,000 to $24,999 | 38 | 12.3% |
| $25,000 to $34,999 | 10 | 3.2% |
| $35,000 to $49,999 | 59 | 19.2% |
| $50,000 to $74,999 | 45 | 14.6% |
| $75,000 to $99,999 | 34 | 11.0% |
| $100,000 to $149,999 | 67 | 21.8% |
| $150,000 to $199,999 | 26 | 8.4% |
| $200,000+ | 6 | 1.9% |
Household Income by Householder Age in Fremont
The median household income in Fremont is $61,667, with the highest median household income of $97,222 found in the 45 to 64 years age bracket for the primary householder. A total of 98 households (31.8%) fall into this category. Meanwhile, the 15 to 24 years age bracket for the primary householder has the lowest median household income of $19,250, with 14 households (4.5%) in this group.
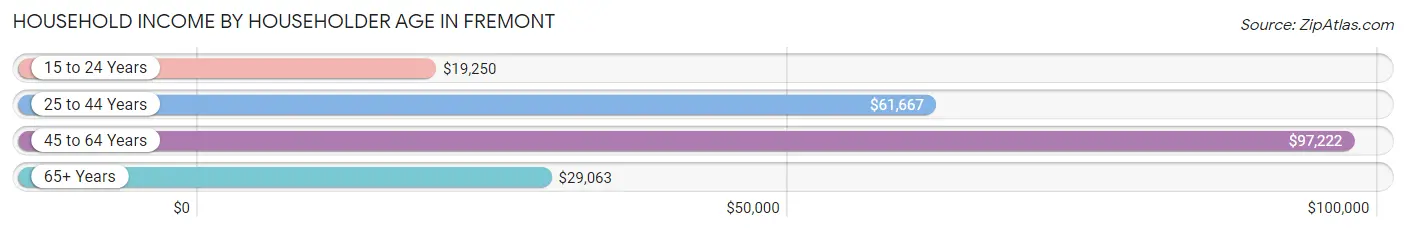
| Income Bracket | # Households | Median Income |
| 15 to 24 Years | 14 (4.5%) | $19,250 |
| 25 to 44 Years | 130 (42.2%) | $61,667 |
| 45 to 64 Years | 98 (31.8%) | $97,222 |
| 65+ Years | 66 (21.4%) | $29,063 |
| Total | 308 (100.0%) | $61,667 |
Poverty in Fremont
Income Below Poverty by Sex and Age in Fremont
With 7.7% poverty level for males and 14.1% for females among the residents of Fremont, 5 year old males and 75 year old and over females are the most vulnerable to poverty, with 6 males (100.0%) and 17 females (51.5%) in their respective age groups living below the poverty level.
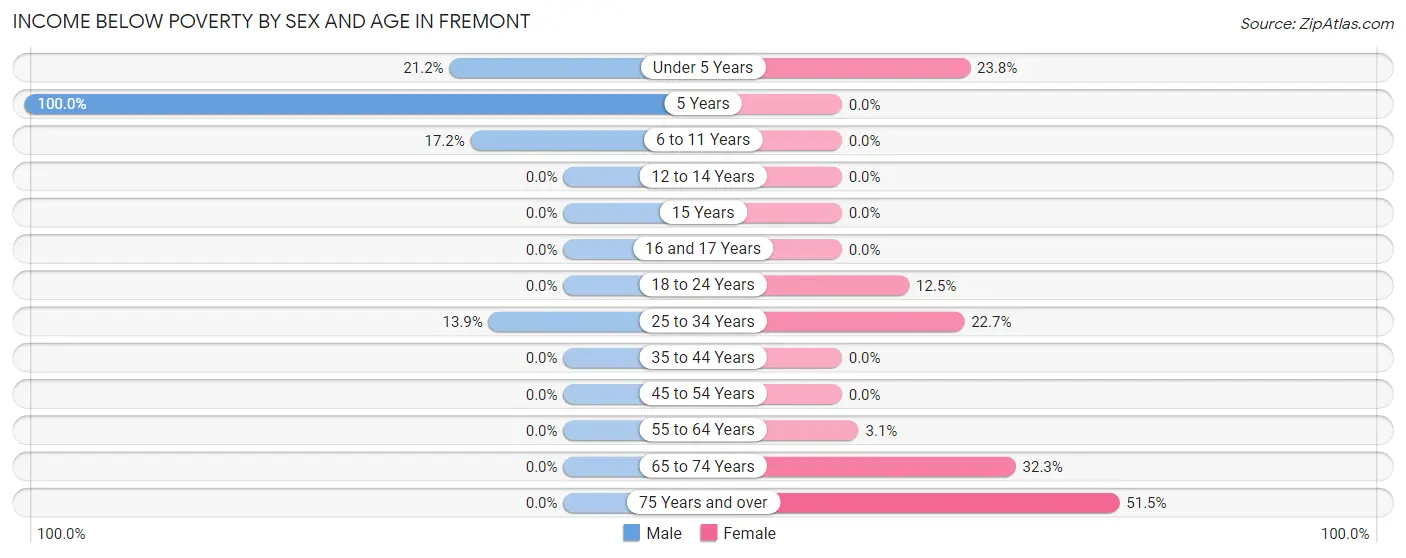
| Age Bracket | Male | Female |
| Under 5 Years | 11 (21.1%) | 10 (23.8%) |
| 5 Years | 6 (100.0%) | 0 (0.0%) |
| 6 to 11 Years | 5 (17.2%) | 0 (0.0%) |
| 12 to 14 Years | 0 (0.0%) | 0 (0.0%) |
| 15 Years | 0 (0.0%) | 0 (0.0%) |
| 16 and 17 Years | 0 (0.0%) | 0 (0.0%) |
| 18 to 24 Years | 0 (0.0%) | 3 (12.5%) |
| 25 to 34 Years | 10 (13.9%) | 15 (22.7%) |
| 35 to 44 Years | 0 (0.0%) | 0 (0.0%) |
| 45 to 54 Years | 0 (0.0%) | 0 (0.0%) |
| 55 to 64 Years | 0 (0.0%) | 1 (3.1%) |
| 65 to 74 Years | 0 (0.0%) | 10 (32.3%) |
| 75 Years and over | 0 (0.0%) | 17 (51.5%) |
| Total | 32 (7.7%) | 56 (14.1%) |
Income Above Poverty by Sex and Age in Fremont
According to the poverty statistics in Fremont, males aged 12 to 14 years and females aged 6 to 11 years are the age groups that are most secure financially, with 100.0% of males and 100.0% of females in these age groups living above the poverty line.
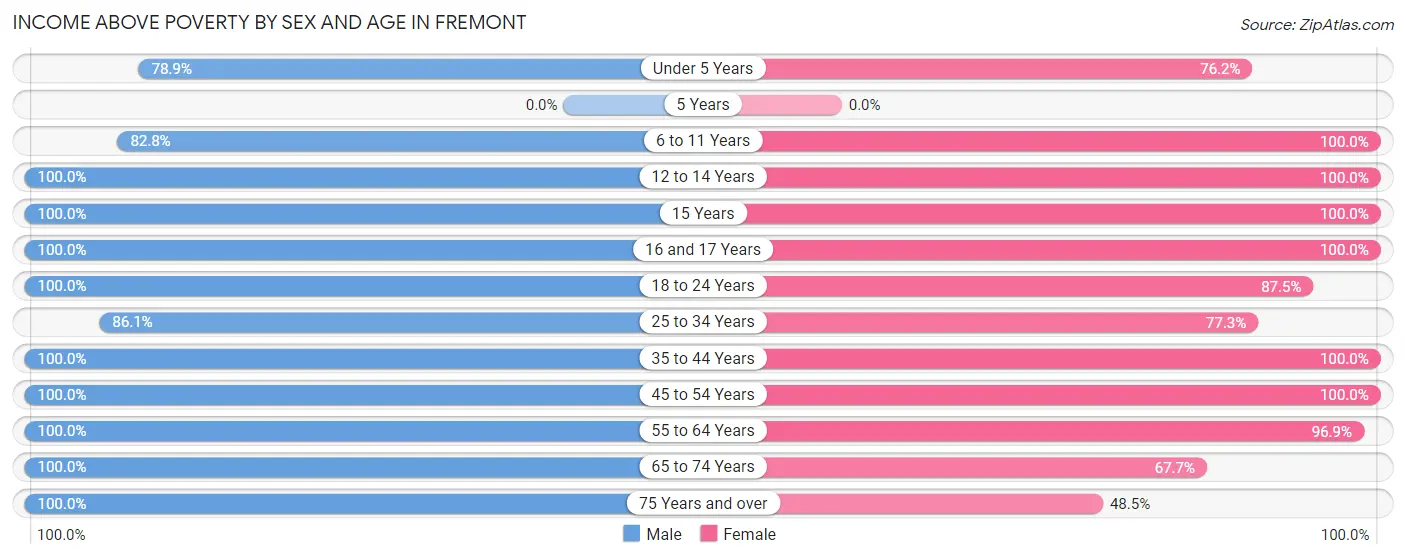
| Age Bracket | Male | Female |
| Under 5 Years | 41 (78.8%) | 32 (76.2%) |
| 5 Years | 0 (0.0%) | 0 (0.0%) |
| 6 to 11 Years | 24 (82.8%) | 31 (100.0%) |
| 12 to 14 Years | 31 (100.0%) | 22 (100.0%) |
| 15 Years | 2 (100.0%) | 4 (100.0%) |
| 16 and 17 Years | 5 (100.0%) | 18 (100.0%) |
| 18 to 24 Years | 42 (100.0%) | 21 (87.5%) |
| 25 to 34 Years | 62 (86.1%) | 51 (77.3%) |
| 35 to 44 Years | 57 (100.0%) | 35 (100.0%) |
| 45 to 54 Years | 39 (100.0%) | 59 (100.0%) |
| 55 to 64 Years | 50 (100.0%) | 31 (96.9%) |
| 65 to 74 Years | 17 (100.0%) | 21 (67.7%) |
| 75 Years and over | 11 (100.0%) | 16 (48.5%) |
| Total | 381 (92.2%) | 341 (85.9%) |
Income Below Poverty Among Married-Couple Families in Fremont
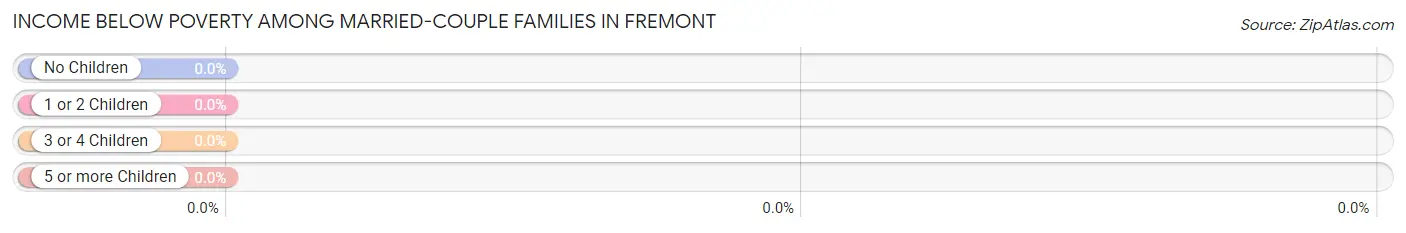
| Children | Above Poverty | Below Poverty |
| No Children | 100 (100.0%) | 0 (0.0%) |
| 1 or 2 Children | 29 (100.0%) | 0 (0.0%) |
| 3 or 4 Children | 15 (100.0%) | 0 (0.0%) |
| 5 or more Children | 3 (100.0%) | 0 (0.0%) |
| Total | 147 (100.0%) | 0 (0.0%) |
Income Below Poverty Among Single-Parent Households in Fremont
| Children | Single Father | Single Mother |
| No Children | 0 (0.0%) | 0 (0.0%) |
| 1 or 2 Children | 0 (0.0%) | 15 (39.5%) |
| 3 or 4 Children | 0 (0.0%) | 0 (0.0%) |
| 5 or more Children | 0 (0.0%) | 0 (0.0%) |
| Total | 0 (0.0%) | 15 (28.8%) |
Income Below Poverty Among Married-Couple vs Single-Parent Households in Fremont
| Children | Married-Couple Families | Single-Parent Households |
| No Children | 0 (0.0%) | 0 (0.0%) |
| 1 or 2 Children | 0 (0.0%) | 15 (28.3%) |
| 3 or 4 Children | 0 (0.0%) | 0 (0.0%) |
| 5 or more Children | 0 (0.0%) | 0 (0.0%) |
| Total | 0 (0.0%) | 15 (22.4%) |
Race in Fremont
The most populous races in Fremont are White / Caucasian (769 | 94.9%), Two or more Races (29 | 3.6%), and Black / African American (12 | 1.5%).
| Race | # Population | % Population |
| Asian | 0 | 0.0% |
| Black / African American | 12 | 1.5% |
| Hawaiian / Pacific | 0 | 0.0% |
| Hispanic or Latino | 10 | 1.2% |
| Native / Alaskan | 0 | 0.0% |
| White / Caucasian | 769 | 94.9% |
| Two or more Races | 29 | 3.6% |
| Some other Race | 0 | 0.0% |
| Total | 810 | 100.0% |
Ancestry in Fremont
The most populous ancestries reported in Fremont are German (155 | 19.1%), American (98 | 12.1%), Irish (93 | 11.5%), English (62 | 7.6%), and Dutch (58 | 7.2%), together accounting for 57.5% of all Fremont residents.
| Ancestry | # Population | % Population |
| American | 98 | 12.1% |
| Arab | 15 | 1.8% |
| Central American | 4 | 0.5% |
| Cherokee | 1 | 0.1% |
| Dutch | 58 | 7.2% |
| English | 62 | 7.6% |
| European | 20 | 2.5% |
| French | 5 | 0.6% |
| German | 155 | 19.1% |
| Greek | 24 | 3.0% |
| Guatemalan | 4 | 0.5% |
| Irish | 93 | 11.5% |
| Italian | 7 | 0.9% |
| Mexican | 6 | 0.7% |
| Norwegian | 2 | 0.3% |
| Polish | 7 | 0.9% |
| Russian | 10 | 1.2% |
| Scottish | 2 | 0.3% |
| Subsaharan African | 12 | 1.5% |
| Swedish | 12 | 1.5% |
| Syrian | 15 | 1.8% | View All 21 Rows |
Immigrants in Fremont
The most numerous immigrant groups reported in Fremont came from Africa (12 | 1.5%), Cameroon (12 | 1.5%), and Middle Africa (12 | 1.5%), together accounting for 4.4% of all Fremont residents.
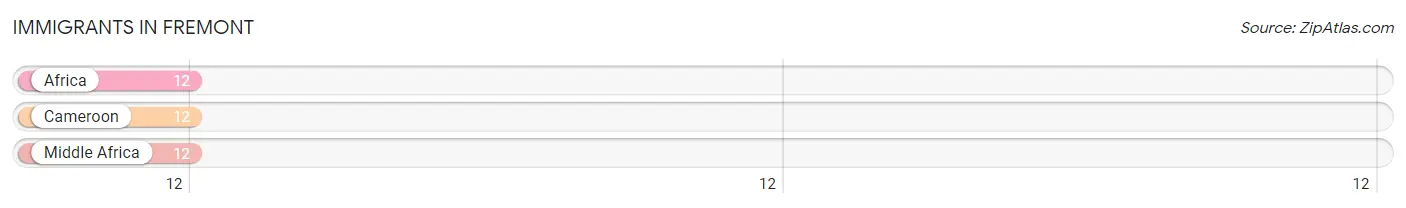
| Immigration Origin | # Population | % Population |
| Africa | 12 | 1.5% |
| Cameroon | 12 | 1.5% |
| Middle Africa | 12 | 1.5% | View All 3 Rows |
Sex and Age in Fremont
Sex and Age in Fremont
The most populous age groups in Fremont are Under 5 Years (52 | 12.6%) for men and Under 5 Years (42 | 10.6%) for women.
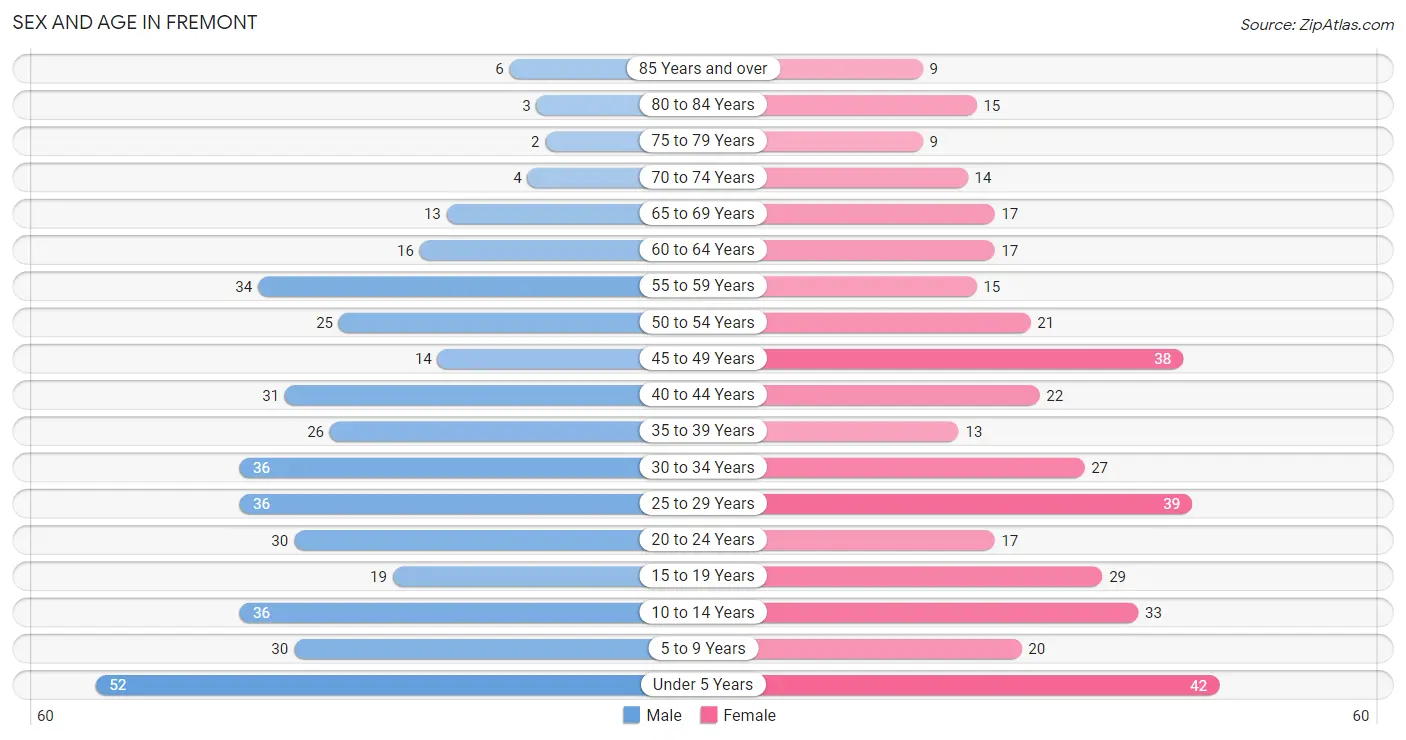
| Age Bracket | Male | Female |
| Under 5 Years | 52 (12.6%) | 42 (10.6%) |
| 5 to 9 Years | 30 (7.3%) | 20 (5.0%) |
| 10 to 14 Years | 36 (8.7%) | 33 (8.3%) |
| 15 to 19 Years | 19 (4.6%) | 29 (7.3%) |
| 20 to 24 Years | 30 (7.3%) | 17 (4.3%) |
| 25 to 29 Years | 36 (8.7%) | 39 (9.8%) |
| 30 to 34 Years | 36 (8.7%) | 27 (6.8%) |
| 35 to 39 Years | 26 (6.3%) | 13 (3.3%) |
| 40 to 44 Years | 31 (7.5%) | 22 (5.5%) |
| 45 to 49 Years | 14 (3.4%) | 38 (9.6%) |
| 50 to 54 Years | 25 (6.0%) | 21 (5.3%) |
| 55 to 59 Years | 34 (8.2%) | 15 (3.8%) |
| 60 to 64 Years | 16 (3.9%) | 17 (4.3%) |
| 65 to 69 Years | 13 (3.2%) | 17 (4.3%) |
| 70 to 74 Years | 4 (1.0%) | 14 (3.5%) |
| 75 to 79 Years | 2 (0.5%) | 9 (2.3%) |
| 80 to 84 Years | 3 (0.7%) | 15 (3.8%) |
| 85 Years and over | 6 (1.5%) | 9 (2.3%) |
| Total | 413 (100.0%) | 397 (100.0%) |
Families and Households in Fremont
Median Family Size in Fremont
The median family size in Fremont is 3.15 persons per family, with single female/mother families (52 | 24.3%) accounting for the largest median family size of 3.67 persons per family. On the other hand, single male/father families (15 | 7.0%) represent the smallest median family size with 1.93 persons per family.
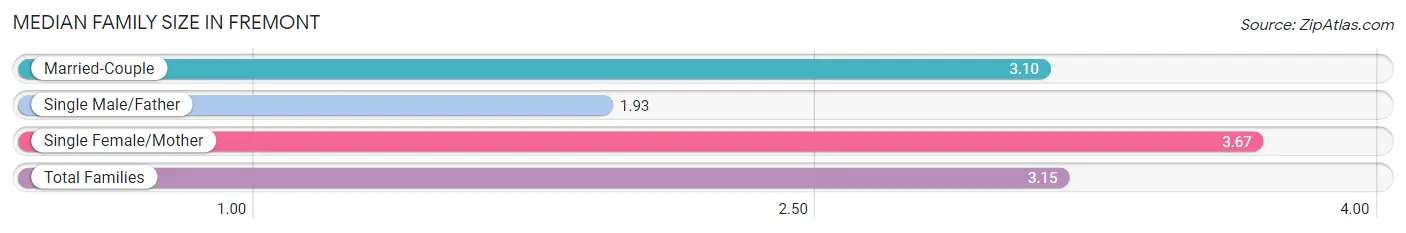
| Family Type | # Families | Family Size |
| Married-Couple | 147 (68.7%) | 3.10 |
| Single Male/Father | 15 (7.0%) | 1.93 |
| Single Female/Mother | 52 (24.3%) | 3.67 |
| Total Families | 214 (100.0%) | 3.15 |
Median Household Size in Fremont
The median household size in Fremont is 2.63 persons per household, with single female/mother households (52 | 16.9%) accounting for the largest median household size of 4.06 persons per household. non-family households (94 | 30.5%) represent the smallest median household size with 1.05 persons per household.
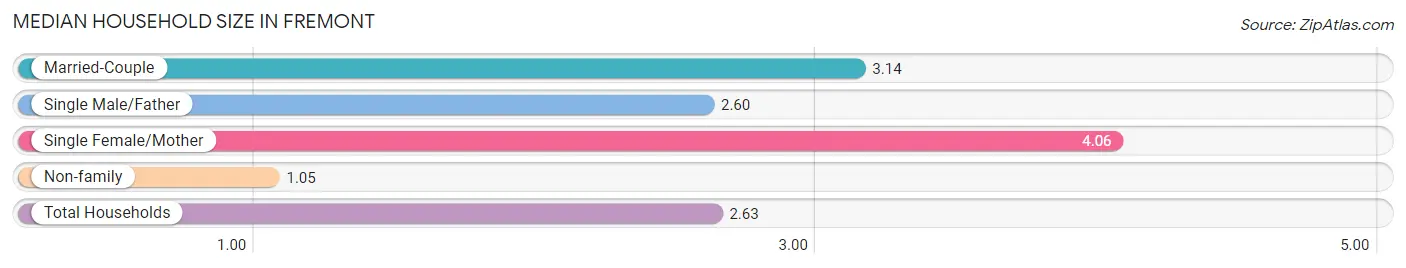
| Household Type | # Households | Household Size |
| Married-Couple | 147 (47.7%) | 3.14 |
| Single Male/Father | 15 (4.9%) | 2.60 |
| Single Female/Mother | 52 (16.9%) | 4.06 |
| Non-family | 94 (30.5%) | 1.05 |
| Total Households | 308 (100.0%) | 2.63 |
Household Size by Marriage Status in Fremont
Out of a total of 308 households in Fremont, 214 (69.5%) are family households, while 94 (30.5%) are nonfamily households. The most numerous type of family households are 2-person households, comprising 101, and the most common type of nonfamily households are 1-person households, comprising 88.
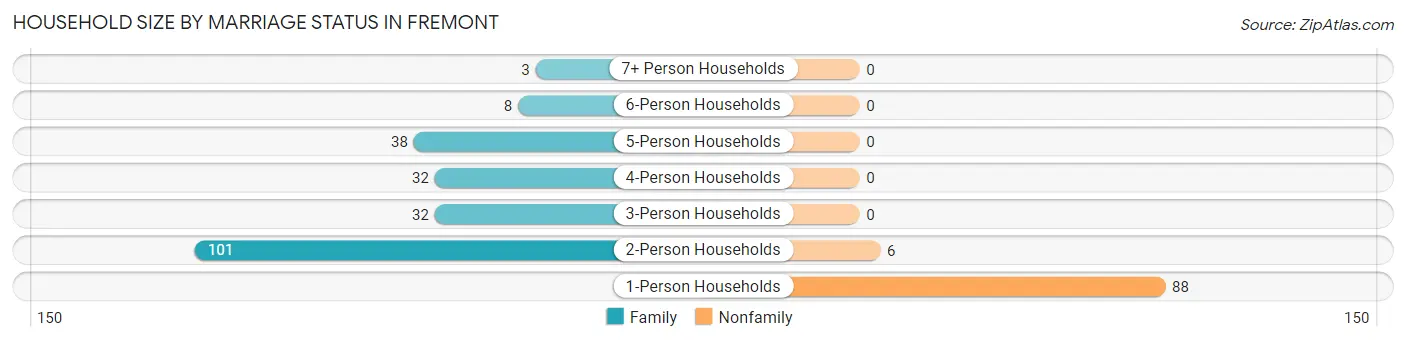
| Household Size | Family Households | Nonfamily Households |
| 1-Person Households | - | 88 (28.6%) |
| 2-Person Households | 101 (32.8%) | 6 (1.9%) |
| 3-Person Households | 32 (10.4%) | 0 (0.0%) |
| 4-Person Households | 32 (10.4%) | 0 (0.0%) |
| 5-Person Households | 38 (12.3%) | 0 (0.0%) |
| 6-Person Households | 8 (2.6%) | 0 (0.0%) |
| 7+ Person Households | 3 (1.0%) | 0 (0.0%) |
| Total | 214 (69.5%) | 94 (30.5%) |
Female Fertility in Fremont
Fertility by Age in Fremont
Average fertility rate in Fremont is 40.0 births per 1,000 women. Women in the age bracket of 20 to 34 years have the highest fertility rate with 96.0 births per 1,000 women. Women in the age bracket of 20 to 34 years acount for 100.0% of all women with births.
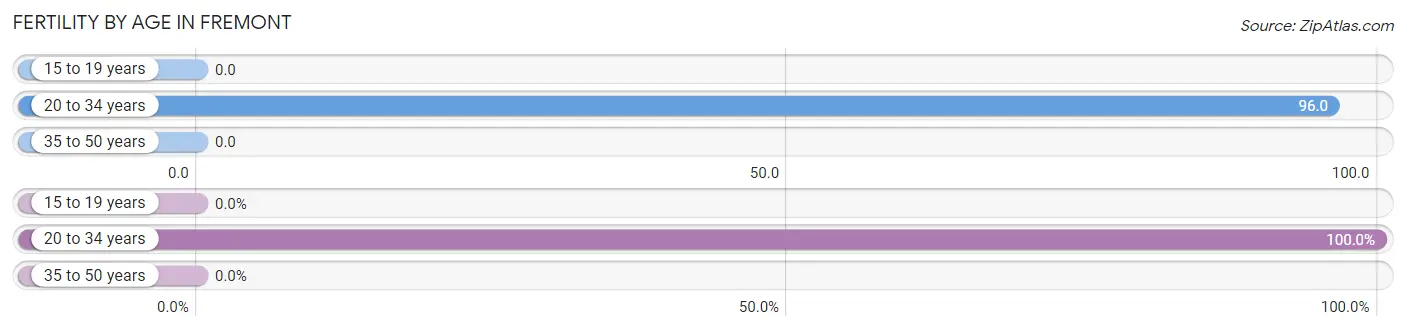
| Age Bracket | Women with Births | Births / 1,000 Women |
| 15 to 19 years | 0 (0.0%) | 0.0 |
| 20 to 34 years | 8 (100.0%) | 96.0 |
| 35 to 50 years | 0 (0.0%) | 0.0 |
| Total | 8 (100.0%) | 40.0 |
Fertility by Age by Marriage Status in Fremont
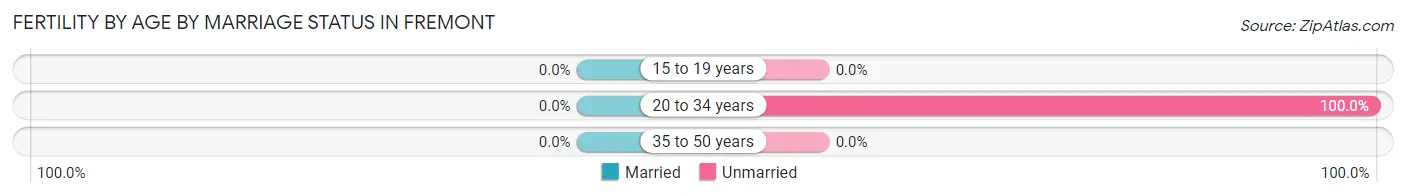
| Age Bracket | Married | Unmarried |
| 15 to 19 years | 0 (0.0%) | 0 (0.0%) |
| 20 to 34 years | 0 (0.0%) | 8 (100.0%) |
| 35 to 50 years | 0 (0.0%) | 0 (0.0%) |
| Total | 0 (0.0%) | 8 (100.0%) |
Fertility by Education in Fremont
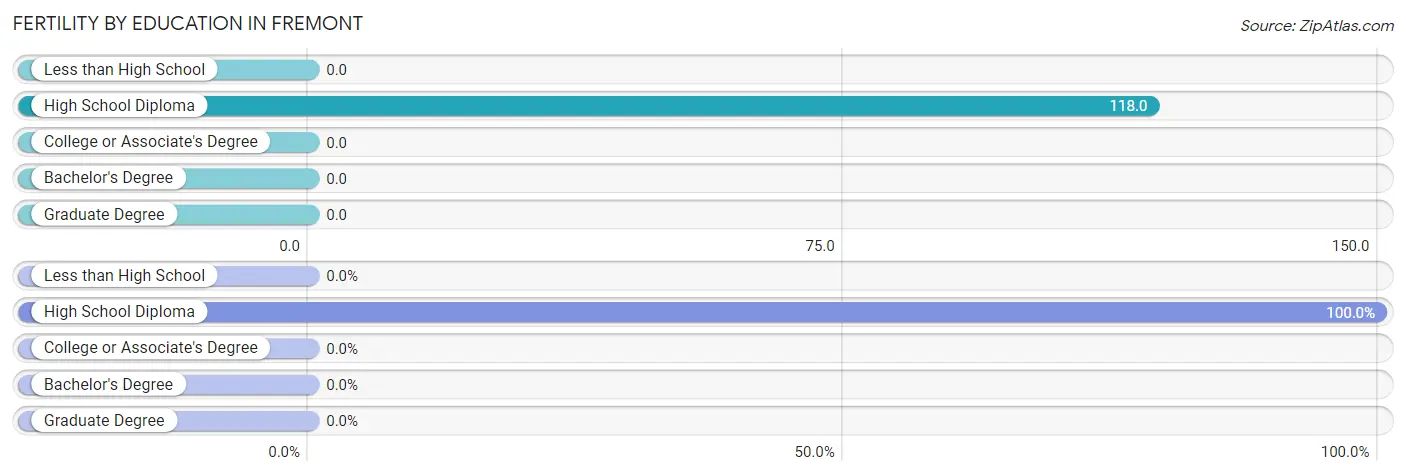
| Educational Attainment | Women with Births | Births / 1,000 Women |
| Less than High School | 0 (0.0%) | 0.0 |
| High School Diploma | 8 (100.0%) | 118.0 |
| College or Associate's Degree | 0 (0.0%) | 0.0 |
| Bachelor's Degree | 0 (0.0%) | 0.0 |
| Graduate Degree | 0 (0.0%) | 0.0 |
| Total | 8 (100.0%) | 40.0 |
Fertility by Education by Marriage Status in Fremont
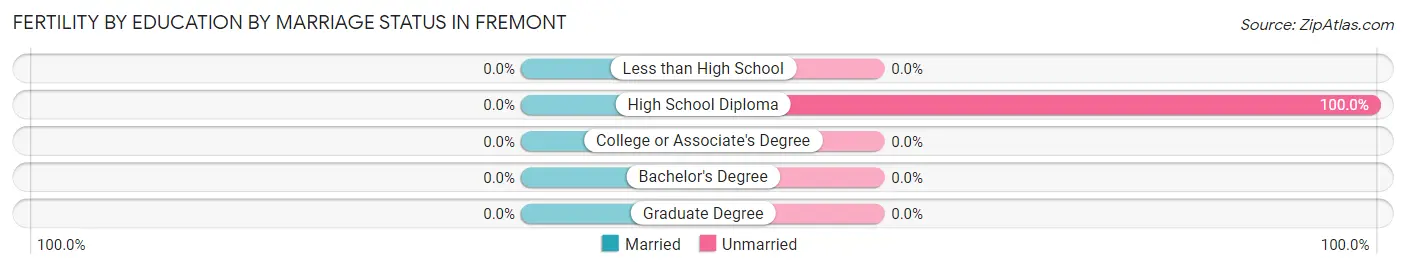
| Educational Attainment | Married | Unmarried |
| Less than High School | 0 (0.0%) | 0 (0.0%) |
| High School Diploma | 0 (0.0%) | 8 (100.0%) |
| College or Associate's Degree | 0 (0.0%) | 0 (0.0%) |
| Bachelor's Degree | 0 (0.0%) | 0 (0.0%) |
| Graduate Degree | 0 (0.0%) | 0 (0.0%) |
| Total | 0 (0.0%) | 8 (100.0%) |
Employment Characteristics in Fremont
Employment by Class of Employer in Fremont
Among the 423 employed individuals in Fremont, private company employees (321 | 75.9%), local government employees (37 | 8.7%), and not-for-profit organizations (22 | 5.2%) make up the most common classes of employment.
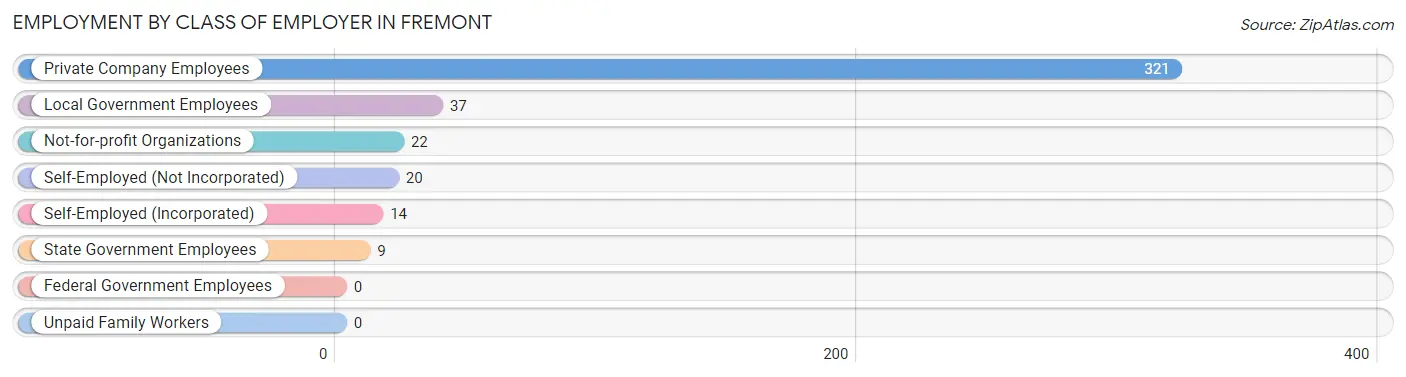
| Employer Class | # Employees | % Employees |
| Private Company Employees | 321 | 75.9% |
| Self-Employed (Incorporated) | 14 | 3.3% |
| Self-Employed (Not Incorporated) | 20 | 4.7% |
| Not-for-profit Organizations | 22 | 5.2% |
| Local Government Employees | 37 | 8.7% |
| State Government Employees | 9 | 2.1% |
| Federal Government Employees | 0 | 0.0% |
| Unpaid Family Workers | 0 | 0.0% |
| Total | 423 | 100.0% |
Employment Status by Age in Fremont
According to the labor force statistics for Fremont, out of the total population over 16 years of age (591), 76.1% or 450 individuals are in the labor force, with 3.8% or 17 of them unemployed. The age group with the highest labor force participation rate is 45 to 54 years, with 100.0% or 98 individuals in the labor force. Within the labor force, the 20 to 24 years age range has the highest percentage of unemployed individuals, with 17.6% or 6 of them being unemployed.
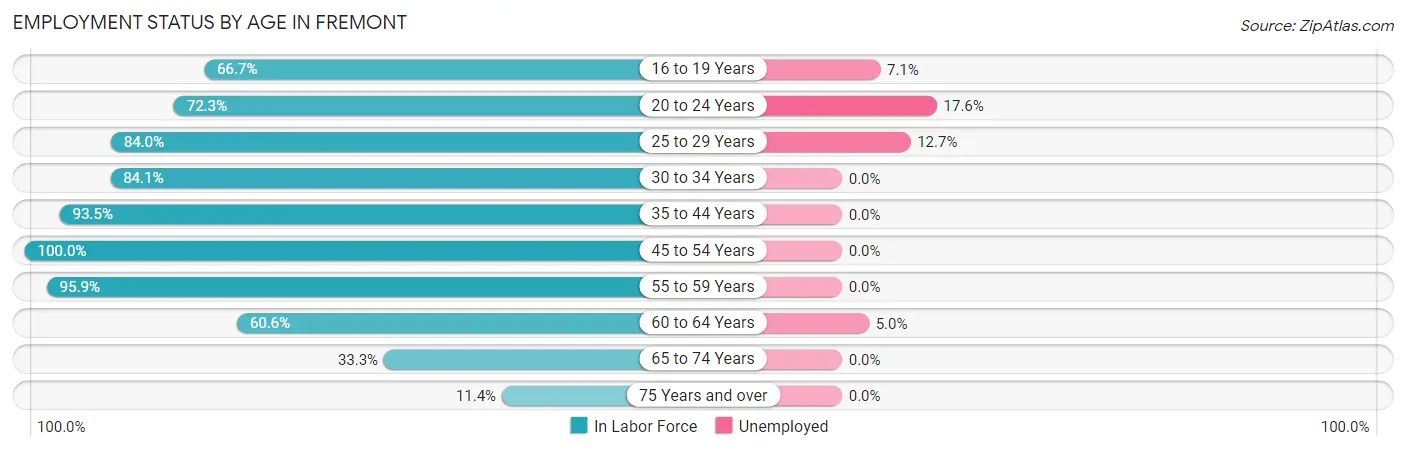
| Age Bracket | In Labor Force | Unemployed |
| 16 to 19 Years | 28 (66.7%) | 2 (7.1%) |
| 20 to 24 Years | 34 (72.3%) | 6 (17.6%) |
| 25 to 29 Years | 63 (84.0%) | 8 (12.7%) |
| 30 to 34 Years | 53 (84.1%) | 0 (0.0%) |
| 35 to 44 Years | 86 (93.5%) | 0 (0.0%) |
| 45 to 54 Years | 98 (100.0%) | 0 (0.0%) |
| 55 to 59 Years | 47 (95.9%) | 0 (0.0%) |
| 60 to 64 Years | 20 (60.6%) | 1 (5.0%) |
| 65 to 74 Years | 16 (33.3%) | 0 (0.0%) |
| 75 Years and over | 5 (11.4%) | 0 (0.0%) |
| Total | 450 (76.1%) | 17 (3.8%) |
Employment Status by Educational Attainment in Fremont
According to labor force statistics for Fremont, 89.5% of individuals (367) out of the total population between 25 and 64 years of age (410) are in the labor force, with 2.5% or 9 of them being unemployed. The group with the highest labor force participation rate are those with the educational attainment of college / associate degree, with 93.2% or 207 individuals in the labor force. Within the labor force, individuals with high school diploma education have the highest percentage of unemployment, with 8.0% or 8 of them being unemployed.
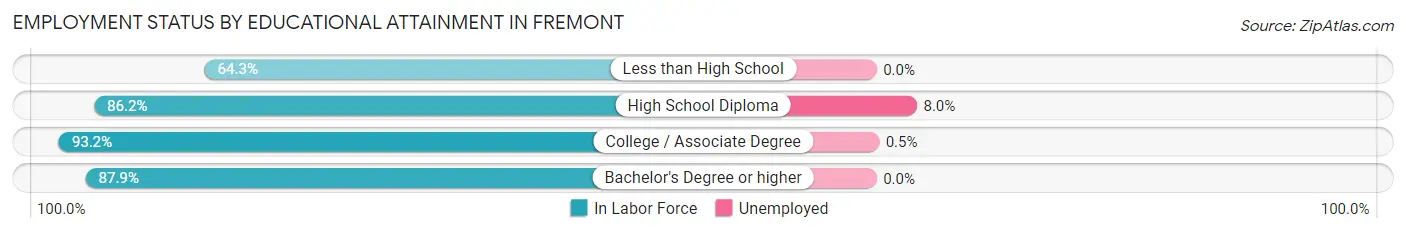
| Educational Attainment | In Labor Force | Unemployed |
| Less than High School | 9 (64.3%) | 0 (0.0%) |
| High School Diploma | 100 (86.2%) | 9 (8.0%) |
| College / Associate Degree | 207 (93.2%) | 1 (0.5%) |
| Bachelor's Degree or higher | 51 (87.9%) | 0 (0.0%) |
| Total | 367 (89.5%) | 10 (2.5%) |
Employment Occupations by Sex in Fremont
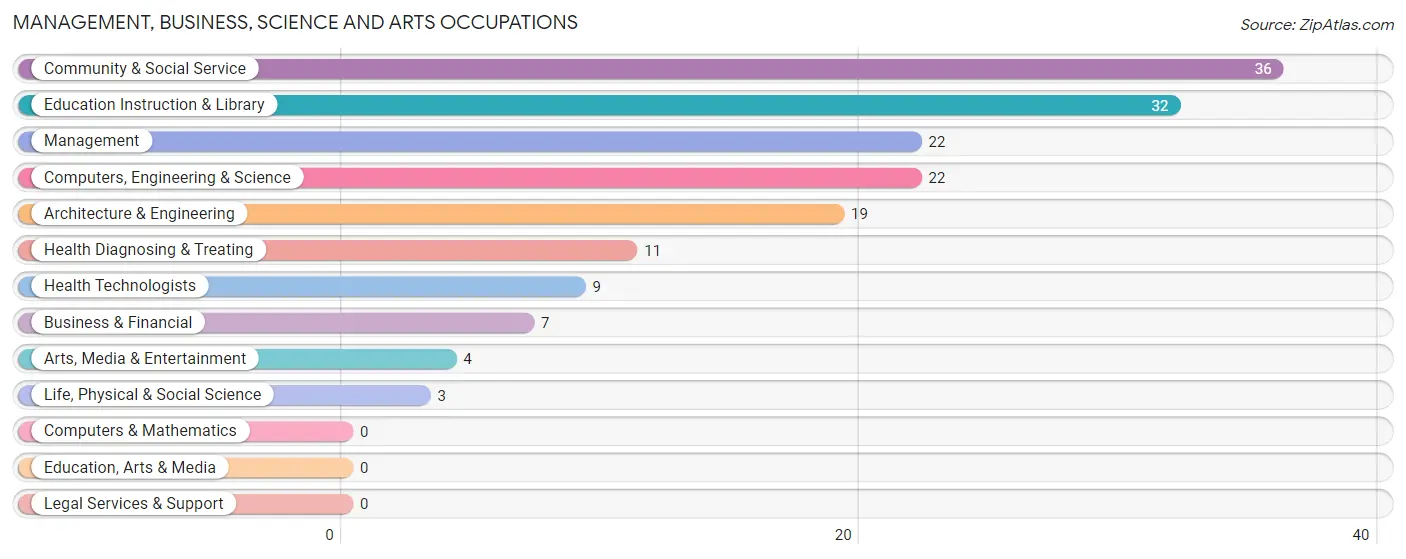
Management, Business, Science and Arts Occupations
The most common Management, Business, Science and Arts occupations in Fremont are Community & Social Service (36 | 8.3%), Education Instruction & Library (32 | 7.4%), Management (22 | 5.1%), Computers, Engineering & Science (22 | 5.1%), and Architecture & Engineering (19 | 4.4%).
Management, Business, Science and Arts Occupations by Sex
Within the Management, Business, Science and Arts occupations in Fremont, the most male-oriented occupations are Management (100.0%), Life, Physical & Social Science (100.0%), and Arts, Media & Entertainment (100.0%), while the most female-oriented occupations are Business & Financial (100.0%), Health Diagnosing & Treating (100.0%), and Health Technologists (100.0%).
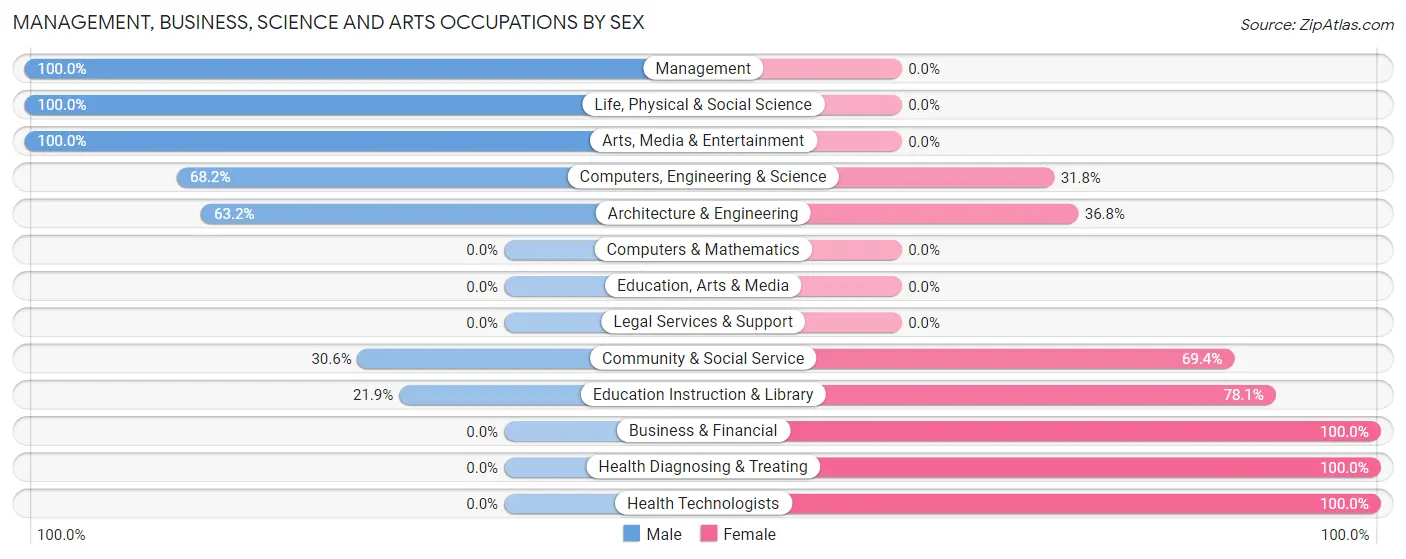
| Occupation | Male | Female |
| Management | 22 (100.0%) | 0 (0.0%) |
| Business & Financial | 0 (0.0%) | 7 (100.0%) |
| Computers, Engineering & Science | 15 (68.2%) | 7 (31.8%) |
| Computers & Mathematics | 0 (0.0%) | 0 (0.0%) |
| Architecture & Engineering | 12 (63.2%) | 7 (36.8%) |
| Life, Physical & Social Science | 3 (100.0%) | 0 (0.0%) |
| Community & Social Service | 11 (30.6%) | 25 (69.4%) |
| Education, Arts & Media | 0 (0.0%) | 0 (0.0%) |
| Legal Services & Support | 0 (0.0%) | 0 (0.0%) |
| Education Instruction & Library | 7 (21.9%) | 25 (78.1%) |
| Arts, Media & Entertainment | 4 (100.0%) | 0 (0.0%) |
| Health Diagnosing & Treating | 0 (0.0%) | 11 (100.0%) |
| Health Technologists | 0 (0.0%) | 9 (100.0%) |
| Total (Category) | 48 (49.0%) | 50 (51.0%) |
| Total (Overall) | 247 (57.0%) | 186 (43.0%) |
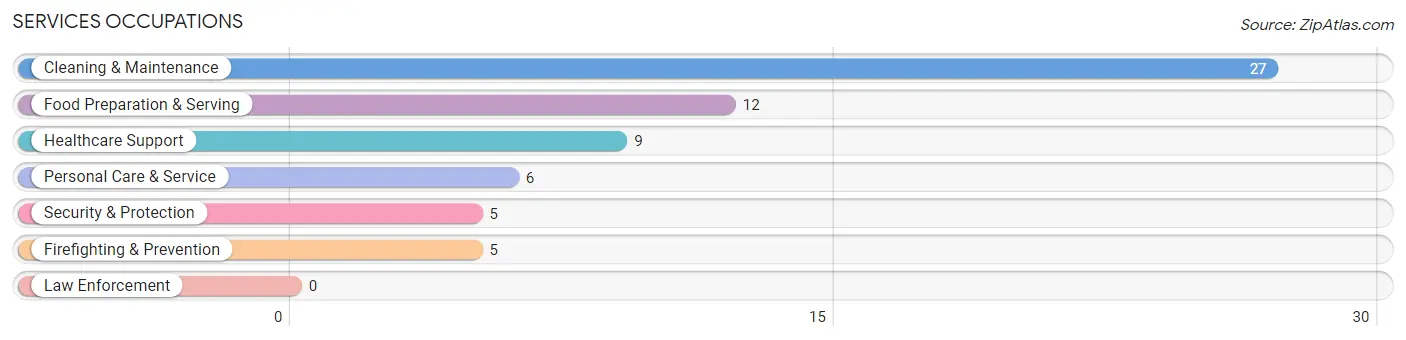
Services Occupations
The most common Services occupations in Fremont are Cleaning & Maintenance (27 | 6.2%), Food Preparation & Serving (12 | 2.8%), Healthcare Support (9 | 2.1%), Personal Care & Service (6 | 1.4%), and Security & Protection (5 | 1.1%).
Services Occupations by Sex
Within the Services occupations in Fremont, the most male-oriented occupations are Security & Protection (100.0%), Firefighting & Prevention (100.0%), and Healthcare Support (22.2%), while the most female-oriented occupations are Food Preparation & Serving (100.0%), Personal Care & Service (100.0%), and Healthcare Support (77.8%).
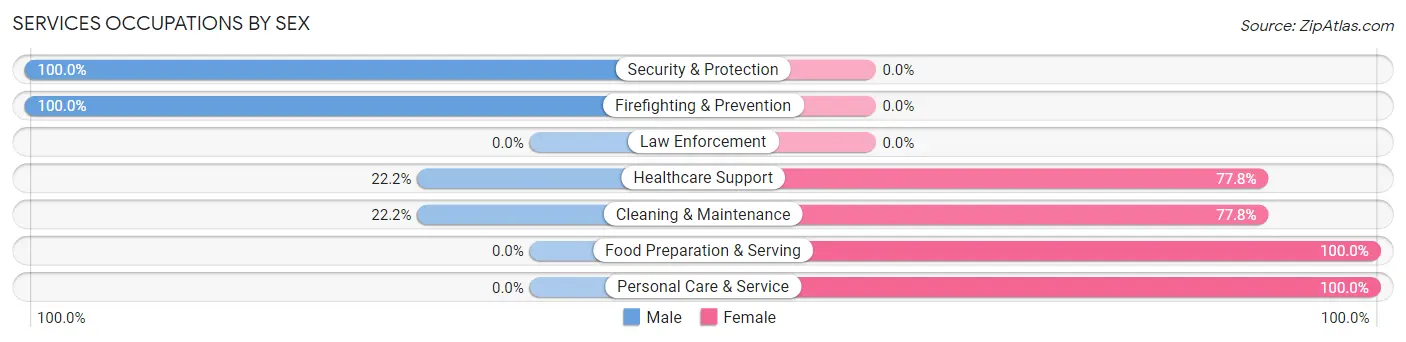
| Occupation | Male | Female |
| Healthcare Support | 2 (22.2%) | 7 (77.8%) |
| Security & Protection | 5 (100.0%) | 0 (0.0%) |
| Firefighting & Prevention | 5 (100.0%) | 0 (0.0%) |
| Law Enforcement | 0 (0.0%) | 0 (0.0%) |
| Food Preparation & Serving | 0 (0.0%) | 12 (100.0%) |
| Cleaning & Maintenance | 6 (22.2%) | 21 (77.8%) |
| Personal Care & Service | 0 (0.0%) | 6 (100.0%) |
| Total (Category) | 13 (22.0%) | 46 (78.0%) |
| Total (Overall) | 247 (57.0%) | 186 (43.0%) |
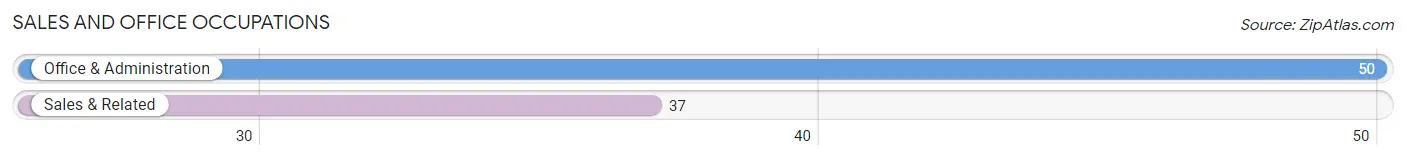
Sales and Office Occupations
The most common Sales and Office occupations in Fremont are Office & Administration (50 | 11.6%), and Sales & Related (37 | 8.6%).
Sales and Office Occupations by Sex
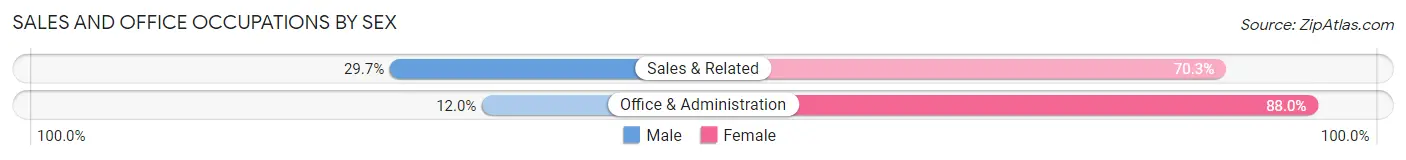
| Occupation | Male | Female |
| Sales & Related | 11 (29.7%) | 26 (70.3%) |
| Office & Administration | 6 (12.0%) | 44 (88.0%) |
| Total (Category) | 17 (19.5%) | 70 (80.5%) |
| Total (Overall) | 247 (57.0%) | 186 (43.0%) |
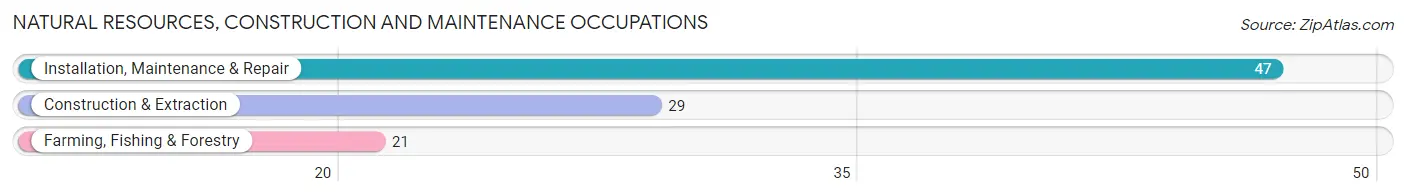
Natural Resources, Construction and Maintenance Occupations
The most common Natural Resources, Construction and Maintenance occupations in Fremont are Installation, Maintenance & Repair (47 | 10.8%), Construction & Extraction (29 | 6.7%), and Farming, Fishing & Forestry (21 | 4.9%).
Natural Resources, Construction and Maintenance Occupations by Sex
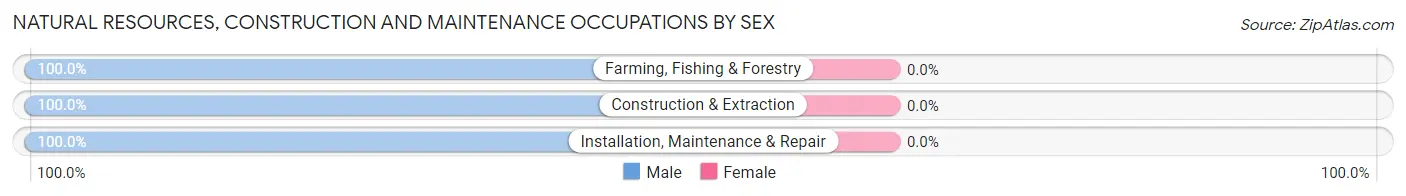
| Occupation | Male | Female |
| Farming, Fishing & Forestry | 21 (100.0%) | 0 (0.0%) |
| Construction & Extraction | 29 (100.0%) | 0 (0.0%) |
| Installation, Maintenance & Repair | 47 (100.0%) | 0 (0.0%) |
| Total (Category) | 97 (100.0%) | 0 (0.0%) |
| Total (Overall) | 247 (57.0%) | 186 (43.0%) |
Production, Transportation and Moving Occupations
The most common Production, Transportation and Moving occupations in Fremont are Production (67 | 15.5%), Material Moving (13 | 3.0%), and Transportation (12 | 2.8%).
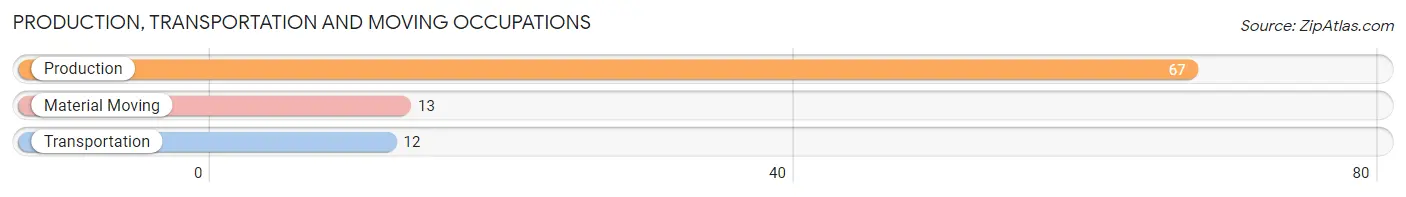
Production, Transportation and Moving Occupations by Sex
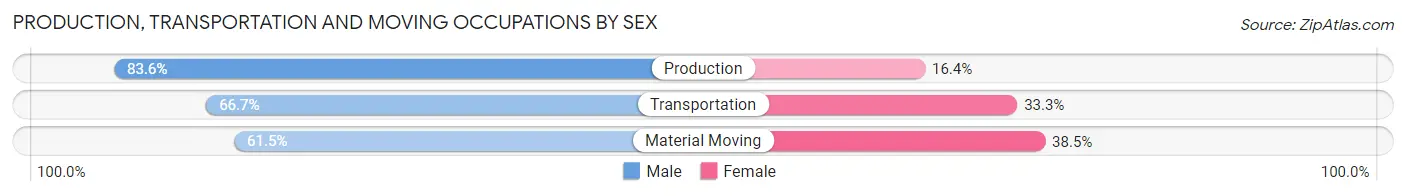
| Occupation | Male | Female |
| Production | 56 (83.6%) | 11 (16.4%) |
| Transportation | 8 (66.7%) | 4 (33.3%) |
| Material Moving | 8 (61.5%) | 5 (38.5%) |
| Total (Category) | 72 (78.3%) | 20 (21.7%) |
| Total (Overall) | 247 (57.0%) | 186 (43.0%) |
Employment Industries by Sex in Fremont
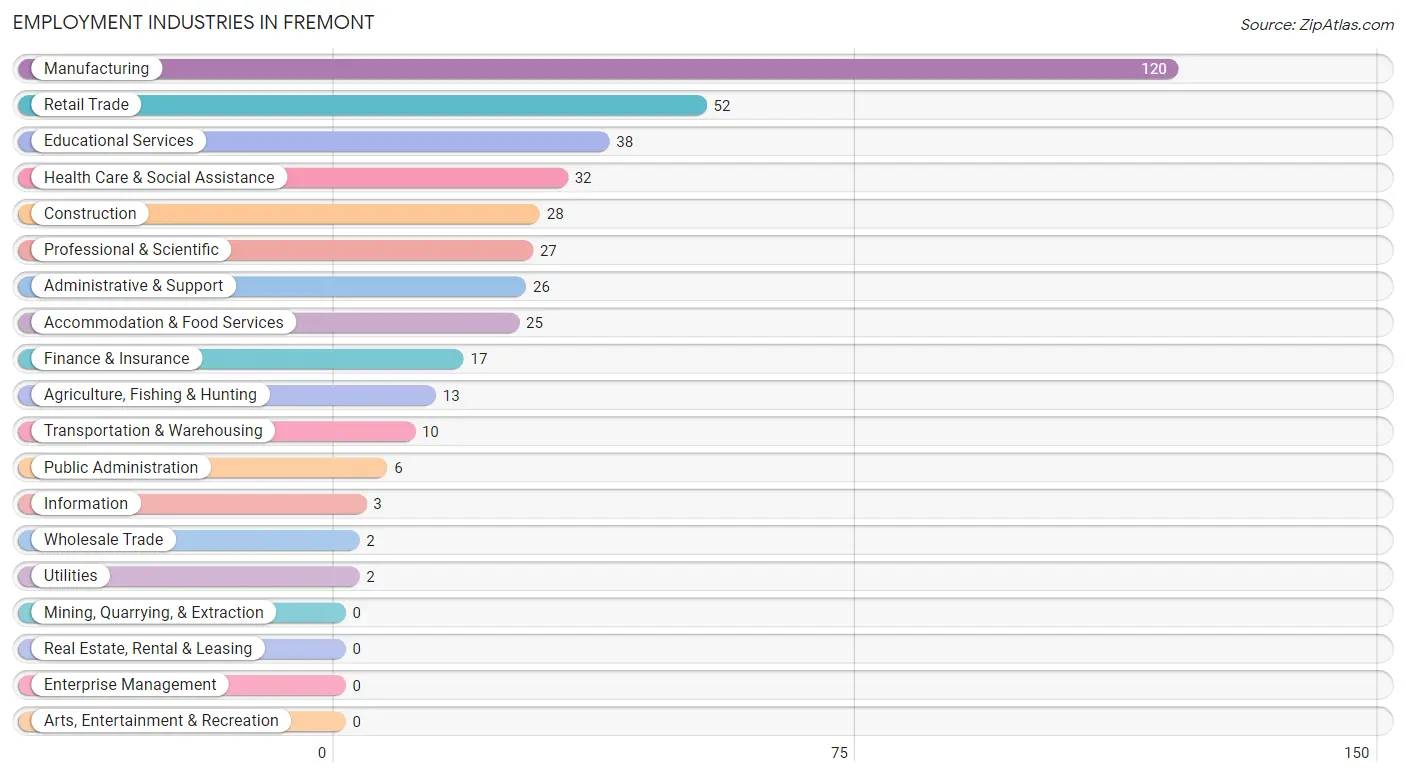
Employment Industries in Fremont
The major employment industries in Fremont include Manufacturing (120 | 27.7%), Retail Trade (52 | 12.0%), Educational Services (38 | 8.8%), Health Care & Social Assistance (32 | 7.4%), and Construction (28 | 6.5%).
Employment Industries by Sex in Fremont
The Fremont industries that see more men than women are Agriculture, Fishing & Hunting (100.0%), Construction (100.0%), and Utilities (100.0%), whereas the industries that tend to have a higher number of women are Wholesale Trade (100.0%), Information (100.0%), and Finance & Insurance (100.0%).
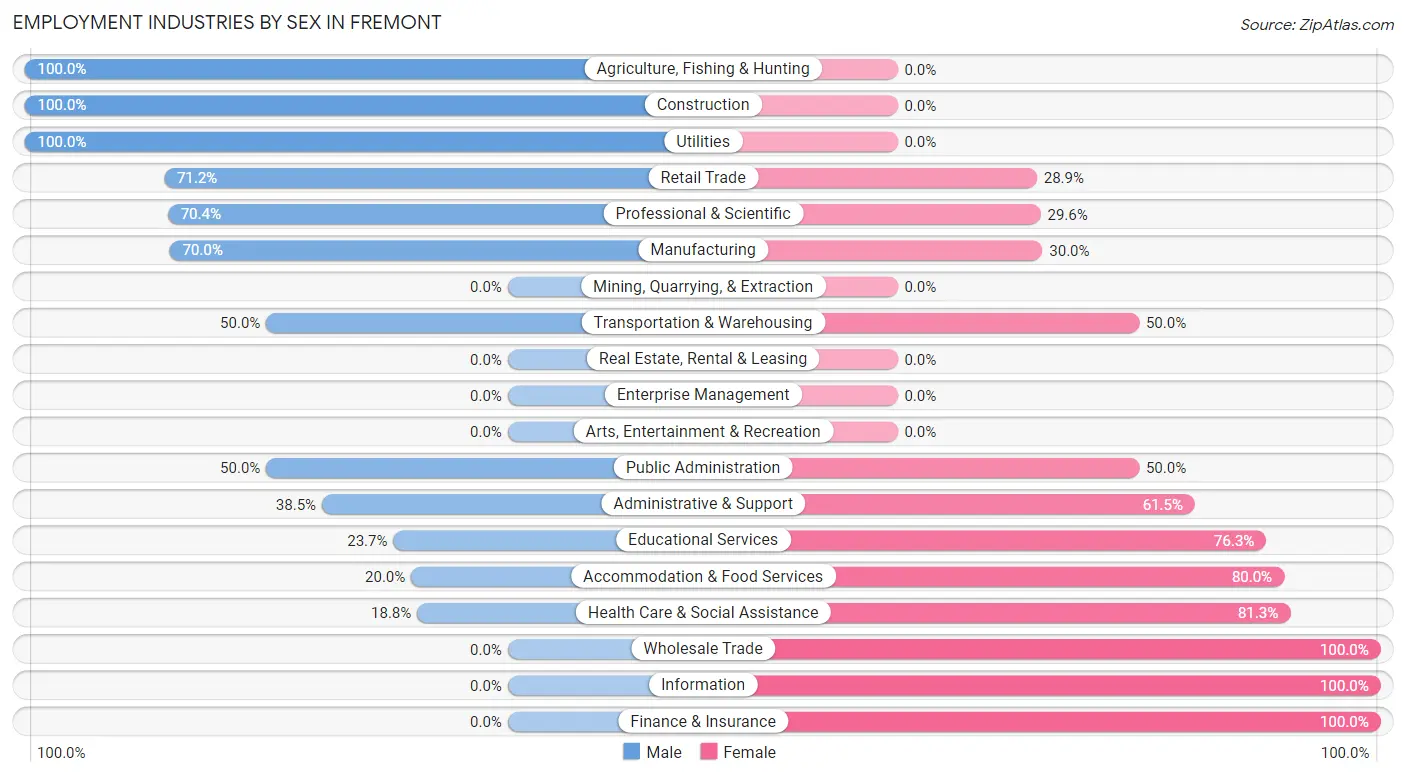
| Industry | Male | Female |
| Agriculture, Fishing & Hunting | 13 (100.0%) | 0 (0.0%) |
| Mining, Quarrying, & Extraction | 0 (0.0%) | 0 (0.0%) |
| Construction | 28 (100.0%) | 0 (0.0%) |
| Manufacturing | 84 (70.0%) | 36 (30.0%) |
| Wholesale Trade | 0 (0.0%) | 2 (100.0%) |
| Retail Trade | 37 (71.2%) | 15 (28.8%) |
| Transportation & Warehousing | 5 (50.0%) | 5 (50.0%) |
| Utilities | 2 (100.0%) | 0 (0.0%) |
| Information | 0 (0.0%) | 3 (100.0%) |
| Finance & Insurance | 0 (0.0%) | 17 (100.0%) |
| Real Estate, Rental & Leasing | 0 (0.0%) | 0 (0.0%) |
| Professional & Scientific | 19 (70.4%) | 8 (29.6%) |
| Enterprise Management | 0 (0.0%) | 0 (0.0%) |
| Administrative & Support | 10 (38.5%) | 16 (61.5%) |
| Educational Services | 9 (23.7%) | 29 (76.3%) |
| Health Care & Social Assistance | 6 (18.8%) | 26 (81.2%) |
| Arts, Entertainment & Recreation | 0 (0.0%) | 0 (0.0%) |
| Accommodation & Food Services | 5 (20.0%) | 20 (80.0%) |
| Public Administration | 3 (50.0%) | 3 (50.0%) |
| Total | 247 (57.0%) | 186 (43.0%) |
Education in Fremont
School Enrollment in Fremont
The most common levels of schooling among the 196 students in Fremont are high school (62 | 31.6%), middle school (42 | 21.4%), and elementary school (38 | 19.4%).
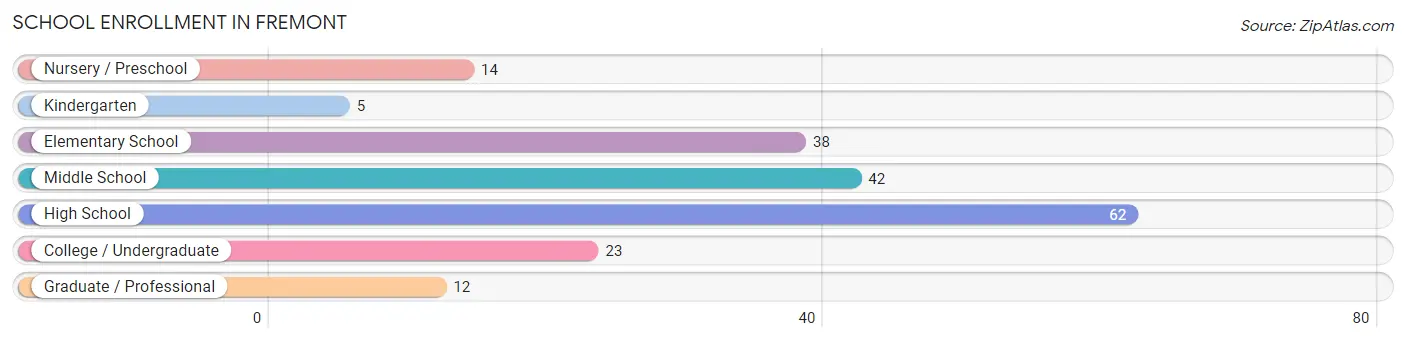
| School Level | # Students | % Students |
| Nursery / Preschool | 14 | 7.1% |
| Kindergarten | 5 | 2.5% |
| Elementary School | 38 | 19.4% |
| Middle School | 42 | 21.4% |
| High School | 62 | 31.6% |
| College / Undergraduate | 23 | 11.7% |
| Graduate / Professional | 12 | 6.1% |
| Total | 196 | 100.0% |
School Enrollment by Age by Funding Source in Fremont
Out of a total of 196 students who are enrolled in schools in Fremont, 2 (1.0%) attend a private institution, while the remaining 194 (99.0%) are enrolled in public schools. The age group of 5 to 9 year old has the highest likelihood of being enrolled in private schools, with 2 (4.3% in the age bracket) enrolled. Conversely, the age group of 3 to 4 year olds has the lowest likelihood of being enrolled in a private school, with 8 (100.0% in the age bracket) attending a public institution.
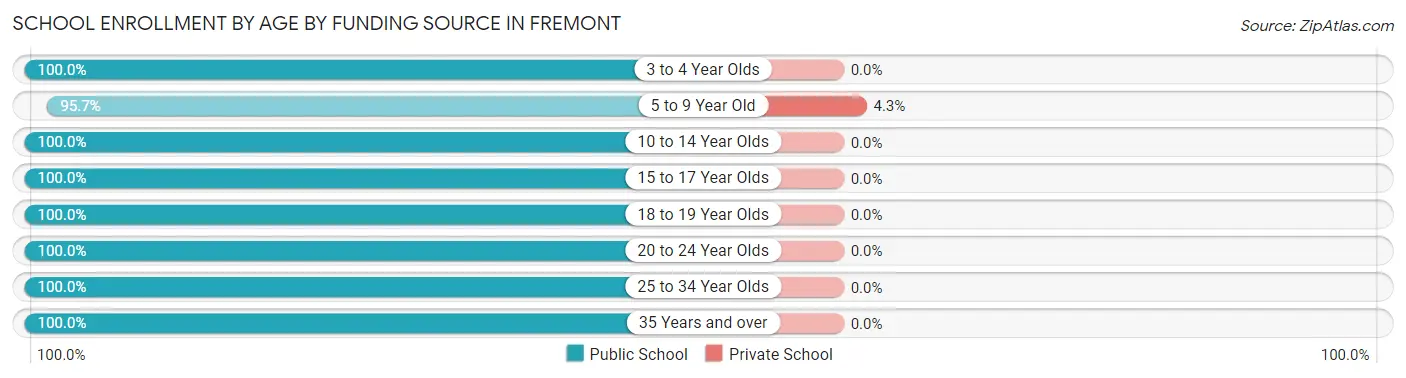
| Age Bracket | Public School | Private School |
| 3 to 4 Year Olds | 8 (100.0%) | 0 (0.0%) |
| 5 to 9 Year Old | 45 (95.7%) | 2 (4.3%) |
| 10 to 14 Year Olds | 67 (100.0%) | 0 (0.0%) |
| 15 to 17 Year Olds | 29 (100.0%) | 0 (0.0%) |
| 18 to 19 Year Olds | 4 (100.0%) | 0 (0.0%) |
| 20 to 24 Year Olds | 25 (100.0%) | 0 (0.0%) |
| 25 to 34 Year Olds | 6 (100.0%) | 0 (0.0%) |
| 35 Years and over | 10 (100.0%) | 0 (0.0%) |
| Total | 194 (99.0%) | 2 (1.0%) |
Educational Attainment by Field of Study in Fremont
Education (20 | 29.8%), bio, nature & agricultural (14 | 20.9%), business (14 | 20.9%), psychology (8 | 11.9%), and science & technology (4 | 6.0%) are the most common fields of study among 67 individuals in Fremont who have obtained a bachelor's degree or higher.
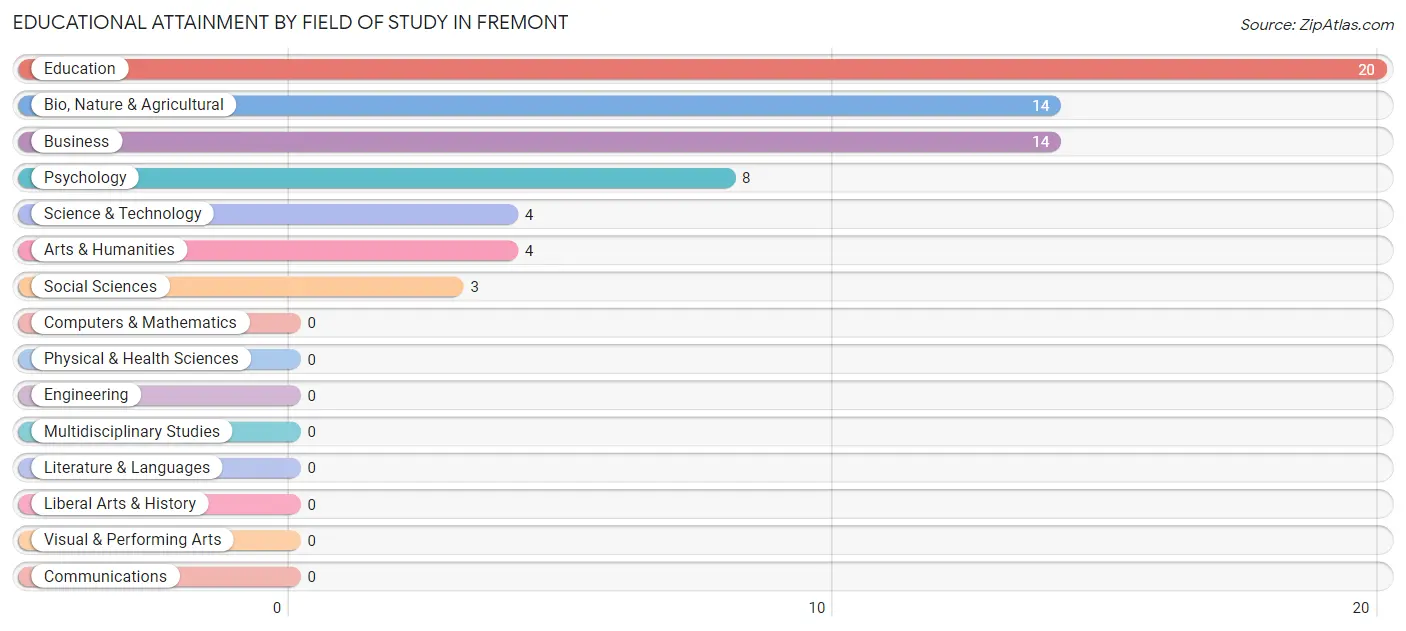
| Field of Study | # Graduates | % Graduates |
| Computers & Mathematics | 0 | 0.0% |
| Bio, Nature & Agricultural | 14 | 20.9% |
| Physical & Health Sciences | 0 | 0.0% |
| Psychology | 8 | 11.9% |
| Social Sciences | 3 | 4.5% |
| Engineering | 0 | 0.0% |
| Multidisciplinary Studies | 0 | 0.0% |
| Science & Technology | 4 | 6.0% |
| Business | 14 | 20.9% |
| Education | 20 | 29.8% |
| Literature & Languages | 0 | 0.0% |
| Liberal Arts & History | 0 | 0.0% |
| Visual & Performing Arts | 0 | 0.0% |
| Communications | 0 | 0.0% |
| Arts & Humanities | 4 | 6.0% |
| Total | 67 | 100.0% |
Transportation & Commute in Fremont
Vehicle Availability by Sex in Fremont
The most prevalent vehicle ownership categories in Fremont are males with 3 vehicles (84, accounting for 34.4%) and females with 3 vehicles (58, making up 46.9%).
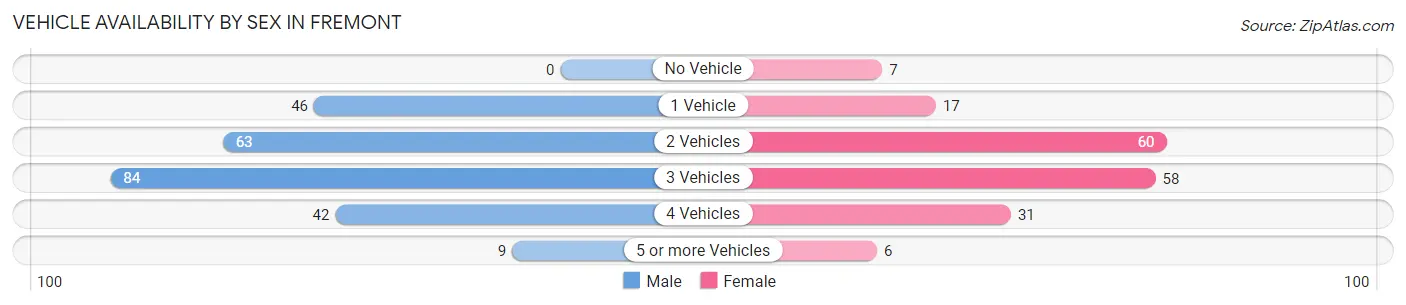
| Vehicles Available | Male | Female |
| No Vehicle | 0 (0.0%) | 7 (3.9%) |
| 1 Vehicle | 46 (18.9%) | 17 (9.5%) |
| 2 Vehicles | 63 (25.8%) | 60 (33.5%) |
| 3 Vehicles | 84 (34.4%) | 58 (32.4%) |
| 4 Vehicles | 42 (17.2%) | 31 (17.3%) |
| 5 or more Vehicles | 9 (3.7%) | 6 (3.4%) |
| Total | 244 (100.0%) | 179 (100.0%) |
Commute Time in Fremont
The most frequently occuring commute durations in Fremont are 20 to 24 minutes (110 commuters, 26.6%), 15 to 19 minutes (65 commuters, 15.7%), and 30 to 34 minutes (53 commuters, 12.8%).
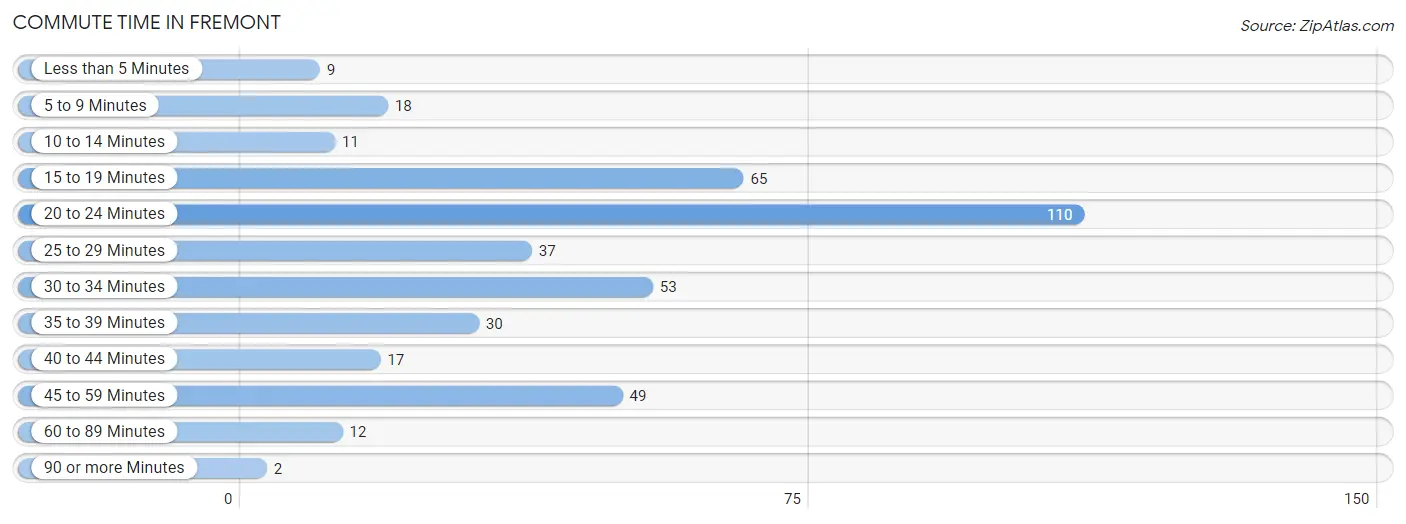
| Commute Time | # Commuters | % Commuters |
| Less than 5 Minutes | 9 | 2.2% |
| 5 to 9 Minutes | 18 | 4.4% |
| 10 to 14 Minutes | 11 | 2.7% |
| 15 to 19 Minutes | 65 | 15.7% |
| 20 to 24 Minutes | 110 | 26.6% |
| 25 to 29 Minutes | 37 | 9.0% |
| 30 to 34 Minutes | 53 | 12.8% |
| 35 to 39 Minutes | 30 | 7.3% |
| 40 to 44 Minutes | 17 | 4.1% |
| 45 to 59 Minutes | 49 | 11.9% |
| 60 to 89 Minutes | 12 | 2.9% |
| 90 or more Minutes | 2 | 0.5% |
Commute Time by Sex in Fremont
The most common commute times in Fremont are 20 to 24 minutes (62 commuters, 25.8%) for males and 20 to 24 minutes (48 commuters, 27.8%) for females.
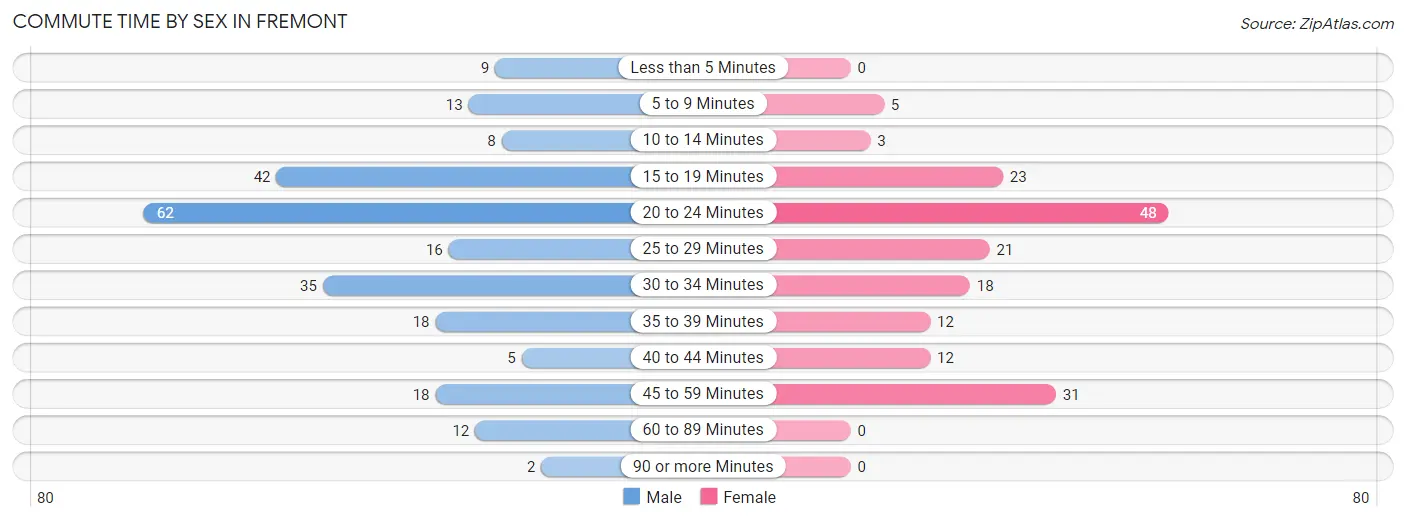
| Commute Time | Male | Female |
| Less than 5 Minutes | 9 (3.7%) | 0 (0.0%) |
| 5 to 9 Minutes | 13 (5.4%) | 5 (2.9%) |
| 10 to 14 Minutes | 8 (3.3%) | 3 (1.7%) |
| 15 to 19 Minutes | 42 (17.5%) | 23 (13.3%) |
| 20 to 24 Minutes | 62 (25.8%) | 48 (27.8%) |
| 25 to 29 Minutes | 16 (6.7%) | 21 (12.1%) |
| 30 to 34 Minutes | 35 (14.6%) | 18 (10.4%) |
| 35 to 39 Minutes | 18 (7.5%) | 12 (6.9%) |
| 40 to 44 Minutes | 5 (2.1%) | 12 (6.9%) |
| 45 to 59 Minutes | 18 (7.5%) | 31 (17.9%) |
| 60 to 89 Minutes | 12 (5.0%) | 0 (0.0%) |
| 90 or more Minutes | 2 (0.8%) | 0 (0.0%) |
Time of Departure to Work by Sex in Fremont
The most frequent times of departure to work in Fremont are 7:00 AM to 7:29 AM (45, 18.8%) for males and 7:30 AM to 7:59 AM (42, 24.3%) for females.
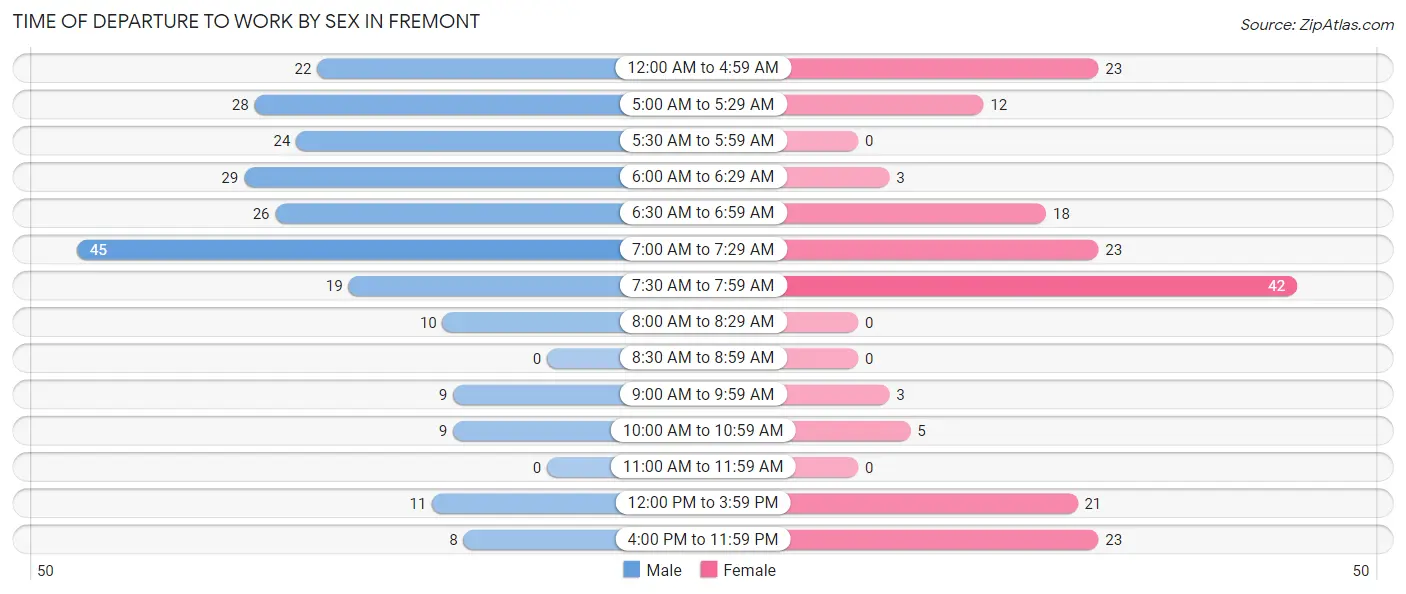
| Time of Departure | Male | Female |
| 12:00 AM to 4:59 AM | 22 (9.2%) | 23 (13.3%) |
| 5:00 AM to 5:29 AM | 28 (11.7%) | 12 (6.9%) |
| 5:30 AM to 5:59 AM | 24 (10.0%) | 0 (0.0%) |
| 6:00 AM to 6:29 AM | 29 (12.1%) | 3 (1.7%) |
| 6:30 AM to 6:59 AM | 26 (10.8%) | 18 (10.4%) |
| 7:00 AM to 7:29 AM | 45 (18.8%) | 23 (13.3%) |
| 7:30 AM to 7:59 AM | 19 (7.9%) | 42 (24.3%) |
| 8:00 AM to 8:29 AM | 10 (4.2%) | 0 (0.0%) |
| 8:30 AM to 8:59 AM | 0 (0.0%) | 0 (0.0%) |
| 9:00 AM to 9:59 AM | 9 (3.7%) | 3 (1.7%) |
| 10:00 AM to 10:59 AM | 9 (3.7%) | 5 (2.9%) |
| 11:00 AM to 11:59 AM | 0 (0.0%) | 0 (0.0%) |
| 12:00 PM to 3:59 PM | 11 (4.6%) | 21 (12.1%) |
| 4:00 PM to 11:59 PM | 8 (3.3%) | 23 (13.3%) |
| Total | 240 (100.0%) | 173 (100.0%) |
Housing Occupancy in Fremont
Occupancy by Ownership in Fremont
Of the total 308 dwellings in Fremont, owner-occupied units account for 220 (71.4%), while renter-occupied units make up 88 (28.6%).
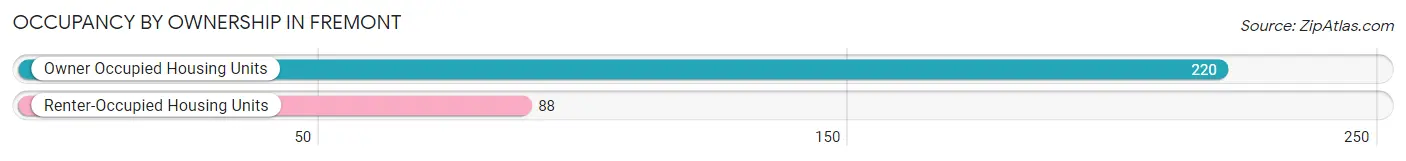
| Occupancy | # Housing Units | % Housing Units |
| Owner Occupied Housing Units | 220 | 71.4% |
| Renter-Occupied Housing Units | 88 | 28.6% |
| Total Occupied Housing Units | 308 | 100.0% |
Occupancy by Household Size in Fremont
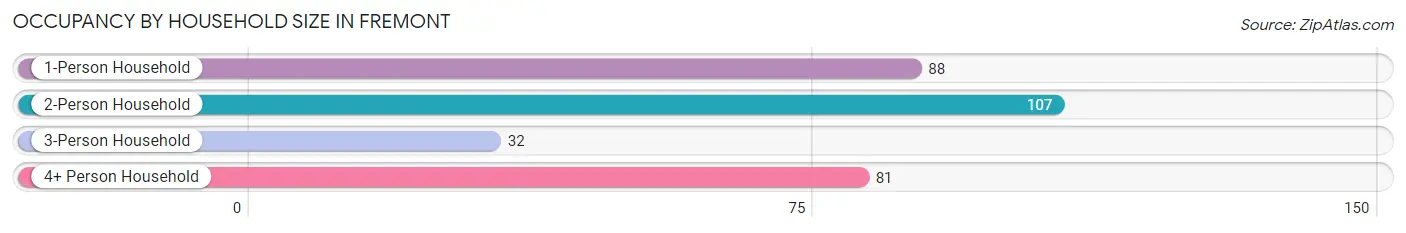
| Household Size | # Housing Units | % Housing Units |
| 1-Person Household | 88 | 28.6% |
| 2-Person Household | 107 | 34.7% |
| 3-Person Household | 32 | 10.4% |
| 4+ Person Household | 81 | 26.3% |
| Total Housing Units | 308 | 100.0% |
Occupancy by Ownership by Household Size in Fremont
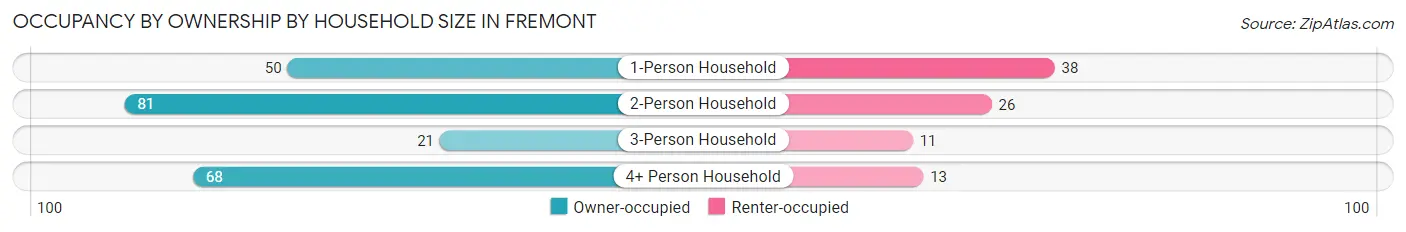
| Household Size | Owner-occupied | Renter-occupied |
| 1-Person Household | 50 (56.8%) | 38 (43.2%) |
| 2-Person Household | 81 (75.7%) | 26 (24.3%) |
| 3-Person Household | 21 (65.6%) | 11 (34.4%) |
| 4+ Person Household | 68 (84.0%) | 13 (16.1%) |
| Total Housing Units | 220 (71.4%) | 88 (28.6%) |
Occupancy by Educational Attainment in Fremont
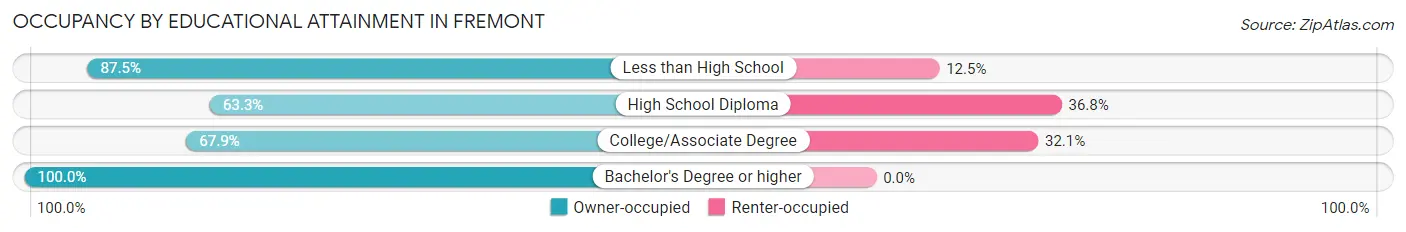
| Household Size | Owner-occupied | Renter-occupied |
| Less than High School | 14 (87.5%) | 2 (12.5%) |
| High School Diploma | 74 (63.2%) | 43 (36.7%) |
| College/Associate Degree | 91 (67.9%) | 43 (32.1%) |
| Bachelor's Degree or higher | 41 (100.0%) | 0 (0.0%) |
Occupancy by Age of Householder in Fremont
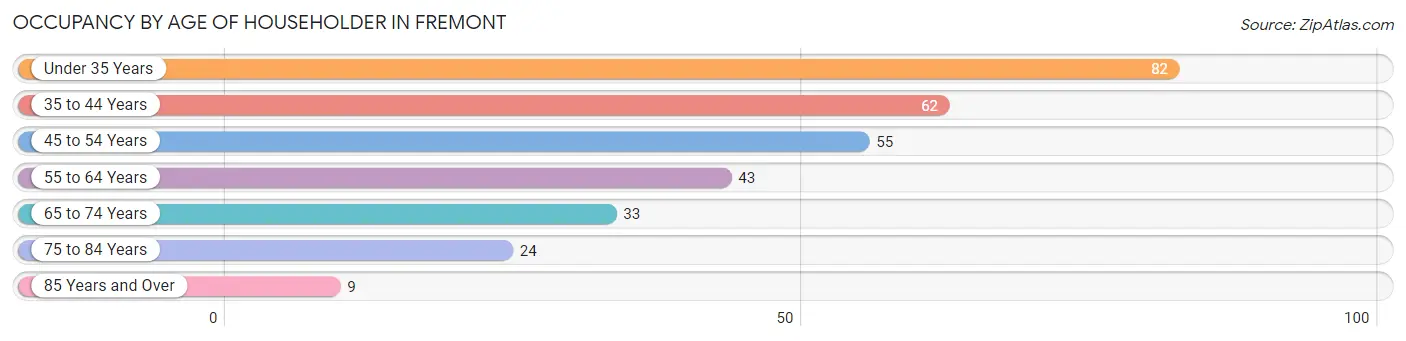
| Age Bracket | # Households | % Households |
| Under 35 Years | 82 | 26.6% |
| 35 to 44 Years | 62 | 20.1% |
| 45 to 54 Years | 55 | 17.9% |
| 55 to 64 Years | 43 | 14.0% |
| 65 to 74 Years | 33 | 10.7% |
| 75 to 84 Years | 24 | 7.8% |
| 85 Years and Over | 9 | 2.9% |
| Total | 308 | 100.0% |
Housing Finances in Fremont
Median Income by Occupancy in Fremont
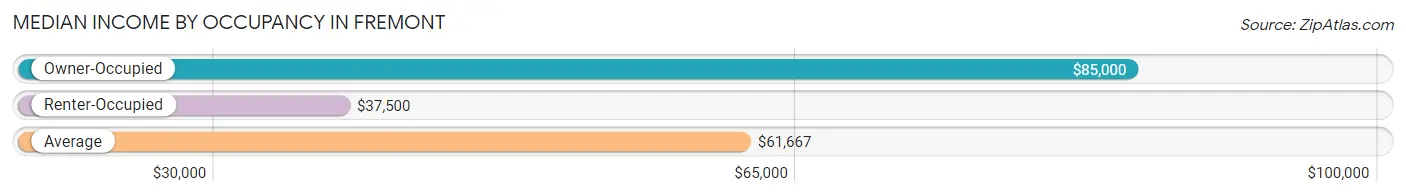
| Occupancy Type | # Households | Median Income |
| Owner-Occupied | 220 (71.4%) | $85,000 |
| Renter-Occupied | 88 (28.6%) | $37,500 |
| Average | 308 (100.0%) | $61,667 |
Occupancy by Householder Income Bracket in Fremont
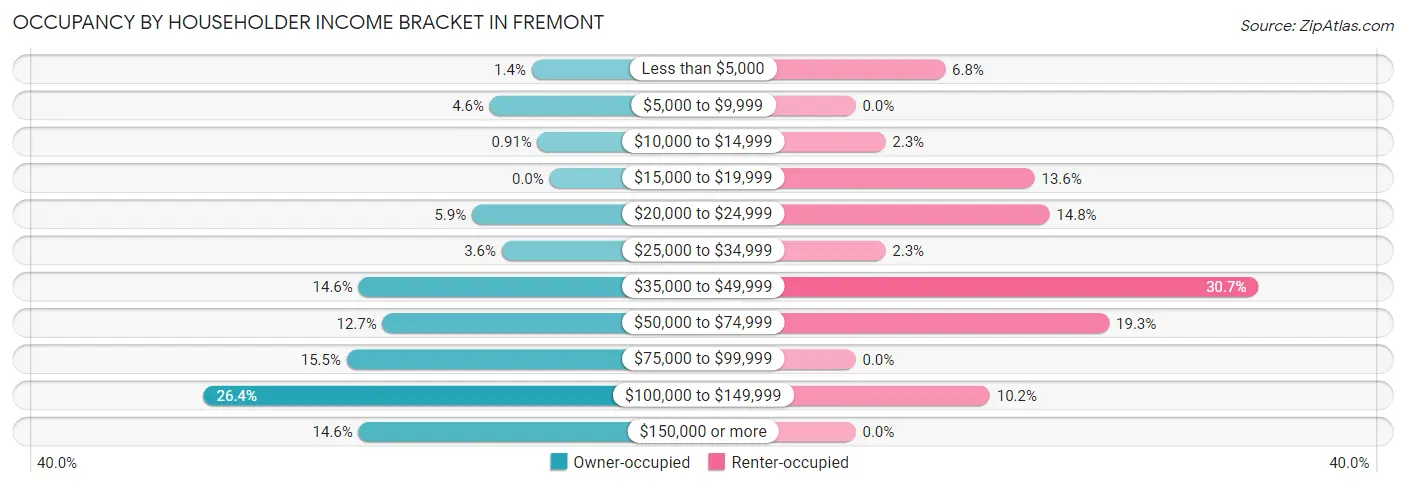
| Income Bracket | Owner-occupied | Renter-occupied |
| Less than $5,000 | 3 (1.4%) | 6 (6.8%) |
| $5,000 to $9,999 | 10 (4.5%) | 0 (0.0%) |
| $10,000 to $14,999 | 2 (0.9%) | 2 (2.3%) |
| $15,000 to $19,999 | 0 (0.0%) | 12 (13.6%) |
| $20,000 to $24,999 | 13 (5.9%) | 13 (14.8%) |
| $25,000 to $34,999 | 8 (3.6%) | 2 (2.3%) |
| $35,000 to $49,999 | 32 (14.5%) | 27 (30.7%) |
| $50,000 to $74,999 | 28 (12.7%) | 17 (19.3%) |
| $75,000 to $99,999 | 34 (15.4%) | 0 (0.0%) |
| $100,000 to $149,999 | 58 (26.4%) | 9 (10.2%) |
| $150,000 or more | 32 (14.5%) | 0 (0.0%) |
| Total | 220 (100.0%) | 88 (100.0%) |
Monthly Housing Cost Tiers in Fremont
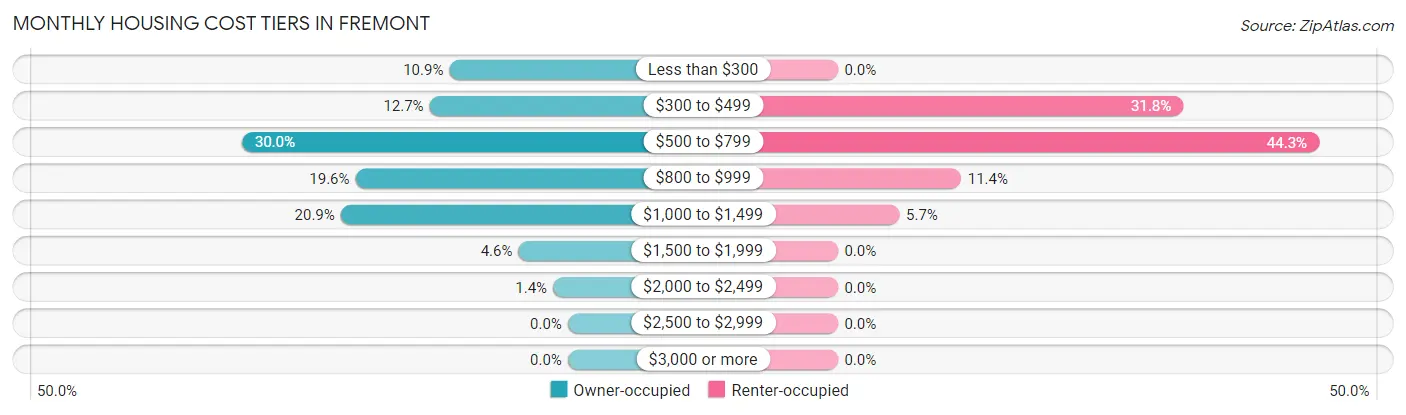
| Monthly Cost | Owner-occupied | Renter-occupied |
| Less than $300 | 24 (10.9%) | 0 (0.0%) |
| $300 to $499 | 28 (12.7%) | 28 (31.8%) |
| $500 to $799 | 66 (30.0%) | 39 (44.3%) |
| $800 to $999 | 43 (19.6%) | 10 (11.4%) |
| $1,000 to $1,499 | 46 (20.9%) | 5 (5.7%) |
| $1,500 to $1,999 | 10 (4.5%) | 0 (0.0%) |
| $2,000 to $2,499 | 3 (1.4%) | 0 (0.0%) |
| $2,500 to $2,999 | 0 (0.0%) | 0 (0.0%) |
| $3,000 or more | 0 (0.0%) | 0 (0.0%) |
| Total | 220 (100.0%) | 88 (100.0%) |
Physical Housing Characteristics in Fremont
Housing Structures in Fremont
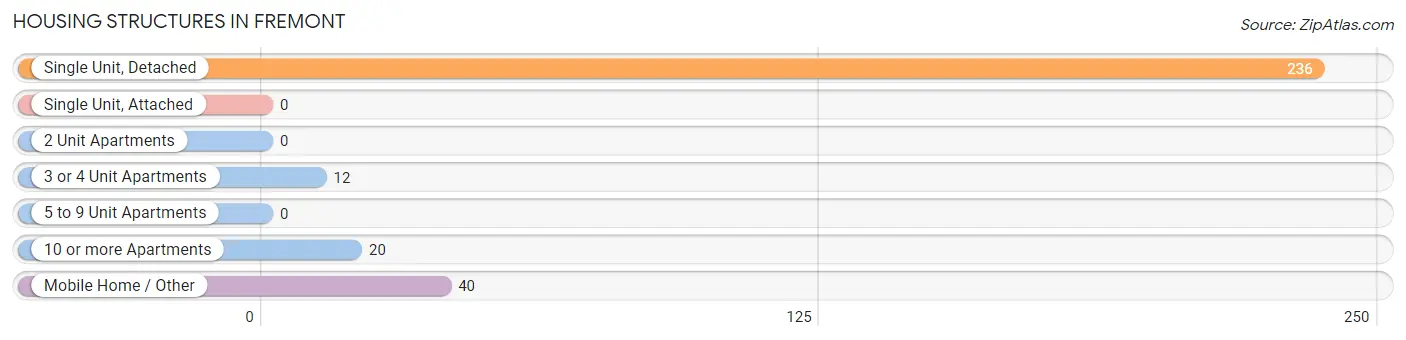
| Structure Type | # Housing Units | % Housing Units |
| Single Unit, Detached | 236 | 76.6% |
| Single Unit, Attached | 0 | 0.0% |
| 2 Unit Apartments | 0 | 0.0% |
| 3 or 4 Unit Apartments | 12 | 3.9% |
| 5 to 9 Unit Apartments | 0 | 0.0% |
| 10 or more Apartments | 20 | 6.5% |
| Mobile Home / Other | 40 | 13.0% |
| Total | 308 | 100.0% |
Housing Structures by Occupancy in Fremont
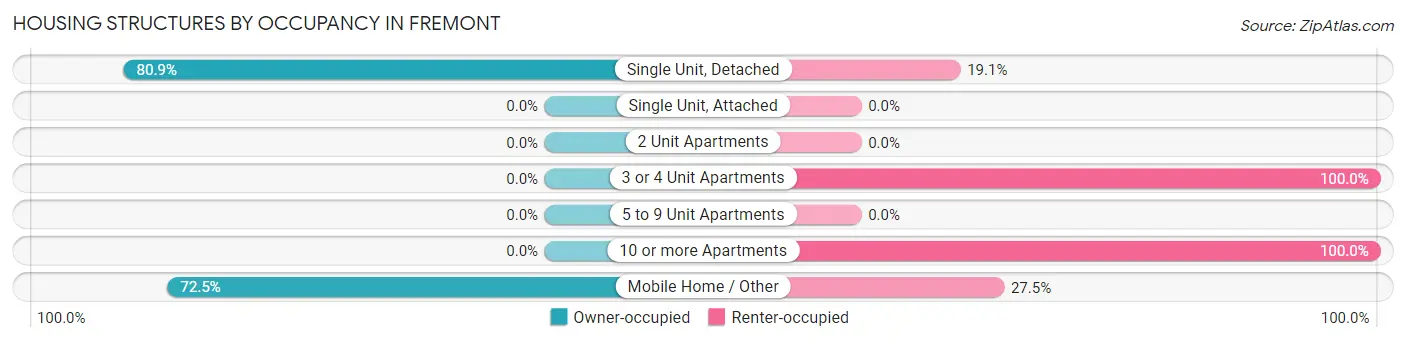
| Structure Type | Owner-occupied | Renter-occupied |
| Single Unit, Detached | 191 (80.9%) | 45 (19.1%) |
| Single Unit, Attached | 0 (0.0%) | 0 (0.0%) |
| 2 Unit Apartments | 0 (0.0%) | 0 (0.0%) |
| 3 or 4 Unit Apartments | 0 (0.0%) | 12 (100.0%) |
| 5 to 9 Unit Apartments | 0 (0.0%) | 0 (0.0%) |
| 10 or more Apartments | 0 (0.0%) | 20 (100.0%) |
| Mobile Home / Other | 29 (72.5%) | 11 (27.5%) |
| Total | 220 (71.4%) | 88 (28.6%) |
Housing Structures by Number of Rooms in Fremont
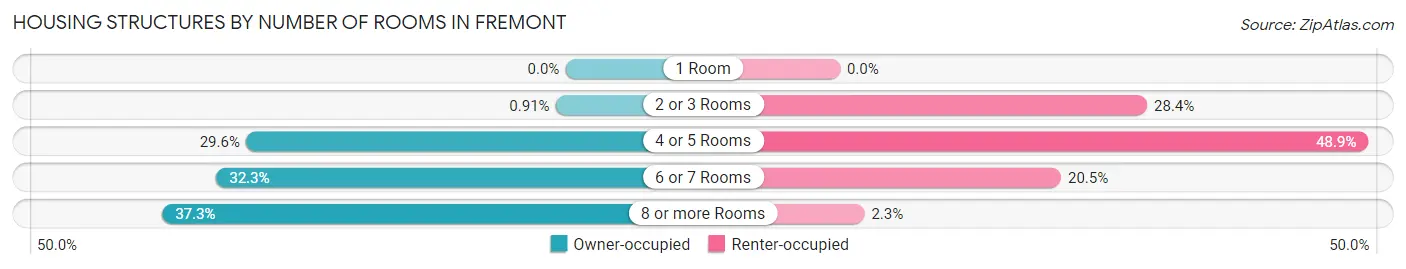
| Number of Rooms | Owner-occupied | Renter-occupied |
| 1 Room | 0 (0.0%) | 0 (0.0%) |
| 2 or 3 Rooms | 2 (0.9%) | 25 (28.4%) |
| 4 or 5 Rooms | 65 (29.5%) | 43 (48.9%) |
| 6 or 7 Rooms | 71 (32.3%) | 18 (20.4%) |
| 8 or more Rooms | 82 (37.3%) | 2 (2.3%) |
| Total | 220 (100.0%) | 88 (100.0%) |
Housing Structure by Heating Type in Fremont
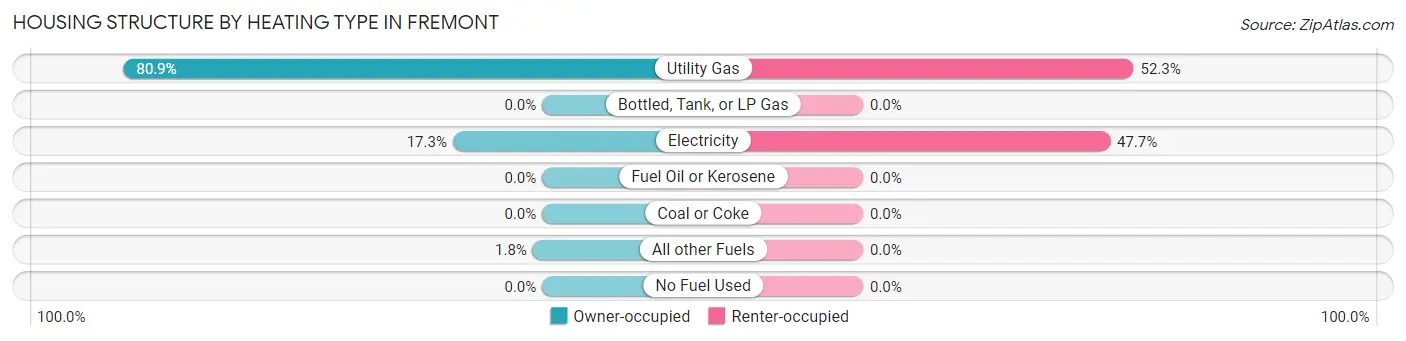
| Heating Type | Owner-occupied | Renter-occupied |
| Utility Gas | 178 (80.9%) | 46 (52.3%) |
| Bottled, Tank, or LP Gas | 0 (0.0%) | 0 (0.0%) |
| Electricity | 38 (17.3%) | 42 (47.7%) |
| Fuel Oil or Kerosene | 0 (0.0%) | 0 (0.0%) |
| Coal or Coke | 0 (0.0%) | 0 (0.0%) |
| All other Fuels | 4 (1.8%) | 0 (0.0%) |
| No Fuel Used | 0 (0.0%) | 0 (0.0%) |
| Total | 220 (100.0%) | 88 (100.0%) |
Household Vehicle Usage in Fremont
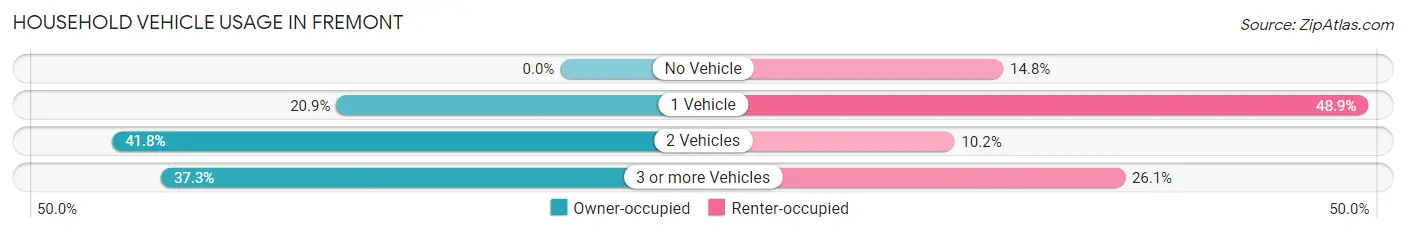
| Vehicles per Household | Owner-occupied | Renter-occupied |
| No Vehicle | 0 (0.0%) | 13 (14.8%) |
| 1 Vehicle | 46 (20.9%) | 43 (48.9%) |
| 2 Vehicles | 92 (41.8%) | 9 (10.2%) |
| 3 or more Vehicles | 82 (37.3%) | 23 (26.1%) |
| Total | 220 (100.0%) | 88 (100.0%) |
Real Estate & Mortgages in Fremont
Real Estate and Mortgage Overview in Fremont
| Characteristic | Without Mortgage | With Mortgage |
| Housing Units | 100 | 120 |
| Median Property Value | $97,000 | $94,700 |
| Median Household Income | $51,250 | $19 |
| Monthly Housing Costs | $475 | $0 |
| Real Estate Taxes | $1,196 | $4 |
Property Value by Mortgage Status in Fremont
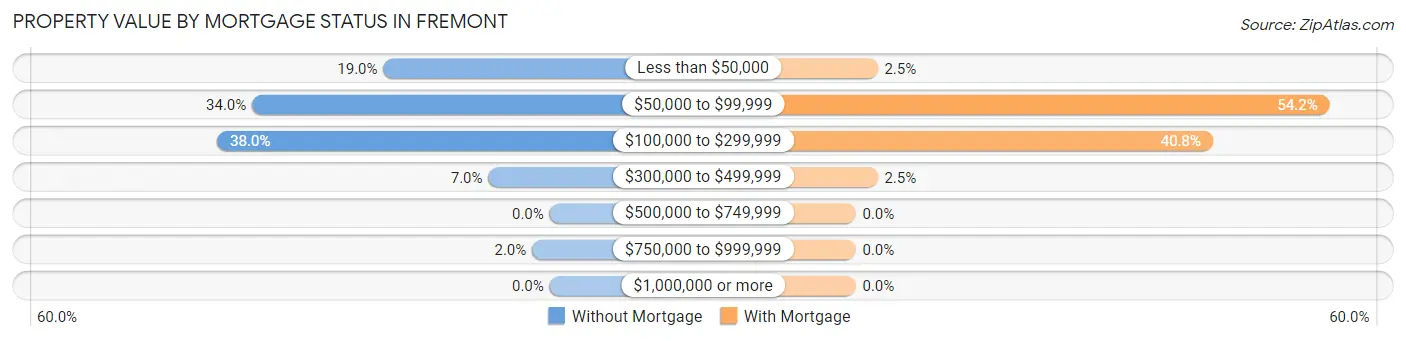
| Property Value | Without Mortgage | With Mortgage |
| Less than $50,000 | 19 (19.0%) | 3 (2.5%) |
| $50,000 to $99,999 | 34 (34.0%) | 65 (54.2%) |
| $100,000 to $299,999 | 38 (38.0%) | 49 (40.8%) |
| $300,000 to $499,999 | 7 (7.0%) | 3 (2.5%) |
| $500,000 to $749,999 | 0 (0.0%) | 0 (0.0%) |
| $750,000 to $999,999 | 2 (2.0%) | 0 (0.0%) |
| $1,000,000 or more | 0 (0.0%) | 0 (0.0%) |
| Total | 100 (100.0%) | 120 (100.0%) |
Household Income by Mortgage Status in Fremont
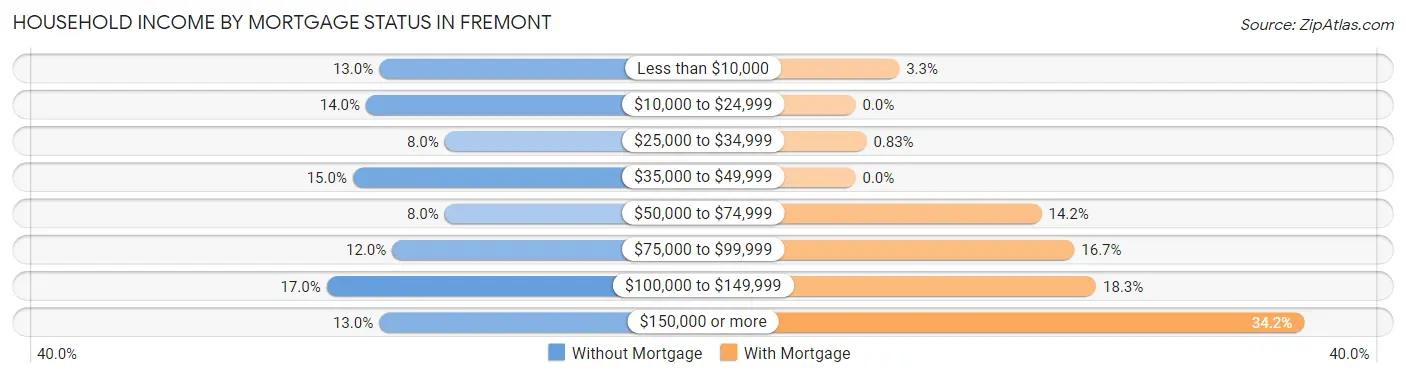
| Household Income | Without Mortgage | With Mortgage |
| Less than $10,000 | 13 (13.0%) | 4 (3.3%) |
| $10,000 to $24,999 | 14 (14.0%) | 0 (0.0%) |
| $25,000 to $34,999 | 8 (8.0%) | 1 (0.8%) |
| $35,000 to $49,999 | 15 (15.0%) | 0 (0.0%) |
| $50,000 to $74,999 | 8 (8.0%) | 17 (14.2%) |
| $75,000 to $99,999 | 12 (12.0%) | 20 (16.7%) |
| $100,000 to $149,999 | 17 (17.0%) | 22 (18.3%) |
| $150,000 or more | 13 (13.0%) | 41 (34.2%) |
| Total | 100 (100.0%) | 120 (100.0%) |
Property Value to Household Income Ratio in Fremont
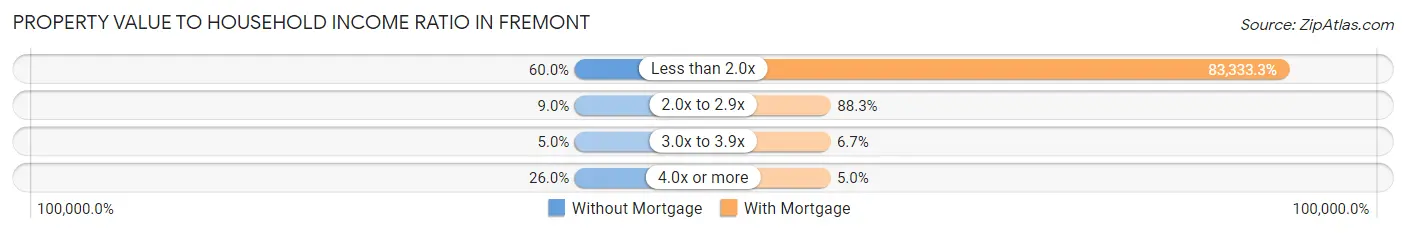
| Value-to-Income Ratio | Without Mortgage | With Mortgage |
| Less than 2.0x | 60 (60.0%) | 100,000 (83,333.3%) |
| 2.0x to 2.9x | 9 (9.0%) | 106 (88.3%) |
| 3.0x to 3.9x | 5 (5.0%) | 8 (6.7%) |
| 4.0x or more | 26 (26.0%) | 6 (5.0%) |
| Total | 100 (100.0%) | 120 (100.0%) |
Real Estate Taxes by Mortgage Status in Fremont
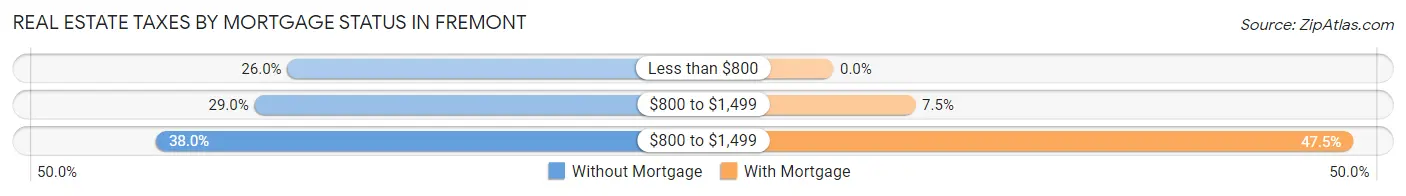
| Property Taxes | Without Mortgage | With Mortgage |
| Less than $800 | 26 (26.0%) | 0 (0.0%) |
| $800 to $1,499 | 29 (29.0%) | 9 (7.5%) |
| $800 to $1,499 | 38 (38.0%) | 57 (47.5%) |
| Total | 100 (100.0%) | 120 (100.0%) |
Health & Disability in Fremont
Health Insurance Coverage by Age in Fremont
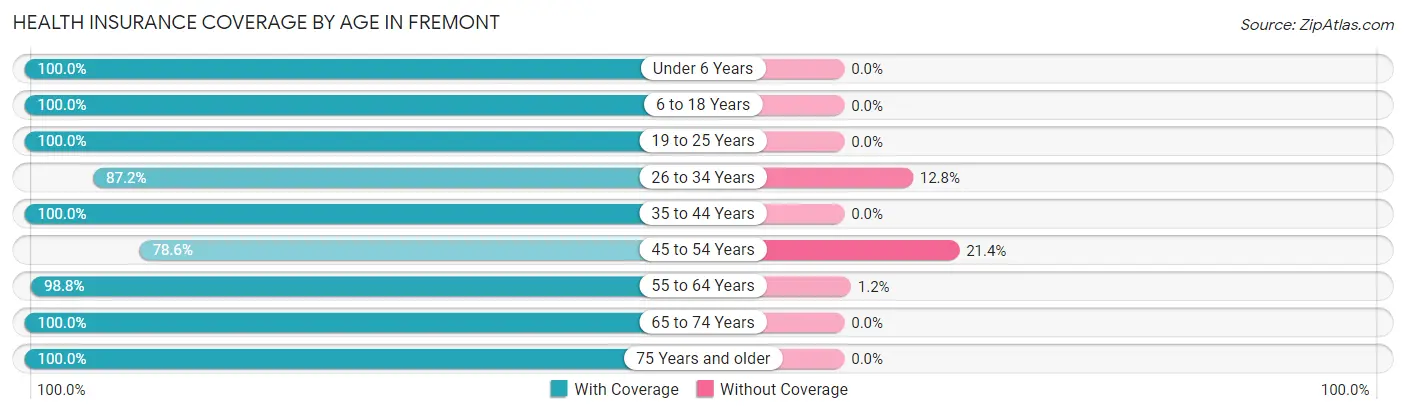
| Age Bracket | With Coverage | Without Coverage |
| Under 6 Years | 100 (100.0%) | 0 (0.0%) |
| 6 to 18 Years | 154 (100.0%) | 0 (0.0%) |
| 19 to 25 Years | 59 (100.0%) | 0 (0.0%) |
| 26 to 34 Years | 116 (87.2%) | 17 (12.8%) |
| 35 to 44 Years | 92 (100.0%) | 0 (0.0%) |
| 45 to 54 Years | 77 (78.6%) | 21 (21.4%) |
| 55 to 64 Years | 81 (98.8%) | 1 (1.2%) |
| 65 to 74 Years | 48 (100.0%) | 0 (0.0%) |
| 75 Years and older | 44 (100.0%) | 0 (0.0%) |
| Total | 771 (95.2%) | 39 (4.8%) |
Health Insurance Coverage by Citizenship Status in Fremont
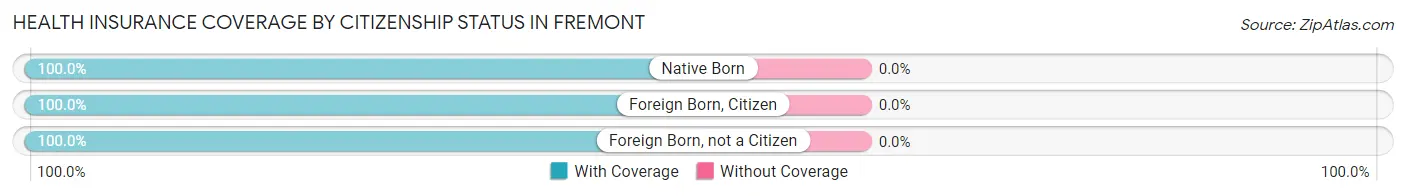
| Citizenship Status | With Coverage | Without Coverage |
| Native Born | 100 (100.0%) | 0 (0.0%) |
| Foreign Born, Citizen | 154 (100.0%) | 0 (0.0%) |
| Foreign Born, not a Citizen | 59 (100.0%) | 0 (0.0%) |
Health Insurance Coverage by Household Income in Fremont
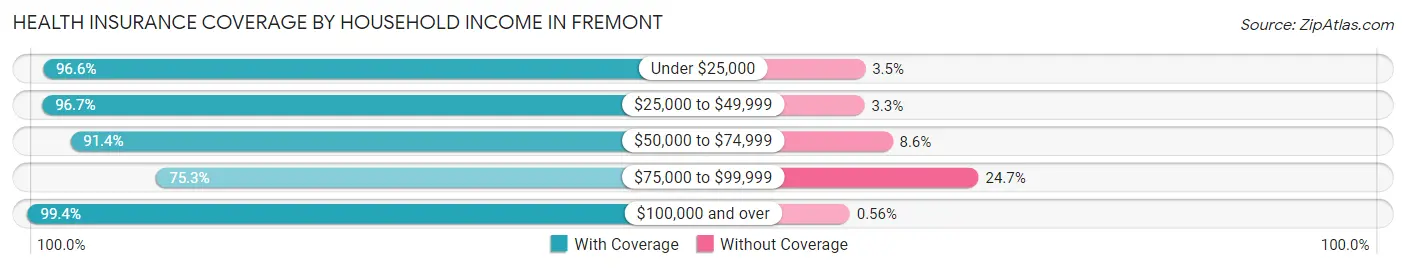
| Household Income | With Coverage | Without Coverage |
| Under $25,000 | 84 (96.6%) | 3 (3.5%) |
| $25,000 to $49,999 | 175 (96.7%) | 6 (3.3%) |
| $50,000 to $74,999 | 96 (91.4%) | 9 (8.6%) |
| $75,000 to $99,999 | 58 (75.3%) | 19 (24.7%) |
| $100,000 and over | 358 (99.4%) | 2 (0.6%) |
Public vs Private Health Insurance Coverage by Age in Fremont
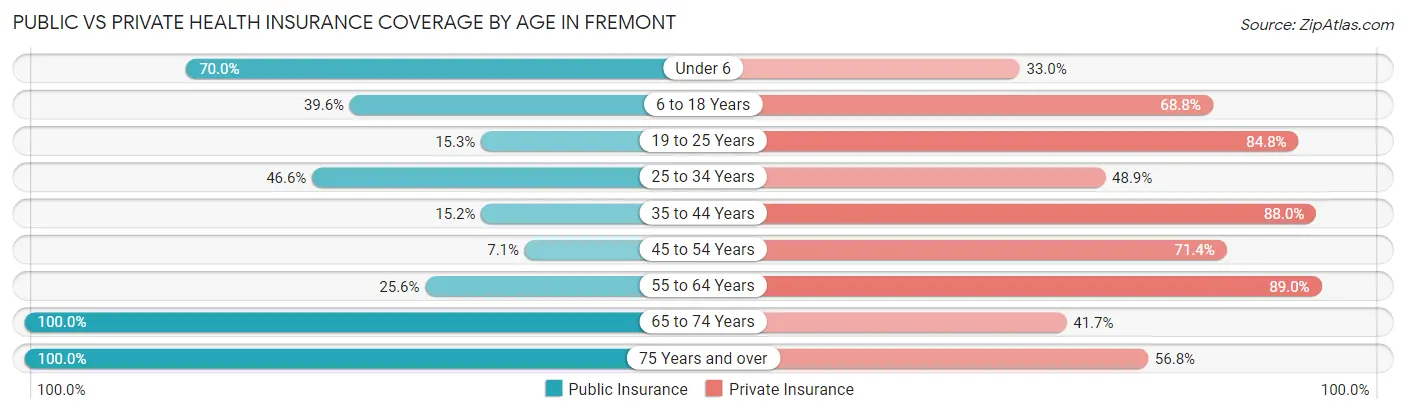
| Age Bracket | Public Insurance | Private Insurance |
| Under 6 | 70 (70.0%) | 33 (33.0%) |
| 6 to 18 Years | 61 (39.6%) | 106 (68.8%) |
| 19 to 25 Years | 9 (15.2%) | 50 (84.8%) |
| 25 to 34 Years | 62 (46.6%) | 65 (48.9%) |
| 35 to 44 Years | 14 (15.2%) | 81 (88.0%) |
| 45 to 54 Years | 7 (7.1%) | 70 (71.4%) |
| 55 to 64 Years | 21 (25.6%) | 73 (89.0%) |
| 65 to 74 Years | 48 (100.0%) | 20 (41.7%) |
| 75 Years and over | 44 (100.0%) | 25 (56.8%) |
| Total | 336 (41.5%) | 523 (64.6%) |
Disability Status by Sex by Age in Fremont
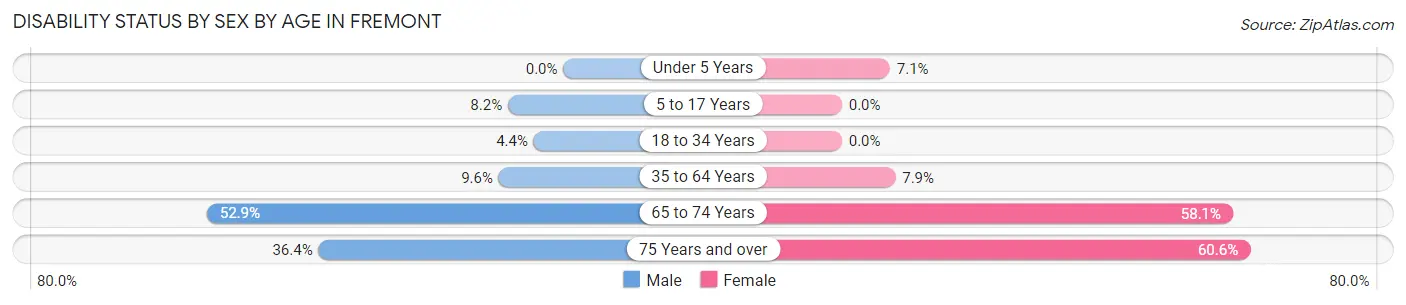
| Age Bracket | Male | Female |
| Under 5 Years | 0 (0.0%) | 3 (7.1%) |
| 5 to 17 Years | 6 (8.2%) | 0 (0.0%) |
| 18 to 34 Years | 5 (4.4%) | 0 (0.0%) |
| 35 to 64 Years | 14 (9.6%) | 10 (7.9%) |
| 65 to 74 Years | 9 (52.9%) | 18 (58.1%) |
| 75 Years and over | 4 (36.4%) | 20 (60.6%) |
Disability Class by Sex by Age in Fremont
Disability Class: Hearing Difficulty
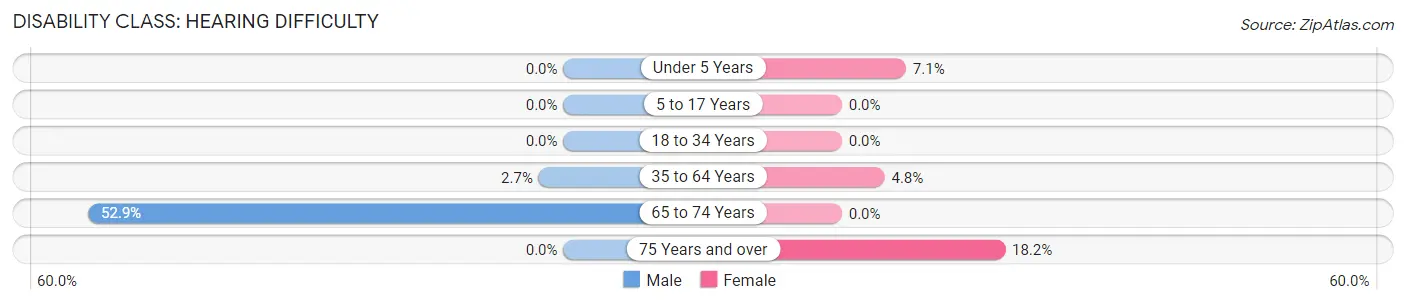
| Age Bracket | Male | Female |
| Under 5 Years | 0 (0.0%) | 3 (7.1%) |
| 5 to 17 Years | 0 (0.0%) | 0 (0.0%) |
| 18 to 34 Years | 0 (0.0%) | 0 (0.0%) |
| 35 to 64 Years | 4 (2.7%) | 6 (4.8%) |
| 65 to 74 Years | 9 (52.9%) | 0 (0.0%) |
| 75 Years and over | 0 (0.0%) | 6 (18.2%) |
Disability Class: Vision Difficulty
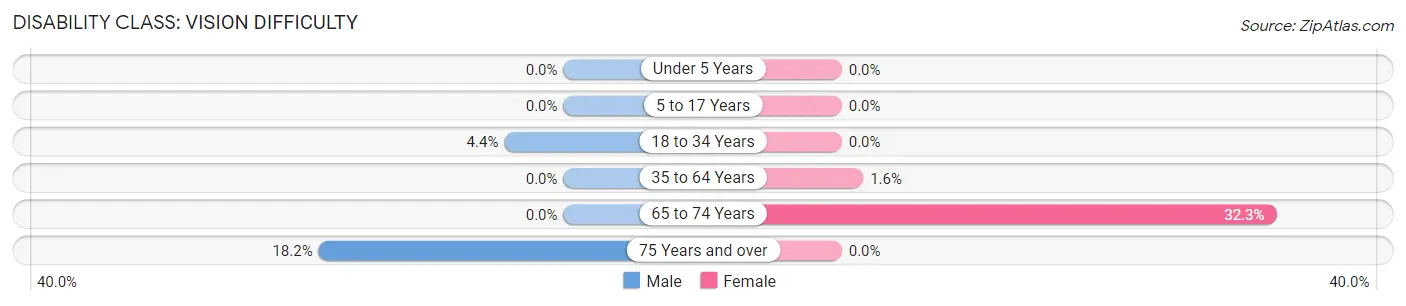
| Age Bracket | Male | Female |
| Under 5 Years | 0 (0.0%) | 0 (0.0%) |
| 5 to 17 Years | 0 (0.0%) | 0 (0.0%) |
| 18 to 34 Years | 5 (4.4%) | 0 (0.0%) |
| 35 to 64 Years | 0 (0.0%) | 2 (1.6%) |
| 65 to 74 Years | 0 (0.0%) | 10 (32.3%) |
| 75 Years and over | 2 (18.2%) | 0 (0.0%) |
Disability Class: Cognitive Difficulty
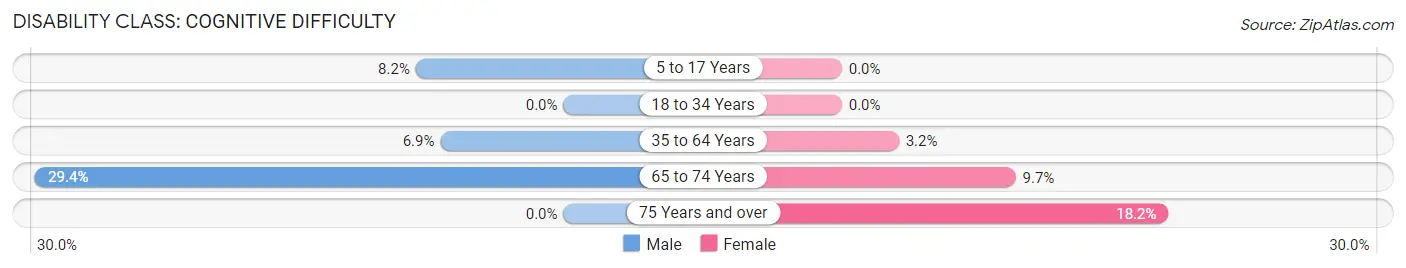
| Age Bracket | Male | Female |
| 5 to 17 Years | 6 (8.2%) | 0 (0.0%) |
| 18 to 34 Years | 0 (0.0%) | 0 (0.0%) |
| 35 to 64 Years | 10 (6.9%) | 4 (3.2%) |
| 65 to 74 Years | 5 (29.4%) | 3 (9.7%) |
| 75 Years and over | 0 (0.0%) | 6 (18.2%) |
Disability Class: Ambulatory Difficulty
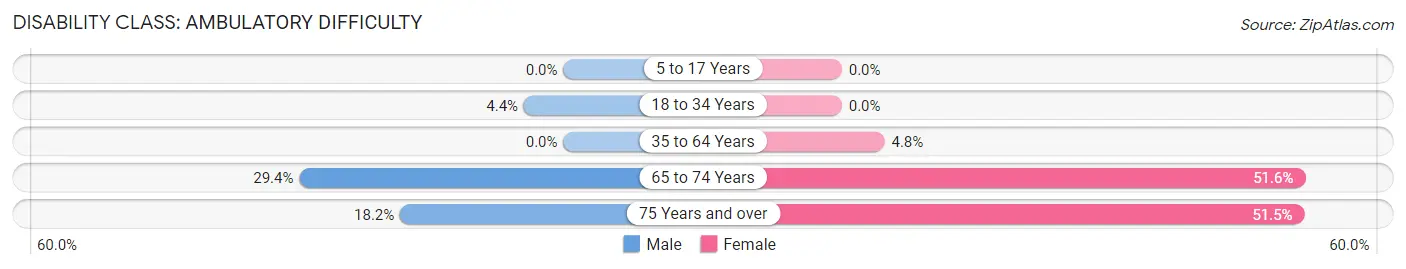
| Age Bracket | Male | Female |
| 5 to 17 Years | 0 (0.0%) | 0 (0.0%) |
| 18 to 34 Years | 5 (4.4%) | 0 (0.0%) |
| 35 to 64 Years | 0 (0.0%) | 6 (4.8%) |
| 65 to 74 Years | 5 (29.4%) | 16 (51.6%) |
| 75 Years and over | 2 (18.2%) | 17 (51.5%) |
Disability Class: Self-Care Difficulty
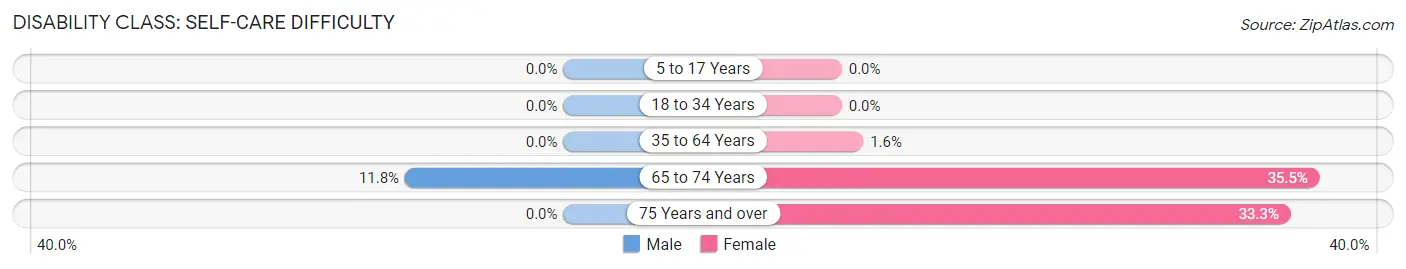
| Age Bracket | Male | Female |
| 5 to 17 Years | 0 (0.0%) | 0 (0.0%) |
| 18 to 34 Years | 0 (0.0%) | 0 (0.0%) |
| 35 to 64 Years | 0 (0.0%) | 2 (1.6%) |
| 65 to 74 Years | 2 (11.8%) | 11 (35.5%) |
| 75 Years and over | 0 (0.0%) | 11 (33.3%) |
Technology Access in Fremont
Computing Device Access in Fremont
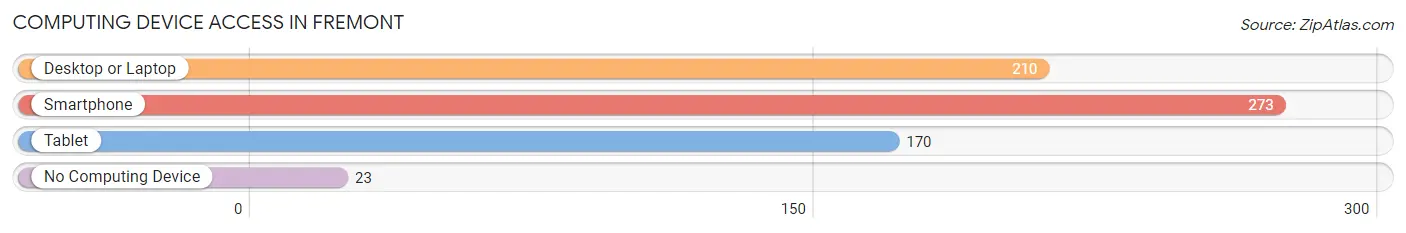
| Device Type | # Households | % Households |
| Desktop or Laptop | 210 | 68.2% |
| Smartphone | 273 | 88.6% |
| Tablet | 170 | 55.2% |
| No Computing Device | 23 | 7.5% |
| Total | 308 | 100.0% |
Internet Access in Fremont
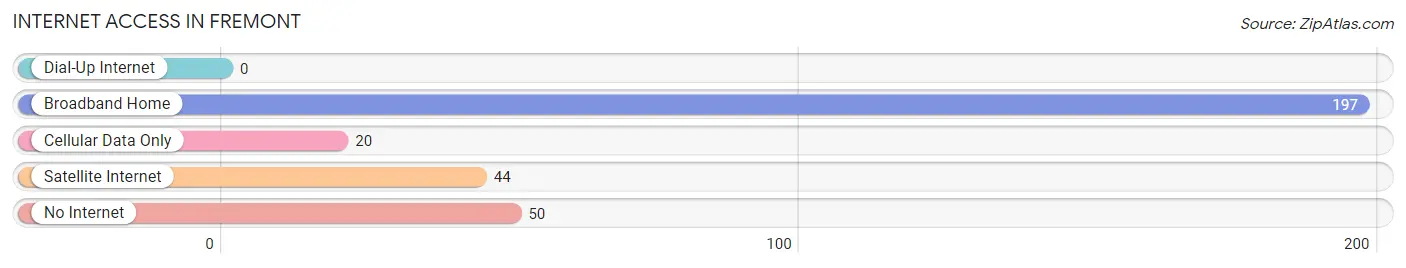
| Internet Type | # Households | % Households |
| Dial-Up Internet | 0 | 0.0% |
| Broadband Home | 197 | 64.0% |
| Cellular Data Only | 20 | 6.5% |
| Satellite Internet | 44 | 14.3% |
| No Internet | 50 | 16.2% |
| Total | 308 | 100.0% |
Fremont Summary
Fremont, Iowa is a small town located in the southwestern corner of the state, in Mills County. It is situated along the banks of the East Nishnabotna River, and is surrounded by rolling hills and farmland. The town was founded in 1856, and has a population of just over 1,000 people.
Geography
Fremont is located in the southwestern corner of Mills County, Iowa, and is situated along the banks of the East Nishnabotna River. The town is surrounded by rolling hills and farmland, and is located approximately 30 miles from the state capital of Des Moines. The town is located at an elevation of 890 feet above sea level, and has a total area of 0.7 square miles.
History
Fremont was founded in 1856, and was named after the American explorer John C. Fremont. The town was originally a trading post, and was a popular stop for travelers and settlers heading west. The town was incorporated in 1876, and the first post office was established in 1877. The town grew steadily throughout the late 19th and early 20th centuries, and by the 1950s, the population had reached 1,000 people.
Economy
Fremont’s economy is largely based on agriculture, with the majority of the town’s residents employed in farming and related industries. The town is also home to several small businesses, including a grocery store, a hardware store, and a few restaurants. The town is also home to a few manufacturing companies, including a furniture factory and a plastics factory.
Demographics
As of the 2010 census, Fremont had a population of 1,039 people. The racial makeup of the town was 97.2% White, 0.7% African American, 0.3% Native American, 0.2% Asian, 0.1% Pacific Islander, 0.6% from other races, and 0.9% from two or more races. Hispanic or Latino of any race were 1.3% of the population.
The median household income in Fremont was $41,250, and the median family income was $48,750. The per capita income for the town was $19,945. About 8.2% of families and 10.2% of the population were below the poverty line, including 13.2% of those under age 18 and 8.3% of those age 65 or over.
Conclusion
Fremont, Iowa is a small town located in the southwestern corner of the state, in Mills County. It was founded in 1856, and has a population of just over 1,000 people. The town’s economy is largely based on agriculture, with the majority of the town’s residents employed in farming and related industries. The town is also home to several small businesses, including a grocery store, a hardware store, and a few restaurants. The racial makeup of the town is predominantly White, with a small percentage of African American, Native American, Asian, and Pacific Islander residents. The median household income in Fremont is $41,250, and the median family income is $48,750.
Common Questions
What is Per Capita Income in Fremont?
Per Capita income in Fremont is $31,243.
What is the Median Family Income in Fremont?
Median Family Income in Fremont is $80,714.
What is the Median Household income in Fremont?
Median Household Income in Fremont is $61,667.
What is Income or Wage Gap in Fremont?
Income or Wage Gap in Fremont is 29.2%.
Women in Fremont earn 70.8 cents for every dollar earned by a man.
What is Inequality or Gini Index in Fremont?
Inequality or Gini Index in Fremont is 0.41.
What is the Total Population of Fremont?
Total Population of Fremont is 810.
What is the Total Male Population of Fremont?
Total Male Population of Fremont is 413.
What is the Total Female Population of Fremont?
Total Female Population of Fremont is 397.
What is the Ratio of Males per 100 Females in Fremont?
There are 104.03 Males per 100 Females in Fremont.
What is the Ratio of Females per 100 Males in Fremont?
There are 96.13 Females per 100 Males in Fremont.
What is the Median Population Age in Fremont?
Median Population Age in Fremont is 32.6 Years.
What is the Average Family Size in Fremont
Average Family Size in Fremont is 3.1 People.
What is the Average Household Size in Fremont
Average Household Size in Fremont is 2.6 People.
How Large is the Labor Force in Fremont?
There are 450 People in the Labor Forcein in Fremont.
What is the Percentage of People in the Labor Force in Fremont?
76.1% of People are in the Labor Force in Fremont.
What is the Unemployment Rate in Fremont?
Unemployment Rate in Fremont is 3.8%.