Bonner West Riverside, MT Map & Demographics
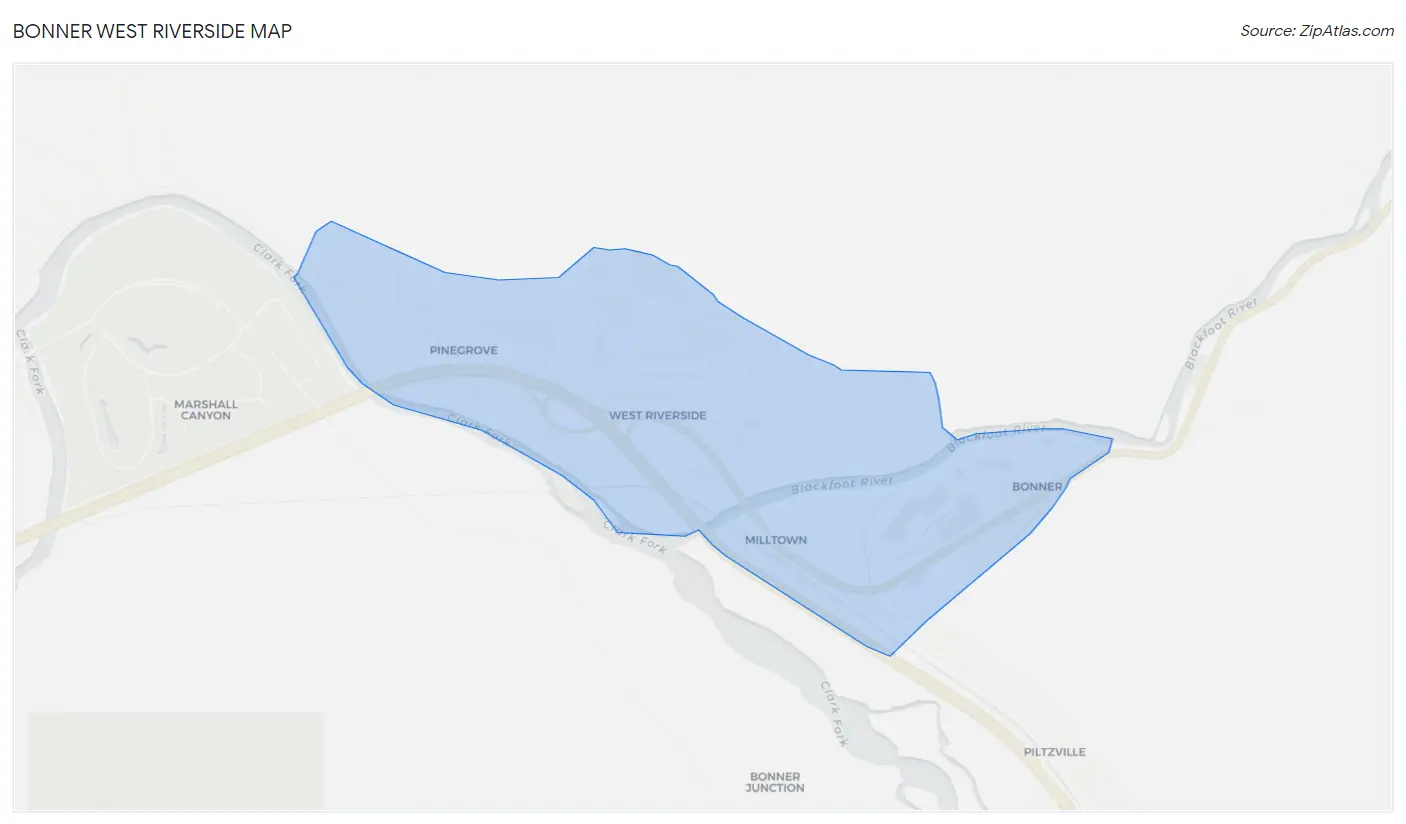
Bonner West Riverside Map
Bonner West Riverside Overview
$32,188
PER CAPITA INCOME
$59,760
AVG FAMILY INCOME
$58,673
AVG HOUSEHOLD INCOME
54.2%
WAGE / INCOME GAP [ % ]
45.8¢/ $1
WAGE / INCOME GAP [ $ ]
0.47
INEQUALITY / GINI INDEX
1,281
TOTAL POPULATION
651
MALE POPULATION
630
FEMALE POPULATION
103.33
MALES / 100 FEMALES
96.77
FEMALES / 100 MALES
38.9
MEDIAN AGE
2.8
AVG FAMILY SIZE
2.3
AVG HOUSEHOLD SIZE
770
LABOR FORCE [ PEOPLE ]
73.8%
PERCENT IN LABOR FORCE
5.0%
UNEMPLOYMENT RATE
Income in Bonner West Riverside
Income Overview in Bonner West Riverside
Per Capita Income in Bonner West Riverside is $32,188, while median incomes of families and households are $59,760 and $58,673 respectively.
| Characteristic | Number | Measure |
| Per Capita Income | 1,281 | $32,188 |
| Median Family Income | 317 | $59,760 |
| Mean Family Income | 317 | $57,203 |
| Median Household Income | 564 | $58,673 |
| Mean Household Income | 564 | $72,768 |
| Income Deficit | 317 | $0 |
| Wage / Income Gap (%) | 1,281 | 54.22% |
| Wage / Income Gap ($) | 1,281 | 45.78¢ per $1 |
| Gini / Inequality Index | 1,281 | 0.47 |
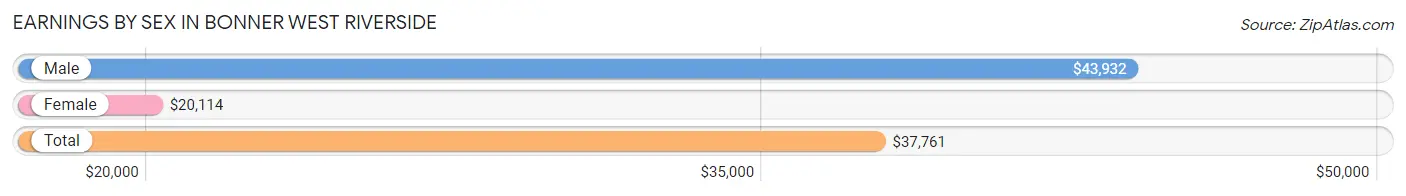
Earnings by Sex in Bonner West Riverside
Average Earnings in Bonner West Riverside are $37,761, $43,932 for men and $20,114 for women, a difference of 54.2%.
| Sex | Number | Average Earnings |
| Male | 383 (49.2%) | $43,932 |
| Female | 395 (50.8%) | $20,114 |
| Total | 778 (100.0%) | $37,761 |
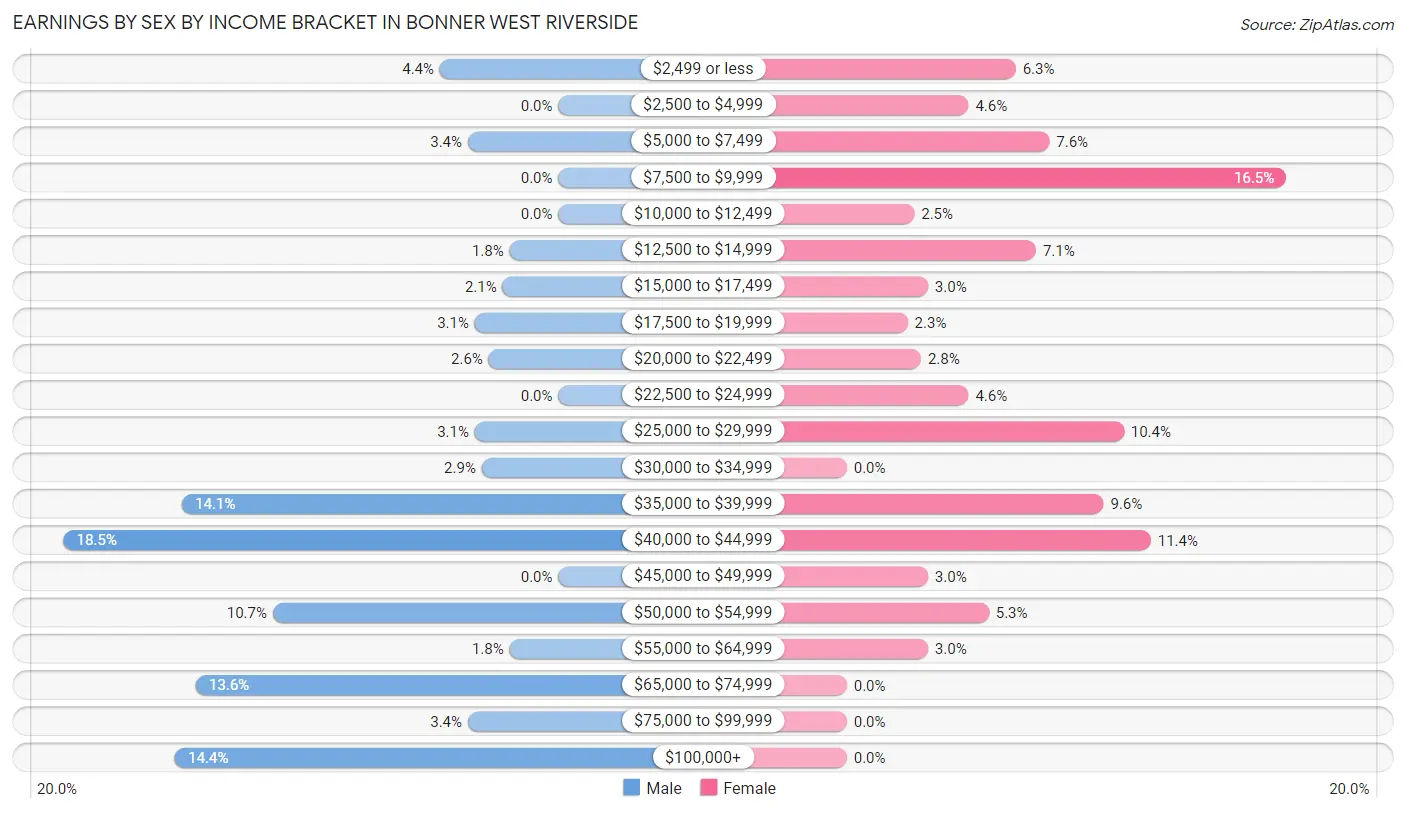
Earnings by Sex by Income Bracket in Bonner West Riverside
The most common earnings brackets in Bonner West Riverside are $40,000 to $44,999 for men (71 | 18.5%) and $7,500 to $9,999 for women (65 | 16.5%).
| Income | Male | Female |
| $2,499 or less | 17 (4.4%) | 25 (6.3%) |
| $2,500 to $4,999 | 0 (0.0%) | 18 (4.6%) |
| $5,000 to $7,499 | 13 (3.4%) | 30 (7.6%) |
| $7,500 to $9,999 | 0 (0.0%) | 65 (16.5%) |
| $10,000 to $12,499 | 0 (0.0%) | 10 (2.5%) |
| $12,500 to $14,999 | 7 (1.8%) | 28 (7.1%) |
| $15,000 to $17,499 | 8 (2.1%) | 12 (3.0%) |
| $17,500 to $19,999 | 12 (3.1%) | 9 (2.3%) |
| $20,000 to $22,499 | 10 (2.6%) | 11 (2.8%) |
| $22,500 to $24,999 | 0 (0.0%) | 18 (4.6%) |
| $25,000 to $29,999 | 12 (3.1%) | 41 (10.4%) |
| $30,000 to $34,999 | 11 (2.9%) | 0 (0.0%) |
| $35,000 to $39,999 | 54 (14.1%) | 38 (9.6%) |
| $40,000 to $44,999 | 71 (18.5%) | 45 (11.4%) |
| $45,000 to $49,999 | 0 (0.0%) | 12 (3.0%) |
| $50,000 to $54,999 | 41 (10.7%) | 21 (5.3%) |
| $55,000 to $64,999 | 7 (1.8%) | 12 (3.0%) |
| $65,000 to $74,999 | 52 (13.6%) | 0 (0.0%) |
| $75,000 to $99,999 | 13 (3.4%) | 0 (0.0%) |
| $100,000+ | 55 (14.4%) | 0 (0.0%) |
| Total | 383 (100.0%) | 395 (100.0%) |
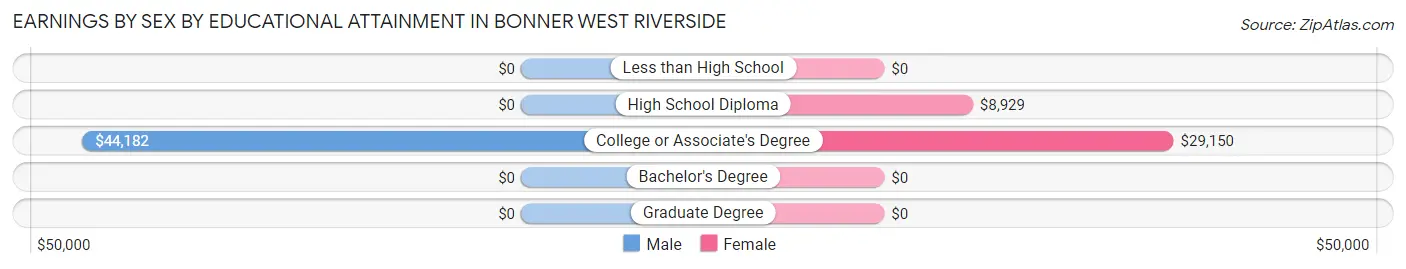
Earnings by Sex by Educational Attainment in Bonner West Riverside
Average earnings in Bonner West Riverside are $52,744 for men and $20,227 for women, a difference of 61.7%. Men with an educational attainment of college or associate's degree enjoy the highest average annual earnings of $44,182, while those with college or associate's degree education earn the least with $44,182. Women with an educational attainment of college or associate's degree earn the most with the average annual earnings of $29,150, while those with high school diploma education have the smallest earnings of $8,929.
| Educational Attainment | Male Income | Female Income |
| Less than High School | - | - |
| High School Diploma | - | - |
| College or Associate's Degree | $44,182 | $29,150 |
| Bachelor's Degree | - | - |
| Graduate Degree | - | - |
| Total | $52,744 | $20,227 |
Family Income in Bonner West Riverside
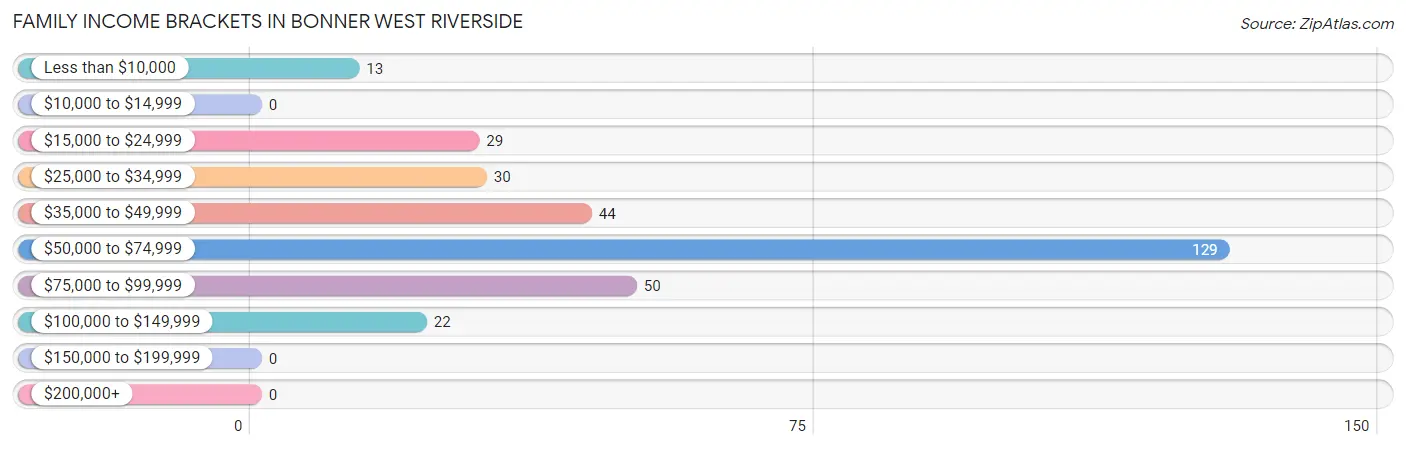
Family Income Brackets in Bonner West Riverside
According to the Bonner West Riverside family income data, there are 129 families falling into the $50,000 to $74,999 income range, which is the most common income bracket and makes up 40.7% of all families.
| Income Bracket | # Families | % Families |
| Less than $10,000 | 13 | 4.1% |
| $10,000 to $14,999 | 0 | 0.0% |
| $15,000 to $24,999 | 29 | 9.1% |
| $25,000 to $34,999 | 30 | 9.5% |
| $35,000 to $49,999 | 44 | 13.9% |
| $50,000 to $74,999 | 129 | 40.7% |
| $75,000 to $99,999 | 50 | 15.8% |
| $100,000 to $149,999 | 22 | 6.9% |
| $150,000 to $199,999 | 0 | 0.0% |
| $200,000+ | 0 | 0.0% |
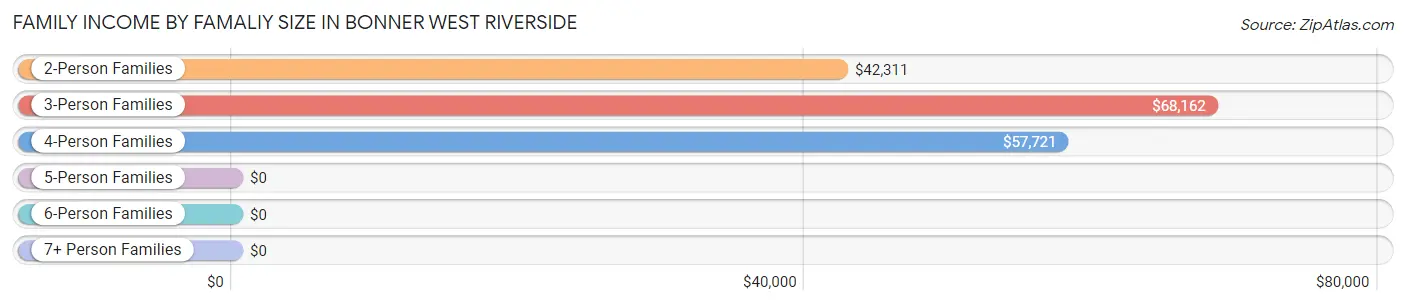
Family Income by Famaliy Size in Bonner West Riverside
3-person families (29 | 9.1%) account for the highest median family income in Bonner West Riverside with $68,162 per family, while 3-person families (29 | 9.1%) have the highest median income of $22,721 per family member.
| Income Bracket | # Families | Median Income |
| 2-Person Families | 201 (63.4%) | $42,311 |
| 3-Person Families | 29 (9.1%) | $68,162 |
| 4-Person Families | 47 (14.8%) | $57,721 |
| 5-Person Families | 28 (8.8%) | $0 |
| 6-Person Families | 0 (0.0%) | $0 |
| 7+ Person Families | 12 (3.8%) | $0 |
| Total | 317 (100.0%) | $59,760 |
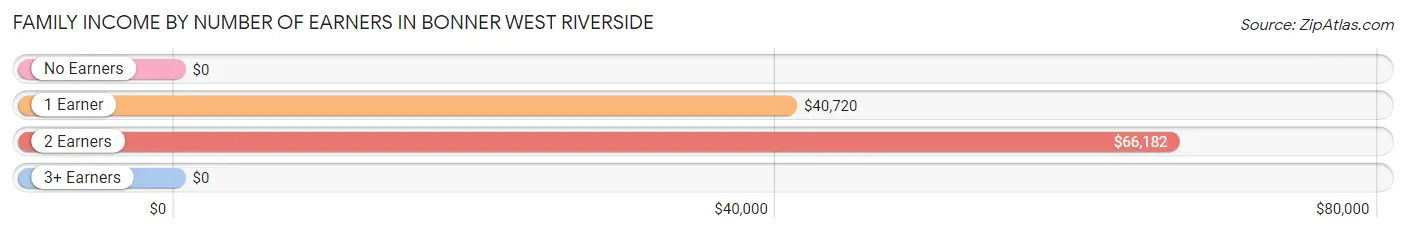
Family Income by Number of Earners in Bonner West Riverside
| Number of Earners | # Families | Median Income |
| No Earners | 29 (9.1%) | $0 |
| 1 Earner | 103 (32.5%) | $40,720 |
| 2 Earners | 171 (53.9%) | $66,182 |
| 3+ Earners | 14 (4.4%) | $0 |
| Total | 317 (100.0%) | $59,760 |
Household Income in Bonner West Riverside
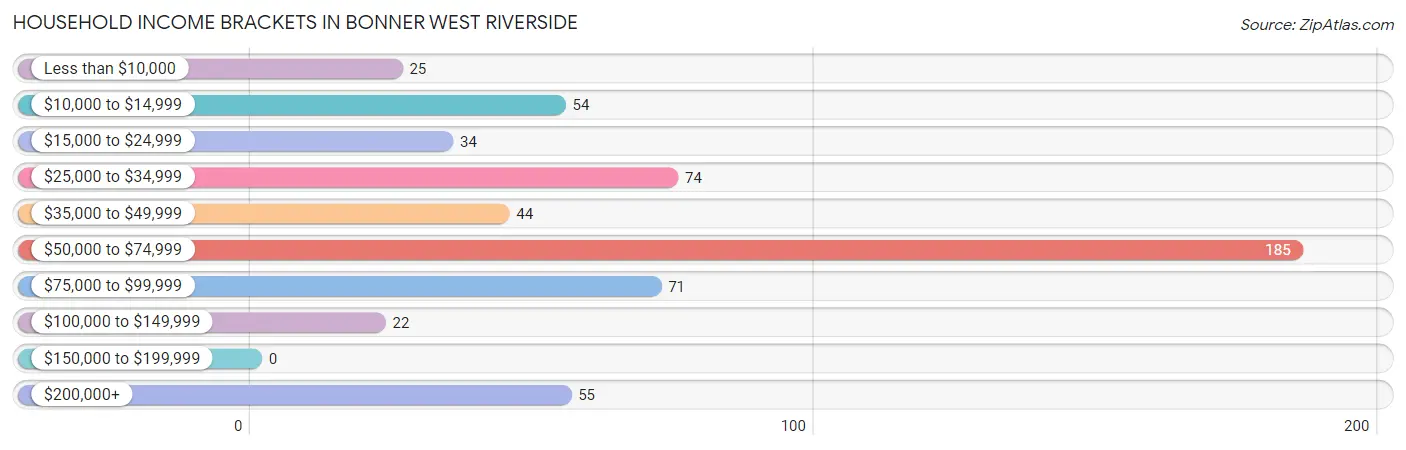
Household Income Brackets in Bonner West Riverside
With 185 households falling in the category, the $50,000 to $74,999 income range is the most frequent in Bonner West Riverside, accounting for 32.8% of all households.
| Income Bracket | # Households | % Households |
| Less than $10,000 | 25 | 4.4% |
| $10,000 to $14,999 | 54 | 9.6% |
| $15,000 to $24,999 | 34 | 6.0% |
| $25,000 to $34,999 | 74 | 13.1% |
| $35,000 to $49,999 | 44 | 7.8% |
| $50,000 to $74,999 | 185 | 32.8% |
| $75,000 to $99,999 | 71 | 12.6% |
| $100,000 to $149,999 | 22 | 3.9% |
| $150,000 to $199,999 | 0 | 0.0% |
| $200,000+ | 55 | 9.8% |
Household Income by Householder Age in Bonner West Riverside
The median household income in Bonner West Riverside is $58,673, with the highest median household income of $85,694 found in the 45 to 64 years age bracket for the primary householder. A total of 169 households (30.0%) fall into this category. Meanwhile, the 15 to 24 years age bracket for the primary householder has the lowest median household income of $0, with 29 households (5.1%) in this group.
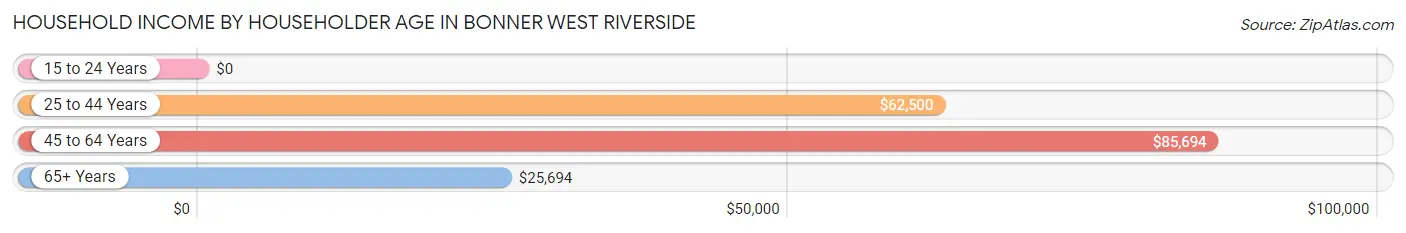
| Income Bracket | # Households | Median Income |
| 15 to 24 Years | 29 (5.1%) | $0 |
| 25 to 44 Years | 214 (37.9%) | $62,500 |
| 45 to 64 Years | 169 (30.0%) | $85,694 |
| 65+ Years | 152 (27.0%) | $25,694 |
| Total | 564 (100.0%) | $58,673 |
Poverty in Bonner West Riverside
Income Below Poverty by Sex and Age in Bonner West Riverside
With 10.6% poverty level for males and 19.8% for females among the residents of Bonner West Riverside, 75 year old and over males and 75 year old and over females are the most vulnerable to poverty, with 18 males (64.3%) and 16 females (100.0%) in their respective age groups living below the poverty level.
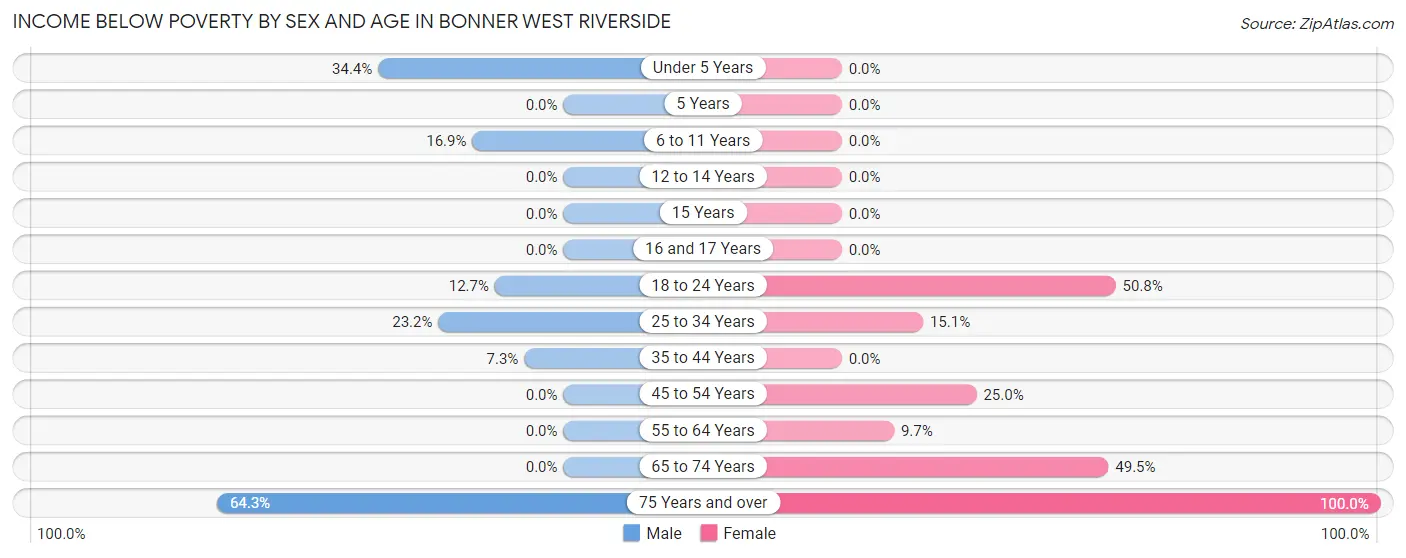
| Age Bracket | Male | Female |
| Under 5 Years | 11 (34.4%) | 0 (0.0%) |
| 5 Years | 0 (0.0%) | 0 (0.0%) |
| 6 to 11 Years | 12 (16.9%) | 0 (0.0%) |
| 12 to 14 Years | 0 (0.0%) | 0 (0.0%) |
| 15 Years | 0 (0.0%) | 0 (0.0%) |
| 16 and 17 Years | 0 (0.0%) | 0 (0.0%) |
| 18 to 24 Years | 7 (12.7%) | 31 (50.8%) |
| 25 to 34 Years | 13 (23.2%) | 11 (15.1%) |
| 35 to 44 Years | 8 (7.3%) | 0 (0.0%) |
| 45 to 54 Years | 0 (0.0%) | 10 (25.0%) |
| 55 to 64 Years | 0 (0.0%) | 9 (9.7%) |
| 65 to 74 Years | 0 (0.0%) | 48 (49.5%) |
| 75 Years and over | 18 (64.3%) | 16 (100.0%) |
| Total | 69 (10.6%) | 125 (19.8%) |
Income Above Poverty by Sex and Age in Bonner West Riverside
According to the poverty statistics in Bonner West Riverside, males aged 5 years and females aged under 5 years are the age groups that are most secure financially, with 100.0% of males and 100.0% of females in these age groups living above the poverty line.
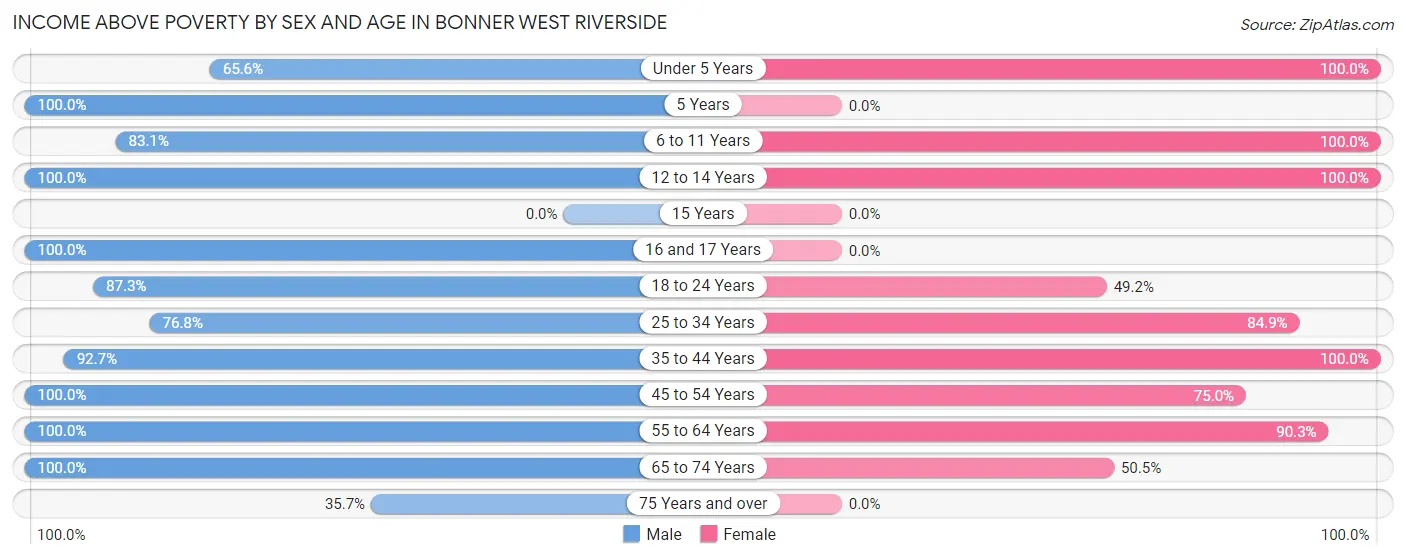
| Age Bracket | Male | Female |
| Under 5 Years | 21 (65.6%) | 70 (100.0%) |
| 5 Years | 11 (100.0%) | 0 (0.0%) |
| 6 to 11 Years | 59 (83.1%) | 11 (100.0%) |
| 12 to 14 Years | 17 (100.0%) | 26 (100.0%) |
| 15 Years | 0 (0.0%) | 0 (0.0%) |
| 16 and 17 Years | 38 (100.0%) | 0 (0.0%) |
| 18 to 24 Years | 48 (87.3%) | 30 (49.2%) |
| 25 to 34 Years | 43 (76.8%) | 62 (84.9%) |
| 35 to 44 Years | 102 (92.7%) | 143 (100.0%) |
| 45 to 54 Years | 48 (100.0%) | 30 (75.0%) |
| 55 to 64 Years | 138 (100.0%) | 84 (90.3%) |
| 65 to 74 Years | 47 (100.0%) | 49 (50.5%) |
| 75 Years and over | 10 (35.7%) | 0 (0.0%) |
| Total | 582 (89.4%) | 505 (80.2%) |
Income Below Poverty Among Married-Couple Families in Bonner West Riverside
The poverty statistics for married-couple families in Bonner West Riverside show that 15.5% or 31 of the total 200 families live below the poverty line. Families with 1 or 2 children have the highest poverty rate of 20.3%, comprising of 13 families. On the other hand, families with 3 or 4 children have the lowest poverty rate of 0.0%, which includes 0 families.
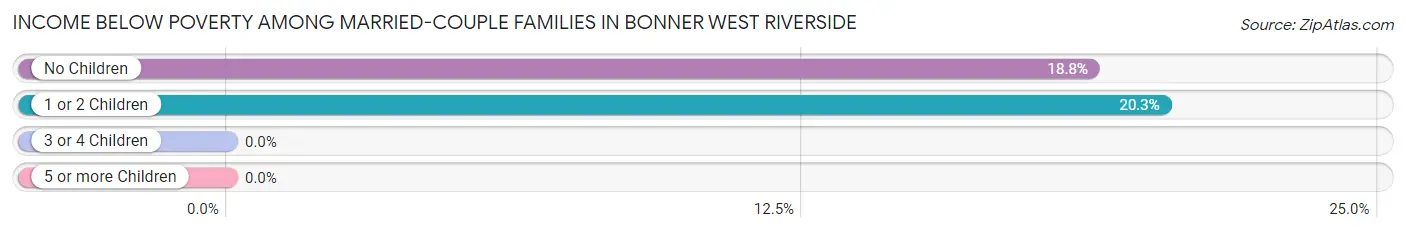
| Children | Above Poverty | Below Poverty |
| No Children | 78 (81.2%) | 18 (18.8%) |
| 1 or 2 Children | 51 (79.7%) | 13 (20.3%) |
| 3 or 4 Children | 40 (100.0%) | 0 (0.0%) |
| 5 or more Children | 0 (0.0%) | 0 (0.0%) |
| Total | 169 (84.5%) | 31 (15.5%) |
Income Below Poverty Among Single-Parent Households in Bonner West Riverside
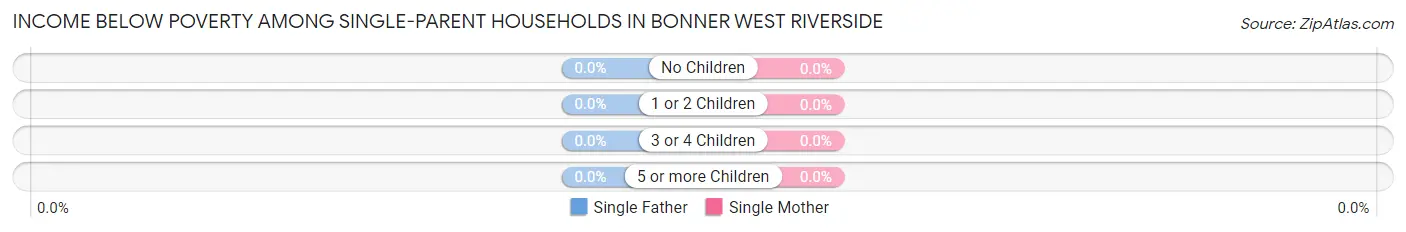
| Children | Single Father | Single Mother |
| No Children | 0 (0.0%) | 0 (0.0%) |
| 1 or 2 Children | 0 (0.0%) | 0 (0.0%) |
| 3 or 4 Children | 0 (0.0%) | 0 (0.0%) |
| 5 or more Children | 0 (0.0%) | 0 (0.0%) |
| Total | 0 (0.0%) | 0 (0.0%) |
Income Below Poverty Among Married-Couple vs Single-Parent Households in Bonner West Riverside
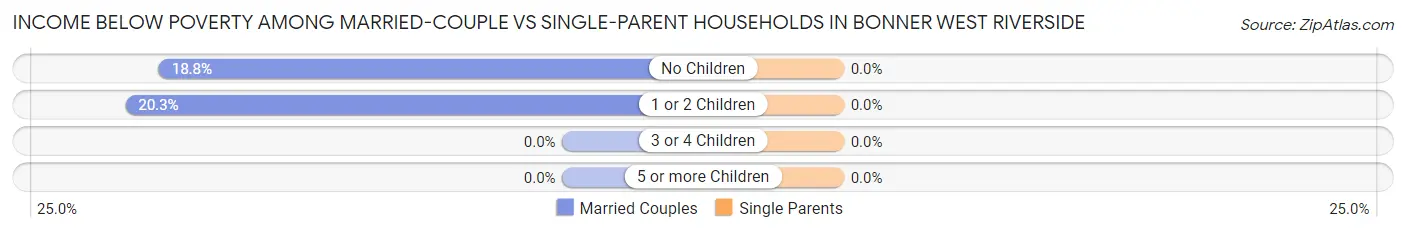
| Children | Married-Couple Families | Single-Parent Households |
| No Children | 18 (18.8%) | 0 (0.0%) |
| 1 or 2 Children | 13 (20.3%) | 0 (0.0%) |
| 3 or 4 Children | 0 (0.0%) | 0 (0.0%) |
| 5 or more Children | 0 (0.0%) | 0 (0.0%) |
| Total | 31 (15.5%) | 0 (0.0%) |
Race in Bonner West Riverside
The most populous races in Bonner West Riverside are White / Caucasian (1,113 | 86.9%), Two or more Races (147 | 11.5%), and Hispanic or Latino (50 | 3.9%).
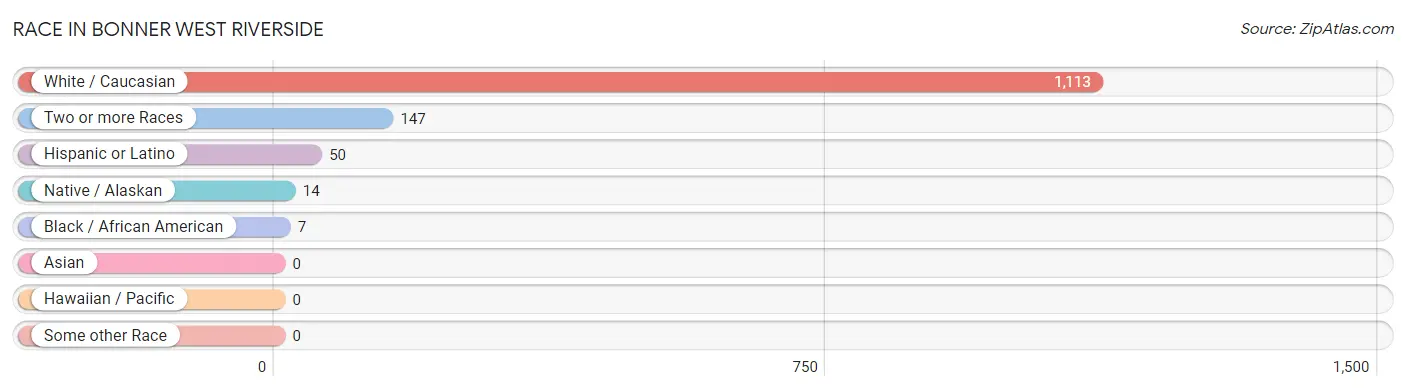
| Race | # Population | % Population |
| Asian | 0 | 0.0% |
| Black / African American | 7 | 0.5% |
| Hawaiian / Pacific | 0 | 0.0% |
| Hispanic or Latino | 50 | 3.9% |
| Native / Alaskan | 14 | 1.1% |
| White / Caucasian | 1,113 | 86.9% |
| Two or more Races | 147 | 11.5% |
| Some other Race | 0 | 0.0% |
| Total | 1,281 | 100.0% |
Ancestry in Bonner West Riverside
The most populous ancestries reported in Bonner West Riverside are German (282 | 22.0%), Irish (177 | 13.8%), Luxembourger (108 | 8.4%), Cherokee (73 | 5.7%), and Norwegian (67 | 5.2%), together accounting for 55.2% of all Bonner West Riverside residents.
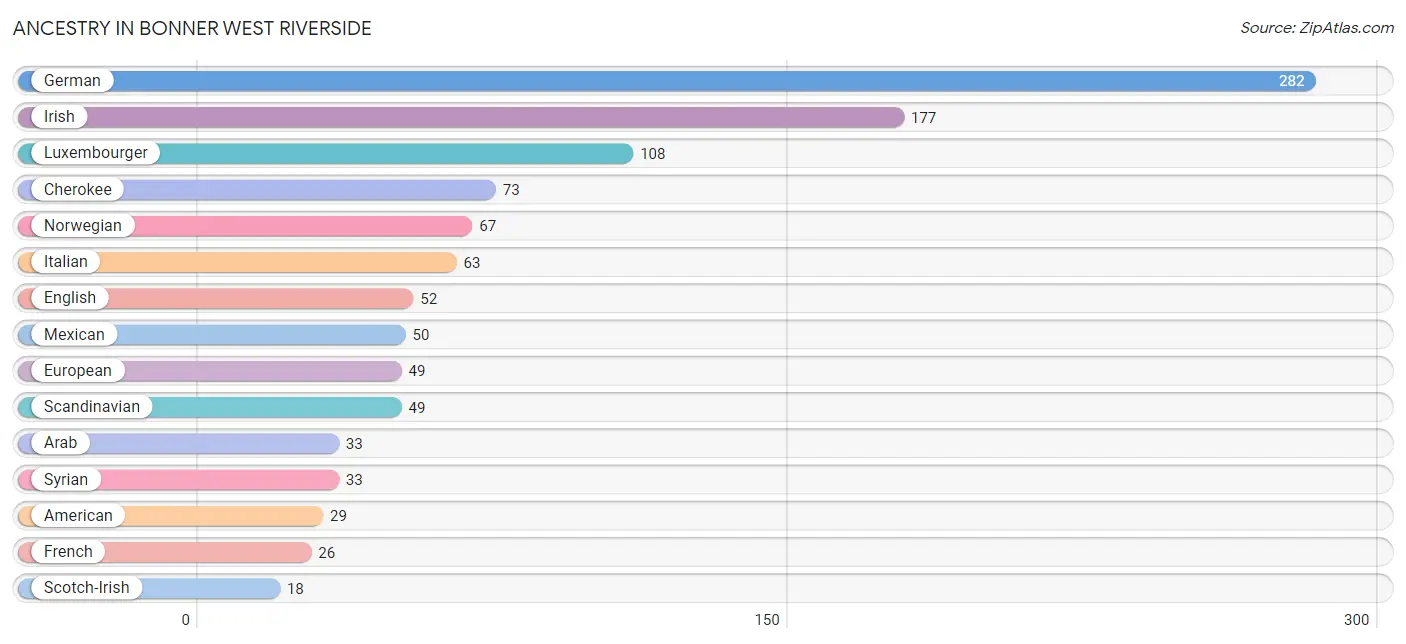
| Ancestry | # Population | % Population |
| American | 29 | 2.3% |
| Arab | 33 | 2.6% |
| Belgian | 4 | 0.3% |
| Cherokee | 73 | 5.7% |
| Chippewa | 8 | 0.6% |
| Creek | 8 | 0.6% |
| English | 52 | 4.1% |
| European | 49 | 3.8% |
| French | 26 | 2.0% |
| German | 282 | 22.0% |
| Irish | 177 | 13.8% |
| Italian | 63 | 4.9% |
| Luxembourger | 108 | 8.4% |
| Mexican | 50 | 3.9% |
| Norwegian | 67 | 5.2% |
| Polish | 7 | 0.5% |
| Scandinavian | 49 | 3.8% |
| Scotch-Irish | 18 | 1.4% |
| Swedish | 4 | 0.3% |
| Syrian | 33 | 2.6% | View All 20 Rows |
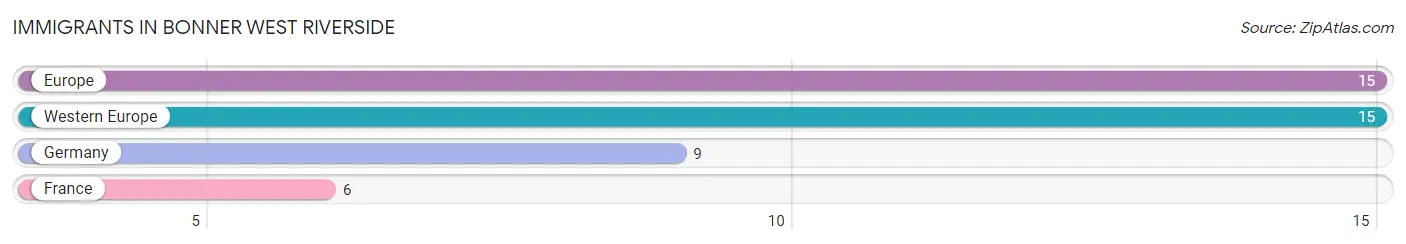
Immigrants in Bonner West Riverside
The most numerous immigrant groups reported in Bonner West Riverside came from Europe (15 | 1.2%), Western Europe (15 | 1.2%), Germany (9 | 0.7%), and France (6 | 0.5%), together accounting for 3.5% of all Bonner West Riverside residents.
| Immigration Origin | # Population | % Population |
| Europe | 15 | 1.2% |
| France | 6 | 0.5% |
| Germany | 9 | 0.7% |
| Western Europe | 15 | 1.2% | View All 4 Rows |
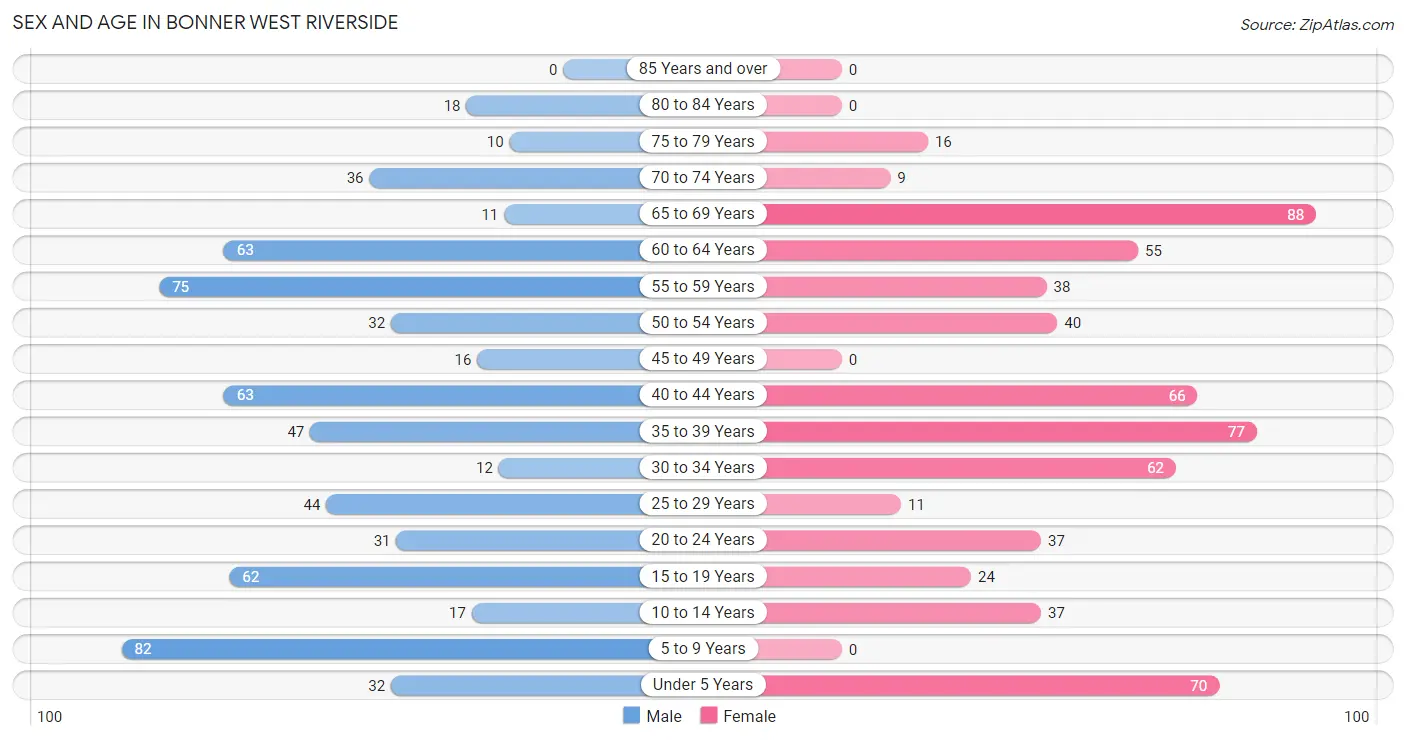
Sex and Age in Bonner West Riverside
Sex and Age in Bonner West Riverside
The most populous age groups in Bonner West Riverside are 5 to 9 Years (82 | 12.6%) for men and 65 to 69 Years (88 | 14.0%) for women.
| Age Bracket | Male | Female |
| Under 5 Years | 32 (4.9%) | 70 (11.1%) |
| 5 to 9 Years | 82 (12.6%) | 0 (0.0%) |
| 10 to 14 Years | 17 (2.6%) | 37 (5.9%) |
| 15 to 19 Years | 62 (9.5%) | 24 (3.8%) |
| 20 to 24 Years | 31 (4.8%) | 37 (5.9%) |
| 25 to 29 Years | 44 (6.8%) | 11 (1.8%) |
| 30 to 34 Years | 12 (1.8%) | 62 (9.8%) |
| 35 to 39 Years | 47 (7.2%) | 77 (12.2%) |
| 40 to 44 Years | 63 (9.7%) | 66 (10.5%) |
| 45 to 49 Years | 16 (2.5%) | 0 (0.0%) |
| 50 to 54 Years | 32 (4.9%) | 40 (6.4%) |
| 55 to 59 Years | 75 (11.5%) | 38 (6.0%) |
| 60 to 64 Years | 63 (9.7%) | 55 (8.7%) |
| 65 to 69 Years | 11 (1.7%) | 88 (14.0%) |
| 70 to 74 Years | 36 (5.5%) | 9 (1.4%) |
| 75 to 79 Years | 10 (1.5%) | 16 (2.5%) |
| 80 to 84 Years | 18 (2.8%) | 0 (0.0%) |
| 85 Years and over | 0 (0.0%) | 0 (0.0%) |
| Total | 651 (100.0%) | 630 (100.0%) |
Families and Households in Bonner West Riverside
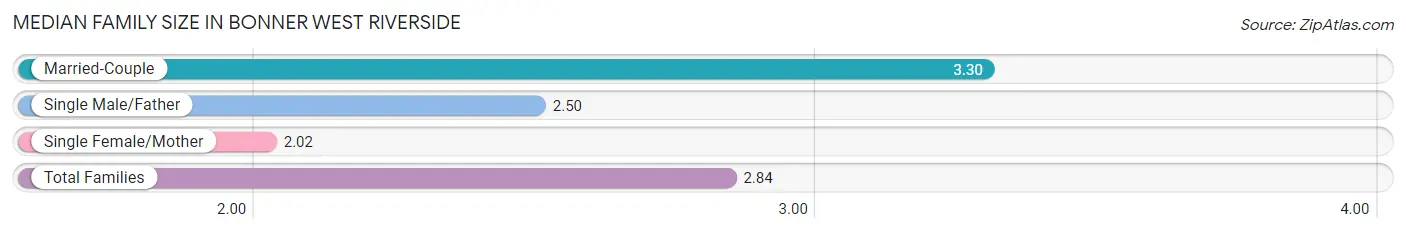
Median Family Size in Bonner West Riverside
The median family size in Bonner West Riverside is 2.84 persons per family, with married-couple families (200 | 63.1%) accounting for the largest median family size of 3.3 persons per family. On the other hand, single female/mother families (107 | 33.8%) represent the smallest median family size with 2.02 persons per family.
| Family Type | # Families | Family Size |
| Married-Couple | 200 (63.1%) | 3.30 |
| Single Male/Father | 10 (3.2%) | 2.50 |
| Single Female/Mother | 107 (33.8%) | 2.02 |
| Total Families | 317 (100.0%) | 2.84 |
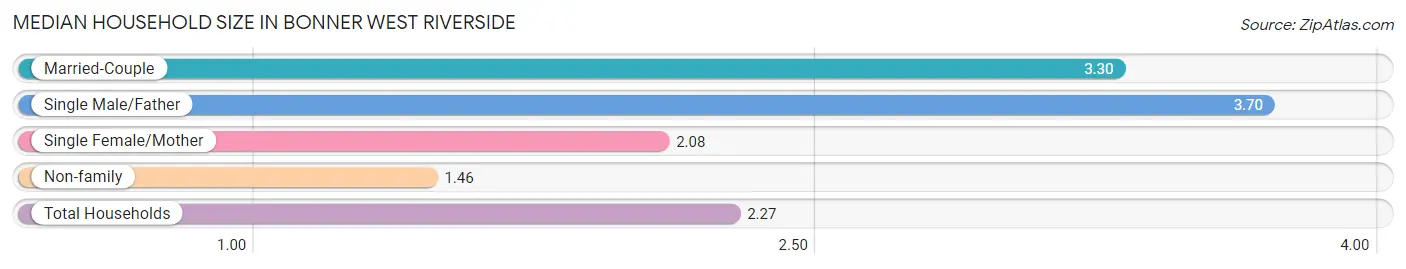
Median Household Size in Bonner West Riverside
The median household size in Bonner West Riverside is 2.27 persons per household, with single male/father households (10 | 1.8%) accounting for the largest median household size of 3.7 persons per household. non-family households (247 | 43.8%) represent the smallest median household size with 1.46 persons per household.
| Household Type | # Households | Household Size |
| Married-Couple | 200 (35.5%) | 3.30 |
| Single Male/Father | 10 (1.8%) | 3.70 |
| Single Female/Mother | 107 (19.0%) | 2.08 |
| Non-family | 247 (43.8%) | 1.46 |
| Total Households | 564 (100.0%) | 2.27 |
Household Size by Marriage Status in Bonner West Riverside
Out of a total of 564 households in Bonner West Riverside, 317 (56.2%) are family households, while 247 (43.8%) are nonfamily households. The most numerous type of family households are 2-person households, comprising 190, and the most common type of nonfamily households are 1-person households, comprising 134.
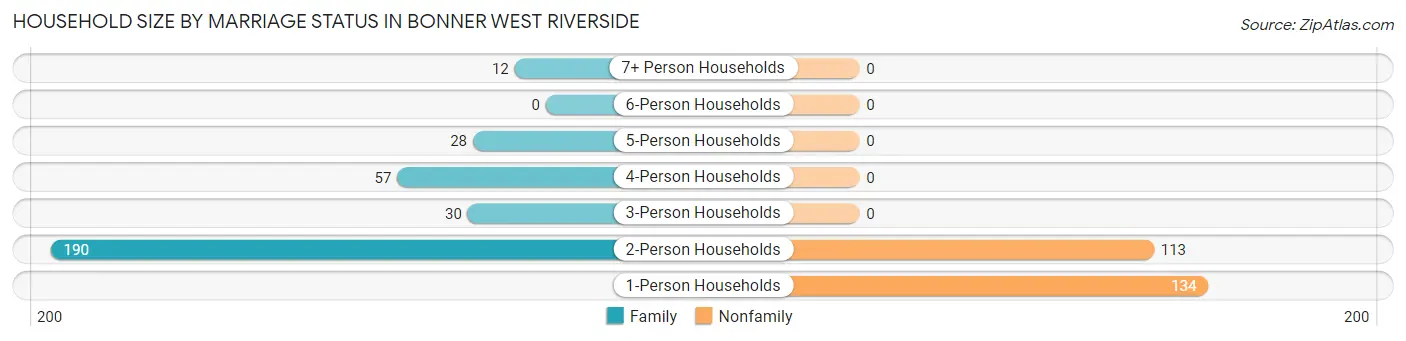
| Household Size | Family Households | Nonfamily Households |
| 1-Person Households | - | 134 (23.8%) |
| 2-Person Households | 190 (33.7%) | 113 (20.0%) |
| 3-Person Households | 30 (5.3%) | 0 (0.0%) |
| 4-Person Households | 57 (10.1%) | 0 (0.0%) |
| 5-Person Households | 28 (5.0%) | 0 (0.0%) |
| 6-Person Households | 0 (0.0%) | 0 (0.0%) |
| 7+ Person Households | 12 (2.1%) | 0 (0.0%) |
| Total | 317 (56.2%) | 247 (43.8%) |
Female Fertility in Bonner West Riverside
Fertility by Age in Bonner West Riverside
| Age Bracket | Women with Births | Births / 1,000 Women |
| 15 to 19 years | 0 (0.0%) | 0.0 |
| 20 to 34 years | 0 (0.0%) | 0.0 |
| 35 to 50 years | 0 (0.0%) | 0.0 |
| Total | 0 (0.0%) | 0.0 |
Fertility by Age by Marriage Status in Bonner West Riverside
| Age Bracket | Married | Unmarried |
| 15 to 19 years | 0 (0.0%) | 0 (0.0%) |
| 20 to 34 years | 0 (0.0%) | 0 (0.0%) |
| 35 to 50 years | 0 (0.0%) | 0 (0.0%) |
| Total | 0 (0.0%) | 0 (0.0%) |
Fertility by Education in Bonner West Riverside
| Educational Attainment | Women with Births | Births / 1,000 Women |
| Less than High School | 0 (0.0%) | 0.0 |
| High School Diploma | 0 (0.0%) | 0.0 |
| College or Associate's Degree | 0 (0.0%) | 0.0 |
| Bachelor's Degree | 0 (0.0%) | 0.0 |
| Graduate Degree | 0 (0.0%) | 0.0 |
| Total | 0 (0.0%) | 0.0 |
Fertility by Education by Marriage Status in Bonner West Riverside
| Educational Attainment | Married | Unmarried |
| Less than High School | 0 (0.0%) | 0 (0.0%) |
| High School Diploma | 0 (0.0%) | 0 (0.0%) |
| College or Associate's Degree | 0 (0.0%) | 0 (0.0%) |
| Bachelor's Degree | 0 (0.0%) | 0 (0.0%) |
| Graduate Degree | 0 (0.0%) | 0 (0.0%) |
| Total | 0 (0.0%) | 0 (0.0%) |
Employment Characteristics in Bonner West Riverside
Employment by Class of Employer in Bonner West Riverside
Among the 732 employed individuals in Bonner West Riverside, private company employees (505 | 69.0%), local government employees (84 | 11.5%), and self-employed (not incorporated) (46 | 6.3%) make up the most common classes of employment.
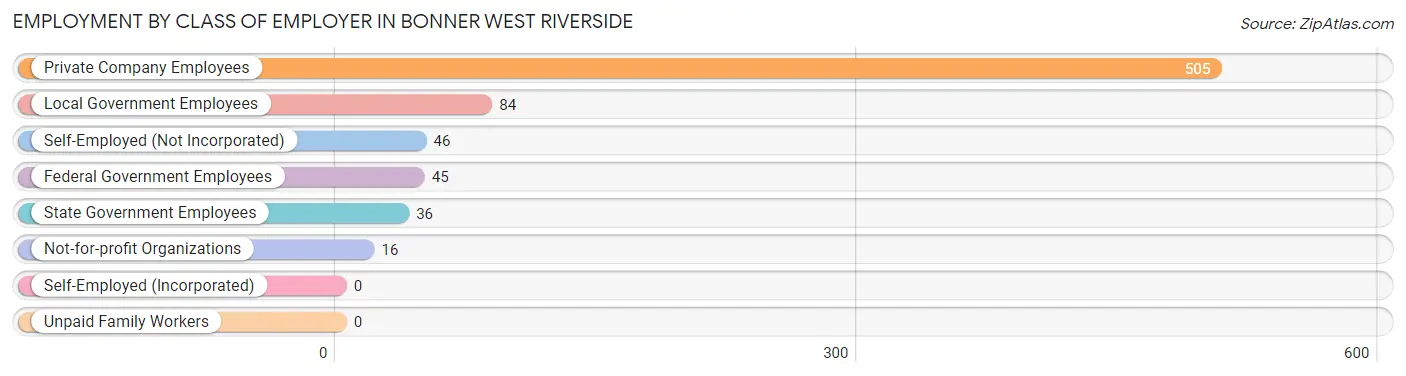
| Employer Class | # Employees | % Employees |
| Private Company Employees | 505 | 69.0% |
| Self-Employed (Incorporated) | 0 | 0.0% |
| Self-Employed (Not Incorporated) | 46 | 6.3% |
| Not-for-profit Organizations | 16 | 2.2% |
| Local Government Employees | 84 | 11.5% |
| State Government Employees | 36 | 4.9% |
| Federal Government Employees | 45 | 6.1% |
| Unpaid Family Workers | 0 | 0.0% |
| Total | 732 | 100.0% |
Employment Status by Age in Bonner West Riverside
According to the labor force statistics for Bonner West Riverside, out of the total population over 16 years of age (1,043), 73.8% or 770 individuals are in the labor force, with 5.0% or 38 of them unemployed. The age group with the highest labor force participation rate is 20 to 24 years, with 100.0% or 68 individuals in the labor force. Within the labor force, the 20 to 24 years age range has the highest percentage of unemployed individuals, with 36.8% or 25 of them being unemployed.
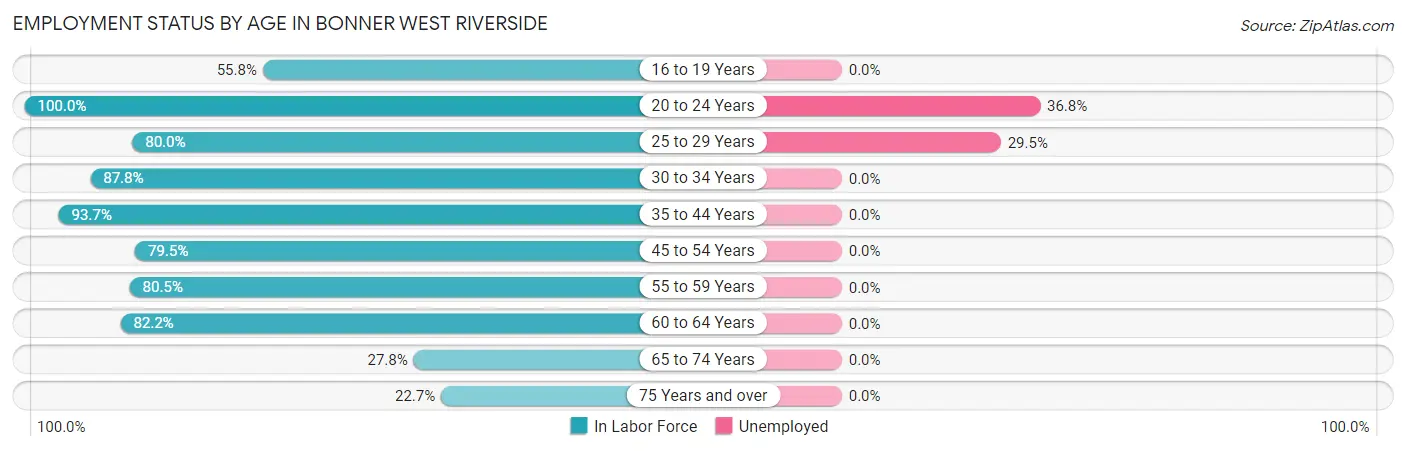
| Age Bracket | In Labor Force | Unemployed |
| 16 to 19 Years | 48 (55.8%) | 0 (0.0%) |
| 20 to 24 Years | 68 (100.0%) | 25 (36.8%) |
| 25 to 29 Years | 44 (80.0%) | 13 (29.5%) |
| 30 to 34 Years | 65 (87.8%) | 0 (0.0%) |
| 35 to 44 Years | 237 (93.7%) | 0 (0.0%) |
| 45 to 54 Years | 70 (79.5%) | 0 (0.0%) |
| 55 to 59 Years | 91 (80.5%) | 0 (0.0%) |
| 60 to 64 Years | 97 (82.2%) | 0 (0.0%) |
| 65 to 74 Years | 40 (27.8%) | 0 (0.0%) |
| 75 Years and over | 10 (22.7%) | 0 (0.0%) |
| Total | 770 (73.8%) | 38 (5.0%) |
Employment Status by Educational Attainment in Bonner West Riverside
According to labor force statistics for Bonner West Riverside, 86.2% of individuals (604) out of the total population between 25 and 64 years of age (701) are in the labor force, with 2.2% or 13 of them being unemployed. The group with the highest labor force participation rate are those with the educational attainment of less than high school, with 100.0% or 12 individuals in the labor force. Within the labor force, individuals with high school diploma education have the highest percentage of unemployment, with 10.2% or 13 of them being unemployed.
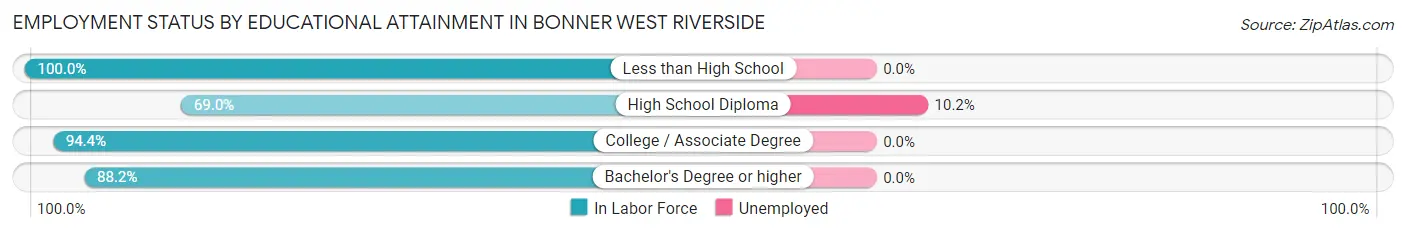
| Educational Attainment | In Labor Force | Unemployed |
| Less than High School | 12 (100.0%) | 0 (0.0%) |
| High School Diploma | 127 (69.0%) | 19 (10.2%) |
| College / Associate Degree | 301 (94.4%) | 0 (0.0%) |
| Bachelor's Degree or higher | 164 (88.2%) | 0 (0.0%) |
| Total | 604 (86.2%) | 15 (2.2%) |
Employment Occupations by Sex in Bonner West Riverside
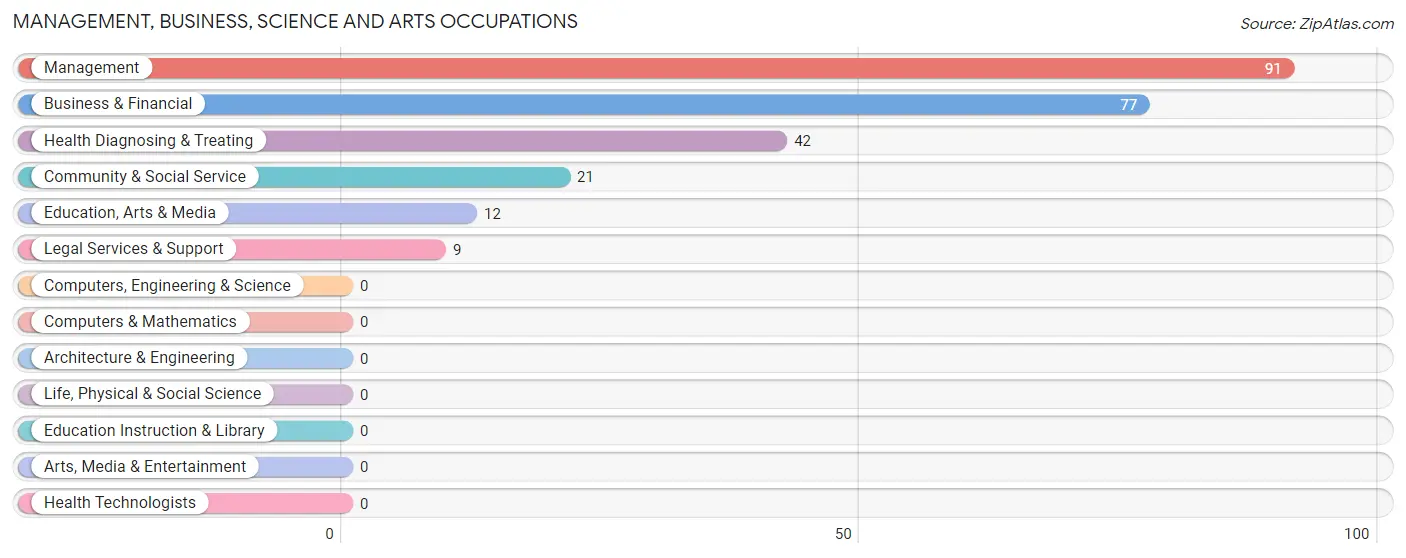
Management, Business, Science and Arts Occupations
The most common Management, Business, Science and Arts occupations in Bonner West Riverside are Management (91 | 12.6%), Business & Financial (77 | 10.6%), Health Diagnosing & Treating (42 | 5.8%), Community & Social Service (21 | 2.9%), and Education, Arts & Media (12 | 1.7%).
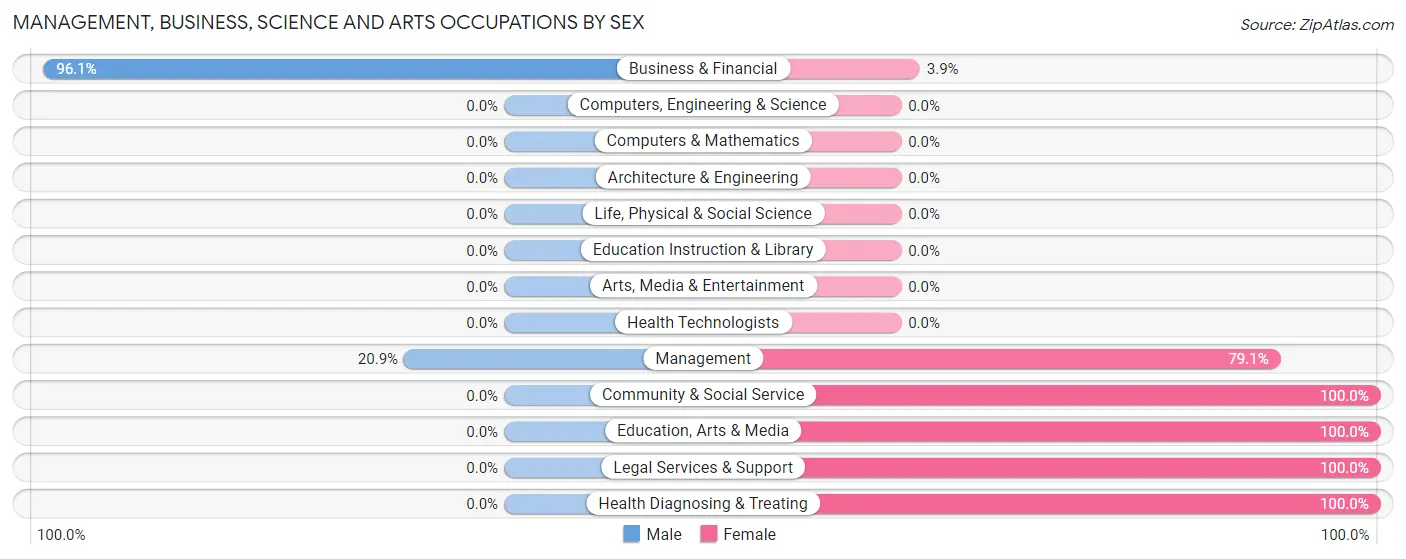
Management, Business, Science and Arts Occupations by Sex
Within the Management, Business, Science and Arts occupations in Bonner West Riverside, the most male-oriented occupations are Business & Financial (96.1%), and Management (20.9%), while the most female-oriented occupations are Community & Social Service (100.0%), Education, Arts & Media (100.0%), and Legal Services & Support (100.0%).
| Occupation | Male | Female |
| Management | 19 (20.9%) | 72 (79.1%) |
| Business & Financial | 74 (96.1%) | 3 (3.9%) |
| Computers, Engineering & Science | 0 (0.0%) | 0 (0.0%) |
| Computers & Mathematics | 0 (0.0%) | 0 (0.0%) |
| Architecture & Engineering | 0 (0.0%) | 0 (0.0%) |
| Life, Physical & Social Science | 0 (0.0%) | 0 (0.0%) |
| Community & Social Service | 0 (0.0%) | 21 (100.0%) |
| Education, Arts & Media | 0 (0.0%) | 12 (100.0%) |
| Legal Services & Support | 0 (0.0%) | 9 (100.0%) |
| Education Instruction & Library | 0 (0.0%) | 0 (0.0%) |
| Arts, Media & Entertainment | 0 (0.0%) | 0 (0.0%) |
| Health Diagnosing & Treating | 0 (0.0%) | 42 (100.0%) |
| Health Technologists | 0 (0.0%) | 0 (0.0%) |
| Total (Category) | 93 (40.3%) | 138 (59.7%) |
| Total (Overall) | 361 (49.9%) | 362 (50.1%) |
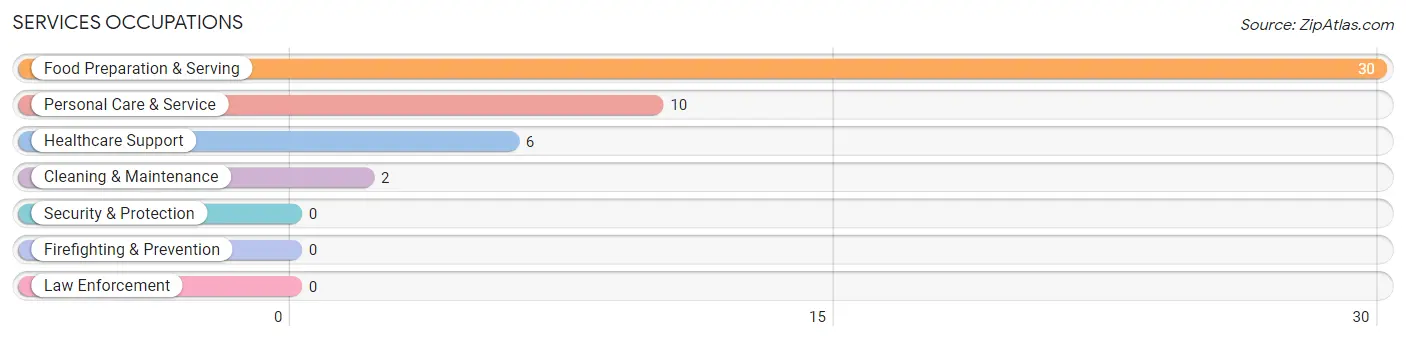
Services Occupations
The most common Services occupations in Bonner West Riverside are Food Preparation & Serving (30 | 4.2%), Personal Care & Service (10 | 1.4%), Healthcare Support (6 | 0.8%), and Cleaning & Maintenance (2 | 0.3%).
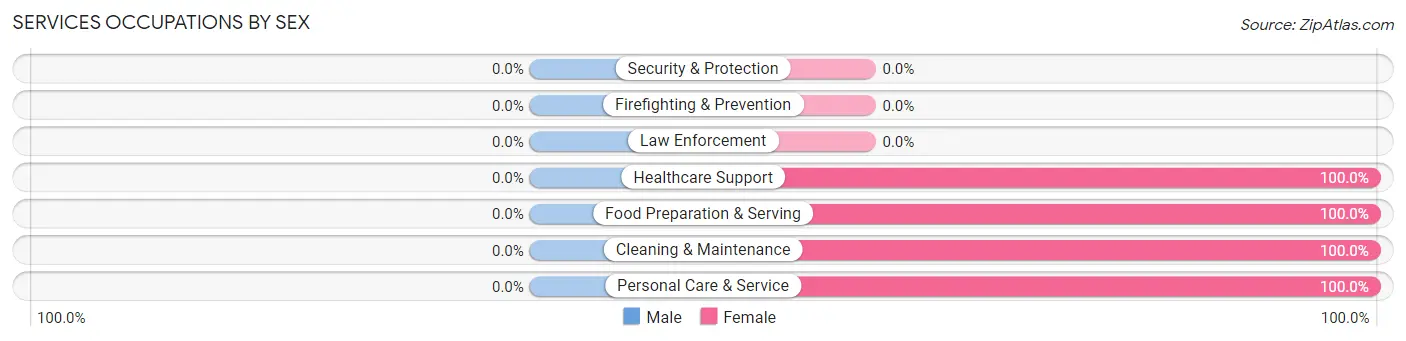
Services Occupations by Sex
| Occupation | Male | Female |
| Healthcare Support | 0 (0.0%) | 6 (100.0%) |
| Security & Protection | 0 (0.0%) | 0 (0.0%) |
| Firefighting & Prevention | 0 (0.0%) | 0 (0.0%) |
| Law Enforcement | 0 (0.0%) | 0 (0.0%) |
| Food Preparation & Serving | 0 (0.0%) | 30 (100.0%) |
| Cleaning & Maintenance | 0 (0.0%) | 2 (100.0%) |
| Personal Care & Service | 0 (0.0%) | 10 (100.0%) |
| Total (Category) | 0 (0.0%) | 48 (100.0%) |
| Total (Overall) | 361 (49.9%) | 362 (50.1%) |
Sales and Office Occupations
The most common Sales and Office occupations in Bonner West Riverside are Sales & Related (106 | 14.7%), and Office & Administration (89 | 12.3%).
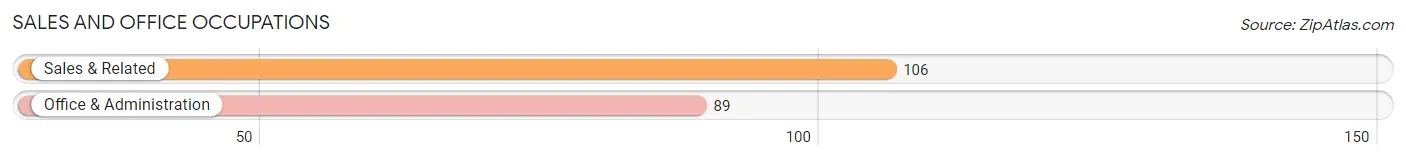
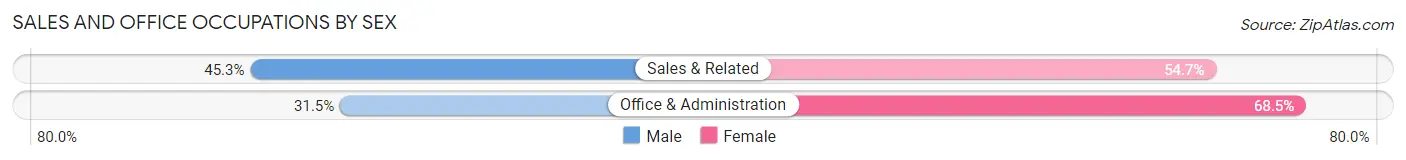
Sales and Office Occupations by Sex
| Occupation | Male | Female |
| Sales & Related | 48 (45.3%) | 58 (54.7%) |
| Office & Administration | 28 (31.5%) | 61 (68.5%) |
| Total (Category) | 76 (39.0%) | 119 (61.0%) |
| Total (Overall) | 361 (49.9%) | 362 (50.1%) |
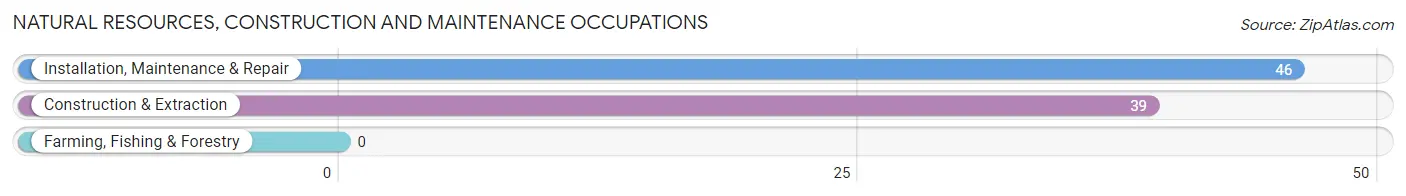
Natural Resources, Construction and Maintenance Occupations
The most common Natural Resources, Construction and Maintenance occupations in Bonner West Riverside are Installation, Maintenance & Repair (46 | 6.4%), and Construction & Extraction (39 | 5.4%).
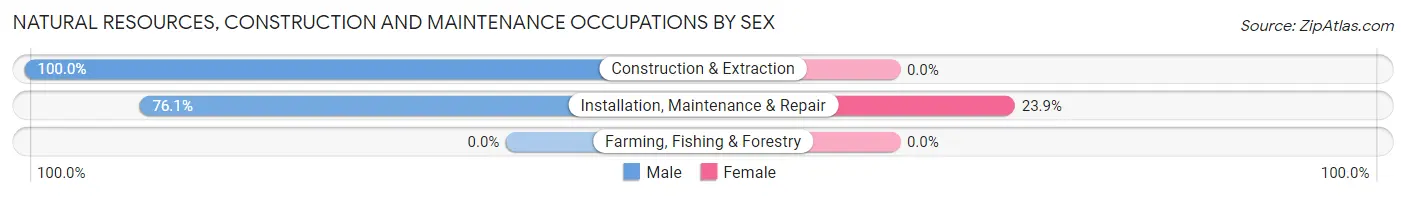
Natural Resources, Construction and Maintenance Occupations by Sex
| Occupation | Male | Female |
| Farming, Fishing & Forestry | 0 (0.0%) | 0 (0.0%) |
| Construction & Extraction | 39 (100.0%) | 0 (0.0%) |
| Installation, Maintenance & Repair | 35 (76.1%) | 11 (23.9%) |
| Total (Category) | 74 (87.1%) | 11 (12.9%) |
| Total (Overall) | 361 (49.9%) | 362 (50.1%) |
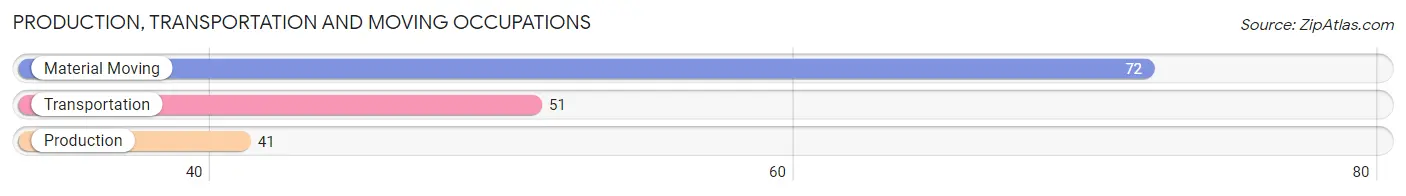
Production, Transportation and Moving Occupations
The most common Production, Transportation and Moving occupations in Bonner West Riverside are Material Moving (72 | 10.0%), Transportation (51 | 7.0%), and Production (41 | 5.7%).
Production, Transportation and Moving Occupations by Sex
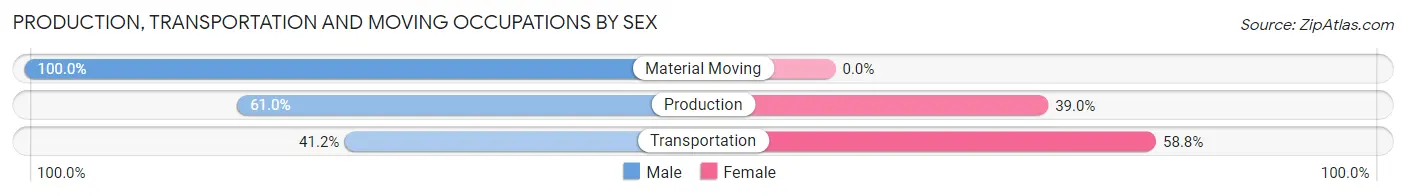
| Occupation | Male | Female |
| Production | 25 (61.0%) | 16 (39.0%) |
| Transportation | 21 (41.2%) | 30 (58.8%) |
| Material Moving | 72 (100.0%) | 0 (0.0%) |
| Total (Category) | 118 (72.0%) | 46 (28.1%) |
| Total (Overall) | 361 (49.9%) | 362 (50.1%) |
Employment Industries by Sex in Bonner West Riverside
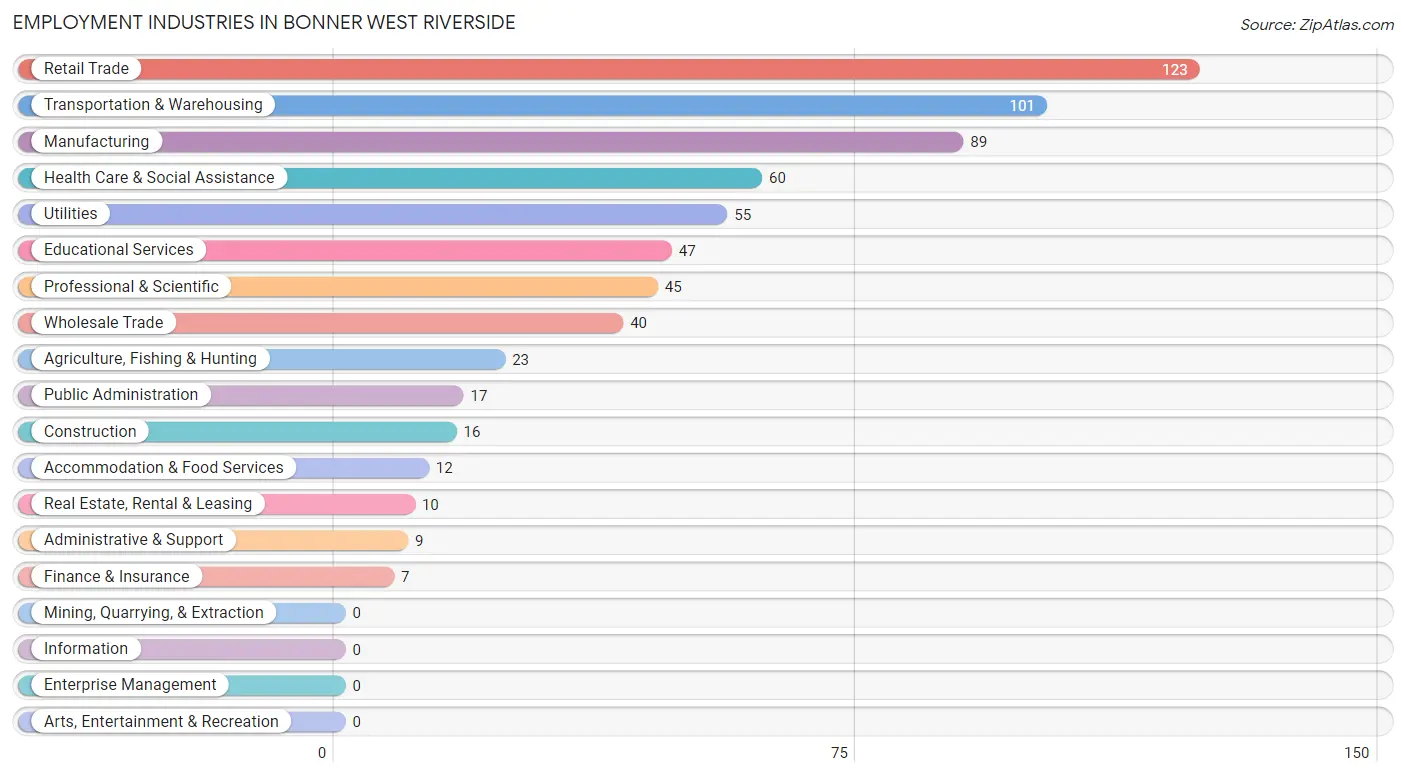
Employment Industries in Bonner West Riverside
The major employment industries in Bonner West Riverside include Retail Trade (123 | 17.0%), Transportation & Warehousing (101 | 14.0%), Manufacturing (89 | 12.3%), Health Care & Social Assistance (60 | 8.3%), and Utilities (55 | 7.6%).
Employment Industries by Sex in Bonner West Riverside
The Bonner West Riverside industries that see more men than women are Agriculture, Fishing & Hunting (100.0%), Construction (100.0%), and Utilities (100.0%), whereas the industries that tend to have a higher number of women are Educational Services (100.0%), Health Care & Social Assistance (100.0%), and Accommodation & Food Services (100.0%).

| Industry | Male | Female |
| Agriculture, Fishing & Hunting | 23 (100.0%) | 0 (0.0%) |
| Mining, Quarrying, & Extraction | 0 (0.0%) | 0 (0.0%) |
| Construction | 16 (100.0%) | 0 (0.0%) |
| Manufacturing | 45 (50.6%) | 44 (49.4%) |
| Wholesale Trade | 31 (77.5%) | 9 (22.5%) |
| Retail Trade | 44 (35.8%) | 79 (64.2%) |
| Transportation & Warehousing | 45 (44.6%) | 56 (55.4%) |
| Utilities | 55 (100.0%) | 0 (0.0%) |
| Information | 0 (0.0%) | 0 (0.0%) |
| Finance & Insurance | 7 (100.0%) | 0 (0.0%) |
| Real Estate, Rental & Leasing | 10 (100.0%) | 0 (0.0%) |
| Professional & Scientific | 19 (42.2%) | 26 (57.8%) |
| Enterprise Management | 0 (0.0%) | 0 (0.0%) |
| Administrative & Support | 7 (77.8%) | 2 (22.2%) |
| Educational Services | 0 (0.0%) | 47 (100.0%) |
| Health Care & Social Assistance | 0 (0.0%) | 60 (100.0%) |
| Arts, Entertainment & Recreation | 0 (0.0%) | 0 (0.0%) |
| Accommodation & Food Services | 0 (0.0%) | 12 (100.0%) |
| Public Administration | 0 (0.0%) | 17 (100.0%) |
| Total | 361 (49.9%) | 362 (50.1%) |
Education in Bonner West Riverside
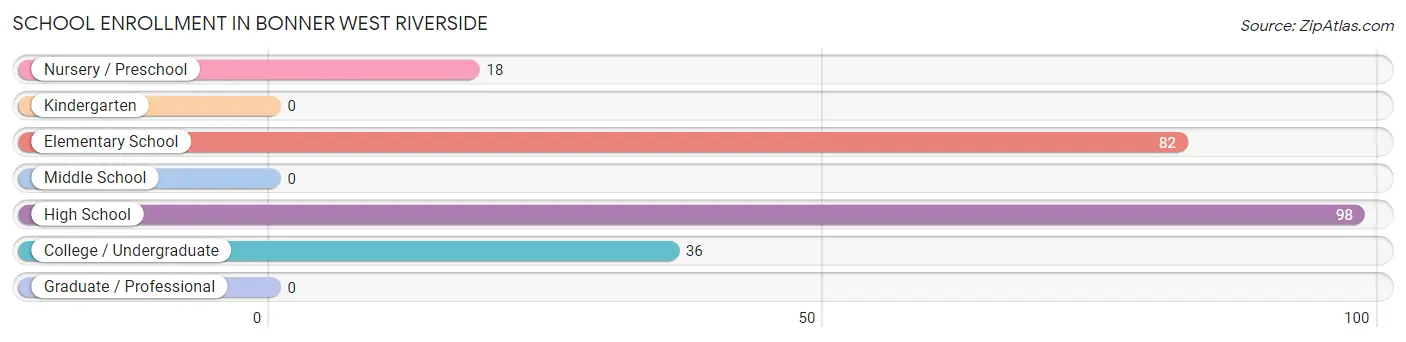
School Enrollment in Bonner West Riverside
The most common levels of schooling among the 234 students in Bonner West Riverside are high school (98 | 41.9%), elementary school (82 | 35.0%), and college / undergraduate (36 | 15.4%).
| School Level | # Students | % Students |
| Nursery / Preschool | 18 | 7.7% |
| Kindergarten | 0 | 0.0% |
| Elementary School | 82 | 35.0% |
| Middle School | 0 | 0.0% |
| High School | 98 | 41.9% |
| College / Undergraduate | 36 | 15.4% |
| Graduate / Professional | 0 | 0.0% |
| Total | 234 | 100.0% |
School Enrollment by Age by Funding Source in Bonner West Riverside
Out of a total of 234 students who are enrolled in schools in Bonner West Riverside, 11 (4.7%) attend a private institution, while the remaining 223 (95.3%) are enrolled in public schools. The age group of 10 to 14 year olds has the highest likelihood of being enrolled in private schools, with 11 (20.4% in the age bracket) enrolled. Conversely, the age group of 3 to 4 year olds has the lowest likelihood of being enrolled in a private school, with 7 (100.0% in the age bracket) attending a public institution.
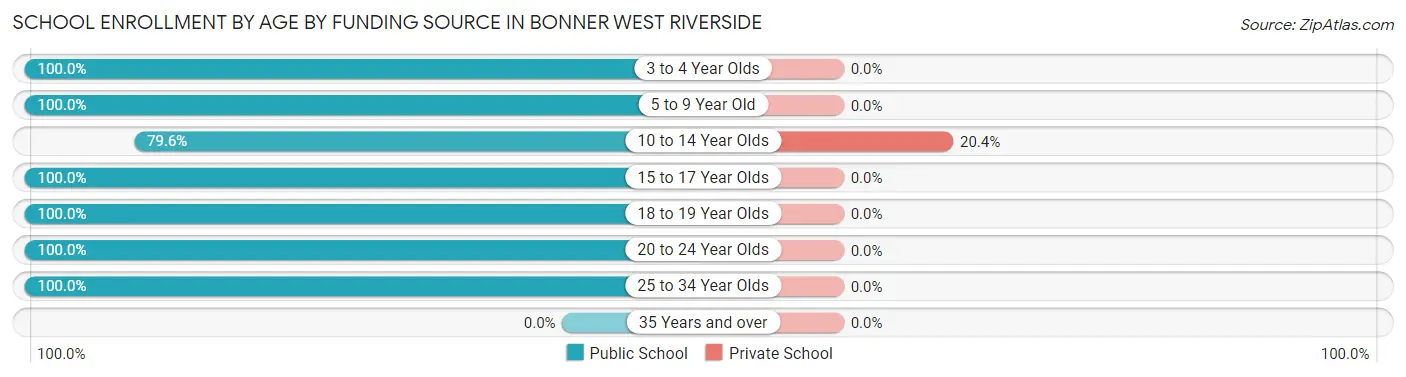
| Age Bracket | Public School | Private School |
| 3 to 4 Year Olds | 7 (100.0%) | 0 (0.0%) |
| 5 to 9 Year Old | 82 (100.0%) | 0 (0.0%) |
| 10 to 14 Year Olds | 43 (79.6%) | 11 (20.4%) |
| 15 to 17 Year Olds | 38 (100.0%) | 0 (0.0%) |
| 18 to 19 Year Olds | 17 (100.0%) | 0 (0.0%) |
| 20 to 24 Year Olds | 25 (100.0%) | 0 (0.0%) |
| 25 to 34 Year Olds | 11 (100.0%) | 0 (0.0%) |
| 35 Years and over | 0 (0.0%) | 0 (0.0%) |
| Total | 223 (95.3%) | 11 (4.7%) |
Educational Attainment by Field of Study in Bonner West Riverside
Business (70 | 34.5%), education (38 | 18.7%), communications (33 | 16.3%), physical & health sciences (29 | 14.3%), and literature & languages (17 | 8.4%) are the most common fields of study among 203 individuals in Bonner West Riverside who have obtained a bachelor's degree or higher.
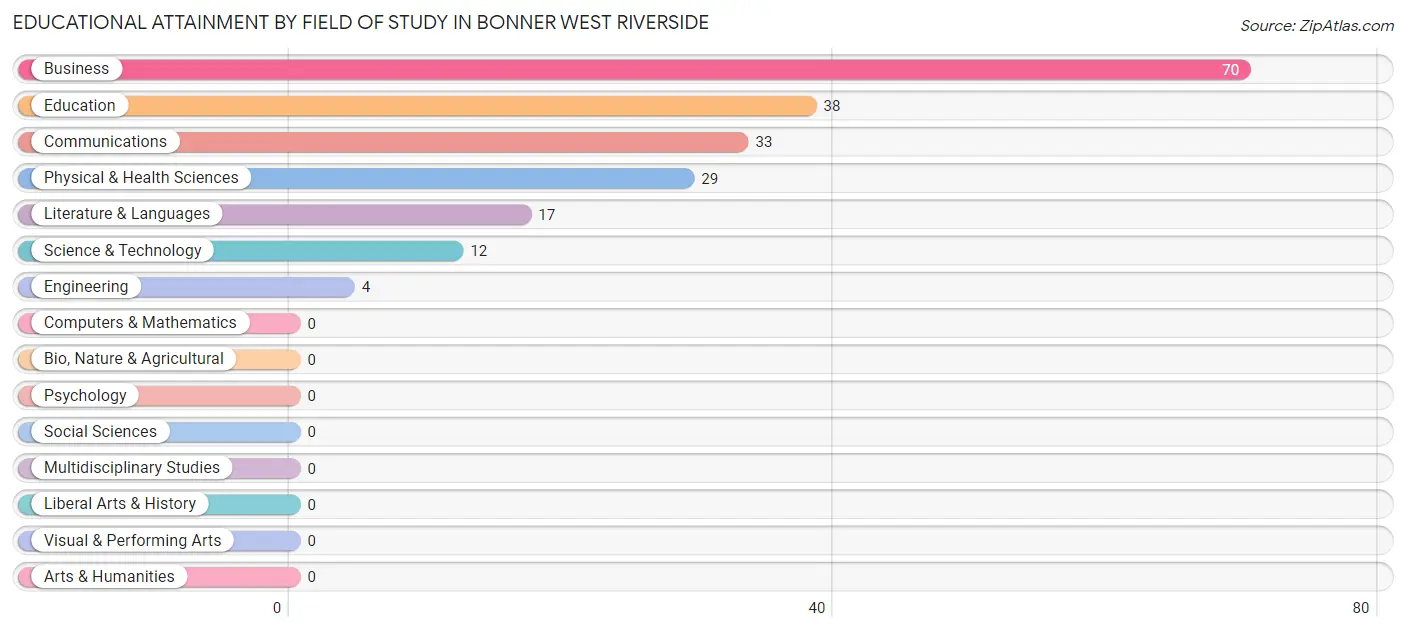
| Field of Study | # Graduates | % Graduates |
| Computers & Mathematics | 0 | 0.0% |
| Bio, Nature & Agricultural | 0 | 0.0% |
| Physical & Health Sciences | 29 | 14.3% |
| Psychology | 0 | 0.0% |
| Social Sciences | 0 | 0.0% |
| Engineering | 4 | 2.0% |
| Multidisciplinary Studies | 0 | 0.0% |
| Science & Technology | 12 | 5.9% |
| Business | 70 | 34.5% |
| Education | 38 | 18.7% |
| Literature & Languages | 17 | 8.4% |
| Liberal Arts & History | 0 | 0.0% |
| Visual & Performing Arts | 0 | 0.0% |
| Communications | 33 | 16.3% |
| Arts & Humanities | 0 | 0.0% |
| Total | 203 | 100.0% |
Transportation & Commute in Bonner West Riverside
Vehicle Availability by Sex in Bonner West Riverside
The most prevalent vehicle ownership categories in Bonner West Riverside are males with 3 vehicles (204, accounting for 55.1%) and females with 3 vehicles (108, making up 56.4%).
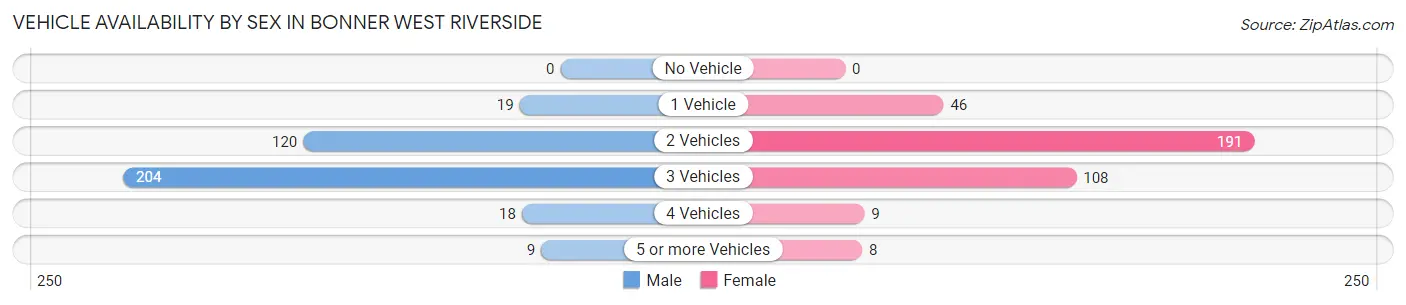
| Vehicles Available | Male | Female |
| No Vehicle | 0 (0.0%) | 0 (0.0%) |
| 1 Vehicle | 19 (5.1%) | 46 (12.7%) |
| 2 Vehicles | 120 (32.4%) | 191 (52.8%) |
| 3 Vehicles | 204 (55.1%) | 108 (29.8%) |
| 4 Vehicles | 18 (4.9%) | 9 (2.5%) |
| 5 or more Vehicles | 9 (2.4%) | 8 (2.2%) |
| Total | 370 (100.0%) | 362 (100.0%) |
Commute Time in Bonner West Riverside
The most frequently occuring commute durations in Bonner West Riverside are 15 to 19 minutes (317 commuters, 47.8%), 5 to 9 minutes (91 commuters, 13.7%), and 10 to 14 minutes (73 commuters, 11.0%).
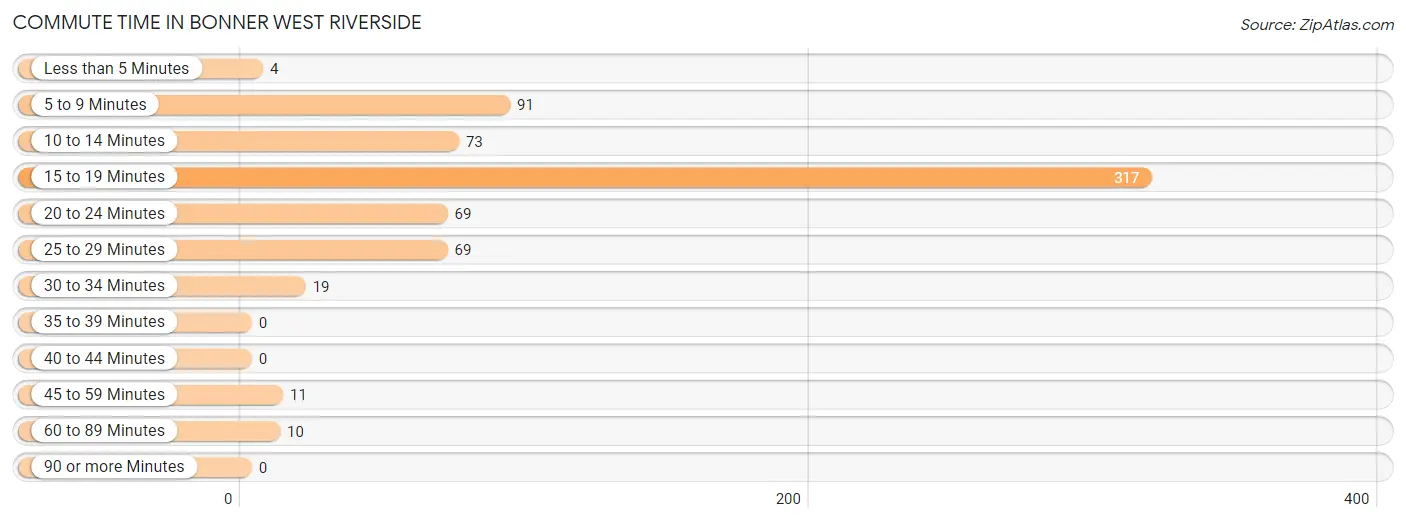
| Commute Time | # Commuters | % Commuters |
| Less than 5 Minutes | 4 | 0.6% |
| 5 to 9 Minutes | 91 | 13.7% |
| 10 to 14 Minutes | 73 | 11.0% |
| 15 to 19 Minutes | 317 | 47.8% |
| 20 to 24 Minutes | 69 | 10.4% |
| 25 to 29 Minutes | 69 | 10.4% |
| 30 to 34 Minutes | 19 | 2.9% |
| 35 to 39 Minutes | 0 | 0.0% |
| 40 to 44 Minutes | 0 | 0.0% |
| 45 to 59 Minutes | 11 | 1.7% |
| 60 to 89 Minutes | 10 | 1.5% |
| 90 or more Minutes | 0 | 0.0% |
Commute Time by Sex in Bonner West Riverside
The most common commute times in Bonner West Riverside are 15 to 19 minutes (160 commuters, 45.6%) for males and 15 to 19 minutes (157 commuters, 50.3%) for females.
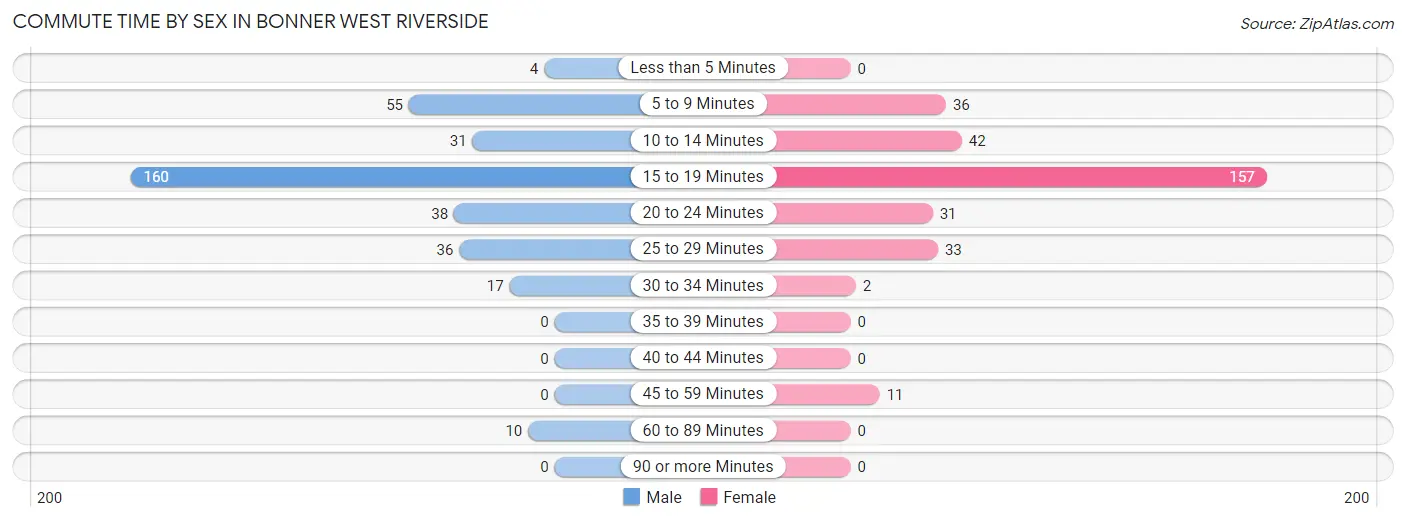
| Commute Time | Male | Female |
| Less than 5 Minutes | 4 (1.1%) | 0 (0.0%) |
| 5 to 9 Minutes | 55 (15.7%) | 36 (11.5%) |
| 10 to 14 Minutes | 31 (8.8%) | 42 (13.5%) |
| 15 to 19 Minutes | 160 (45.6%) | 157 (50.3%) |
| 20 to 24 Minutes | 38 (10.8%) | 31 (9.9%) |
| 25 to 29 Minutes | 36 (10.3%) | 33 (10.6%) |
| 30 to 34 Minutes | 17 (4.8%) | 2 (0.6%) |
| 35 to 39 Minutes | 0 (0.0%) | 0 (0.0%) |
| 40 to 44 Minutes | 0 (0.0%) | 0 (0.0%) |
| 45 to 59 Minutes | 0 (0.0%) | 11 (3.5%) |
| 60 to 89 Minutes | 10 (2.9%) | 0 (0.0%) |
| 90 or more Minutes | 0 (0.0%) | 0 (0.0%) |
Time of Departure to Work by Sex in Bonner West Riverside
The most frequent times of departure to work in Bonner West Riverside are 7:00 AM to 7:29 AM (110, 31.3%) for males and 7:00 AM to 7:29 AM (120, 38.5%) for females.
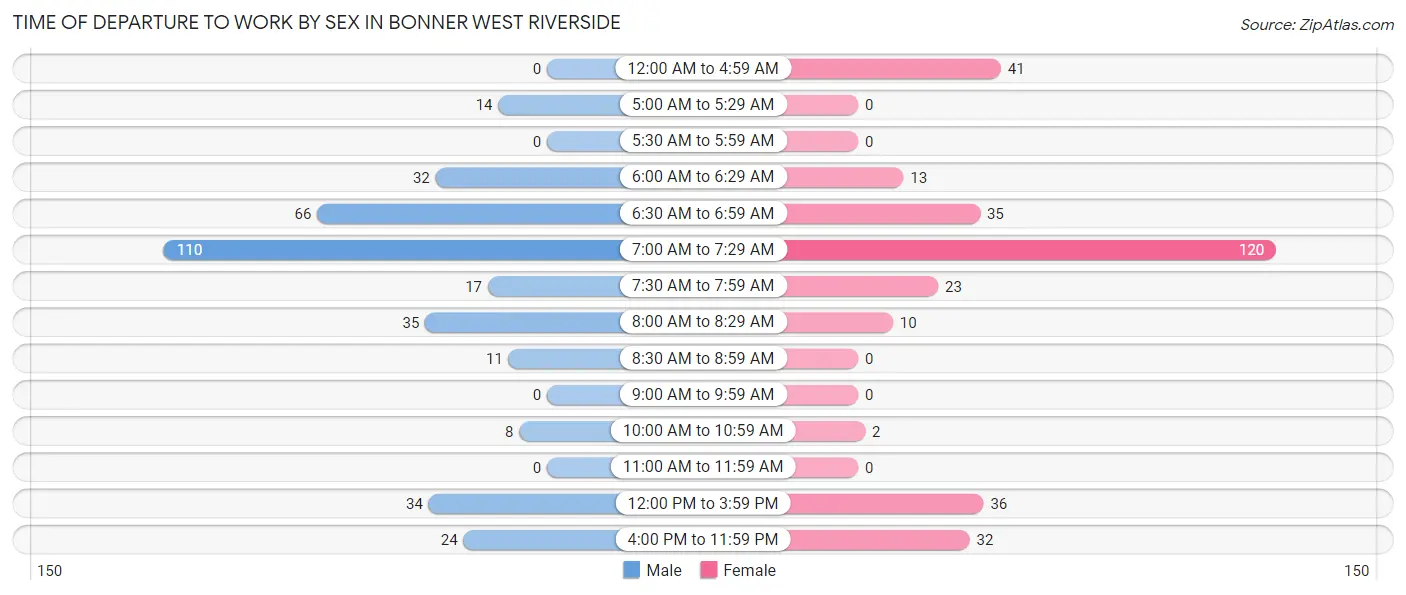
| Time of Departure | Male | Female |
| 12:00 AM to 4:59 AM | 0 (0.0%) | 41 (13.1%) |
| 5:00 AM to 5:29 AM | 14 (4.0%) | 0 (0.0%) |
| 5:30 AM to 5:59 AM | 0 (0.0%) | 0 (0.0%) |
| 6:00 AM to 6:29 AM | 32 (9.1%) | 13 (4.2%) |
| 6:30 AM to 6:59 AM | 66 (18.8%) | 35 (11.2%) |
| 7:00 AM to 7:29 AM | 110 (31.3%) | 120 (38.5%) |
| 7:30 AM to 7:59 AM | 17 (4.8%) | 23 (7.4%) |
| 8:00 AM to 8:29 AM | 35 (10.0%) | 10 (3.2%) |
| 8:30 AM to 8:59 AM | 11 (3.1%) | 0 (0.0%) |
| 9:00 AM to 9:59 AM | 0 (0.0%) | 0 (0.0%) |
| 10:00 AM to 10:59 AM | 8 (2.3%) | 2 (0.6%) |
| 11:00 AM to 11:59 AM | 0 (0.0%) | 0 (0.0%) |
| 12:00 PM to 3:59 PM | 34 (9.7%) | 36 (11.5%) |
| 4:00 PM to 11:59 PM | 24 (6.8%) | 32 (10.3%) |
| Total | 351 (100.0%) | 312 (100.0%) |
Housing Occupancy in Bonner West Riverside
Occupancy by Ownership in Bonner West Riverside
Of the total 564 dwellings in Bonner West Riverside, owner-occupied units account for 373 (66.1%), while renter-occupied units make up 191 (33.9%).
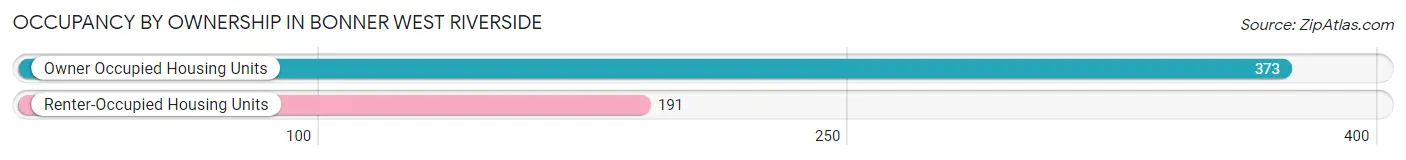
| Occupancy | # Housing Units | % Housing Units |
| Owner Occupied Housing Units | 373 | 66.1% |
| Renter-Occupied Housing Units | 191 | 33.9% |
| Total Occupied Housing Units | 564 | 100.0% |
Occupancy by Household Size in Bonner West Riverside
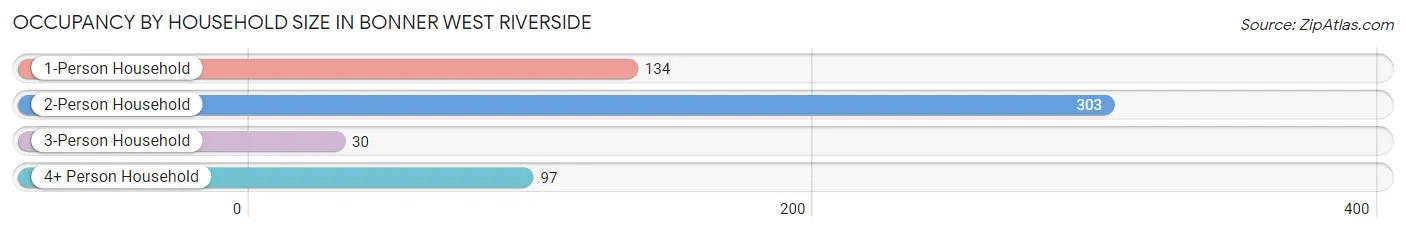
| Household Size | # Housing Units | % Housing Units |
| 1-Person Household | 134 | 23.8% |
| 2-Person Household | 303 | 53.7% |
| 3-Person Household | 30 | 5.3% |
| 4+ Person Household | 97 | 17.2% |
| Total Housing Units | 564 | 100.0% |
Occupancy by Ownership by Household Size in Bonner West Riverside
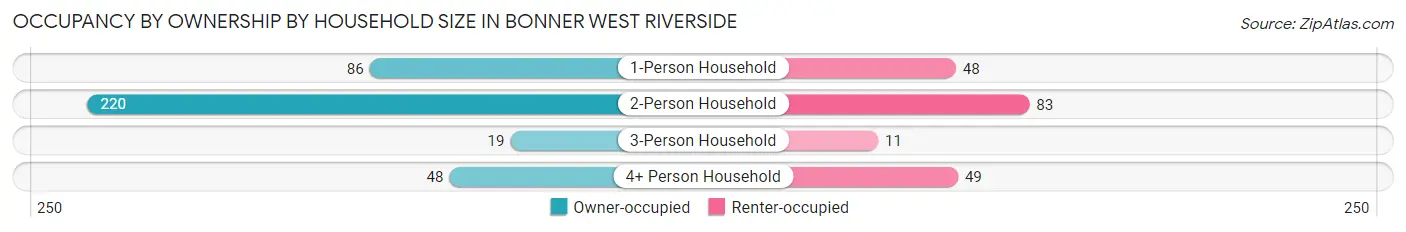
| Household Size | Owner-occupied | Renter-occupied |
| 1-Person Household | 86 (64.2%) | 48 (35.8%) |
| 2-Person Household | 220 (72.6%) | 83 (27.4%) |
| 3-Person Household | 19 (63.3%) | 11 (36.7%) |
| 4+ Person Household | 48 (49.5%) | 49 (50.5%) |
| Total Housing Units | 373 (66.1%) | 191 (33.9%) |
Occupancy by Educational Attainment in Bonner West Riverside
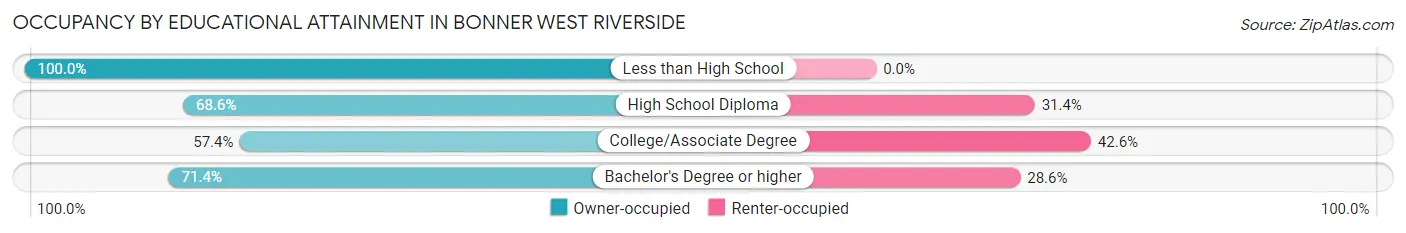
| Household Size | Owner-occupied | Renter-occupied |
| Less than High School | 12 (100.0%) | 0 (0.0%) |
| High School Diploma | 120 (68.6%) | 55 (31.4%) |
| College/Associate Degree | 116 (57.4%) | 86 (42.6%) |
| Bachelor's Degree or higher | 125 (71.4%) | 50 (28.6%) |
Occupancy by Age of Householder in Bonner West Riverside
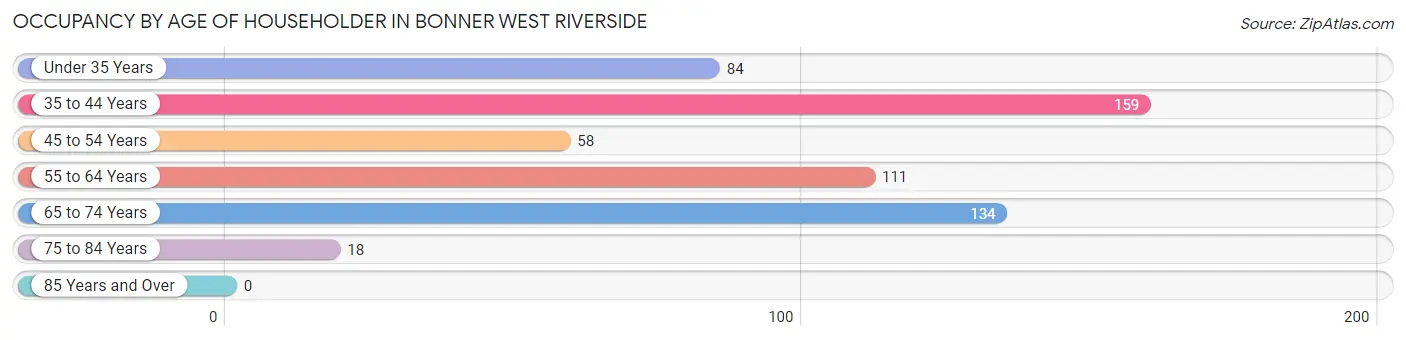
| Age Bracket | # Households | % Households |
| Under 35 Years | 84 | 14.9% |
| 35 to 44 Years | 159 | 28.2% |
| 45 to 54 Years | 58 | 10.3% |
| 55 to 64 Years | 111 | 19.7% |
| 65 to 74 Years | 134 | 23.8% |
| 75 to 84 Years | 18 | 3.2% |
| 85 Years and Over | 0 | 0.0% |
| Total | 564 | 100.0% |
Housing Finances in Bonner West Riverside
Median Income by Occupancy in Bonner West Riverside
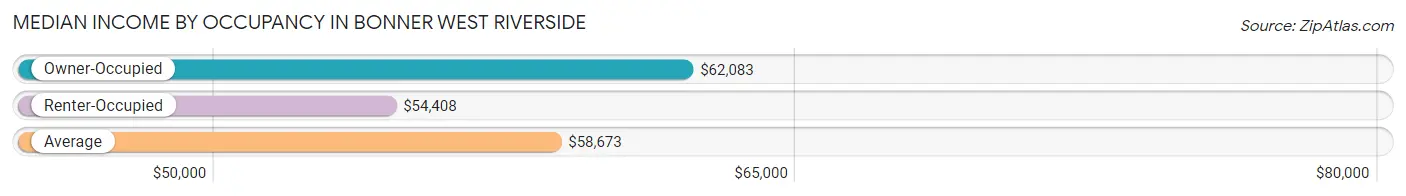
| Occupancy Type | # Households | Median Income |
| Owner-Occupied | 373 (66.1%) | $62,083 |
| Renter-Occupied | 191 (33.9%) | $54,408 |
| Average | 564 (100.0%) | $58,673 |
Occupancy by Householder Income Bracket in Bonner West Riverside
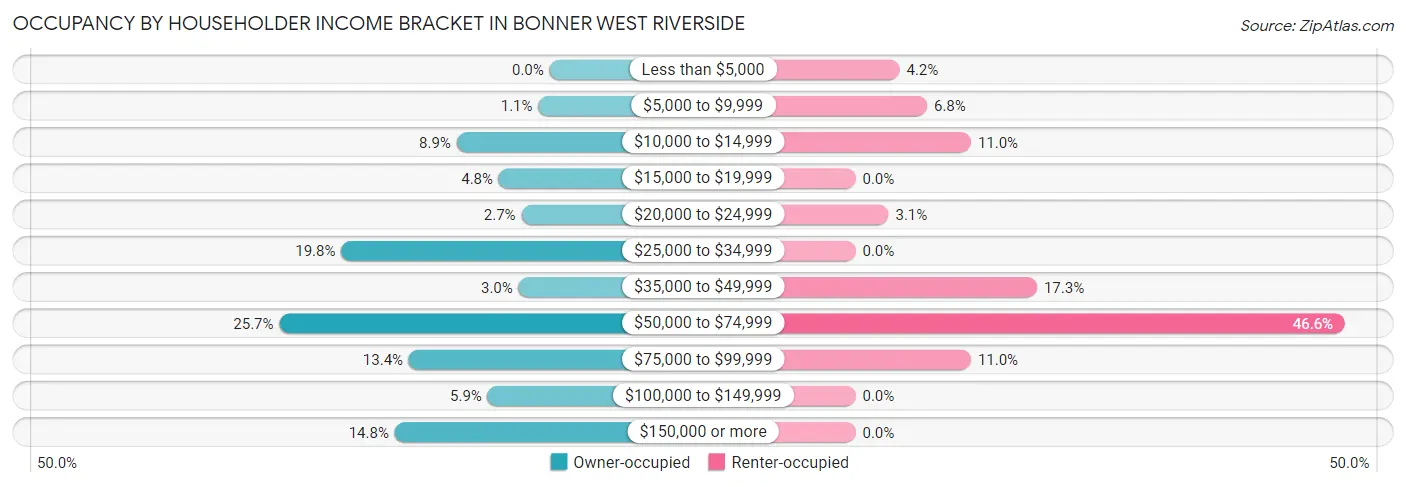
| Income Bracket | Owner-occupied | Renter-occupied |
| Less than $5,000 | 0 (0.0%) | 8 (4.2%) |
| $5,000 to $9,999 | 4 (1.1%) | 13 (6.8%) |
| $10,000 to $14,999 | 33 (8.8%) | 21 (11.0%) |
| $15,000 to $19,999 | 18 (4.8%) | 0 (0.0%) |
| $20,000 to $24,999 | 10 (2.7%) | 6 (3.1%) |
| $25,000 to $34,999 | 74 (19.8%) | 0 (0.0%) |
| $35,000 to $49,999 | 11 (2.9%) | 33 (17.3%) |
| $50,000 to $74,999 | 96 (25.7%) | 89 (46.6%) |
| $75,000 to $99,999 | 50 (13.4%) | 21 (11.0%) |
| $100,000 to $149,999 | 22 (5.9%) | 0 (0.0%) |
| $150,000 or more | 55 (14.7%) | 0 (0.0%) |
| Total | 373 (100.0%) | 191 (100.0%) |
Monthly Housing Cost Tiers in Bonner West Riverside
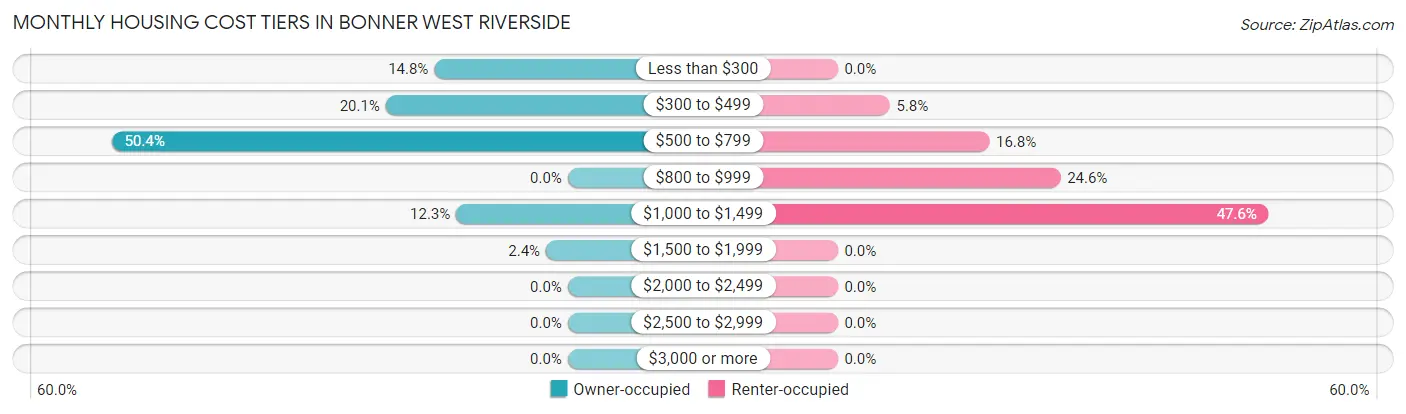
| Monthly Cost | Owner-occupied | Renter-occupied |
| Less than $300 | 55 (14.7%) | 0 (0.0%) |
| $300 to $499 | 75 (20.1%) | 11 (5.8%) |
| $500 to $799 | 188 (50.4%) | 32 (16.8%) |
| $800 to $999 | 0 (0.0%) | 47 (24.6%) |
| $1,000 to $1,499 | 46 (12.3%) | 91 (47.6%) |
| $1,500 to $1,999 | 9 (2.4%) | 0 (0.0%) |
| $2,000 to $2,499 | 0 (0.0%) | 0 (0.0%) |
| $2,500 to $2,999 | 0 (0.0%) | 0 (0.0%) |
| $3,000 or more | 0 (0.0%) | 0 (0.0%) |
| Total | 373 (100.0%) | 191 (100.0%) |
Physical Housing Characteristics in Bonner West Riverside
Housing Structures in Bonner West Riverside
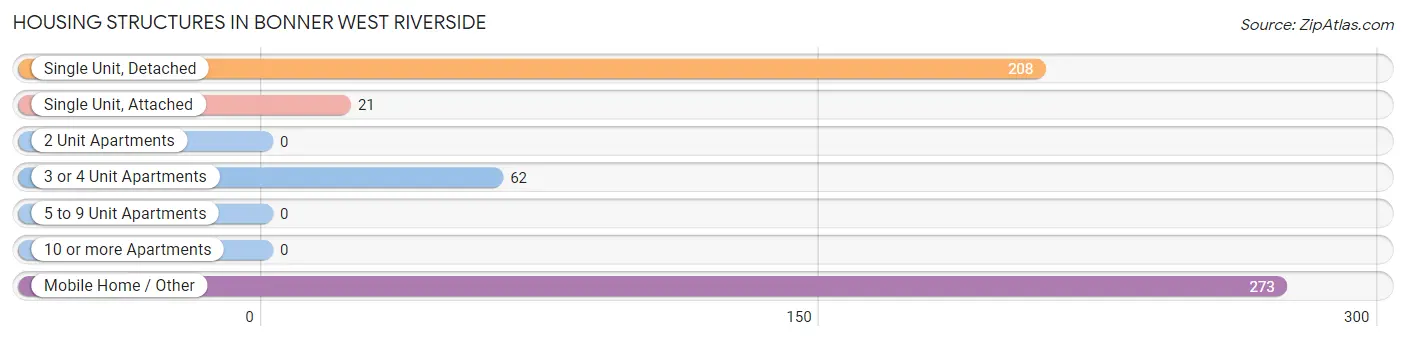
| Structure Type | # Housing Units | % Housing Units |
| Single Unit, Detached | 208 | 36.9% |
| Single Unit, Attached | 21 | 3.7% |
| 2 Unit Apartments | 0 | 0.0% |
| 3 or 4 Unit Apartments | 62 | 11.0% |
| 5 to 9 Unit Apartments | 0 | 0.0% |
| 10 or more Apartments | 0 | 0.0% |
| Mobile Home / Other | 273 | 48.4% |
| Total | 564 | 100.0% |
Housing Structures by Occupancy in Bonner West Riverside
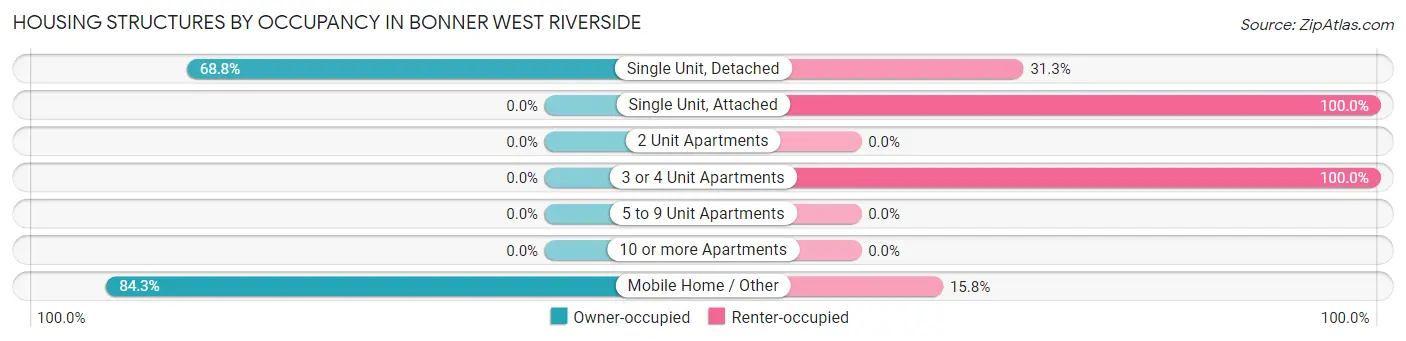
| Structure Type | Owner-occupied | Renter-occupied |
| Single Unit, Detached | 143 (68.8%) | 65 (31.2%) |
| Single Unit, Attached | 0 (0.0%) | 21 (100.0%) |
| 2 Unit Apartments | 0 (0.0%) | 0 (0.0%) |
| 3 or 4 Unit Apartments | 0 (0.0%) | 62 (100.0%) |
| 5 to 9 Unit Apartments | 0 (0.0%) | 0 (0.0%) |
| 10 or more Apartments | 0 (0.0%) | 0 (0.0%) |
| Mobile Home / Other | 230 (84.3%) | 43 (15.8%) |
| Total | 373 (66.1%) | 191 (33.9%) |
Housing Structures by Number of Rooms in Bonner West Riverside
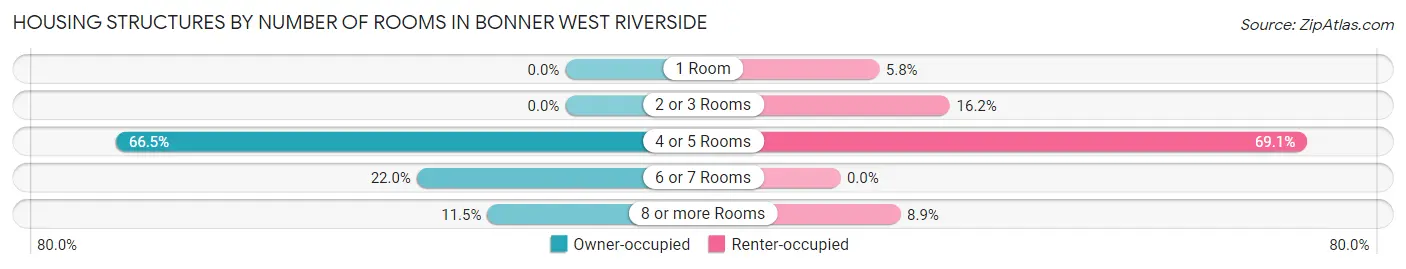
| Number of Rooms | Owner-occupied | Renter-occupied |
| 1 Room | 0 (0.0%) | 11 (5.8%) |
| 2 or 3 Rooms | 0 (0.0%) | 31 (16.2%) |
| 4 or 5 Rooms | 248 (66.5%) | 132 (69.1%) |
| 6 or 7 Rooms | 82 (22.0%) | 0 (0.0%) |
| 8 or more Rooms | 43 (11.5%) | 17 (8.9%) |
| Total | 373 (100.0%) | 191 (100.0%) |
Housing Structure by Heating Type in Bonner West Riverside
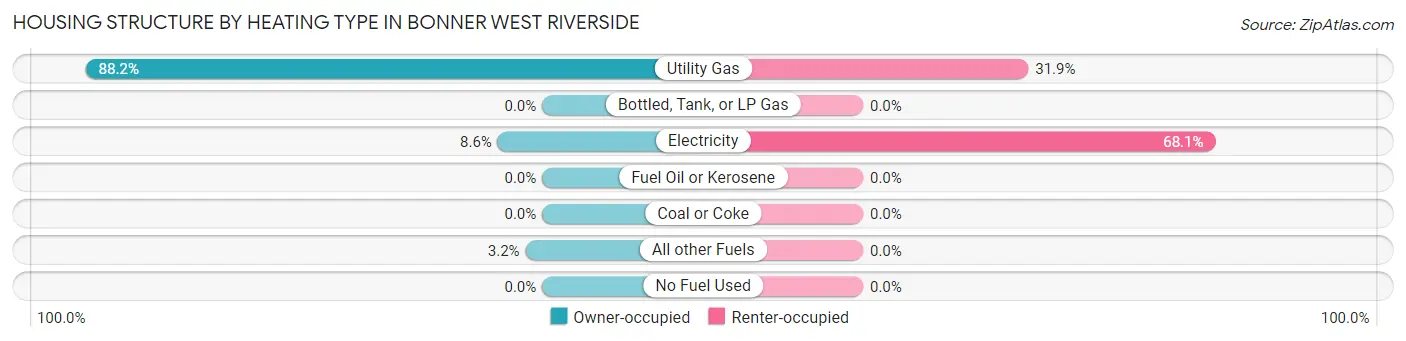
| Heating Type | Owner-occupied | Renter-occupied |
| Utility Gas | 329 (88.2%) | 61 (31.9%) |
| Bottled, Tank, or LP Gas | 0 (0.0%) | 0 (0.0%) |
| Electricity | 32 (8.6%) | 130 (68.1%) |
| Fuel Oil or Kerosene | 0 (0.0%) | 0 (0.0%) |
| Coal or Coke | 0 (0.0%) | 0 (0.0%) |
| All other Fuels | 12 (3.2%) | 0 (0.0%) |
| No Fuel Used | 0 (0.0%) | 0 (0.0%) |
| Total | 373 (100.0%) | 191 (100.0%) |
Household Vehicle Usage in Bonner West Riverside
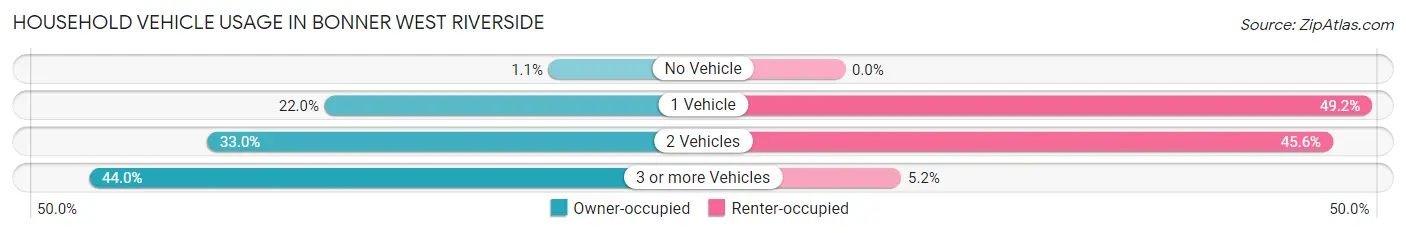
| Vehicles per Household | Owner-occupied | Renter-occupied |
| No Vehicle | 4 (1.1%) | 0 (0.0%) |
| 1 Vehicle | 82 (22.0%) | 94 (49.2%) |
| 2 Vehicles | 123 (33.0%) | 87 (45.6%) |
| 3 or more Vehicles | 164 (44.0%) | 10 (5.2%) |
| Total | 373 (100.0%) | 191 (100.0%) |
Real Estate & Mortgages in Bonner West Riverside
Real Estate and Mortgage Overview in Bonner West Riverside
| Characteristic | Without Mortgage | With Mortgage |
| Housing Units | 318 | 55 |
| Median Property Value | $47,600 | $425,700 |
| Median Household Income | $60,758 | $0 |
| Monthly Housing Costs | $524 | $0 |
| Real Estate Taxes | $487 | $0 |
Property Value by Mortgage Status in Bonner West Riverside
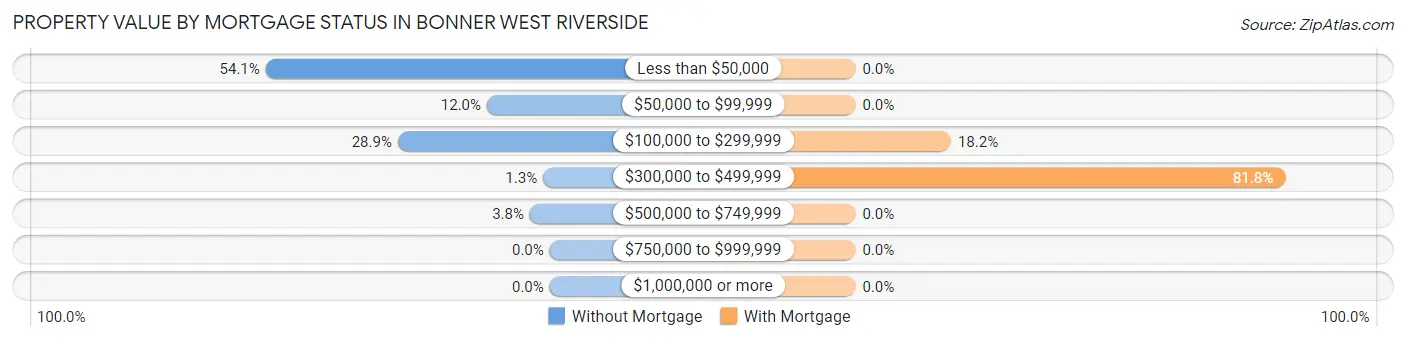
| Property Value | Without Mortgage | With Mortgage |
| Less than $50,000 | 172 (54.1%) | 0 (0.0%) |
| $50,000 to $99,999 | 38 (11.9%) | 0 (0.0%) |
| $100,000 to $299,999 | 92 (28.9%) | 10 (18.2%) |
| $300,000 to $499,999 | 4 (1.3%) | 45 (81.8%) |
| $500,000 to $749,999 | 12 (3.8%) | 0 (0.0%) |
| $750,000 to $999,999 | 0 (0.0%) | 0 (0.0%) |
| $1,000,000 or more | 0 (0.0%) | 0 (0.0%) |
| Total | 318 (100.0%) | 55 (100.0%) |
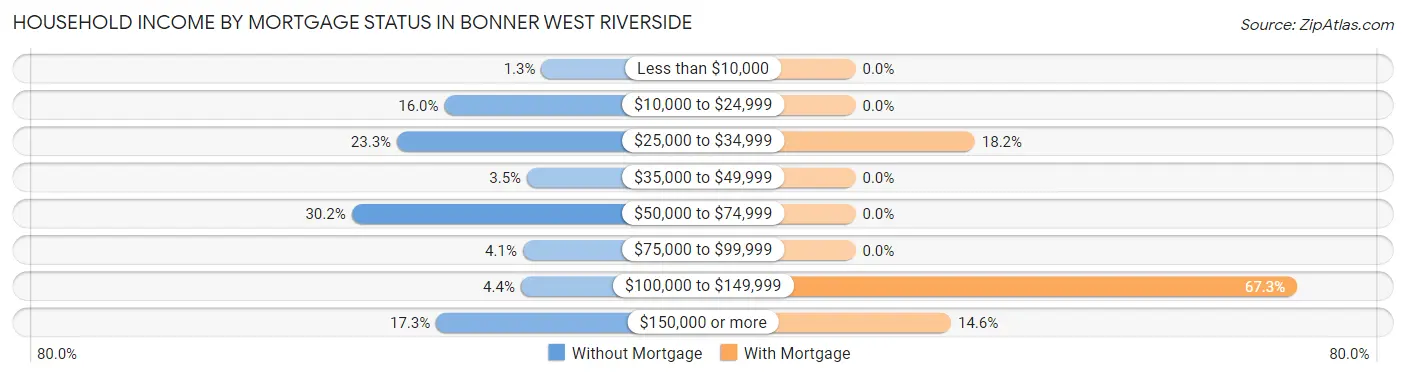
Household Income by Mortgage Status in Bonner West Riverside
| Household Income | Without Mortgage | With Mortgage |
| Less than $10,000 | 4 (1.3%) | 0 (0.0%) |
| $10,000 to $24,999 | 51 (16.0%) | 0 (0.0%) |
| $25,000 to $34,999 | 74 (23.3%) | 10 (18.2%) |
| $35,000 to $49,999 | 11 (3.5%) | 0 (0.0%) |
| $50,000 to $74,999 | 96 (30.2%) | 0 (0.0%) |
| $75,000 to $99,999 | 13 (4.1%) | 0 (0.0%) |
| $100,000 to $149,999 | 14 (4.4%) | 37 (67.3%) |
| $150,000 or more | 55 (17.3%) | 8 (14.5%) |
| Total | 318 (100.0%) | 55 (100.0%) |
Property Value to Household Income Ratio in Bonner West Riverside
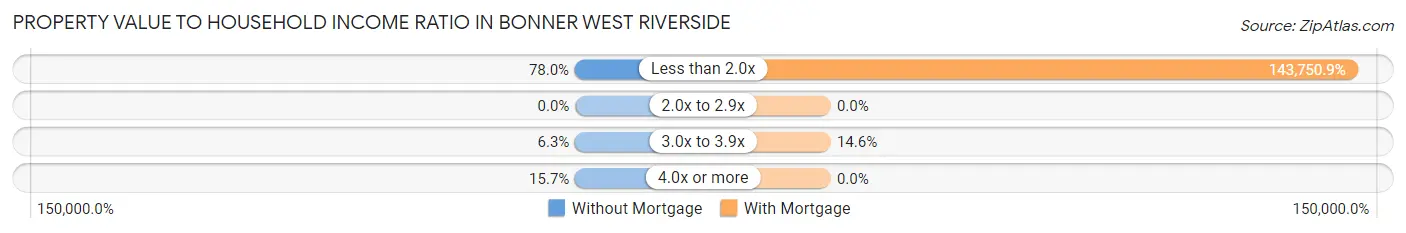
| Value-to-Income Ratio | Without Mortgage | With Mortgage |
| Less than 2.0x | 248 (78.0%) | 79,063 (143,750.9%) |
| 2.0x to 2.9x | 0 (0.0%) | 0 (0.0%) |
| 3.0x to 3.9x | 20 (6.3%) | 8 (14.5%) |
| 4.0x or more | 50 (15.7%) | 0 (0.0%) |
| Total | 318 (100.0%) | 55 (100.0%) |
Real Estate Taxes by Mortgage Status in Bonner West Riverside
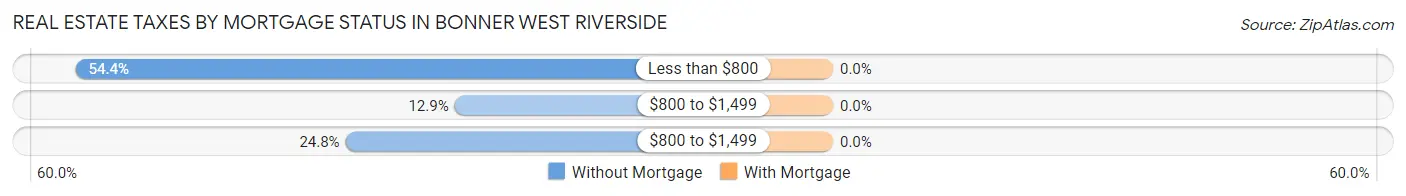
| Property Taxes | Without Mortgage | With Mortgage |
| Less than $800 | 173 (54.4%) | 0 (0.0%) |
| $800 to $1,499 | 41 (12.9%) | 0 (0.0%) |
| $800 to $1,499 | 79 (24.8%) | 0 (0.0%) |
| Total | 318 (100.0%) | 55 (100.0%) |
Health & Disability in Bonner West Riverside
Health Insurance Coverage by Age in Bonner West Riverside
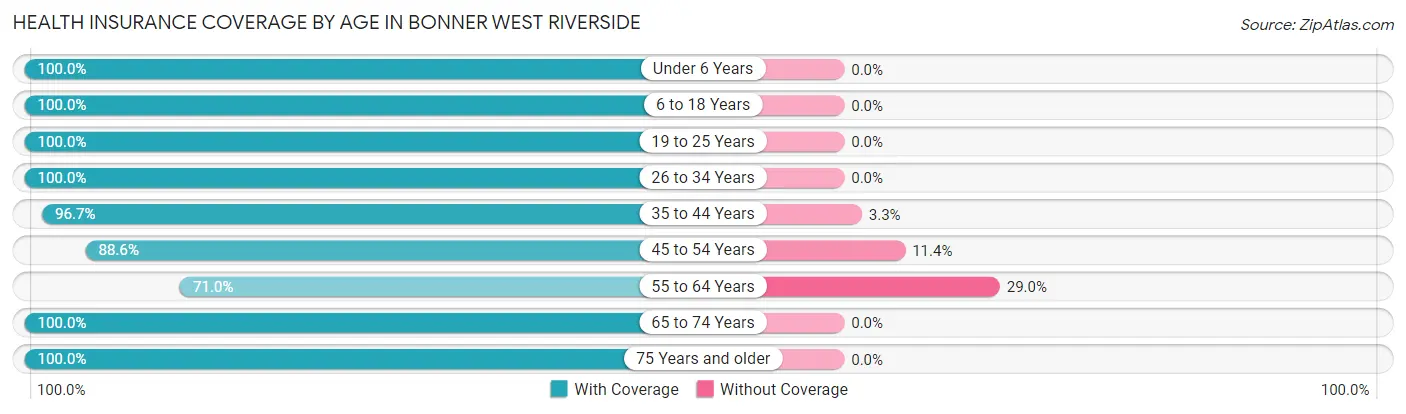
| Age Bracket | With Coverage | Without Coverage |
| Under 6 Years | 113 (100.0%) | 0 (0.0%) |
| 6 to 18 Years | 186 (100.0%) | 0 (0.0%) |
| 19 to 25 Years | 104 (100.0%) | 0 (0.0%) |
| 26 to 34 Years | 118 (100.0%) | 0 (0.0%) |
| 35 to 44 Years | 236 (96.7%) | 8 (3.3%) |
| 45 to 54 Years | 78 (88.6%) | 10 (11.4%) |
| 55 to 64 Years | 164 (71.0%) | 67 (29.0%) |
| 65 to 74 Years | 144 (100.0%) | 0 (0.0%) |
| 75 Years and older | 44 (100.0%) | 0 (0.0%) |
| Total | 1,187 (93.3%) | 85 (6.7%) |
Health Insurance Coverage by Citizenship Status in Bonner West Riverside
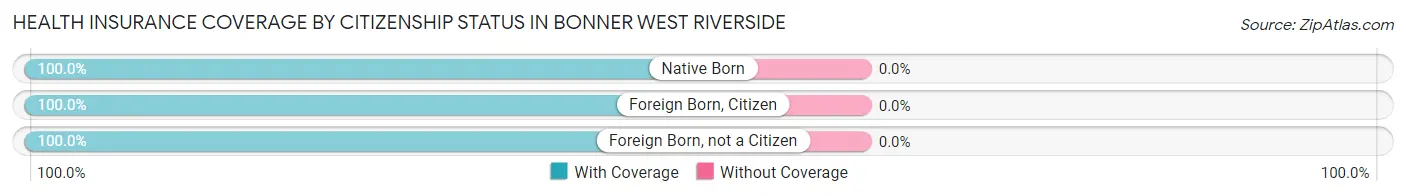
| Citizenship Status | With Coverage | Without Coverage |
| Native Born | 113 (100.0%) | 0 (0.0%) |
| Foreign Born, Citizen | 186 (100.0%) | 0 (0.0%) |
| Foreign Born, not a Citizen | 104 (100.0%) | 0 (0.0%) |
Health Insurance Coverage by Household Income in Bonner West Riverside
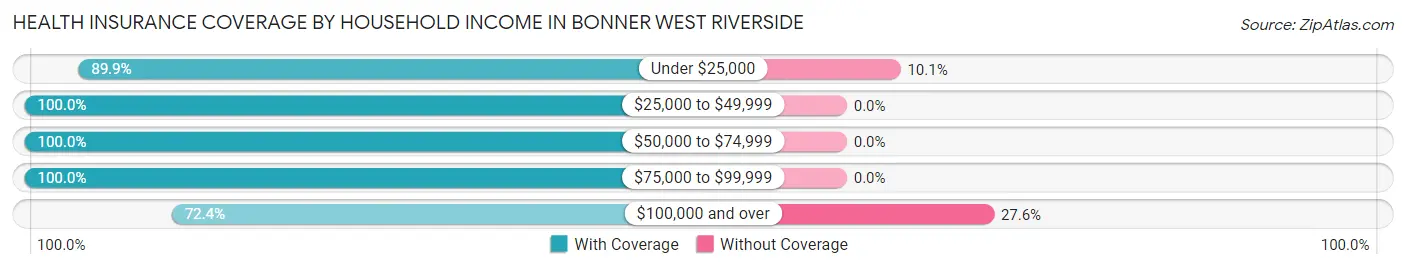
| Household Income | With Coverage | Without Coverage |
| Under $25,000 | 161 (89.9%) | 18 (10.1%) |
| $25,000 to $49,999 | 189 (100.0%) | 0 (0.0%) |
| $50,000 to $74,999 | 416 (100.0%) | 0 (0.0%) |
| $75,000 to $99,999 | 245 (100.0%) | 0 (0.0%) |
| $100,000 and over | 176 (72.4%) | 67 (27.6%) |
Public vs Private Health Insurance Coverage by Age in Bonner West Riverside
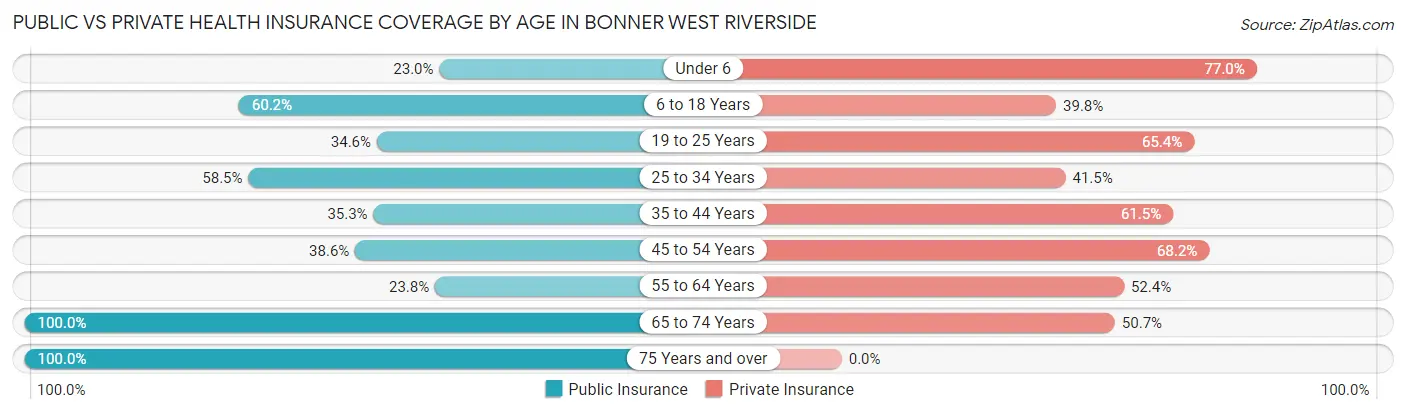
| Age Bracket | Public Insurance | Private Insurance |
| Under 6 | 26 (23.0%) | 87 (77.0%) |
| 6 to 18 Years | 112 (60.2%) | 74 (39.8%) |
| 19 to 25 Years | 36 (34.6%) | 68 (65.4%) |
| 25 to 34 Years | 69 (58.5%) | 49 (41.5%) |
| 35 to 44 Years | 86 (35.2%) | 150 (61.5%) |
| 45 to 54 Years | 34 (38.6%) | 60 (68.2%) |
| 55 to 64 Years | 55 (23.8%) | 121 (52.4%) |
| 65 to 74 Years | 144 (100.0%) | 73 (50.7%) |
| 75 Years and over | 44 (100.0%) | 0 (0.0%) |
| Total | 606 (47.6%) | 682 (53.6%) |
Disability Status by Sex by Age in Bonner West Riverside
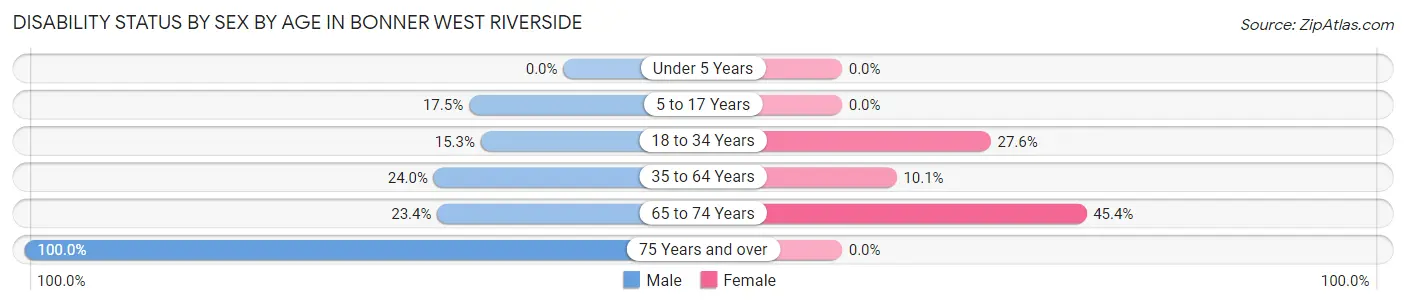
| Age Bracket | Male | Female |
| Under 5 Years | 0 (0.0%) | 0 (0.0%) |
| 5 to 17 Years | 24 (17.5%) | 0 (0.0%) |
| 18 to 34 Years | 17 (15.3%) | 37 (27.6%) |
| 35 to 64 Years | 69 (24.0%) | 28 (10.1%) |
| 65 to 74 Years | 11 (23.4%) | 44 (45.4%) |
| 75 Years and over | 28 (100.0%) | 0 (0.0%) |
Disability Class by Sex by Age in Bonner West Riverside
Disability Class: Hearing Difficulty
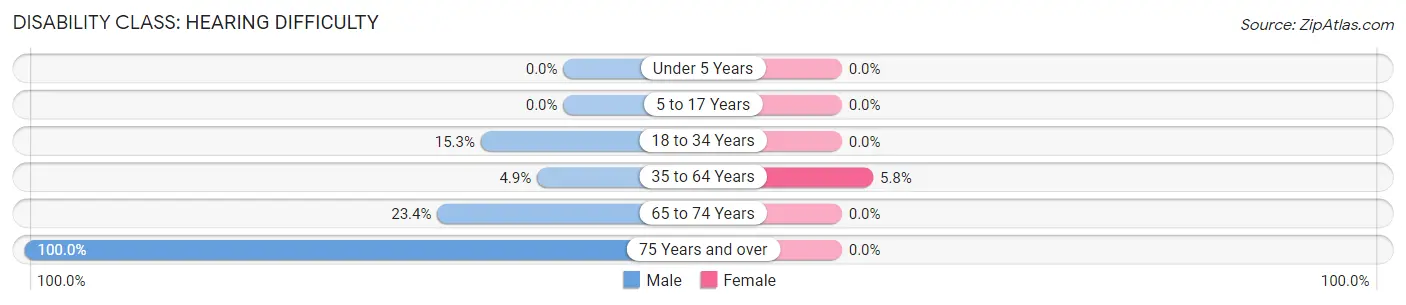
| Age Bracket | Male | Female |
| Under 5 Years | 0 (0.0%) | 0 (0.0%) |
| 5 to 17 Years | 0 (0.0%) | 0 (0.0%) |
| 18 to 34 Years | 17 (15.3%) | 0 (0.0%) |
| 35 to 64 Years | 14 (4.9%) | 16 (5.8%) |
| 65 to 74 Years | 11 (23.4%) | 0 (0.0%) |
| 75 Years and over | 28 (100.0%) | 0 (0.0%) |
Disability Class: Vision Difficulty
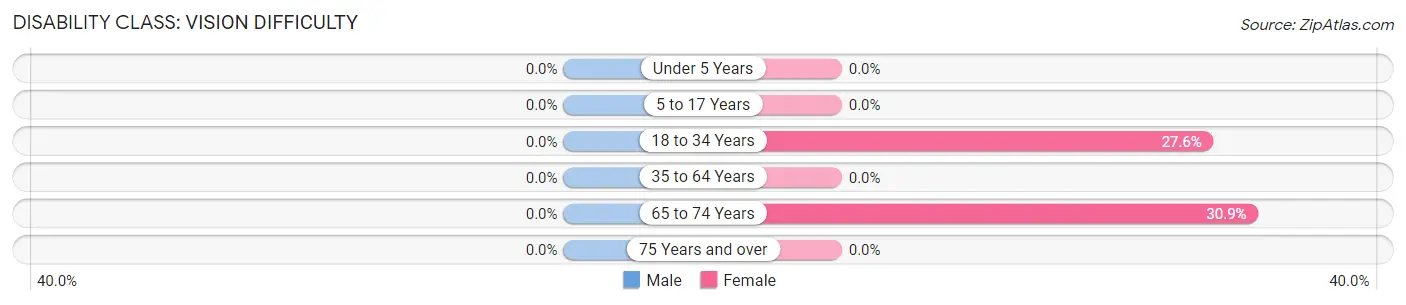
| Age Bracket | Male | Female |
| Under 5 Years | 0 (0.0%) | 0 (0.0%) |
| 5 to 17 Years | 0 (0.0%) | 0 (0.0%) |
| 18 to 34 Years | 0 (0.0%) | 37 (27.6%) |
| 35 to 64 Years | 0 (0.0%) | 0 (0.0%) |
| 65 to 74 Years | 0 (0.0%) | 30 (30.9%) |
| 75 Years and over | 0 (0.0%) | 0 (0.0%) |
Disability Class: Cognitive Difficulty
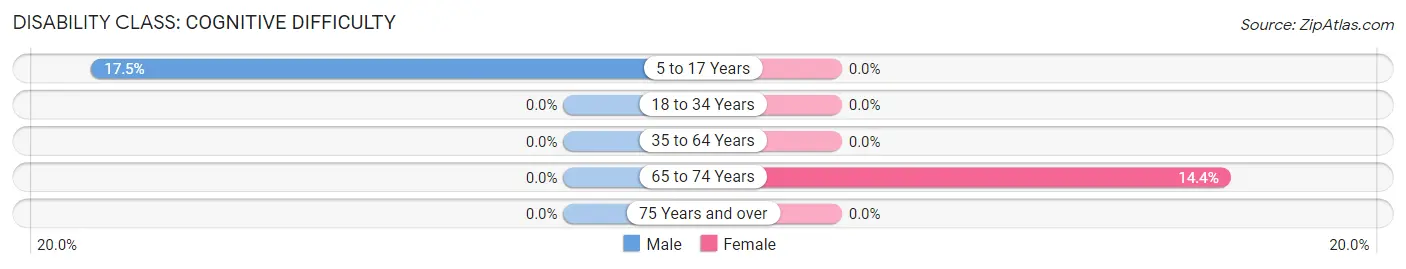
| Age Bracket | Male | Female |
| 5 to 17 Years | 24 (17.5%) | 0 (0.0%) |
| 18 to 34 Years | 0 (0.0%) | 0 (0.0%) |
| 35 to 64 Years | 0 (0.0%) | 0 (0.0%) |
| 65 to 74 Years | 0 (0.0%) | 14 (14.4%) |
| 75 Years and over | 0 (0.0%) | 0 (0.0%) |
Disability Class: Ambulatory Difficulty
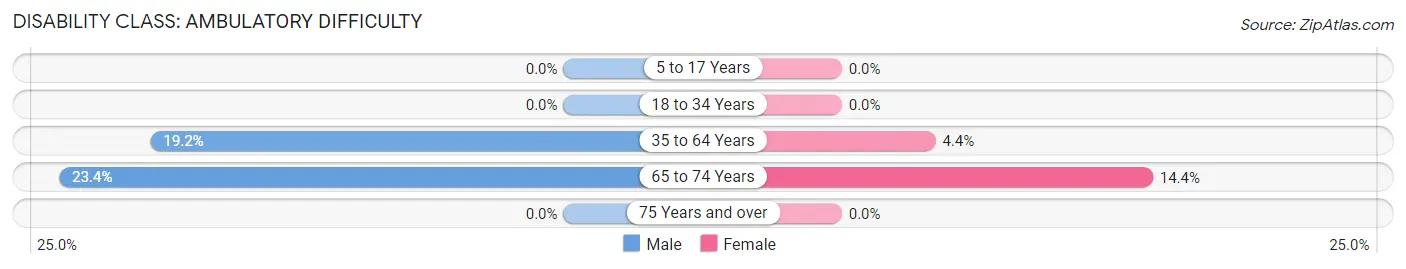
| Age Bracket | Male | Female |
| 5 to 17 Years | 0 (0.0%) | 0 (0.0%) |
| 18 to 34 Years | 0 (0.0%) | 0 (0.0%) |
| 35 to 64 Years | 55 (19.2%) | 12 (4.3%) |
| 65 to 74 Years | 11 (23.4%) | 14 (14.4%) |
| 75 Years and over | 0 (0.0%) | 0 (0.0%) |
Disability Class: Self-Care Difficulty
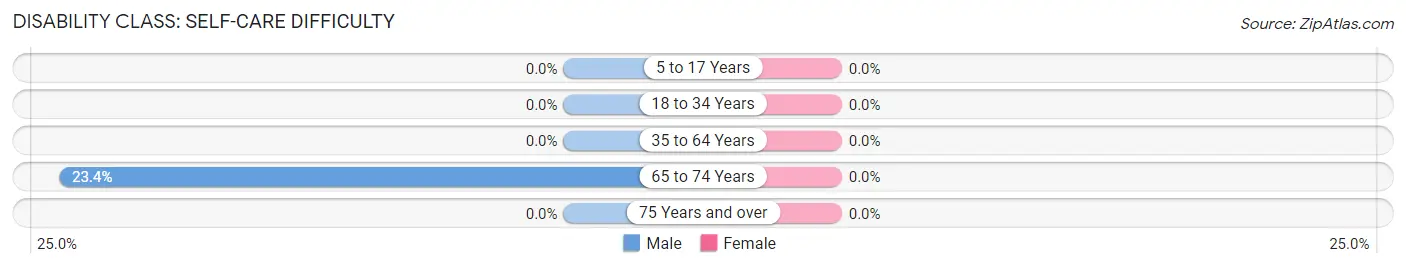
| Age Bracket | Male | Female |
| 5 to 17 Years | 0 (0.0%) | 0 (0.0%) |
| 18 to 34 Years | 0 (0.0%) | 0 (0.0%) |
| 35 to 64 Years | 0 (0.0%) | 0 (0.0%) |
| 65 to 74 Years | 11 (23.4%) | 0 (0.0%) |
| 75 Years and over | 0 (0.0%) | 0 (0.0%) |
Technology Access in Bonner West Riverside
Computing Device Access in Bonner West Riverside
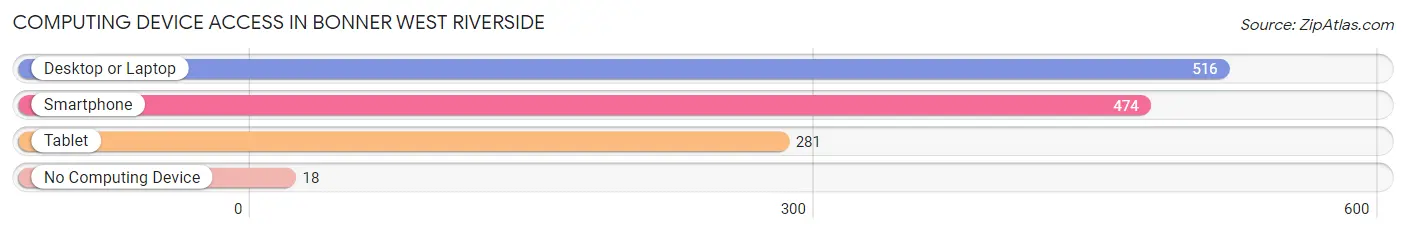
| Device Type | # Households | % Households |
| Desktop or Laptop | 516 | 91.5% |
| Smartphone | 474 | 84.0% |
| Tablet | 281 | 49.8% |
| No Computing Device | 18 | 3.2% |
| Total | 564 | 100.0% |
Internet Access in Bonner West Riverside
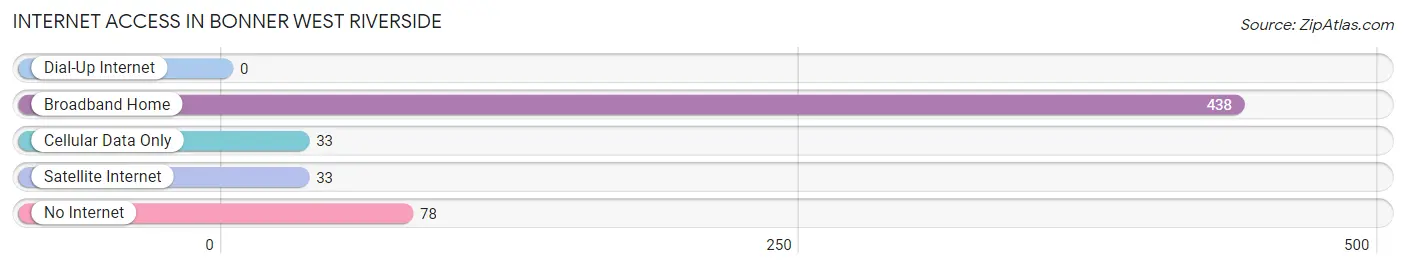
| Internet Type | # Households | % Households |
| Dial-Up Internet | 0 | 0.0% |
| Broadband Home | 438 | 77.7% |
| Cellular Data Only | 33 | 5.9% |
| Satellite Internet | 33 | 5.9% |
| No Internet | 78 | 13.8% |
| Total | 564 | 100.0% |
Bonner West Riverside Summary
History
Bonner West Riverside is a small unincorporated community located in Missoula County, Montana. It is situated on the west bank of the Clark Fork River, just north of Missoula. The area was first settled in the late 1800s by homesteaders and loggers. The community was named after the Bonner family, who were among the first settlers in the area.
The area was originally used for logging and farming, but in the early 1900s, the area began to develop into a residential community. The first school in the area was built in 1910, and the first post office was established in 1912. The community was officially incorporated in 1915.
In the 1920s, the area began to experience a population boom, as more people moved to the area to take advantage of the area's natural resources. The population peaked in the 1950s, when the population was estimated to be around 1,000 people.
Geography
Bonner West Riverside is located in western Montana, just north of Missoula. The area is situated on the west bank of the Clark Fork River, and is surrounded by the Bitterroot Mountains to the east and the Sapphire Mountains to the west. The area is characterized by rolling hills, forests, and meadows.
The climate in the area is generally mild, with warm summers and cold winters. The average annual temperature is around 45 degrees Fahrenheit, and the average annual precipitation is around 20 inches.
Economy
The economy of Bonner West Riverside is largely based on agriculture and tourism. The area is home to several farms, which produce a variety of crops, including wheat, barley, oats, and hay. The area is also home to several wineries, which produce a variety of wines.
Tourism is also an important part of the local economy. The area is home to several recreational activities, including fishing, hunting, camping, and hiking. The area is also home to several historic sites, including the Bonner West Riverside Historic District, which is listed on the National Register of Historic Places.
Demographics
As of the 2010 census, the population of Bonner West Riverside was 1,072. The population is largely white (94.3%), with small percentages of Native American (2.2%), African American (1.2%), and Asian (0.7%) residents. The median household income in the area is $45,000, and the median home value is $170,000. The area is served by the Missoula County Public Schools.
Common Questions
What is Per Capita Income in Bonner West Riverside?
Per Capita income in Bonner West Riverside is $32,188.
What is the Median Family Income in Bonner West Riverside?
Median Family Income in Bonner West Riverside is $59,760.
What is the Median Household income in Bonner West Riverside?
Median Household Income in Bonner West Riverside is $58,673.
What is Income or Wage Gap in Bonner West Riverside?
Income or Wage Gap in Bonner West Riverside is 54.2%.
Women in Bonner West Riverside earn 45.8 cents for every dollar earned by a man.
What is Inequality or Gini Index in Bonner West Riverside?
Inequality or Gini Index in Bonner West Riverside is 0.47.
What is the Total Population of Bonner West Riverside?
Total Population of Bonner West Riverside is 1,281.
What is the Total Male Population of Bonner West Riverside?
Total Male Population of Bonner West Riverside is 651.
What is the Total Female Population of Bonner West Riverside?
Total Female Population of Bonner West Riverside is 630.
What is the Ratio of Males per 100 Females in Bonner West Riverside?
There are 103.33 Males per 100 Females in Bonner West Riverside.
What is the Ratio of Females per 100 Males in Bonner West Riverside?
There are 96.77 Females per 100 Males in Bonner West Riverside.
What is the Median Population Age in Bonner West Riverside?
Median Population Age in Bonner West Riverside is 38.9 Years.
What is the Average Family Size in Bonner West Riverside
Average Family Size in Bonner West Riverside is 2.8 People.
What is the Average Household Size in Bonner West Riverside
Average Household Size in Bonner West Riverside is 2.3 People.
How Large is the Labor Force in Bonner West Riverside?
There are 770 People in the Labor Forcein in Bonner West Riverside.
What is the Percentage of People in the Labor Force in Bonner West Riverside?
73.8% of People are in the Labor Force in Bonner West Riverside.
What is the Unemployment Rate in Bonner West Riverside?
Unemployment Rate in Bonner West Riverside is 5.0%.