Casco, ME Map & Demographics
Casco Map
Casco Overview
$31,534
PER CAPITA INCOME
$101,908
AVG FAMILY INCOME
0.51
INEQUALITY / GINI INDEX
771
TOTAL POPULATION
336
MALE POPULATION
435
FEMALE POPULATION
77.24
MALES / 100 FEMALES
129.46
FEMALES / 100 MALES
50.6
MEDIAN AGE
2.9
AVG FAMILY SIZE
1.7
AVG HOUSEHOLD SIZE
554
LABOR FORCE [ PEOPLE ]
77.6%
PERCENT IN LABOR FORCE
0.5%
UNEMPLOYMENT RATE
Casco Zip Codes
Casco Area Codes
Income in Casco
Income Overview in Casco
| Characteristic | Number | Measure |
| Per Capita Income | 771 | $31,534 |
| Median Family Income | 156 | $101,908 |
| Mean Family Income | 156 | $101,699 |
| Median Household Income | 439 | $0 |
| Mean Household Income | 439 | $53,593 |
| Income Deficit | 156 | $0 |
| Wage / Income Gap (%) | 771 | 0.00% |
| Wage / Income Gap ($) | 771 | 100.00¢ per $1 |
| Gini / Inequality Index | 771 | 0.51 |
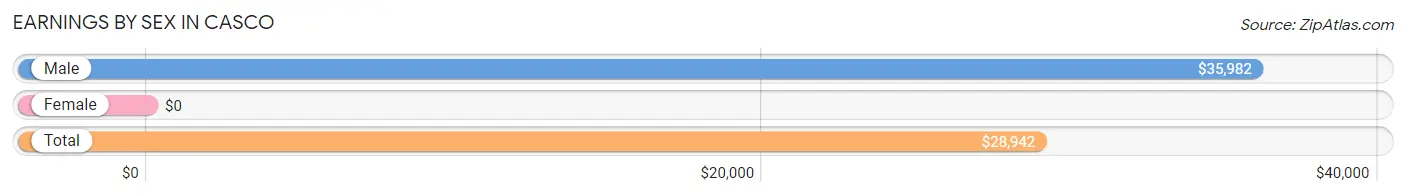
Earnings by Sex in Casco
| Sex | Number | Average Earnings |
| Male | 241 (43.6%) | $35,982 |
| Female | 312 (56.4%) | $0 |
| Total | 553 (100.0%) | $28,942 |
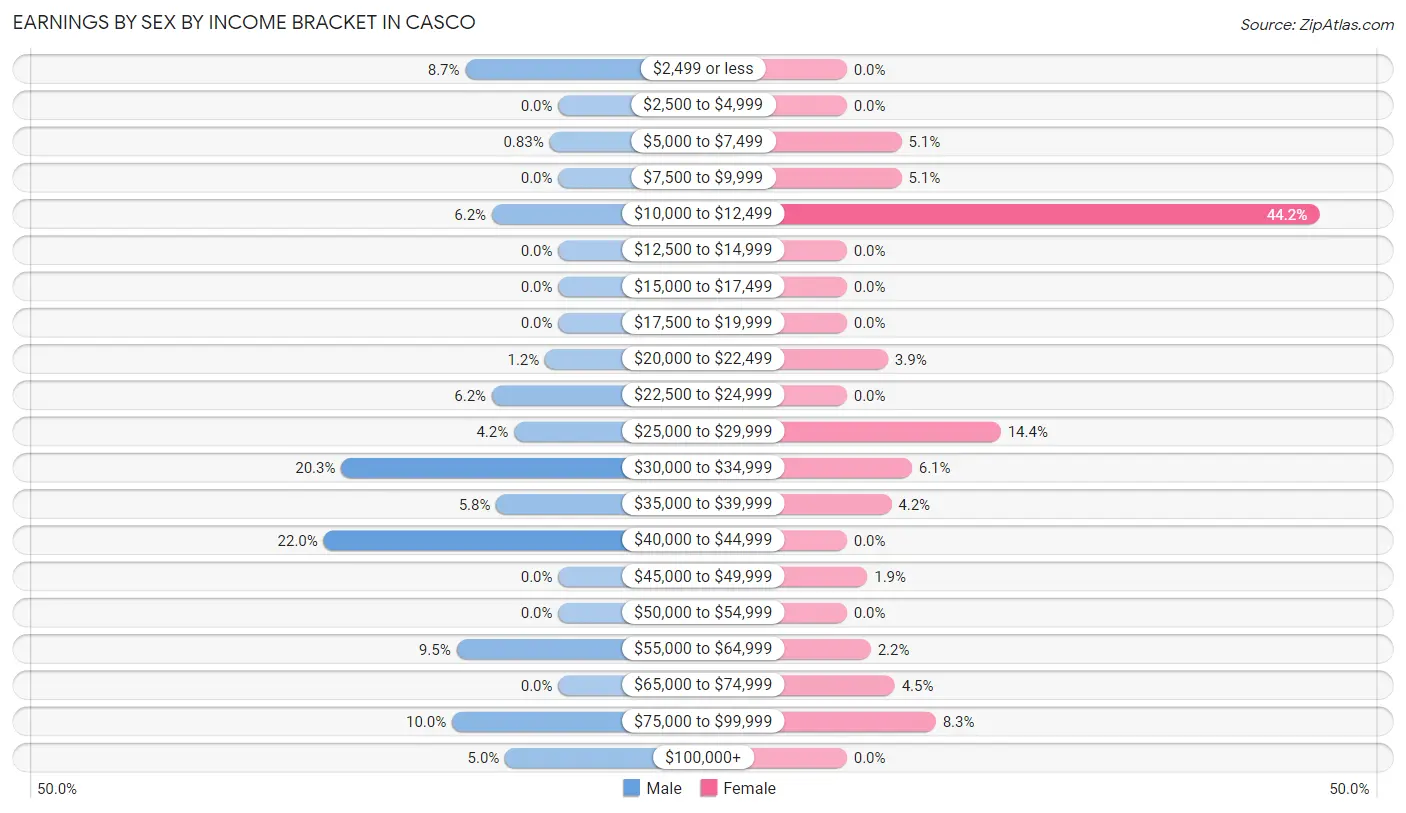
Earnings by Sex by Income Bracket in Casco
The most common earnings brackets in Casco are $40,000 to $44,999 for men (53 | 22.0%) and $10,000 to $12,499 for women (138 | 44.2%).
| Income | Male | Female |
| $2,499 or less | 21 (8.7%) | 0 (0.0%) |
| $2,500 to $4,999 | 0 (0.0%) | 0 (0.0%) |
| $5,000 to $7,499 | 2 (0.8%) | 16 (5.1%) |
| $7,500 to $9,999 | 0 (0.0%) | 16 (5.1%) |
| $10,000 to $12,499 | 15 (6.2%) | 138 (44.2%) |
| $12,500 to $14,999 | 0 (0.0%) | 0 (0.0%) |
| $15,000 to $17,499 | 0 (0.0%) | 0 (0.0%) |
| $17,500 to $19,999 | 0 (0.0%) | 0 (0.0%) |
| $20,000 to $22,499 | 3 (1.2%) | 12 (3.8%) |
| $22,500 to $24,999 | 15 (6.2%) | 0 (0.0%) |
| $25,000 to $29,999 | 10 (4.2%) | 45 (14.4%) |
| $30,000 to $34,999 | 49 (20.3%) | 19 (6.1%) |
| $35,000 to $39,999 | 14 (5.8%) | 13 (4.2%) |
| $40,000 to $44,999 | 53 (22.0%) | 0 (0.0%) |
| $45,000 to $49,999 | 0 (0.0%) | 6 (1.9%) |
| $50,000 to $54,999 | 0 (0.0%) | 0 (0.0%) |
| $55,000 to $64,999 | 23 (9.5%) | 7 (2.2%) |
| $65,000 to $74,999 | 0 (0.0%) | 14 (4.5%) |
| $75,000 to $99,999 | 24 (10.0%) | 26 (8.3%) |
| $100,000+ | 12 (5.0%) | 0 (0.0%) |
| Total | 241 (100.0%) | 312 (100.0%) |
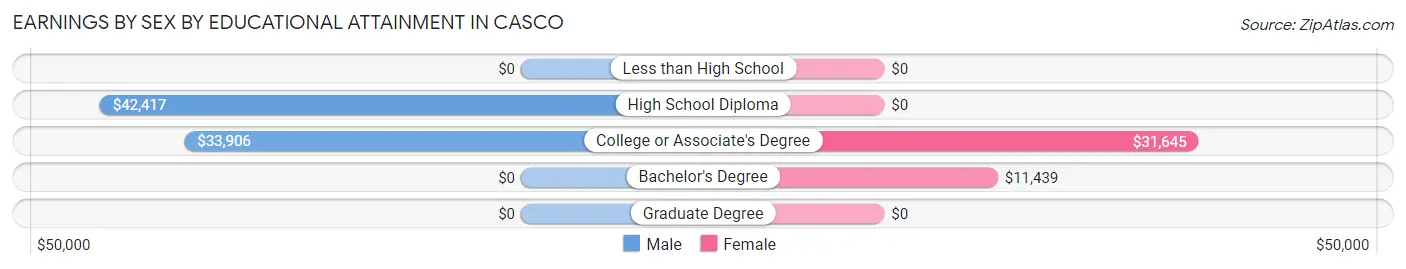
Earnings by Sex by Educational Attainment in Casco
| Educational Attainment | Male Income | Female Income |
| Less than High School | - | - |
| High School Diploma | $42,417 | $0 |
| College or Associate's Degree | $33,906 | $31,645 |
| Bachelor's Degree | - | - |
| Graduate Degree | - | - |
| Total | $36,429 | $0 |
Family Income in Casco
Family Income Brackets in Casco
According to the Casco family income data, there are 91 families falling into the $100,000 to $149,999 income range, which is the most common income bracket and makes up 58.3% of all families.
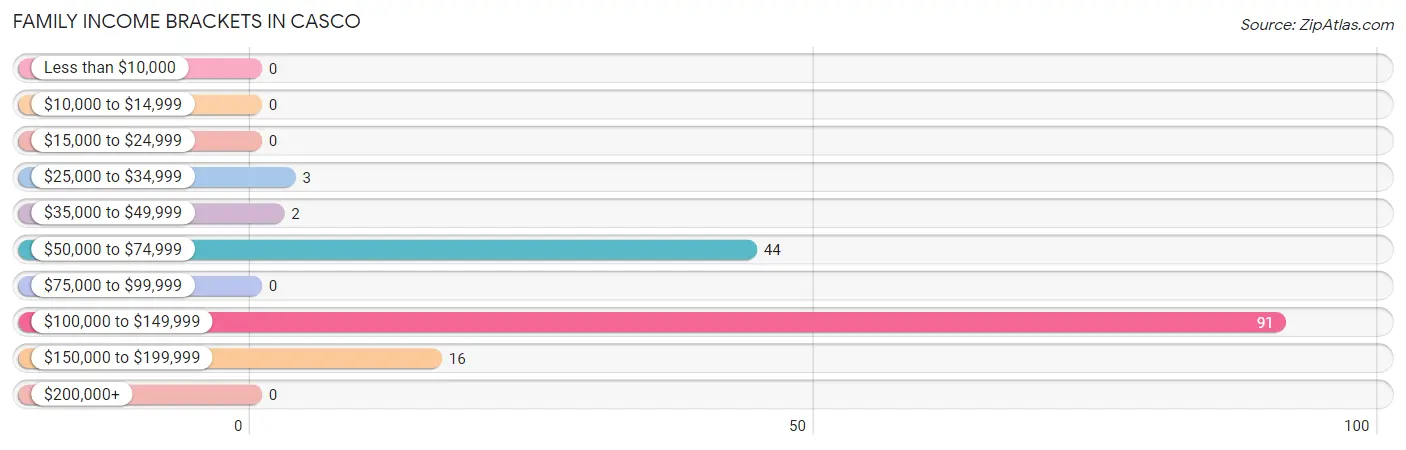
| Income Bracket | # Families | % Families |
| Less than $10,000 | 0 | 0.0% |
| $10,000 to $14,999 | 0 | 0.0% |
| $15,000 to $24,999 | 0 | 0.0% |
| $25,000 to $34,999 | 3 | 1.9% |
| $35,000 to $49,999 | 2 | 1.3% |
| $50,000 to $74,999 | 44 | 28.2% |
| $75,000 to $99,999 | 0 | 0.0% |
| $100,000 to $149,999 | 91 | 58.3% |
| $150,000 to $199,999 | 16 | 10.3% |
| $200,000+ | 0 | 0.0% |
Family Income by Famaliy Size in Casco
4-person families (36 | 23.1%) account for the highest median family income in Casco with $103,214 per family, while 2-person families (104 | 66.7%) have the highest median income of $50,559 per family member.
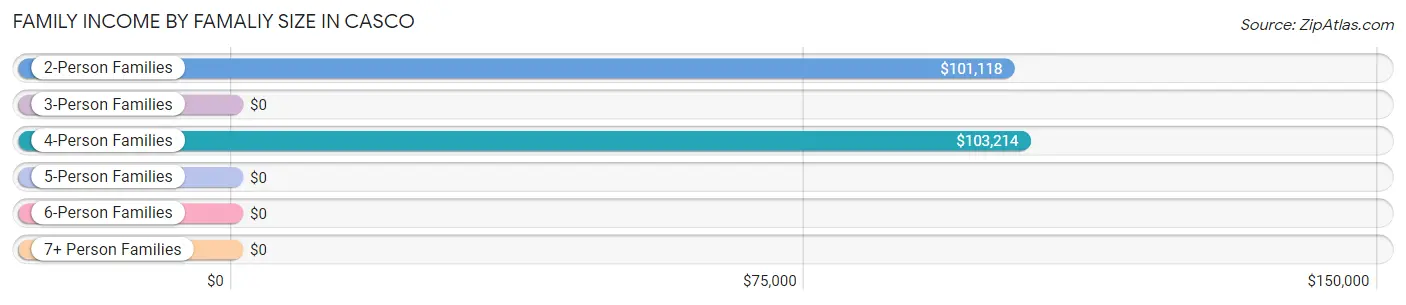
| Income Bracket | # Families | Median Income |
| 2-Person Families | 104 (66.7%) | $101,118 |
| 3-Person Families | 0 (0.0%) | $0 |
| 4-Person Families | 36 (23.1%) | $103,214 |
| 5-Person Families | 16 (10.3%) | $0 |
| 6-Person Families | 0 (0.0%) | $0 |
| 7+ Person Families | 0 (0.0%) | $0 |
| Total | 156 (100.0%) | $101,908 |
Family Income by Number of Earners in Casco
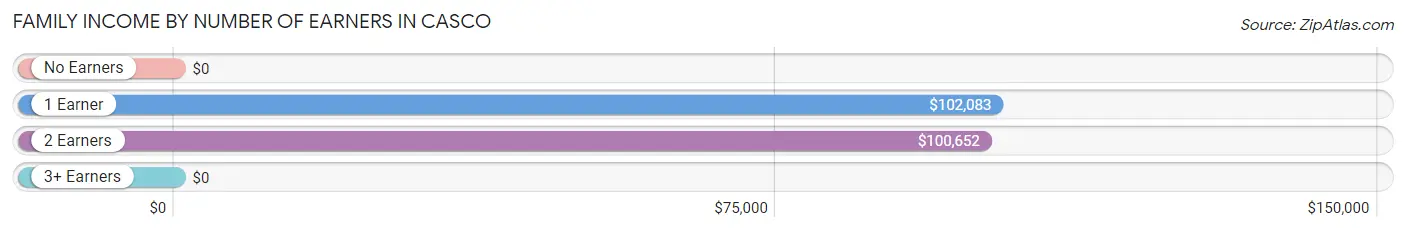
| Number of Earners | # Families | Median Income |
| No Earners | 3 (1.9%) | $0 |
| 1 Earner | 35 (22.4%) | $102,083 |
| 2 Earners | 94 (60.3%) | $100,652 |
| 3+ Earners | 24 (15.4%) | $0 |
| Total | 156 (100.0%) | $101,908 |
Household Income in Casco
Household Income Brackets in Casco
With 142 households falling in the category, the $10,000 to $14,999 income range is the most frequent in Casco, accounting for 32.4% of all households.
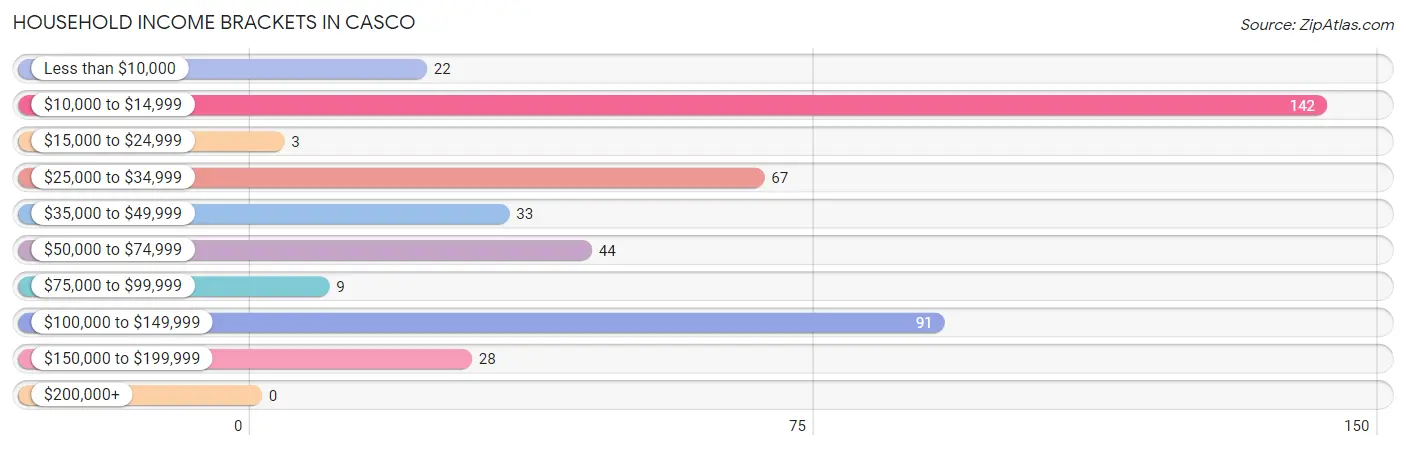
| Income Bracket | # Households | % Households |
| Less than $10,000 | 22 | 5.0% |
| $10,000 to $14,999 | 142 | 32.3% |
| $15,000 to $24,999 | 3 | 0.7% |
| $25,000 to $34,999 | 67 | 15.3% |
| $35,000 to $49,999 | 33 | 7.5% |
| $50,000 to $74,999 | 44 | 10.0% |
| $75,000 to $99,999 | 9 | 2.1% |
| $100,000 to $149,999 | 91 | 20.7% |
| $150,000 to $199,999 | 28 | 6.4% |
| $200,000+ | 0 | 0.0% |
Household Income by Householder Age in Casco
The median household income in Casco is $0, with the highest median household income of $76,250 found in the 65+ years age bracket for the primary householder. A total of 109 households (24.8%) fall into this category.
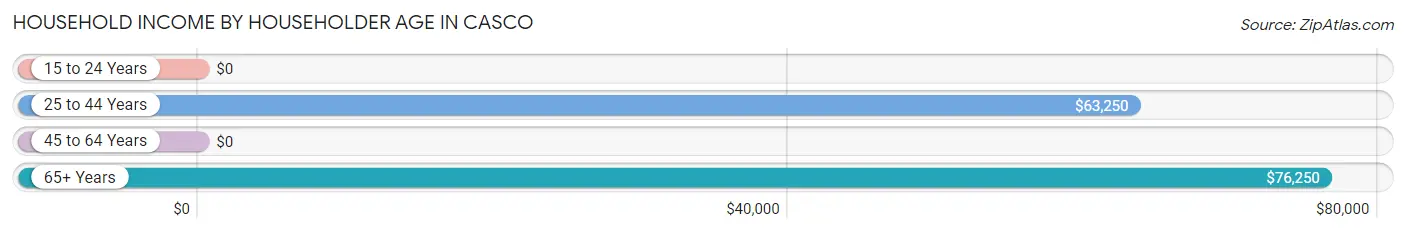
| Income Bracket | # Households | Median Income |
| 15 to 24 Years | 0 (0.0%) | $0 |
| 25 to 44 Years | 42 (9.6%) | $63,250 |
| 45 to 64 Years | 288 (65.6%) | $0 |
| 65+ Years | 109 (24.8%) | $76,250 |
| Total | 439 (100.0%) | $0 |
Poverty in Casco
Income Below Poverty by Sex and Age in Casco
With 7.5% poverty level for males and 33.3% for females among the residents of Casco, 45 to 54 year old males and 45 to 54 year old females are the most vulnerable to poverty, with 25 males (28.4%) and 132 females (86.3%) in their respective age groups living below the poverty level.
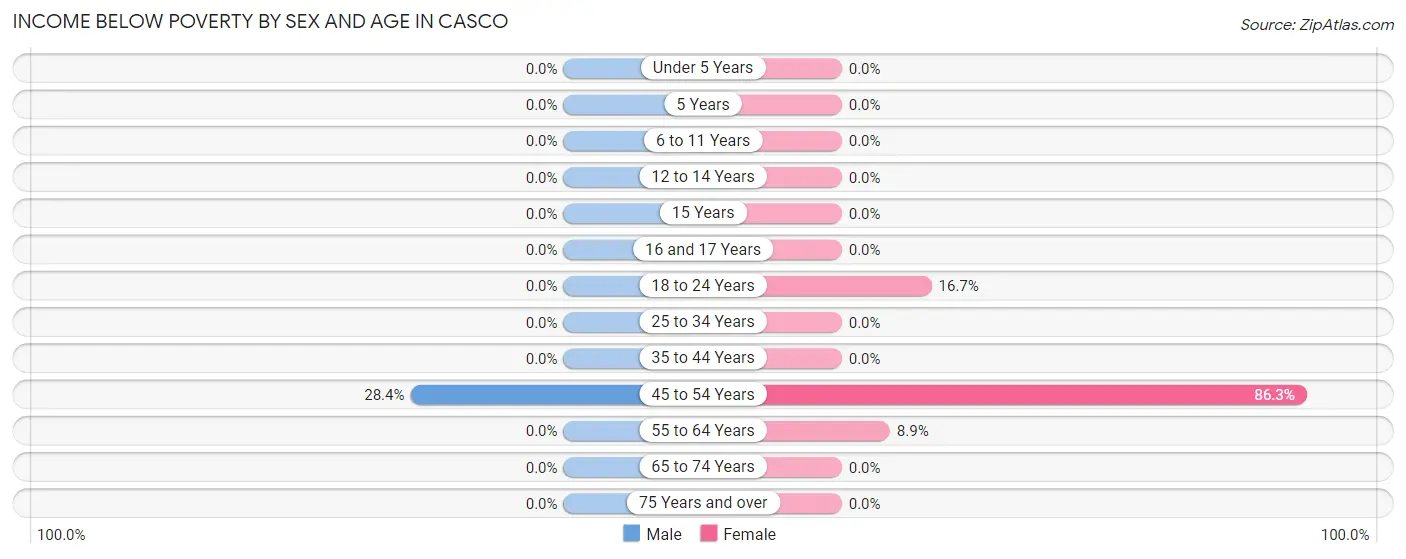
| Age Bracket | Male | Female |
| Under 5 Years | 0 (0.0%) | 0 (0.0%) |
| 5 Years | 0 (0.0%) | 0 (0.0%) |
| 6 to 11 Years | 0 (0.0%) | 0 (0.0%) |
| 12 to 14 Years | 0 (0.0%) | 0 (0.0%) |
| 15 Years | 0 (0.0%) | 0 (0.0%) |
| 16 and 17 Years | 0 (0.0%) | 0 (0.0%) |
| 18 to 24 Years | 0 (0.0%) | 3 (16.7%) |
| 25 to 34 Years | 0 (0.0%) | 0 (0.0%) |
| 35 to 44 Years | 0 (0.0%) | 0 (0.0%) |
| 45 to 54 Years | 25 (28.4%) | 132 (86.3%) |
| 55 to 64 Years | 0 (0.0%) | 10 (8.9%) |
| 65 to 74 Years | 0 (0.0%) | 0 (0.0%) |
| 75 Years and over | 0 (0.0%) | 0 (0.0%) |
| Total | 25 (7.5%) | 145 (33.3%) |
Income Above Poverty by Sex and Age in Casco
According to the poverty statistics in Casco, males aged 12 to 14 years and females aged under 5 years are the age groups that are most secure financially, with 100.0% of males and 100.0% of females in these age groups living above the poverty line.
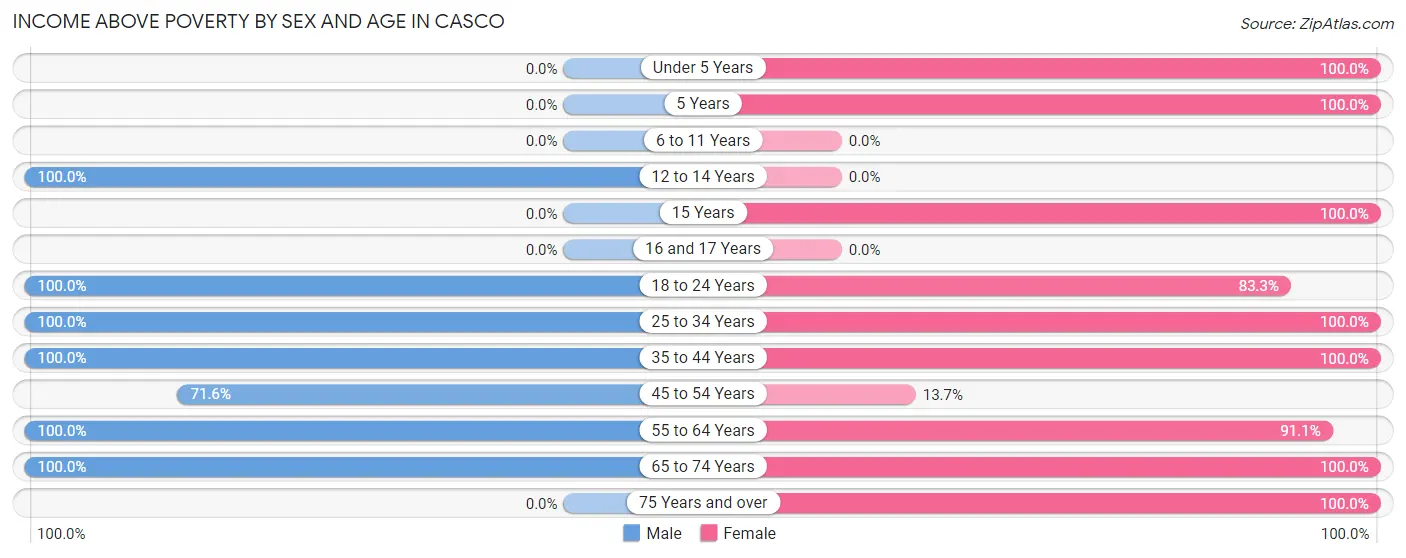
| Age Bracket | Male | Female |
| Under 5 Years | 0 (0.0%) | 15 (100.0%) |
| 5 Years | 0 (0.0%) | 13 (100.0%) |
| 6 to 11 Years | 0 (0.0%) | 0 (0.0%) |
| 12 to 14 Years | 14 (100.0%) | 0 (0.0%) |
| 15 Years | 0 (0.0%) | 14 (100.0%) |
| 16 and 17 Years | 0 (0.0%) | 0 (0.0%) |
| 18 to 24 Years | 45 (100.0%) | 15 (83.3%) |
| 25 to 34 Years | 61 (100.0%) | 14 (100.0%) |
| 35 to 44 Years | 27 (100.0%) | 24 (100.0%) |
| 45 to 54 Years | 63 (71.6%) | 21 (13.7%) |
| 55 to 64 Years | 40 (100.0%) | 102 (91.1%) |
| 65 to 74 Years | 56 (100.0%) | 58 (100.0%) |
| 75 Years and over | 0 (0.0%) | 14 (100.0%) |
| Total | 306 (92.4%) | 290 (66.7%) |
Income Below Poverty Among Married-Couple Families in Casco
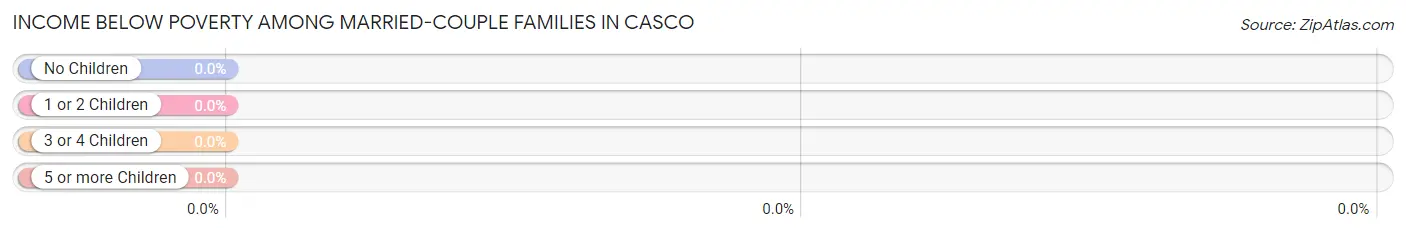
| Children | Above Poverty | Below Poverty |
| No Children | 95 (100.0%) | 0 (0.0%) |
| 1 or 2 Children | 28 (100.0%) | 0 (0.0%) |
| 3 or 4 Children | 0 (0.0%) | 0 (0.0%) |
| 5 or more Children | 0 (0.0%) | 0 (0.0%) |
| Total | 123 (100.0%) | 0 (0.0%) |
Income Below Poverty Among Single-Parent Households in Casco
| Children | Single Father | Single Mother |
| No Children | 0 (0.0%) | 0 (0.0%) |
| 1 or 2 Children | 0 (0.0%) | 0 (0.0%) |
| 3 or 4 Children | 0 (0.0%) | 0 (0.0%) |
| 5 or more Children | 0 (0.0%) | 0 (0.0%) |
| Total | 0 (0.0%) | 0 (0.0%) |
Income Below Poverty Among Married-Couple vs Single-Parent Households in Casco
| Children | Married-Couple Families | Single-Parent Households |
| No Children | 0 (0.0%) | 0 (0.0%) |
| 1 or 2 Children | 0 (0.0%) | 0 (0.0%) |
| 3 or 4 Children | 0 (0.0%) | 0 (0.0%) |
| 5 or more Children | 0 (0.0%) | 0 (0.0%) |
| Total | 0 (0.0%) | 0 (0.0%) |
Race in Casco
The most populous races in Casco are White / Caucasian (594 | 77.0%), Two or more Races (175 | 22.7%), and Black / African American (2 | 0.3%).
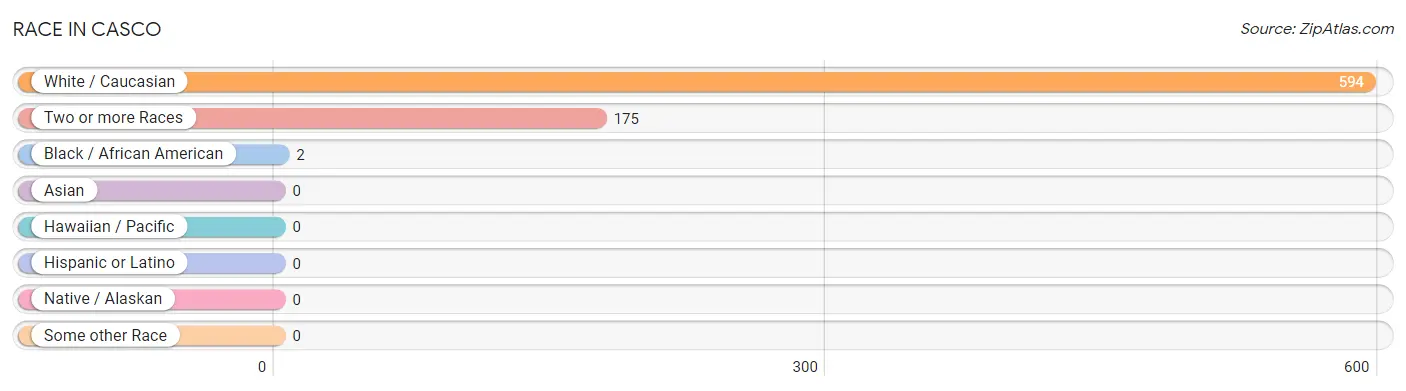
| Race | # Population | % Population |
| Asian | 0 | 0.0% |
| Black / African American | 2 | 0.3% |
| Hawaiian / Pacific | 0 | 0.0% |
| Hispanic or Latino | 0 | 0.0% |
| Native / Alaskan | 0 | 0.0% |
| White / Caucasian | 594 | 77.0% |
| Two or more Races | 175 | 22.7% |
| Some other Race | 0 | 0.0% |
| Total | 771 | 100.0% |
Ancestry in Casco
The most populous ancestries reported in Casco are English (107 | 13.9%), French Canadian (79 | 10.2%), Irish (66 | 8.6%), Italian (58 | 7.5%), and American (57 | 7.4%), together accounting for 47.6% of all Casco residents.
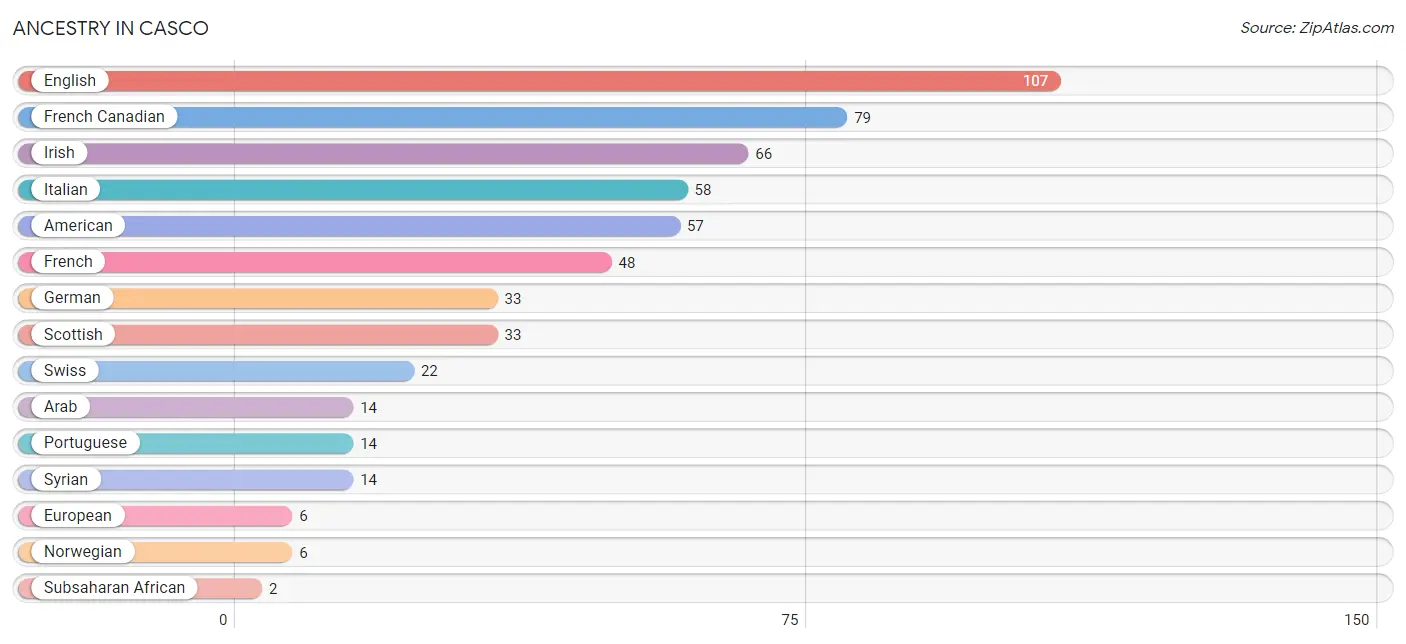
| Ancestry | # Population | % Population |
| American | 57 | 7.4% |
| Arab | 14 | 1.8% |
| English | 107 | 13.9% |
| European | 6 | 0.8% |
| French | 48 | 6.2% |
| French Canadian | 79 | 10.2% |
| German | 33 | 4.3% |
| Irish | 66 | 8.6% |
| Italian | 58 | 7.5% |
| Norwegian | 6 | 0.8% |
| Portuguese | 14 | 1.8% |
| Scottish | 33 | 4.3% |
| Somali | 1 | 0.1% |
| Subsaharan African | 2 | 0.3% |
| Sudanese | 1 | 0.1% |
| Swiss | 22 | 2.9% |
| Syrian | 14 | 1.8% |
| Thai | 1 | 0.1% | View All 18 Rows |
Immigrants in Casco

| Immigration Origin | # Population | % Population | View All 0 Rows |
Sex and Age in Casco
Sex and Age in Casco
The most populous age groups in Casco are 50 to 54 Years (50 | 14.9%) for men and 50 to 54 Years (137 | 31.5%) for women.
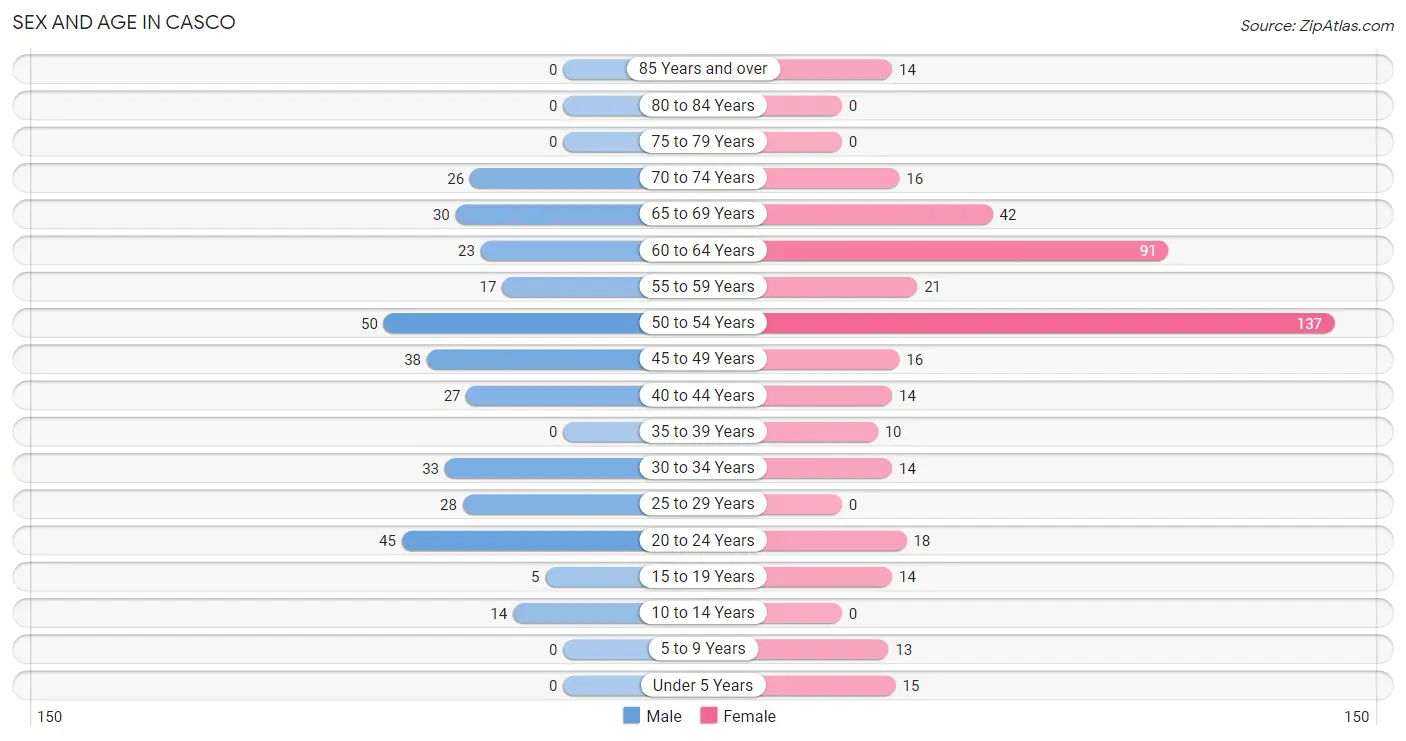
| Age Bracket | Male | Female |
| Under 5 Years | 0 (0.0%) | 15 (3.5%) |
| 5 to 9 Years | 0 (0.0%) | 13 (3.0%) |
| 10 to 14 Years | 14 (4.2%) | 0 (0.0%) |
| 15 to 19 Years | 5 (1.5%) | 14 (3.2%) |
| 20 to 24 Years | 45 (13.4%) | 18 (4.1%) |
| 25 to 29 Years | 28 (8.3%) | 0 (0.0%) |
| 30 to 34 Years | 33 (9.8%) | 14 (3.2%) |
| 35 to 39 Years | 0 (0.0%) | 10 (2.3%) |
| 40 to 44 Years | 27 (8.0%) | 14 (3.2%) |
| 45 to 49 Years | 38 (11.3%) | 16 (3.7%) |
| 50 to 54 Years | 50 (14.9%) | 137 (31.5%) |
| 55 to 59 Years | 17 (5.1%) | 21 (4.8%) |
| 60 to 64 Years | 23 (6.9%) | 91 (20.9%) |
| 65 to 69 Years | 30 (8.9%) | 42 (9.7%) |
| 70 to 74 Years | 26 (7.7%) | 16 (3.7%) |
| 75 to 79 Years | 0 (0.0%) | 0 (0.0%) |
| 80 to 84 Years | 0 (0.0%) | 0 (0.0%) |
| 85 Years and over | 0 (0.0%) | 14 (3.2%) |
| Total | 336 (100.0%) | 435 (100.0%) |
Families and Households in Casco
Median Family Size in Casco
The median family size in Casco is 2.94 persons per family, with married-couple families (123 | 78.8%) accounting for the largest median family size of 3.15 persons per family. On the other hand, single male/father families (15 | 9.6%) represent the smallest median family size with 2.00 persons per family.
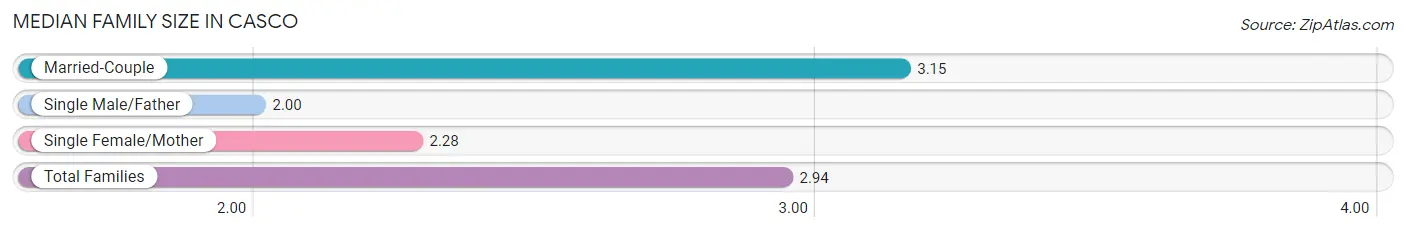
| Family Type | # Families | Family Size |
| Married-Couple | 123 (78.8%) | 3.15 |
| Single Male/Father | 15 (9.6%) | 2.00 |
| Single Female/Mother | 18 (11.5%) | 2.28 |
| Total Families | 156 (100.0%) | 2.94 |
Median Household Size in Casco
The median household size in Casco is 1.74 persons per household, with married-couple households (123 | 28.0%) accounting for the largest median household size of 3.19 persons per household. non-family households (283 | 64.5%) represent the smallest median household size with 1.04 persons per household.
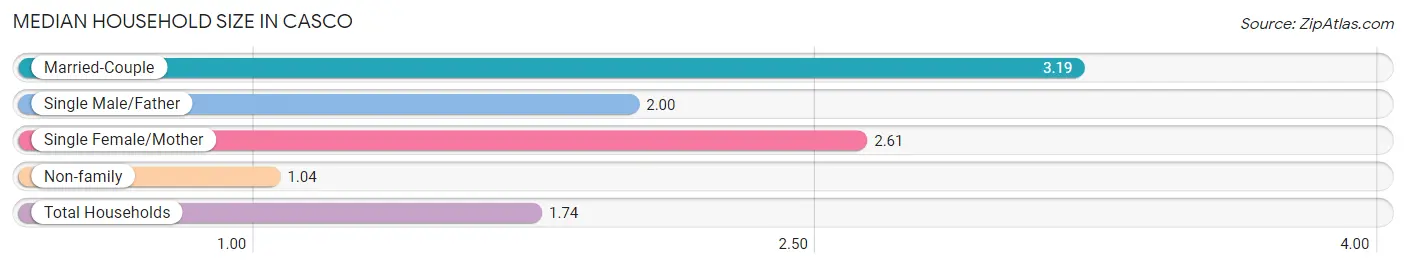
| Household Type | # Households | Household Size |
| Married-Couple | 123 (28.0%) | 3.19 |
| Single Male/Father | 15 (3.4%) | 2.00 |
| Single Female/Mother | 18 (4.1%) | 2.61 |
| Non-family | 283 (64.5%) | 1.04 |
| Total Households | 439 (100.0%) | 1.74 |
Household Size by Marriage Status in Casco
Out of a total of 439 households in Casco, 156 (35.5%) are family households, while 283 (64.5%) are nonfamily households. The most numerous type of family households are 2-person households, comprising 99, and the most common type of nonfamily households are 1-person households, comprising 271.
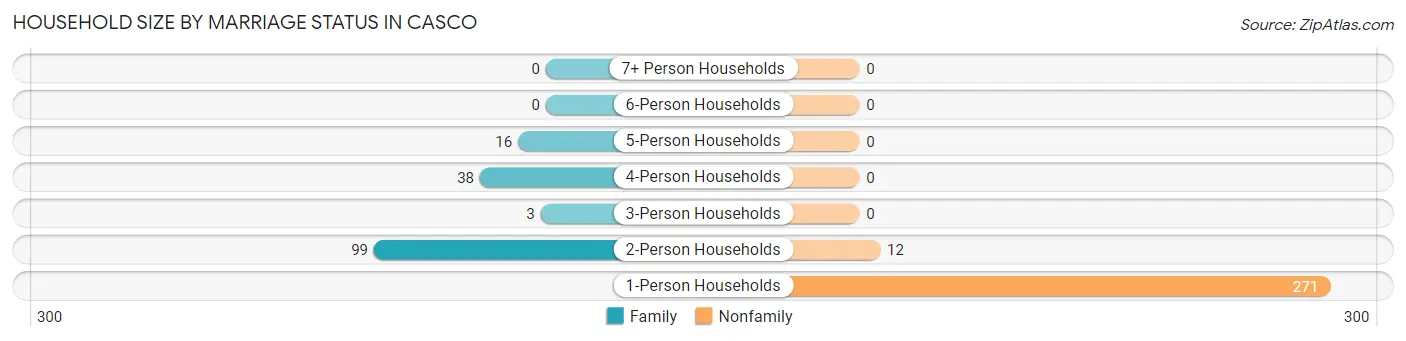
| Household Size | Family Households | Nonfamily Households |
| 1-Person Households | - | 271 (61.7%) |
| 2-Person Households | 99 (22.6%) | 12 (2.7%) |
| 3-Person Households | 3 (0.7%) | 0 (0.0%) |
| 4-Person Households | 38 (8.7%) | 0 (0.0%) |
| 5-Person Households | 16 (3.6%) | 0 (0.0%) |
| 6-Person Households | 0 (0.0%) | 0 (0.0%) |
| 7+ Person Households | 0 (0.0%) | 0 (0.0%) |
| Total | 156 (35.5%) | 283 (64.5%) |
Female Fertility in Casco
Fertility by Age in Casco
| Age Bracket | Women with Births | Births / 1,000 Women |
| 15 to 19 years | 0 (0.0%) | 0.0 |
| 20 to 34 years | 0 (0.0%) | 0.0 |
| 35 to 50 years | 0 (0.0%) | 0.0 |
| Total | 0 (0.0%) | 0.0 |
Fertility by Age by Marriage Status in Casco
| Age Bracket | Married | Unmarried |
| 15 to 19 years | 0 (0.0%) | 0 (0.0%) |
| 20 to 34 years | 0 (0.0%) | 0 (0.0%) |
| 35 to 50 years | 0 (0.0%) | 0 (0.0%) |
| Total | 0 (0.0%) | 0 (0.0%) |
Fertility by Education in Casco
| Educational Attainment | Women with Births | Births / 1,000 Women |
| Less than High School | 0 (0.0%) | 0.0 |
| High School Diploma | 0 (0.0%) | 0.0 |
| College or Associate's Degree | 0 (0.0%) | 0.0 |
| Bachelor's Degree | 0 (0.0%) | 0.0 |
| Graduate Degree | 0 (0.0%) | 0.0 |
| Total | 0 (0.0%) | 0.0 |
Fertility by Education by Marriage Status in Casco
| Educational Attainment | Married | Unmarried |
| Less than High School | 0 (0.0%) | 0 (0.0%) |
| High School Diploma | 0 (0.0%) | 0 (0.0%) |
| College or Associate's Degree | 0 (0.0%) | 0 (0.0%) |
| Bachelor's Degree | 0 (0.0%) | 0 (0.0%) |
| Graduate Degree | 0 (0.0%) | 0 (0.0%) |
| Total | 0 (0.0%) | 0 (0.0%) |
Employment Characteristics in Casco
Employment by Class of Employer in Casco
Among the 531 employed individuals in Casco, private company employees (240 | 45.2%), self-employed (not incorporated) (155 | 29.2%), and local government employees (54 | 10.2%) make up the most common classes of employment.
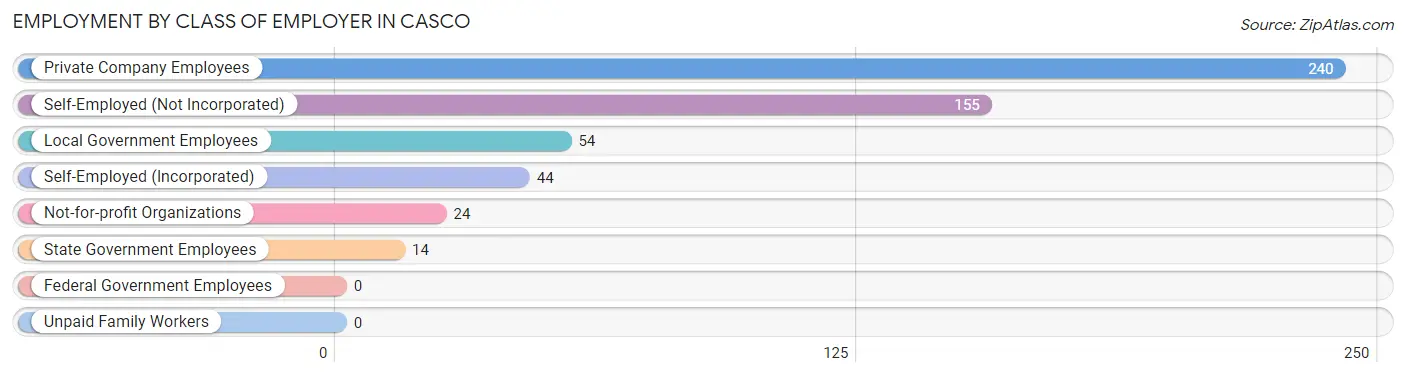
| Employer Class | # Employees | % Employees |
| Private Company Employees | 240 | 45.2% |
| Self-Employed (Incorporated) | 44 | 8.3% |
| Self-Employed (Not Incorporated) | 155 | 29.2% |
| Not-for-profit Organizations | 24 | 4.5% |
| Local Government Employees | 54 | 10.2% |
| State Government Employees | 14 | 2.6% |
| Federal Government Employees | 0 | 0.0% |
| Unpaid Family Workers | 0 | 0.0% |
| Total | 531 | 100.0% |
Employment Status by Age in Casco
According to the labor force statistics for Casco, out of the total population over 16 years of age (714), 77.6% or 554 individuals are in the labor force, with 0.5% or 3 of them unemployed. The age group with the highest labor force participation rate is 20 to 24 years, with 100.0% or 63 individuals in the labor force. Within the labor force, the 45 to 54 years age range has the highest percentage of unemployed individuals, with 1.4% or 3 of them being unemployed.
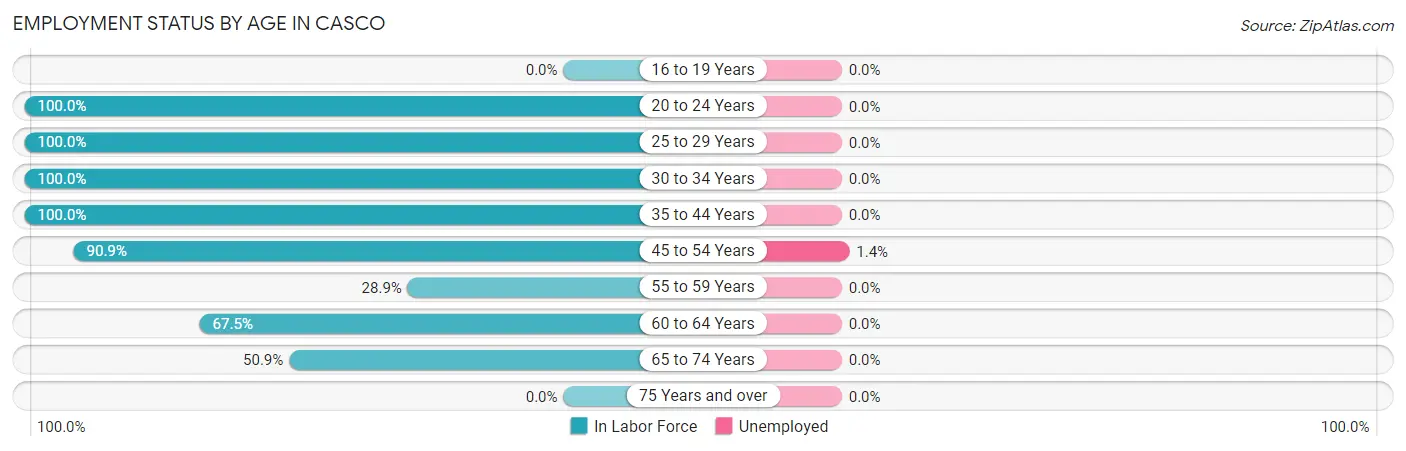
| Age Bracket | In Labor Force | Unemployed |
| 16 to 19 Years | 0 (0.0%) | 0 (0.0%) |
| 20 to 24 Years | 63 (100.0%) | 0 (0.0%) |
| 25 to 29 Years | 28 (100.0%) | 0 (0.0%) |
| 30 to 34 Years | 47 (100.0%) | 0 (0.0%) |
| 35 to 44 Years | 51 (100.0%) | 0 (0.0%) |
| 45 to 54 Years | 219 (90.9%) | 3 (1.4%) |
| 55 to 59 Years | 11 (28.9%) | 0 (0.0%) |
| 60 to 64 Years | 77 (67.5%) | 0 (0.0%) |
| 65 to 74 Years | 58 (50.9%) | 0 (0.0%) |
| 75 Years and over | 0 (0.0%) | 0 (0.0%) |
| Total | 554 (77.6%) | 3 (0.5%) |
Employment Status by Educational Attainment in Casco
According to labor force statistics for Casco, 83.4% of individuals (433) out of the total population between 25 and 64 years of age (519) are in the labor force, with 0.7% or 3 of them being unemployed. The group with the highest labor force participation rate are those with the educational attainment of college / associate degree, with 100.0% or 95 individuals in the labor force. Within the labor force, individuals with high school diploma education have the highest percentage of unemployment, with 2.7% or 3 of them being unemployed.
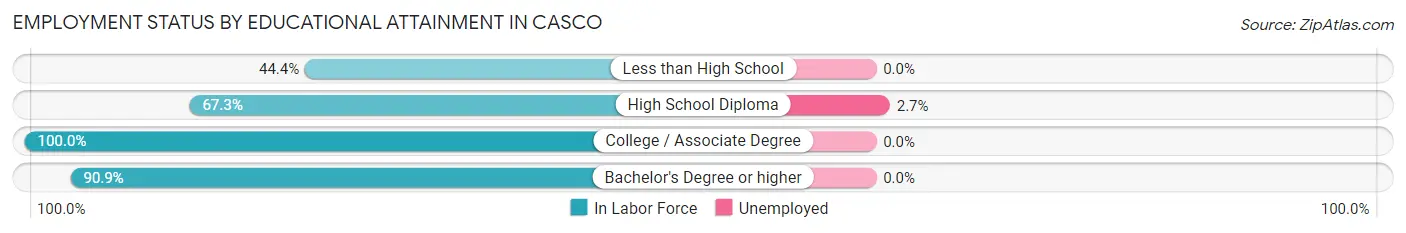
| Educational Attainment | In Labor Force | Unemployed |
| Less than High School | 8 (44.4%) | 0 (0.0%) |
| High School Diploma | 111 (67.3%) | 4 (2.7%) |
| College / Associate Degree | 95 (100.0%) | 0 (0.0%) |
| Bachelor's Degree or higher | 219 (90.9%) | 0 (0.0%) |
| Total | 433 (83.4%) | 4 (0.7%) |
Employment Occupations by Sex in Casco
Management, Business, Science and Arts Occupations
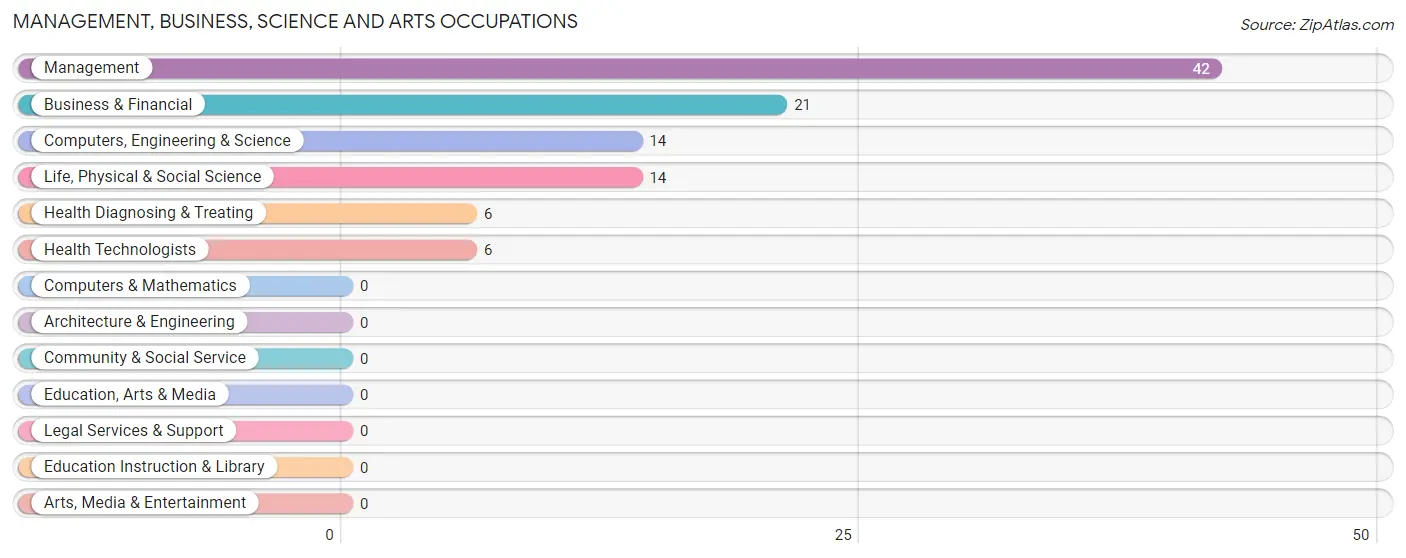
The most common Management, Business, Science and Arts occupations in Casco are Management (42 | 7.6%), Business & Financial (21 | 3.8%), Computers, Engineering & Science (14 | 2.5%), Life, Physical & Social Science (14 | 2.5%), and Health Diagnosing & Treating (6 | 1.1%).
Management, Business, Science and Arts Occupations by Sex
Within the Management, Business, Science and Arts occupations in Casco, the most male-oriented occupations are Computers, Engineering & Science (100.0%), Life, Physical & Social Science (100.0%), and Business & Financial (66.7%), while the most female-oriented occupations are Management (100.0%), Health Diagnosing & Treating (100.0%), and Health Technologists (100.0%).
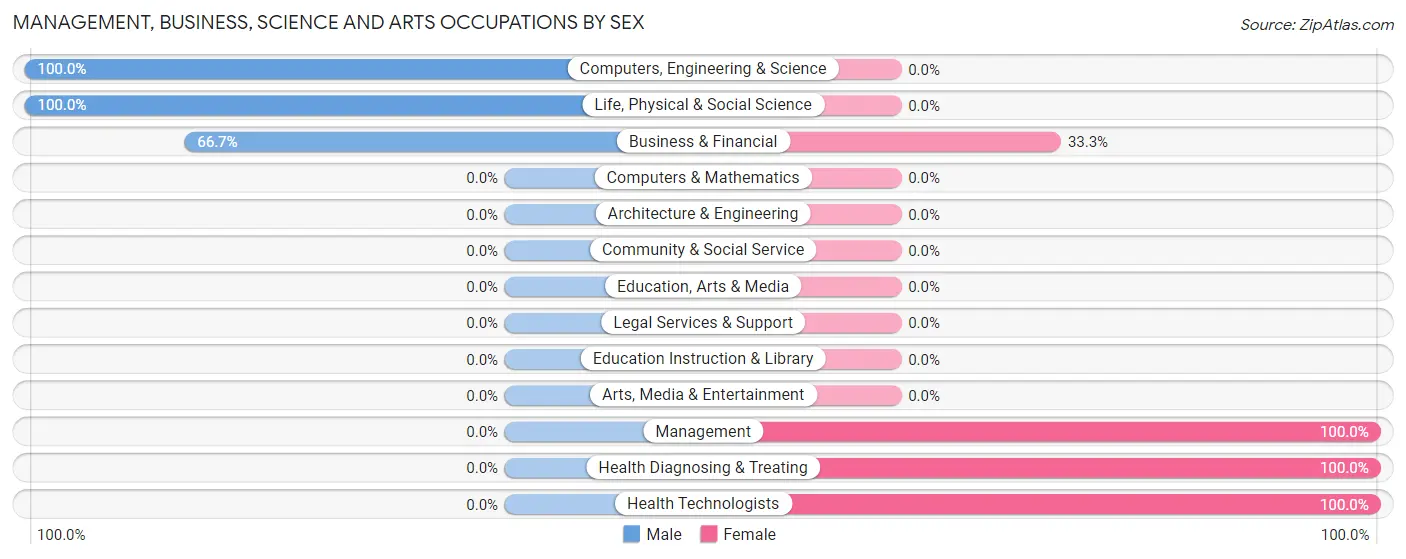
| Occupation | Male | Female |
| Management | 0 (0.0%) | 42 (100.0%) |
| Business & Financial | 14 (66.7%) | 7 (33.3%) |
| Computers, Engineering & Science | 14 (100.0%) | 0 (0.0%) |
| Computers & Mathematics | 0 (0.0%) | 0 (0.0%) |
| Architecture & Engineering | 0 (0.0%) | 0 (0.0%) |
| Life, Physical & Social Science | 14 (100.0%) | 0 (0.0%) |
| Community & Social Service | 0 (0.0%) | 0 (0.0%) |
| Education, Arts & Media | 0 (0.0%) | 0 (0.0%) |
| Legal Services & Support | 0 (0.0%) | 0 (0.0%) |
| Education Instruction & Library | 0 (0.0%) | 0 (0.0%) |
| Arts, Media & Entertainment | 0 (0.0%) | 0 (0.0%) |
| Health Diagnosing & Treating | 0 (0.0%) | 6 (100.0%) |
| Health Technologists | 0 (0.0%) | 6 (100.0%) |
| Total (Category) | 28 (33.7%) | 55 (66.3%) |
| Total (Overall) | 239 (43.4%) | 312 (56.6%) |
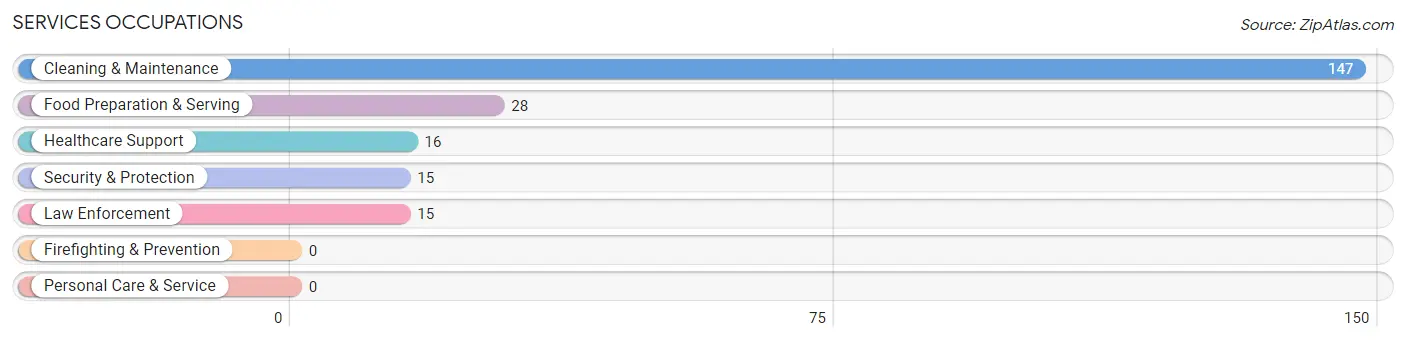
Services Occupations
The most common Services occupations in Casco are Cleaning & Maintenance (147 | 26.7%), Food Preparation & Serving (28 | 5.1%), Healthcare Support (16 | 2.9%), Security & Protection (15 | 2.7%), and Law Enforcement (15 | 2.7%).
Services Occupations by Sex
Within the Services occupations in Casco, the most male-oriented occupations are Food Preparation & Serving (46.4%), and Cleaning & Maintenance (10.2%), while the most female-oriented occupations are Healthcare Support (100.0%), Security & Protection (100.0%), and Law Enforcement (100.0%).
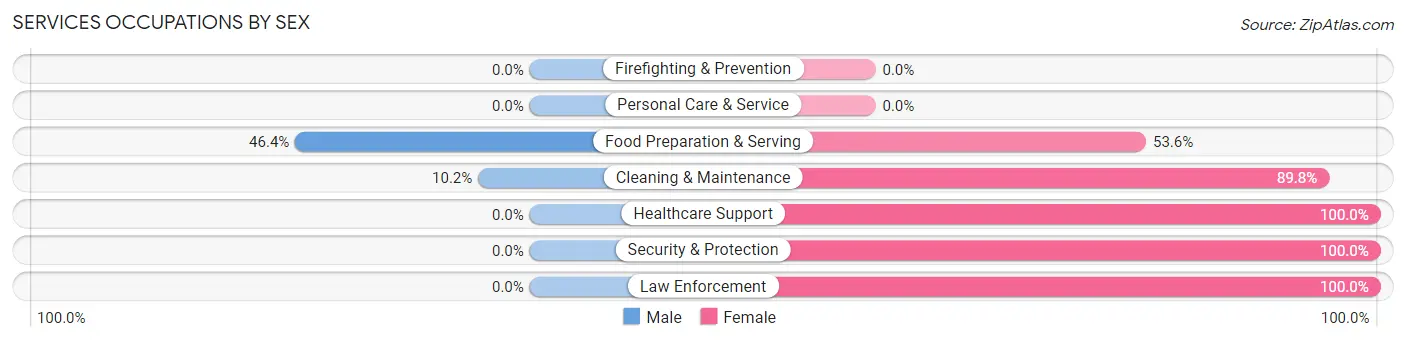
| Occupation | Male | Female |
| Healthcare Support | 0 (0.0%) | 16 (100.0%) |
| Security & Protection | 0 (0.0%) | 15 (100.0%) |
| Firefighting & Prevention | 0 (0.0%) | 0 (0.0%) |
| Law Enforcement | 0 (0.0%) | 15 (100.0%) |
| Food Preparation & Serving | 13 (46.4%) | 15 (53.6%) |
| Cleaning & Maintenance | 15 (10.2%) | 132 (89.8%) |
| Personal Care & Service | 0 (0.0%) | 0 (0.0%) |
| Total (Category) | 28 (13.6%) | 178 (86.4%) |
| Total (Overall) | 239 (43.4%) | 312 (56.6%) |
Sales and Office Occupations
The most common Sales and Office occupations in Casco are Office & Administration (51 | 9.3%), and Sales & Related (31 | 5.6%).

Sales and Office Occupations by Sex

| Occupation | Male | Female |
| Sales & Related | 12 (38.7%) | 19 (61.3%) |
| Office & Administration | 16 (31.4%) | 35 (68.6%) |
| Total (Category) | 28 (34.2%) | 54 (65.8%) |
| Total (Overall) | 239 (43.4%) | 312 (56.6%) |
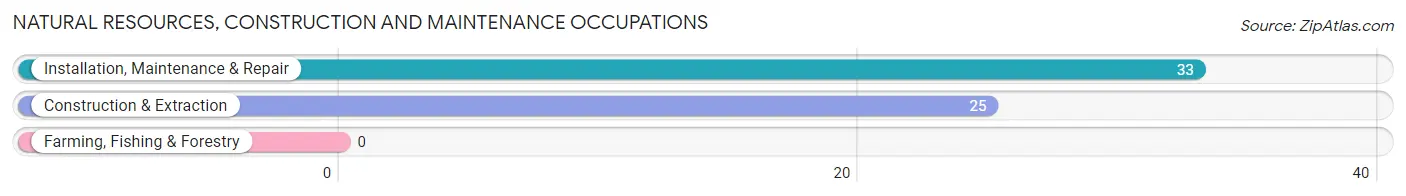
Natural Resources, Construction and Maintenance Occupations
The most common Natural Resources, Construction and Maintenance occupations in Casco are Installation, Maintenance & Repair (33 | 6.0%), and Construction & Extraction (25 | 4.5%).
Natural Resources, Construction and Maintenance Occupations by Sex

| Occupation | Male | Female |
| Farming, Fishing & Forestry | 0 (0.0%) | 0 (0.0%) |
| Construction & Extraction | 25 (100.0%) | 0 (0.0%) |
| Installation, Maintenance & Repair | 22 (66.7%) | 11 (33.3%) |
| Total (Category) | 47 (81.0%) | 11 (19.0%) |
| Total (Overall) | 239 (43.4%) | 312 (56.6%) |
Production, Transportation and Moving Occupations
The most common Production, Transportation and Moving occupations in Casco are Production (66 | 12.0%), and Material Moving (56 | 10.2%).
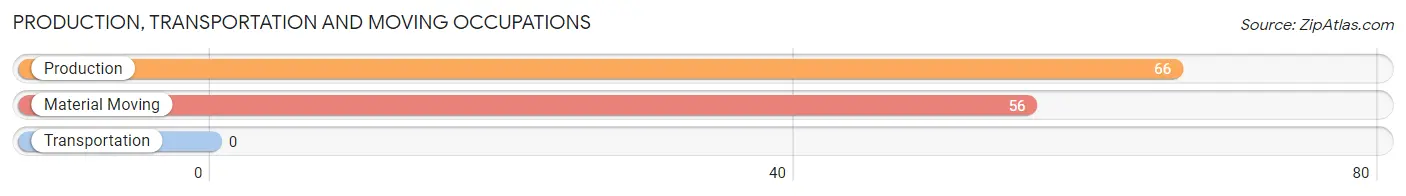
Production, Transportation and Moving Occupations by Sex
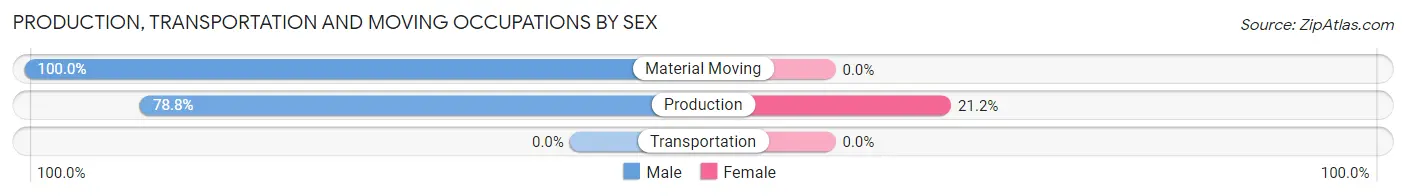
| Occupation | Male | Female |
| Production | 52 (78.8%) | 14 (21.2%) |
| Transportation | 0 (0.0%) | 0 (0.0%) |
| Material Moving | 56 (100.0%) | 0 (0.0%) |
| Total (Category) | 108 (88.5%) | 14 (11.5%) |
| Total (Overall) | 239 (43.4%) | 312 (56.6%) |
Employment Industries by Sex in Casco
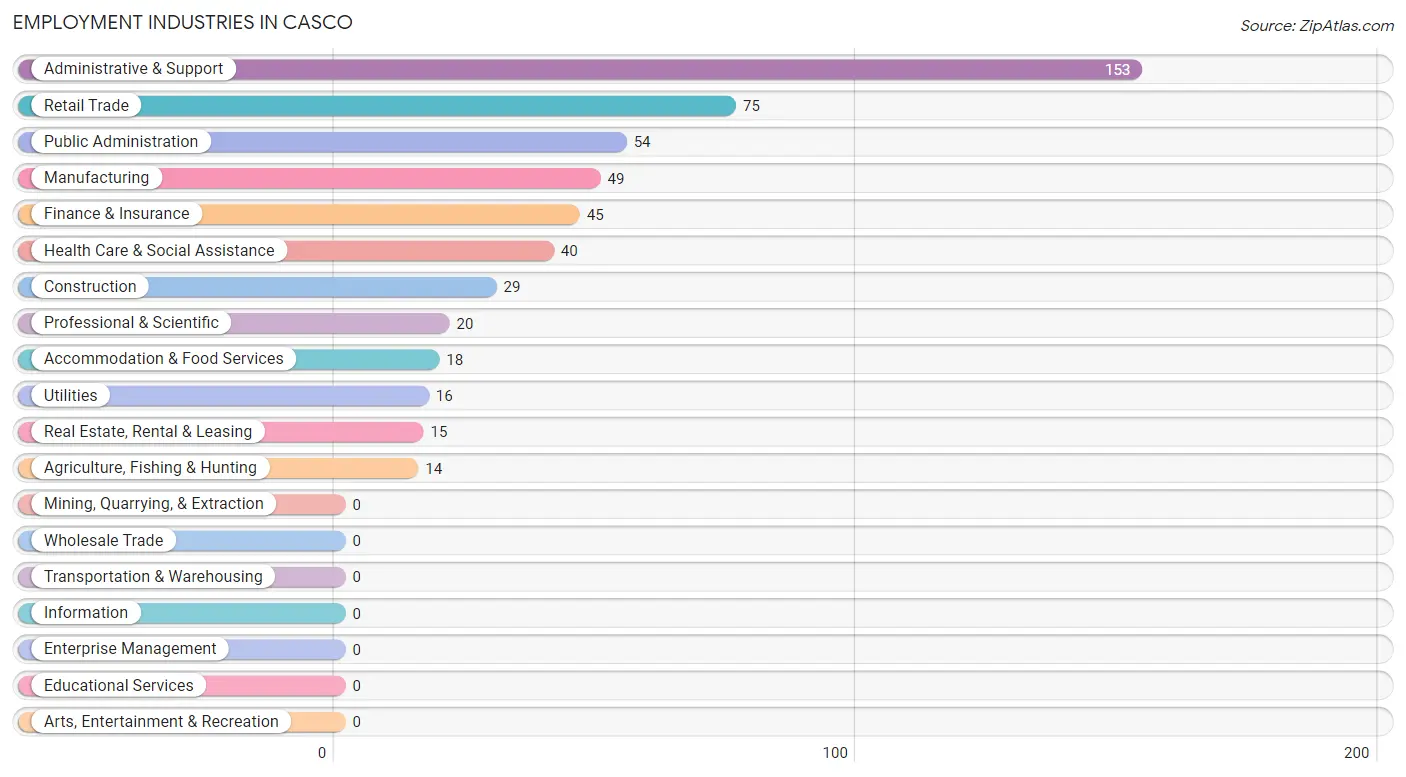
Employment Industries in Casco
The major employment industries in Casco include Administrative & Support (153 | 27.8%), Retail Trade (75 | 13.6%), Public Administration (54 | 9.8%), Manufacturing (49 | 8.9%), and Finance & Insurance (45 | 8.2%).
Employment Industries by Sex in Casco
The Casco industries that see more men than women are Agriculture, Fishing & Hunting (100.0%), Construction (100.0%), and Utilities (100.0%), whereas the industries that tend to have a higher number of women are Public Administration (100.0%), Administrative & Support (86.3%), and Accommodation & Food Services (83.3%).
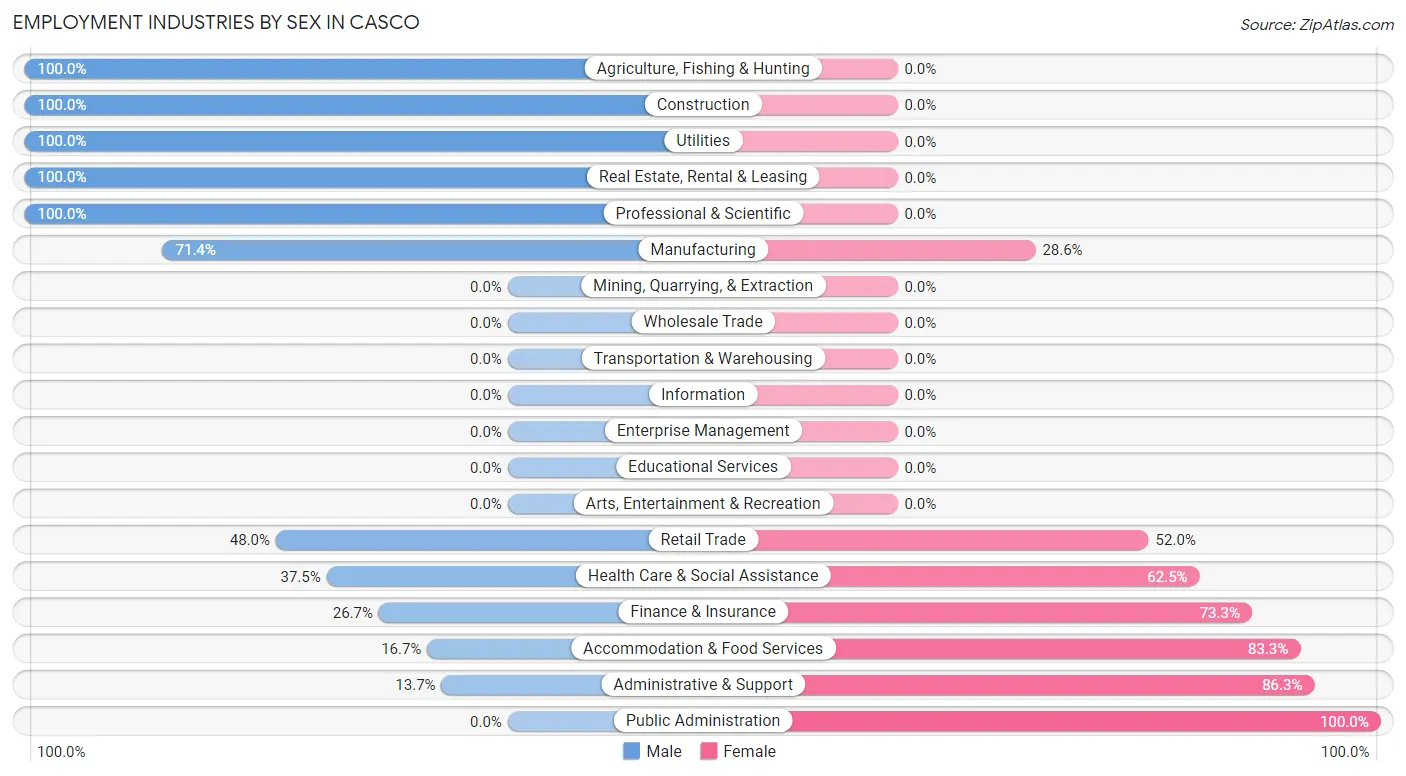
| Industry | Male | Female |
| Agriculture, Fishing & Hunting | 14 (100.0%) | 0 (0.0%) |
| Mining, Quarrying, & Extraction | 0 (0.0%) | 0 (0.0%) |
| Construction | 29 (100.0%) | 0 (0.0%) |
| Manufacturing | 35 (71.4%) | 14 (28.6%) |
| Wholesale Trade | 0 (0.0%) | 0 (0.0%) |
| Retail Trade | 36 (48.0%) | 39 (52.0%) |
| Transportation & Warehousing | 0 (0.0%) | 0 (0.0%) |
| Utilities | 16 (100.0%) | 0 (0.0%) |
| Information | 0 (0.0%) | 0 (0.0%) |
| Finance & Insurance | 12 (26.7%) | 33 (73.3%) |
| Real Estate, Rental & Leasing | 15 (100.0%) | 0 (0.0%) |
| Professional & Scientific | 20 (100.0%) | 0 (0.0%) |
| Enterprise Management | 0 (0.0%) | 0 (0.0%) |
| Administrative & Support | 21 (13.7%) | 132 (86.3%) |
| Educational Services | 0 (0.0%) | 0 (0.0%) |
| Health Care & Social Assistance | 15 (37.5%) | 25 (62.5%) |
| Arts, Entertainment & Recreation | 0 (0.0%) | 0 (0.0%) |
| Accommodation & Food Services | 3 (16.7%) | 15 (83.3%) |
| Public Administration | 0 (0.0%) | 54 (100.0%) |
| Total | 239 (43.4%) | 312 (56.6%) |
Education in Casco
School Enrollment in Casco
The most common levels of schooling among the 73 students in Casco are college / undergraduate (27 | 37.0%), high school (19 | 26.0%), and middle school (14 | 19.2%).
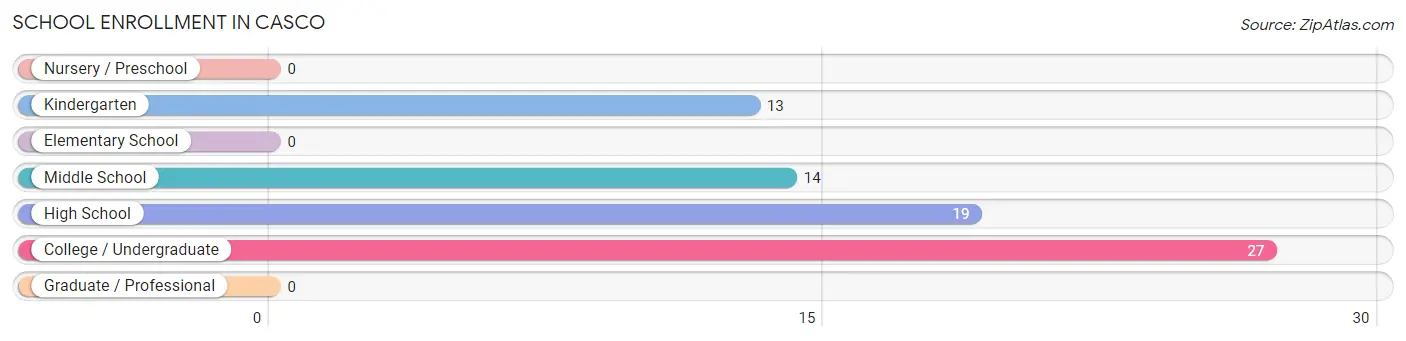
| School Level | # Students | % Students |
| Nursery / Preschool | 0 | 0.0% |
| Kindergarten | 13 | 17.8% |
| Elementary School | 0 | 0.0% |
| Middle School | 14 | 19.2% |
| High School | 19 | 26.0% |
| College / Undergraduate | 27 | 37.0% |
| Graduate / Professional | 0 | 0.0% |
| Total | 73 | 100.0% |
School Enrollment by Age by Funding Source in Casco
Out of a total of 73 students who are enrolled in schools in Casco, 28 (38.4%) attend a private institution, while the remaining 45 (61.6%) are enrolled in public schools. The age group of 10 to 14 year olds has the highest likelihood of being enrolled in private schools, with 14 (100.0% in the age bracket) enrolled. Conversely, the age group of 5 to 9 year old has the lowest likelihood of being enrolled in a private school, with 13 (100.0% in the age bracket) attending a public institution.
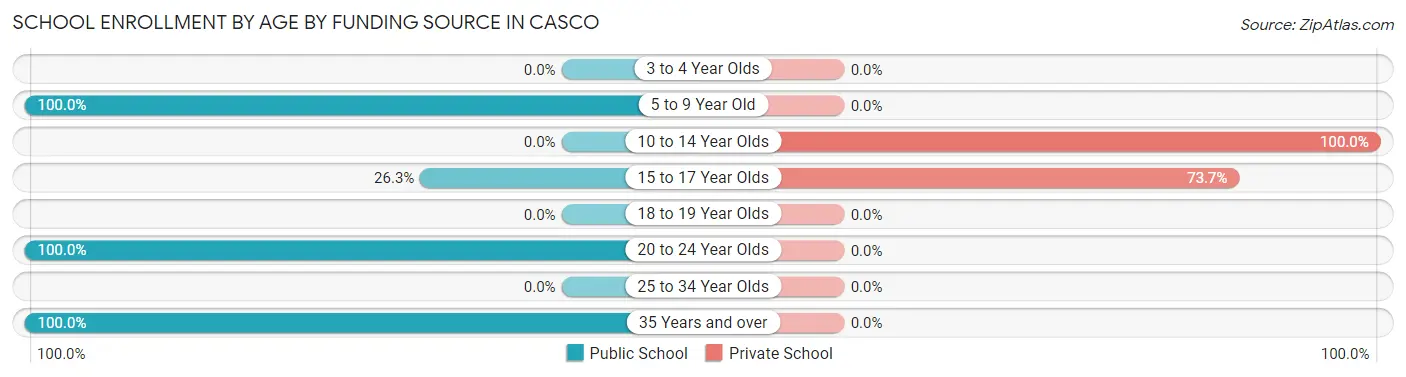
| Age Bracket | Public School | Private School |
| 3 to 4 Year Olds | 0 (0.0%) | 0 (0.0%) |
| 5 to 9 Year Old | 13 (100.0%) | 0 (0.0%) |
| 10 to 14 Year Olds | 0 (0.0%) | 14 (100.0%) |
| 15 to 17 Year Olds | 5 (26.3%) | 14 (73.7%) |
| 18 to 19 Year Olds | 0 (0.0%) | 0 (0.0%) |
| 20 to 24 Year Olds | 18 (100.0%) | 0 (0.0%) |
| 25 to 34 Year Olds | 0 (0.0%) | 0 (0.0%) |
| 35 Years and over | 9 (100.0%) | 0 (0.0%) |
| Total | 45 (61.6%) | 28 (38.4%) |
Educational Attainment by Field of Study in Casco
Science & technology (138 | 50.9%), psychology (29 | 10.7%), physical & health sciences (22 | 8.1%), education (15 | 5.5%), and bio, nature & agricultural (14 | 5.2%) are the most common fields of study among 271 individuals in Casco who have obtained a bachelor's degree or higher.
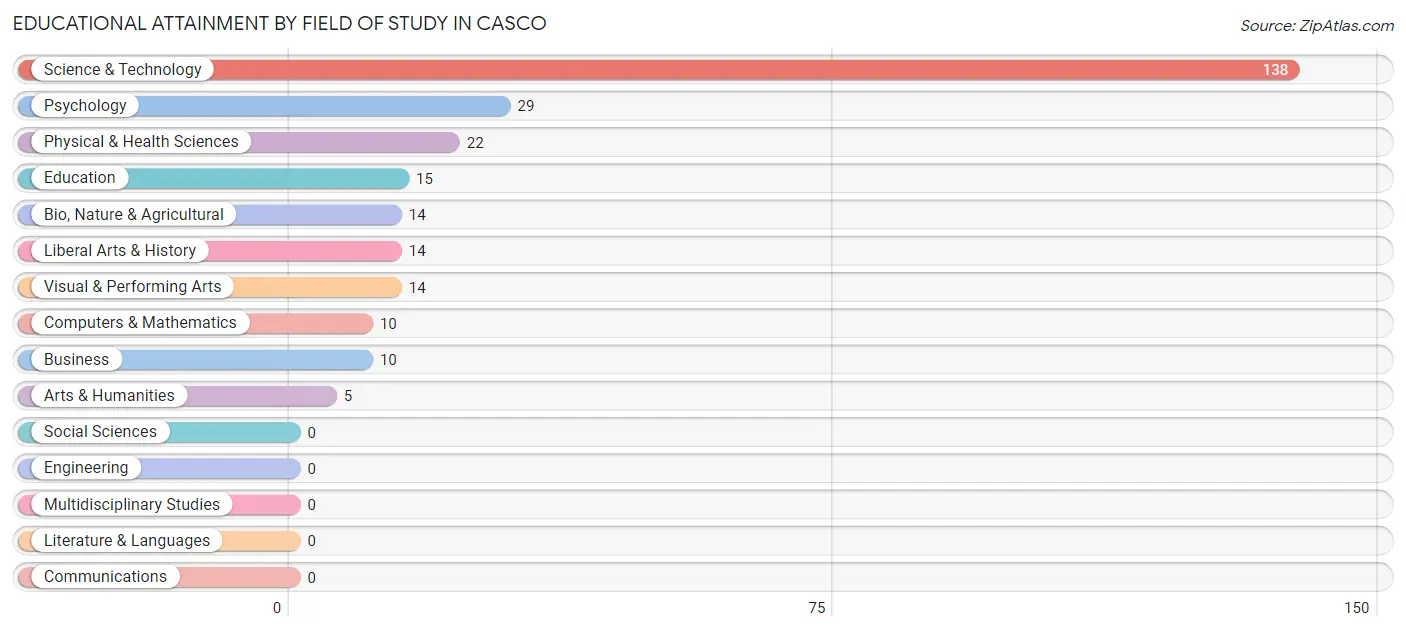
| Field of Study | # Graduates | % Graduates |
| Computers & Mathematics | 10 | 3.7% |
| Bio, Nature & Agricultural | 14 | 5.2% |
| Physical & Health Sciences | 22 | 8.1% |
| Psychology | 29 | 10.7% |
| Social Sciences | 0 | 0.0% |
| Engineering | 0 | 0.0% |
| Multidisciplinary Studies | 0 | 0.0% |
| Science & Technology | 138 | 50.9% |
| Business | 10 | 3.7% |
| Education | 15 | 5.5% |
| Literature & Languages | 0 | 0.0% |
| Liberal Arts & History | 14 | 5.2% |
| Visual & Performing Arts | 14 | 5.2% |
| Communications | 0 | 0.0% |
| Arts & Humanities | 5 | 1.8% |
| Total | 271 | 100.0% |
Transportation & Commute in Casco
Vehicle Availability by Sex in Casco
The most prevalent vehicle ownership categories in Casco are males with 5 or more vehicles (75, accounting for 34.3%) and females with 5 or more vehicles (16, making up 24.0%).
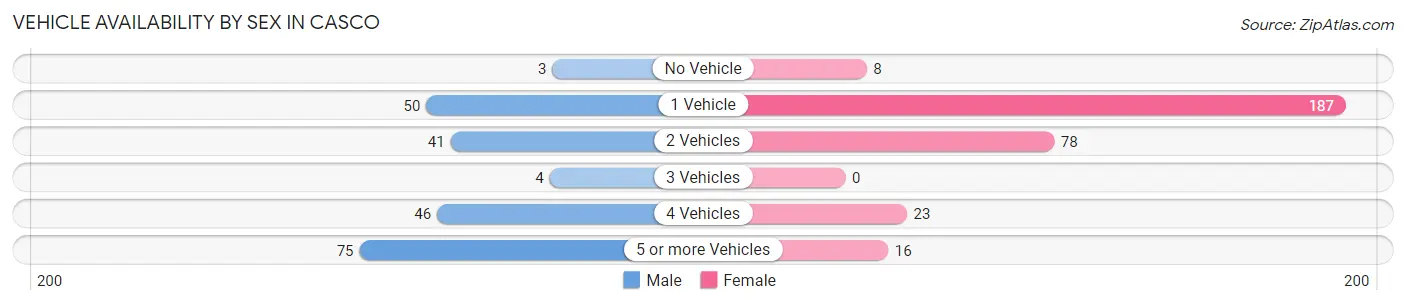
| Vehicles Available | Male | Female |
| No Vehicle | 3 (1.4%) | 8 (2.6%) |
| 1 Vehicle | 50 (22.8%) | 187 (59.9%) |
| 2 Vehicles | 41 (18.7%) | 78 (25.0%) |
| 3 Vehicles | 4 (1.8%) | 0 (0.0%) |
| 4 Vehicles | 46 (21.0%) | 23 (7.4%) |
| 5 or more Vehicles | 75 (34.3%) | 16 (5.1%) |
| Total | 219 (100.0%) | 312 (100.0%) |
Commute Time in Casco
The most frequently occuring commute durations in Casco are 45 to 59 minutes (100 commuters, 29.9%), 60 to 89 minutes (48 commuters, 14.4%), and 15 to 19 minutes (42 commuters, 12.6%).
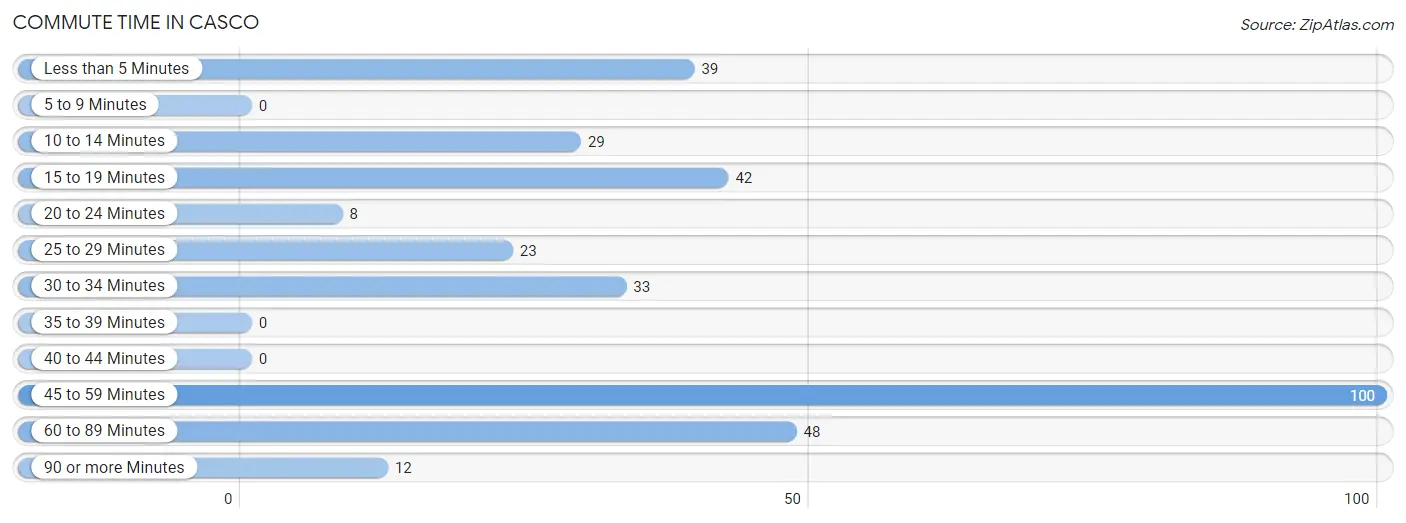
| Commute Time | # Commuters | % Commuters |
| Less than 5 Minutes | 39 | 11.7% |
| 5 to 9 Minutes | 0 | 0.0% |
| 10 to 14 Minutes | 29 | 8.7% |
| 15 to 19 Minutes | 42 | 12.6% |
| 20 to 24 Minutes | 8 | 2.4% |
| 25 to 29 Minutes | 23 | 6.9% |
| 30 to 34 Minutes | 33 | 9.9% |
| 35 to 39 Minutes | 0 | 0.0% |
| 40 to 44 Minutes | 0 | 0.0% |
| 45 to 59 Minutes | 100 | 29.9% |
| 60 to 89 Minutes | 48 | 14.4% |
| 90 or more Minutes | 12 | 3.6% |
Commute Time by Sex in Casco
The most common commute times in Casco are 45 to 59 minutes (78 commuters, 42.4%) for males and 60 to 89 minutes (40 commuters, 26.7%) for females.
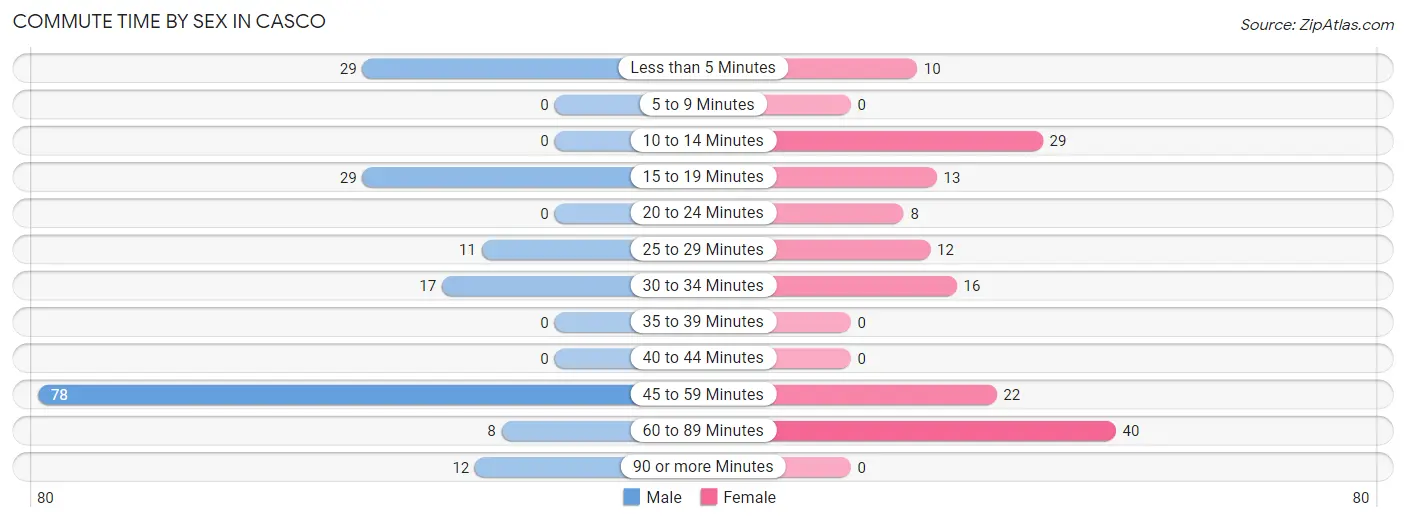
| Commute Time | Male | Female |
| Less than 5 Minutes | 29 (15.8%) | 10 (6.7%) |
| 5 to 9 Minutes | 0 (0.0%) | 0 (0.0%) |
| 10 to 14 Minutes | 0 (0.0%) | 29 (19.3%) |
| 15 to 19 Minutes | 29 (15.8%) | 13 (8.7%) |
| 20 to 24 Minutes | 0 (0.0%) | 8 (5.3%) |
| 25 to 29 Minutes | 11 (6.0%) | 12 (8.0%) |
| 30 to 34 Minutes | 17 (9.2%) | 16 (10.7%) |
| 35 to 39 Minutes | 0 (0.0%) | 0 (0.0%) |
| 40 to 44 Minutes | 0 (0.0%) | 0 (0.0%) |
| 45 to 59 Minutes | 78 (42.4%) | 22 (14.7%) |
| 60 to 89 Minutes | 8 (4.3%) | 40 (26.7%) |
| 90 or more Minutes | 12 (6.5%) | 0 (0.0%) |
Time of Departure to Work by Sex in Casco
The most frequent times of departure to work in Casco are 6:30 AM to 6:59 AM (63, 34.2%) for males and 6:00 AM to 6:29 AM (48, 32.0%) for females.
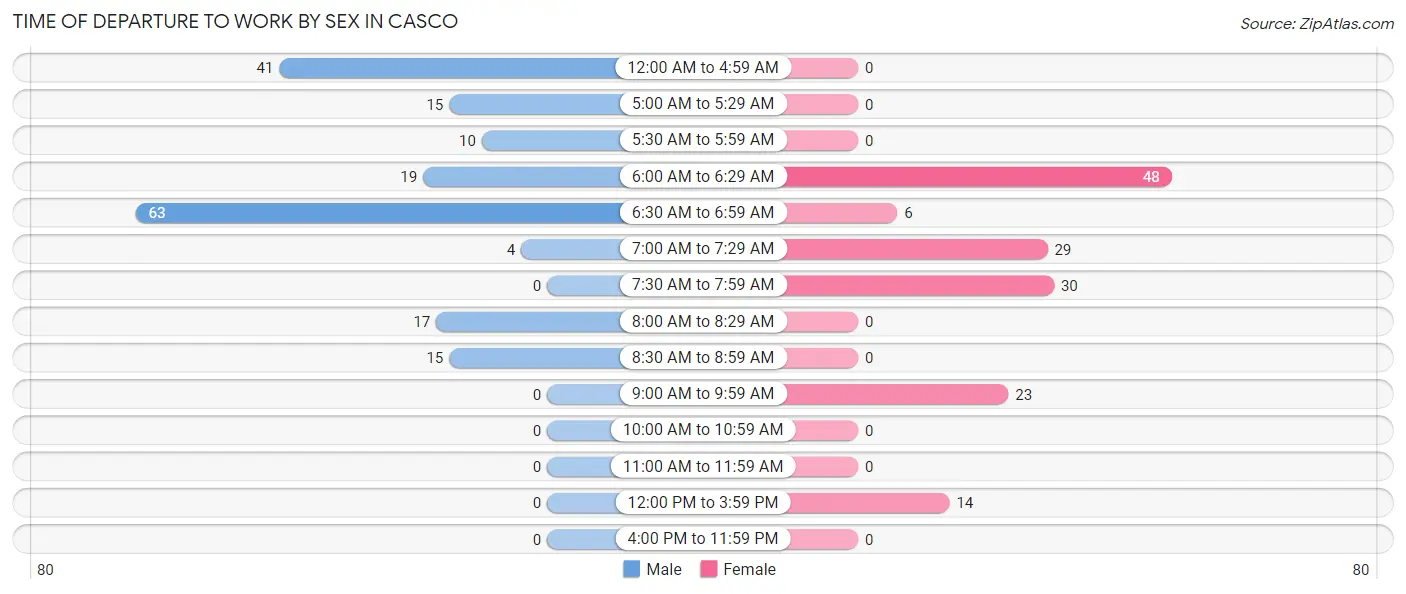
| Time of Departure | Male | Female |
| 12:00 AM to 4:59 AM | 41 (22.3%) | 0 (0.0%) |
| 5:00 AM to 5:29 AM | 15 (8.2%) | 0 (0.0%) |
| 5:30 AM to 5:59 AM | 10 (5.4%) | 0 (0.0%) |
| 6:00 AM to 6:29 AM | 19 (10.3%) | 48 (32.0%) |
| 6:30 AM to 6:59 AM | 63 (34.2%) | 6 (4.0%) |
| 7:00 AM to 7:29 AM | 4 (2.2%) | 29 (19.3%) |
| 7:30 AM to 7:59 AM | 0 (0.0%) | 30 (20.0%) |
| 8:00 AM to 8:29 AM | 17 (9.2%) | 0 (0.0%) |
| 8:30 AM to 8:59 AM | 15 (8.2%) | 0 (0.0%) |
| 9:00 AM to 9:59 AM | 0 (0.0%) | 23 (15.3%) |
| 10:00 AM to 10:59 AM | 0 (0.0%) | 0 (0.0%) |
| 11:00 AM to 11:59 AM | 0 (0.0%) | 0 (0.0%) |
| 12:00 PM to 3:59 PM | 0 (0.0%) | 14 (9.3%) |
| 4:00 PM to 11:59 PM | 0 (0.0%) | 0 (0.0%) |
| Total | 184 (100.0%) | 150 (100.0%) |
Housing Occupancy in Casco
Occupancy by Ownership in Casco
Of the total 439 dwellings in Casco, owner-occupied units account for 401 (91.3%), while renter-occupied units make up 38 (8.7%).
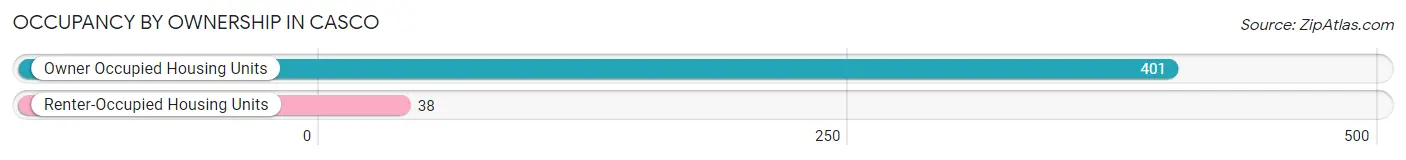
| Occupancy | # Housing Units | % Housing Units |
| Owner Occupied Housing Units | 401 | 91.3% |
| Renter-Occupied Housing Units | 38 | 8.7% |
| Total Occupied Housing Units | 439 | 100.0% |
Occupancy by Household Size in Casco
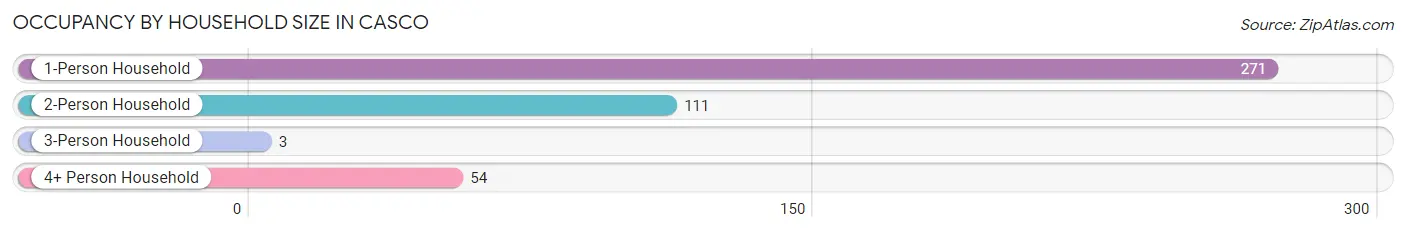
| Household Size | # Housing Units | % Housing Units |
| 1-Person Household | 271 | 61.7% |
| 2-Person Household | 111 | 25.3% |
| 3-Person Household | 3 | 0.7% |
| 4+ Person Household | 54 | 12.3% |
| Total Housing Units | 439 | 100.0% |
Occupancy by Ownership by Household Size in Casco
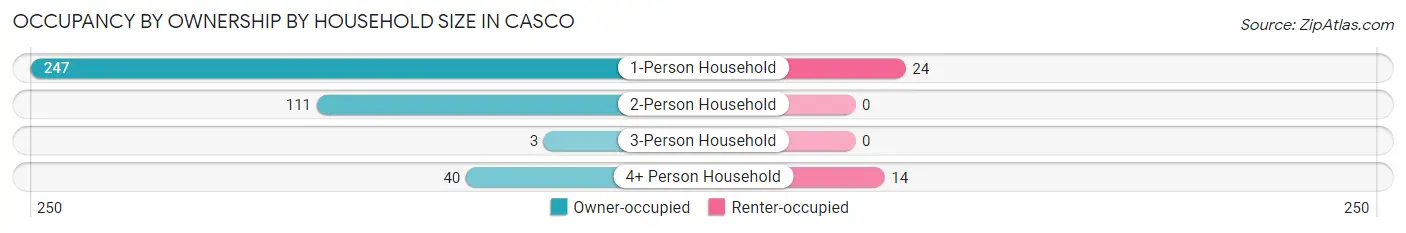
| Household Size | Owner-occupied | Renter-occupied |
| 1-Person Household | 247 (91.1%) | 24 (8.9%) |
| 2-Person Household | 111 (100.0%) | 0 (0.0%) |
| 3-Person Household | 3 (100.0%) | 0 (0.0%) |
| 4+ Person Household | 40 (74.1%) | 14 (25.9%) |
| Total Housing Units | 401 (91.3%) | 38 (8.7%) |
Occupancy by Educational Attainment in Casco
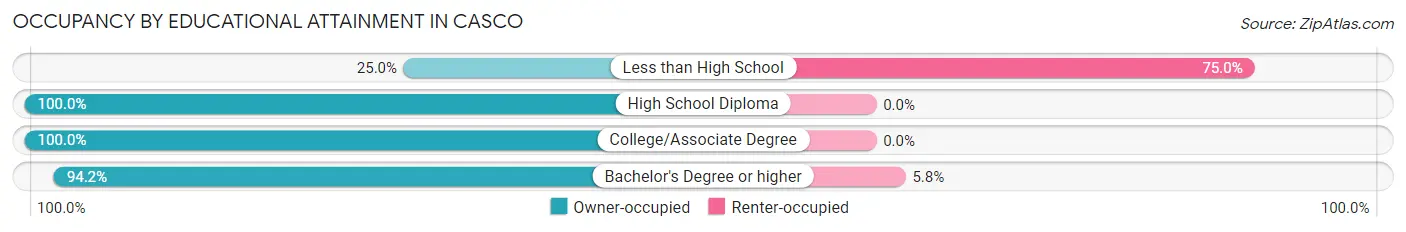
| Household Size | Owner-occupied | Renter-occupied |
| Less than High School | 8 (25.0%) | 24 (75.0%) |
| High School Diploma | 42 (100.0%) | 0 (0.0%) |
| College/Associate Degree | 124 (100.0%) | 0 (0.0%) |
| Bachelor's Degree or higher | 227 (94.2%) | 14 (5.8%) |
Occupancy by Age of Householder in Casco
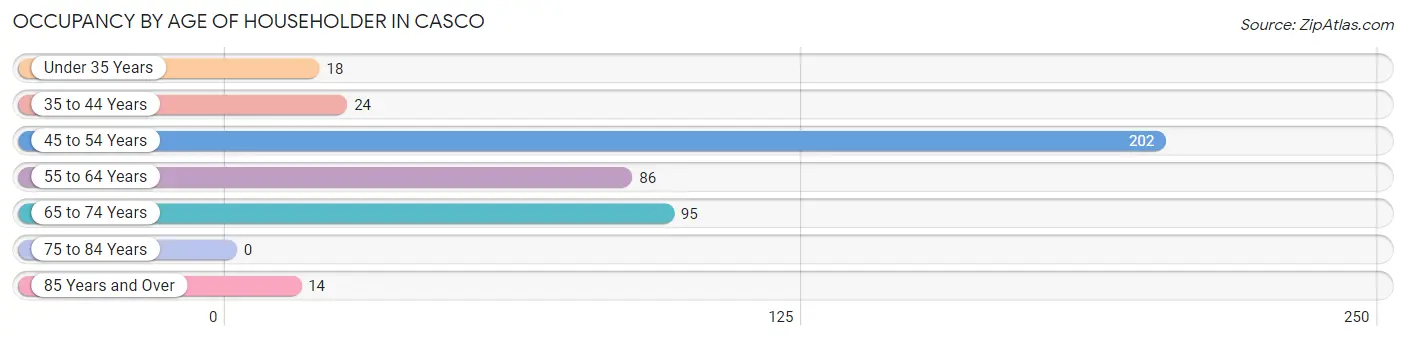
| Age Bracket | # Households | % Households |
| Under 35 Years | 18 | 4.1% |
| 35 to 44 Years | 24 | 5.5% |
| 45 to 54 Years | 202 | 46.0% |
| 55 to 64 Years | 86 | 19.6% |
| 65 to 74 Years | 95 | 21.6% |
| 75 to 84 Years | 0 | 0.0% |
| 85 Years and Over | 14 | 3.2% |
| Total | 439 | 100.0% |
Housing Finances in Casco
Median Income by Occupancy in Casco
| Occupancy Type | # Households | Median Income |
| Owner-Occupied | 401 (91.3%) | $0 |
| Renter-Occupied | 38 (8.7%) | $0 |
| Average | 439 (100.0%) | $0 |
Occupancy by Householder Income Bracket in Casco
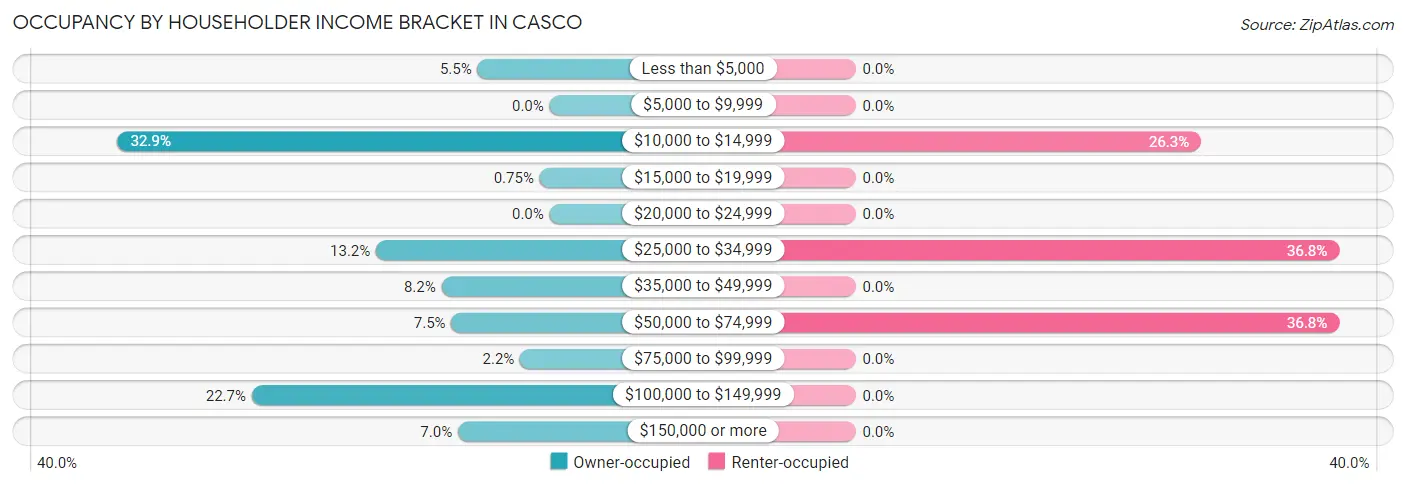
| Income Bracket | Owner-occupied | Renter-occupied |
| Less than $5,000 | 22 (5.5%) | 0 (0.0%) |
| $5,000 to $9,999 | 0 (0.0%) | 0 (0.0%) |
| $10,000 to $14,999 | 132 (32.9%) | 10 (26.3%) |
| $15,000 to $19,999 | 3 (0.7%) | 0 (0.0%) |
| $20,000 to $24,999 | 0 (0.0%) | 0 (0.0%) |
| $25,000 to $34,999 | 53 (13.2%) | 14 (36.8%) |
| $35,000 to $49,999 | 33 (8.2%) | 0 (0.0%) |
| $50,000 to $74,999 | 30 (7.5%) | 14 (36.8%) |
| $75,000 to $99,999 | 9 (2.2%) | 0 (0.0%) |
| $100,000 to $149,999 | 91 (22.7%) | 0 (0.0%) |
| $150,000 or more | 28 (7.0%) | 0 (0.0%) |
| Total | 401 (100.0%) | 38 (100.0%) |
Monthly Housing Cost Tiers in Casco
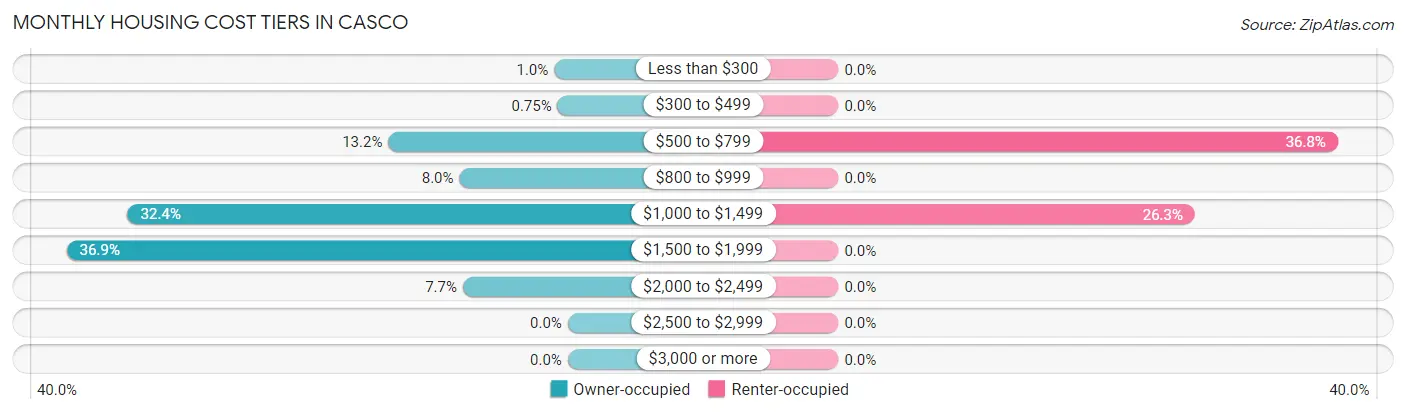
| Monthly Cost | Owner-occupied | Renter-occupied |
| Less than $300 | 4 (1.0%) | 0 (0.0%) |
| $300 to $499 | 3 (0.7%) | 0 (0.0%) |
| $500 to $799 | 53 (13.2%) | 14 (36.8%) |
| $800 to $999 | 32 (8.0%) | 0 (0.0%) |
| $1,000 to $1,499 | 130 (32.4%) | 10 (26.3%) |
| $1,500 to $1,999 | 148 (36.9%) | 0 (0.0%) |
| $2,000 to $2,499 | 31 (7.7%) | 0 (0.0%) |
| $2,500 to $2,999 | 0 (0.0%) | 0 (0.0%) |
| $3,000 or more | 0 (0.0%) | 0 (0.0%) |
| Total | 401 (100.0%) | 38 (100.0%) |
Physical Housing Characteristics in Casco
Housing Structures in Casco
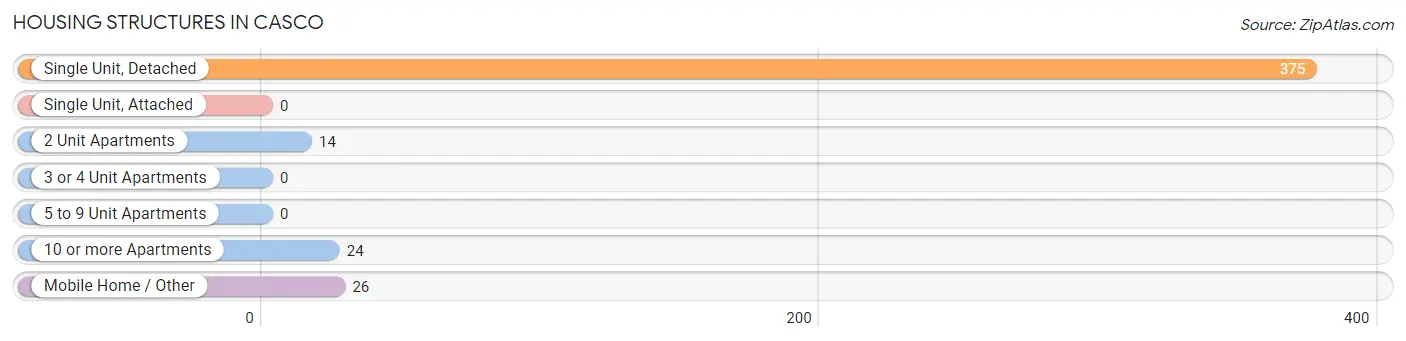
| Structure Type | # Housing Units | % Housing Units |
| Single Unit, Detached | 375 | 85.4% |
| Single Unit, Attached | 0 | 0.0% |
| 2 Unit Apartments | 14 | 3.2% |
| 3 or 4 Unit Apartments | 0 | 0.0% |
| 5 to 9 Unit Apartments | 0 | 0.0% |
| 10 or more Apartments | 24 | 5.5% |
| Mobile Home / Other | 26 | 5.9% |
| Total | 439 | 100.0% |
Housing Structures by Occupancy in Casco
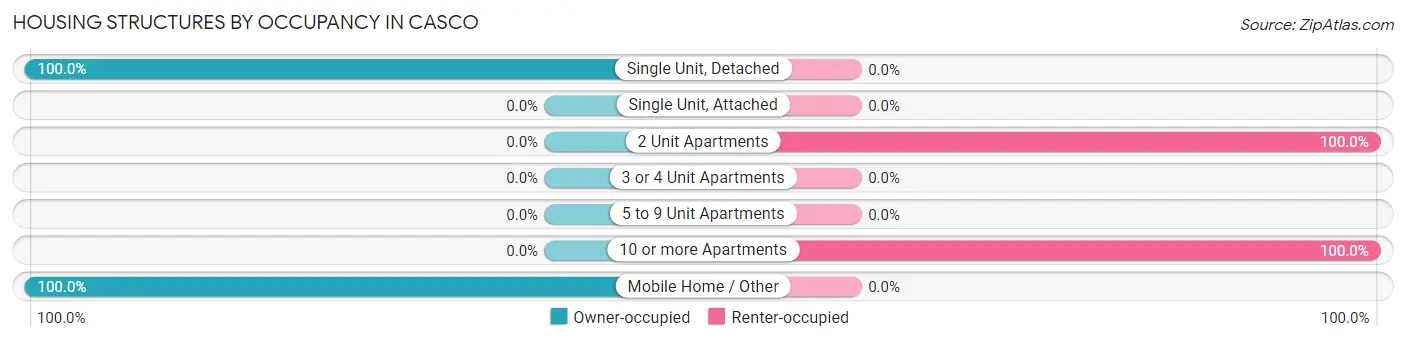
| Structure Type | Owner-occupied | Renter-occupied |
| Single Unit, Detached | 375 (100.0%) | 0 (0.0%) |
| Single Unit, Attached | 0 (0.0%) | 0 (0.0%) |
| 2 Unit Apartments | 0 (0.0%) | 14 (100.0%) |
| 3 or 4 Unit Apartments | 0 (0.0%) | 0 (0.0%) |
| 5 to 9 Unit Apartments | 0 (0.0%) | 0 (0.0%) |
| 10 or more Apartments | 0 (0.0%) | 24 (100.0%) |
| Mobile Home / Other | 26 (100.0%) | 0 (0.0%) |
| Total | 401 (91.3%) | 38 (8.7%) |
Housing Structures by Number of Rooms in Casco
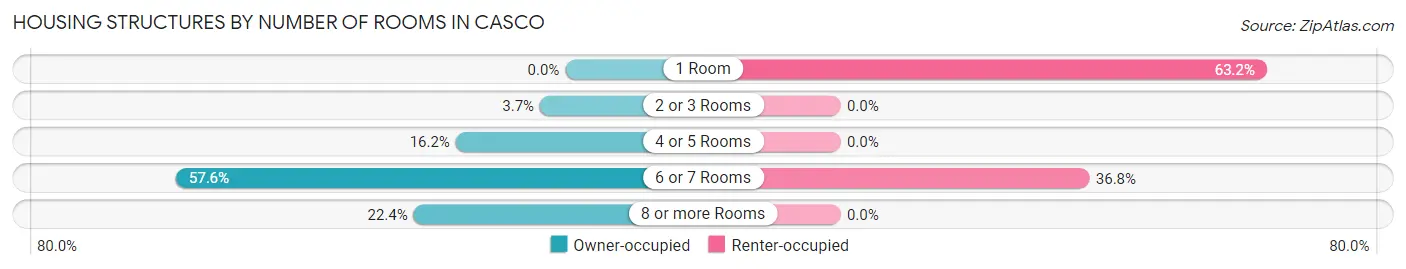
| Number of Rooms | Owner-occupied | Renter-occupied |
| 1 Room | 0 (0.0%) | 24 (63.2%) |
| 2 or 3 Rooms | 15 (3.7%) | 0 (0.0%) |
| 4 or 5 Rooms | 65 (16.2%) | 0 (0.0%) |
| 6 or 7 Rooms | 231 (57.6%) | 14 (36.8%) |
| 8 or more Rooms | 90 (22.4%) | 0 (0.0%) |
| Total | 401 (100.0%) | 38 (100.0%) |
Housing Structure by Heating Type in Casco
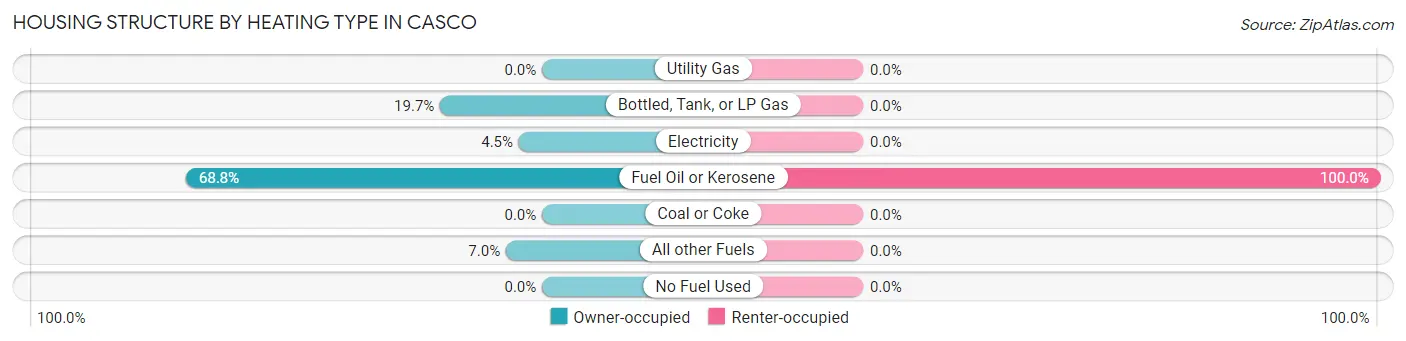
| Heating Type | Owner-occupied | Renter-occupied |
| Utility Gas | 0 (0.0%) | 0 (0.0%) |
| Bottled, Tank, or LP Gas | 79 (19.7%) | 0 (0.0%) |
| Electricity | 18 (4.5%) | 0 (0.0%) |
| Fuel Oil or Kerosene | 276 (68.8%) | 38 (100.0%) |
| Coal or Coke | 0 (0.0%) | 0 (0.0%) |
| All other Fuels | 28 (7.0%) | 0 (0.0%) |
| No Fuel Used | 0 (0.0%) | 0 (0.0%) |
| Total | 401 (100.0%) | 38 (100.0%) |
Household Vehicle Usage in Casco
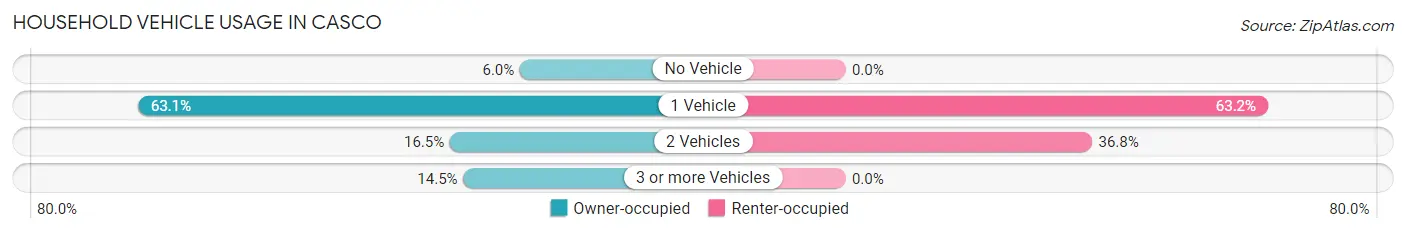
| Vehicles per Household | Owner-occupied | Renter-occupied |
| No Vehicle | 24 (6.0%) | 0 (0.0%) |
| 1 Vehicle | 253 (63.1%) | 24 (63.2%) |
| 2 Vehicles | 66 (16.5%) | 14 (36.8%) |
| 3 or more Vehicles | 58 (14.5%) | 0 (0.0%) |
| Total | 401 (100.0%) | 38 (100.0%) |
Real Estate & Mortgages in Casco
Real Estate and Mortgage Overview in Casco
| Characteristic | Without Mortgage | With Mortgage |
| Housing Units | 107 | 294 |
| Median Property Value | $240,500 | $190,400 |
| Median Household Income | $29,957 | $28 |
| Monthly Housing Costs | $597 | $0 |
| Real Estate Taxes | $3,402 | $0 |
Property Value by Mortgage Status in Casco
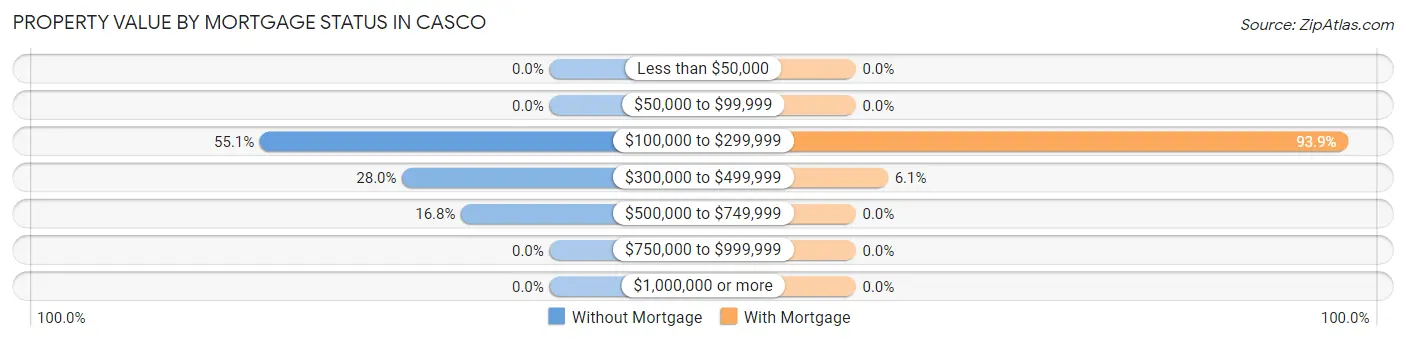
| Property Value | Without Mortgage | With Mortgage |
| Less than $50,000 | 0 (0.0%) | 0 (0.0%) |
| $50,000 to $99,999 | 0 (0.0%) | 0 (0.0%) |
| $100,000 to $299,999 | 59 (55.1%) | 276 (93.9%) |
| $300,000 to $499,999 | 30 (28.0%) | 18 (6.1%) |
| $500,000 to $749,999 | 18 (16.8%) | 0 (0.0%) |
| $750,000 to $999,999 | 0 (0.0%) | 0 (0.0%) |
| $1,000,000 or more | 0 (0.0%) | 0 (0.0%) |
| Total | 107 (100.0%) | 294 (100.0%) |
Household Income by Mortgage Status in Casco
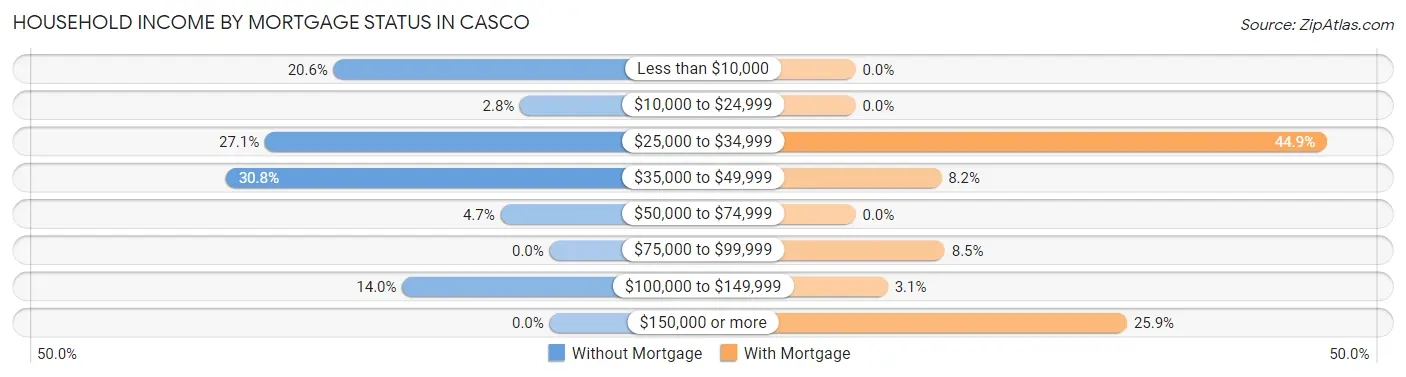
| Household Income | Without Mortgage | With Mortgage |
| Less than $10,000 | 22 (20.6%) | 0 (0.0%) |
| $10,000 to $24,999 | 3 (2.8%) | 0 (0.0%) |
| $25,000 to $34,999 | 29 (27.1%) | 132 (44.9%) |
| $35,000 to $49,999 | 33 (30.8%) | 24 (8.2%) |
| $50,000 to $74,999 | 5 (4.7%) | 0 (0.0%) |
| $75,000 to $99,999 | 0 (0.0%) | 25 (8.5%) |
| $100,000 to $149,999 | 15 (14.0%) | 9 (3.1%) |
| $150,000 or more | 0 (0.0%) | 76 (25.9%) |
| Total | 107 (100.0%) | 294 (100.0%) |
Property Value to Household Income Ratio in Casco
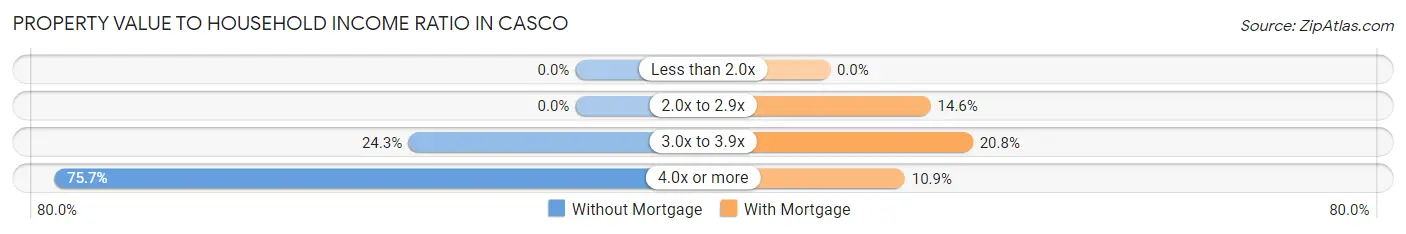
| Value-to-Income Ratio | Without Mortgage | With Mortgage |
| Less than 2.0x | 0 (0.0%) | 0 (0.0%) |
| 2.0x to 2.9x | 0 (0.0%) | 43 (14.6%) |
| 3.0x to 3.9x | 26 (24.3%) | 61 (20.7%) |
| 4.0x or more | 81 (75.7%) | 32 (10.9%) |
| Total | 107 (100.0%) | 294 (100.0%) |
Real Estate Taxes by Mortgage Status in Casco

| Property Taxes | Without Mortgage | With Mortgage |
| Less than $800 | 0 (0.0%) | 0 (0.0%) |
| $800 to $1,499 | 0 (0.0%) | 0 (0.0%) |
| $800 to $1,499 | 107 (100.0%) | 0 (0.0%) |
| Total | 107 (100.0%) | 294 (100.0%) |
Health & Disability in Casco
Health Insurance Coverage by Age in Casco
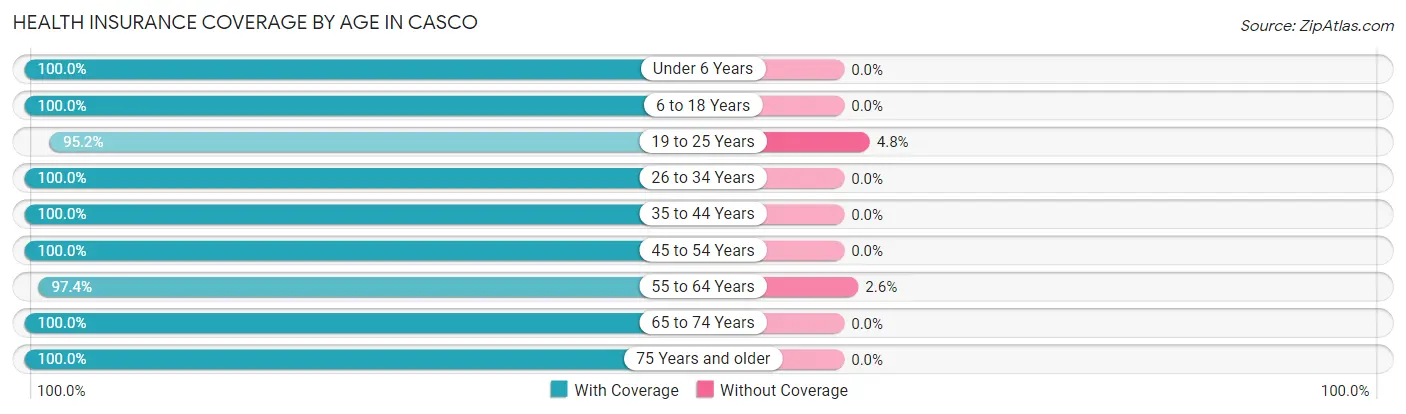
| Age Bracket | With Coverage | Without Coverage |
| Under 6 Years | 28 (100.0%) | 0 (0.0%) |
| 6 to 18 Years | 28 (100.0%) | 0 (0.0%) |
| 19 to 25 Years | 60 (95.2%) | 3 (4.8%) |
| 26 to 34 Years | 75 (100.0%) | 0 (0.0%) |
| 35 to 44 Years | 51 (100.0%) | 0 (0.0%) |
| 45 to 54 Years | 241 (100.0%) | 0 (0.0%) |
| 55 to 64 Years | 148 (97.4%) | 4 (2.6%) |
| 65 to 74 Years | 114 (100.0%) | 0 (0.0%) |
| 75 Years and older | 14 (100.0%) | 0 (0.0%) |
| Total | 759 (99.1%) | 7 (0.9%) |
Health Insurance Coverage by Citizenship Status in Casco

| Citizenship Status | With Coverage | Without Coverage |
| Native Born | 28 (100.0%) | 0 (0.0%) |
| Foreign Born, Citizen | 28 (100.0%) | 0 (0.0%) |
| Foreign Born, not a Citizen | 60 (95.2%) | 3 (4.8%) |
Health Insurance Coverage by Household Income in Casco
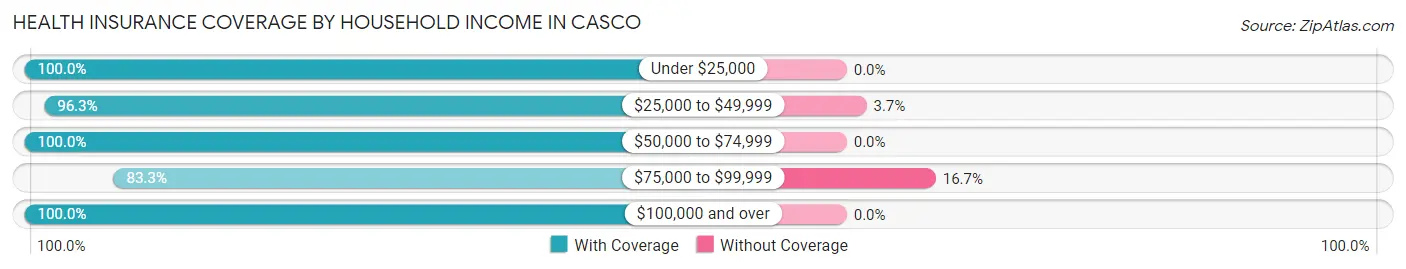
| Household Income | With Coverage | Without Coverage |
| Under $25,000 | 167 (100.0%) | 0 (0.0%) |
| $25,000 to $49,999 | 104 (96.3%) | 4 (3.7%) |
| $50,000 to $74,999 | 117 (100.0%) | 0 (0.0%) |
| $75,000 to $99,999 | 15 (83.3%) | 3 (16.7%) |
| $100,000 and over | 353 (100.0%) | 0 (0.0%) |
Public vs Private Health Insurance Coverage by Age in Casco
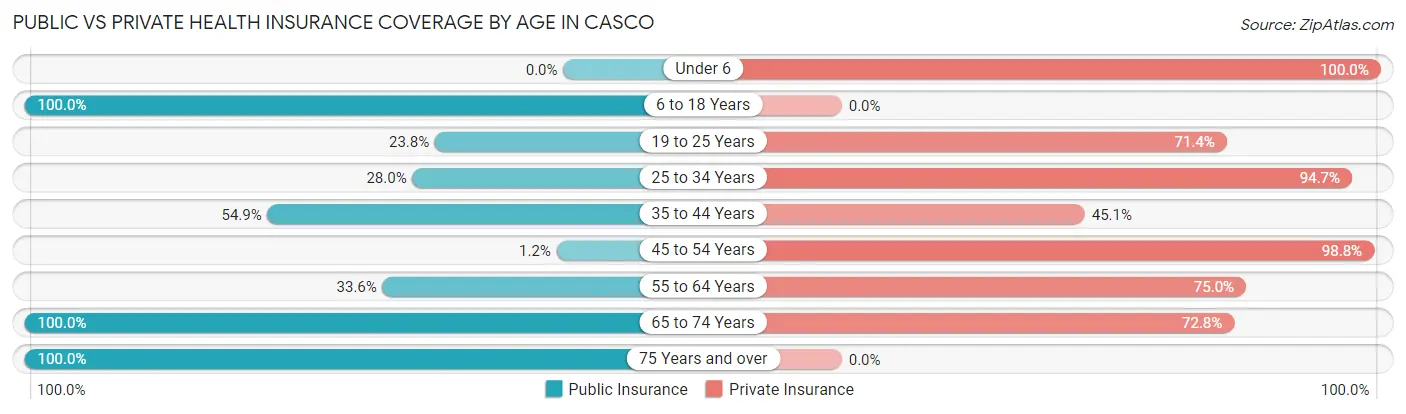
| Age Bracket | Public Insurance | Private Insurance |
| Under 6 | 0 (0.0%) | 28 (100.0%) |
| 6 to 18 Years | 28 (100.0%) | 0 (0.0%) |
| 19 to 25 Years | 15 (23.8%) | 45 (71.4%) |
| 25 to 34 Years | 21 (28.0%) | 71 (94.7%) |
| 35 to 44 Years | 28 (54.9%) | 23 (45.1%) |
| 45 to 54 Years | 3 (1.2%) | 238 (98.8%) |
| 55 to 64 Years | 51 (33.6%) | 114 (75.0%) |
| 65 to 74 Years | 114 (100.0%) | 83 (72.8%) |
| 75 Years and over | 14 (100.0%) | 0 (0.0%) |
| Total | 274 (35.8%) | 602 (78.6%) |
Disability Status by Sex by Age in Casco
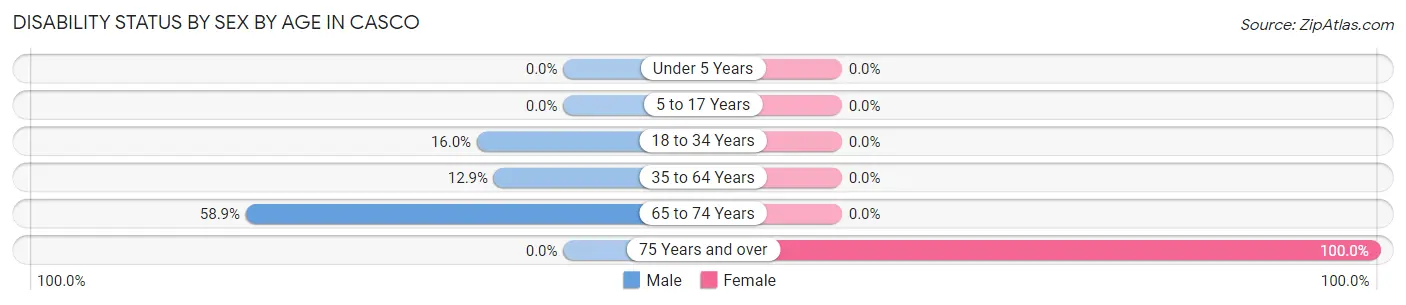
| Age Bracket | Male | Female |
| Under 5 Years | 0 (0.0%) | 0 (0.0%) |
| 5 to 17 Years | 0 (0.0%) | 0 (0.0%) |
| 18 to 34 Years | 17 (16.0%) | 0 (0.0%) |
| 35 to 64 Years | 20 (12.9%) | 0 (0.0%) |
| 65 to 74 Years | 33 (58.9%) | 0 (0.0%) |
| 75 Years and over | 0 (0.0%) | 14 (100.0%) |
Disability Class by Sex by Age in Casco
Disability Class: Hearing Difficulty
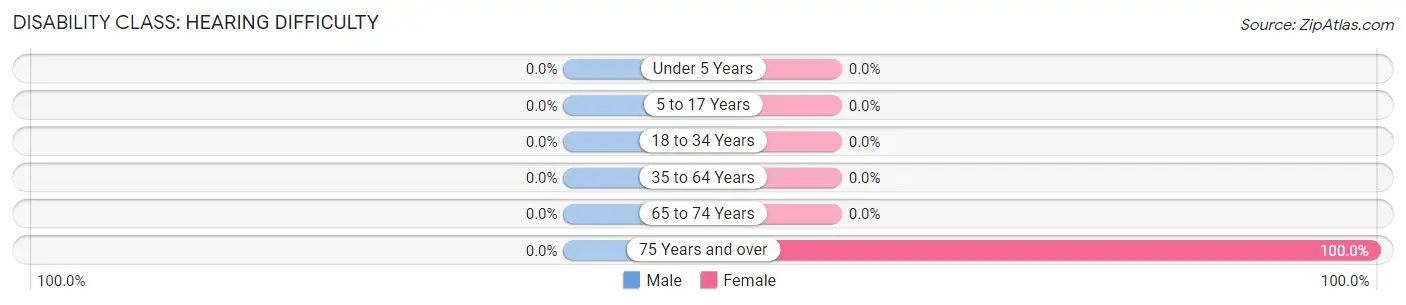
| Age Bracket | Male | Female |
| Under 5 Years | 0 (0.0%) | 0 (0.0%) |
| 5 to 17 Years | 0 (0.0%) | 0 (0.0%) |
| 18 to 34 Years | 0 (0.0%) | 0 (0.0%) |
| 35 to 64 Years | 0 (0.0%) | 0 (0.0%) |
| 65 to 74 Years | 0 (0.0%) | 0 (0.0%) |
| 75 Years and over | 0 (0.0%) | 14 (100.0%) |
Disability Class: Vision Difficulty
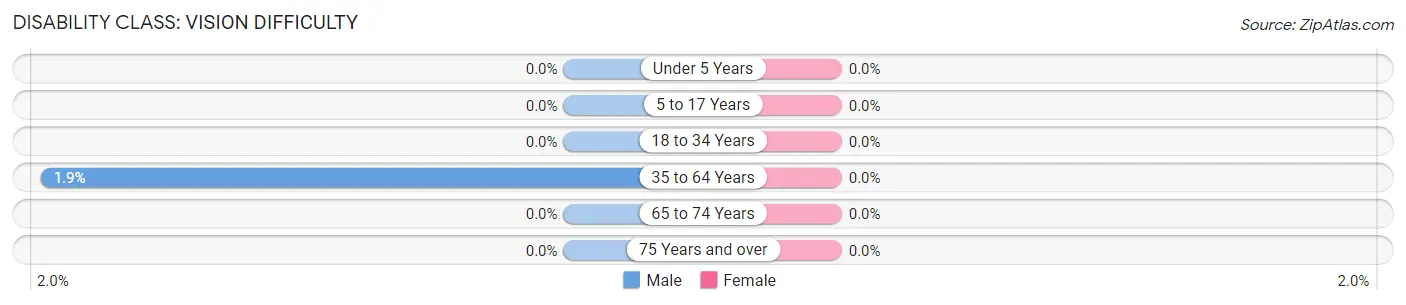
| Age Bracket | Male | Female |
| Under 5 Years | 0 (0.0%) | 0 (0.0%) |
| 5 to 17 Years | 0 (0.0%) | 0 (0.0%) |
| 18 to 34 Years | 0 (0.0%) | 0 (0.0%) |
| 35 to 64 Years | 3 (1.9%) | 0 (0.0%) |
| 65 to 74 Years | 0 (0.0%) | 0 (0.0%) |
| 75 Years and over | 0 (0.0%) | 0 (0.0%) |
Disability Class: Cognitive Difficulty
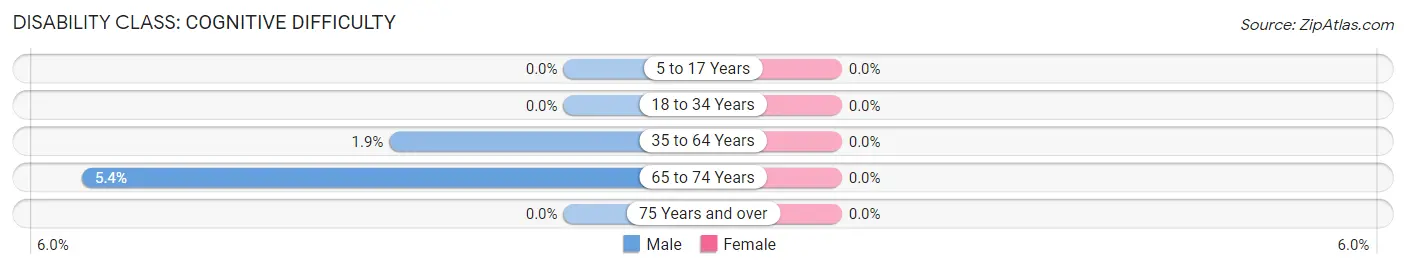
| Age Bracket | Male | Female |
| 5 to 17 Years | 0 (0.0%) | 0 (0.0%) |
| 18 to 34 Years | 0 (0.0%) | 0 (0.0%) |
| 35 to 64 Years | 3 (1.9%) | 0 (0.0%) |
| 65 to 74 Years | 3 (5.4%) | 0 (0.0%) |
| 75 Years and over | 0 (0.0%) | 0 (0.0%) |
Disability Class: Ambulatory Difficulty
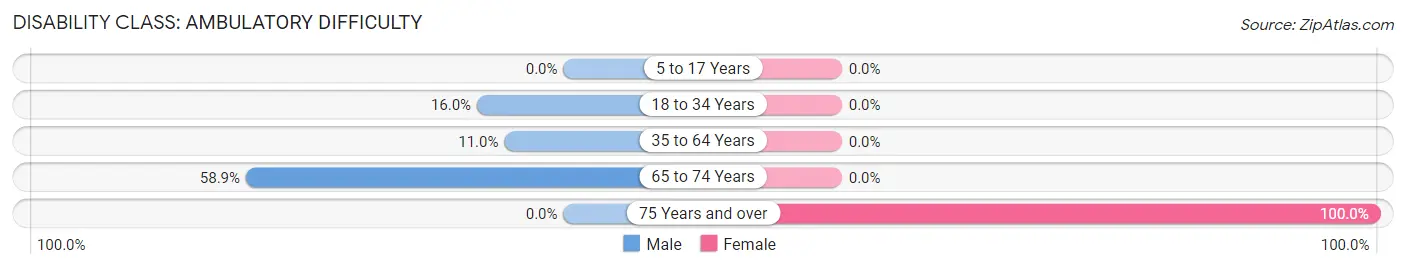
| Age Bracket | Male | Female |
| 5 to 17 Years | 0 (0.0%) | 0 (0.0%) |
| 18 to 34 Years | 17 (16.0%) | 0 (0.0%) |
| 35 to 64 Years | 17 (11.0%) | 0 (0.0%) |
| 65 to 74 Years | 33 (58.9%) | 0 (0.0%) |
| 75 Years and over | 0 (0.0%) | 14 (100.0%) |
Disability Class: Self-Care Difficulty
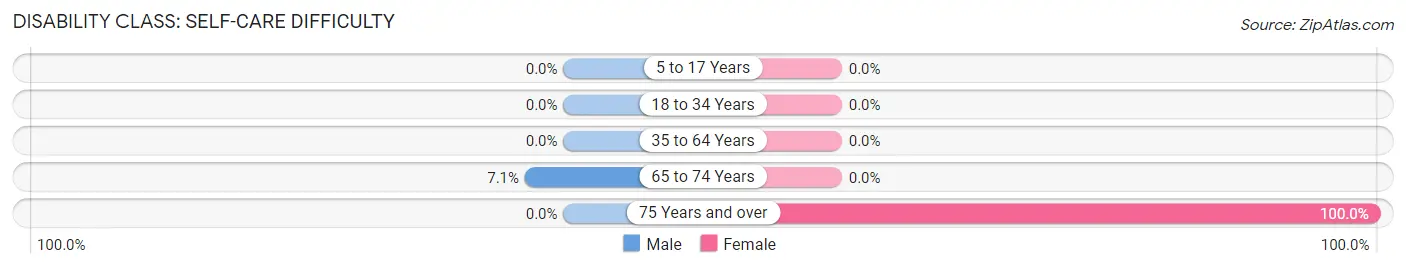
| Age Bracket | Male | Female |
| 5 to 17 Years | 0 (0.0%) | 0 (0.0%) |
| 18 to 34 Years | 0 (0.0%) | 0 (0.0%) |
| 35 to 64 Years | 0 (0.0%) | 0 (0.0%) |
| 65 to 74 Years | 4 (7.1%) | 0 (0.0%) |
| 75 Years and over | 0 (0.0%) | 14 (100.0%) |
Technology Access in Casco
Computing Device Access in Casco
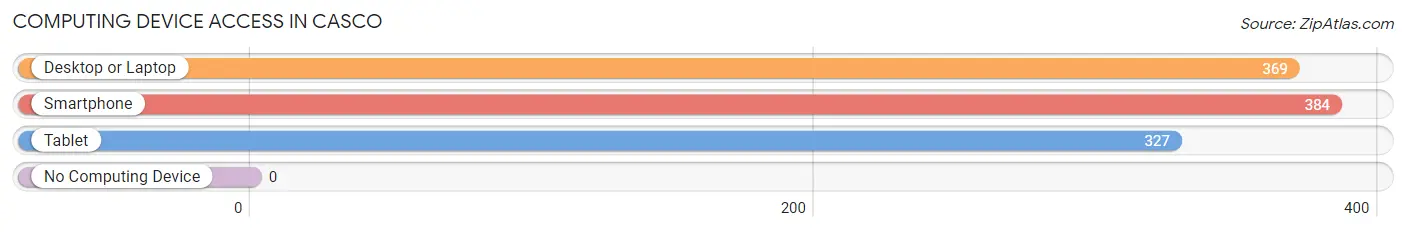
| Device Type | # Households | % Households |
| Desktop or Laptop | 369 | 84.1% |
| Smartphone | 384 | 87.5% |
| Tablet | 327 | 74.5% |
| No Computing Device | 0 | 0.0% |
| Total | 439 | 100.0% |
Internet Access in Casco
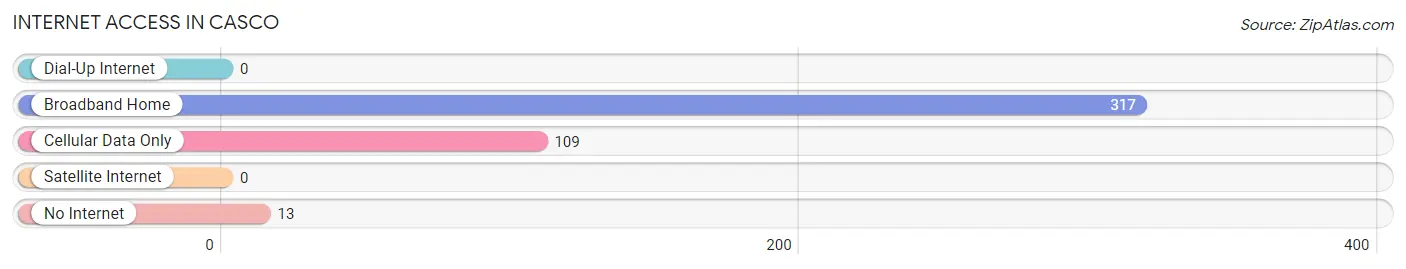
| Internet Type | # Households | % Households |
| Dial-Up Internet | 0 | 0.0% |
| Broadband Home | 317 | 72.2% |
| Cellular Data Only | 109 | 24.8% |
| Satellite Internet | 0 | 0.0% |
| No Internet | 13 | 3.0% |
| Total | 439 | 100.0% |
Casco Summary
Casco, Maine is a small town located in Cumberland County, Maine. It is situated on the eastern shore of Sebago Lake, the second largest lake in the state. The town was incorporated in 1794 and has a population of approximately 4,000 people.
Geography
Casco is located in the foothills of the White Mountains, and is surrounded by forests and lakes. The town is situated on the eastern shore of Sebago Lake, which is the second largest lake in the state. The lake is a popular destination for fishing, swimming, and boating. The town is also home to several small ponds, including Little Sebago Lake, which is a popular spot for ice fishing.
The town is located in the Sebago Lake watershed, which is part of the Saco River watershed. The Saco River is the longest river in Maine and is a major source of drinking water for the state. The town is also home to several small streams, including the Crooked River, which flows through the town and empties into Sebago Lake.
The town is located in a rural area, and is surrounded by forests and lakes. The town is home to several small farms, and is a popular destination for outdoor recreation.
History
The area that is now Casco was first settled in the late 1700s by settlers from Massachusetts. The town was incorporated in 1794 and was named after the Casco Bay, which is located nearby.
The town was originally a farming community, and the main crops grown were potatoes, corn, and hay. The town also had several sawmills and gristmills, which provided lumber and grain for the local population.
In the late 1800s, the town began to develop as a resort destination. Several large hotels were built, and the town became a popular destination for summer vacationers. The town also became a popular destination for ice fishing, and the town's population grew significantly during this time.
Economy
The economy of Casco is largely based on tourism and outdoor recreation. The town is home to several resorts and campgrounds, which attract visitors from all over the state. The town is also home to several small businesses, including restaurants, shops, and galleries.
The town is also home to several small farms, which produce a variety of crops, including potatoes, corn, and hay. The town is also home to several small manufacturing businesses, which produce a variety of products, including furniture, clothing, and wood products.
Demographics
As of the 2010 census, the population of Casco was 4,099. The town has a median household income of $50,945, and the median age is 44. The town is predominantly white, with 92.3% of the population identifying as white. The town also has a small Hispanic population, with 2.3% of the population identifying as Hispanic or Latino.
Conclusion
Casco, Maine is a small town located in Cumberland County, Maine. It is situated on the eastern shore of Sebago Lake, the second largest lake in the state. The town was incorporated in 1794 and has a population of approximately 4,000 people. The town is a popular destination for outdoor recreation and tourism, and is home to several small businesses and farms. The town has a median household income of $50,945, and the population is predominantly white.
Common Questions
What is Per Capita Income in Casco?
Per Capita income in Casco is $31,534.
What is the Median Family Income in Casco?
Median Family Income in Casco is $101,908.
What is Inequality or Gini Index in Casco?
Inequality or Gini Index in Casco is 0.51.
What is the Total Population of Casco?
Total Population of Casco is 771.
What is the Total Male Population of Casco?
Total Male Population of Casco is 336.
What is the Total Female Population of Casco?
Total Female Population of Casco is 435.
What is the Ratio of Males per 100 Females in Casco?
There are 77.24 Males per 100 Females in Casco.
What is the Ratio of Females per 100 Males in Casco?
There are 129.46 Females per 100 Males in Casco.
What is the Median Population Age in Casco?
Median Population Age in Casco is 50.6 Years.
What is the Average Family Size in Casco
Average Family Size in Casco is 2.9 People.
What is the Average Household Size in Casco
Average Household Size in Casco is 1.7 People.
How Large is the Labor Force in Casco?
There are 554 People in the Labor Forcein in Casco.
What is the Percentage of People in the Labor Force in Casco?
77.6% of People are in the Labor Force in Casco.
What is the Unemployment Rate in Casco?
Unemployment Rate in Casco is 0.5%.