Glenn Heights, TX Map & Demographics
Glenn Heights Map
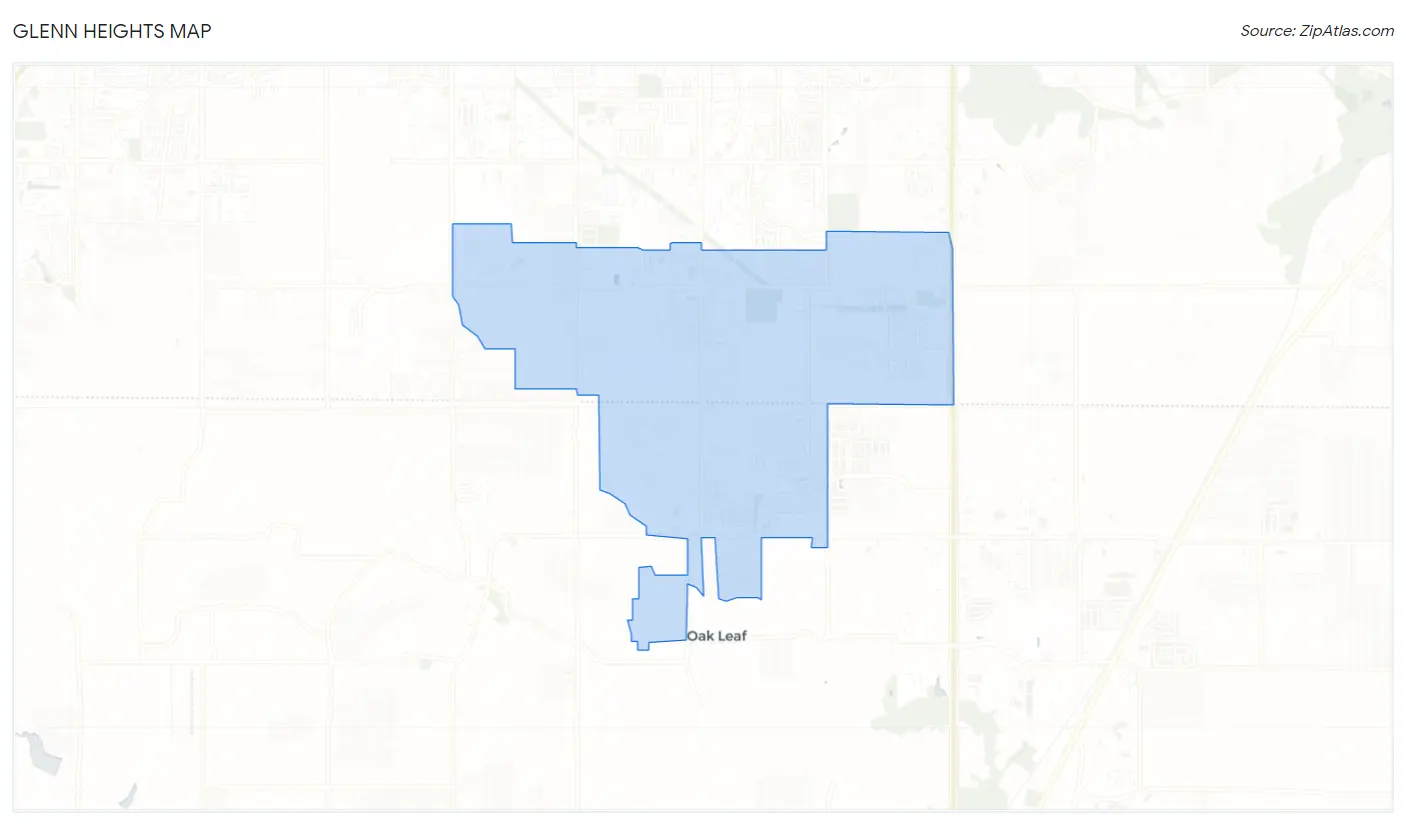
Glenn Heights Overview
$31,763
PER CAPITA INCOME
$89,482
AVG FAMILY INCOME
$87,686
AVG HOUSEHOLD INCOME
26.6%
WAGE / INCOME GAP [ % ]
73.4¢/ $1
WAGE / INCOME GAP [ $ ]
$6,682
FAMILY INCOME DEFICIT
0.37
INEQUALITY / GINI INDEX
16,445
TOTAL POPULATION
7,998
MALE POPULATION
8,447
FEMALE POPULATION
94.68
MALES / 100 FEMALES
105.61
FEMALES / 100 MALES
33.6
MEDIAN AGE
3.6
AVG FAMILY SIZE
3.2
AVG HOUSEHOLD SIZE
8,902
LABOR FORCE [ PEOPLE ]
69.9%
PERCENT IN LABOR FORCE
8.6%
UNEMPLOYMENT RATE
Income in Glenn Heights
Income Overview in Glenn Heights
Per Capita Income in Glenn Heights is $31,763, while median incomes of families and households are $89,482 and $87,686 respectively.
| Characteristic | Number | Measure |
| Per Capita Income | 16,445 | $31,763 |
| Median Family Income | 4,033 | $89,482 |
| Mean Family Income | 4,033 | $105,890 |
| Median Household Income | 5,153 | $87,686 |
| Mean Household Income | 5,153 | $97,942 |
| Income Deficit | 4,033 | $6,682 |
| Wage / Income Gap (%) | 16,445 | 26.60% |
| Wage / Income Gap ($) | 16,445 | 73.40¢ per $1 |
| Gini / Inequality Index | 16,445 | 0.37 |
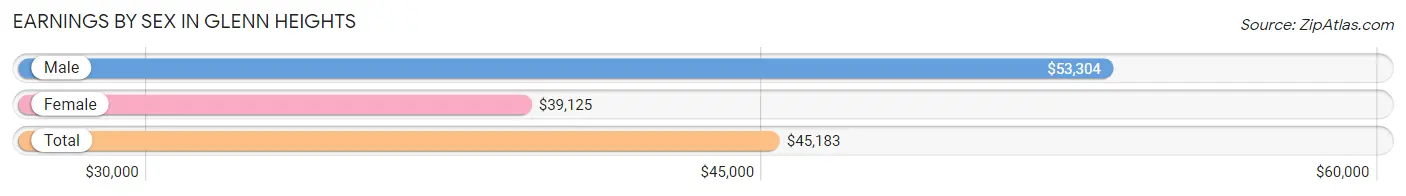
Earnings by Sex in Glenn Heights
Average Earnings in Glenn Heights are $45,183, $53,304 for men and $39,125 for women, a difference of 26.6%.
| Sex | Number | Average Earnings |
| Male | 4,250 (47.7%) | $53,304 |
| Female | 4,665 (52.3%) | $39,125 |
| Total | 8,915 (100.0%) | $45,183 |
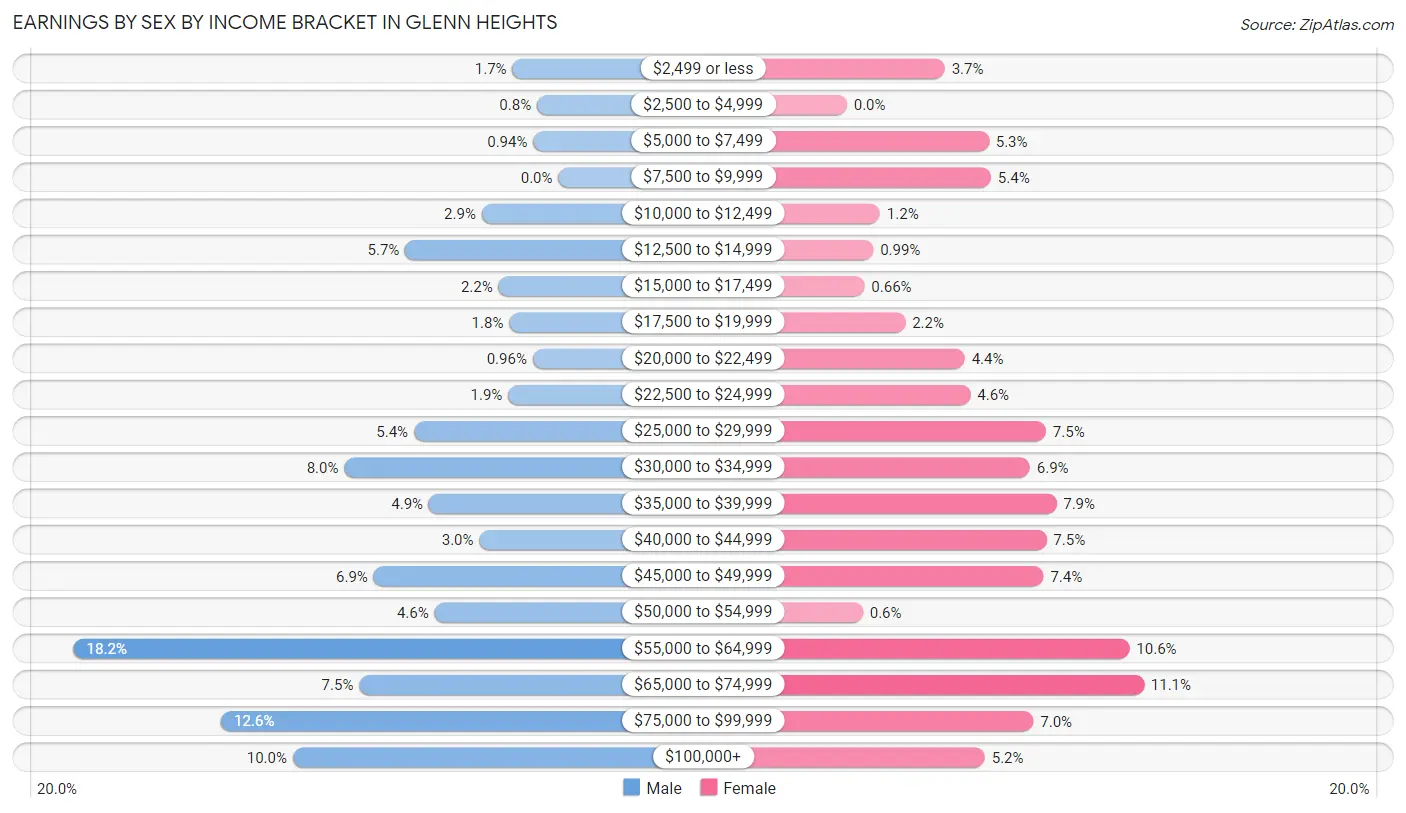
Earnings by Sex by Income Bracket in Glenn Heights
The most common earnings brackets in Glenn Heights are $55,000 to $64,999 for men (772 | 18.2%) and $65,000 to $74,999 for women (519 | 11.1%).
| Income | Male | Female |
| $2,499 or less | 73 (1.7%) | 171 (3.7%) |
| $2,500 to $4,999 | 34 (0.8%) | 0 (0.0%) |
| $5,000 to $7,499 | 40 (0.9%) | 248 (5.3%) |
| $7,500 to $9,999 | 0 (0.0%) | 252 (5.4%) |
| $10,000 to $12,499 | 122 (2.9%) | 58 (1.2%) |
| $12,500 to $14,999 | 244 (5.7%) | 46 (1.0%) |
| $15,000 to $17,499 | 95 (2.2%) | 31 (0.7%) |
| $17,500 to $19,999 | 78 (1.8%) | 102 (2.2%) |
| $20,000 to $22,499 | 41 (1.0%) | 206 (4.4%) |
| $22,500 to $24,999 | 80 (1.9%) | 216 (4.6%) |
| $25,000 to $29,999 | 230 (5.4%) | 348 (7.5%) |
| $30,000 to $34,999 | 341 (8.0%) | 320 (6.9%) |
| $35,000 to $39,999 | 206 (4.9%) | 366 (7.9%) |
| $40,000 to $44,999 | 126 (3.0%) | 349 (7.5%) |
| $45,000 to $49,999 | 294 (6.9%) | 344 (7.4%) |
| $50,000 to $54,999 | 197 (4.6%) | 28 (0.6%) |
| $55,000 to $64,999 | 772 (18.2%) | 494 (10.6%) |
| $65,000 to $74,999 | 317 (7.5%) | 519 (11.1%) |
| $75,000 to $99,999 | 537 (12.6%) | 326 (7.0%) |
| $100,000+ | 423 (10.0%) | 241 (5.2%) |
| Total | 4,250 (100.0%) | 4,665 (100.0%) |
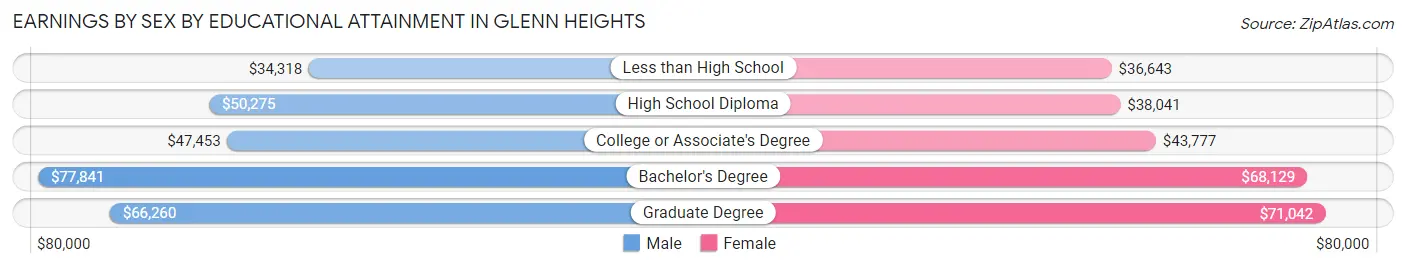
Earnings by Sex by Educational Attainment in Glenn Heights
Average earnings in Glenn Heights are $55,361 for men and $46,376 for women, a difference of 16.2%. Men with an educational attainment of bachelor's degree enjoy the highest average annual earnings of $77,841, while those with less than high school education earn the least with $34,318. Women with an educational attainment of graduate degree earn the most with the average annual earnings of $71,042, while those with less than high school education have the smallest earnings of $36,643.
| Educational Attainment | Male Income | Female Income |
| Less than High School | $34,318 | $36,643 |
| High School Diploma | $50,275 | $38,041 |
| College or Associate's Degree | $47,453 | $43,777 |
| Bachelor's Degree | $77,841 | $68,129 |
| Graduate Degree | $66,260 | $71,042 |
| Total | $55,361 | $46,376 |
Family Income in Glenn Heights
Family Income Brackets in Glenn Heights
According to the Glenn Heights family income data, there are 1,028 families falling into the $75,000 to $99,999 income range, which is the most common income bracket and makes up 25.5% of all families.
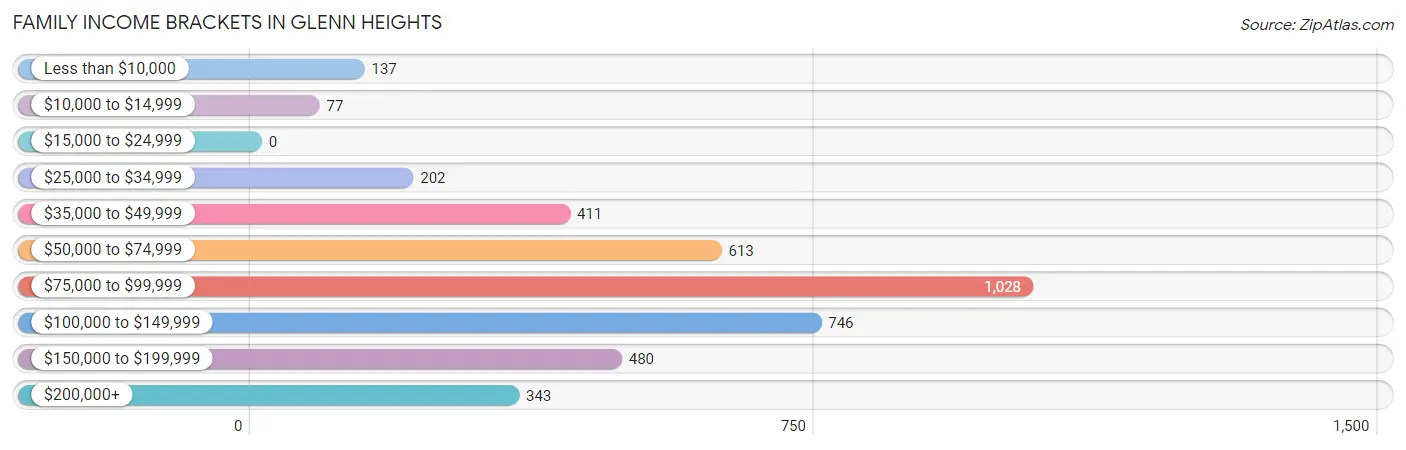
| Income Bracket | # Families | % Families |
| Less than $10,000 | 137 | 3.4% |
| $10,000 to $14,999 | 77 | 1.9% |
| $15,000 to $24,999 | 0 | 0.0% |
| $25,000 to $34,999 | 202 | 5.0% |
| $35,000 to $49,999 | 411 | 10.2% |
| $50,000 to $74,999 | 613 | 15.2% |
| $75,000 to $99,999 | 1,028 | 25.5% |
| $100,000 to $149,999 | 746 | 18.5% |
| $150,000 to $199,999 | 480 | 11.9% |
| $200,000+ | 343 | 8.5% |
Family Income by Famaliy Size in Glenn Heights
7+ person families (350 | 8.7%) account for the highest median family income in Glenn Heights with $183,866 per family, while 2-person families (1,705 | 42.3%) have the highest median income of $41,440 per family member.
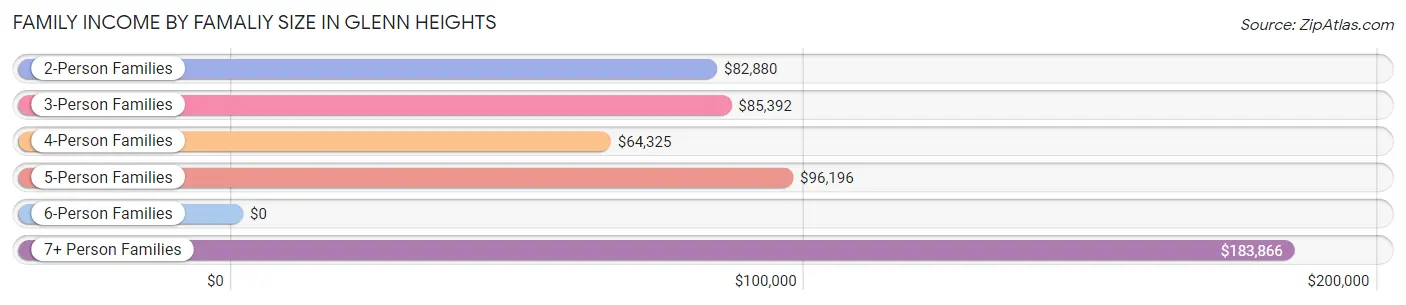
| Income Bracket | # Families | Median Income |
| 2-Person Families | 1,705 (42.3%) | $82,880 |
| 3-Person Families | 866 (21.5%) | $85,392 |
| 4-Person Families | 343 (8.5%) | $64,325 |
| 5-Person Families | 678 (16.8%) | $96,196 |
| 6-Person Families | 91 (2.3%) | $0 |
| 7+ Person Families | 350 (8.7%) | $183,866 |
| Total | 4,033 (100.0%) | $89,482 |
Family Income by Number of Earners in Glenn Heights
The median family income in Glenn Heights is $89,482, with families comprising 3+ earners (784) having the highest median family income of $179,136, while families with no earners (339) have the lowest median family income of $50,625, accounting for 19.4% and 8.4% of families, respectively.
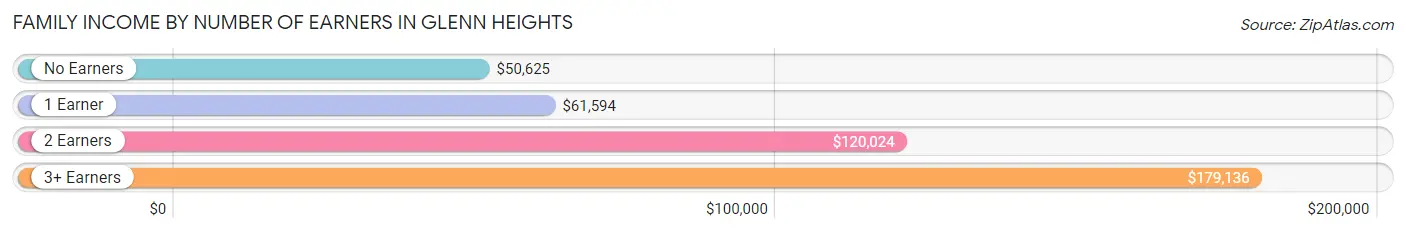
| Number of Earners | # Families | Median Income |
| No Earners | 339 (8.4%) | $50,625 |
| 1 Earner | 1,512 (37.5%) | $61,594 |
| 2 Earners | 1,398 (34.7%) | $120,024 |
| 3+ Earners | 784 (19.4%) | $179,136 |
| Total | 4,033 (100.0%) | $89,482 |
Household Income in Glenn Heights
Household Income Brackets in Glenn Heights
With 1,056 households falling in the category, the $75,000 to $99,999 income range is the most frequent in Glenn Heights, accounting for 20.5% of all households. In contrast, only 108 households (2.1%) fall into the $15,000 to $24,999 income bracket, making it the least populous group.
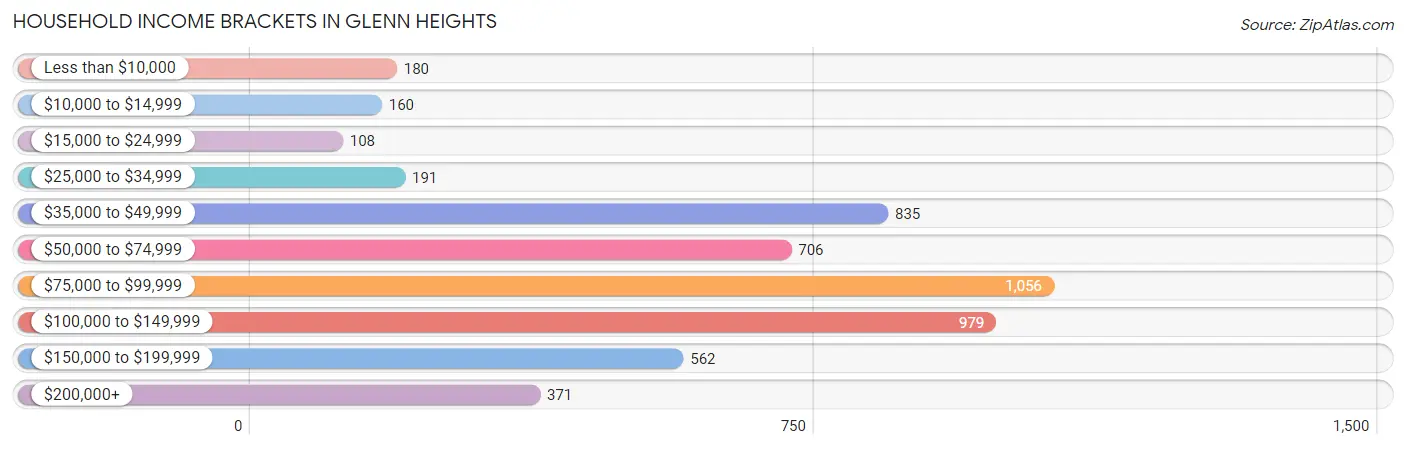
| Income Bracket | # Households | % Households |
| Less than $10,000 | 180 | 3.5% |
| $10,000 to $14,999 | 160 | 3.1% |
| $15,000 to $24,999 | 108 | 2.1% |
| $25,000 to $34,999 | 191 | 3.7% |
| $35,000 to $49,999 | 835 | 16.2% |
| $50,000 to $74,999 | 706 | 13.7% |
| $75,000 to $99,999 | 1,056 | 20.5% |
| $100,000 to $149,999 | 979 | 19.0% |
| $150,000 to $199,999 | 562 | 10.9% |
| $200,000+ | 371 | 7.2% |
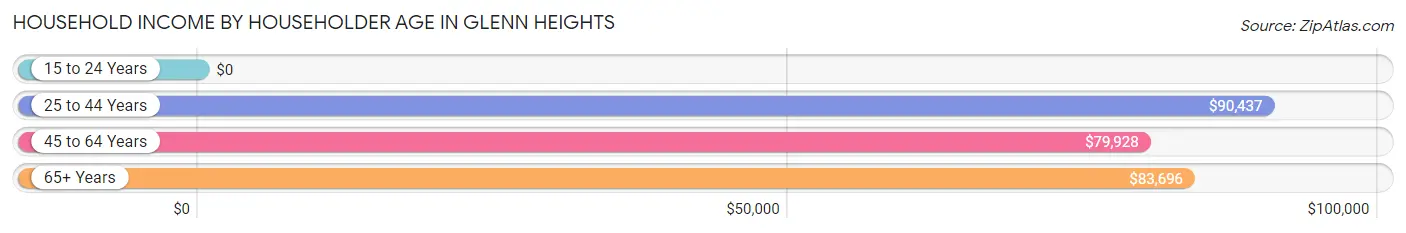
Household Income by Householder Age in Glenn Heights
The median household income in Glenn Heights is $87,686, with the highest median household income of $90,437 found in the 25 to 44 years age bracket for the primary householder. A total of 1,826 households (35.4%) fall into this category.
| Income Bracket | # Households | Median Income |
| 15 to 24 Years | 0 (0.0%) | $0 |
| 25 to 44 Years | 1,826 (35.4%) | $90,437 |
| 45 to 64 Years | 2,633 (51.1%) | $79,928 |
| 65+ Years | 694 (13.5%) | $83,696 |
| Total | 5,153 (100.0%) | $87,686 |
Poverty in Glenn Heights
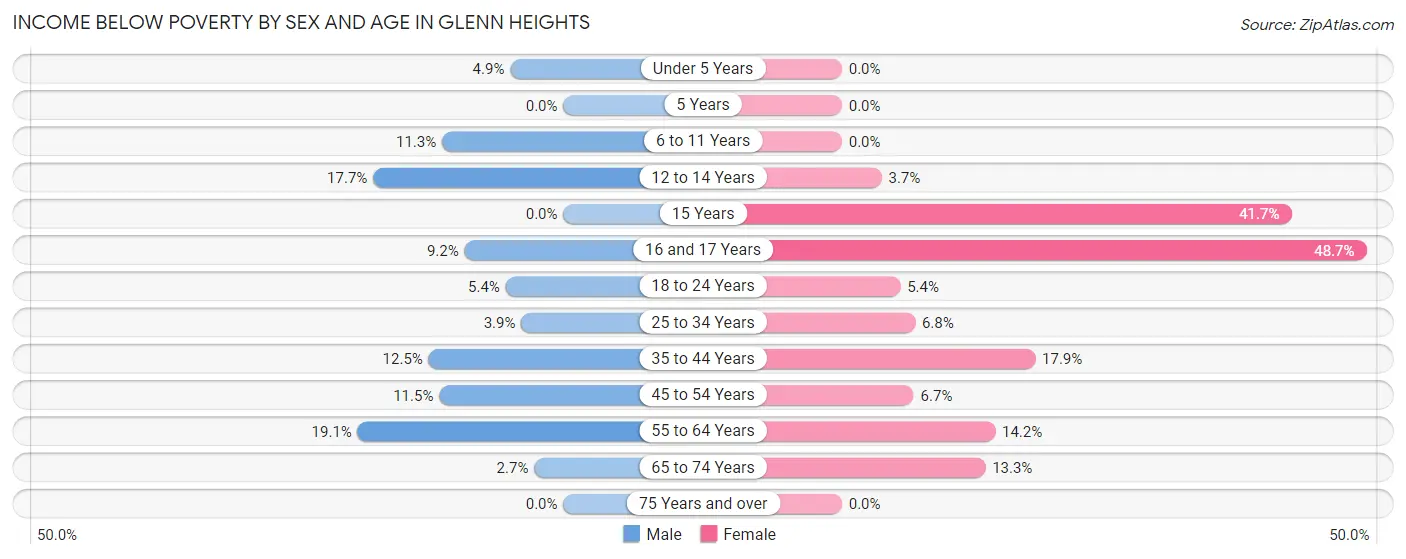
Income Below Poverty by Sex and Age in Glenn Heights
With 9.9% poverty level for males and 10.5% for females among the residents of Glenn Heights, 55 to 64 year old males and 16 and 17 year old females are the most vulnerable to poverty, with 197 males (19.1%) and 111 females (48.7%) in their respective age groups living below the poverty level.
| Age Bracket | Male | Female |
| Under 5 Years | 29 (4.9%) | 0 (0.0%) |
| 5 Years | 0 (0.0%) | 0 (0.0%) |
| 6 to 11 Years | 102 (11.3%) | 0 (0.0%) |
| 12 to 14 Years | 114 (17.6%) | 9 (3.7%) |
| 15 Years | 0 (0.0%) | 83 (41.7%) |
| 16 and 17 Years | 20 (9.2%) | 111 (48.7%) |
| 18 to 24 Years | 46 (5.3%) | 84 (5.4%) |
| 25 to 34 Years | 47 (3.9%) | 67 (6.8%) |
| 35 to 44 Years | 127 (12.5%) | 199 (17.9%) |
| 45 to 54 Years | 100 (11.5%) | 70 (6.7%) |
| 55 to 64 Years | 197 (19.1%) | 200 (14.2%) |
| 65 to 74 Years | 10 (2.7%) | 66 (13.3%) |
| 75 Years and over | 0 (0.0%) | 0 (0.0%) |
| Total | 792 (9.9%) | 889 (10.5%) |
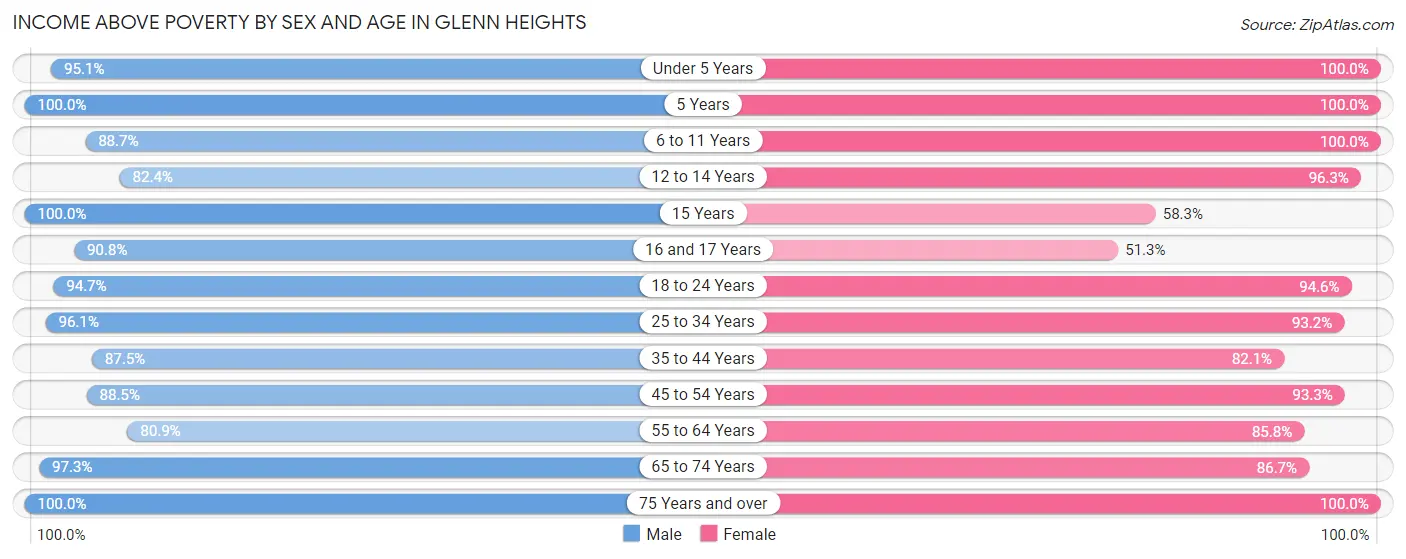
Income Above Poverty by Sex and Age in Glenn Heights
According to the poverty statistics in Glenn Heights, males aged 5 years and females aged under 5 years are the age groups that are most secure financially, with 100.0% of males and 100.0% of females in these age groups living above the poverty line.
| Age Bracket | Male | Female |
| Under 5 Years | 559 (95.1%) | 314 (100.0%) |
| 5 Years | 132 (100.0%) | 34 (100.0%) |
| 6 to 11 Years | 804 (88.7%) | 599 (100.0%) |
| 12 to 14 Years | 532 (82.4%) | 235 (96.3%) |
| 15 Years | 35 (100.0%) | 116 (58.3%) |
| 16 and 17 Years | 198 (90.8%) | 117 (51.3%) |
| 18 to 24 Years | 814 (94.7%) | 1,467 (94.6%) |
| 25 to 34 Years | 1,159 (96.1%) | 920 (93.2%) |
| 35 to 44 Years | 889 (87.5%) | 910 (82.1%) |
| 45 to 54 Years | 768 (88.5%) | 979 (93.3%) |
| 55 to 64 Years | 835 (80.9%) | 1,206 (85.8%) |
| 65 to 74 Years | 360 (97.3%) | 430 (86.7%) |
| 75 Years and over | 121 (100.0%) | 219 (100.0%) |
| Total | 7,206 (90.1%) | 7,546 (89.5%) |
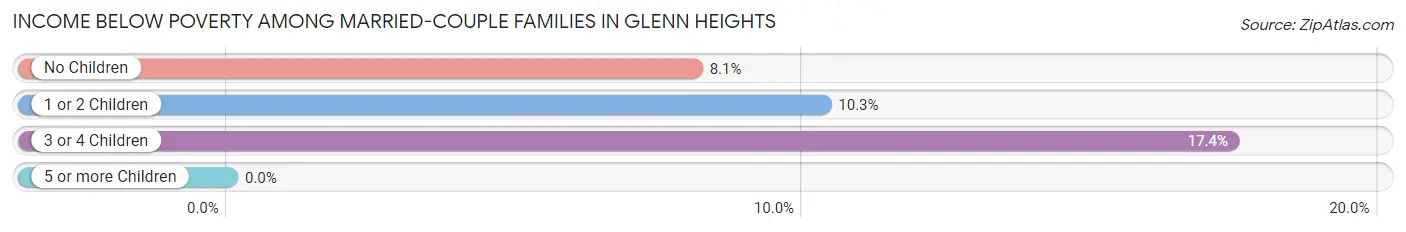
Income Below Poverty Among Married-Couple Families in Glenn Heights
The poverty statistics for married-couple families in Glenn Heights show that 9.0% or 240 of the total 2,676 families live below the poverty line. Families with 3 or 4 children have the highest poverty rate of 17.4%, comprising of 30 families. On the other hand, families with 5 or more children have the lowest poverty rate of 0.0%, which includes 0 families.
| Children | Above Poverty | Below Poverty |
| No Children | 1,568 (91.9%) | 138 (8.1%) |
| 1 or 2 Children | 625 (89.7%) | 72 (10.3%) |
| 3 or 4 Children | 142 (82.6%) | 30 (17.4%) |
| 5 or more Children | 101 (100.0%) | 0 (0.0%) |
| Total | 2,436 (91.0%) | 240 (9.0%) |
Income Below Poverty Among Single-Parent Households in Glenn Heights
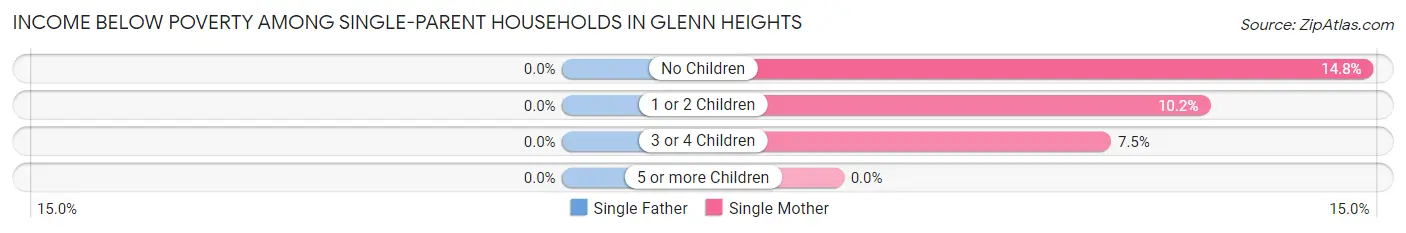
| Children | Single Father | Single Mother |
| No Children | 0 (0.0%) | 58 (14.8%) |
| 1 or 2 Children | 0 (0.0%) | 39 (10.2%) |
| 3 or 4 Children | 0 (0.0%) | 18 (7.5%) |
| 5 or more Children | 0 (0.0%) | 0 (0.0%) |
| Total | 0 (0.0%) | 115 (11.3%) |
Income Below Poverty Among Married-Couple vs Single-Parent Households in Glenn Heights
The poverty data for Glenn Heights shows that 240 of the married-couple family households (9.0%) and 115 of the single-parent households (8.5%) are living below the poverty level. Within the married-couple family households, those with 3 or 4 children have the highest poverty rate, with 30 households (17.4%) falling below the poverty line. Among the single-parent households, those with no children have the highest poverty rate, with 58 household (11.5%) living below poverty.
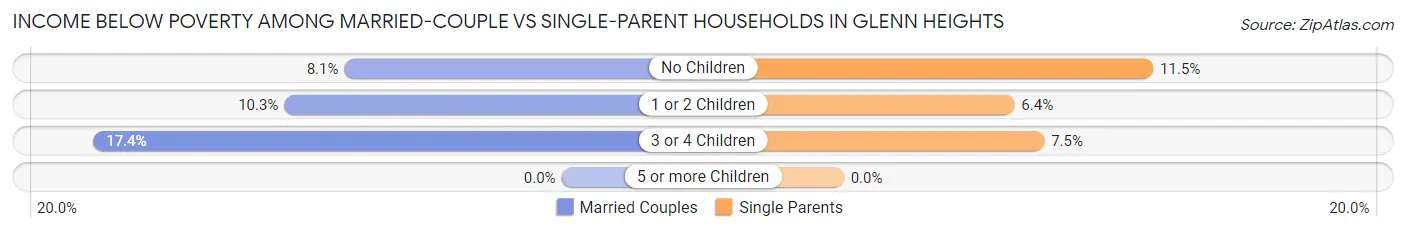
| Children | Married-Couple Families | Single-Parent Households |
| No Children | 138 (8.1%) | 58 (11.5%) |
| 1 or 2 Children | 72 (10.3%) | 39 (6.4%) |
| 3 or 4 Children | 30 (17.4%) | 18 (7.5%) |
| 5 or more Children | 0 (0.0%) | 0 (0.0%) |
| Total | 240 (9.0%) | 115 (8.5%) |
Race in Glenn Heights
The most populous races in Glenn Heights are Black / African American (8,480 | 51.6%), White / Caucasian (5,028 | 30.6%), and Hispanic or Latino (4,217 | 25.6%).
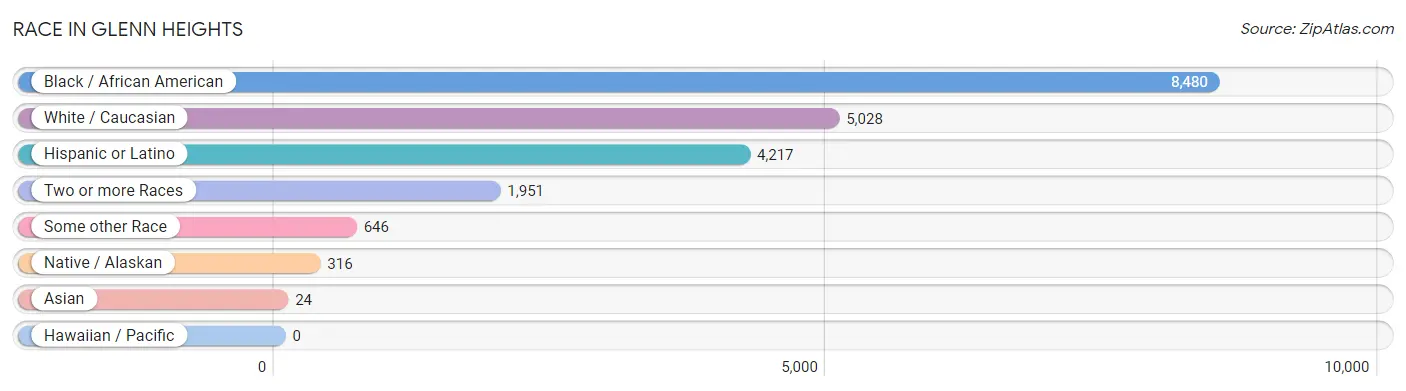
| Race | # Population | % Population |
| Asian | 24 | 0.2% |
| Black / African American | 8,480 | 51.6% |
| Hawaiian / Pacific | 0 | 0.0% |
| Hispanic or Latino | 4,217 | 25.6% |
| Native / Alaskan | 316 | 1.9% |
| White / Caucasian | 5,028 | 30.6% |
| Two or more Races | 1,951 | 11.9% |
| Some other Race | 646 | 3.9% |
| Total | 16,445 | 100.0% |
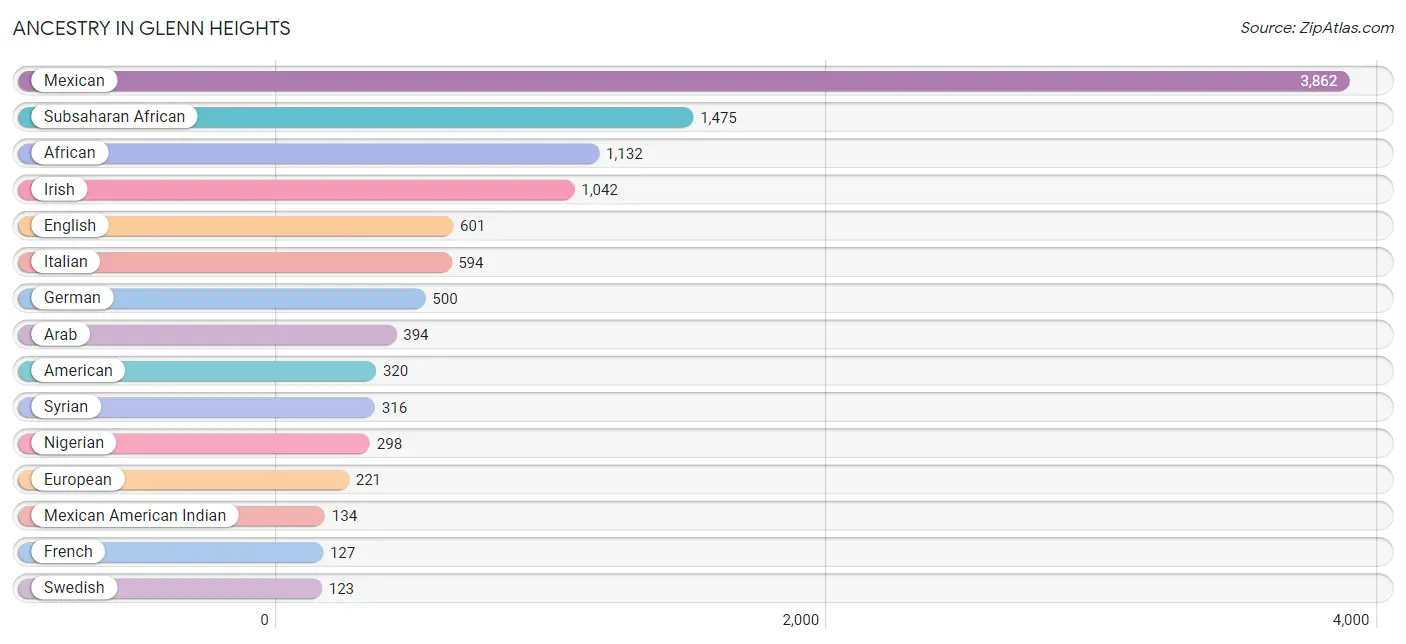
Ancestry in Glenn Heights
The most populous ancestries reported in Glenn Heights are Mexican (3,862 | 23.5%), Subsaharan African (1,475 | 9.0%), African (1,132 | 6.9%), Irish (1,042 | 6.3%), and English (601 | 3.6%), together accounting for 49.3% of all Glenn Heights residents.
| Ancestry | # Population | % Population |
| African | 1,132 | 6.9% |
| American | 320 | 1.9% |
| Arab | 394 | 2.4% |
| Belgian | 5 | 0.0% |
| British | 47 | 0.3% |
| Cajun | 13 | 0.1% |
| Central American Indian | 17 | 0.1% |
| Cherokee | 73 | 0.4% |
| Colombian | 26 | 0.2% |
| Creek | 19 | 0.1% |
| Czech | 27 | 0.2% |
| Dutch | 47 | 0.3% |
| Eastern European | 108 | 0.7% |
| English | 601 | 3.6% |
| Ethiopian | 17 | 0.1% |
| European | 221 | 1.3% |
| French | 127 | 0.8% |
| German | 500 | 3.0% |
| Greek | 7 | 0.0% |
| Hungarian | 12 | 0.1% |
| Irish | 1,042 | 6.3% |
| Italian | 594 | 3.6% |
| Jamaican | 17 | 0.1% |
| Jordanian | 27 | 0.2% |
| Korean | 52 | 0.3% |
| Lebanese | 51 | 0.3% |
| Mexican | 3,862 | 23.5% |
| Mexican American Indian | 134 | 0.8% |
| Nigerian | 298 | 1.8% |
| Northern European | 32 | 0.2% |
| Norwegian | 11 | 0.1% |
| Portuguese | 25 | 0.2% |
| Puerto Rican | 89 | 0.5% |
| Scotch-Irish | 15 | 0.1% |
| Scottish | 15 | 0.1% |
| South American | 26 | 0.2% |
| Spaniard | 42 | 0.3% |
| Sri Lankan | 44 | 0.3% |
| Subsaharan African | 1,475 | 9.0% |
| Swedish | 123 | 0.7% |
| Syrian | 316 | 1.9% |
| Thai | 11 | 0.1% |
| Welsh | 75 | 0.5% | View All 43 Rows |
Immigrants in Glenn Heights
The most numerous immigrant groups reported in Glenn Heights came from Latin America (825 | 5.0%), Central America (799 | 4.9%), Mexico (799 | 4.9%), Asia (228 | 1.4%), and Western Asia (204 | 1.2%), together accounting for 17.4% of all Glenn Heights residents.
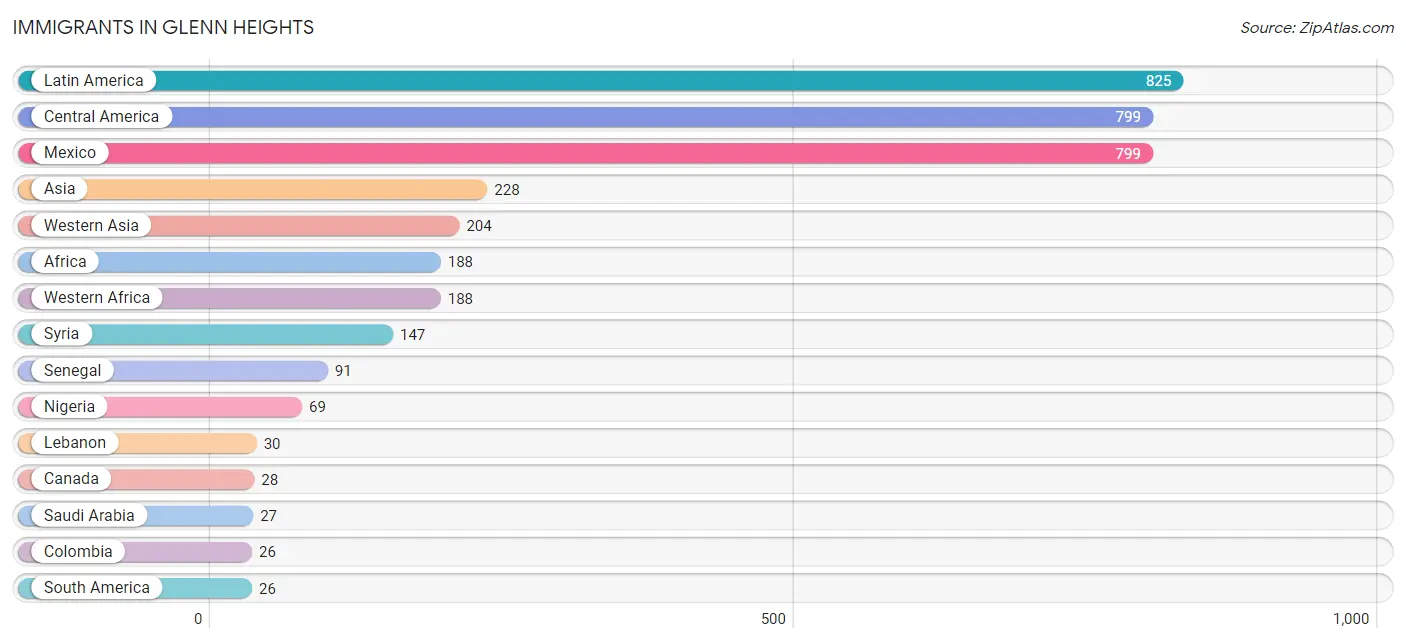
| Immigration Origin | # Population | % Population |
| Africa | 188 | 1.1% |
| Asia | 228 | 1.4% |
| Canada | 28 | 0.2% |
| Central America | 799 | 4.9% |
| Colombia | 26 | 0.2% |
| India | 11 | 0.1% |
| Latin America | 825 | 5.0% |
| Lebanon | 30 | 0.2% |
| Mexico | 799 | 4.9% |
| Nigeria | 69 | 0.4% |
| Philippines | 13 | 0.1% |
| Saudi Arabia | 27 | 0.2% |
| Senegal | 91 | 0.5% |
| South America | 26 | 0.2% |
| South Central Asia | 11 | 0.1% |
| South Eastern Asia | 13 | 0.1% |
| Syria | 147 | 0.9% |
| Western Africa | 188 | 1.1% |
| Western Asia | 204 | 1.2% | View All 19 Rows |
Sex and Age in Glenn Heights
Sex and Age in Glenn Heights
The most populous age groups in Glenn Heights are 10 to 14 Years (957 | 12.0%) for men and 20 to 24 Years (1,092 | 12.9%) for women.
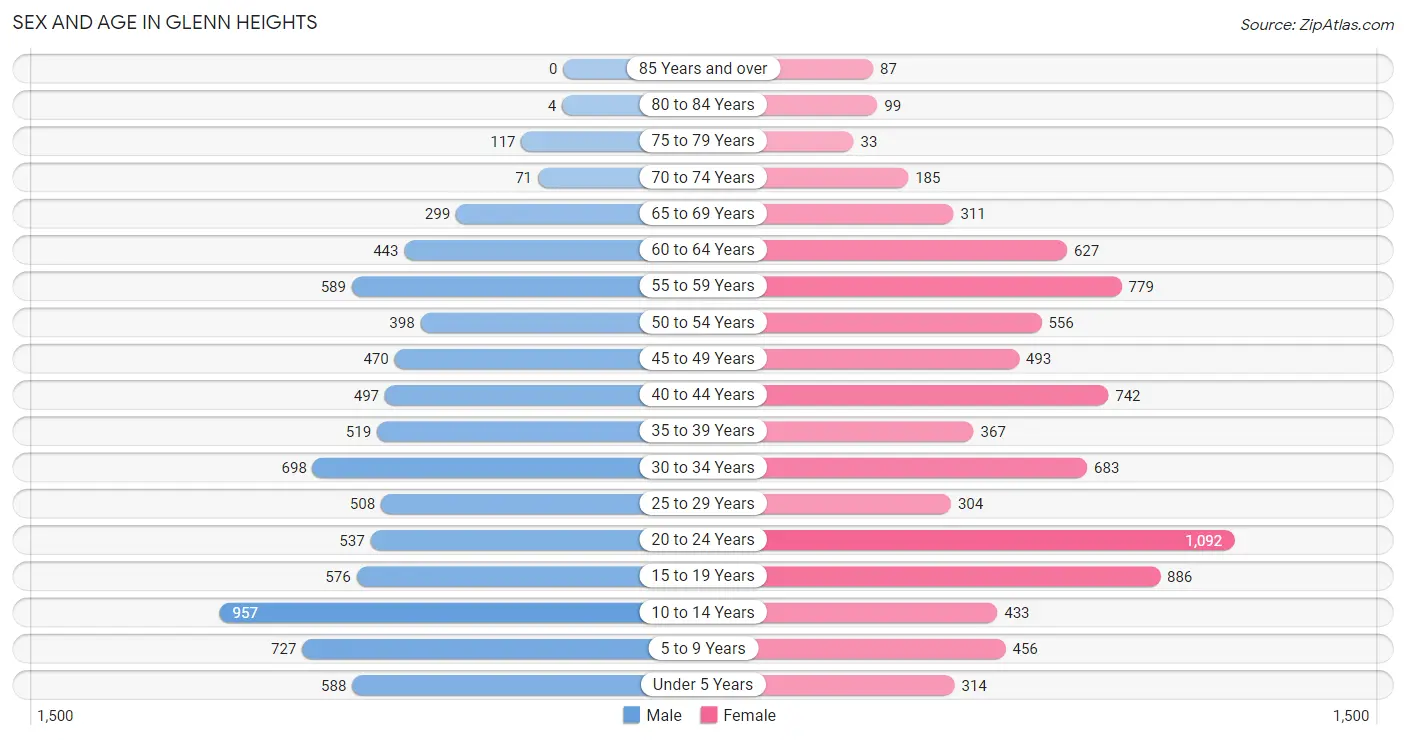
| Age Bracket | Male | Female |
| Under 5 Years | 588 (7.3%) | 314 (3.7%) |
| 5 to 9 Years | 727 (9.1%) | 456 (5.4%) |
| 10 to 14 Years | 957 (12.0%) | 433 (5.1%) |
| 15 to 19 Years | 576 (7.2%) | 886 (10.5%) |
| 20 to 24 Years | 537 (6.7%) | 1,092 (12.9%) |
| 25 to 29 Years | 508 (6.4%) | 304 (3.6%) |
| 30 to 34 Years | 698 (8.7%) | 683 (8.1%) |
| 35 to 39 Years | 519 (6.5%) | 367 (4.3%) |
| 40 to 44 Years | 497 (6.2%) | 742 (8.8%) |
| 45 to 49 Years | 470 (5.9%) | 493 (5.8%) |
| 50 to 54 Years | 398 (5.0%) | 556 (6.6%) |
| 55 to 59 Years | 589 (7.4%) | 779 (9.2%) |
| 60 to 64 Years | 443 (5.5%) | 627 (7.4%) |
| 65 to 69 Years | 299 (3.7%) | 311 (3.7%) |
| 70 to 74 Years | 71 (0.9%) | 185 (2.2%) |
| 75 to 79 Years | 117 (1.5%) | 33 (0.4%) |
| 80 to 84 Years | 4 (0.1%) | 99 (1.2%) |
| 85 Years and over | 0 (0.0%) | 87 (1.0%) |
| Total | 7,998 (100.0%) | 8,447 (100.0%) |
Families and Households in Glenn Heights
Median Family Size in Glenn Heights
The median family size in Glenn Heights is 3.63 persons per family, with single female/mother families (1,014 | 25.1%) accounting for the largest median family size of 4.07 persons per family. On the other hand, single male/father families (343 | 8.5%) represent the smallest median family size with 2.92 persons per family.
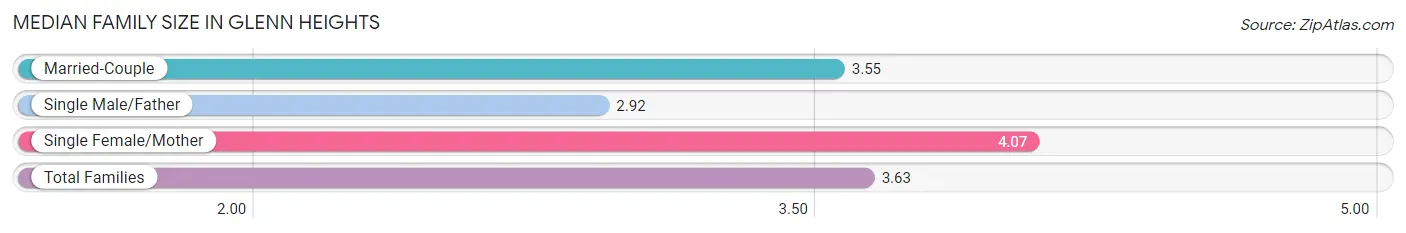
| Family Type | # Families | Family Size |
| Married-Couple | 2,676 (66.3%) | 3.55 |
| Single Male/Father | 343 (8.5%) | 2.92 |
| Single Female/Mother | 1,014 (25.1%) | 4.07 |
| Total Families | 4,033 (100.0%) | 3.63 |
Median Household Size in Glenn Heights
The median household size in Glenn Heights is 3.19 persons per household, with single female/mother households (1,014 | 19.7%) accounting for the largest median household size of 4.36 persons per household. non-family households (1,120 | 21.7%) represent the smallest median household size with 1.22 persons per household.
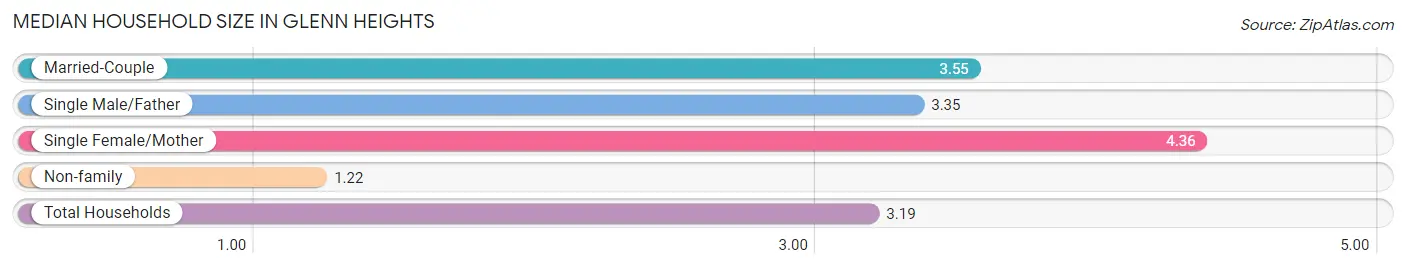
| Household Type | # Households | Household Size |
| Married-Couple | 2,676 (51.9%) | 3.55 |
| Single Male/Father | 343 (6.7%) | 3.35 |
| Single Female/Mother | 1,014 (19.7%) | 4.36 |
| Non-family | 1,120 (21.7%) | 1.22 |
| Total Households | 5,153 (100.0%) | 3.19 |
Household Size by Marriage Status in Glenn Heights
Out of a total of 5,153 households in Glenn Heights, 4,033 (78.3%) are family households, while 1,120 (21.7%) are nonfamily households. The most numerous type of family households are 2-person households, comprising 1,608, and the most common type of nonfamily households are 1-person households, comprising 938.
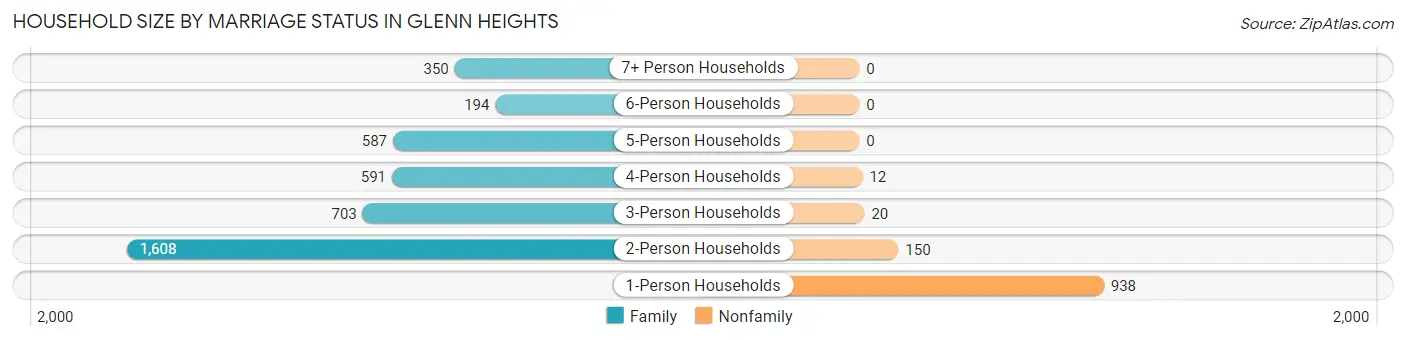
| Household Size | Family Households | Nonfamily Households |
| 1-Person Households | - | 938 (18.2%) |
| 2-Person Households | 1,608 (31.2%) | 150 (2.9%) |
| 3-Person Households | 703 (13.6%) | 20 (0.4%) |
| 4-Person Households | 591 (11.5%) | 12 (0.2%) |
| 5-Person Households | 587 (11.4%) | 0 (0.0%) |
| 6-Person Households | 194 (3.8%) | 0 (0.0%) |
| 7+ Person Households | 350 (6.8%) | 0 (0.0%) |
| Total | 4,033 (78.3%) | 1,120 (21.7%) |
Female Fertility in Glenn Heights
Fertility by Age in Glenn Heights
Average fertility rate in Glenn Heights is 42.0 births per 1,000 women. Women in the age bracket of 20 to 34 years have the highest fertility rate with 73.0 births per 1,000 women. Women in the age bracket of 20 to 34 years acount for 77.0% of all women with births.
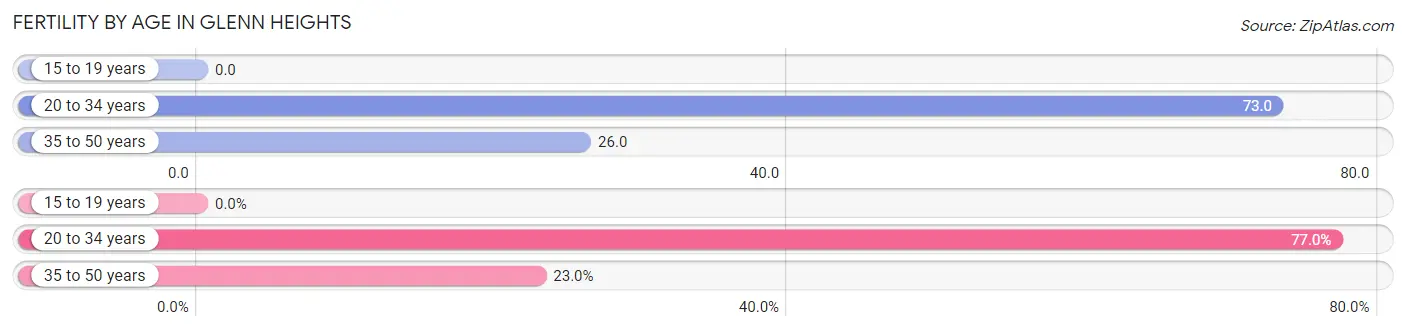
| Age Bracket | Women with Births | Births / 1,000 Women |
| 15 to 19 years | 0 (0.0%) | 0.0 |
| 20 to 34 years | 151 (77.0%) | 73.0 |
| 35 to 50 years | 45 (23.0%) | 26.0 |
| Total | 196 (100.0%) | 42.0 |
Fertility by Age by Marriage Status in Glenn Heights
80.6% of women with births (196) in Glenn Heights are married. The highest percentage of unmarried women with births falls into 35 to 50 years age bracket with 84.4% of them unmarried at the time of birth, while the lowest percentage of unmarried women with births belong to 20 to 34 years age bracket with 0.0% of them unmarried.
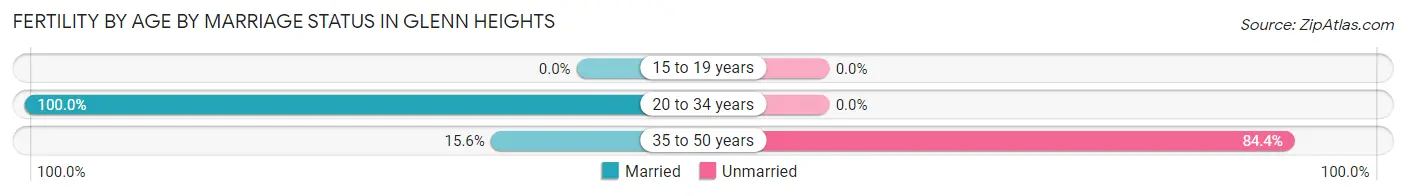
| Age Bracket | Married | Unmarried |
| 15 to 19 years | 0 (0.0%) | 0 (0.0%) |
| 20 to 34 years | 151 (100.0%) | 0 (0.0%) |
| 35 to 50 years | 7 (15.6%) | 38 (84.4%) |
| Total | 158 (80.6%) | 38 (19.4%) |
Fertility by Education in Glenn Heights
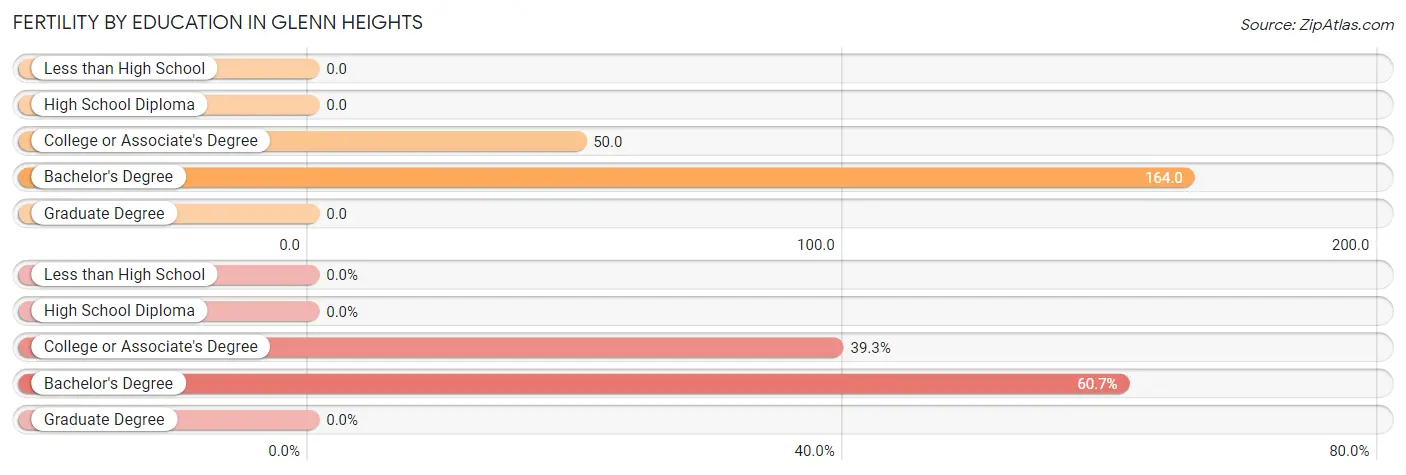
| Educational Attainment | Women with Births | Births / 1,000 Women |
| Less than High School | 0 (0.0%) | 0.0 |
| High School Diploma | 0 (0.0%) | 0.0 |
| College or Associate's Degree | 77 (39.3%) | 50.0 |
| Bachelor's Degree | 119 (60.7%) | 164.0 |
| Graduate Degree | 0 (0.0%) | 0.0 |
| Total | 196 (100.0%) | 42.0 |
Fertility by Education by Marriage Status in Glenn Heights
19.4% of women with births in Glenn Heights are unmarried. Women with the educational attainment of bachelor's degree are most likely to be married with 100.0% of them married at childbirth, while women with the educational attainment of college or associate's degree are least likely to be married with 49.3% of them unmarried at childbirth.
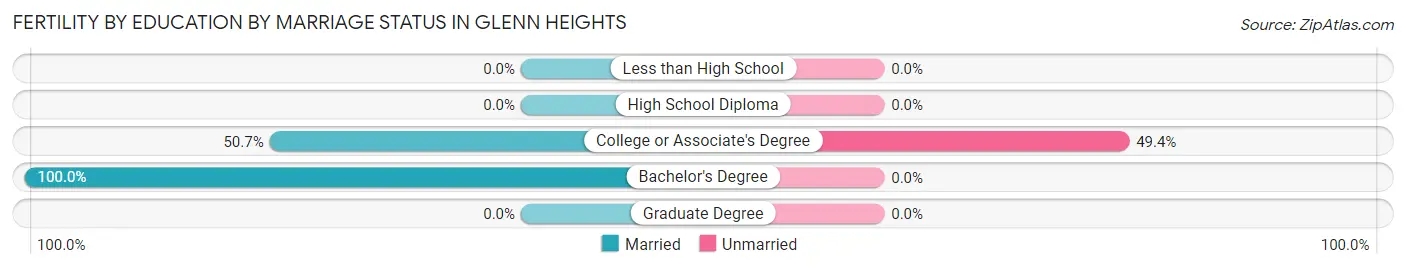
| Educational Attainment | Married | Unmarried |
| Less than High School | 0 (0.0%) | 0 (0.0%) |
| High School Diploma | 0 (0.0%) | 0 (0.0%) |
| College or Associate's Degree | 39 (50.6%) | 38 (49.3%) |
| Bachelor's Degree | 119 (100.0%) | 0 (0.0%) |
| Graduate Degree | 0 (0.0%) | 0 (0.0%) |
| Total | 158 (80.6%) | 38 (19.4%) |
Employment Characteristics in Glenn Heights
Employment by Class of Employer in Glenn Heights
Among the 7,926 employed individuals in Glenn Heights, private company employees (5,779 | 72.9%), local government employees (823 | 10.4%), and self-employed (not incorporated) (550 | 6.9%) make up the most common classes of employment.
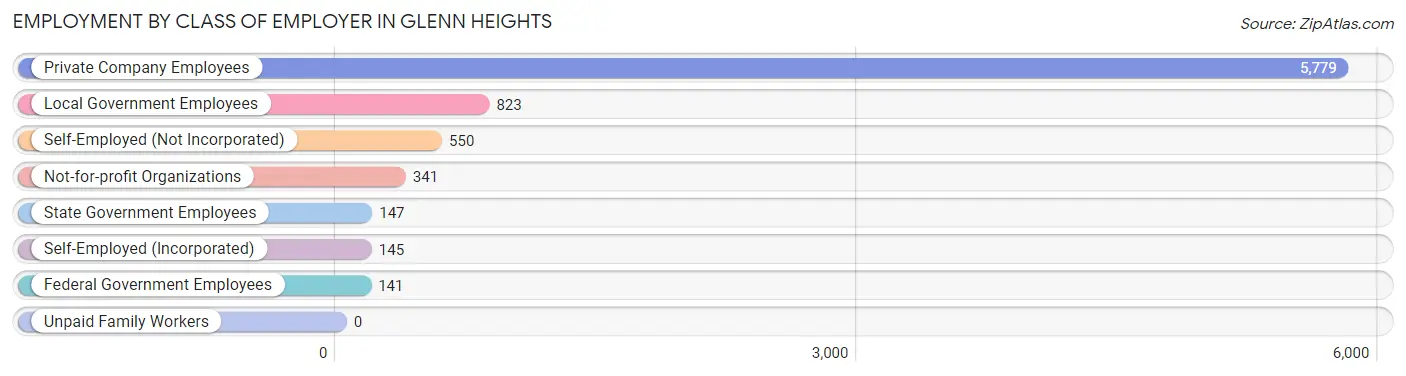
| Employer Class | # Employees | % Employees |
| Private Company Employees | 5,779 | 72.9% |
| Self-Employed (Incorporated) | 145 | 1.8% |
| Self-Employed (Not Incorporated) | 550 | 6.9% |
| Not-for-profit Organizations | 341 | 4.3% |
| Local Government Employees | 823 | 10.4% |
| State Government Employees | 147 | 1.8% |
| Federal Government Employees | 141 | 1.8% |
| Unpaid Family Workers | 0 | 0.0% |
| Total | 7,926 | 100.0% |
Employment Status by Age in Glenn Heights
According to the labor force statistics for Glenn Heights, out of the total population over 16 years of age (12,736), 69.9% or 8,902 individuals are in the labor force, with 8.6% or 766 of them unemployed. The age group with the highest labor force participation rate is 25 to 29 years, with 87.8% or 713 individuals in the labor force. Within the labor force, the 16 to 19 years age range has the highest percentage of unemployed individuals, with 41.5% or 213 of them being unemployed.
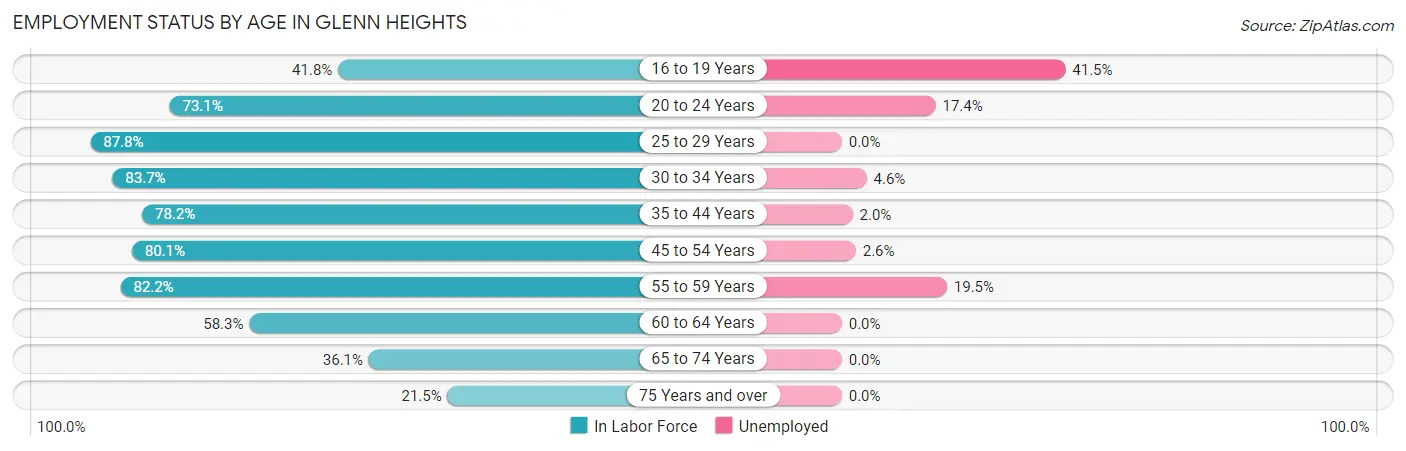
| Age Bracket | In Labor Force | Unemployed |
| 16 to 19 Years | 513 (41.8%) | 213 (41.5%) |
| 20 to 24 Years | 1,191 (73.1%) | 207 (17.4%) |
| 25 to 29 Years | 713 (87.8%) | 0 (0.0%) |
| 30 to 34 Years | 1,156 (83.7%) | 53 (4.6%) |
| 35 to 44 Years | 1,662 (78.2%) | 33 (2.0%) |
| 45 to 54 Years | 1,536 (80.1%) | 40 (2.6%) |
| 55 to 59 Years | 1,124 (82.2%) | 219 (19.5%) |
| 60 to 64 Years | 624 (58.3%) | 0 (0.0%) |
| 65 to 74 Years | 313 (36.1%) | 0 (0.0%) |
| 75 Years and over | 73 (21.5%) | 0 (0.0%) |
| Total | 8,902 (69.9%) | 766 (8.6%) |
Employment Status by Educational Attainment in Glenn Heights
According to labor force statistics for Glenn Heights, 78.6% of individuals (6,817) out of the total population between 25 and 64 years of age (8,673) are in the labor force, with 5.1% or 348 of them being unemployed. The group with the highest labor force participation rate are those with the educational attainment of bachelor's degree or higher, with 92.4% or 2,249 individuals in the labor force. Within the labor force, individuals with high school diploma education have the highest percentage of unemployment, with 12.1% or 229 of them being unemployed.
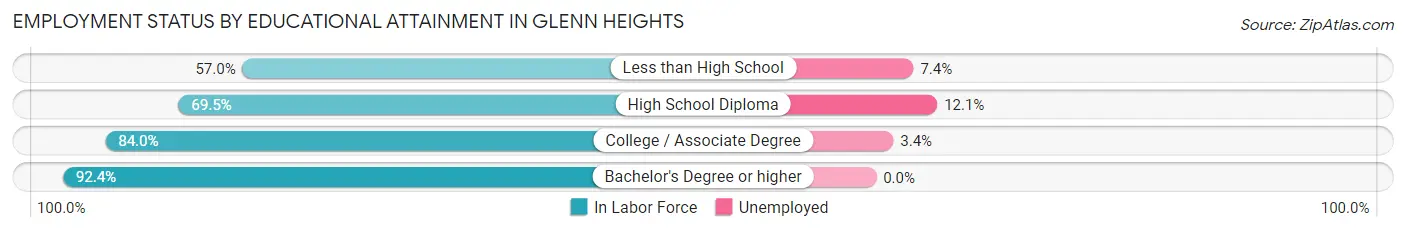
| Educational Attainment | In Labor Force | Unemployed |
| Less than High School | 592 (57.0%) | 77 (7.4%) |
| High School Diploma | 1,896 (69.5%) | 330 (12.1%) |
| College / Associate Degree | 2,076 (84.0%) | 84 (3.4%) |
| Bachelor's Degree or higher | 2,249 (92.4%) | 0 (0.0%) |
| Total | 6,817 (78.6%) | 442 (5.1%) |
Employment Occupations by Sex in Glenn Heights
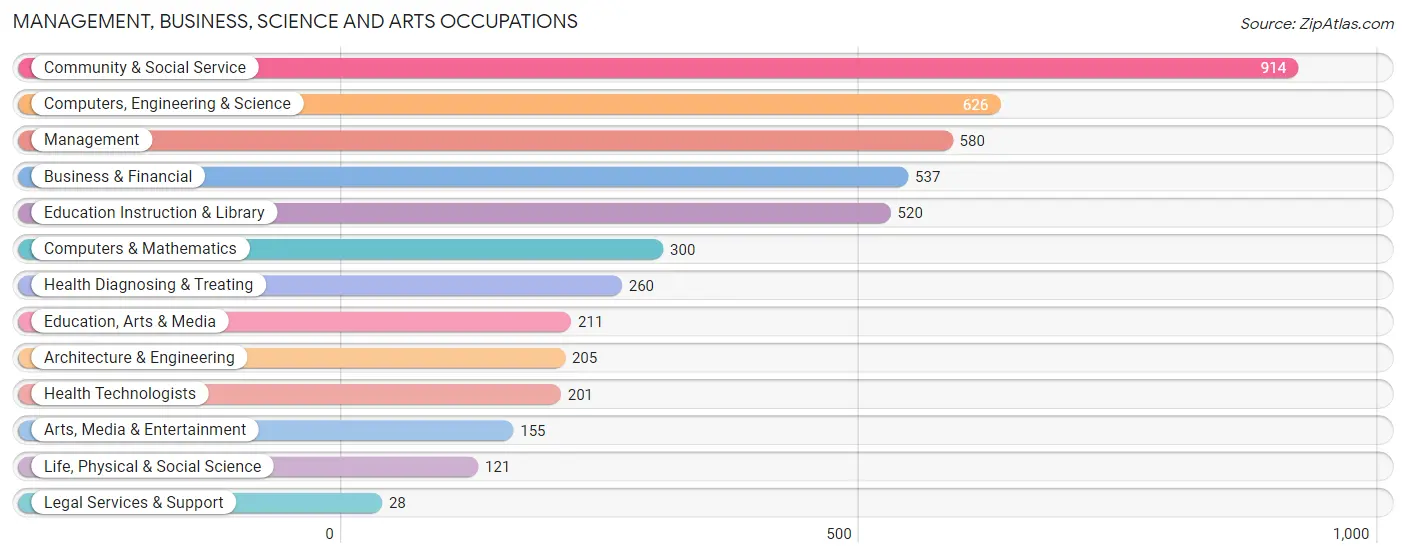
Management, Business, Science and Arts Occupations
The most common Management, Business, Science and Arts occupations in Glenn Heights are Community & Social Service (914 | 11.2%), Computers, Engineering & Science (626 | 7.7%), Management (580 | 7.1%), Business & Financial (537 | 6.6%), and Education Instruction & Library (520 | 6.4%).
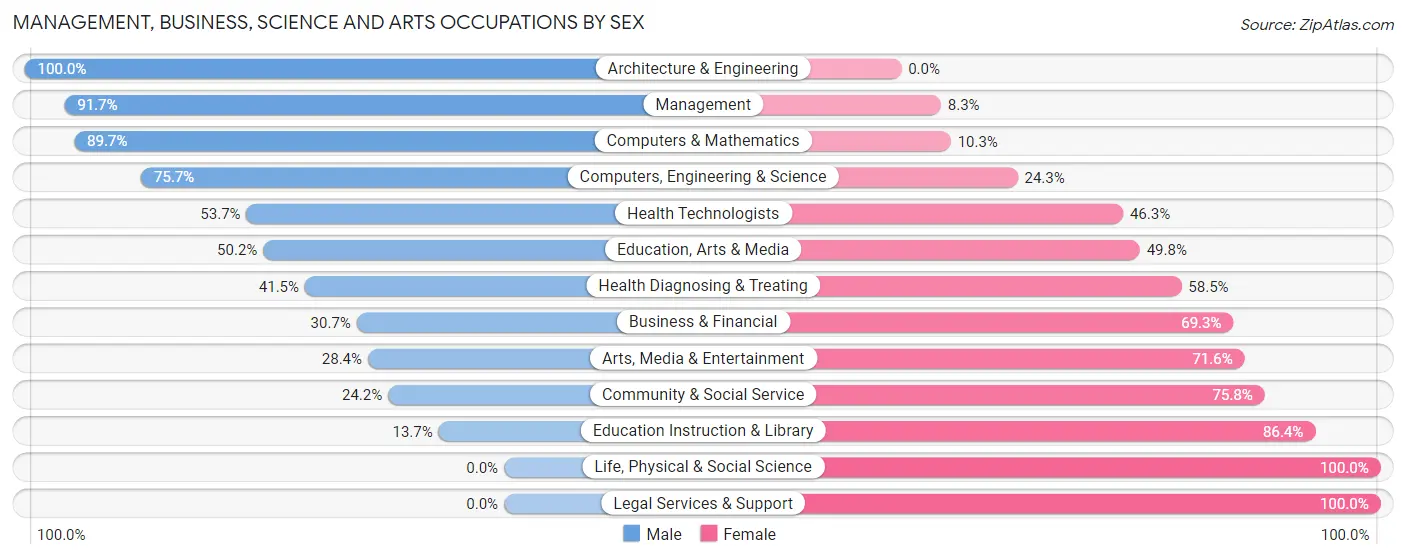
Management, Business, Science and Arts Occupations by Sex
Within the Management, Business, Science and Arts occupations in Glenn Heights, the most male-oriented occupations are Architecture & Engineering (100.0%), Management (91.7%), and Computers & Mathematics (89.7%), while the most female-oriented occupations are Life, Physical & Social Science (100.0%), Legal Services & Support (100.0%), and Education Instruction & Library (86.4%).
| Occupation | Male | Female |
| Management | 532 (91.7%) | 48 (8.3%) |
| Business & Financial | 165 (30.7%) | 372 (69.3%) |
| Computers, Engineering & Science | 474 (75.7%) | 152 (24.3%) |
| Computers & Mathematics | 269 (89.7%) | 31 (10.3%) |
| Architecture & Engineering | 205 (100.0%) | 0 (0.0%) |
| Life, Physical & Social Science | 0 (0.0%) | 121 (100.0%) |
| Community & Social Service | 221 (24.2%) | 693 (75.8%) |
| Education, Arts & Media | 106 (50.2%) | 105 (49.8%) |
| Legal Services & Support | 0 (0.0%) | 28 (100.0%) |
| Education Instruction & Library | 71 (13.7%) | 449 (86.4%) |
| Arts, Media & Entertainment | 44 (28.4%) | 111 (71.6%) |
| Health Diagnosing & Treating | 108 (41.5%) | 152 (58.5%) |
| Health Technologists | 108 (53.7%) | 93 (46.3%) |
| Total (Category) | 1,500 (51.4%) | 1,417 (48.6%) |
| Total (Overall) | 3,908 (48.0%) | 4,231 (52.0%) |
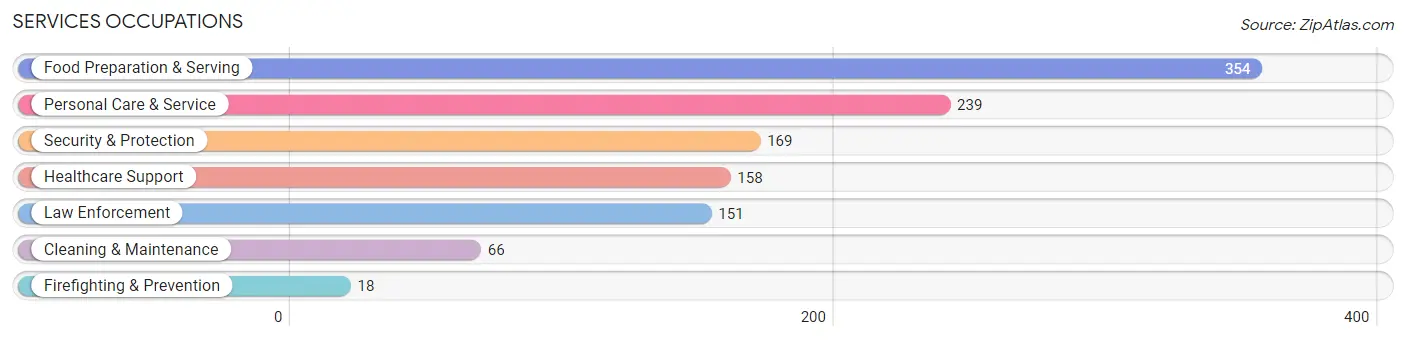
Services Occupations
The most common Services occupations in Glenn Heights are Food Preparation & Serving (354 | 4.3%), Personal Care & Service (239 | 2.9%), Security & Protection (169 | 2.1%), Healthcare Support (158 | 1.9%), and Law Enforcement (151 | 1.9%).
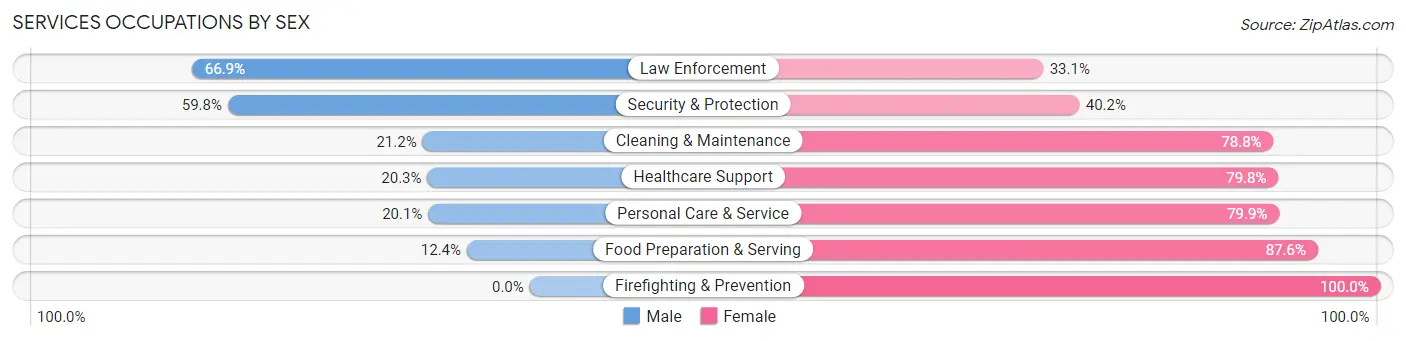
Services Occupations by Sex
Within the Services occupations in Glenn Heights, the most male-oriented occupations are Law Enforcement (66.9%), Security & Protection (59.8%), and Cleaning & Maintenance (21.2%), while the most female-oriented occupations are Firefighting & Prevention (100.0%), Food Preparation & Serving (87.6%), and Personal Care & Service (79.9%).
| Occupation | Male | Female |
| Healthcare Support | 32 (20.3%) | 126 (79.7%) |
| Security & Protection | 101 (59.8%) | 68 (40.2%) |
| Firefighting & Prevention | 0 (0.0%) | 18 (100.0%) |
| Law Enforcement | 101 (66.9%) | 50 (33.1%) |
| Food Preparation & Serving | 44 (12.4%) | 310 (87.6%) |
| Cleaning & Maintenance | 14 (21.2%) | 52 (78.8%) |
| Personal Care & Service | 48 (20.1%) | 191 (79.9%) |
| Total (Category) | 239 (24.2%) | 747 (75.8%) |
| Total (Overall) | 3,908 (48.0%) | 4,231 (52.0%) |
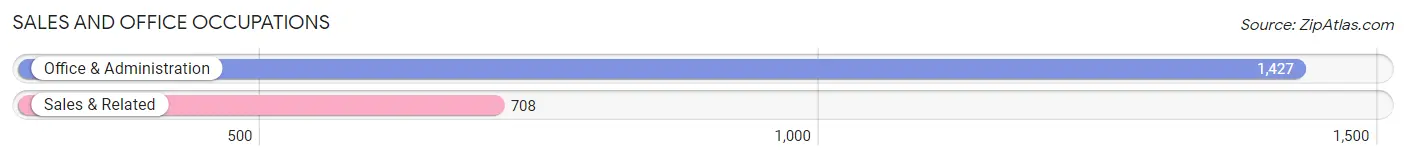
Sales and Office Occupations
The most common Sales and Office occupations in Glenn Heights are Office & Administration (1,427 | 17.5%), and Sales & Related (708 | 8.7%).
Sales and Office Occupations by Sex
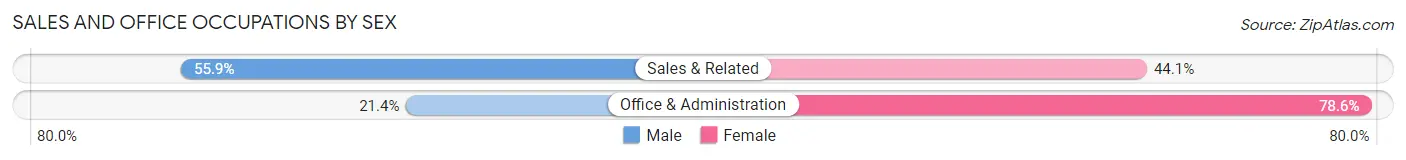
| Occupation | Male | Female |
| Sales & Related | 396 (55.9%) | 312 (44.1%) |
| Office & Administration | 306 (21.4%) | 1,121 (78.6%) |
| Total (Category) | 702 (32.9%) | 1,433 (67.1%) |
| Total (Overall) | 3,908 (48.0%) | 4,231 (52.0%) |
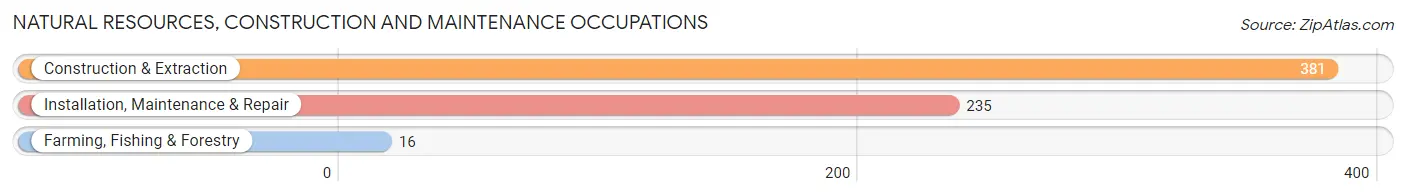
Natural Resources, Construction and Maintenance Occupations
The most common Natural Resources, Construction and Maintenance occupations in Glenn Heights are Construction & Extraction (381 | 4.7%), Installation, Maintenance & Repair (235 | 2.9%), and Farming, Fishing & Forestry (16 | 0.2%).
Natural Resources, Construction and Maintenance Occupations by Sex
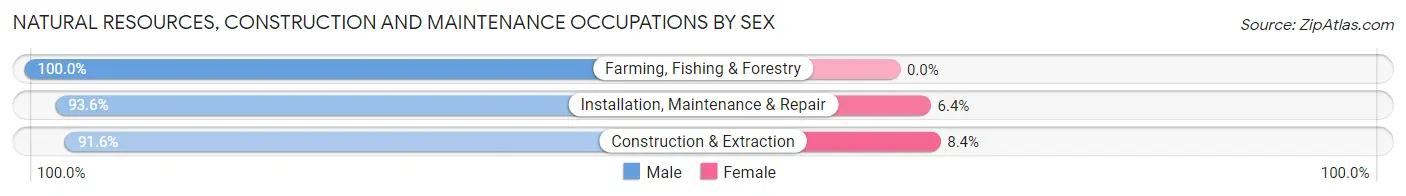
| Occupation | Male | Female |
| Farming, Fishing & Forestry | 16 (100.0%) | 0 (0.0%) |
| Construction & Extraction | 349 (91.6%) | 32 (8.4%) |
| Installation, Maintenance & Repair | 220 (93.6%) | 15 (6.4%) |
| Total (Category) | 585 (92.6%) | 47 (7.4%) |
| Total (Overall) | 3,908 (48.0%) | 4,231 (52.0%) |
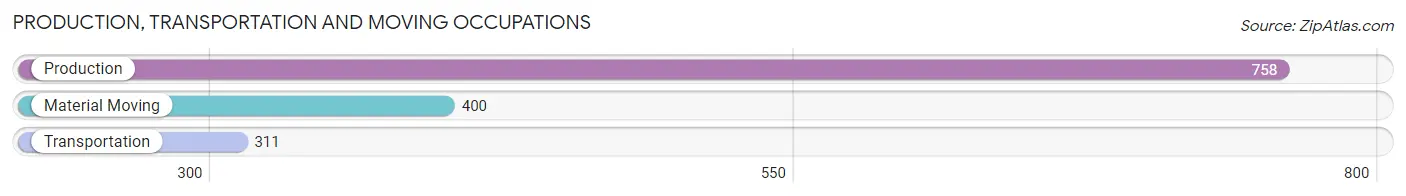
Production, Transportation and Moving Occupations
The most common Production, Transportation and Moving occupations in Glenn Heights are Production (758 | 9.3%), Material Moving (400 | 4.9%), and Transportation (311 | 3.8%).
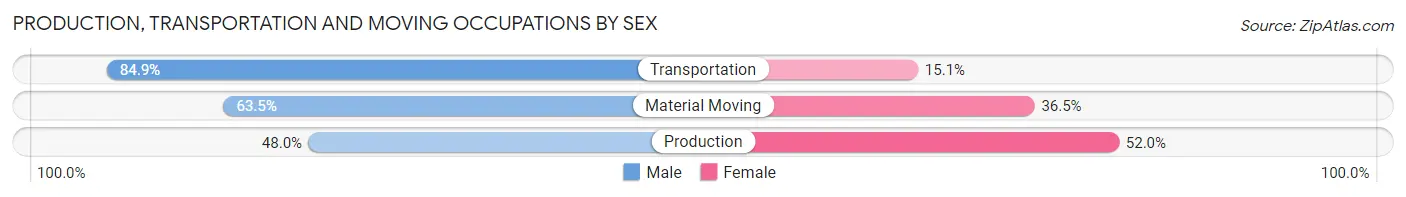
Production, Transportation and Moving Occupations by Sex
| Occupation | Male | Female |
| Production | 364 (48.0%) | 394 (52.0%) |
| Transportation | 264 (84.9%) | 47 (15.1%) |
| Material Moving | 254 (63.5%) | 146 (36.5%) |
| Total (Category) | 882 (60.0%) | 587 (40.0%) |
| Total (Overall) | 3,908 (48.0%) | 4,231 (52.0%) |
Employment Industries by Sex in Glenn Heights
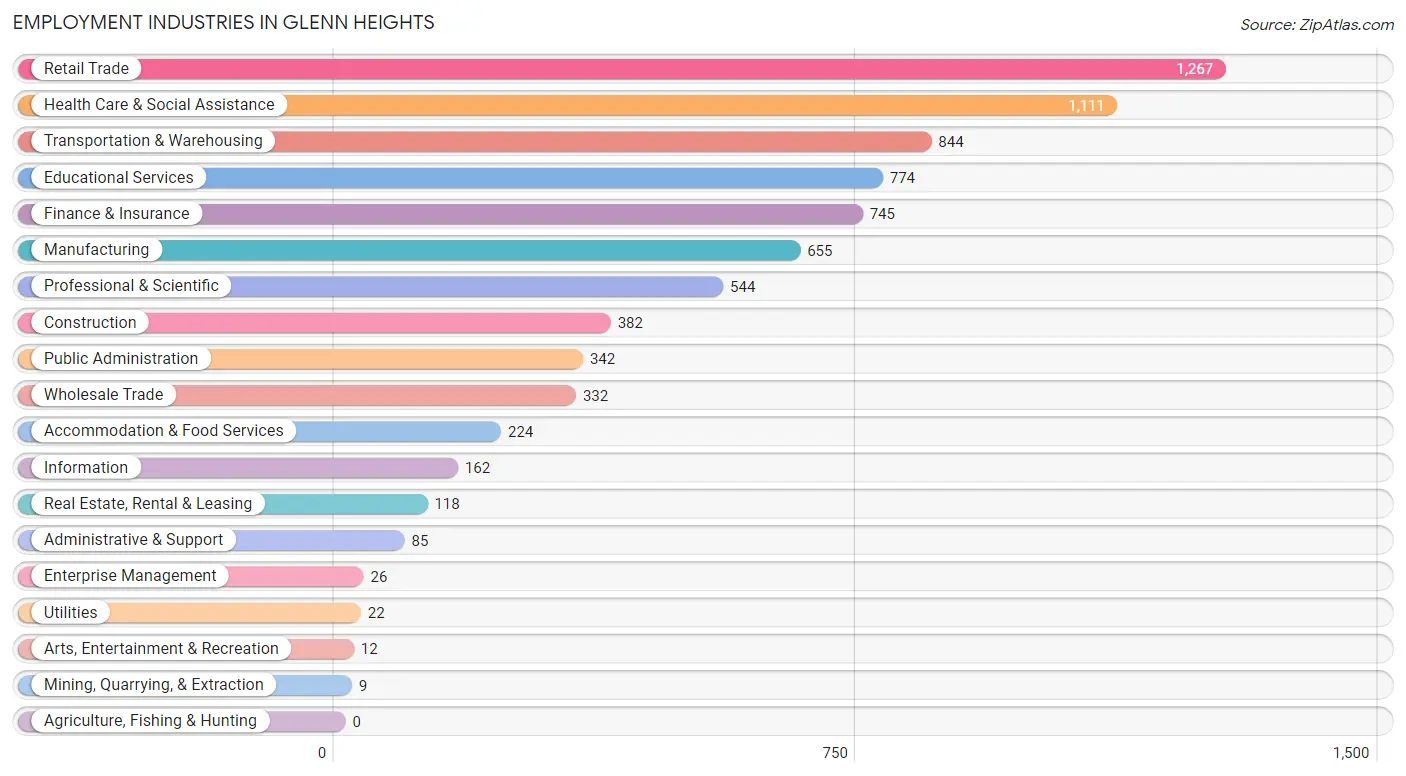
Employment Industries in Glenn Heights
The major employment industries in Glenn Heights include Retail Trade (1,267 | 15.6%), Health Care & Social Assistance (1,111 | 13.7%), Transportation & Warehousing (844 | 10.4%), Educational Services (774 | 9.5%), and Finance & Insurance (745 | 9.1%).
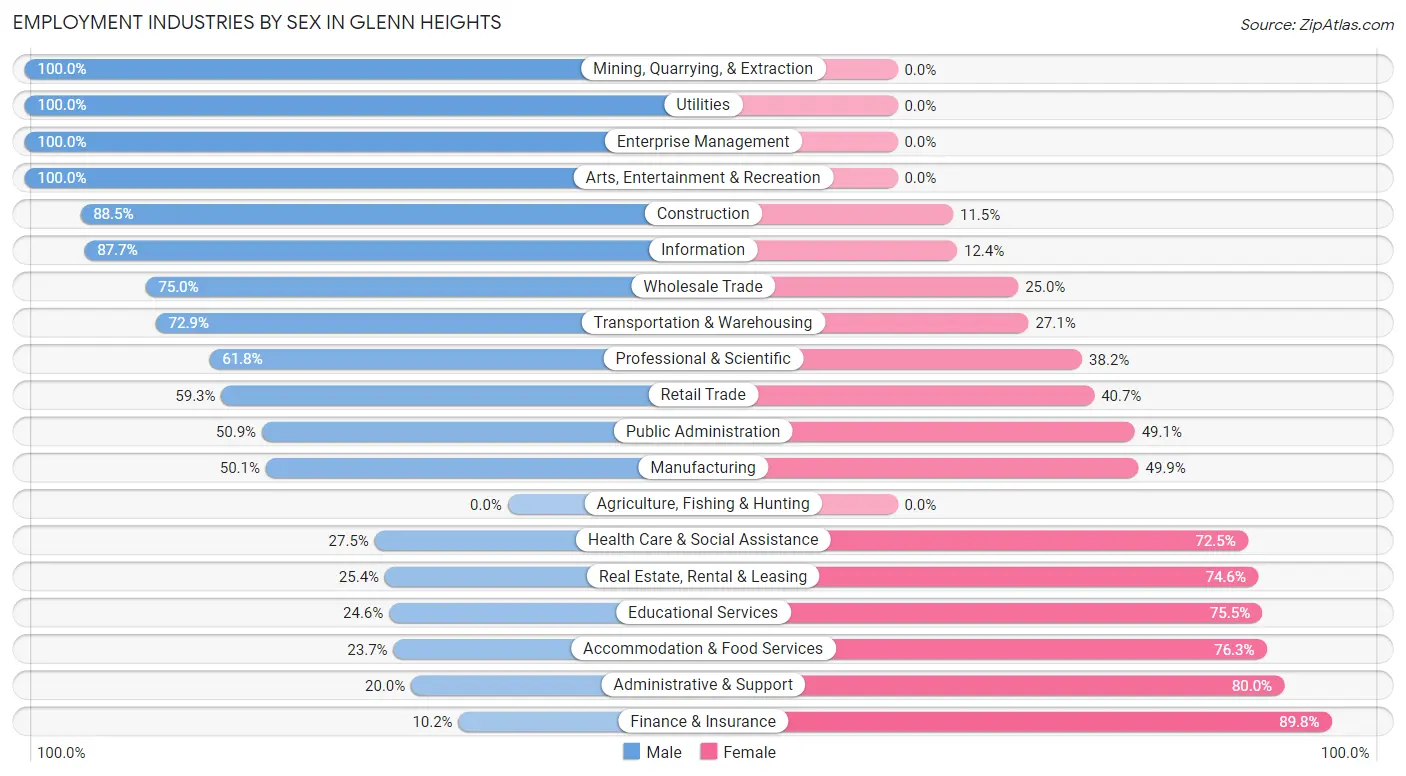
Employment Industries by Sex in Glenn Heights
The Glenn Heights industries that see more men than women are Mining, Quarrying, & Extraction (100.0%), Utilities (100.0%), and Enterprise Management (100.0%), whereas the industries that tend to have a higher number of women are Finance & Insurance (89.8%), Administrative & Support (80.0%), and Accommodation & Food Services (76.3%).
| Industry | Male | Female |
| Agriculture, Fishing & Hunting | 0 (0.0%) | 0 (0.0%) |
| Mining, Quarrying, & Extraction | 9 (100.0%) | 0 (0.0%) |
| Construction | 338 (88.5%) | 44 (11.5%) |
| Manufacturing | 328 (50.1%) | 327 (49.9%) |
| Wholesale Trade | 249 (75.0%) | 83 (25.0%) |
| Retail Trade | 751 (59.3%) | 516 (40.7%) |
| Transportation & Warehousing | 615 (72.9%) | 229 (27.1%) |
| Utilities | 22 (100.0%) | 0 (0.0%) |
| Information | 142 (87.6%) | 20 (12.3%) |
| Finance & Insurance | 76 (10.2%) | 669 (89.8%) |
| Real Estate, Rental & Leasing | 30 (25.4%) | 88 (74.6%) |
| Professional & Scientific | 336 (61.8%) | 208 (38.2%) |
| Enterprise Management | 26 (100.0%) | 0 (0.0%) |
| Administrative & Support | 17 (20.0%) | 68 (80.0%) |
| Educational Services | 190 (24.5%) | 584 (75.4%) |
| Health Care & Social Assistance | 306 (27.5%) | 805 (72.5%) |
| Arts, Entertainment & Recreation | 12 (100.0%) | 0 (0.0%) |
| Accommodation & Food Services | 53 (23.7%) | 171 (76.3%) |
| Public Administration | 174 (50.9%) | 168 (49.1%) |
| Total | 3,908 (48.0%) | 4,231 (52.0%) |
Education in Glenn Heights
School Enrollment in Glenn Heights
The most common levels of schooling among the 4,669 students in Glenn Heights are elementary school (1,045 | 22.4%), middle school (1,042 | 22.3%), and high school (967 | 20.7%).
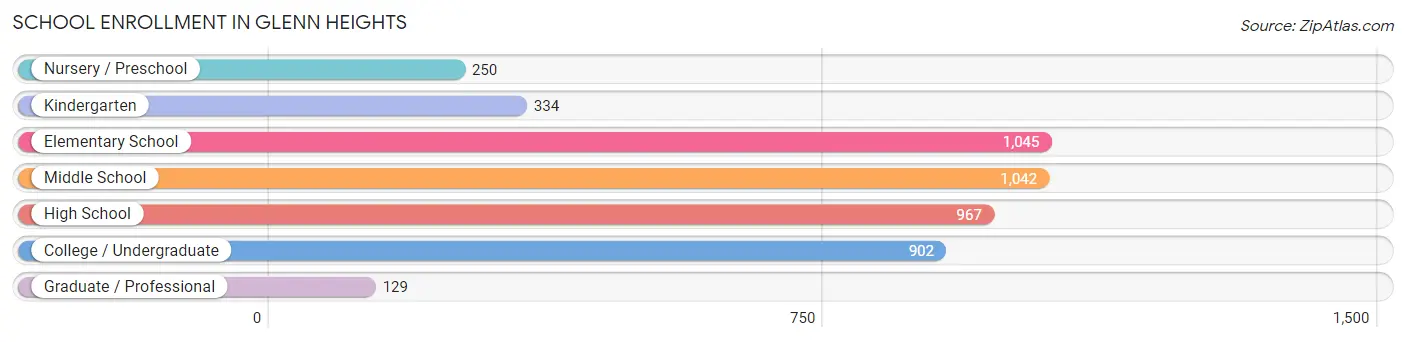
| School Level | # Students | % Students |
| Nursery / Preschool | 250 | 5.3% |
| Kindergarten | 334 | 7.1% |
| Elementary School | 1,045 | 22.4% |
| Middle School | 1,042 | 22.3% |
| High School | 967 | 20.7% |
| College / Undergraduate | 902 | 19.3% |
| Graduate / Professional | 129 | 2.8% |
| Total | 4,669 | 100.0% |
School Enrollment by Age by Funding Source in Glenn Heights
Out of a total of 4,669 students who are enrolled in schools in Glenn Heights, 644 (13.8%) attend a private institution, while the remaining 4,025 (86.2%) are enrolled in public schools. The age group of 18 to 19 year olds has the highest likelihood of being enrolled in private schools, with 131 (37.1% in the age bracket) enrolled. Conversely, the age group of 20 to 24 year olds has the lowest likelihood of being enrolled in a private school, with 397 (95.4% in the age bracket) attending a public institution.
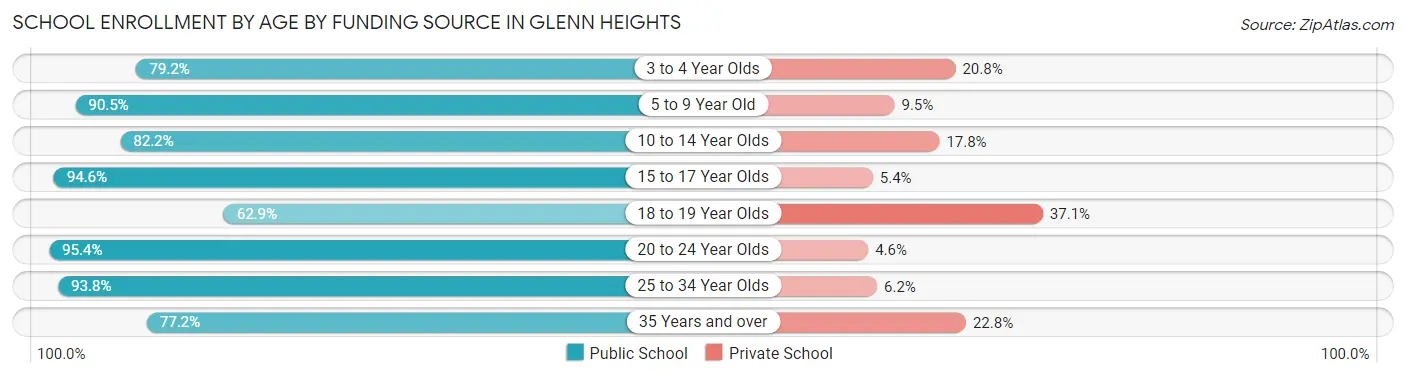
| Age Bracket | Public School | Private School |
| 3 to 4 Year Olds | 171 (79.2%) | 45 (20.8%) |
| 5 to 9 Year Old | 1,071 (90.5%) | 112 (9.5%) |
| 10 to 14 Year Olds | 1,142 (82.2%) | 248 (17.8%) |
| 15 to 17 Year Olds | 643 (94.6%) | 37 (5.4%) |
| 18 to 19 Year Olds | 222 (62.9%) | 131 (37.1%) |
| 20 to 24 Year Olds | 397 (95.4%) | 19 (4.6%) |
| 25 to 34 Year Olds | 256 (93.8%) | 17 (6.2%) |
| 35 Years and over | 122 (77.2%) | 36 (22.8%) |
| Total | 4,025 (86.2%) | 644 (13.8%) |
Educational Attainment by Field of Study in Glenn Heights
Business (716 | 24.3%), education (349 | 11.9%), social sciences (347 | 11.8%), science & technology (342 | 11.6%), and engineering (227 | 7.7%) are the most common fields of study among 2,940 individuals in Glenn Heights who have obtained a bachelor's degree or higher.
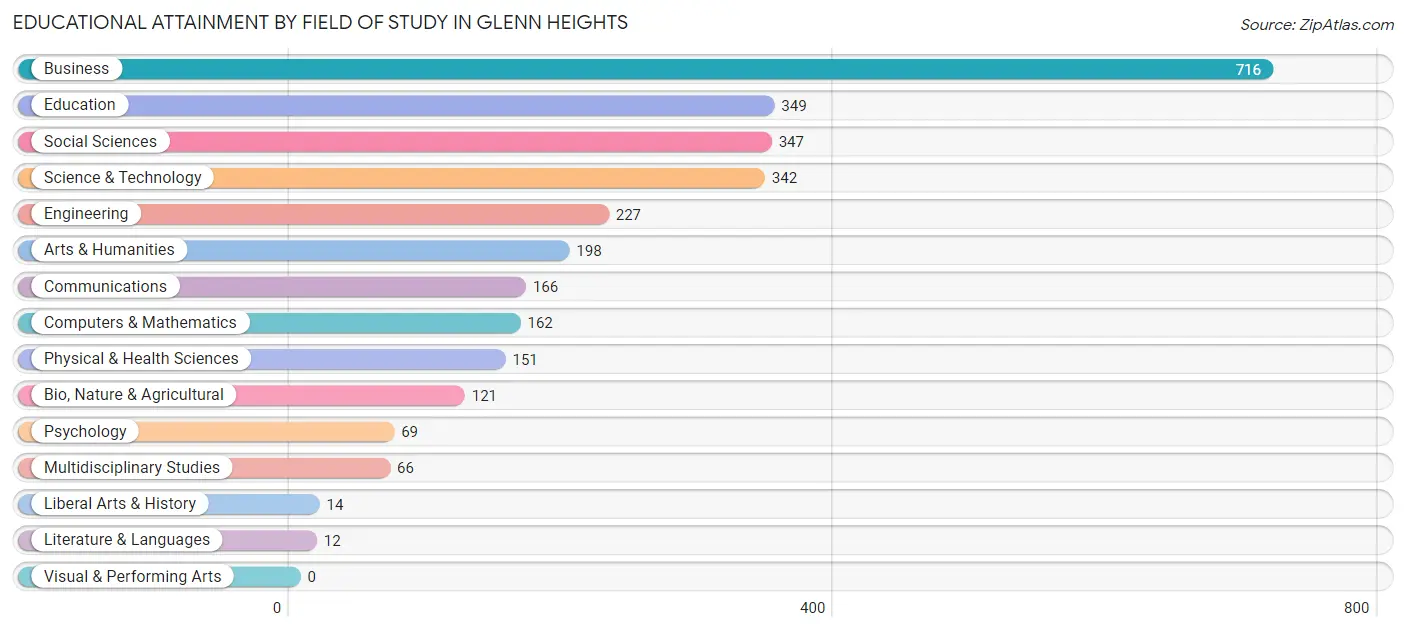
| Field of Study | # Graduates | % Graduates |
| Computers & Mathematics | 162 | 5.5% |
| Bio, Nature & Agricultural | 121 | 4.1% |
| Physical & Health Sciences | 151 | 5.1% |
| Psychology | 69 | 2.4% |
| Social Sciences | 347 | 11.8% |
| Engineering | 227 | 7.7% |
| Multidisciplinary Studies | 66 | 2.2% |
| Science & Technology | 342 | 11.6% |
| Business | 716 | 24.3% |
| Education | 349 | 11.9% |
| Literature & Languages | 12 | 0.4% |
| Liberal Arts & History | 14 | 0.5% |
| Visual & Performing Arts | 0 | 0.0% |
| Communications | 166 | 5.7% |
| Arts & Humanities | 198 | 6.7% |
| Total | 2,940 | 100.0% |
Transportation & Commute in Glenn Heights
Vehicle Availability by Sex in Glenn Heights
The most prevalent vehicle ownership categories in Glenn Heights are males with 2 vehicles (1,457, accounting for 37.3%) and females with 2 vehicles (1,157, making up 36.3%).
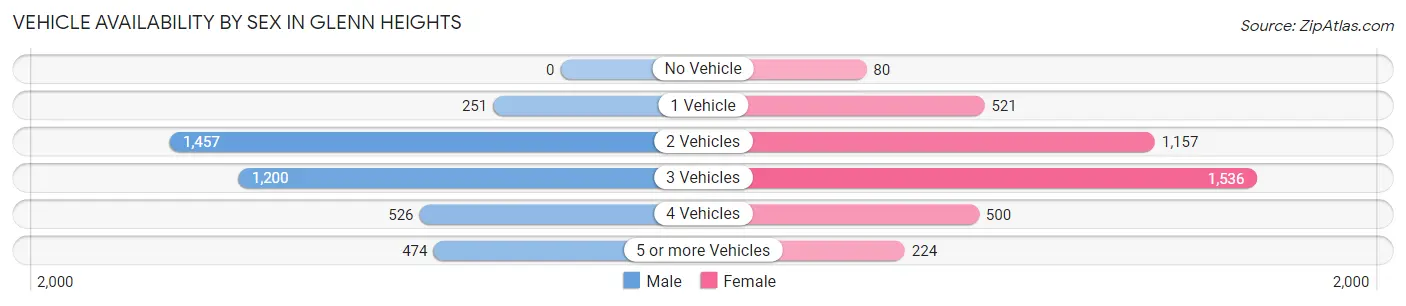
| Vehicles Available | Male | Female |
| No Vehicle | 0 (0.0%) | 80 (2.0%) |
| 1 Vehicle | 251 (6.4%) | 521 (13.0%) |
| 2 Vehicles | 1,457 (37.3%) | 1,157 (28.8%) |
| 3 Vehicles | 1,200 (30.7%) | 1,536 (38.2%) |
| 4 Vehicles | 526 (13.5%) | 500 (12.4%) |
| 5 or more Vehicles | 474 (12.1%) | 224 (5.6%) |
| Total | 3,908 (100.0%) | 4,018 (100.0%) |
Commute Time in Glenn Heights
The most frequently occuring commute durations in Glenn Heights are 30 to 34 minutes (1,345 commuters, 19.4%), 45 to 59 minutes (1,068 commuters, 15.4%), and 15 to 19 minutes (911 commuters, 13.2%).
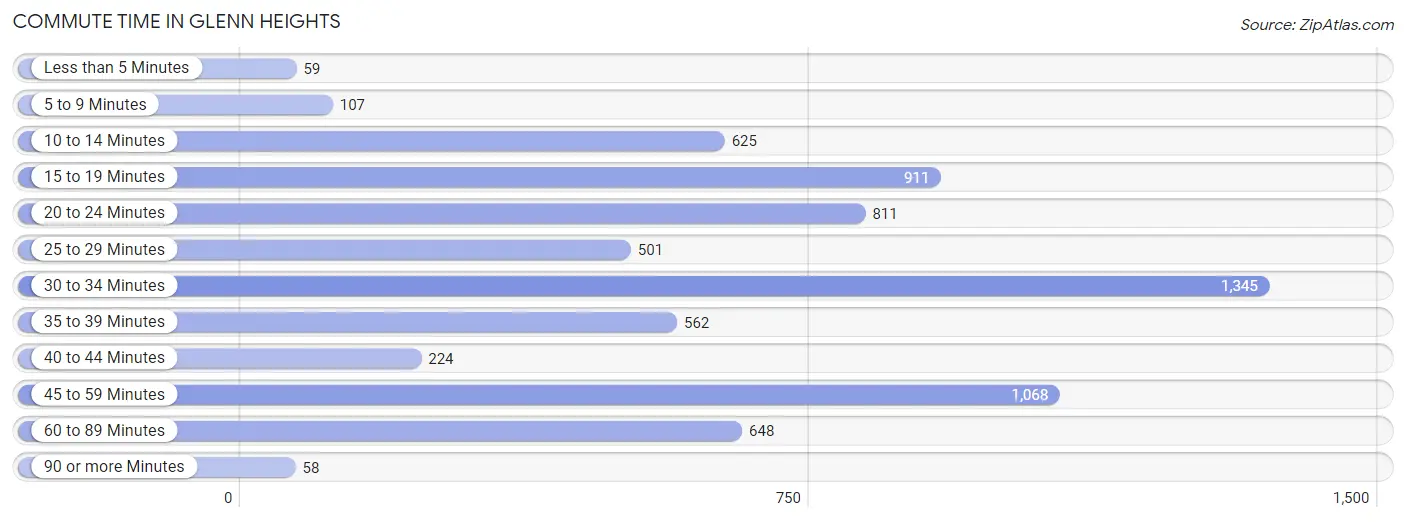
| Commute Time | # Commuters | % Commuters |
| Less than 5 Minutes | 59 | 0.9% |
| 5 to 9 Minutes | 107 | 1.5% |
| 10 to 14 Minutes | 625 | 9.0% |
| 15 to 19 Minutes | 911 | 13.2% |
| 20 to 24 Minutes | 811 | 11.7% |
| 25 to 29 Minutes | 501 | 7.2% |
| 30 to 34 Minutes | 1,345 | 19.4% |
| 35 to 39 Minutes | 562 | 8.1% |
| 40 to 44 Minutes | 224 | 3.2% |
| 45 to 59 Minutes | 1,068 | 15.4% |
| 60 to 89 Minutes | 648 | 9.4% |
| 90 or more Minutes | 58 | 0.8% |
Commute Time by Sex in Glenn Heights
The most common commute times in Glenn Heights are 30 to 34 minutes (690 commuters, 19.9%) for males and 30 to 34 minutes (655 commuters, 19.0%) for females.
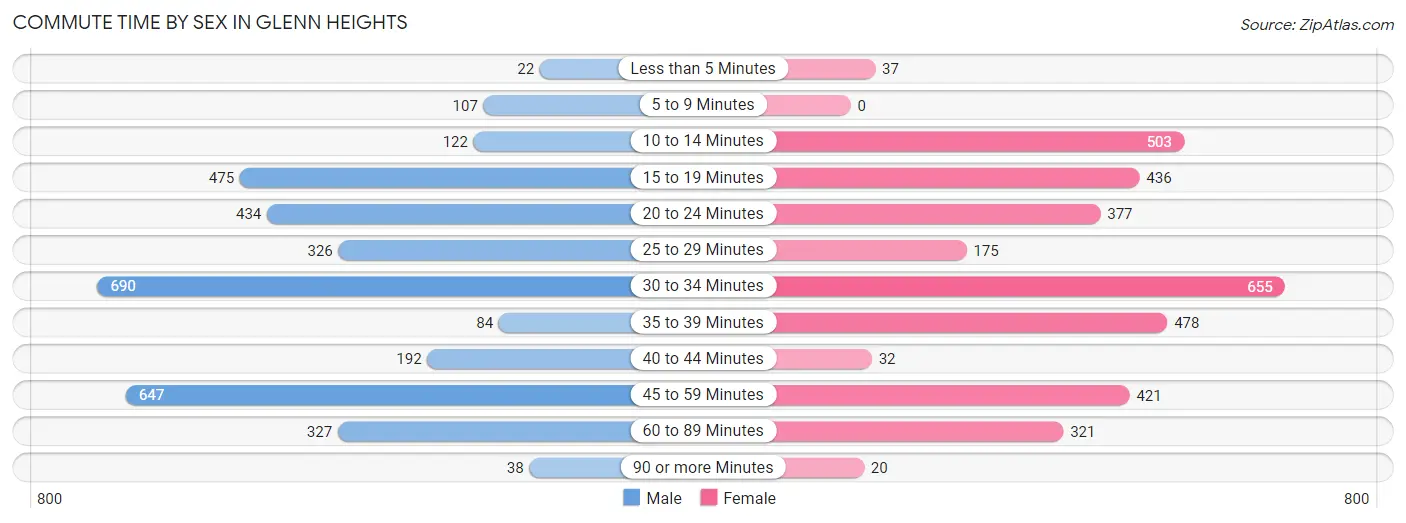
| Commute Time | Male | Female |
| Less than 5 Minutes | 22 (0.6%) | 37 (1.1%) |
| 5 to 9 Minutes | 107 (3.1%) | 0 (0.0%) |
| 10 to 14 Minutes | 122 (3.5%) | 503 (14.6%) |
| 15 to 19 Minutes | 475 (13.7%) | 436 (12.6%) |
| 20 to 24 Minutes | 434 (12.5%) | 377 (10.9%) |
| 25 to 29 Minutes | 326 (9.4%) | 175 (5.1%) |
| 30 to 34 Minutes | 690 (19.9%) | 655 (19.0%) |
| 35 to 39 Minutes | 84 (2.4%) | 478 (13.8%) |
| 40 to 44 Minutes | 192 (5.5%) | 32 (0.9%) |
| 45 to 59 Minutes | 647 (18.7%) | 421 (12.2%) |
| 60 to 89 Minutes | 327 (9.4%) | 321 (9.3%) |
| 90 or more Minutes | 38 (1.1%) | 20 (0.6%) |
Time of Departure to Work by Sex in Glenn Heights
The most frequent times of departure to work in Glenn Heights are 8:00 AM to 8:29 AM (473, 13.7%) for males and 7:00 AM to 7:29 AM (760, 22.0%) for females.
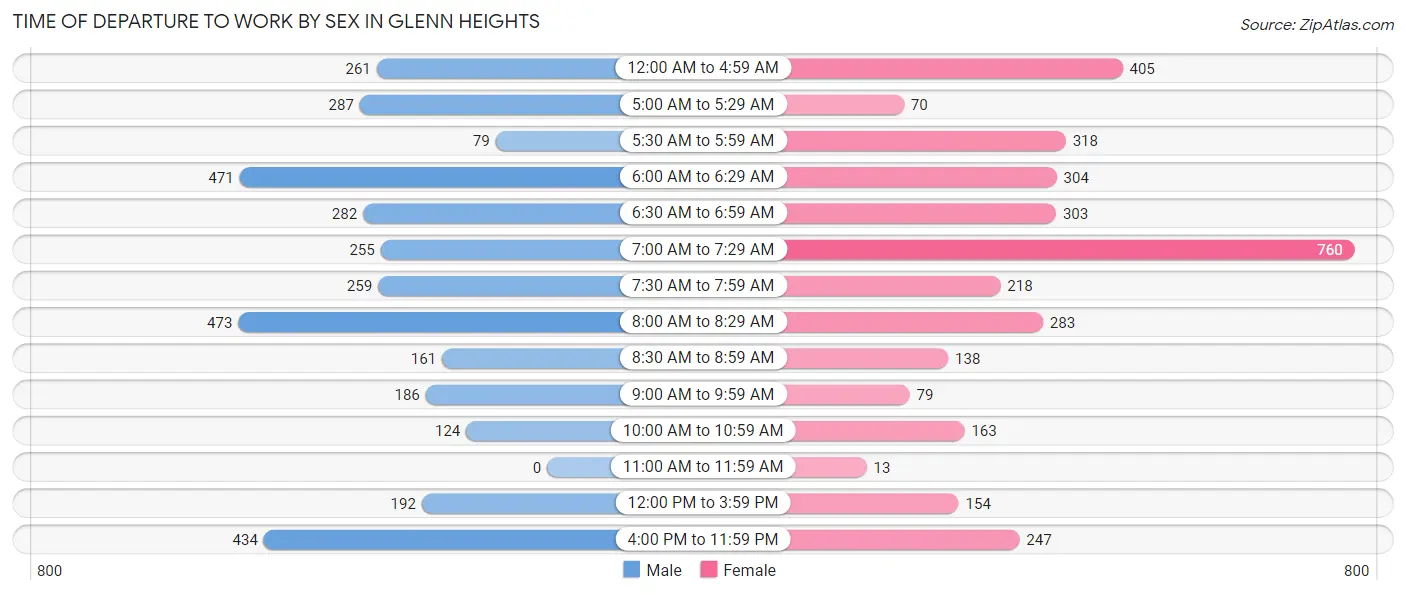
| Time of Departure | Male | Female |
| 12:00 AM to 4:59 AM | 261 (7.5%) | 405 (11.7%) |
| 5:00 AM to 5:29 AM | 287 (8.3%) | 70 (2.0%) |
| 5:30 AM to 5:59 AM | 79 (2.3%) | 318 (9.2%) |
| 6:00 AM to 6:29 AM | 471 (13.6%) | 304 (8.8%) |
| 6:30 AM to 6:59 AM | 282 (8.1%) | 303 (8.8%) |
| 7:00 AM to 7:29 AM | 255 (7.4%) | 760 (22.0%) |
| 7:30 AM to 7:59 AM | 259 (7.5%) | 218 (6.3%) |
| 8:00 AM to 8:29 AM | 473 (13.7%) | 283 (8.2%) |
| 8:30 AM to 8:59 AM | 161 (4.6%) | 138 (4.0%) |
| 9:00 AM to 9:59 AM | 186 (5.4%) | 79 (2.3%) |
| 10:00 AM to 10:59 AM | 124 (3.6%) | 163 (4.7%) |
| 11:00 AM to 11:59 AM | 0 (0.0%) | 13 (0.4%) |
| 12:00 PM to 3:59 PM | 192 (5.5%) | 154 (4.5%) |
| 4:00 PM to 11:59 PM | 434 (12.5%) | 247 (7.1%) |
| Total | 3,464 (100.0%) | 3,455 (100.0%) |
Housing Occupancy in Glenn Heights
Occupancy by Ownership in Glenn Heights
Of the total 5,153 dwellings in Glenn Heights, owner-occupied units account for 4,430 (86.0%), while renter-occupied units make up 723 (14.0%).
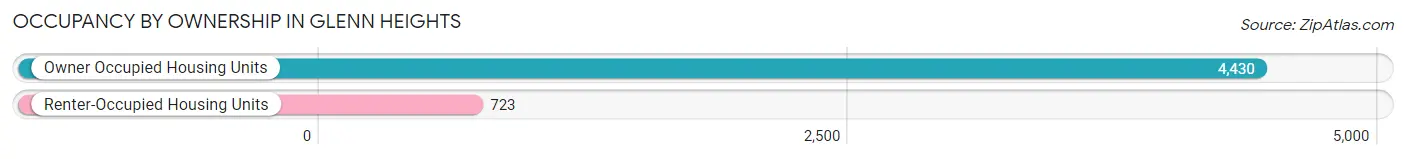
| Occupancy | # Housing Units | % Housing Units |
| Owner Occupied Housing Units | 4,430 | 86.0% |
| Renter-Occupied Housing Units | 723 | 14.0% |
| Total Occupied Housing Units | 5,153 | 100.0% |
Occupancy by Household Size in Glenn Heights
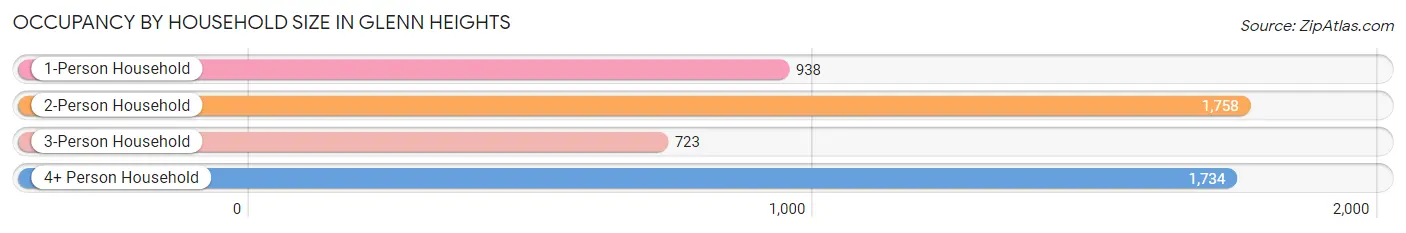
| Household Size | # Housing Units | % Housing Units |
| 1-Person Household | 938 | 18.2% |
| 2-Person Household | 1,758 | 34.1% |
| 3-Person Household | 723 | 14.0% |
| 4+ Person Household | 1,734 | 33.7% |
| Total Housing Units | 5,153 | 100.0% |
Occupancy by Ownership by Household Size in Glenn Heights
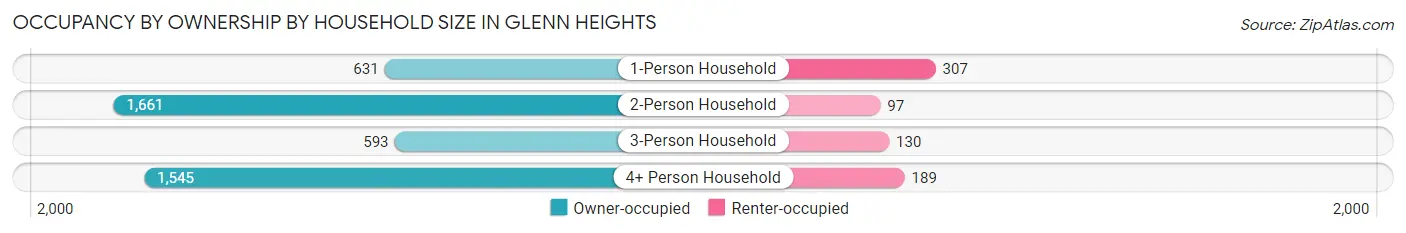
| Household Size | Owner-occupied | Renter-occupied |
| 1-Person Household | 631 (67.3%) | 307 (32.7%) |
| 2-Person Household | 1,661 (94.5%) | 97 (5.5%) |
| 3-Person Household | 593 (82.0%) | 130 (18.0%) |
| 4+ Person Household | 1,545 (89.1%) | 189 (10.9%) |
| Total Housing Units | 4,430 (86.0%) | 723 (14.0%) |
Occupancy by Educational Attainment in Glenn Heights
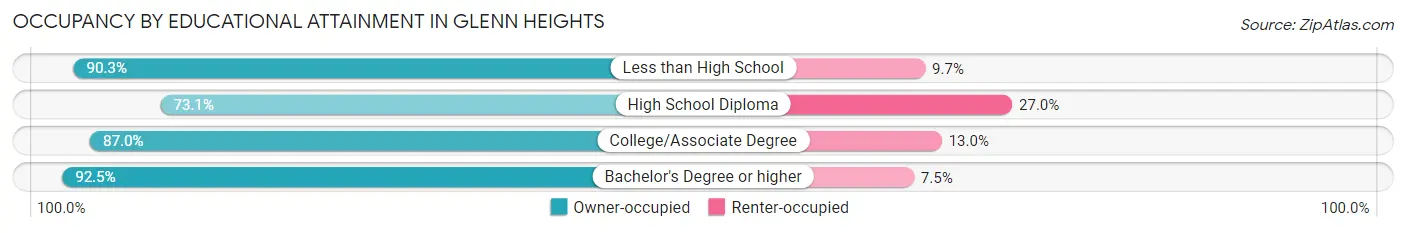
| Household Size | Owner-occupied | Renter-occupied |
| Less than High School | 567 (90.3%) | 61 (9.7%) |
| High School Diploma | 900 (73.1%) | 332 (27.0%) |
| College/Associate Degree | 1,318 (87.0%) | 197 (13.0%) |
| Bachelor's Degree or higher | 1,645 (92.5%) | 133 (7.5%) |
Occupancy by Age of Householder in Glenn Heights
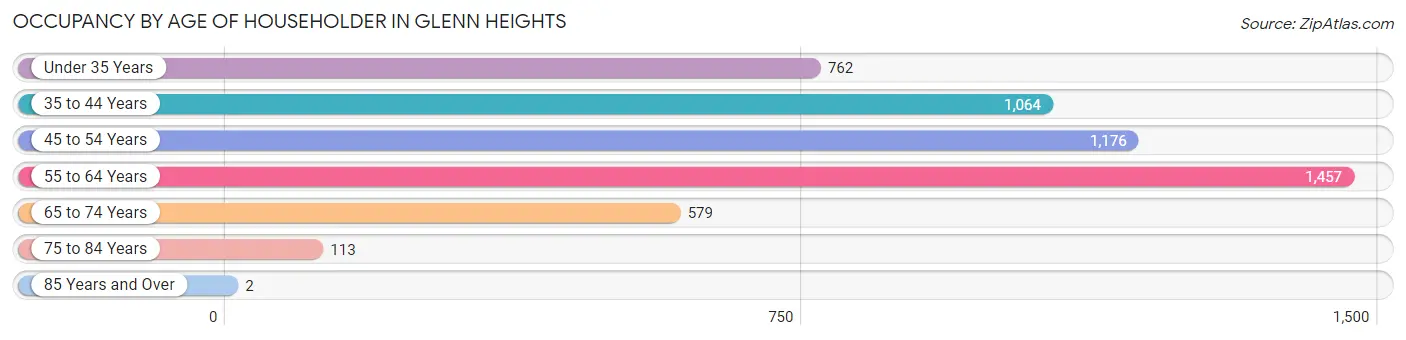
| Age Bracket | # Households | % Households |
| Under 35 Years | 762 | 14.8% |
| 35 to 44 Years | 1,064 | 20.6% |
| 45 to 54 Years | 1,176 | 22.8% |
| 55 to 64 Years | 1,457 | 28.3% |
| 65 to 74 Years | 579 | 11.2% |
| 75 to 84 Years | 113 | 2.2% |
| 85 Years and Over | 2 | 0.0% |
| Total | 5,153 | 100.0% |
Housing Finances in Glenn Heights
Median Income by Occupancy in Glenn Heights
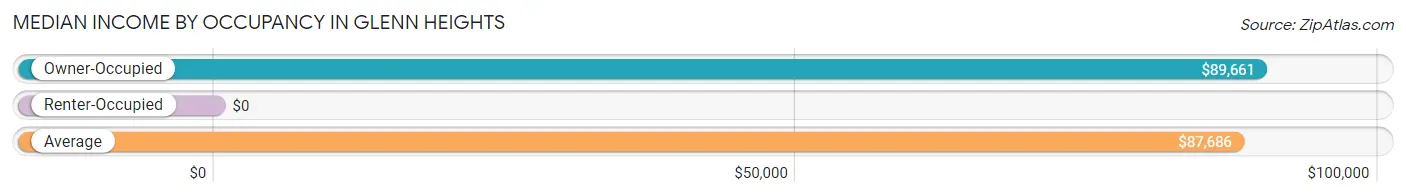
| Occupancy Type | # Households | Median Income |
| Owner-Occupied | 4,430 (86.0%) | $89,661 |
| Renter-Occupied | 723 (14.0%) | $0 |
| Average | 5,153 (100.0%) | $87,686 |
Occupancy by Householder Income Bracket in Glenn Heights
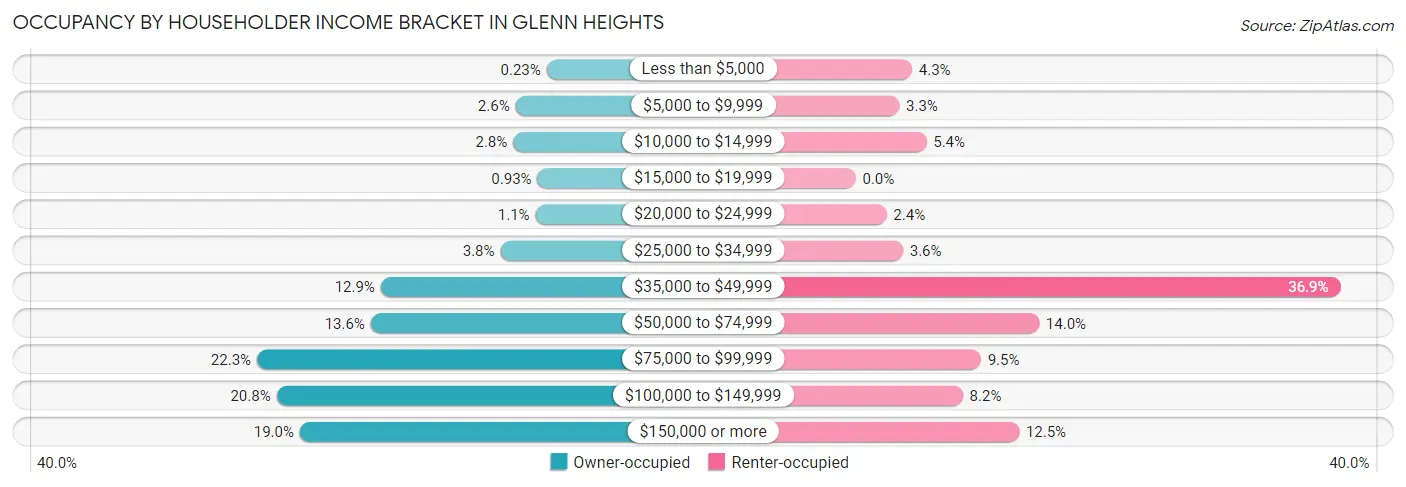
| Income Bracket | Owner-occupied | Renter-occupied |
| Less than $5,000 | 10 (0.2%) | 31 (4.3%) |
| $5,000 to $9,999 | 115 (2.6%) | 24 (3.3%) |
| $10,000 to $14,999 | 123 (2.8%) | 39 (5.4%) |
| $15,000 to $19,999 | 41 (0.9%) | 0 (0.0%) |
| $20,000 to $24,999 | 48 (1.1%) | 17 (2.4%) |
| $25,000 to $34,999 | 166 (3.7%) | 26 (3.6%) |
| $35,000 to $49,999 | 570 (12.9%) | 267 (36.9%) |
| $50,000 to $74,999 | 604 (13.6%) | 101 (14.0%) |
| $75,000 to $99,999 | 988 (22.3%) | 69 (9.5%) |
| $100,000 to $149,999 | 922 (20.8%) | 59 (8.2%) |
| $150,000 or more | 843 (19.0%) | 90 (12.4%) |
| Total | 4,430 (100.0%) | 723 (100.0%) |
Monthly Housing Cost Tiers in Glenn Heights
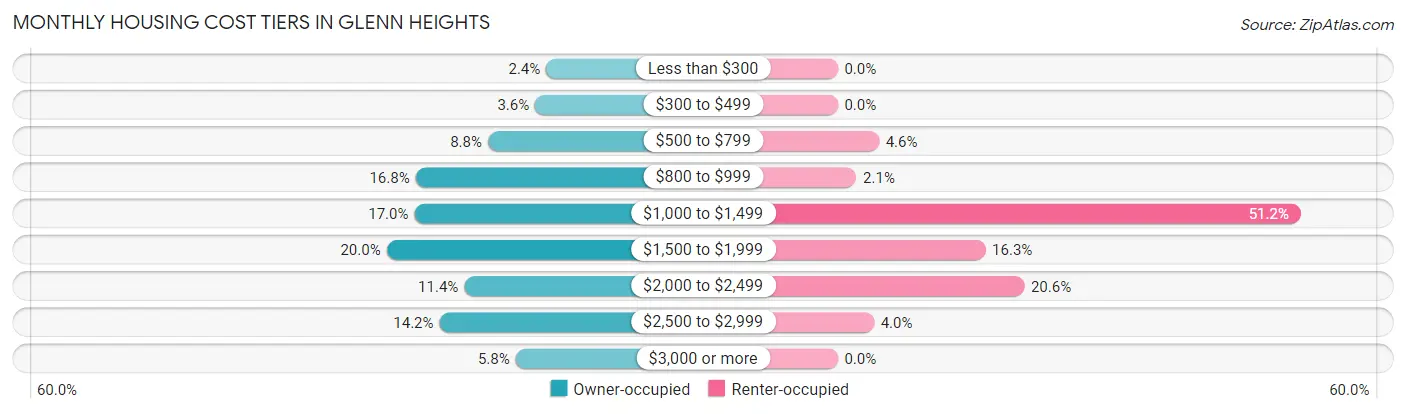
| Monthly Cost | Owner-occupied | Renter-occupied |
| Less than $300 | 106 (2.4%) | 0 (0.0%) |
| $300 to $499 | 160 (3.6%) | 0 (0.0%) |
| $500 to $799 | 391 (8.8%) | 33 (4.6%) |
| $800 to $999 | 745 (16.8%) | 15 (2.1%) |
| $1,000 to $1,499 | 751 (17.0%) | 370 (51.2%) |
| $1,500 to $1,999 | 887 (20.0%) | 118 (16.3%) |
| $2,000 to $2,499 | 507 (11.4%) | 149 (20.6%) |
| $2,500 to $2,999 | 628 (14.2%) | 29 (4.0%) |
| $3,000 or more | 255 (5.8%) | 0 (0.0%) |
| Total | 4,430 (100.0%) | 723 (100.0%) |
Physical Housing Characteristics in Glenn Heights
Housing Structures in Glenn Heights
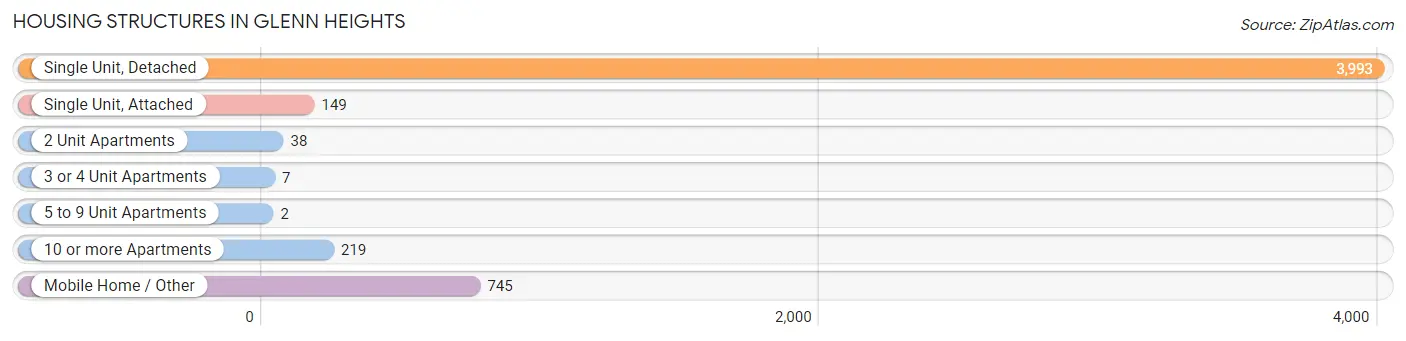
| Structure Type | # Housing Units | % Housing Units |
| Single Unit, Detached | 3,993 | 77.5% |
| Single Unit, Attached | 149 | 2.9% |
| 2 Unit Apartments | 38 | 0.7% |
| 3 or 4 Unit Apartments | 7 | 0.1% |
| 5 to 9 Unit Apartments | 2 | 0.0% |
| 10 or more Apartments | 219 | 4.3% |
| Mobile Home / Other | 745 | 14.5% |
| Total | 5,153 | 100.0% |
Housing Structures by Occupancy in Glenn Heights
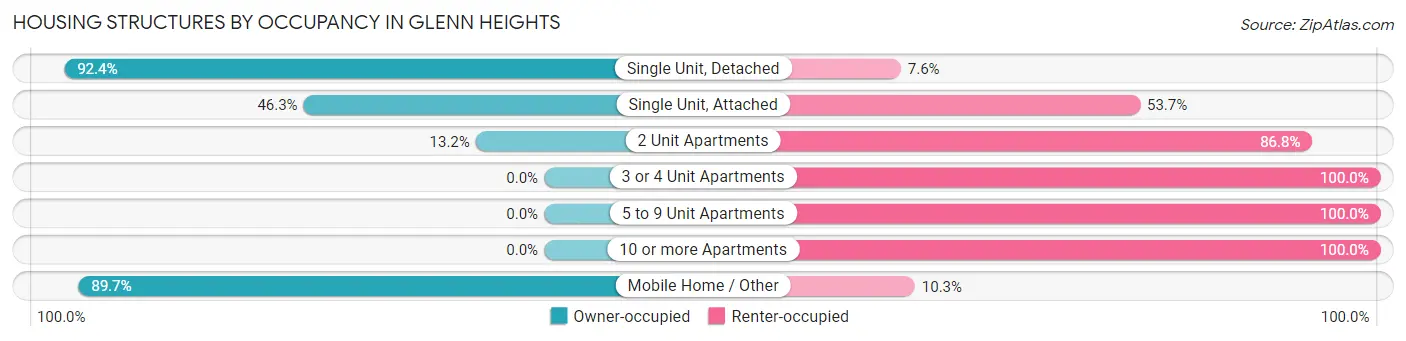
| Structure Type | Owner-occupied | Renter-occupied |
| Single Unit, Detached | 3,688 (92.4%) | 305 (7.6%) |
| Single Unit, Attached | 69 (46.3%) | 80 (53.7%) |
| 2 Unit Apartments | 5 (13.2%) | 33 (86.8%) |
| 3 or 4 Unit Apartments | 0 (0.0%) | 7 (100.0%) |
| 5 to 9 Unit Apartments | 0 (0.0%) | 2 (100.0%) |
| 10 or more Apartments | 0 (0.0%) | 219 (100.0%) |
| Mobile Home / Other | 668 (89.7%) | 77 (10.3%) |
| Total | 4,430 (86.0%) | 723 (14.0%) |
Housing Structures by Number of Rooms in Glenn Heights
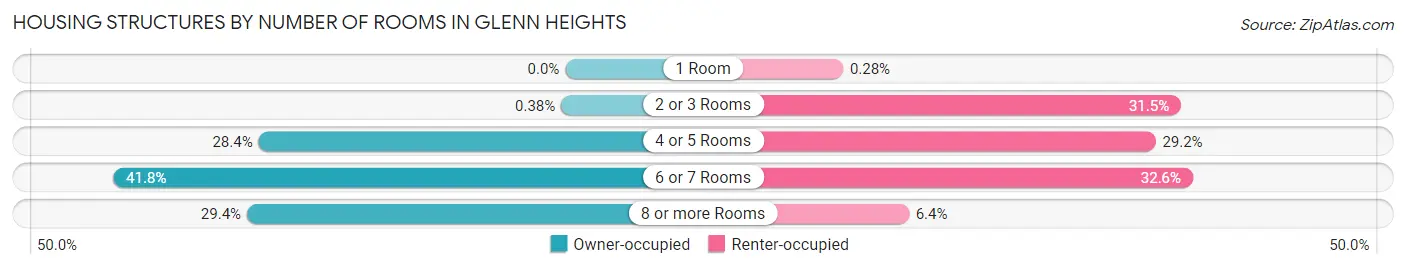
| Number of Rooms | Owner-occupied | Renter-occupied |
| 1 Room | 0 (0.0%) | 2 (0.3%) |
| 2 or 3 Rooms | 17 (0.4%) | 228 (31.5%) |
| 4 or 5 Rooms | 1,257 (28.4%) | 211 (29.2%) |
| 6 or 7 Rooms | 1,852 (41.8%) | 236 (32.6%) |
| 8 or more Rooms | 1,304 (29.4%) | 46 (6.4%) |
| Total | 4,430 (100.0%) | 723 (100.0%) |
Housing Structure by Heating Type in Glenn Heights
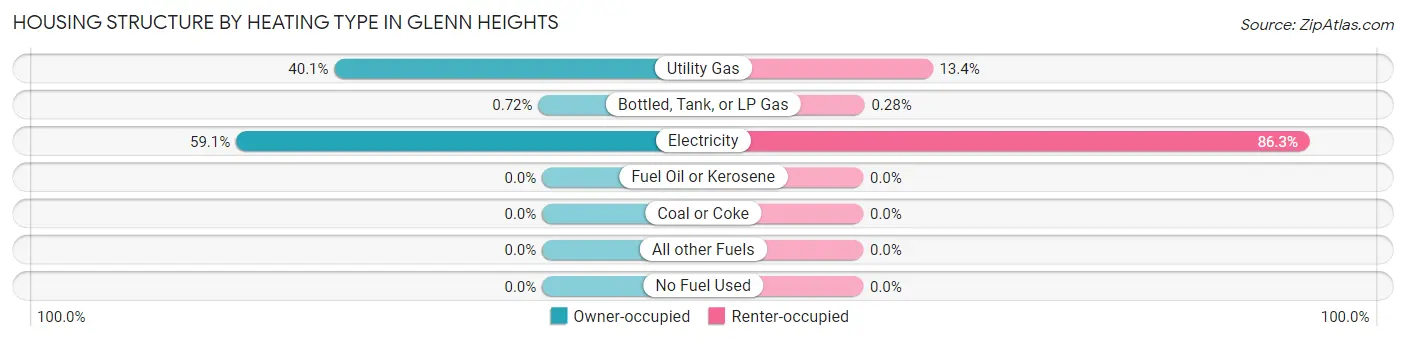
| Heating Type | Owner-occupied | Renter-occupied |
| Utility Gas | 1,778 (40.1%) | 97 (13.4%) |
| Bottled, Tank, or LP Gas | 32 (0.7%) | 2 (0.3%) |
| Electricity | 2,620 (59.1%) | 624 (86.3%) |
| Fuel Oil or Kerosene | 0 (0.0%) | 0 (0.0%) |
| Coal or Coke | 0 (0.0%) | 0 (0.0%) |
| All other Fuels | 0 (0.0%) | 0 (0.0%) |
| No Fuel Used | 0 (0.0%) | 0 (0.0%) |
| Total | 4,430 (100.0%) | 723 (100.0%) |
Household Vehicle Usage in Glenn Heights
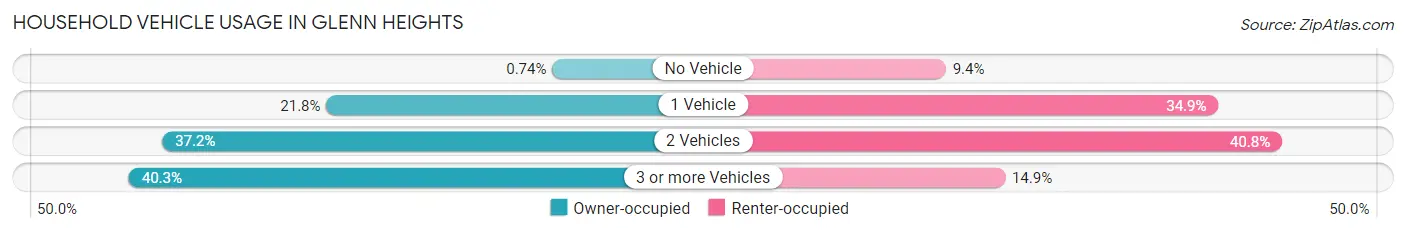
| Vehicles per Household | Owner-occupied | Renter-occupied |
| No Vehicle | 33 (0.7%) | 68 (9.4%) |
| 1 Vehicle | 967 (21.8%) | 252 (34.8%) |
| 2 Vehicles | 1,646 (37.2%) | 295 (40.8%) |
| 3 or more Vehicles | 1,784 (40.3%) | 108 (14.9%) |
| Total | 4,430 (100.0%) | 723 (100.0%) |
Real Estate & Mortgages in Glenn Heights
Real Estate and Mortgage Overview in Glenn Heights
| Characteristic | Without Mortgage | With Mortgage |
| Housing Units | 1,330 | 3,100 |
| Median Property Value | - | - |
| Median Household Income | $55,658 | $678 |
| Monthly Housing Costs | $830 | $255 |
| Real Estate Taxes | - | - |
Property Value by Mortgage Status in Glenn Heights
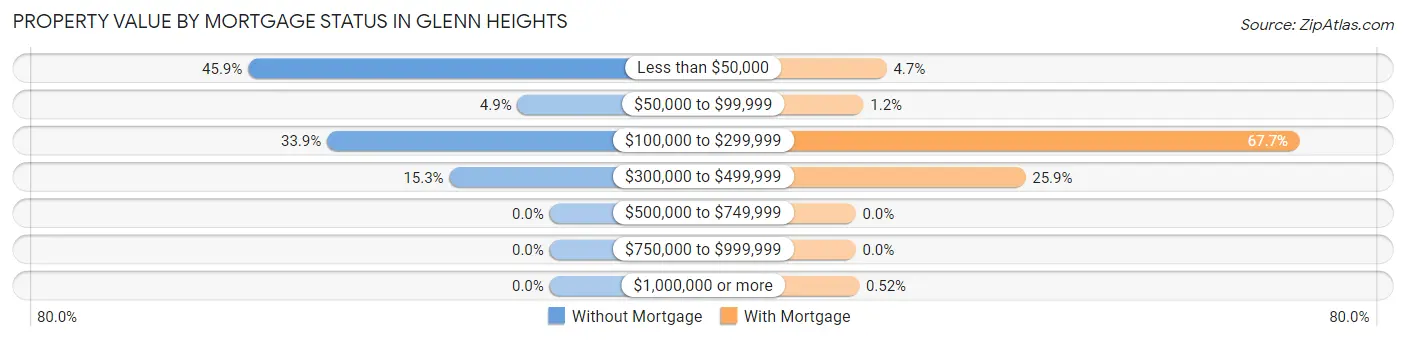
| Property Value | Without Mortgage | With Mortgage |
| Less than $50,000 | 611 (45.9%) | 146 (4.7%) |
| $50,000 to $99,999 | 65 (4.9%) | 37 (1.2%) |
| $100,000 to $299,999 | 451 (33.9%) | 2,099 (67.7%) |
| $300,000 to $499,999 | 203 (15.3%) | 802 (25.9%) |
| $500,000 to $749,999 | 0 (0.0%) | 0 (0.0%) |
| $750,000 to $999,999 | 0 (0.0%) | 0 (0.0%) |
| $1,000,000 or more | 0 (0.0%) | 16 (0.5%) |
| Total | 1,330 (100.0%) | 3,100 (100.0%) |
Household Income by Mortgage Status in Glenn Heights
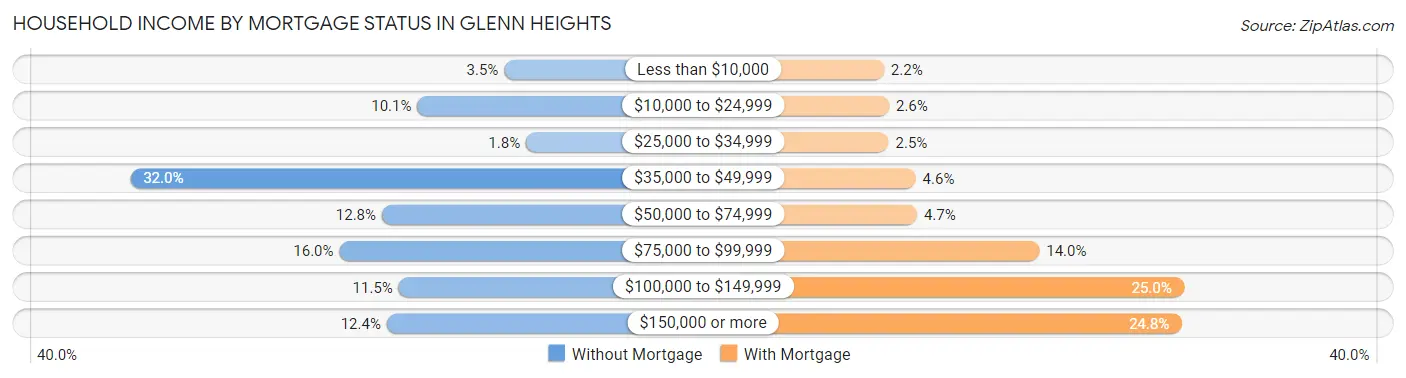
| Household Income | Without Mortgage | With Mortgage |
| Less than $10,000 | 46 (3.5%) | 67 (2.2%) |
| $10,000 to $24,999 | 134 (10.1%) | 79 (2.5%) |
| $25,000 to $34,999 | 24 (1.8%) | 78 (2.5%) |
| $35,000 to $49,999 | 425 (32.0%) | 142 (4.6%) |
| $50,000 to $74,999 | 170 (12.8%) | 145 (4.7%) |
| $75,000 to $99,999 | 213 (16.0%) | 434 (14.0%) |
| $100,000 to $149,999 | 153 (11.5%) | 775 (25.0%) |
| $150,000 or more | 165 (12.4%) | 769 (24.8%) |
| Total | 1,330 (100.0%) | 3,100 (100.0%) |
Property Value to Household Income Ratio in Glenn Heights
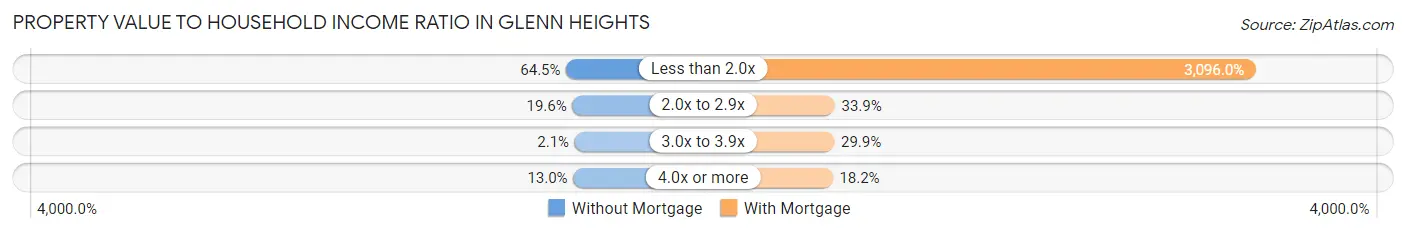
| Value-to-Income Ratio | Without Mortgage | With Mortgage |
| Less than 2.0x | 858 (64.5%) | 95,976 (3,096.0%) |
| 2.0x to 2.9x | 261 (19.6%) | 1,050 (33.9%) |
| 3.0x to 3.9x | 28 (2.1%) | 927 (29.9%) |
| 4.0x or more | 173 (13.0%) | 565 (18.2%) |
| Total | 1,330 (100.0%) | 3,100 (100.0%) |
Real Estate Taxes by Mortgage Status in Glenn Heights
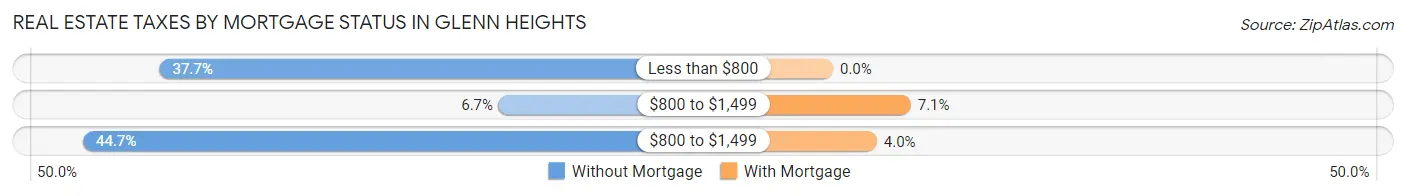
| Property Taxes | Without Mortgage | With Mortgage |
| Less than $800 | 501 (37.7%) | 0 (0.0%) |
| $800 to $1,499 | 89 (6.7%) | 220 (7.1%) |
| $800 to $1,499 | 594 (44.7%) | 124 (4.0%) |
| Total | 1,330 (100.0%) | 3,100 (100.0%) |
Health & Disability in Glenn Heights
Health Insurance Coverage by Age in Glenn Heights
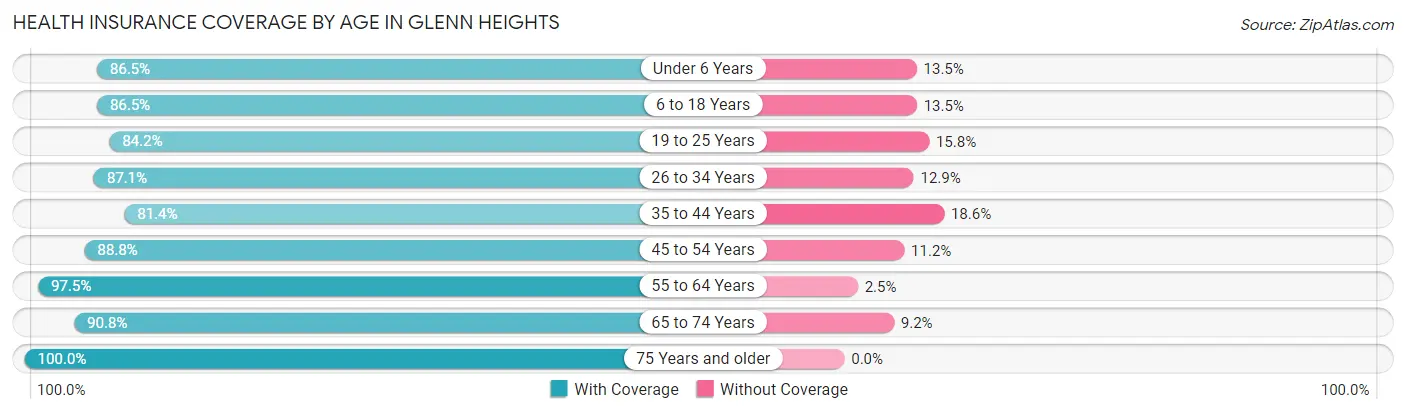
| Age Bracket | With Coverage | Without Coverage |
| Under 6 Years | 924 (86.5%) | 144 (13.5%) |
| 6 to 18 Years | 3,062 (86.5%) | 478 (13.5%) |
| 19 to 25 Years | 1,760 (84.2%) | 330 (15.8%) |
| 26 to 34 Years | 1,795 (87.1%) | 266 (12.9%) |
| 35 to 44 Years | 1,730 (81.4%) | 395 (18.6%) |
| 45 to 54 Years | 1,703 (88.8%) | 214 (11.2%) |
| 55 to 64 Years | 2,377 (97.5%) | 61 (2.5%) |
| 65 to 74 Years | 786 (90.8%) | 80 (9.2%) |
| 75 Years and older | 340 (100.0%) | 0 (0.0%) |
| Total | 14,477 (88.0%) | 1,968 (12.0%) |
Health Insurance Coverage by Citizenship Status in Glenn Heights
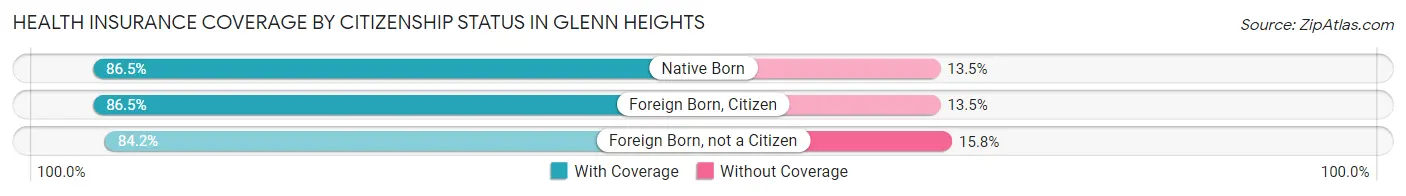
| Citizenship Status | With Coverage | Without Coverage |
| Native Born | 924 (86.5%) | 144 (13.5%) |
| Foreign Born, Citizen | 3,062 (86.5%) | 478 (13.5%) |
| Foreign Born, not a Citizen | 1,760 (84.2%) | 330 (15.8%) |
Health Insurance Coverage by Household Income in Glenn Heights
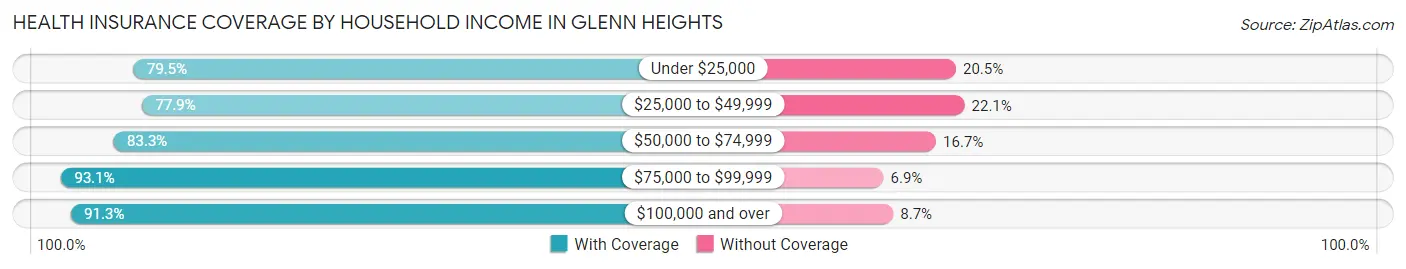
| Household Income | With Coverage | Without Coverage |
| Under $25,000 | 610 (79.5%) | 157 (20.5%) |
| $25,000 to $49,999 | 1,875 (77.9%) | 531 (22.1%) |
| $50,000 to $74,999 | 1,930 (83.3%) | 388 (16.7%) |
| $75,000 to $99,999 | 3,228 (93.1%) | 239 (6.9%) |
| $100,000 and over | 6,834 (91.3%) | 653 (8.7%) |
Public vs Private Health Insurance Coverage by Age in Glenn Heights
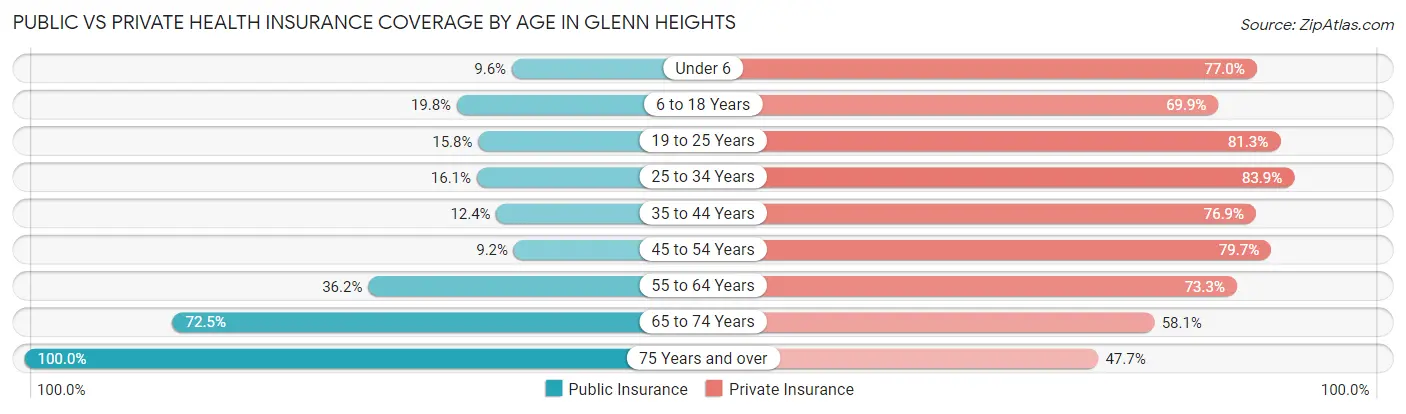
| Age Bracket | Public Insurance | Private Insurance |
| Under 6 | 102 (9.6%) | 822 (77.0%) |
| 6 to 18 Years | 699 (19.8%) | 2,473 (69.9%) |
| 19 to 25 Years | 330 (15.8%) | 1,700 (81.3%) |
| 25 to 34 Years | 331 (16.1%) | 1,730 (83.9%) |
| 35 to 44 Years | 264 (12.4%) | 1,633 (76.8%) |
| 45 to 54 Years | 176 (9.2%) | 1,527 (79.7%) |
| 55 to 64 Years | 883 (36.2%) | 1,787 (73.3%) |
| 65 to 74 Years | 628 (72.5%) | 503 (58.1%) |
| 75 Years and over | 340 (100.0%) | 162 (47.6%) |
| Total | 3,753 (22.8%) | 12,337 (75.0%) |
Disability Status by Sex by Age in Glenn Heights
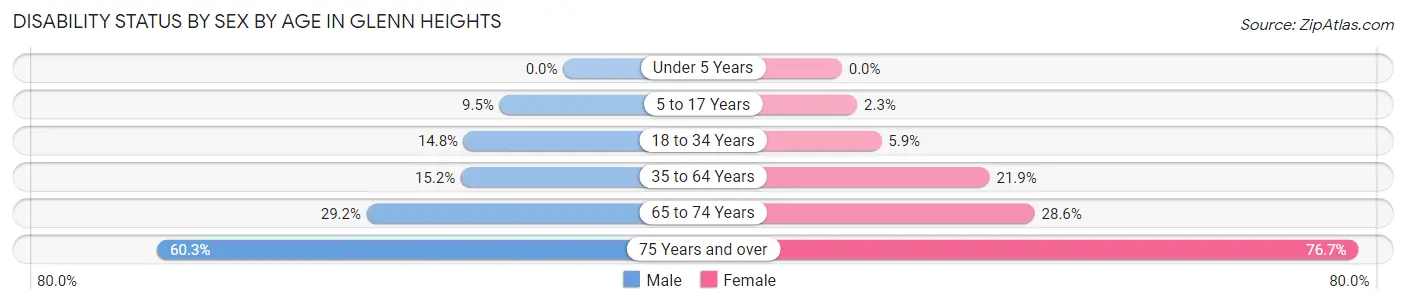
| Age Bracket | Male | Female |
| Under 5 Years | 0 (0.0%) | 0 (0.0%) |
| 5 to 17 Years | 183 (9.5%) | 30 (2.3%) |
| 18 to 34 Years | 305 (14.8%) | 149 (5.9%) |
| 35 to 64 Years | 443 (15.2%) | 782 (21.9%) |
| 65 to 74 Years | 108 (29.2%) | 142 (28.6%) |
| 75 Years and over | 73 (60.3%) | 168 (76.7%) |
Disability Class by Sex by Age in Glenn Heights
Disability Class: Hearing Difficulty
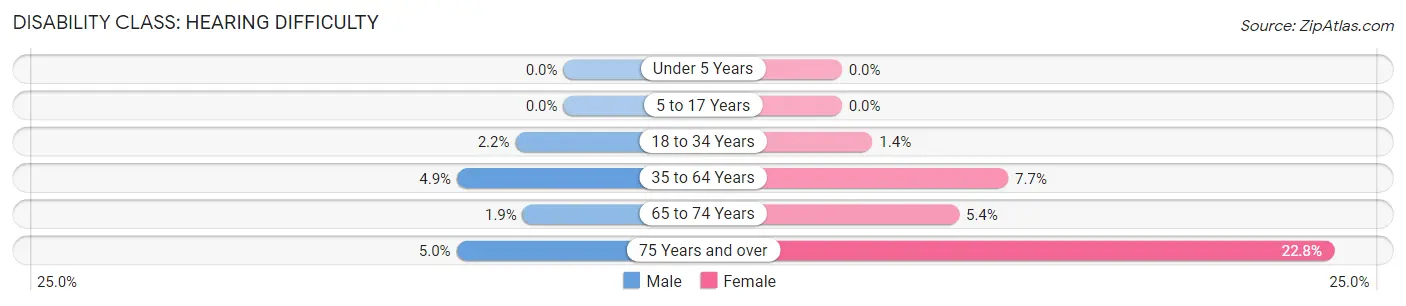
| Age Bracket | Male | Female |
| Under 5 Years | 0 (0.0%) | 0 (0.0%) |
| 5 to 17 Years | 0 (0.0%) | 0 (0.0%) |
| 18 to 34 Years | 46 (2.2%) | 36 (1.4%) |
| 35 to 64 Years | 144 (4.9%) | 275 (7.7%) |
| 65 to 74 Years | 7 (1.9%) | 27 (5.4%) |
| 75 Years and over | 6 (5.0%) | 50 (22.8%) |
Disability Class: Vision Difficulty
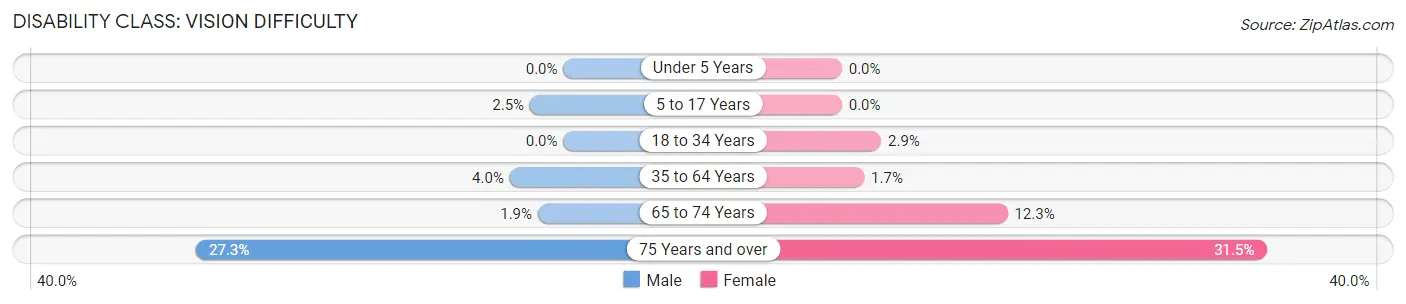
| Age Bracket | Male | Female |
| Under 5 Years | 0 (0.0%) | 0 (0.0%) |
| 5 to 17 Years | 48 (2.5%) | 0 (0.0%) |
| 18 to 34 Years | 0 (0.0%) | 74 (2.9%) |
| 35 to 64 Years | 116 (4.0%) | 59 (1.7%) |
| 65 to 74 Years | 7 (1.9%) | 61 (12.3%) |
| 75 Years and over | 33 (27.3%) | 69 (31.5%) |
Disability Class: Cognitive Difficulty
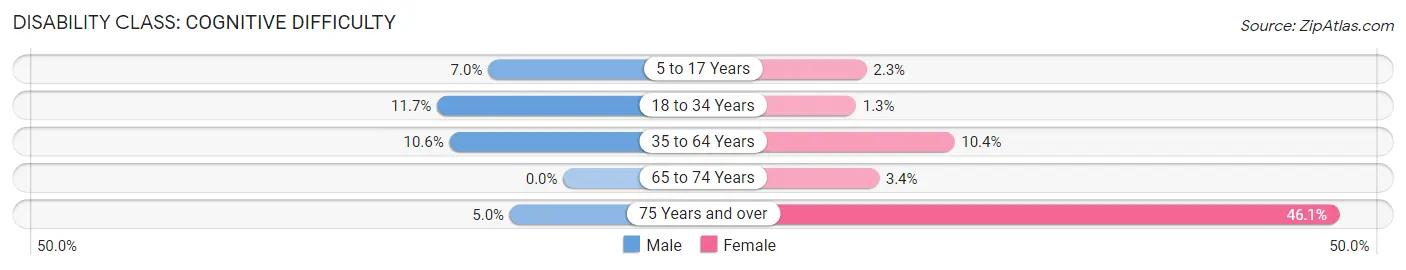
| Age Bracket | Male | Female |
| 5 to 17 Years | 135 (7.0%) | 30 (2.3%) |
| 18 to 34 Years | 242 (11.7%) | 33 (1.3%) |
| 35 to 64 Years | 308 (10.6%) | 372 (10.4%) |
| 65 to 74 Years | 0 (0.0%) | 17 (3.4%) |
| 75 Years and over | 6 (5.0%) | 101 (46.1%) |
Disability Class: Ambulatory Difficulty
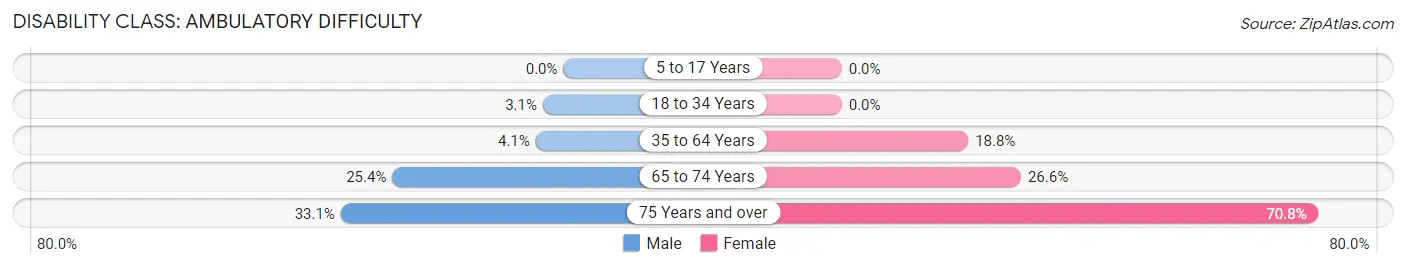
| Age Bracket | Male | Female |
| 5 to 17 Years | 0 (0.0%) | 0 (0.0%) |
| 18 to 34 Years | 63 (3.0%) | 0 (0.0%) |
| 35 to 64 Years | 120 (4.1%) | 669 (18.8%) |
| 65 to 74 Years | 94 (25.4%) | 132 (26.6%) |
| 75 Years and over | 40 (33.1%) | 155 (70.8%) |
Disability Class: Self-Care Difficulty
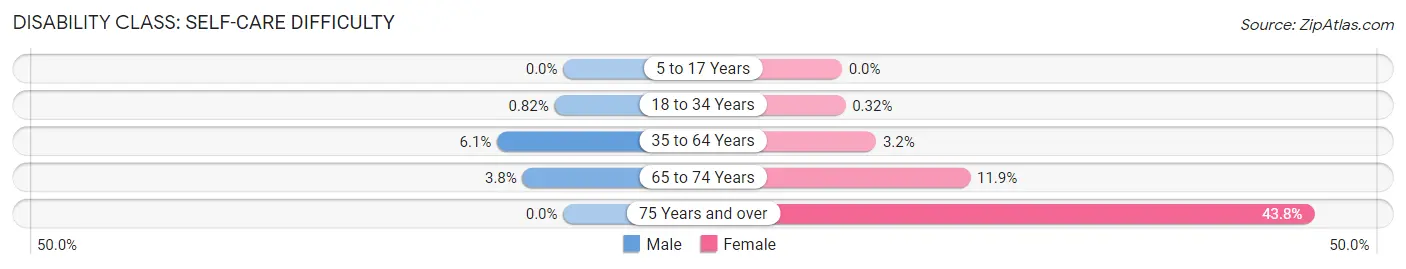
| Age Bracket | Male | Female |
| 5 to 17 Years | 0 (0.0%) | 0 (0.0%) |
| 18 to 34 Years | 17 (0.8%) | 8 (0.3%) |
| 35 to 64 Years | 179 (6.1%) | 113 (3.2%) |
| 65 to 74 Years | 14 (3.8%) | 59 (11.9%) |
| 75 Years and over | 0 (0.0%) | 96 (43.8%) |
Technology Access in Glenn Heights
Computing Device Access in Glenn Heights
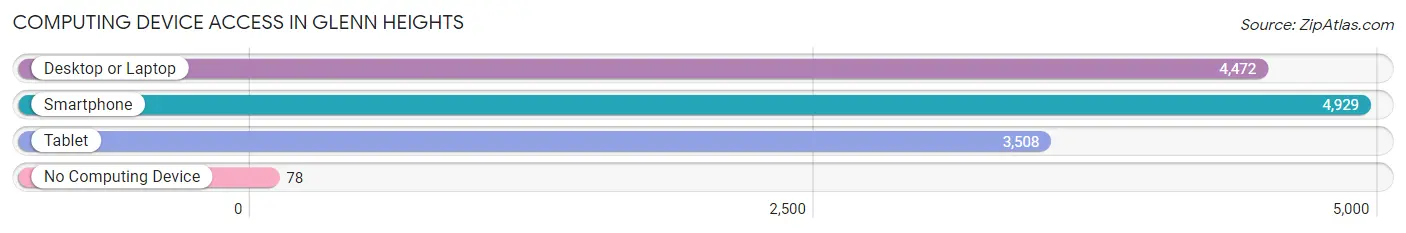
| Device Type | # Households | % Households |
| Desktop or Laptop | 4,472 | 86.8% |
| Smartphone | 4,929 | 95.7% |
| Tablet | 3,508 | 68.1% |
| No Computing Device | 78 | 1.5% |
| Total | 5,153 | 100.0% |
Internet Access in Glenn Heights
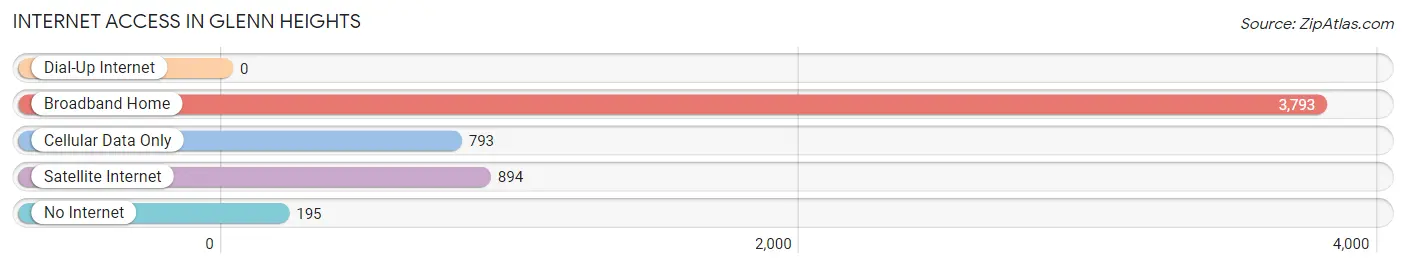
| Internet Type | # Households | % Households |
| Dial-Up Internet | 0 | 0.0% |
| Broadband Home | 3,793 | 73.6% |
| Cellular Data Only | 793 | 15.4% |
| Satellite Internet | 894 | 17.3% |
| No Internet | 195 | 3.8% |
| Total | 5,153 | 100.0% |
Glenn Heights Summary
Glenn Heights is a city located in Dallas and Ellis Counties in the state of Texas. It is a suburb of Dallas and is part of the Dallas-Fort Worth-Arlington metropolitan area. The city was incorporated in 1969 and has a population of 11,278 as of the 2010 census.
History
The area that is now Glenn Heights was originally inhabited by the Caddo Indians. The first settlers in the area were the Glenn family, who arrived in the late 1840s. The family established a homestead and a post office in the area in 1854. The post office was named after the family and the area became known as Glenn Heights.
In the early 1900s, the area began to grow as more people moved to the area. The population increased from just over 200 in the 1920s to over 1,000 by the 1950s. The city was officially incorporated in 1969 and the population continued to grow, reaching 11,278 by the 2010 census.
Geography
Glenn Heights is located in Dallas and Ellis Counties in the state of Texas. It is situated at an elevation of 645 feet above sea level. The city has a total area of 8.3 square miles, of which 8.2 square miles is land and 0.1 square miles is water.
The city is located in the Central Time Zone and observes Daylight Saving Time. The climate is classified as humid subtropical, with hot summers and mild winters. The average annual temperature is 68°F and the average annual precipitation is 37.5 inches.
Economy
The economy of Glenn Heights is largely based on retail and services. The city is home to several major retailers, including Walmart, Target, and Home Depot. There are also several restaurants, banks, and other businesses located in the city.
The city is also home to several industrial and manufacturing companies, including a large plastics manufacturing plant. The city is also home to a number of small businesses, including auto repair shops, beauty salons, and other service-oriented businesses.
Demographics
As of the 2010 census, the population of Glenn Heights was 11,278. The racial makeup of the city was 57.3% White, 28.2% African American, 0.5% Native American, 1.3% Asian, 0.1% Pacific Islander, 9.7% from other races, and 2.9% from two or more races. Hispanic or Latino of any race were 20.2% of the population.
The median income for a household in the city was $45,945 and the median income for a family was $51,945. The per capita income for the city was $20,945. About 11.3% of families and 14.2% of the population were below the poverty line, including 19.2% of those under age 18 and 8.2% of those age 65 or over.
Common Questions
What is Per Capita Income in Glenn Heights?
Per Capita income in Glenn Heights is $31,763.
What is the Median Family Income in Glenn Heights?
Median Family Income in Glenn Heights is $89,482.
What is the Median Household income in Glenn Heights?
Median Household Income in Glenn Heights is $87,686.
What is Income or Wage Gap in Glenn Heights?
Income or Wage Gap in Glenn Heights is 26.6%.
Women in Glenn Heights earn 73.4 cents for every dollar earned by a man.
What is Family Income Deficit in Glenn Heights?
Family Income Deficit in Glenn Heights is $6,682.
Families that are below poverty line in Glenn Heights earn $6,682 less on average than the poverty threshold level.
What is Inequality or Gini Index in Glenn Heights?
Inequality or Gini Index in Glenn Heights is 0.37.
What is the Total Population of Glenn Heights?
Total Population of Glenn Heights is 16,445.
What is the Total Male Population of Glenn Heights?
Total Male Population of Glenn Heights is 7,998.
What is the Total Female Population of Glenn Heights?
Total Female Population of Glenn Heights is 8,447.
What is the Ratio of Males per 100 Females in Glenn Heights?
There are 94.68 Males per 100 Females in Glenn Heights.
What is the Ratio of Females per 100 Males in Glenn Heights?
There are 105.61 Females per 100 Males in Glenn Heights.
What is the Median Population Age in Glenn Heights?
Median Population Age in Glenn Heights is 33.6 Years.
What is the Average Family Size in Glenn Heights
Average Family Size in Glenn Heights is 3.6 People.
What is the Average Household Size in Glenn Heights
Average Household Size in Glenn Heights is 3.2 People.
How Large is the Labor Force in Glenn Heights?
There are 8,902 People in the Labor Forcein in Glenn Heights.
What is the Percentage of People in the Labor Force in Glenn Heights?
69.9% of People are in the Labor Force in Glenn Heights.
What is the Unemployment Rate in Glenn Heights?
Unemployment Rate in Glenn Heights is 8.6%.