Chula Vista CDP Zavala County, TX Map & Demographics
Chula Vista CDP Zavala County Overview
$15,562
PER CAPITA INCOME
0.42
INEQUALITY / GINI INDEX
416
TOTAL POPULATION
188
MALE POPULATION
228
FEMALE POPULATION
82.46
MALES / 100 FEMALES
121.28
FEMALES / 100 MALES
47.1
MEDIAN AGE
3.6
AVG FAMILY SIZE
3.1
AVG HOUSEHOLD SIZE
84
LABOR FORCE [ PEOPLE ]
28.1%
PERCENT IN LABOR FORCE
32.1%
UNEMPLOYMENT RATE
Income in Chula Vista CDP Zavala County
Income Overview in Chula Vista CDP Zavala County
| Characteristic | Number | Measure |
| Per Capita Income | 416 | $15,562 |
| Median Family Income | 109 | $0 |
| Mean Family Income | 109 | $62,408 |
| Median Household Income | 136 | $0 |
| Mean Household Income | 136 | $51,041 |
| Income Deficit | 109 | $0 |
| Wage / Income Gap (%) | 416 | 0.00% |
| Wage / Income Gap ($) | 416 | 100.00¢ per $1 |
| Gini / Inequality Index | 416 | 0.42 |
Earnings by Sex in Chula Vista CDP Zavala County
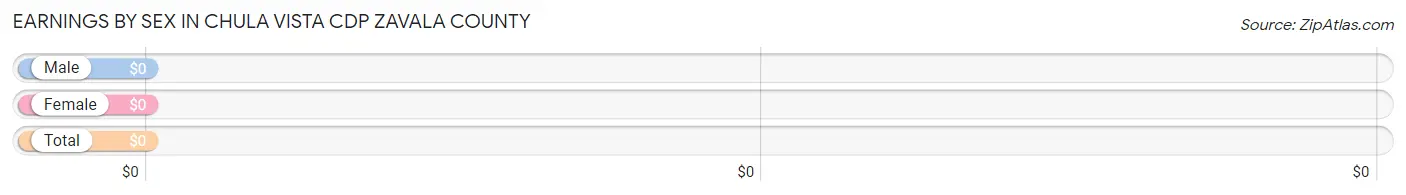
| Sex | Number | Average Earnings |
| Male | 20 (19.2%) | $0 |
| Female | 84 (80.8%) | $0 |
| Total | 104 (100.0%) | $0 |
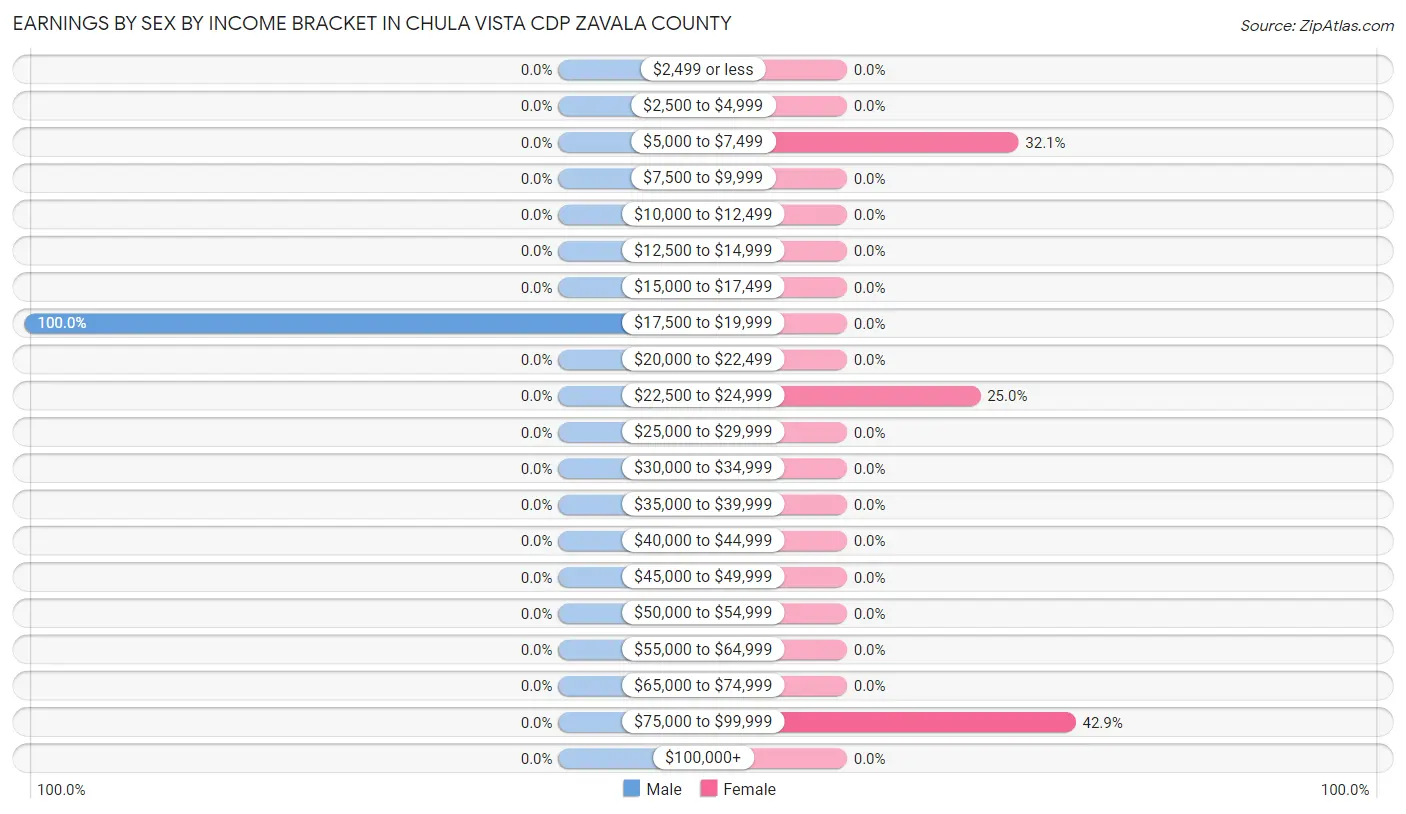
Earnings by Sex by Income Bracket in Chula Vista CDP Zavala County
The most common earnings brackets in Chula Vista CDP Zavala County are $17,500 to $19,999 for men (20 | 100.0%) and $75,000 to $99,999 for women (36 | 42.9%).
| Income | Male | Female |
| $2,499 or less | 0 (0.0%) | 0 (0.0%) |
| $2,500 to $4,999 | 0 (0.0%) | 0 (0.0%) |
| $5,000 to $7,499 | 0 (0.0%) | 27 (32.1%) |
| $7,500 to $9,999 | 0 (0.0%) | 0 (0.0%) |
| $10,000 to $12,499 | 0 (0.0%) | 0 (0.0%) |
| $12,500 to $14,999 | 0 (0.0%) | 0 (0.0%) |
| $15,000 to $17,499 | 0 (0.0%) | 0 (0.0%) |
| $17,500 to $19,999 | 20 (100.0%) | 0 (0.0%) |
| $20,000 to $22,499 | 0 (0.0%) | 0 (0.0%) |
| $22,500 to $24,999 | 0 (0.0%) | 21 (25.0%) |
| $25,000 to $29,999 | 0 (0.0%) | 0 (0.0%) |
| $30,000 to $34,999 | 0 (0.0%) | 0 (0.0%) |
| $35,000 to $39,999 | 0 (0.0%) | 0 (0.0%) |
| $40,000 to $44,999 | 0 (0.0%) | 0 (0.0%) |
| $45,000 to $49,999 | 0 (0.0%) | 0 (0.0%) |
| $50,000 to $54,999 | 0 (0.0%) | 0 (0.0%) |
| $55,000 to $64,999 | 0 (0.0%) | 0 (0.0%) |
| $65,000 to $74,999 | 0 (0.0%) | 0 (0.0%) |
| $75,000 to $99,999 | 0 (0.0%) | 36 (42.9%) |
| $100,000+ | 0 (0.0%) | 0 (0.0%) |
| Total | 20 (100.0%) | 84 (100.0%) |
Earnings by Sex by Educational Attainment in Chula Vista CDP Zavala County
| Educational Attainment | Male Income | Female Income |
| Less than High School | - | - |
| High School Diploma | - | - |
| College or Associate's Degree | - | - |
| Bachelor's Degree | - | - |
| Graduate Degree | - | - |
| Total | - | - |
Family Income in Chula Vista CDP Zavala County
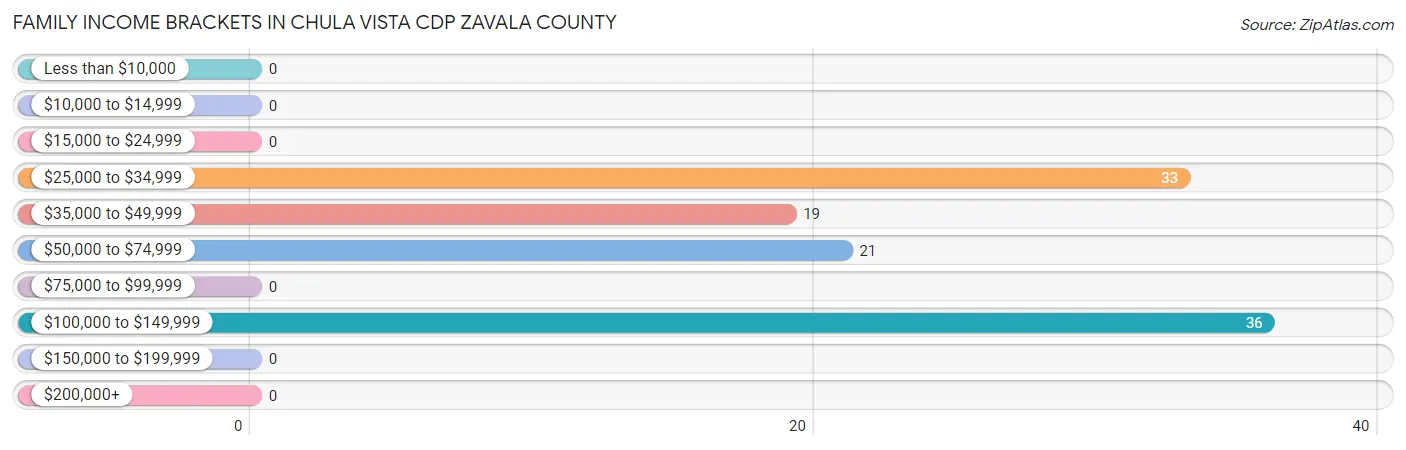
Family Income Brackets in Chula Vista CDP Zavala County
According to the Chula Vista CDP Zavala County family income data, there are 36 families falling into the $100,000 to $149,999 income range, which is the most common income bracket and makes up 33.0% of all families.
| Income Bracket | # Families | % Families |
| Less than $10,000 | 0 | 0.0% |
| $10,000 to $14,999 | 0 | 0.0% |
| $15,000 to $24,999 | 0 | 0.0% |
| $25,000 to $34,999 | 33 | 30.3% |
| $35,000 to $49,999 | 19 | 17.4% |
| $50,000 to $74,999 | 21 | 19.3% |
| $75,000 to $99,999 | 0 | 0.0% |
| $100,000 to $149,999 | 36 | 33.0% |
| $150,000 to $199,999 | 0 | 0.0% |
| $200,000+ | 0 | 0.0% |
Family Income by Famaliy Size in Chula Vista CDP Zavala County
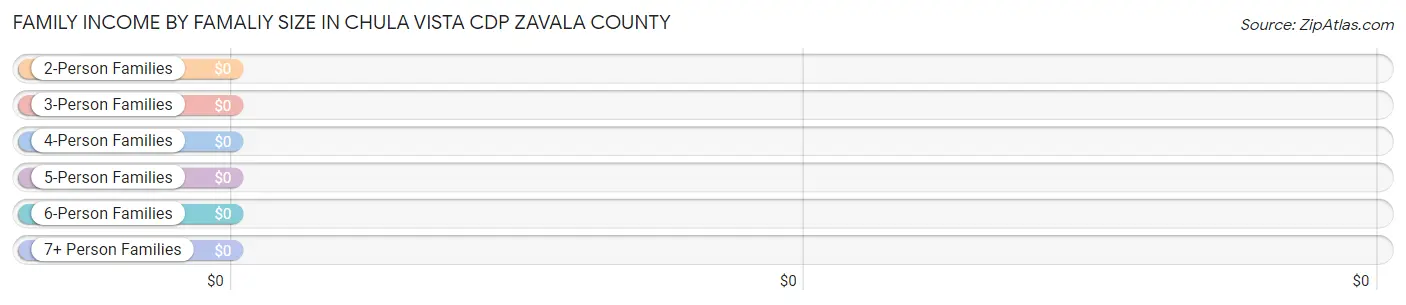
| Income Bracket | # Families | Median Income |
| 2-Person Families | 33 (30.3%) | $0 |
| 3-Person Families | 21 (19.3%) | $0 |
| 4-Person Families | 36 (33.0%) | $0 |
| 5-Person Families | 0 (0.0%) | $0 |
| 6-Person Families | 19 (17.4%) | $0 |
| 7+ Person Families | 0 (0.0%) | $0 |
| Total | 109 (100.0%) | $0 |
Family Income by Number of Earners in Chula Vista CDP Zavala County
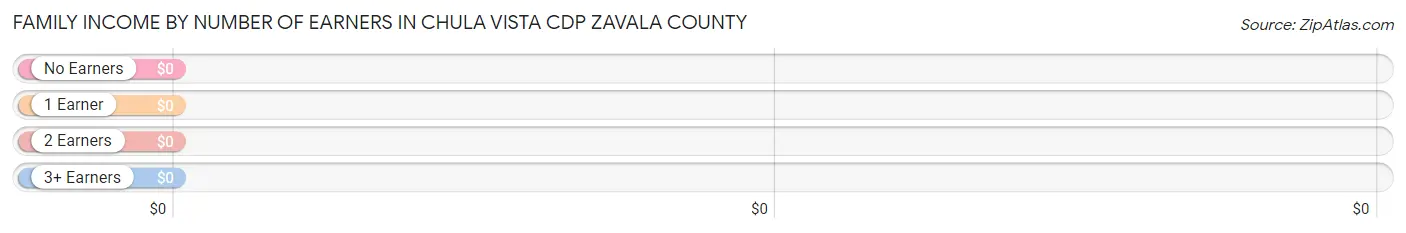
| Number of Earners | # Families | Median Income |
| No Earners | 52 (47.7%) | $0 |
| 1 Earner | 36 (33.0%) | $0 |
| 2 Earners | 21 (19.3%) | $0 |
| 3+ Earners | 0 (0.0%) | $0 |
| Total | 109 (100.0%) | $0 |
Household Income in Chula Vista CDP Zavala County
Household Income Brackets in Chula Vista CDP Zavala County
With 36 households falling in the category, the $100,000 to $149,999 income range is the most frequent in Chula Vista CDP Zavala County, accounting for 26.5% of all households.
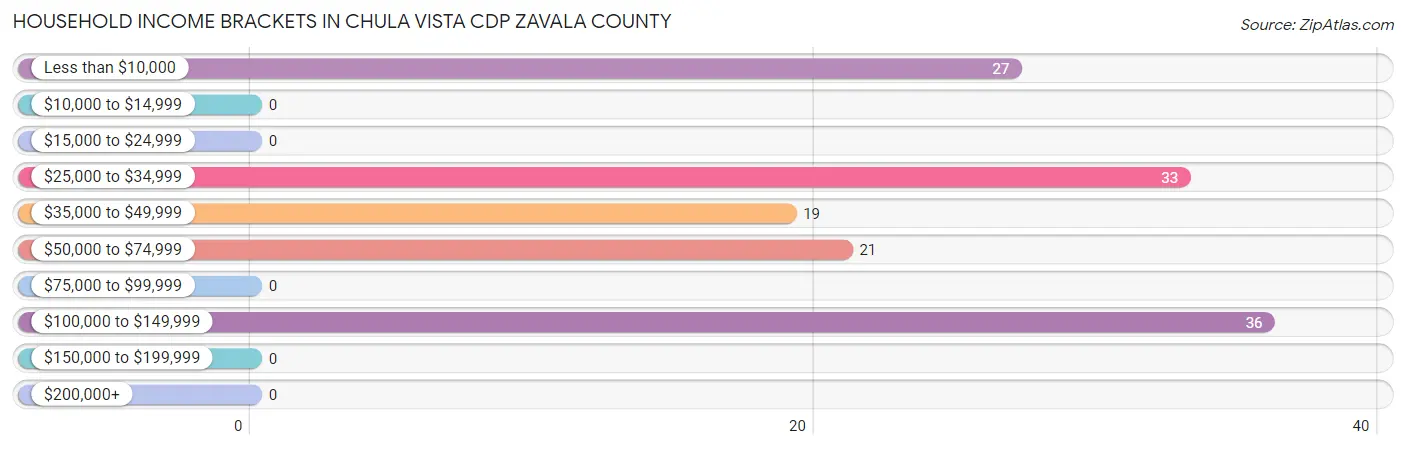
| Income Bracket | # Households | % Households |
| Less than $10,000 | 27 | 19.9% |
| $10,000 to $14,999 | 0 | 0.0% |
| $15,000 to $24,999 | 0 | 0.0% |
| $25,000 to $34,999 | 33 | 24.3% |
| $35,000 to $49,999 | 19 | 14.0% |
| $50,000 to $74,999 | 21 | 15.4% |
| $75,000 to $99,999 | 0 | 0.0% |
| $100,000 to $149,999 | 36 | 26.5% |
| $150,000 to $199,999 | 0 | 0.0% |
| $200,000+ | 0 | 0.0% |
Household Income by Householder Age in Chula Vista CDP Zavala County
The median household income in Chula Vista CDP Zavala County is $0, with the highest median household income of $25,947 found in the 65+ years age bracket for the primary householder. A total of 79 households (58.1%) fall into this category.
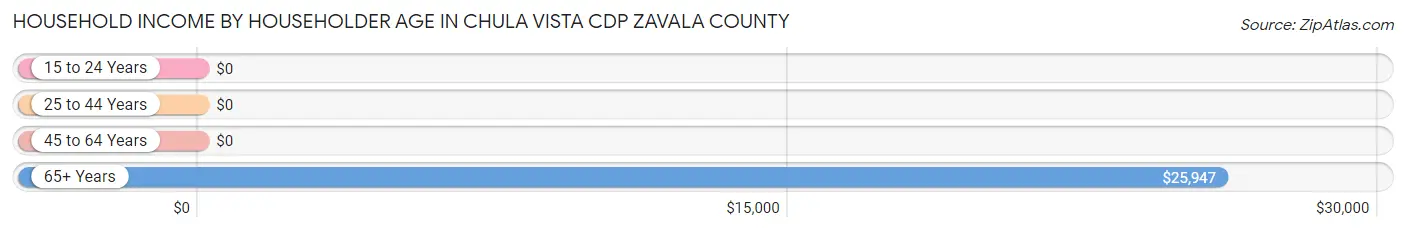
| Income Bracket | # Households | Median Income |
| 15 to 24 Years | 0 (0.0%) | $0 |
| 25 to 44 Years | 0 (0.0%) | $0 |
| 45 to 64 Years | 57 (41.9%) | $0 |
| 65+ Years | 79 (58.1%) | $25,947 |
| Total | 136 (100.0%) | $0 |
Poverty in Chula Vista CDP Zavala County
Income Below Poverty by Sex and Age in Chula Vista CDP Zavala County
With 42.5% poverty level for males and 42.1% for females among the residents of Chula Vista CDP Zavala County, 16 and 17 year old males and 6 to 11 year old females are the most vulnerable to poverty, with 47 males (100.0%) and 25 females (100.0%) in their respective age groups living below the poverty level.
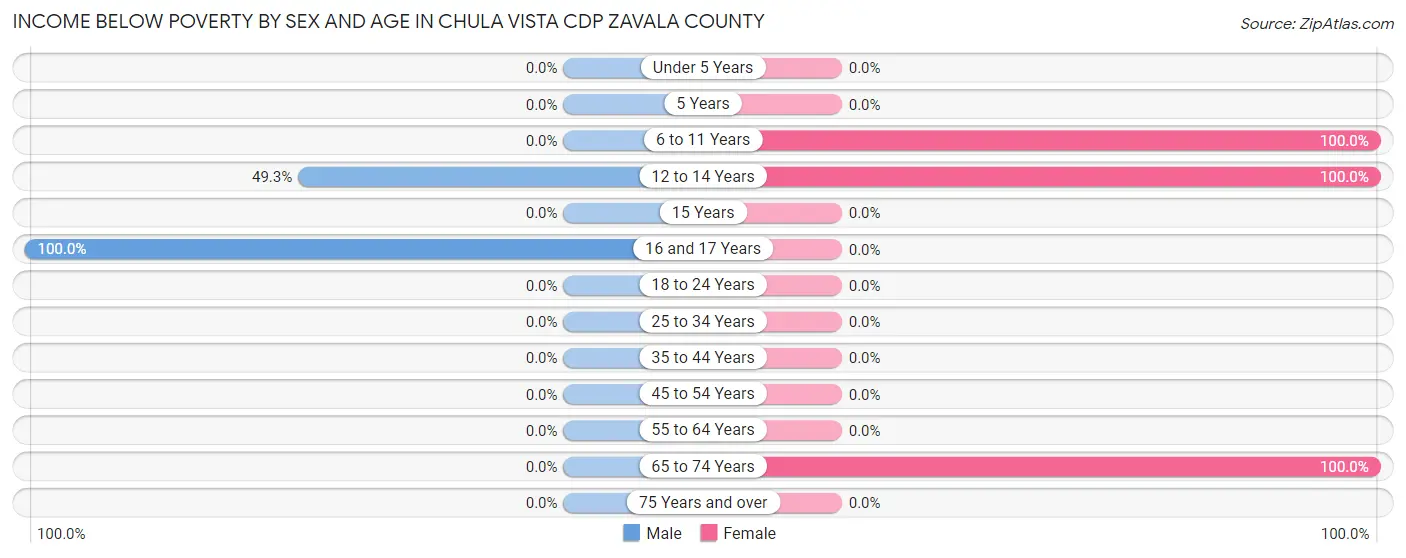
| Age Bracket | Male | Female |
| Under 5 Years | 0 (0.0%) | 0 (0.0%) |
| 5 Years | 0 (0.0%) | 0 (0.0%) |
| 6 to 11 Years | 0 (0.0%) | 25 (100.0%) |
| 12 to 14 Years | 33 (49.2%) | 25 (100.0%) |
| 15 Years | 0 (0.0%) | 0 (0.0%) |
| 16 and 17 Years | 47 (100.0%) | 0 (0.0%) |
| 18 to 24 Years | 0 (0.0%) | 0 (0.0%) |
| 25 to 34 Years | 0 (0.0%) | 0 (0.0%) |
| 35 to 44 Years | 0 (0.0%) | 0 (0.0%) |
| 45 to 54 Years | 0 (0.0%) | 0 (0.0%) |
| 55 to 64 Years | 0 (0.0%) | 0 (0.0%) |
| 65 to 74 Years | 0 (0.0%) | 46 (100.0%) |
| 75 Years and over | 0 (0.0%) | 0 (0.0%) |
| Total | 80 (42.5%) | 96 (42.1%) |
Income Above Poverty by Sex and Age in Chula Vista CDP Zavala County
According to the poverty statistics in Chula Vista CDP Zavala County, males aged 55 to 64 years and females aged 18 to 24 years are the age groups that are most secure financially, with 100.0% of males and 100.0% of females in these age groups living above the poverty line.
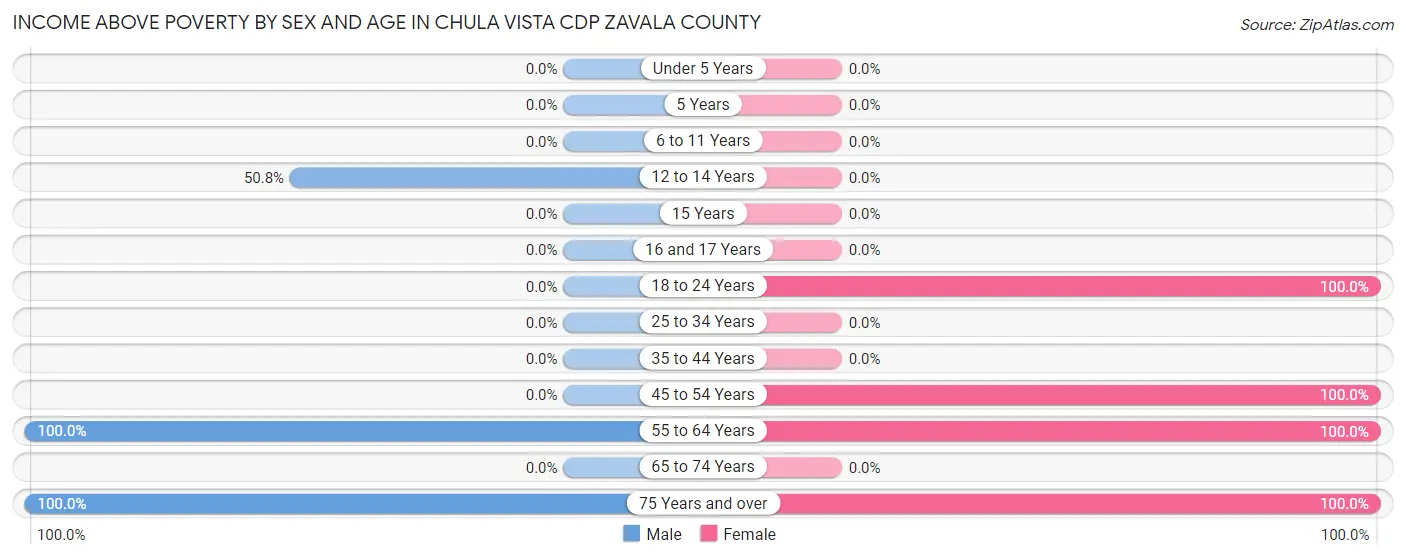
| Age Bracket | Male | Female |
| Under 5 Years | 0 (0.0%) | 0 (0.0%) |
| 5 Years | 0 (0.0%) | 0 (0.0%) |
| 6 to 11 Years | 0 (0.0%) | 0 (0.0%) |
| 12 to 14 Years | 34 (50.7%) | 0 (0.0%) |
| 15 Years | 0 (0.0%) | 0 (0.0%) |
| 16 and 17 Years | 0 (0.0%) | 0 (0.0%) |
| 18 to 24 Years | 0 (0.0%) | 40 (100.0%) |
| 25 to 34 Years | 0 (0.0%) | 0 (0.0%) |
| 35 to 44 Years | 0 (0.0%) | 0 (0.0%) |
| 45 to 54 Years | 0 (0.0%) | 36 (100.0%) |
| 55 to 64 Years | 41 (100.0%) | 21 (100.0%) |
| 65 to 74 Years | 0 (0.0%) | 0 (0.0%) |
| 75 Years and over | 33 (100.0%) | 35 (100.0%) |
| Total | 108 (57.5%) | 132 (57.9%) |
Income Below Poverty Among Married-Couple Families in Chula Vista CDP Zavala County
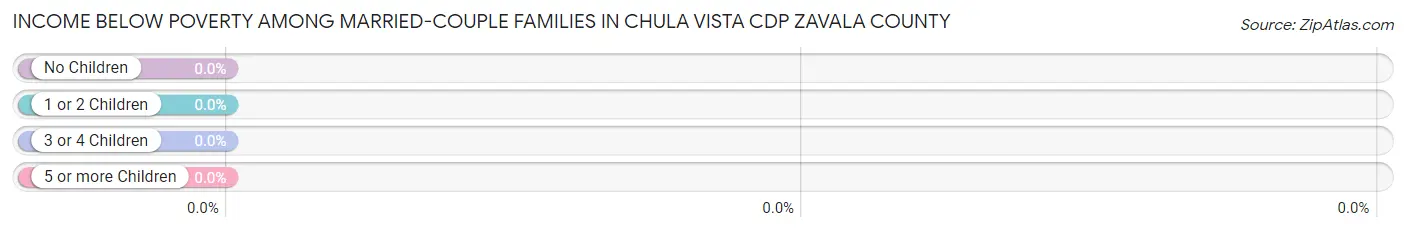
| Children | Above Poverty | Below Poverty |
| No Children | 54 (100.0%) | 0 (0.0%) |
| 1 or 2 Children | 36 (100.0%) | 0 (0.0%) |
| 3 or 4 Children | 0 (0.0%) | 0 (0.0%) |
| 5 or more Children | 0 (0.0%) | 0 (0.0%) |
| Total | 90 (100.0%) | 0 (0.0%) |
Income Below Poverty Among Single-Parent Households in Chula Vista CDP Zavala County
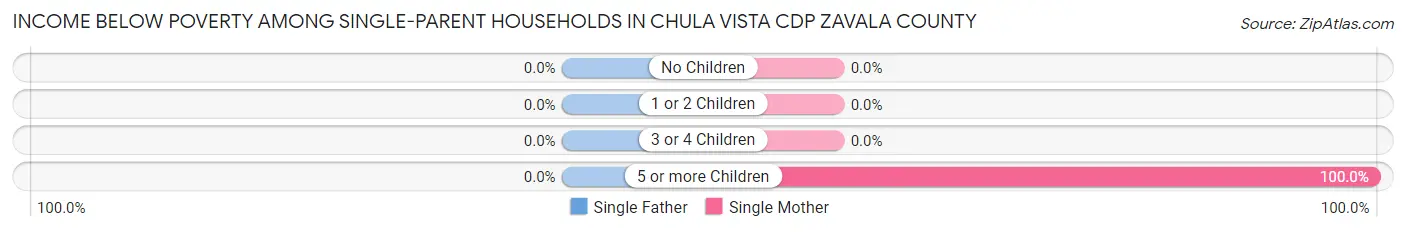
| Children | Single Father | Single Mother |
| No Children | 0 (0.0%) | 0 (0.0%) |
| 1 or 2 Children | 0 (0.0%) | 0 (0.0%) |
| 3 or 4 Children | 0 (0.0%) | 0 (0.0%) |
| 5 or more Children | 0 (0.0%) | 19 (100.0%) |
| Total | 0 (0.0%) | 19 (100.0%) |
Income Below Poverty Among Married-Couple vs Single-Parent Households in Chula Vista CDP Zavala County
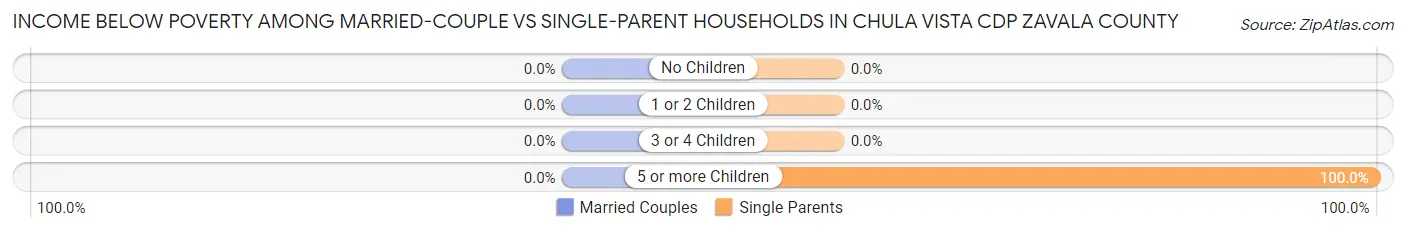
| Children | Married-Couple Families | Single-Parent Households |
| No Children | 0 (0.0%) | 0 (0.0%) |
| 1 or 2 Children | 0 (0.0%) | 0 (0.0%) |
| 3 or 4 Children | 0 (0.0%) | 0 (0.0%) |
| 5 or more Children | 0 (0.0%) | 19 (100.0%) |
| Total | 0 (0.0%) | 19 (100.0%) |
Race in Chula Vista CDP Zavala County
The most populous races in Chula Vista CDP Zavala County are Hispanic or Latino (416 | 100.0%), White / Caucasian (229 | 55.0%), and Two or more Races (187 | 45.0%).
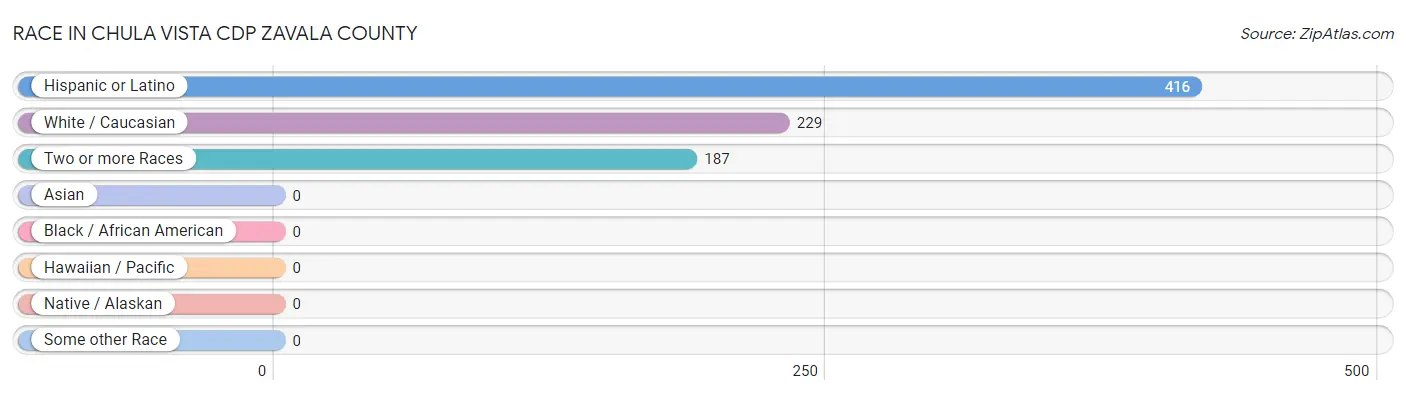
| Race | # Population | % Population |
| Asian | 0 | 0.0% |
| Black / African American | 0 | 0.0% |
| Hawaiian / Pacific | 0 | 0.0% |
| Hispanic or Latino | 416 | 100.0% |
| Native / Alaskan | 0 | 0.0% |
| White / Caucasian | 229 | 55.0% |
| Two or more Races | 187 | 45.0% |
| Some other Race | 0 | 0.0% |
| Total | 416 | 100.0% |
Ancestry in Chula Vista CDP Zavala County
The most populous ancestries reported in Chula Vista CDP Zavala County are , and Mexican (416 | 100.0%), together accounting for 100.0% of all Chula Vista CDP Zavala County residents.

| Ancestry | # Population | % Population |
| Mexican | 416 | 100.0% | View All 1 Rows |
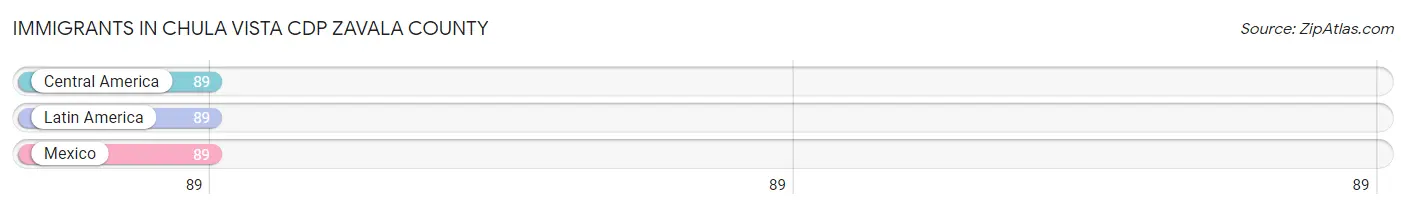
Immigrants in Chula Vista CDP Zavala County
The most numerous immigrant groups reported in Chula Vista CDP Zavala County came from Central America (89 | 21.4%), Latin America (89 | 21.4%), and Mexico (89 | 21.4%), together accounting for 64.2% of all Chula Vista CDP Zavala County residents.
| Immigration Origin | # Population | % Population |
| Central America | 89 | 21.4% |
| Latin America | 89 | 21.4% |
| Mexico | 89 | 21.4% | View All 3 Rows |
Sex and Age in Chula Vista CDP Zavala County
Sex and Age in Chula Vista CDP Zavala County
The most populous age groups in Chula Vista CDP Zavala County are 10 to 14 Years (67 | 35.6%) for men and 10 to 14 Years (50 | 21.9%) for women.
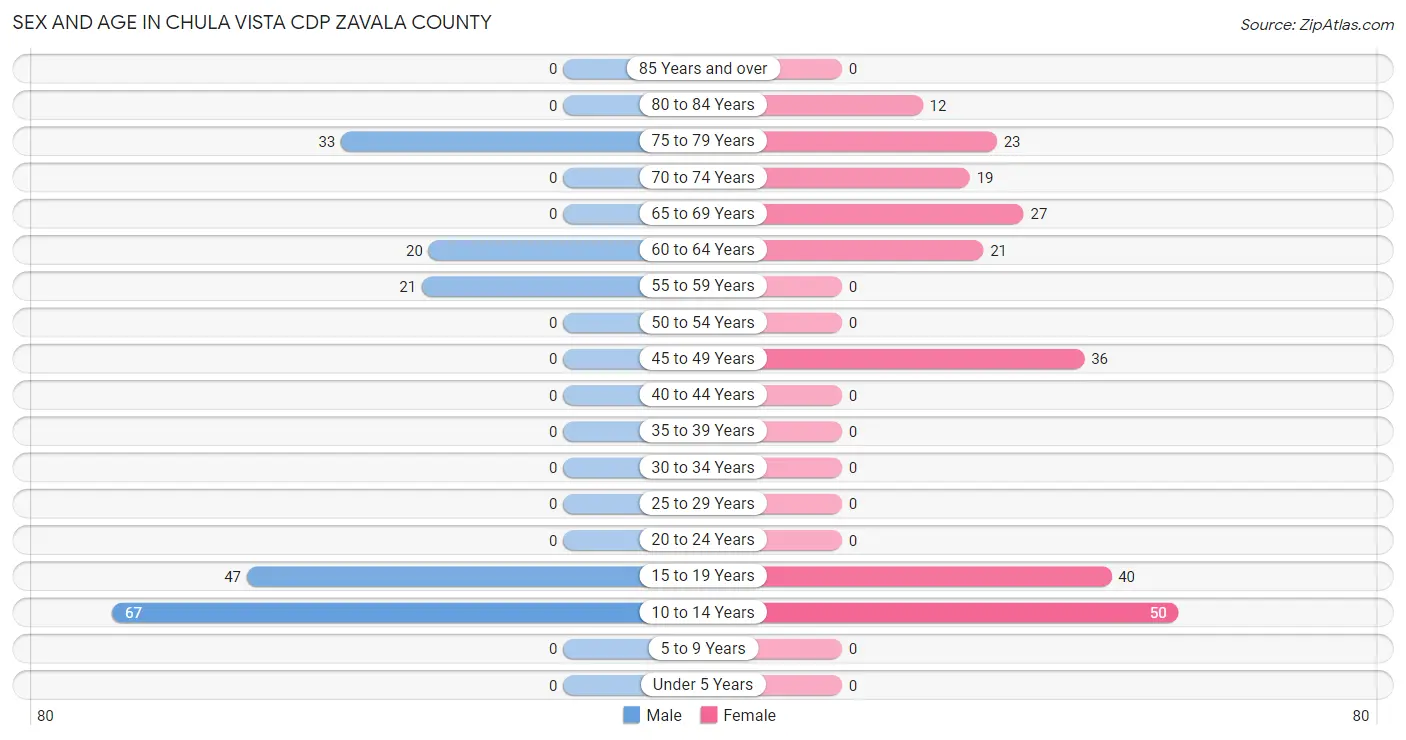
| Age Bracket | Male | Female |
| Under 5 Years | 0 (0.0%) | 0 (0.0%) |
| 5 to 9 Years | 0 (0.0%) | 0 (0.0%) |
| 10 to 14 Years | 67 (35.6%) | 50 (21.9%) |
| 15 to 19 Years | 47 (25.0%) | 40 (17.5%) |
| 20 to 24 Years | 0 (0.0%) | 0 (0.0%) |
| 25 to 29 Years | 0 (0.0%) | 0 (0.0%) |
| 30 to 34 Years | 0 (0.0%) | 0 (0.0%) |
| 35 to 39 Years | 0 (0.0%) | 0 (0.0%) |
| 40 to 44 Years | 0 (0.0%) | 0 (0.0%) |
| 45 to 49 Years | 0 (0.0%) | 36 (15.8%) |
| 50 to 54 Years | 0 (0.0%) | 0 (0.0%) |
| 55 to 59 Years | 21 (11.2%) | 0 (0.0%) |
| 60 to 64 Years | 20 (10.6%) | 21 (9.2%) |
| 65 to 69 Years | 0 (0.0%) | 27 (11.8%) |
| 70 to 74 Years | 0 (0.0%) | 19 (8.3%) |
| 75 to 79 Years | 33 (17.5%) | 23 (10.1%) |
| 80 to 84 Years | 0 (0.0%) | 12 (5.3%) |
| 85 Years and over | 0 (0.0%) | 0 (0.0%) |
| Total | 188 (100.0%) | 228 (100.0%) |
Families and Households in Chula Vista CDP Zavala County
Median Family Size in Chula Vista CDP Zavala County
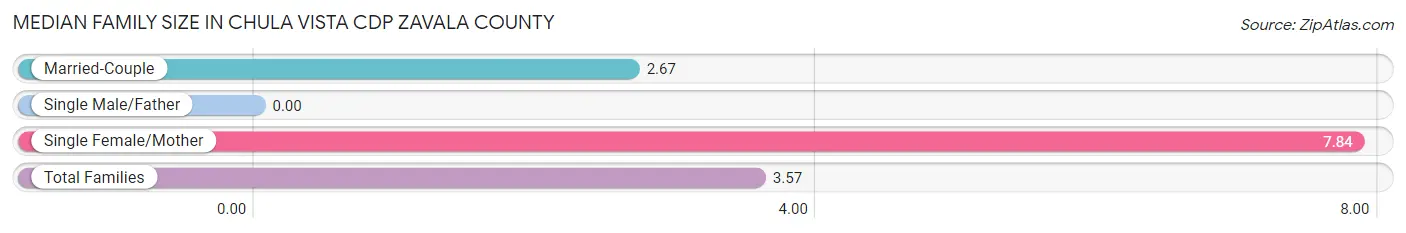
| Family Type | # Families | Family Size |
| Married-Couple | 90 (82.6%) | 2.67 |
| Single Male/Father | 0 (0.0%) | - |
| Single Female/Mother | 19 (17.4%) | 7.84 |
| Total Families | 109 (100.0%) | 3.57 |
Median Household Size in Chula Vista CDP Zavala County
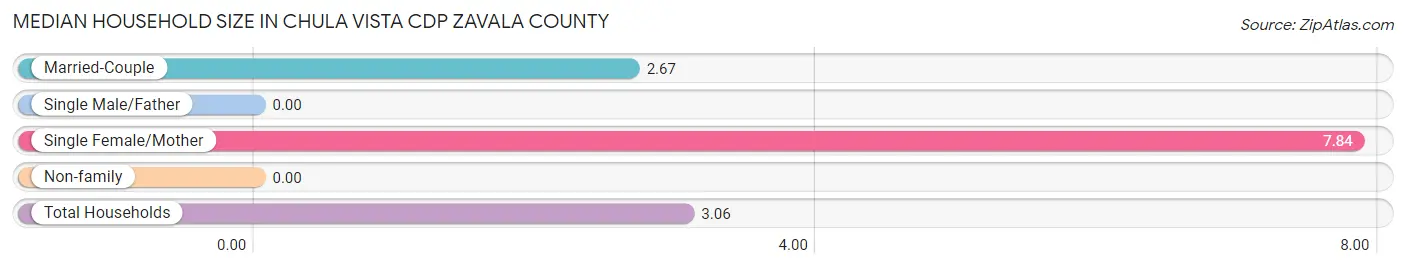
| Household Type | # Households | Household Size |
| Married-Couple | 90 (66.2%) | 2.67 |
| Single Male/Father | 0 (0.0%) | - |
| Single Female/Mother | 19 (14.0%) | 7.84 |
| Non-family | 27 (19.9%) | - |
| Total Households | 136 (100.0%) | 3.06 |
Household Size by Marriage Status in Chula Vista CDP Zavala County
Out of a total of 136 households in Chula Vista CDP Zavala County, 109 (80.1%) are family households, while 27 (19.9%) are nonfamily households. The most numerous type of family households are 4-person households, comprising 36, and the most common type of nonfamily households are 1-person households, comprising 27.
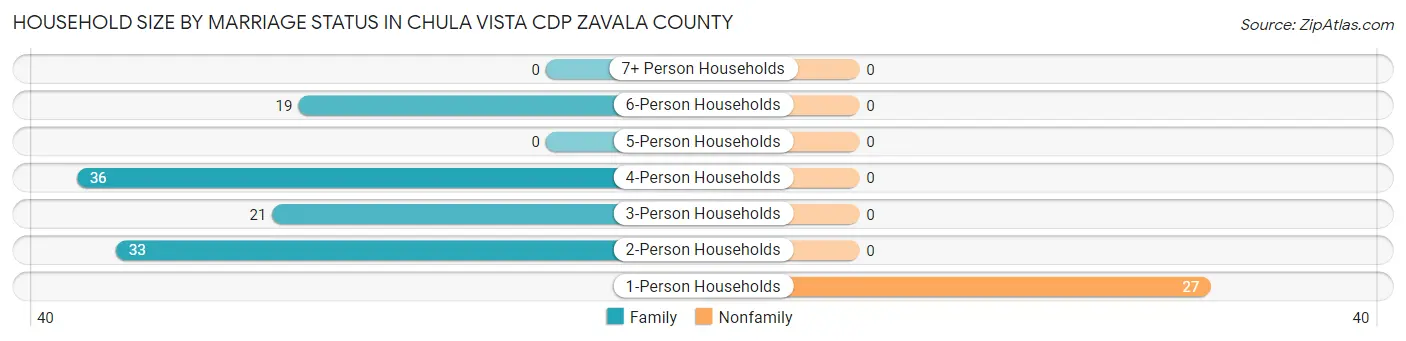
| Household Size | Family Households | Nonfamily Households |
| 1-Person Households | - | 27 (19.9%) |
| 2-Person Households | 33 (24.3%) | 0 (0.0%) |
| 3-Person Households | 21 (15.4%) | 0 (0.0%) |
| 4-Person Households | 36 (26.5%) | 0 (0.0%) |
| 5-Person Households | 0 (0.0%) | 0 (0.0%) |
| 6-Person Households | 19 (14.0%) | 0 (0.0%) |
| 7+ Person Households | 0 (0.0%) | 0 (0.0%) |
| Total | 109 (80.1%) | 27 (19.9%) |
Female Fertility in Chula Vista CDP Zavala County
Fertility by Age in Chula Vista CDP Zavala County
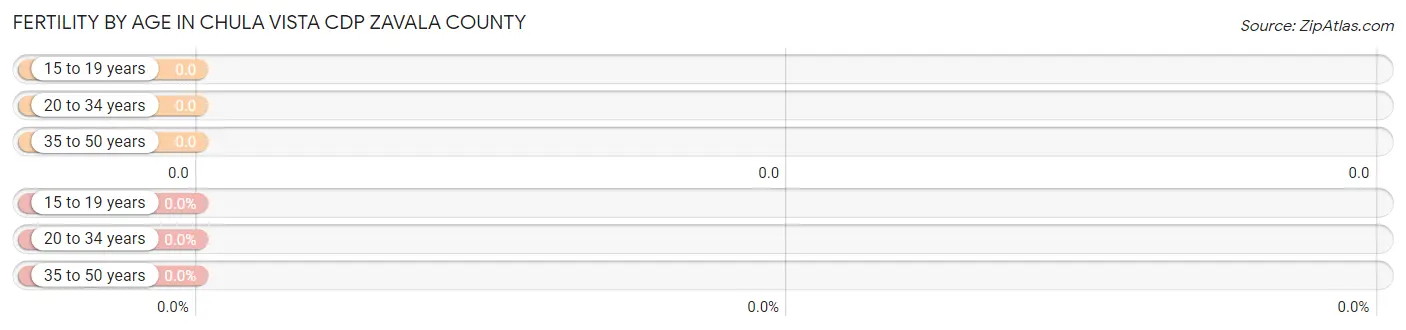
| Age Bracket | Women with Births | Births / 1,000 Women |
| 15 to 19 years | 0 (0.0%) | 0.0 |
| 20 to 34 years | 0 (0.0%) | 0.0 |
| 35 to 50 years | 0 (0.0%) | 0.0 |
| Total | 0 (0.0%) | 0.0 |
Fertility by Age by Marriage Status in Chula Vista CDP Zavala County
| Age Bracket | Married | Unmarried |
| 15 to 19 years | 0 (0.0%) | 0 (0.0%) |
| 20 to 34 years | 0 (0.0%) | 0 (0.0%) |
| 35 to 50 years | 0 (0.0%) | 0 (0.0%) |
| Total | 0 (0.0%) | 0 (0.0%) |
Fertility by Education in Chula Vista CDP Zavala County
| Educational Attainment | Women with Births | Births / 1,000 Women |
| Less than High School | 0 (0.0%) | 0.0 |
| High School Diploma | 0 (0.0%) | 0.0 |
| College or Associate's Degree | 0 (0.0%) | 0.0 |
| Bachelor's Degree | 0 (0.0%) | 0.0 |
| Graduate Degree | 0 (0.0%) | 0.0 |
| Total | 0 (0.0%) | 0.0 |
Fertility by Education by Marriage Status in Chula Vista CDP Zavala County
| Educational Attainment | Married | Unmarried |
| Less than High School | 0 (0.0%) | 0 (0.0%) |
| High School Diploma | 0 (0.0%) | 0 (0.0%) |
| College or Associate's Degree | 0 (0.0%) | 0 (0.0%) |
| Bachelor's Degree | 0 (0.0%) | 0 (0.0%) |
| Graduate Degree | 0 (0.0%) | 0 (0.0%) |
| Total | 0 (0.0%) | 0 (0.0%) |
Employment Characteristics in Chula Vista CDP Zavala County
Employment by Class of Employer in Chula Vista CDP Zavala County
Among the 57 employed individuals in Chula Vista CDP Zavala County, self-employed (not incorporated) (36 | 63.2%), and state government employees (21 | 36.8%) make up the most common classes of employment.
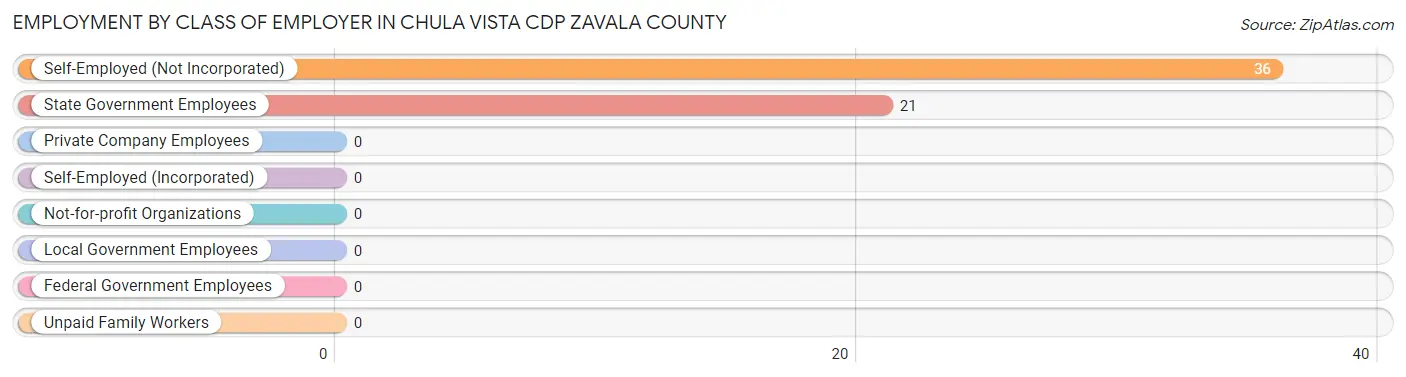
| Employer Class | # Employees | % Employees |
| Private Company Employees | 0 | 0.0% |
| Self-Employed (Incorporated) | 0 | 0.0% |
| Self-Employed (Not Incorporated) | 36 | 63.2% |
| Not-for-profit Organizations | 0 | 0.0% |
| Local Government Employees | 0 | 0.0% |
| State Government Employees | 21 | 36.8% |
| Federal Government Employees | 0 | 0.0% |
| Unpaid Family Workers | 0 | 0.0% |
| Total | 57 | 100.0% |
Employment Status by Age in Chula Vista CDP Zavala County
According to the labor force statistics for Chula Vista CDP Zavala County, out of the total population over 16 years of age (299), 28.1% or 84 individuals are in the labor force, with 32.1% or 27 of them unemployed. The age group with the highest labor force participation rate is 45 to 54 years, with 100.0% or 36 individuals in the labor force. Within the labor force, the 65 to 74 years age range has the highest percentage of unemployed individuals, with 100.0% or 27 of them being unemployed.
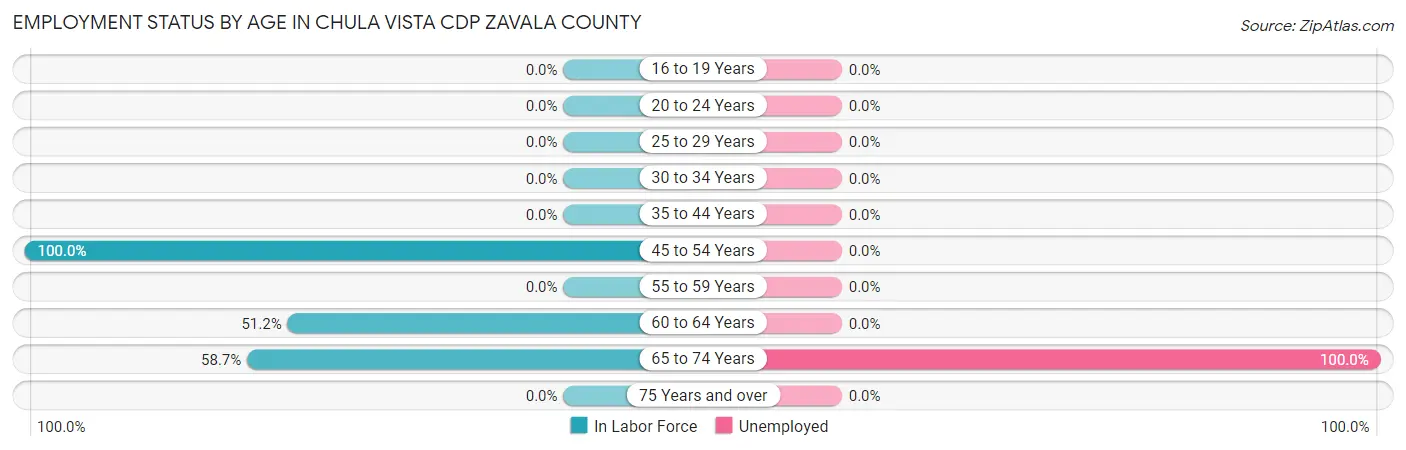
| Age Bracket | In Labor Force | Unemployed |
| 16 to 19 Years | 0 (0.0%) | 0 (0.0%) |
| 20 to 24 Years | 0 (0.0%) | 0 (0.0%) |
| 25 to 29 Years | 0 (0.0%) | 0 (0.0%) |
| 30 to 34 Years | 0 (0.0%) | 0 (0.0%) |
| 35 to 44 Years | 0 (0.0%) | 0 (0.0%) |
| 45 to 54 Years | 36 (100.0%) | 0 (0.0%) |
| 55 to 59 Years | 0 (0.0%) | 0 (0.0%) |
| 60 to 64 Years | 21 (51.2%) | 0 (0.0%) |
| 65 to 74 Years | 27 (58.7%) | 27 (100.0%) |
| 75 Years and over | 0 (0.0%) | 0 (0.0%) |
| Total | 84 (28.1%) | 27 (32.1%) |
Employment Status by Educational Attainment in Chula Vista CDP Zavala County
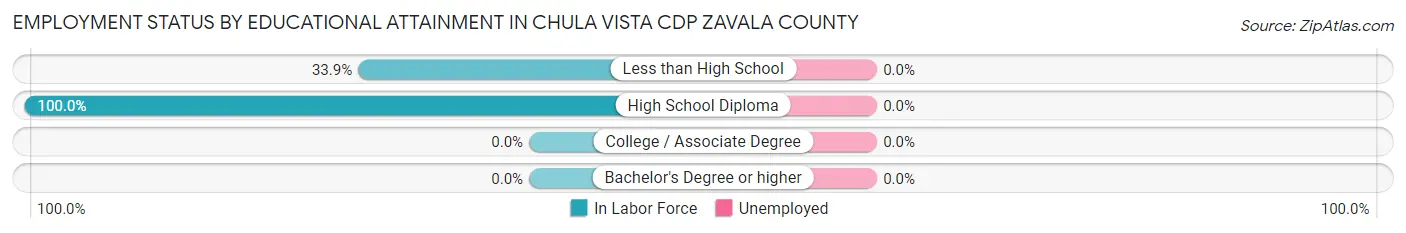
| Educational Attainment | In Labor Force | Unemployed |
| Less than High School | 21 (33.9%) | 0 (0.0%) |
| High School Diploma | 36 (100.0%) | 0 (0.0%) |
| College / Associate Degree | 0 (0.0%) | 0 (0.0%) |
| Bachelor's Degree or higher | 0 (0.0%) | 0 (0.0%) |
| Total | 57 (58.2%) | 0 (0.0%) |
Employment Occupations by Sex in Chula Vista CDP Zavala County
Management, Business, Science and Arts Occupations
Management, Business, Science and Arts Occupations by Sex
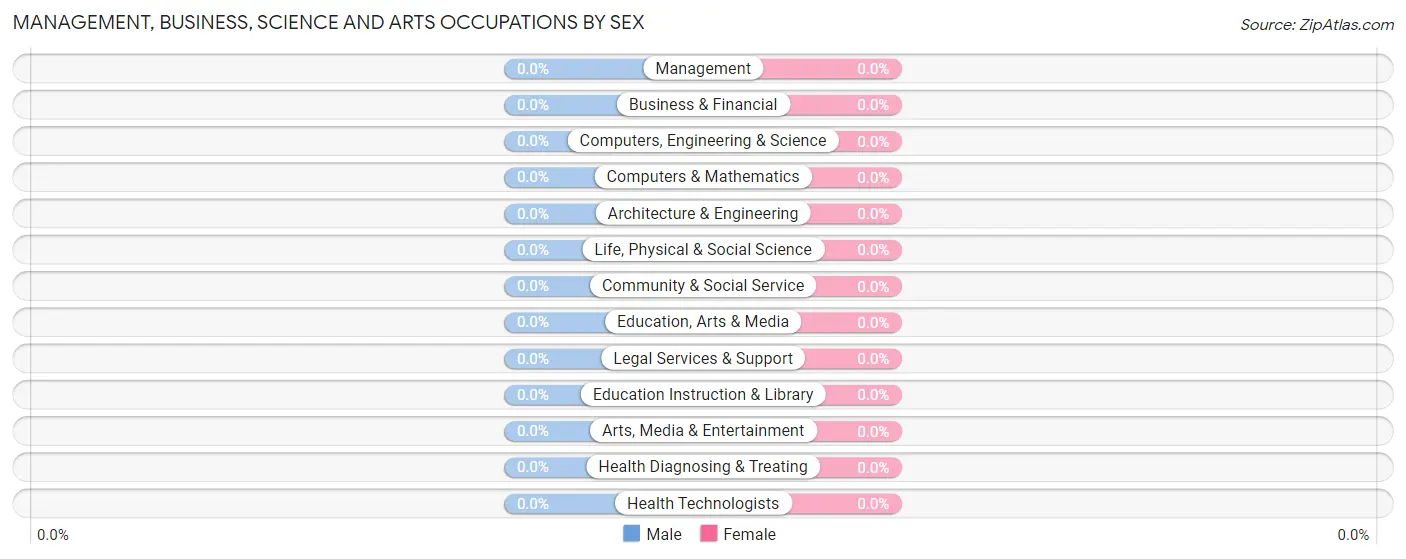
| Occupation | Male | Female |
| Management | 0 (0.0%) | 0 (0.0%) |
| Business & Financial | 0 (0.0%) | 0 (0.0%) |
| Computers, Engineering & Science | 0 (0.0%) | 0 (0.0%) |
| Computers & Mathematics | 0 (0.0%) | 0 (0.0%) |
| Architecture & Engineering | 0 (0.0%) | 0 (0.0%) |
| Life, Physical & Social Science | 0 (0.0%) | 0 (0.0%) |
| Community & Social Service | 0 (0.0%) | 0 (0.0%) |
| Education, Arts & Media | 0 (0.0%) | 0 (0.0%) |
| Legal Services & Support | 0 (0.0%) | 0 (0.0%) |
| Education Instruction & Library | 0 (0.0%) | 0 (0.0%) |
| Arts, Media & Entertainment | 0 (0.0%) | 0 (0.0%) |
| Health Diagnosing & Treating | 0 (0.0%) | 0 (0.0%) |
| Health Technologists | 0 (0.0%) | 0 (0.0%) |
| Total (Category) | 0 (0.0%) | 0 (0.0%) |
| Total (Overall) | 0 (0.0%) | 57 (100.0%) |
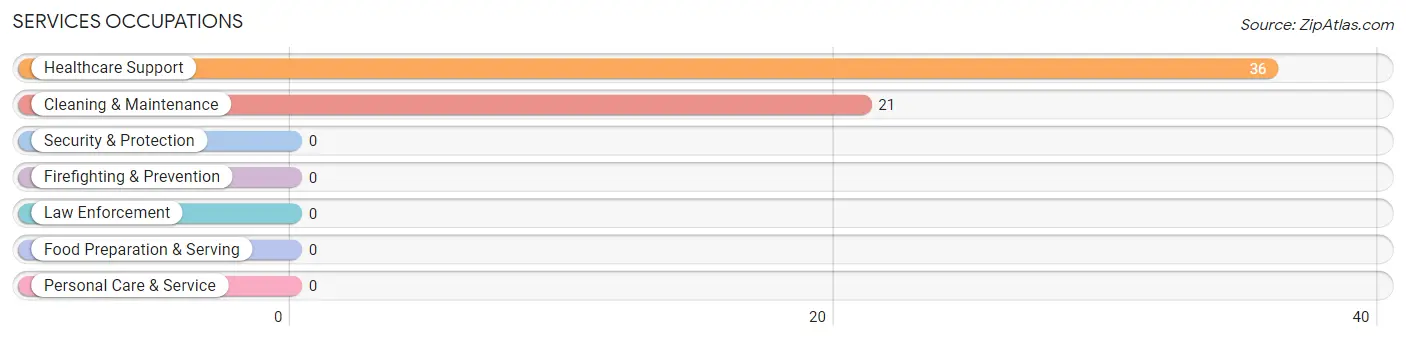
Services Occupations
The most common Services occupations in Chula Vista CDP Zavala County are Healthcare Support (36 | 63.2%), and Cleaning & Maintenance (21 | 36.8%).
Services Occupations by Sex
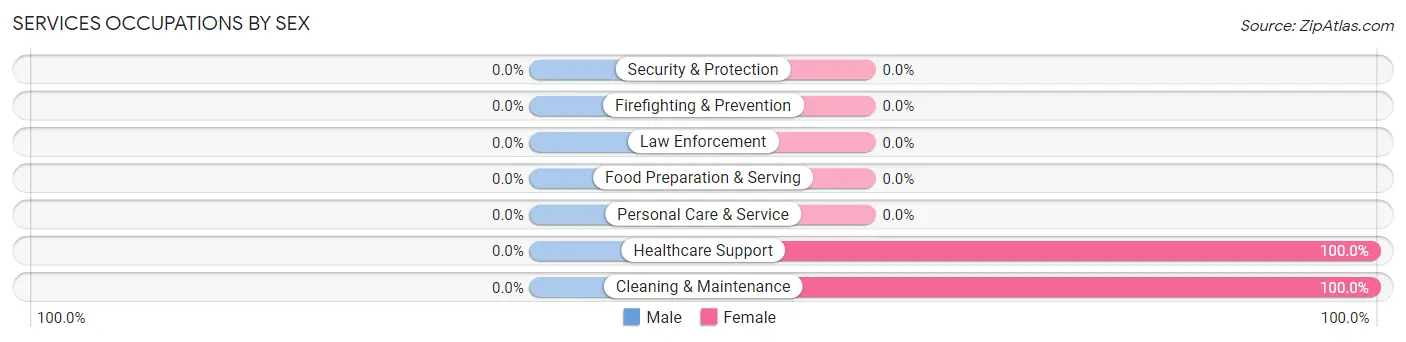
| Occupation | Male | Female |
| Healthcare Support | 0 (0.0%) | 36 (100.0%) |
| Security & Protection | 0 (0.0%) | 0 (0.0%) |
| Firefighting & Prevention | 0 (0.0%) | 0 (0.0%) |
| Law Enforcement | 0 (0.0%) | 0 (0.0%) |
| Food Preparation & Serving | 0 (0.0%) | 0 (0.0%) |
| Cleaning & Maintenance | 0 (0.0%) | 21 (100.0%) |
| Personal Care & Service | 0 (0.0%) | 0 (0.0%) |
| Total (Category) | 0 (0.0%) | 57 (100.0%) |
| Total (Overall) | 0 (0.0%) | 57 (100.0%) |
Sales and Office Occupations

Sales and Office Occupations by Sex

| Occupation | Male | Female |
| Sales & Related | 0 (0.0%) | 0 (0.0%) |
| Office & Administration | 0 (0.0%) | 0 (0.0%) |
| Total (Category) | 0 (0.0%) | 0 (0.0%) |
| Total (Overall) | 0 (0.0%) | 57 (100.0%) |
Natural Resources, Construction and Maintenance Occupations
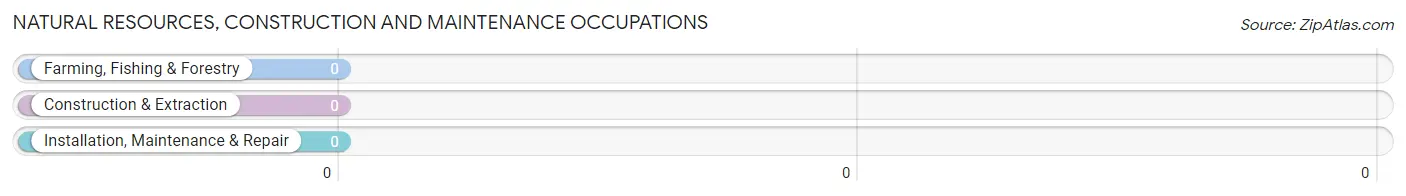
Natural Resources, Construction and Maintenance Occupations by Sex
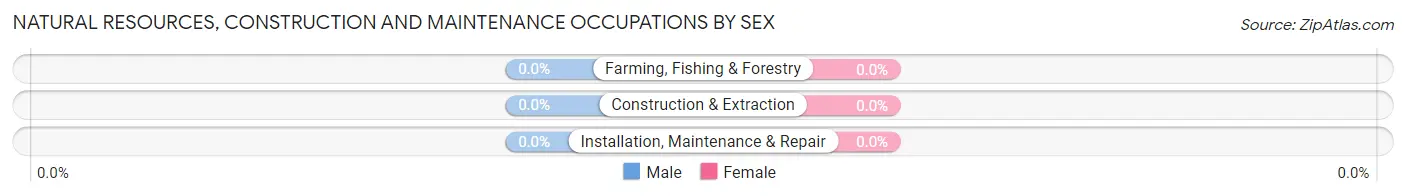
| Occupation | Male | Female |
| Farming, Fishing & Forestry | 0 (0.0%) | 0 (0.0%) |
| Construction & Extraction | 0 (0.0%) | 0 (0.0%) |
| Installation, Maintenance & Repair | 0 (0.0%) | 0 (0.0%) |
| Total (Category) | 0 (0.0%) | 0 (0.0%) |
| Total (Overall) | 0 (0.0%) | 57 (100.0%) |
Production, Transportation and Moving Occupations
Production, Transportation and Moving Occupations by Sex
| Occupation | Male | Female |
| Production | 0 (0.0%) | 0 (0.0%) |
| Transportation | 0 (0.0%) | 0 (0.0%) |
| Material Moving | 0 (0.0%) | 0 (0.0%) |
| Total (Category) | 0 (0.0%) | 0 (0.0%) |
| Total (Overall) | 0 (0.0%) | 57 (100.0%) |
Employment Industries by Sex in Chula Vista CDP Zavala County
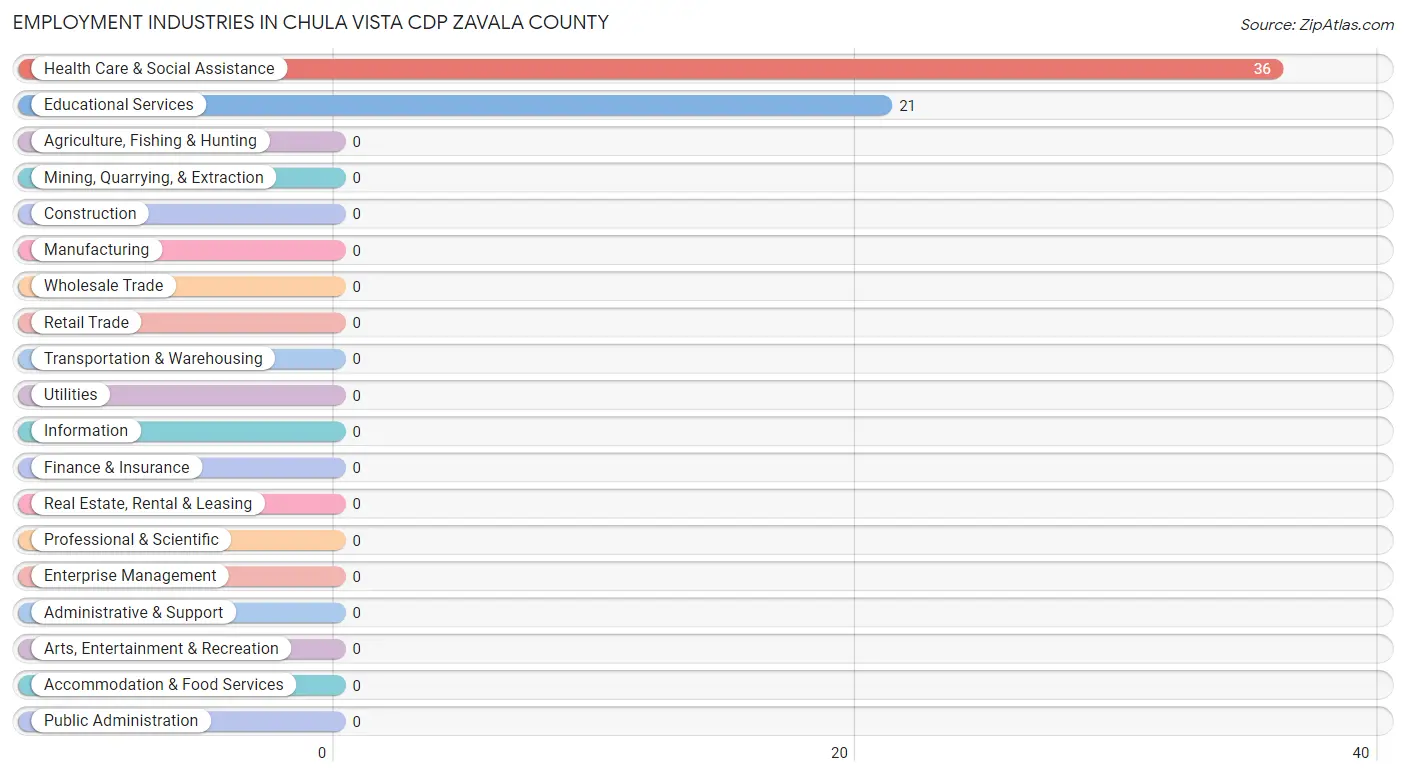
Employment Industries in Chula Vista CDP Zavala County
The major employment industries in Chula Vista CDP Zavala County include Health Care & Social Assistance (36 | 63.2%), and Educational Services (21 | 36.8%).
Employment Industries by Sex in Chula Vista CDP Zavala County
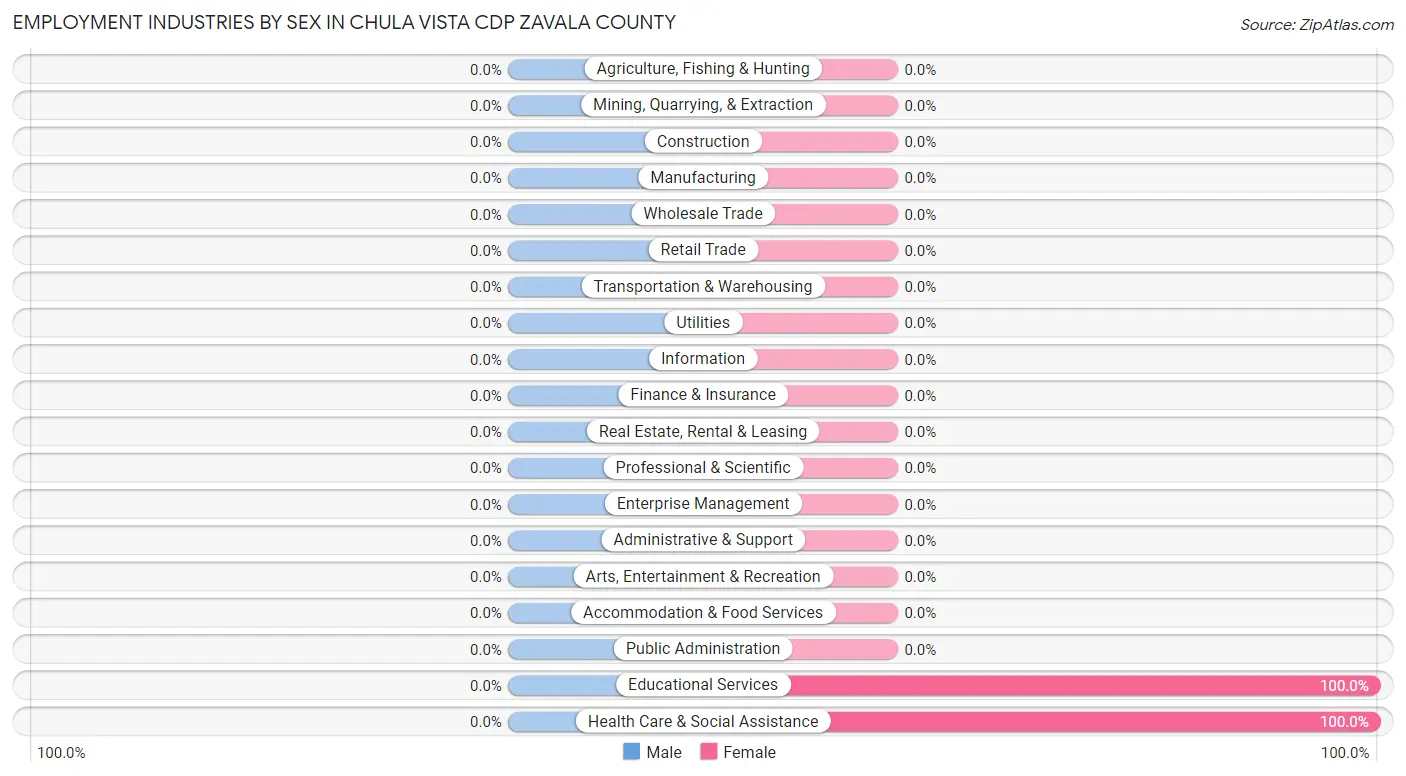
| Industry | Male | Female |
| Agriculture, Fishing & Hunting | 0 (0.0%) | 0 (0.0%) |
| Mining, Quarrying, & Extraction | 0 (0.0%) | 0 (0.0%) |
| Construction | 0 (0.0%) | 0 (0.0%) |
| Manufacturing | 0 (0.0%) | 0 (0.0%) |
| Wholesale Trade | 0 (0.0%) | 0 (0.0%) |
| Retail Trade | 0 (0.0%) | 0 (0.0%) |
| Transportation & Warehousing | 0 (0.0%) | 0 (0.0%) |
| Utilities | 0 (0.0%) | 0 (0.0%) |
| Information | 0 (0.0%) | 0 (0.0%) |
| Finance & Insurance | 0 (0.0%) | 0 (0.0%) |
| Real Estate, Rental & Leasing | 0 (0.0%) | 0 (0.0%) |
| Professional & Scientific | 0 (0.0%) | 0 (0.0%) |
| Enterprise Management | 0 (0.0%) | 0 (0.0%) |
| Administrative & Support | 0 (0.0%) | 0 (0.0%) |
| Educational Services | 0 (0.0%) | 21 (100.0%) |
| Health Care & Social Assistance | 0 (0.0%) | 36 (100.0%) |
| Arts, Entertainment & Recreation | 0 (0.0%) | 0 (0.0%) |
| Accommodation & Food Services | 0 (0.0%) | 0 (0.0%) |
| Public Administration | 0 (0.0%) | 0 (0.0%) |
| Total | 0 (0.0%) | 57 (100.0%) |
Education in Chula Vista CDP Zavala County
School Enrollment in Chula Vista CDP Zavala County
The most common levels of schooling among the 131 students in Chula Vista CDP Zavala County are middle school (84 | 64.1%), and high school (47 | 35.9%).
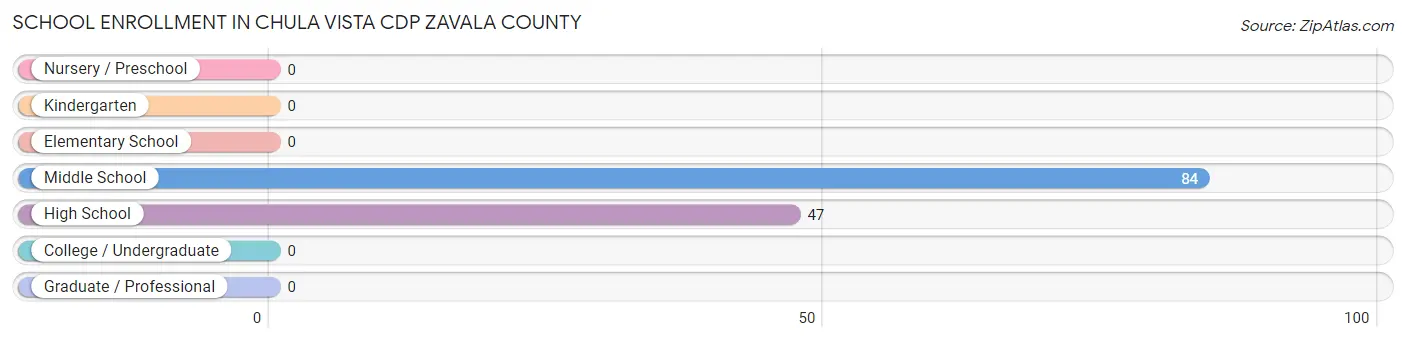
| School Level | # Students | % Students |
| Nursery / Preschool | 0 | 0.0% |
| Kindergarten | 0 | 0.0% |
| Elementary School | 0 | 0.0% |
| Middle School | 84 | 64.1% |
| High School | 47 | 35.9% |
| College / Undergraduate | 0 | 0.0% |
| Graduate / Professional | 0 | 0.0% |
| Total | 131 | 100.0% |
School Enrollment by Age by Funding Source in Chula Vista CDP Zavala County
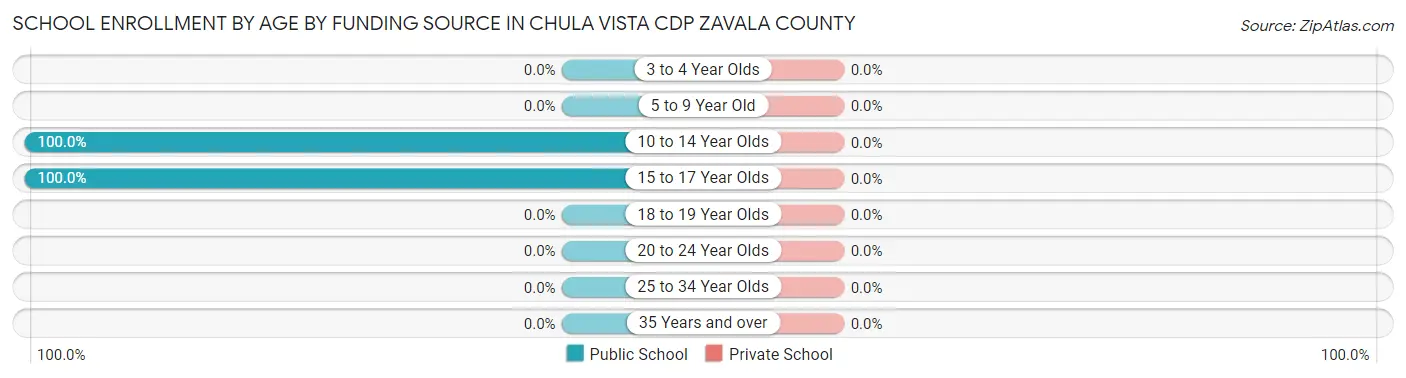
| Age Bracket | Public School | Private School |
| 3 to 4 Year Olds | 0 (0.0%) | 0 (0.0%) |
| 5 to 9 Year Old | 0 (0.0%) | 0 (0.0%) |
| 10 to 14 Year Olds | 84 (100.0%) | 0 (0.0%) |
| 15 to 17 Year Olds | 47 (100.0%) | 0 (0.0%) |
| 18 to 19 Year Olds | 0 (0.0%) | 0 (0.0%) |
| 20 to 24 Year Olds | 0 (0.0%) | 0 (0.0%) |
| 25 to 34 Year Olds | 0 (0.0%) | 0 (0.0%) |
| 35 Years and over | 0 (0.0%) | 0 (0.0%) |
| Total | 131 (100.0%) | 0 (0.0%) |
Educational Attainment by Field of Study in Chula Vista CDP Zavala County
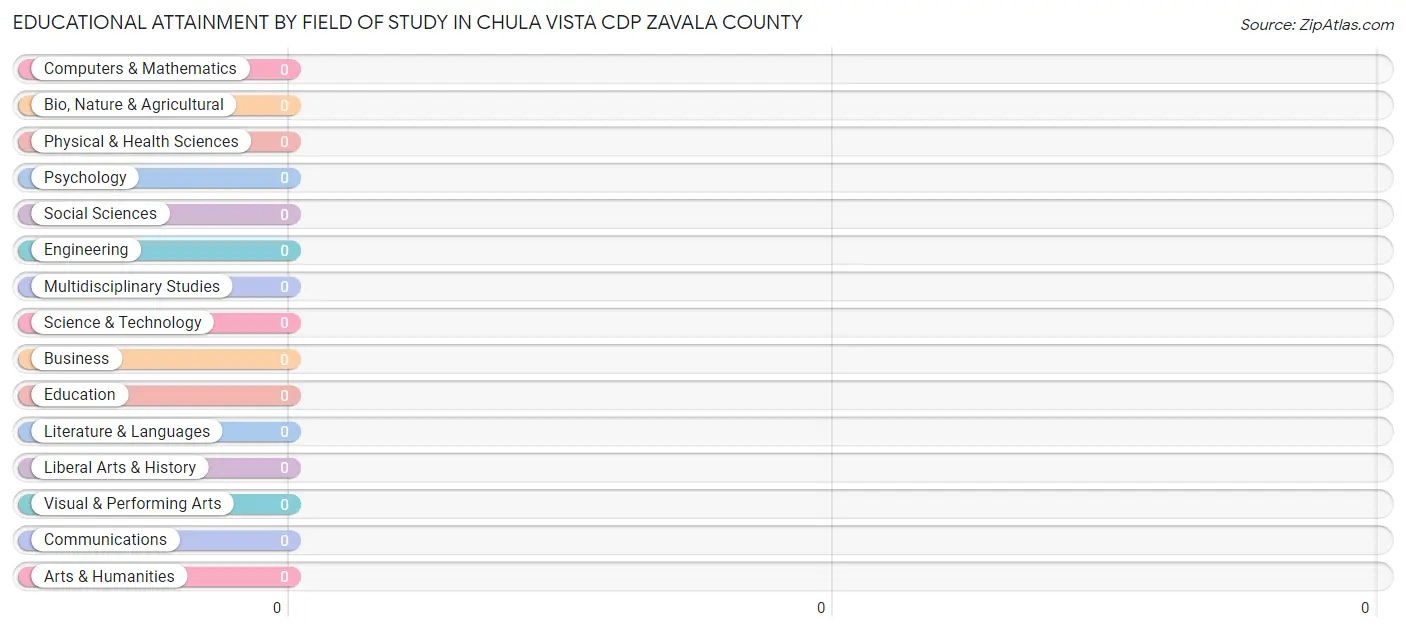
| Field of Study | # Graduates | % Graduates |
| Computers & Mathematics | 0 | 0.0% |
| Bio, Nature & Agricultural | 0 | 0.0% |
| Physical & Health Sciences | 0 | 0.0% |
| Psychology | 0 | 0.0% |
| Social Sciences | 0 | 0.0% |
| Engineering | 0 | 0.0% |
| Multidisciplinary Studies | 0 | 0.0% |
| Science & Technology | 0 | 0.0% |
| Business | 0 | 0.0% |
| Education | 0 | 0.0% |
| Literature & Languages | 0 | 0.0% |
| Liberal Arts & History | 0 | 0.0% |
| Visual & Performing Arts | 0 | 0.0% |
| Communications | 0 | 0.0% |
| Arts & Humanities | 0 | 0.0% |
| Total | 0 | 0.0% |
Transportation & Commute in Chula Vista CDP Zavala County
Vehicle Availability by Sex in Chula Vista CDP Zavala County
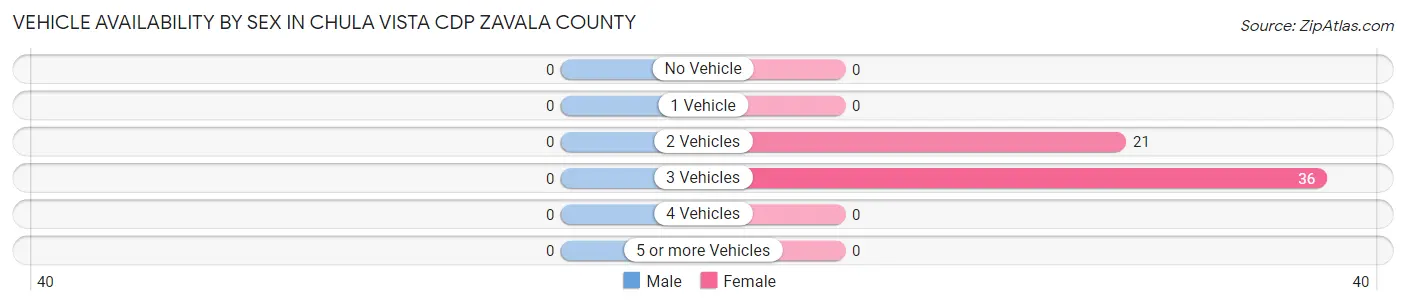
| Vehicles Available | Male | Female |
| No Vehicle | 0 (0.0%) | 0 (0.0%) |
| 1 Vehicle | 0 (0.0%) | 0 (0.0%) |
| 2 Vehicles | 0 (0.0%) | 21 (36.8%) |
| 3 Vehicles | 0 (0.0%) | 36 (63.2%) |
| 4 Vehicles | 0 (0.0%) | 0 (0.0%) |
| 5 or more Vehicles | 0 (0.0%) | 0 (0.0%) |
| Total | 0 (0.0%) | 57 (100.0%) |
Commute Time in Chula Vista CDP Zavala County
The most frequently occuring commute durations in Chula Vista CDP Zavala County are 10 to 14 minutes (21 commuters, 100.0%), less than 5 minutes (0 commuters, 0.0%), and 5 to 9 minutes (0 commuters, 0.0%).
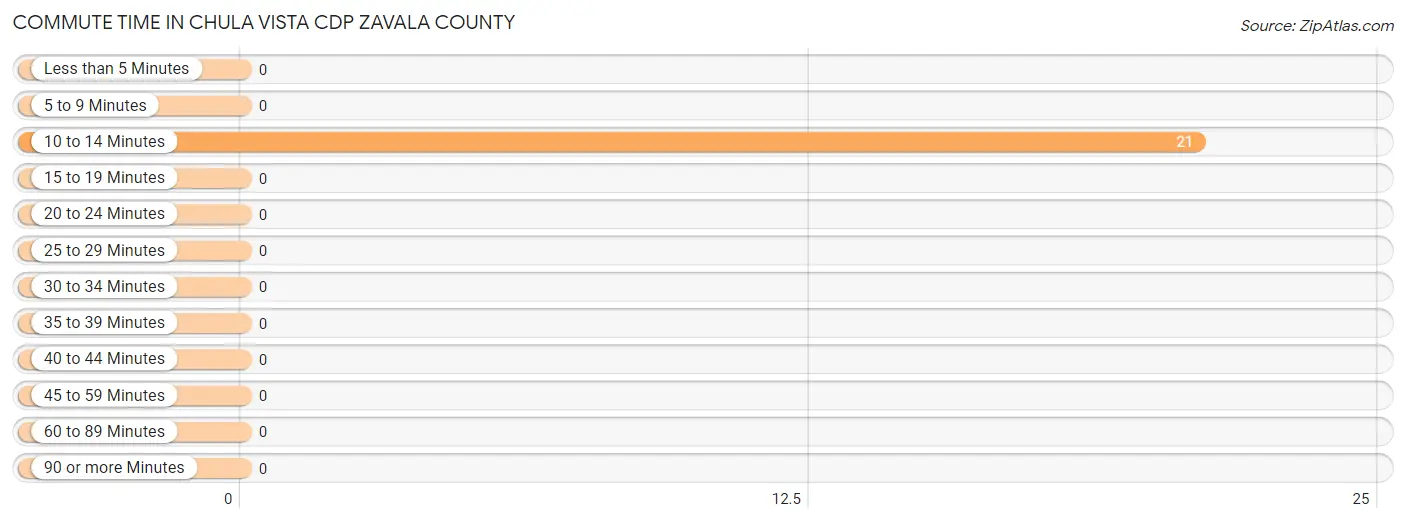
| Commute Time | # Commuters | % Commuters |
| Less than 5 Minutes | 0 | 0.0% |
| 5 to 9 Minutes | 0 | 0.0% |
| 10 to 14 Minutes | 21 | 100.0% |
| 15 to 19 Minutes | 0 | 0.0% |
| 20 to 24 Minutes | 0 | 0.0% |
| 25 to 29 Minutes | 0 | 0.0% |
| 30 to 34 Minutes | 0 | 0.0% |
| 35 to 39 Minutes | 0 | 0.0% |
| 40 to 44 Minutes | 0 | 0.0% |
| 45 to 59 Minutes | 0 | 0.0% |
| 60 to 89 Minutes | 0 | 0.0% |
| 90 or more Minutes | 0 | 0.0% |
Commute Time by Sex in Chula Vista CDP Zavala County
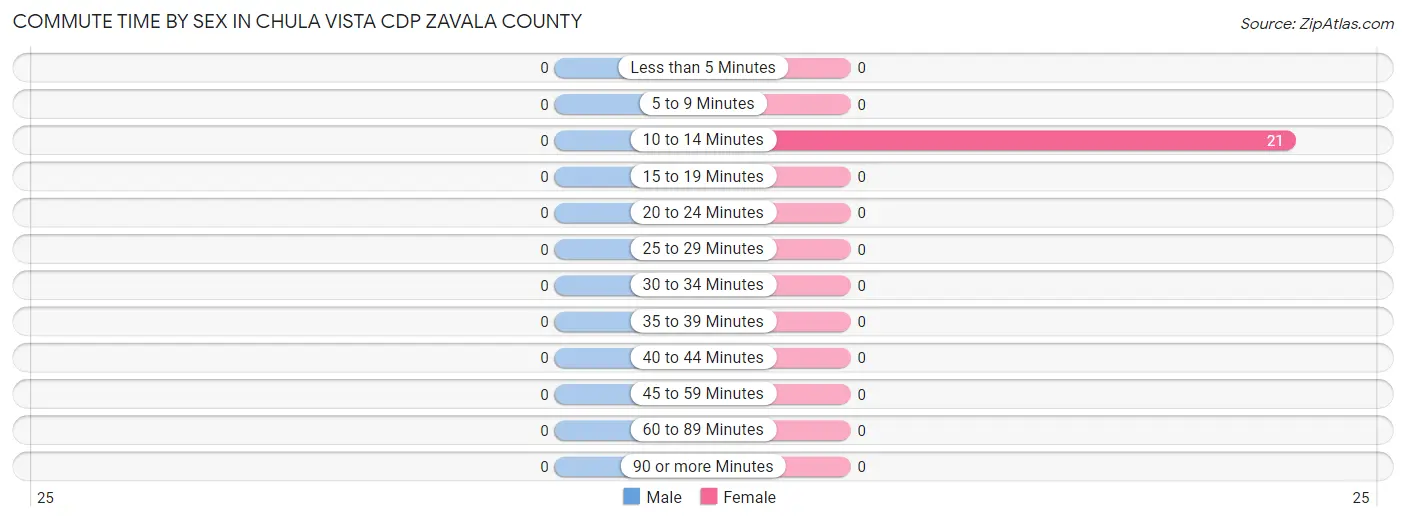
| Commute Time | Male | Female |
| Less than 5 Minutes | 0 (0.0%) | 0 (0.0%) |
| 5 to 9 Minutes | 0 (0.0%) | 0 (0.0%) |
| 10 to 14 Minutes | 0 (0.0%) | 21 (100.0%) |
| 15 to 19 Minutes | 0 (0.0%) | 0 (0.0%) |
| 20 to 24 Minutes | 0 (0.0%) | 0 (0.0%) |
| 25 to 29 Minutes | 0 (0.0%) | 0 (0.0%) |
| 30 to 34 Minutes | 0 (0.0%) | 0 (0.0%) |
| 35 to 39 Minutes | 0 (0.0%) | 0 (0.0%) |
| 40 to 44 Minutes | 0 (0.0%) | 0 (0.0%) |
| 45 to 59 Minutes | 0 (0.0%) | 0 (0.0%) |
| 60 to 89 Minutes | 0 (0.0%) | 0 (0.0%) |
| 90 or more Minutes | 0 (0.0%) | 0 (0.0%) |
Time of Departure to Work by Sex in Chula Vista CDP Zavala County
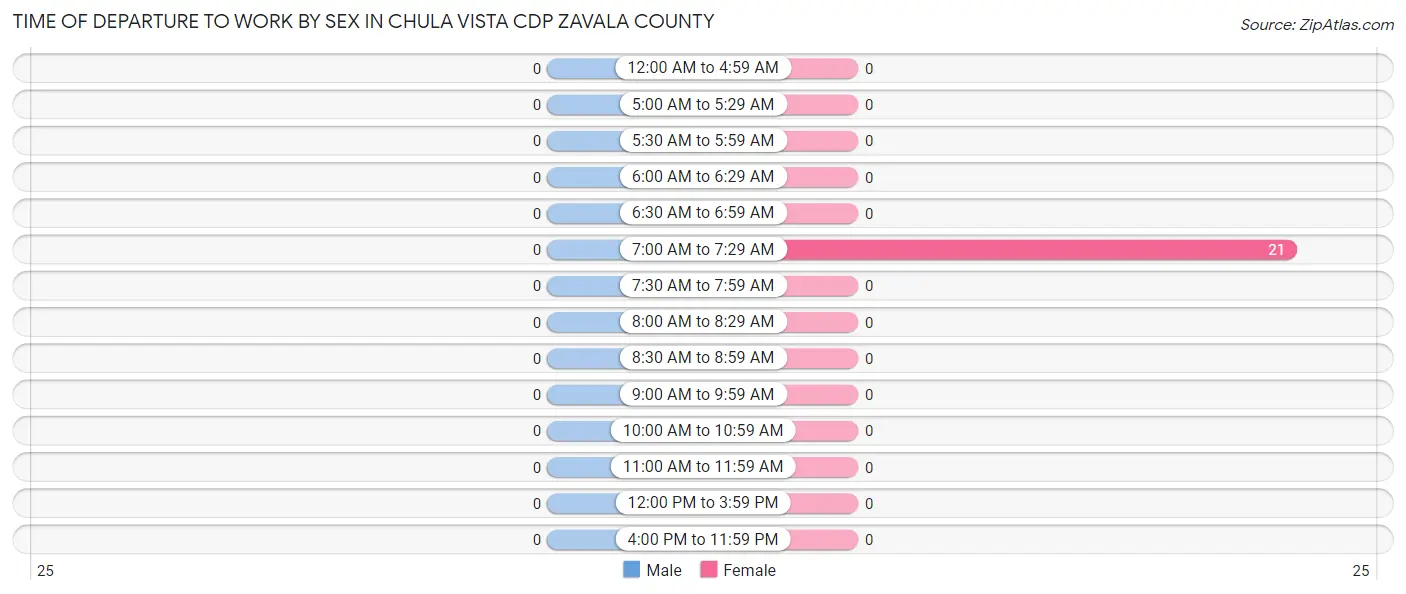
| Time of Departure | Male | Female |
| 12:00 AM to 4:59 AM | 0 (0.0%) | 0 (0.0%) |
| 5:00 AM to 5:29 AM | 0 (0.0%) | 0 (0.0%) |
| 5:30 AM to 5:59 AM | 0 (0.0%) | 0 (0.0%) |
| 6:00 AM to 6:29 AM | 0 (0.0%) | 0 (0.0%) |
| 6:30 AM to 6:59 AM | 0 (0.0%) | 0 (0.0%) |
| 7:00 AM to 7:29 AM | 0 (0.0%) | 21 (100.0%) |
| 7:30 AM to 7:59 AM | 0 (0.0%) | 0 (0.0%) |
| 8:00 AM to 8:29 AM | 0 (0.0%) | 0 (0.0%) |
| 8:30 AM to 8:59 AM | 0 (0.0%) | 0 (0.0%) |
| 9:00 AM to 9:59 AM | 0 (0.0%) | 0 (0.0%) |
| 10:00 AM to 10:59 AM | 0 (0.0%) | 0 (0.0%) |
| 11:00 AM to 11:59 AM | 0 (0.0%) | 0 (0.0%) |
| 12:00 PM to 3:59 PM | 0 (0.0%) | 0 (0.0%) |
| 4:00 PM to 11:59 PM | 0 (0.0%) | 0 (0.0%) |
| Total | 0 (0.0%) | 21 (100.0%) |
Housing Occupancy in Chula Vista CDP Zavala County
Occupancy by Ownership in Chula Vista CDP Zavala County
Of the total 136 dwellings in Chula Vista CDP Zavala County, owner-occupied units account for 136 (100.0%), while renter-occupied units make up 0 (0.0%).
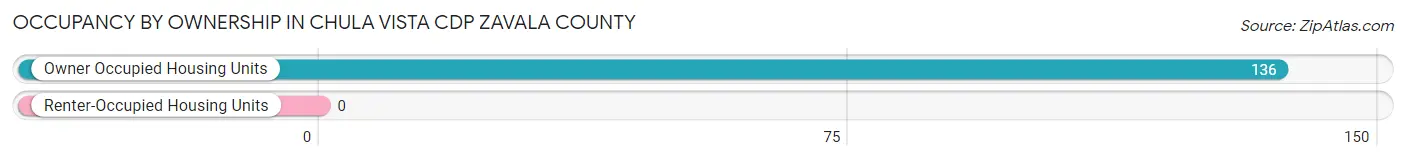
| Occupancy | # Housing Units | % Housing Units |
| Owner Occupied Housing Units | 136 | 100.0% |
| Renter-Occupied Housing Units | 0 | 0.0% |
| Total Occupied Housing Units | 136 | 100.0% |
Occupancy by Household Size in Chula Vista CDP Zavala County
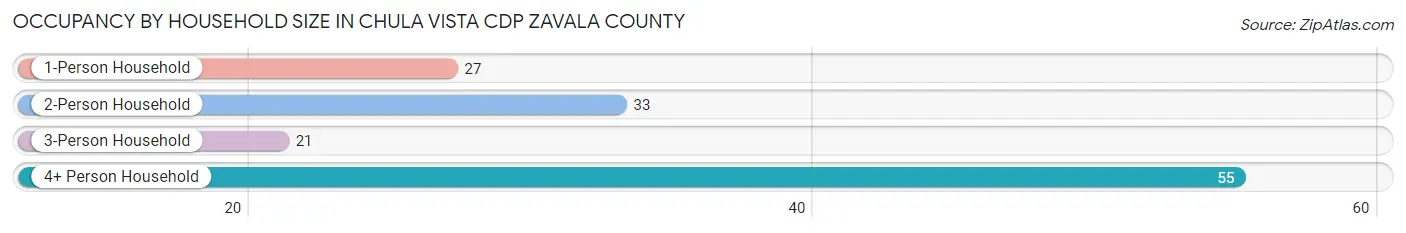
| Household Size | # Housing Units | % Housing Units |
| 1-Person Household | 27 | 19.9% |
| 2-Person Household | 33 | 24.3% |
| 3-Person Household | 21 | 15.4% |
| 4+ Person Household | 55 | 40.4% |
| Total Housing Units | 136 | 100.0% |
Occupancy by Ownership by Household Size in Chula Vista CDP Zavala County
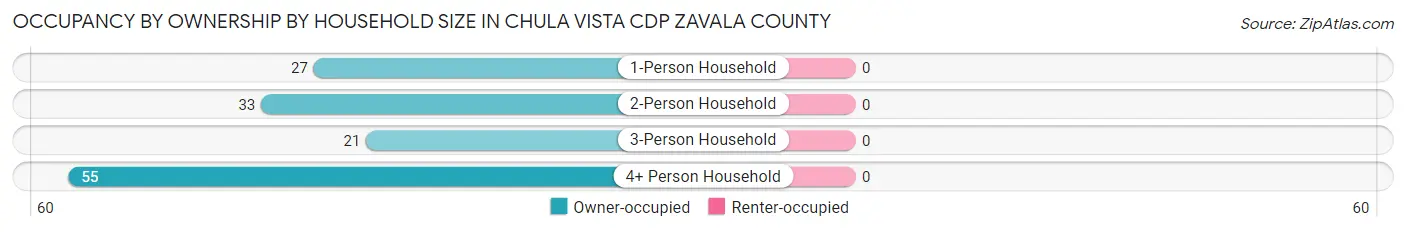
| Household Size | Owner-occupied | Renter-occupied |
| 1-Person Household | 27 (100.0%) | 0 (0.0%) |
| 2-Person Household | 33 (100.0%) | 0 (0.0%) |
| 3-Person Household | 21 (100.0%) | 0 (0.0%) |
| 4+ Person Household | 55 (100.0%) | 0 (0.0%) |
| Total Housing Units | 136 (100.0%) | 0 (0.0%) |
Occupancy by Educational Attainment in Chula Vista CDP Zavala County
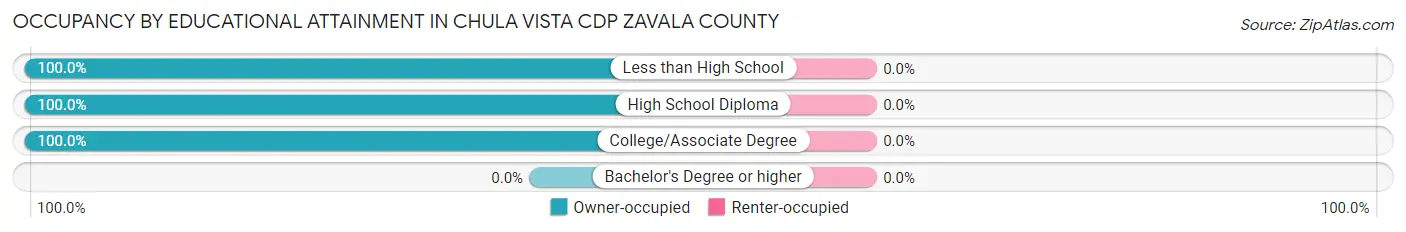
| Household Size | Owner-occupied | Renter-occupied |
| Less than High School | 81 (100.0%) | 0 (0.0%) |
| High School Diploma | 36 (100.0%) | 0 (0.0%) |
| College/Associate Degree | 19 (100.0%) | 0 (0.0%) |
| Bachelor's Degree or higher | 0 (0.0%) | 0 (0.0%) |
Occupancy by Age of Householder in Chula Vista CDP Zavala County
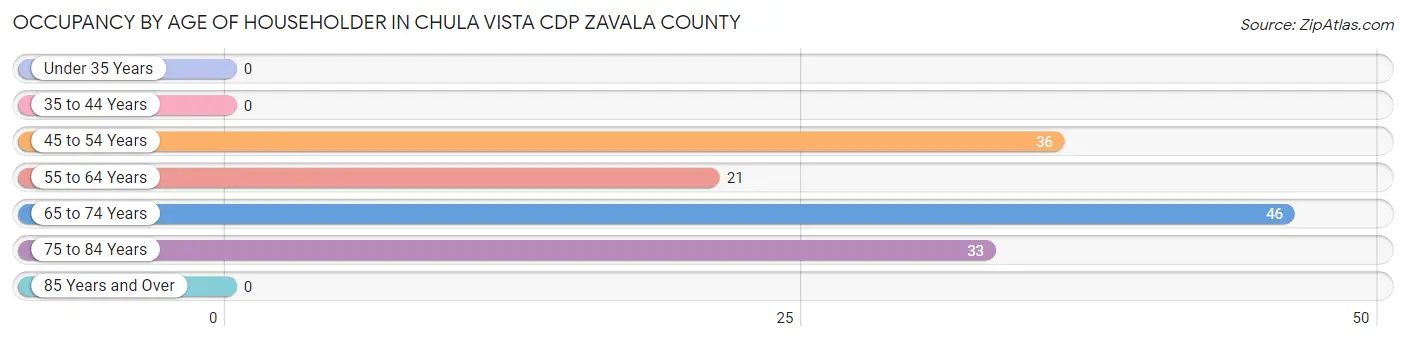
| Age Bracket | # Households | % Households |
| Under 35 Years | 0 | 0.0% |
| 35 to 44 Years | 0 | 0.0% |
| 45 to 54 Years | 36 | 26.5% |
| 55 to 64 Years | 21 | 15.4% |
| 65 to 74 Years | 46 | 33.8% |
| 75 to 84 Years | 33 | 24.3% |
| 85 Years and Over | 0 | 0.0% |
| Total | 136 | 100.0% |
Housing Finances in Chula Vista CDP Zavala County
Median Income by Occupancy in Chula Vista CDP Zavala County
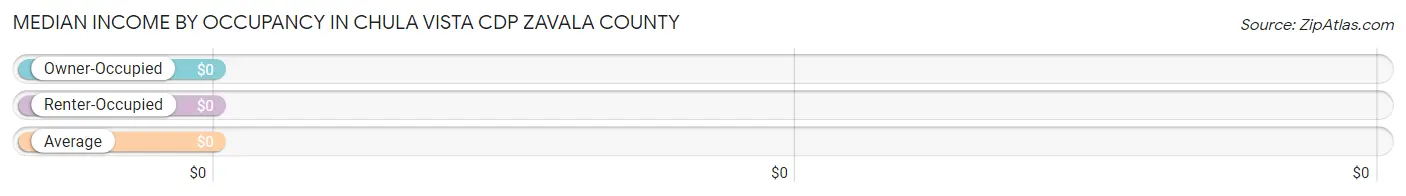
| Occupancy Type | # Households | Median Income |
| Owner-Occupied | 136 (100.0%) | $0 |
| Renter-Occupied | 0 (0.0%) | $0 |
| Average | 136 (100.0%) | $0 |
Occupancy by Householder Income Bracket in Chula Vista CDP Zavala County
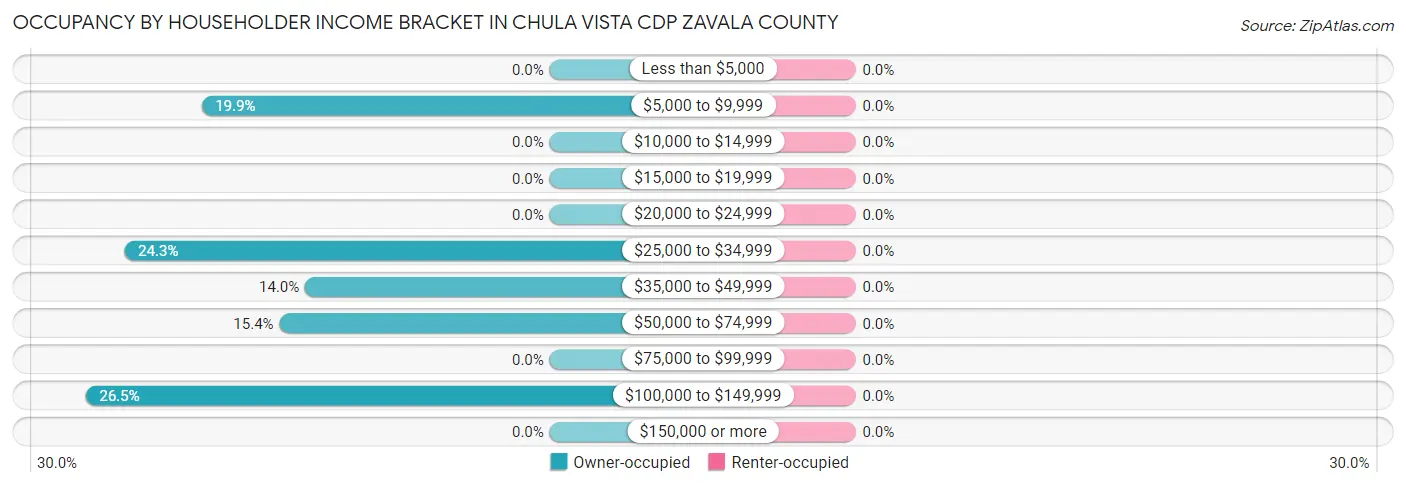
| Income Bracket | Owner-occupied | Renter-occupied |
| Less than $5,000 | 0 (0.0%) | 0 (0.0%) |
| $5,000 to $9,999 | 27 (19.9%) | 0 (0.0%) |
| $10,000 to $14,999 | 0 (0.0%) | 0 (0.0%) |
| $15,000 to $19,999 | 0 (0.0%) | 0 (0.0%) |
| $20,000 to $24,999 | 0 (0.0%) | 0 (0.0%) |
| $25,000 to $34,999 | 33 (24.3%) | 0 (0.0%) |
| $35,000 to $49,999 | 19 (14.0%) | 0 (0.0%) |
| $50,000 to $74,999 | 21 (15.4%) | 0 (0.0%) |
| $75,000 to $99,999 | 0 (0.0%) | 0 (0.0%) |
| $100,000 to $149,999 | 36 (26.5%) | 0 (0.0%) |
| $150,000 or more | 0 (0.0%) | 0 (0.0%) |
| Total | 136 (100.0%) | 0 (0.0%) |
Monthly Housing Cost Tiers in Chula Vista CDP Zavala County
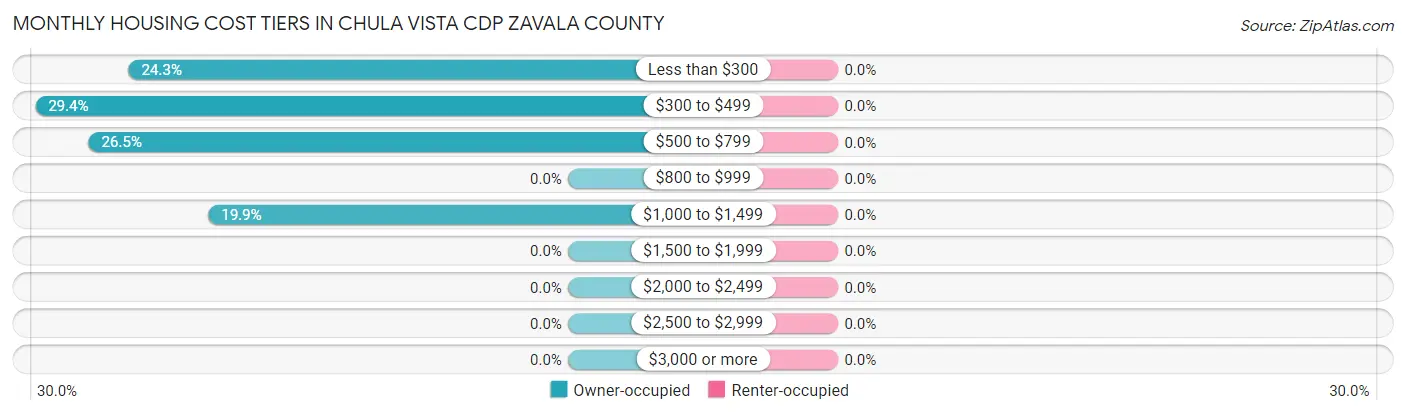
| Monthly Cost | Owner-occupied | Renter-occupied |
| Less than $300 | 33 (24.3%) | 0 (0.0%) |
| $300 to $499 | 40 (29.4%) | 0 (0.0%) |
| $500 to $799 | 36 (26.5%) | 0 (0.0%) |
| $800 to $999 | 0 (0.0%) | 0 (0.0%) |
| $1,000 to $1,499 | 27 (19.9%) | 0 (0.0%) |
| $1,500 to $1,999 | 0 (0.0%) | 0 (0.0%) |
| $2,000 to $2,499 | 0 (0.0%) | 0 (0.0%) |
| $2,500 to $2,999 | 0 (0.0%) | 0 (0.0%) |
| $3,000 or more | 0 (0.0%) | 0 (0.0%) |
| Total | 136 (100.0%) | 0 (0.0%) |
Physical Housing Characteristics in Chula Vista CDP Zavala County
Housing Structures in Chula Vista CDP Zavala County
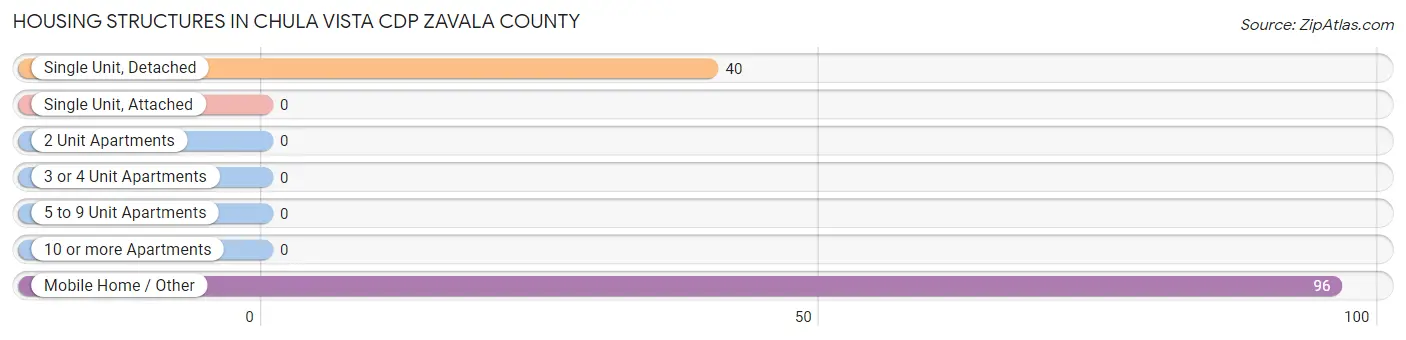
| Structure Type | # Housing Units | % Housing Units |
| Single Unit, Detached | 40 | 29.4% |
| Single Unit, Attached | 0 | 0.0% |
| 2 Unit Apartments | 0 | 0.0% |
| 3 or 4 Unit Apartments | 0 | 0.0% |
| 5 to 9 Unit Apartments | 0 | 0.0% |
| 10 or more Apartments | 0 | 0.0% |
| Mobile Home / Other | 96 | 70.6% |
| Total | 136 | 100.0% |
Housing Structures by Occupancy in Chula Vista CDP Zavala County
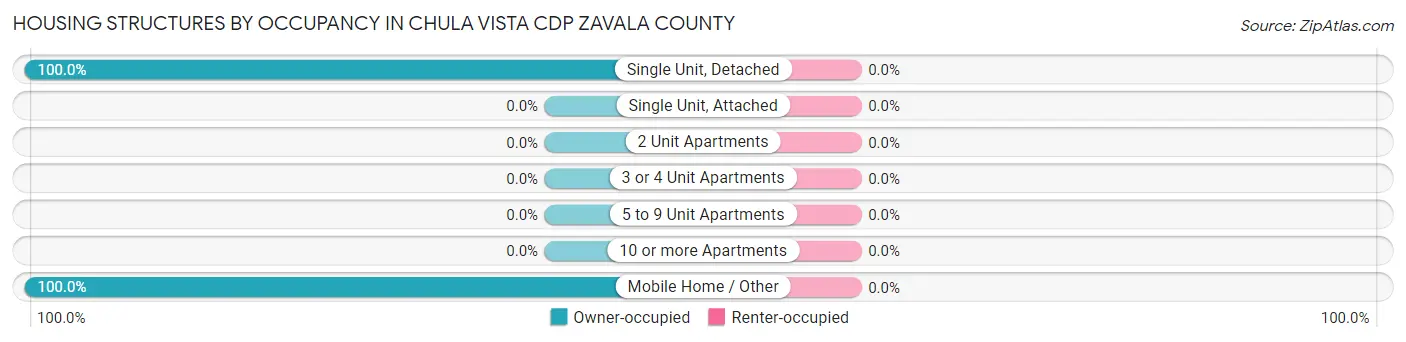
| Structure Type | Owner-occupied | Renter-occupied |
| Single Unit, Detached | 40 (100.0%) | 0 (0.0%) |
| Single Unit, Attached | 0 (0.0%) | 0 (0.0%) |
| 2 Unit Apartments | 0 (0.0%) | 0 (0.0%) |
| 3 or 4 Unit Apartments | 0 (0.0%) | 0 (0.0%) |
| 5 to 9 Unit Apartments | 0 (0.0%) | 0 (0.0%) |
| 10 or more Apartments | 0 (0.0%) | 0 (0.0%) |
| Mobile Home / Other | 96 (100.0%) | 0 (0.0%) |
| Total | 136 (100.0%) | 0 (0.0%) |
Housing Structures by Number of Rooms in Chula Vista CDP Zavala County
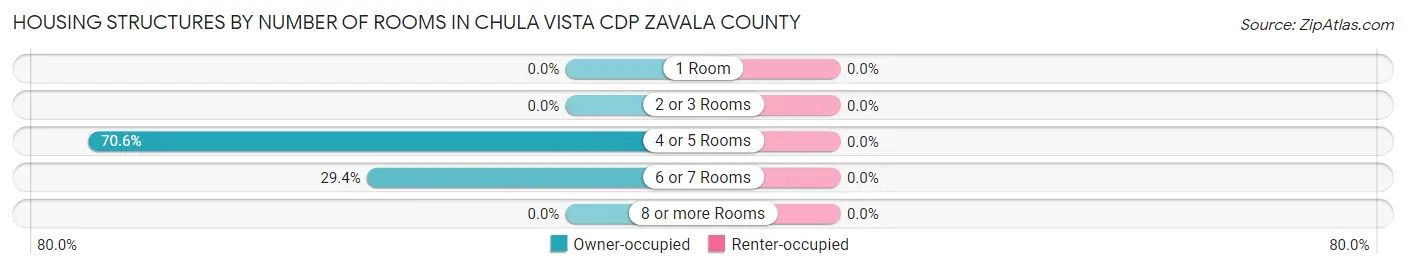
| Number of Rooms | Owner-occupied | Renter-occupied |
| 1 Room | 0 (0.0%) | 0 (0.0%) |
| 2 or 3 Rooms | 0 (0.0%) | 0 (0.0%) |
| 4 or 5 Rooms | 96 (70.6%) | 0 (0.0%) |
| 6 or 7 Rooms | 40 (29.4%) | 0 (0.0%) |
| 8 or more Rooms | 0 (0.0%) | 0 (0.0%) |
| Total | 136 (100.0%) | 0 (0.0%) |
Housing Structure by Heating Type in Chula Vista CDP Zavala County
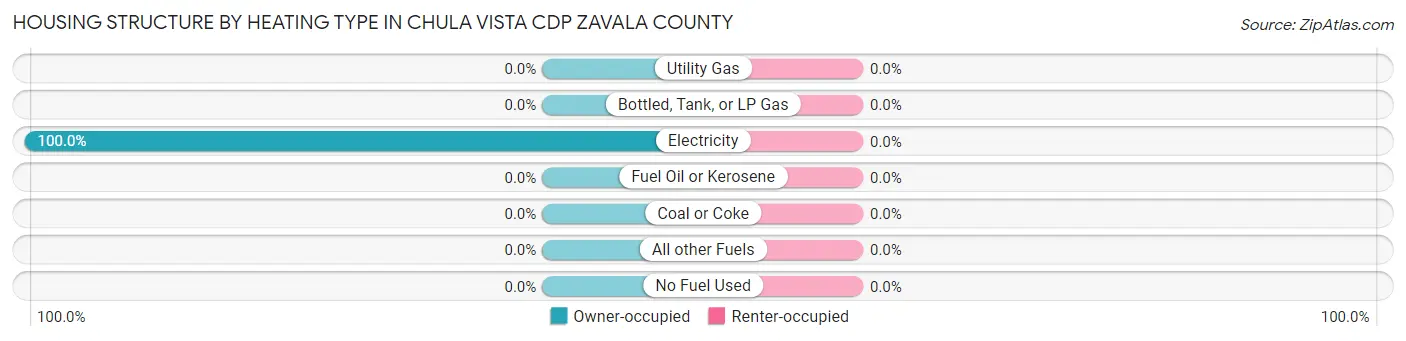
| Heating Type | Owner-occupied | Renter-occupied |
| Utility Gas | 0 (0.0%) | 0 (0.0%) |
| Bottled, Tank, or LP Gas | 0 (0.0%) | 0 (0.0%) |
| Electricity | 136 (100.0%) | 0 (0.0%) |
| Fuel Oil or Kerosene | 0 (0.0%) | 0 (0.0%) |
| Coal or Coke | 0 (0.0%) | 0 (0.0%) |
| All other Fuels | 0 (0.0%) | 0 (0.0%) |
| No Fuel Used | 0 (0.0%) | 0 (0.0%) |
| Total | 136 (100.0%) | 0 (0.0%) |
Household Vehicle Usage in Chula Vista CDP Zavala County
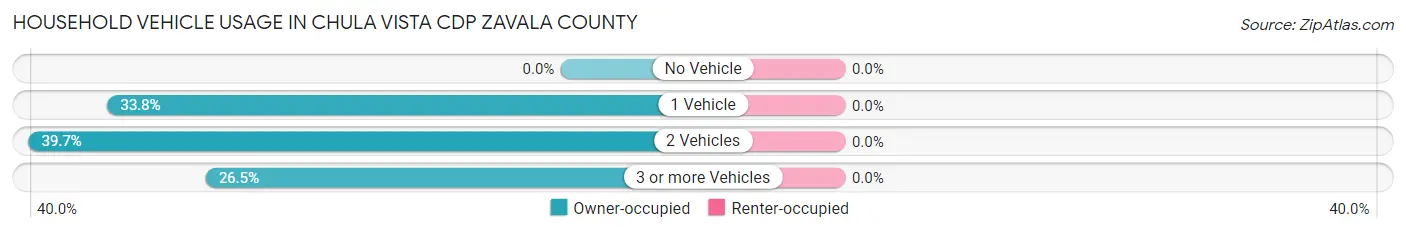
| Vehicles per Household | Owner-occupied | Renter-occupied |
| No Vehicle | 0 (0.0%) | 0 (0.0%) |
| 1 Vehicle | 46 (33.8%) | 0 (0.0%) |
| 2 Vehicles | 54 (39.7%) | 0 (0.0%) |
| 3 or more Vehicles | 36 (26.5%) | 0 (0.0%) |
| Total | 136 (100.0%) | 0 (0.0%) |
Real Estate & Mortgages in Chula Vista CDP Zavala County
Real Estate and Mortgage Overview in Chula Vista CDP Zavala County
| Characteristic | Without Mortgage | With Mortgage |
| Housing Units | 109 | 27 |
| Median Property Value | $77,500 | $0 |
| Median Household Income | - | - |
| Monthly Housing Costs | $454 | $0 |
| Real Estate Taxes | $508 | $0 |
Property Value by Mortgage Status in Chula Vista CDP Zavala County
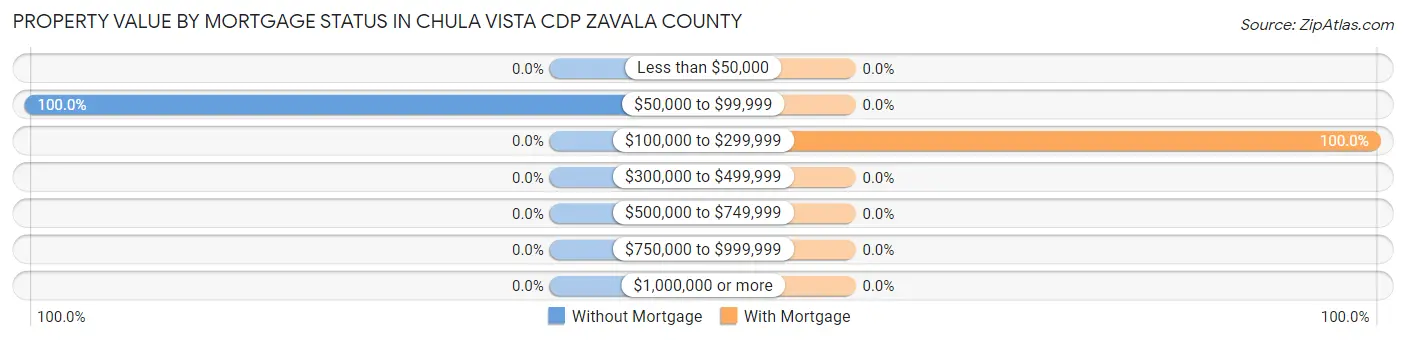
| Property Value | Without Mortgage | With Mortgage |
| Less than $50,000 | 0 (0.0%) | 0 (0.0%) |
| $50,000 to $99,999 | 109 (100.0%) | 0 (0.0%) |
| $100,000 to $299,999 | 0 (0.0%) | 27 (100.0%) |
| $300,000 to $499,999 | 0 (0.0%) | 0 (0.0%) |
| $500,000 to $749,999 | 0 (0.0%) | 0 (0.0%) |
| $750,000 to $999,999 | 0 (0.0%) | 0 (0.0%) |
| $1,000,000 or more | 0 (0.0%) | 0 (0.0%) |
| Total | 109 (100.0%) | 27 (100.0%) |
Household Income by Mortgage Status in Chula Vista CDP Zavala County
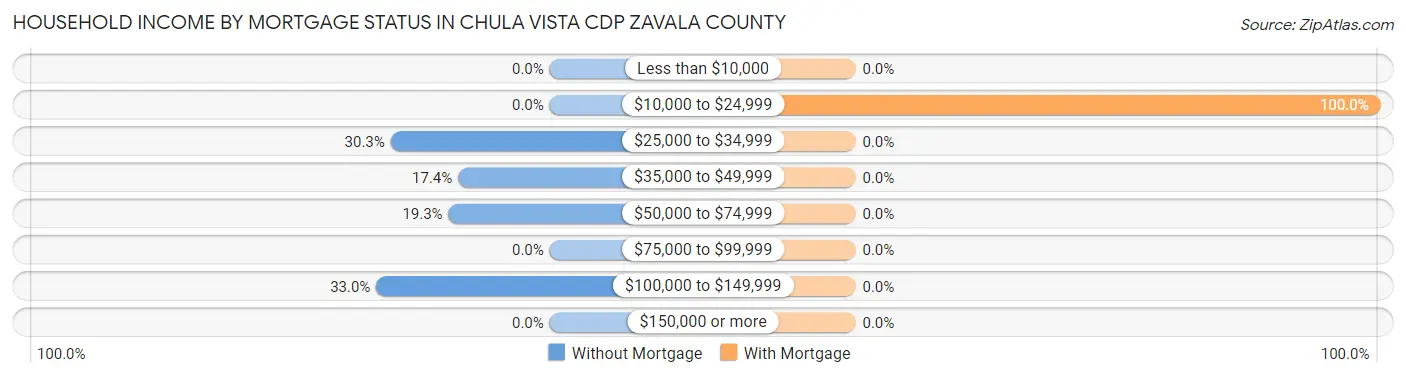
| Household Income | Without Mortgage | With Mortgage |
| Less than $10,000 | 0 (0.0%) | 0 (0.0%) |
| $10,000 to $24,999 | 0 (0.0%) | 27 (100.0%) |
| $25,000 to $34,999 | 33 (30.3%) | 0 (0.0%) |
| $35,000 to $49,999 | 19 (17.4%) | 0 (0.0%) |
| $50,000 to $74,999 | 21 (19.3%) | 0 (0.0%) |
| $75,000 to $99,999 | 0 (0.0%) | 0 (0.0%) |
| $100,000 to $149,999 | 36 (33.0%) | 0 (0.0%) |
| $150,000 or more | 0 (0.0%) | 0 (0.0%) |
| Total | 109 (100.0%) | 27 (100.0%) |
Property Value to Household Income Ratio in Chula Vista CDP Zavala County
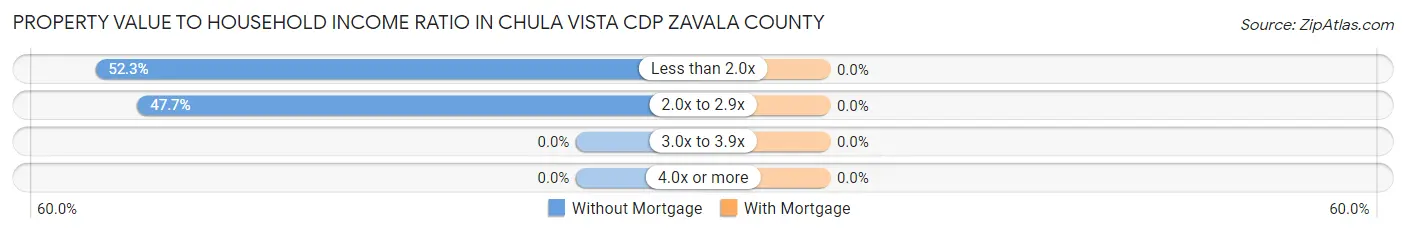
| Value-to-Income Ratio | Without Mortgage | With Mortgage |
| Less than 2.0x | 57 (52.3%) | 0 (0.0%) |
| 2.0x to 2.9x | 52 (47.7%) | 0 (0.0%) |
| 3.0x to 3.9x | 0 (0.0%) | 0 (0.0%) |
| 4.0x or more | 0 (0.0%) | 0 (0.0%) |
| Total | 109 (100.0%) | 27 (100.0%) |
Real Estate Taxes by Mortgage Status in Chula Vista CDP Zavala County
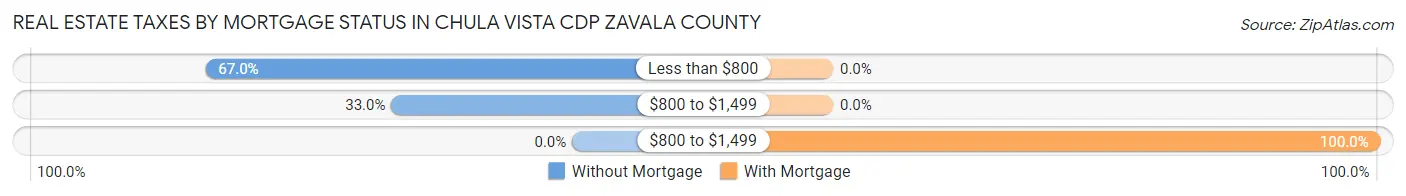
| Property Taxes | Without Mortgage | With Mortgage |
| Less than $800 | 73 (67.0%) | 0 (0.0%) |
| $800 to $1,499 | 36 (33.0%) | 0 (0.0%) |
| $800 to $1,499 | 0 (0.0%) | 27 (100.0%) |
| Total | 109 (100.0%) | 27 (100.0%) |
Health & Disability in Chula Vista CDP Zavala County
Health Insurance Coverage by Age in Chula Vista CDP Zavala County
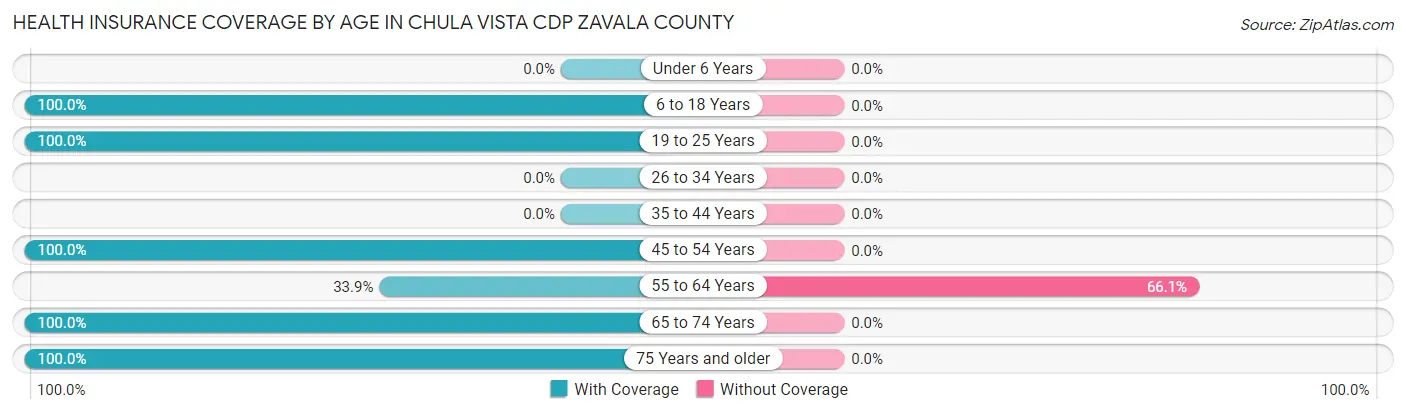
| Age Bracket | With Coverage | Without Coverage |
| Under 6 Years | 0 (0.0%) | 0 (0.0%) |
| 6 to 18 Years | 164 (100.0%) | 0 (0.0%) |
| 19 to 25 Years | 40 (100.0%) | 0 (0.0%) |
| 26 to 34 Years | 0 (0.0%) | 0 (0.0%) |
| 35 to 44 Years | 0 (0.0%) | 0 (0.0%) |
| 45 to 54 Years | 36 (100.0%) | 0 (0.0%) |
| 55 to 64 Years | 21 (33.9%) | 41 (66.1%) |
| 65 to 74 Years | 46 (100.0%) | 0 (0.0%) |
| 75 Years and older | 68 (100.0%) | 0 (0.0%) |
| Total | 375 (90.1%) | 41 (9.9%) |
Health Insurance Coverage by Citizenship Status in Chula Vista CDP Zavala County

| Citizenship Status | With Coverage | Without Coverage |
| Native Born | 0 (0.0%) | 0 (0.0%) |
| Foreign Born, Citizen | 164 (100.0%) | 0 (0.0%) |
| Foreign Born, not a Citizen | 40 (100.0%) | 0 (0.0%) |
Health Insurance Coverage by Household Income in Chula Vista CDP Zavala County
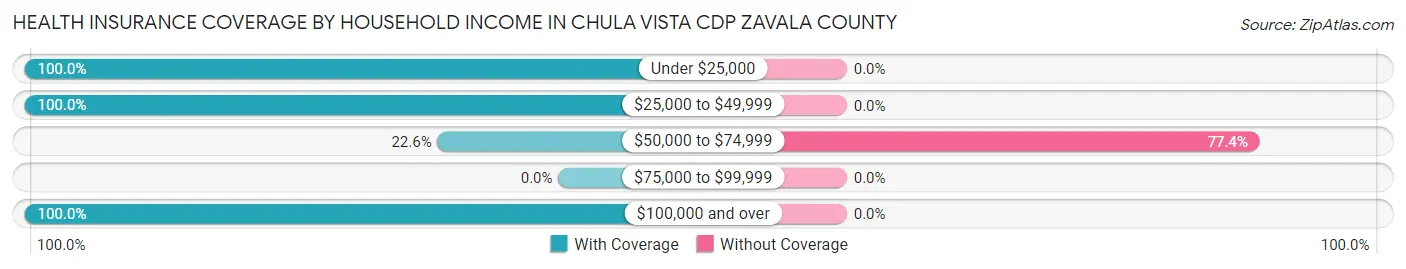
| Household Income | With Coverage | Without Coverage |
| Under $25,000 | 27 (100.0%) | 0 (0.0%) |
| $25,000 to $49,999 | 205 (100.0%) | 0 (0.0%) |
| $50,000 to $74,999 | 12 (22.6%) | 41 (77.4%) |
| $75,000 to $99,999 | 0 (0.0%) | 0 (0.0%) |
| $100,000 and over | 131 (100.0%) | 0 (0.0%) |
Public vs Private Health Insurance Coverage by Age in Chula Vista CDP Zavala County
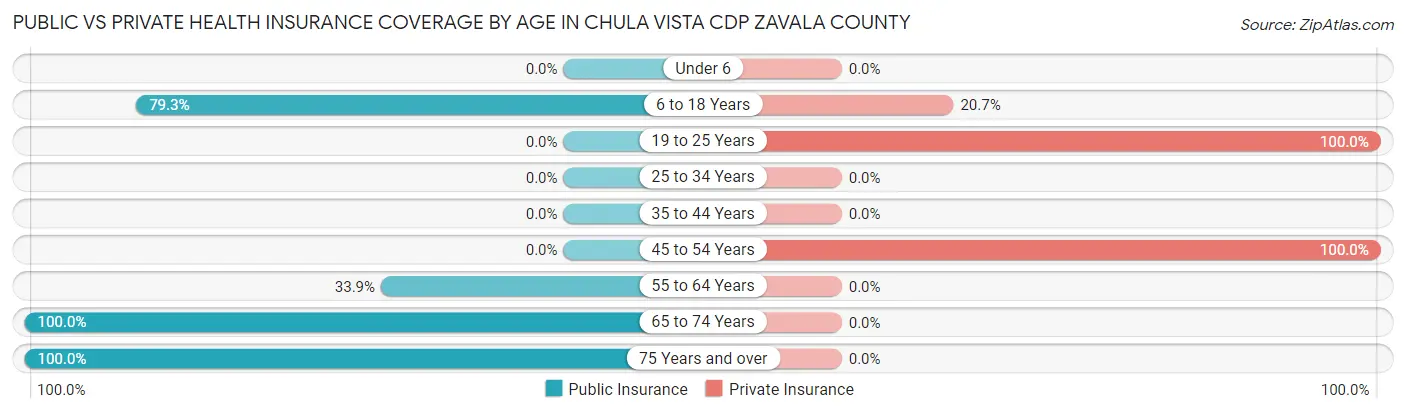
| Age Bracket | Public Insurance | Private Insurance |
| Under 6 | 0 (0.0%) | 0 (0.0%) |
| 6 to 18 Years | 130 (79.3%) | 34 (20.7%) |
| 19 to 25 Years | 0 (0.0%) | 40 (100.0%) |
| 25 to 34 Years | 0 (0.0%) | 0 (0.0%) |
| 35 to 44 Years | 0 (0.0%) | 0 (0.0%) |
| 45 to 54 Years | 0 (0.0%) | 36 (100.0%) |
| 55 to 64 Years | 21 (33.9%) | 0 (0.0%) |
| 65 to 74 Years | 46 (100.0%) | 0 (0.0%) |
| 75 Years and over | 68 (100.0%) | 0 (0.0%) |
| Total | 265 (63.7%) | 110 (26.4%) |
Disability Status by Sex by Age in Chula Vista CDP Zavala County
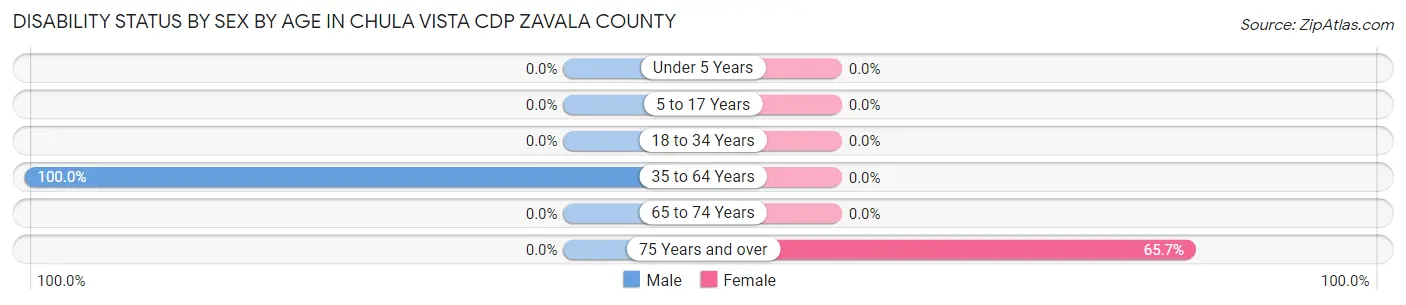
| Age Bracket | Male | Female |
| Under 5 Years | 0 (0.0%) | 0 (0.0%) |
| 5 to 17 Years | 0 (0.0%) | 0 (0.0%) |
| 18 to 34 Years | 0 (0.0%) | 0 (0.0%) |
| 35 to 64 Years | 41 (100.0%) | 0 (0.0%) |
| 65 to 74 Years | 0 (0.0%) | 0 (0.0%) |
| 75 Years and over | 0 (0.0%) | 23 (65.7%) |
Disability Class by Sex by Age in Chula Vista CDP Zavala County
Disability Class: Hearing Difficulty
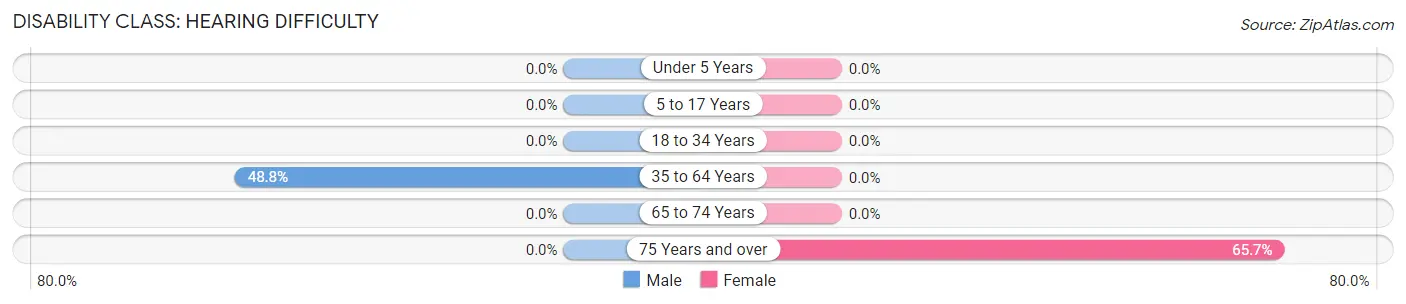
| Age Bracket | Male | Female |
| Under 5 Years | 0 (0.0%) | 0 (0.0%) |
| 5 to 17 Years | 0 (0.0%) | 0 (0.0%) |
| 18 to 34 Years | 0 (0.0%) | 0 (0.0%) |
| 35 to 64 Years | 20 (48.8%) | 0 (0.0%) |
| 65 to 74 Years | 0 (0.0%) | 0 (0.0%) |
| 75 Years and over | 0 (0.0%) | 23 (65.7%) |
Disability Class: Vision Difficulty
| Age Bracket | Male | Female |
| Under 5 Years | 0 (0.0%) | 0 (0.0%) |
| 5 to 17 Years | 0 (0.0%) | 0 (0.0%) |
| 18 to 34 Years | 0 (0.0%) | 0 (0.0%) |
| 35 to 64 Years | 0 (0.0%) | 0 (0.0%) |
| 65 to 74 Years | 0 (0.0%) | 0 (0.0%) |
| 75 Years and over | 0 (0.0%) | 0 (0.0%) |
Disability Class: Cognitive Difficulty
| Age Bracket | Male | Female |
| 5 to 17 Years | 0 (0.0%) | 0 (0.0%) |
| 18 to 34 Years | 0 (0.0%) | 0 (0.0%) |
| 35 to 64 Years | 0 (0.0%) | 0 (0.0%) |
| 65 to 74 Years | 0 (0.0%) | 0 (0.0%) |
| 75 Years and over | 0 (0.0%) | 0 (0.0%) |
Disability Class: Ambulatory Difficulty
| Age Bracket | Male | Female |
| 5 to 17 Years | 0 (0.0%) | 0 (0.0%) |
| 18 to 34 Years | 0 (0.0%) | 0 (0.0%) |
| 35 to 64 Years | 0 (0.0%) | 0 (0.0%) |
| 65 to 74 Years | 0 (0.0%) | 0 (0.0%) |
| 75 Years and over | 0 (0.0%) | 0 (0.0%) |
Disability Class: Self-Care Difficulty
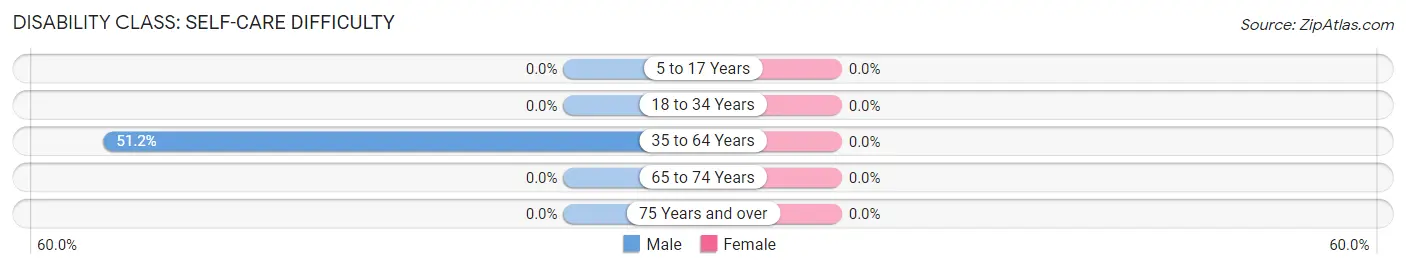
| Age Bracket | Male | Female |
| 5 to 17 Years | 0 (0.0%) | 0 (0.0%) |
| 18 to 34 Years | 0 (0.0%) | 0 (0.0%) |
| 35 to 64 Years | 21 (51.2%) | 0 (0.0%) |
| 65 to 74 Years | 0 (0.0%) | 0 (0.0%) |
| 75 Years and over | 0 (0.0%) | 0 (0.0%) |
Technology Access in Chula Vista CDP Zavala County
Computing Device Access in Chula Vista CDP Zavala County
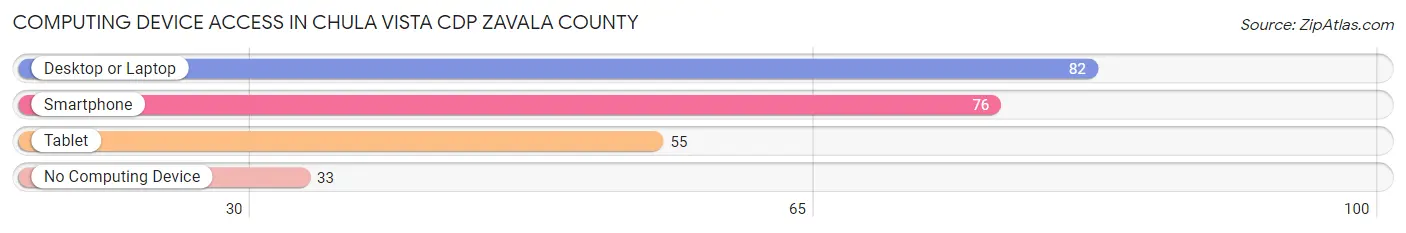
| Device Type | # Households | % Households |
| Desktop or Laptop | 82 | 60.3% |
| Smartphone | 76 | 55.9% |
| Tablet | 55 | 40.4% |
| No Computing Device | 33 | 24.3% |
| Total | 136 | 100.0% |
Internet Access in Chula Vista CDP Zavala County
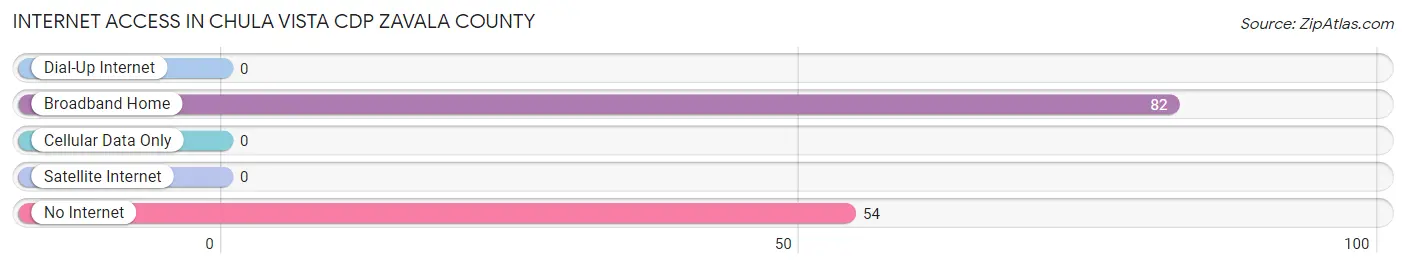
| Internet Type | # Households | % Households |
| Dial-Up Internet | 0 | 0.0% |
| Broadband Home | 82 | 60.3% |
| Cellular Data Only | 0 | 0.0% |
| Satellite Internet | 0 | 0.0% |
| No Internet | 54 | 39.7% |
| Total | 136 | 100.0% |
Chula Vista CDP Zavala County Summary
Chula Vista Cdp is a census-designated place (CDP) located in Zavala County, Texas. It is situated in the southern part of the state, about 25 miles south of the city of San Antonio. The population of Chula Vista Cdp was 1,845 at the 2010 census.
Geography
Chula Vista Cdp is located at 28°45'25" North, 99°45'25" West (28.756944, -99.756944). It has an area of 1.3 square miles, all of which is land.
Demographics
As of the 2010 census, there were 1,845 people, 645 households, and 486 families residing in Chula Vista Cdp. The population density was 1,420.8 people per square mile. The racial makeup of the CDP was 79.2% White, 0.2% African American, 0.2% Native American, 0.2% Asian, 0.1% Pacific Islander, 18.7% from other races, and 1.2% from two or more races. Hispanic or Latino of any race were 97.2% of the population.
There were 645 households, out of which 37.2% had children under the age of 18 living with them, 54.3% were married couples living together, 14.2% had a female householder with no husband present, and 24.2% were non-families. 20.2% of all households were made up of individuals, and 8.2% had someone living alone who was 65 years of age or older. The average household size was 2.86 and the average family size was 3.33.
In Chula Vista Cdp, the population was spread out, with 28.7% under the age of 18, 8.7% from 18 to 24, 27.2% from 25 to 44, 22.7% from 45 to 64, and 12.7% who were 65 years of age or older. The median age was 34 years. For every 100 females, there were 95.2 males. For every 100 females age 18 and over, there were 91.2 males.
The median income for a household in Chula Vista Cdp was $25,938, and the median income for a family was $27,917. Males had a median income of $22,500 versus $17,500 for females. The per capita income for the CDP was $10,845. About 24.2% of families and 28.2% of the population were below the poverty line, including 37.2% of those under age 18 and 16.7% of those age 65 or over.
Economy
The economy of Chula Vista Cdp is largely based on agriculture. The main crops grown in the area are cotton, corn, sorghum, and wheat. The area also has a large number of cattle ranches. In addition, there are several small businesses in the area, including a few restaurants, convenience stores, and auto repair shops.
The unemployment rate in Chula Vista Cdp was 8.2% in 2019, slightly higher than the national average of 3.7%. The median household income was $25,938 in 2019, lower than the national median of $68,703.
Conclusion
Chula Vista Cdp is a small census-designated place located in Zavala County, Texas. It has a population of 1,845 people and an area of 1.3 square miles. The economy of Chula Vista Cdp is largely based on agriculture, with the main crops being cotton, corn, sorghum, and wheat. There are also several small businesses in the area. The unemployment rate in Chula Vista Cdp was 8.2% in 2019, and the median household income was $25,938.
Common Questions
What is Per Capita Income in Chula Vista CDP Zavala County?
Per Capita income in Chula Vista CDP Zavala County is $15,562.
What is Inequality or Gini Index in Chula Vista CDP Zavala County?
Inequality or Gini Index in Chula Vista CDP Zavala County is 0.42.
What is the Total Population of Chula Vista CDP Zavala County?
Total Population of Chula Vista CDP Zavala County is 416.
What is the Total Male Population of Chula Vista CDP Zavala County?
Total Male Population of Chula Vista CDP Zavala County is 188.
What is the Total Female Population of Chula Vista CDP Zavala County?
Total Female Population of Chula Vista CDP Zavala County is 228.
What is the Ratio of Males per 100 Females in Chula Vista CDP Zavala County?
There are 82.46 Males per 100 Females in Chula Vista CDP Zavala County.
What is the Ratio of Females per 100 Males in Chula Vista CDP Zavala County?
There are 121.28 Females per 100 Males in Chula Vista CDP Zavala County.
What is the Median Population Age in Chula Vista CDP Zavala County?
Median Population Age in Chula Vista CDP Zavala County is 47.1 Years.
What is the Average Family Size in Chula Vista CDP Zavala County
Average Family Size in Chula Vista CDP Zavala County is 3.6 People.
What is the Average Household Size in Chula Vista CDP Zavala County
Average Household Size in Chula Vista CDP Zavala County is 3.1 People.
How Large is the Labor Force in Chula Vista CDP Zavala County?
There are 84 People in the Labor Forcein in Chula Vista CDP Zavala County.
What is the Percentage of People in the Labor Force in Chula Vista CDP Zavala County?
28.1% of People are in the Labor Force in Chula Vista CDP Zavala County.
What is the Unemployment Rate in Chula Vista CDP Zavala County?
Unemployment Rate in Chula Vista CDP Zavala County is 32.1%.