Redings Mill, MO Map & Demographics
Redings Mill Map
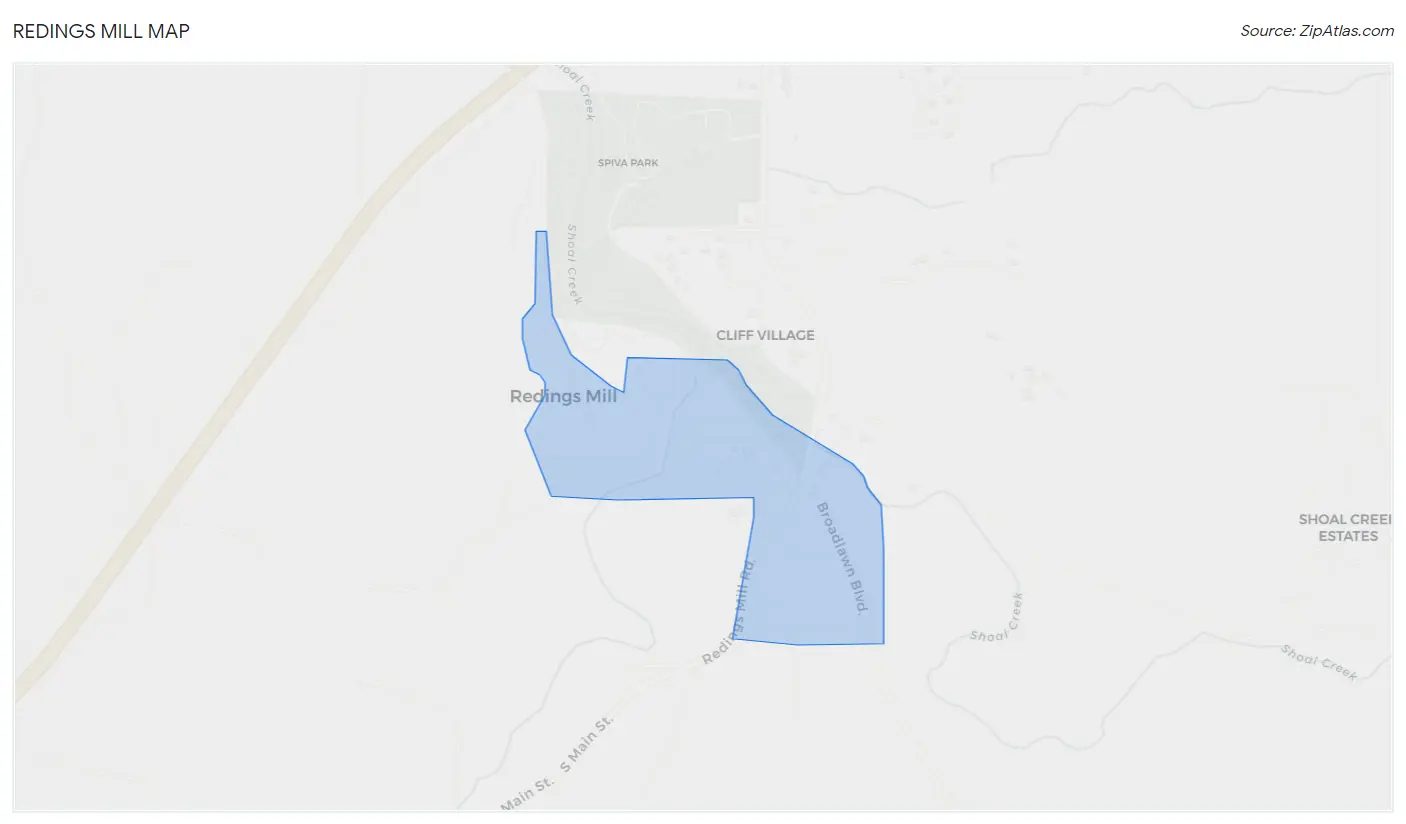
Redings Mill Overview
$40,148
PER CAPITA INCOME
$82,625
AVG FAMILY INCOME
$65,625
AVG HOUSEHOLD INCOME
0.50
INEQUALITY / GINI INDEX
95
TOTAL POPULATION
50
MALE POPULATION
45
FEMALE POPULATION
111.11
MALES / 100 FEMALES
90.00
FEMALES / 100 MALES
31.8
MEDIAN AGE
2.6
AVG FAMILY SIZE
2.2
AVG HOUSEHOLD SIZE
34
LABOR FORCE [ PEOPLE ]
45.9%
PERCENT IN LABOR FORCE
2.9%
UNEMPLOYMENT RATE
Income in Redings Mill
Income Overview in Redings Mill
Per Capita Income in Redings Mill is $40,148, while median incomes of families and households are $82,625 and $65,625 respectively.
| Characteristic | Number | Measure |
| Per Capita Income | 95 | $40,148 |
| Median Family Income | 31 | $82,625 |
| Mean Family Income | 31 | $117,639 |
| Median Household Income | 44 | $65,625 |
| Mean Household Income | 44 | $93,432 |
| Income Deficit | 31 | $0 |
| Wage / Income Gap (%) | 95 | 0.00% |
| Wage / Income Gap ($) | 95 | 100.00¢ per $1 |
| Gini / Inequality Index | 95 | 0.50 |
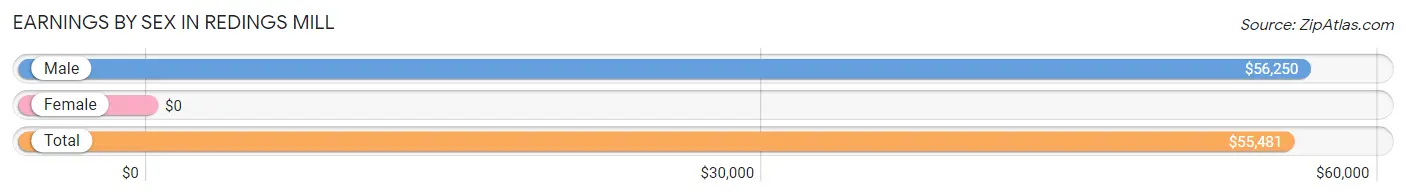
Earnings by Sex in Redings Mill
| Sex | Number | Average Earnings |
| Male | 17 (48.6%) | $56,250 |
| Female | 18 (51.4%) | $0 |
| Total | 35 (100.0%) | $55,481 |
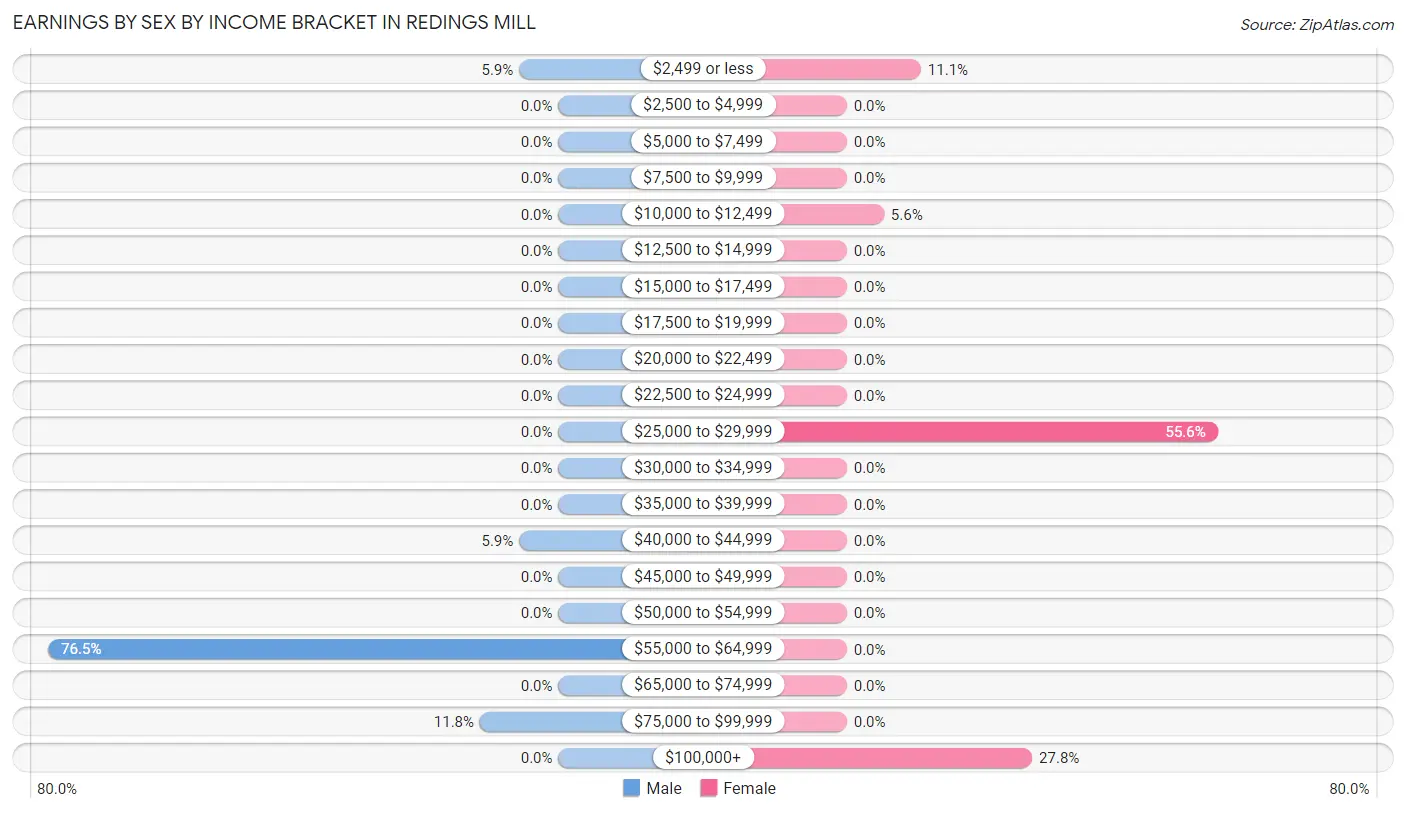
Earnings by Sex by Income Bracket in Redings Mill
The most common earnings brackets in Redings Mill are $55,000 to $64,999 for men (13 | 76.5%) and $25,000 to $29,999 for women (10 | 55.6%).
| Income | Male | Female |
| $2,499 or less | 1 (5.9%) | 2 (11.1%) |
| $2,500 to $4,999 | 0 (0.0%) | 0 (0.0%) |
| $5,000 to $7,499 | 0 (0.0%) | 0 (0.0%) |
| $7,500 to $9,999 | 0 (0.0%) | 0 (0.0%) |
| $10,000 to $12,499 | 0 (0.0%) | 1 (5.6%) |
| $12,500 to $14,999 | 0 (0.0%) | 0 (0.0%) |
| $15,000 to $17,499 | 0 (0.0%) | 0 (0.0%) |
| $17,500 to $19,999 | 0 (0.0%) | 0 (0.0%) |
| $20,000 to $22,499 | 0 (0.0%) | 0 (0.0%) |
| $22,500 to $24,999 | 0 (0.0%) | 0 (0.0%) |
| $25,000 to $29,999 | 0 (0.0%) | 10 (55.6%) |
| $30,000 to $34,999 | 0 (0.0%) | 0 (0.0%) |
| $35,000 to $39,999 | 0 (0.0%) | 0 (0.0%) |
| $40,000 to $44,999 | 1 (5.9%) | 0 (0.0%) |
| $45,000 to $49,999 | 0 (0.0%) | 0 (0.0%) |
| $50,000 to $54,999 | 0 (0.0%) | 0 (0.0%) |
| $55,000 to $64,999 | 13 (76.5%) | 0 (0.0%) |
| $65,000 to $74,999 | 0 (0.0%) | 0 (0.0%) |
| $75,000 to $99,999 | 2 (11.8%) | 0 (0.0%) |
| $100,000+ | 0 (0.0%) | 5 (27.8%) |
| Total | 17 (100.0%) | 18 (100.0%) |
Earnings by Sex by Educational Attainment in Redings Mill
| Educational Attainment | Male Income | Female Income |
| Less than High School | - | - |
| High School Diploma | - | - |
| College or Associate's Degree | - | - |
| Bachelor's Degree | - | - |
| Graduate Degree | - | - |
| Total | $56,346 | $0 |
Family Income in Redings Mill
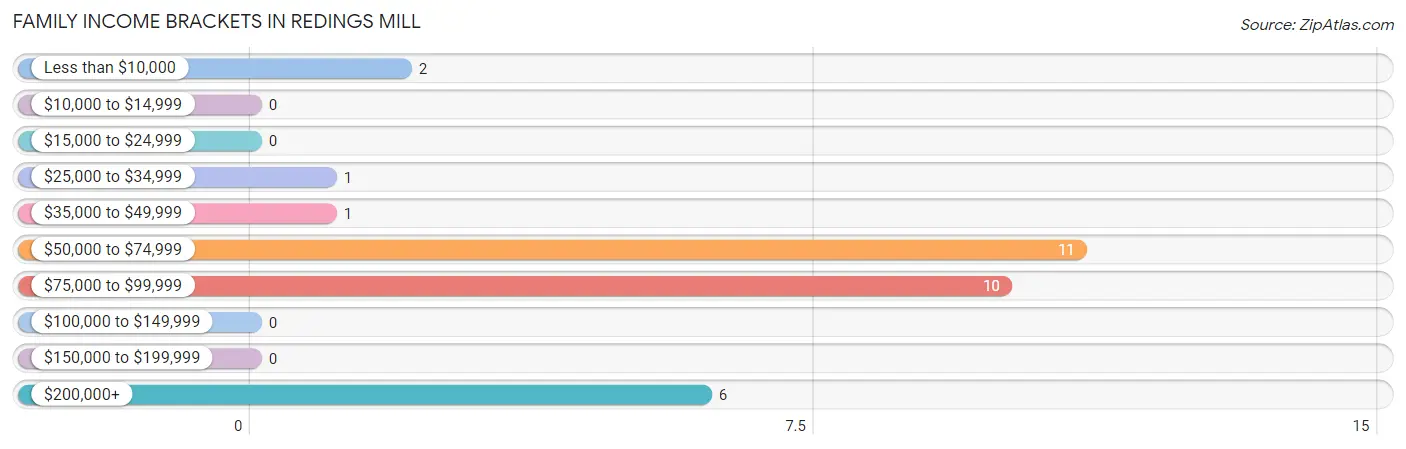
Family Income Brackets in Redings Mill
According to the Redings Mill family income data, there are 11 families falling into the $50,000 to $74,999 income range, which is the most common income bracket and makes up 35.5% of all families.
| Income Bracket | # Families | % Families |
| Less than $10,000 | 2 | 6.5% |
| $10,000 to $14,999 | 0 | 0.0% |
| $15,000 to $24,999 | 0 | 0.0% |
| $25,000 to $34,999 | 1 | 3.2% |
| $35,000 to $49,999 | 1 | 3.2% |
| $50,000 to $74,999 | 11 | 35.5% |
| $75,000 to $99,999 | 10 | 32.3% |
| $100,000 to $149,999 | 0 | 0.0% |
| $150,000 to $199,999 | 0 | 0.0% |
| $200,000+ | 6 | 19.4% |
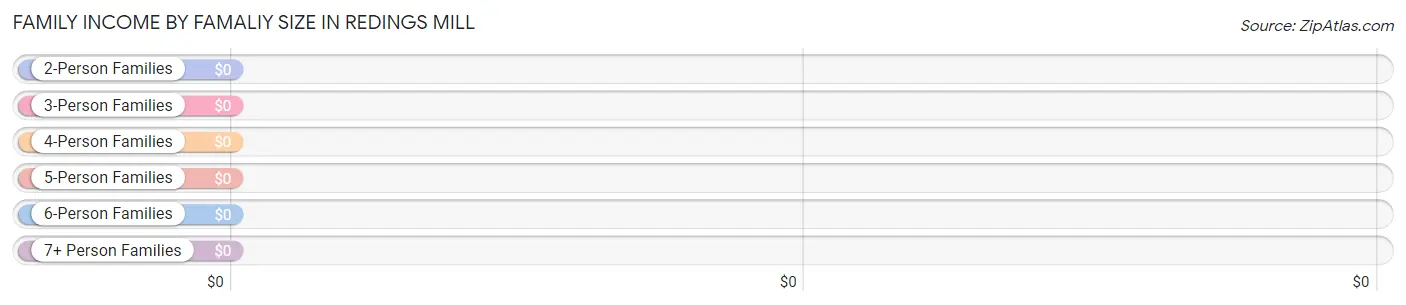
Family Income by Famaliy Size in Redings Mill
| Income Bracket | # Families | Median Income |
| 2-Person Families | 18 (58.1%) | $0 |
| 3-Person Families | 9 (29.0%) | $0 |
| 4-Person Families | 0 (0.0%) | $0 |
| 5-Person Families | 0 (0.0%) | $0 |
| 6-Person Families | 4 (12.9%) | $0 |
| 7+ Person Families | 0 (0.0%) | $0 |
| Total | 31 (100.0%) | $82,625 |
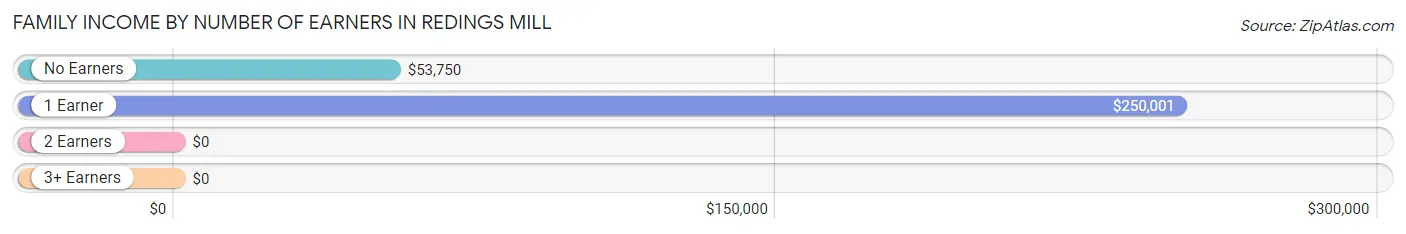
Family Income by Number of Earners in Redings Mill
| Number of Earners | # Families | Median Income |
| No Earners | 9 (29.0%) | $53,750 |
| 1 Earner | 11 (35.5%) | $250,001 |
| 2 Earners | 11 (35.5%) | $0 |
| 3+ Earners | 0 (0.0%) | $0 |
| Total | 31 (100.0%) | $82,625 |
Household Income in Redings Mill
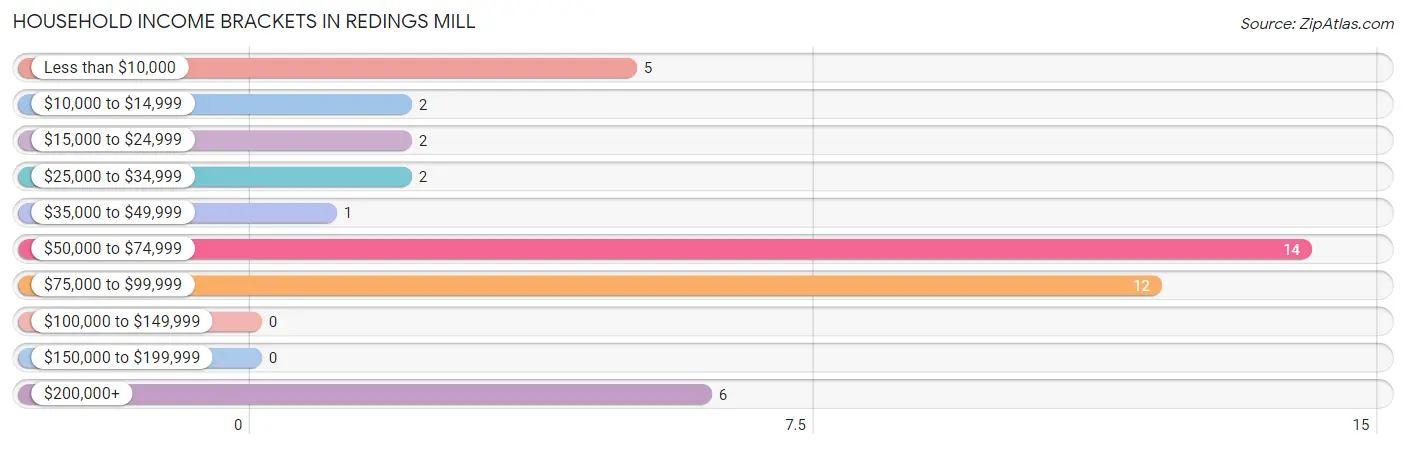
Household Income Brackets in Redings Mill
With 14 households falling in the category, the $50,000 to $74,999 income range is the most frequent in Redings Mill, accounting for 31.8% of all households.
| Income Bracket | # Households | % Households |
| Less than $10,000 | 5 | 11.4% |
| $10,000 to $14,999 | 2 | 4.5% |
| $15,000 to $24,999 | 2 | 4.5% |
| $25,000 to $34,999 | 2 | 4.5% |
| $35,000 to $49,999 | 1 | 2.3% |
| $50,000 to $74,999 | 14 | 31.8% |
| $75,000 to $99,999 | 12 | 27.3% |
| $100,000 to $149,999 | 0 | 0.0% |
| $150,000 to $199,999 | 0 | 0.0% |
| $200,000+ | 6 | 13.6% |
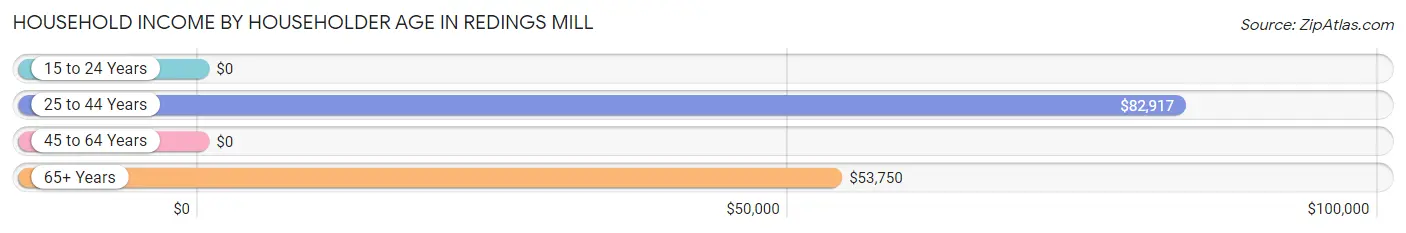
Household Income by Householder Age in Redings Mill
The median household income in Redings Mill is $65,625, with the highest median household income of $82,917 found in the 25 to 44 years age bracket for the primary householder. A total of 15 households (34.1%) fall into this category. Meanwhile, the 15 to 24 years age bracket for the primary householder has the lowest median household income of $0, with 1 households (2.3%) in this group.
| Income Bracket | # Households | Median Income |
| 15 to 24 Years | 1 (2.3%) | $0 |
| 25 to 44 Years | 15 (34.1%) | $82,917 |
| 45 to 64 Years | 13 (29.5%) | $0 |
| 65+ Years | 15 (34.1%) | $53,750 |
| Total | 44 (100.0%) | $65,625 |
Poverty in Redings Mill
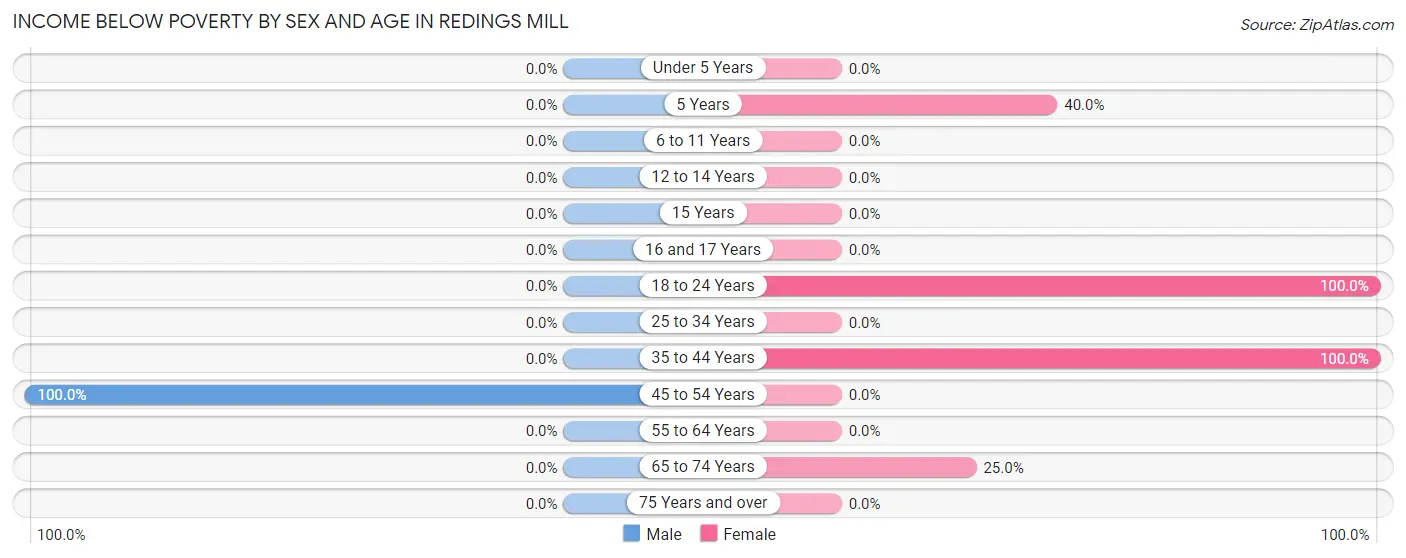
Income Below Poverty by Sex and Age in Redings Mill
With 4.0% poverty level for males and 13.3% for females among the residents of Redings Mill, 45 to 54 year old males and 18 to 24 year old females are the most vulnerable to poverty, with 2 males (100.0%) and 1 females (100.0%) in their respective age groups living below the poverty level.
| Age Bracket | Male | Female |
| Under 5 Years | 0 (0.0%) | 0 (0.0%) |
| 5 Years | 0 (0.0%) | 2 (40.0%) |
| 6 to 11 Years | 0 (0.0%) | 0 (0.0%) |
| 12 to 14 Years | 0 (0.0%) | 0 (0.0%) |
| 15 Years | 0 (0.0%) | 0 (0.0%) |
| 16 and 17 Years | 0 (0.0%) | 0 (0.0%) |
| 18 to 24 Years | 0 (0.0%) | 1 (100.0%) |
| 25 to 34 Years | 0 (0.0%) | 0 (0.0%) |
| 35 to 44 Years | 0 (0.0%) | 2 (100.0%) |
| 45 to 54 Years | 2 (100.0%) | 0 (0.0%) |
| 55 to 64 Years | 0 (0.0%) | 0 (0.0%) |
| 65 to 74 Years | 0 (0.0%) | 1 (25.0%) |
| 75 Years and over | 0 (0.0%) | 0 (0.0%) |
| Total | 2 (4.0%) | 6 (13.3%) |
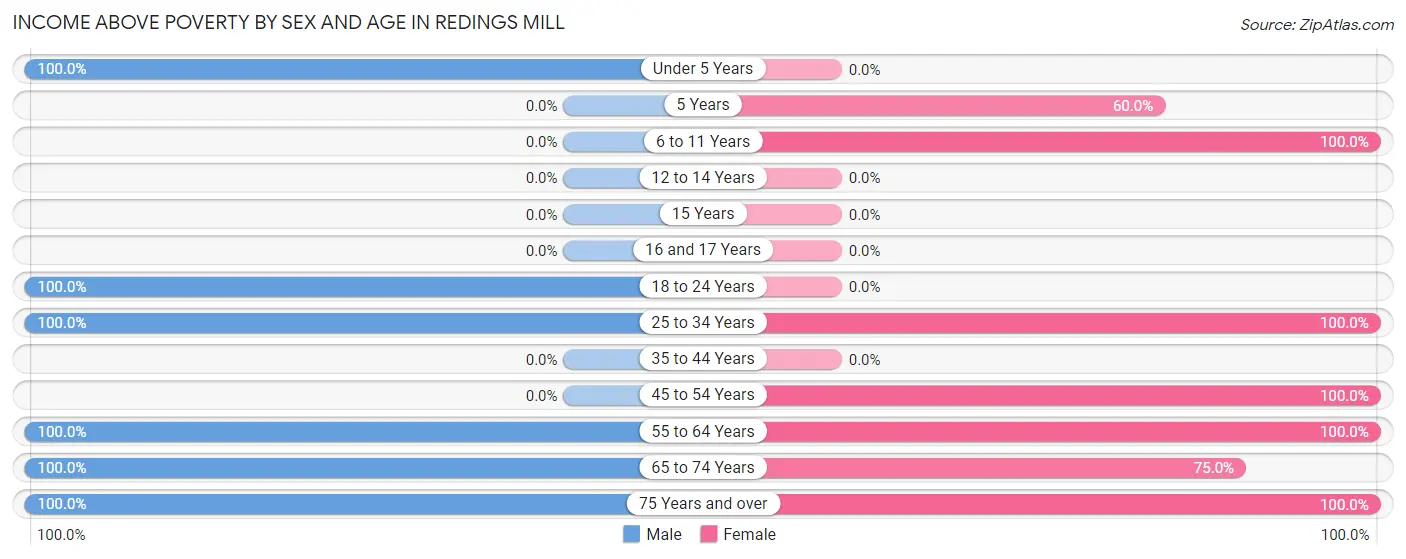
Income Above Poverty by Sex and Age in Redings Mill
According to the poverty statistics in Redings Mill, males aged under 5 years and females aged 6 to 11 years are the age groups that are most secure financially, with 100.0% of males and 100.0% of females in these age groups living above the poverty line.
| Age Bracket | Male | Female |
| Under 5 Years | 13 (100.0%) | 0 (0.0%) |
| 5 Years | 0 (0.0%) | 3 (60.0%) |
| 6 to 11 Years | 0 (0.0%) | 3 (100.0%) |
| 12 to 14 Years | 0 (0.0%) | 0 (0.0%) |
| 15 Years | 0 (0.0%) | 0 (0.0%) |
| 16 and 17 Years | 0 (0.0%) | 0 (0.0%) |
| 18 to 24 Years | 1 (100.0%) | 0 (0.0%) |
| 25 to 34 Years | 13 (100.0%) | 13 (100.0%) |
| 35 to 44 Years | 0 (0.0%) | 0 (0.0%) |
| 45 to 54 Years | 0 (0.0%) | 5 (100.0%) |
| 55 to 64 Years | 10 (100.0%) | 5 (100.0%) |
| 65 to 74 Years | 6 (100.0%) | 3 (75.0%) |
| 75 Years and over | 5 (100.0%) | 7 (100.0%) |
| Total | 48 (96.0%) | 39 (86.7%) |
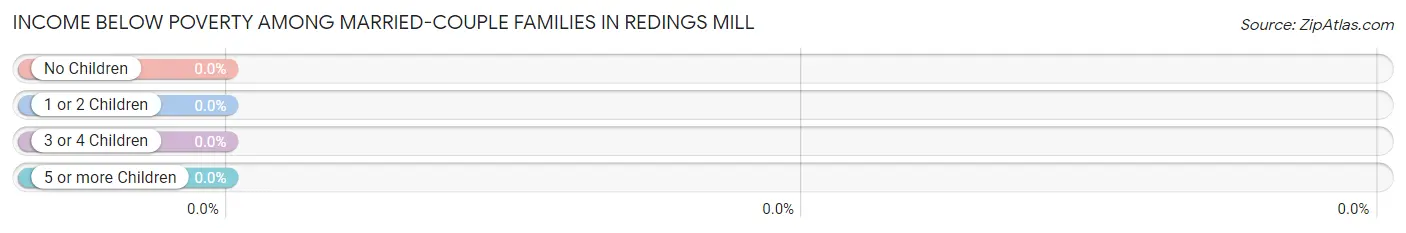
Income Below Poverty Among Married-Couple Families in Redings Mill
| Children | Above Poverty | Below Poverty |
| No Children | 15 (100.0%) | 0 (0.0%) |
| 1 or 2 Children | 9 (100.0%) | 0 (0.0%) |
| 3 or 4 Children | 4 (100.0%) | 0 (0.0%) |
| 5 or more Children | 0 (0.0%) | 0 (0.0%) |
| Total | 28 (100.0%) | 0 (0.0%) |
Income Below Poverty Among Single-Parent Households in Redings Mill
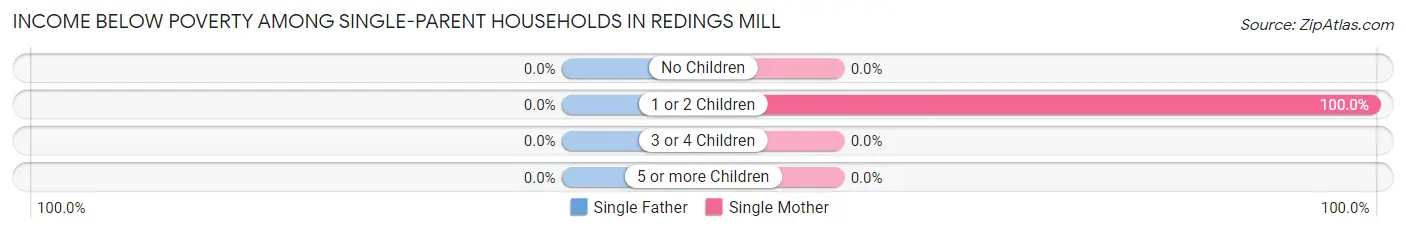
| Children | Single Father | Single Mother |
| No Children | 0 (0.0%) | 0 (0.0%) |
| 1 or 2 Children | 0 (0.0%) | 2 (100.0%) |
| 3 or 4 Children | 0 (0.0%) | 0 (0.0%) |
| 5 or more Children | 0 (0.0%) | 0 (0.0%) |
| Total | 0 (0.0%) | 2 (100.0%) |
Income Below Poverty Among Married-Couple vs Single-Parent Households in Redings Mill
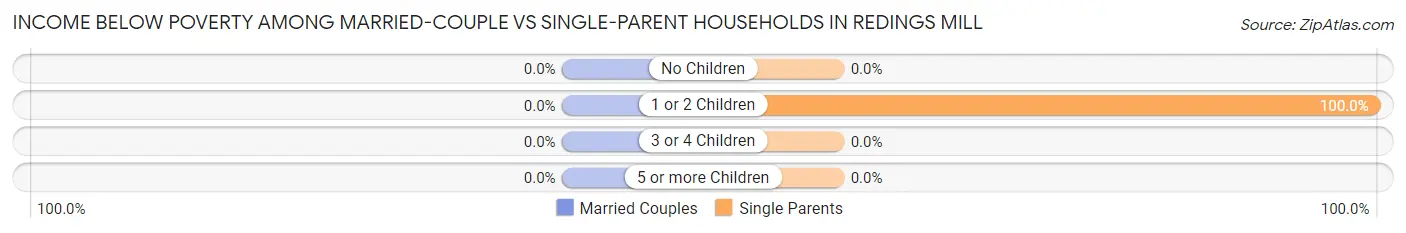
| Children | Married-Couple Families | Single-Parent Households |
| No Children | 0 (0.0%) | 0 (0.0%) |
| 1 or 2 Children | 0 (0.0%) | 2 (100.0%) |
| 3 or 4 Children | 0 (0.0%) | 0 (0.0%) |
| 5 or more Children | 0 (0.0%) | 0 (0.0%) |
| Total | 0 (0.0%) | 2 (66.7%) |
Race in Redings Mill
The most populous races in Redings Mill are White / Caucasian (92 | 96.8%), Black / African American (1 | 1.1%), and Native / Alaskan (1 | 1.1%).
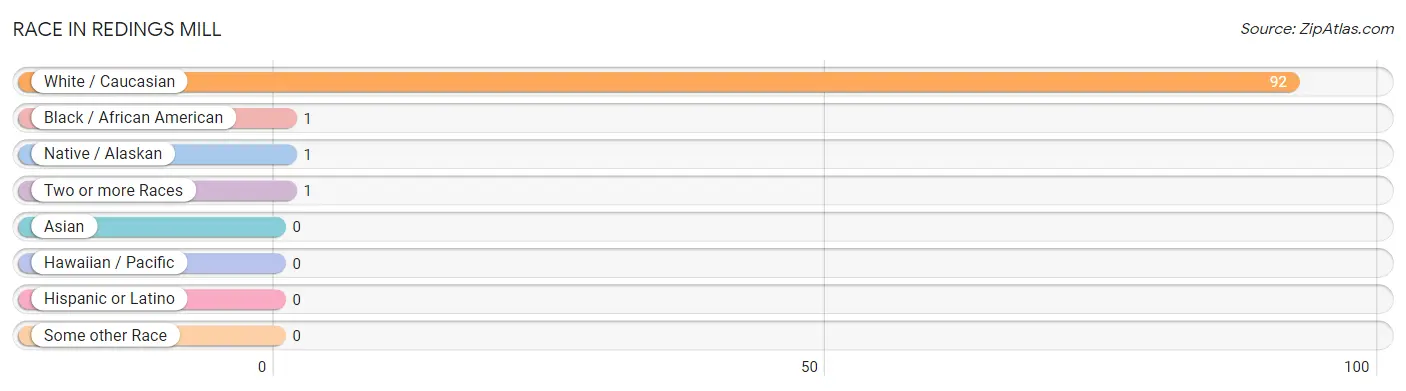
| Race | # Population | % Population |
| Asian | 0 | 0.0% |
| Black / African American | 1 | 1.1% |
| Hawaiian / Pacific | 0 | 0.0% |
| Hispanic or Latino | 0 | 0.0% |
| Native / Alaskan | 1 | 1.1% |
| White / Caucasian | 92 | 96.8% |
| Two or more Races | 1 | 1.1% |
| Some other Race | 0 | 0.0% |
| Total | 95 | 100.0% |
Ancestry in Redings Mill
The most populous ancestries reported in Redings Mill are Irish (12 | 12.6%), American (9 | 9.5%), Scottish (9 | 9.5%), English (5 | 5.3%), and German (4 | 4.2%), together accounting for 41.0% of all Redings Mill residents.
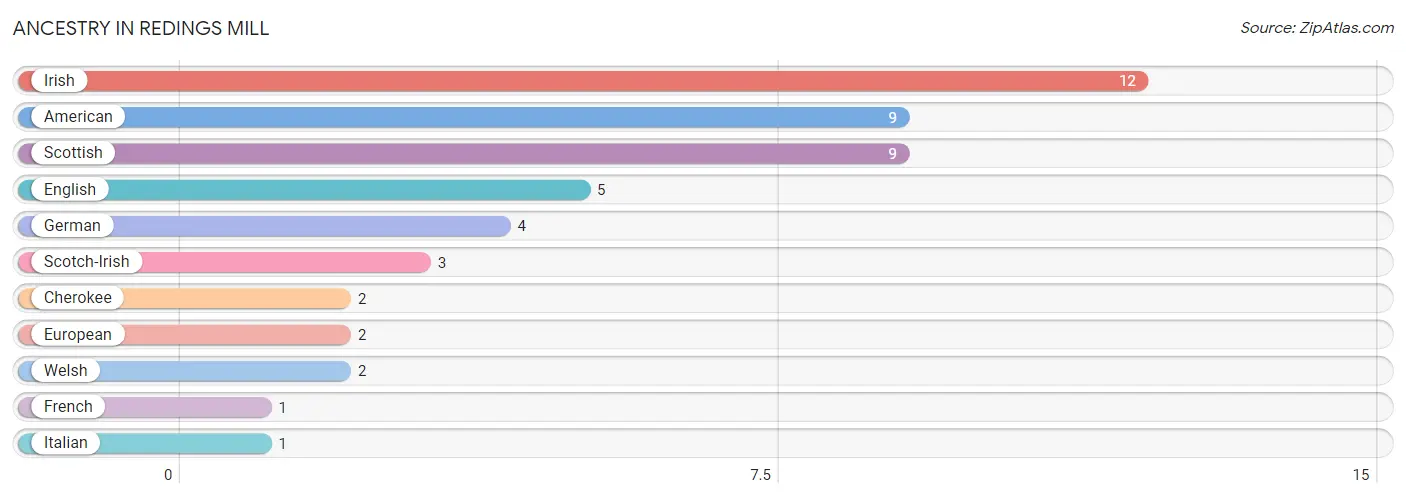
| Ancestry | # Population | % Population |
| American | 9 | 9.5% |
| Cherokee | 2 | 2.1% |
| English | 5 | 5.3% |
| European | 2 | 2.1% |
| French | 1 | 1.1% |
| German | 4 | 4.2% |
| Irish | 12 | 12.6% |
| Italian | 1 | 1.1% |
| Scotch-Irish | 3 | 3.2% |
| Scottish | 9 | 9.5% |
| Welsh | 2 | 2.1% | View All 11 Rows |
Immigrants in Redings Mill

| Immigration Origin | # Population | % Population | View All 0 Rows |
Sex and Age in Redings Mill
Sex and Age in Redings Mill
The most populous age groups in Redings Mill are Under 5 Years (13 | 26.0%) for men and 25 to 29 Years (9 | 20.0%) for women.
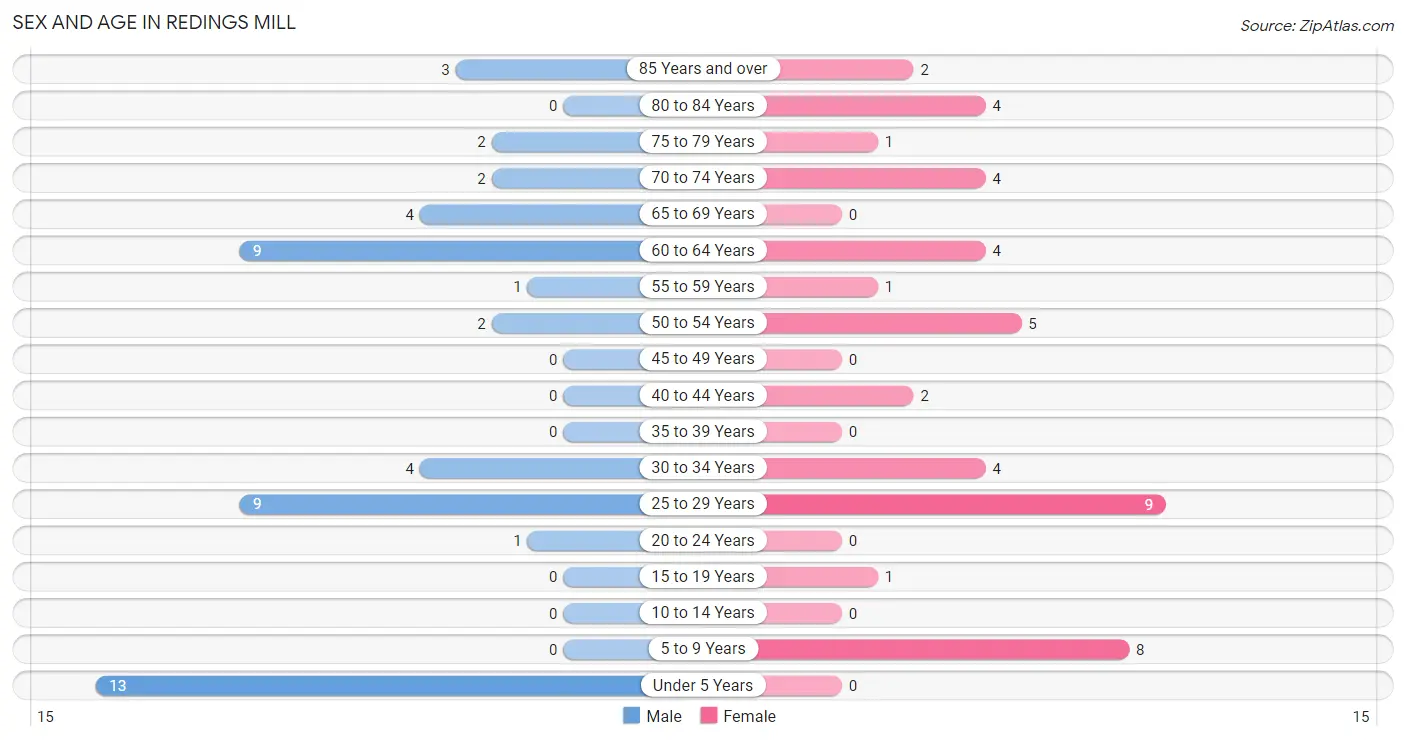
| Age Bracket | Male | Female |
| Under 5 Years | 13 (26.0%) | 0 (0.0%) |
| 5 to 9 Years | 0 (0.0%) | 8 (17.8%) |
| 10 to 14 Years | 0 (0.0%) | 0 (0.0%) |
| 15 to 19 Years | 0 (0.0%) | 1 (2.2%) |
| 20 to 24 Years | 1 (2.0%) | 0 (0.0%) |
| 25 to 29 Years | 9 (18.0%) | 9 (20.0%) |
| 30 to 34 Years | 4 (8.0%) | 4 (8.9%) |
| 35 to 39 Years | 0 (0.0%) | 0 (0.0%) |
| 40 to 44 Years | 0 (0.0%) | 2 (4.4%) |
| 45 to 49 Years | 0 (0.0%) | 0 (0.0%) |
| 50 to 54 Years | 2 (4.0%) | 5 (11.1%) |
| 55 to 59 Years | 1 (2.0%) | 1 (2.2%) |
| 60 to 64 Years | 9 (18.0%) | 4 (8.9%) |
| 65 to 69 Years | 4 (8.0%) | 0 (0.0%) |
| 70 to 74 Years | 2 (4.0%) | 4 (8.9%) |
| 75 to 79 Years | 2 (4.0%) | 1 (2.2%) |
| 80 to 84 Years | 0 (0.0%) | 4 (8.9%) |
| 85 Years and over | 3 (6.0%) | 2 (4.4%) |
| Total | 50 (100.0%) | 45 (100.0%) |
Families and Households in Redings Mill
Median Family Size in Redings Mill
The median family size in Redings Mill is 2.61 persons per family, with single male/father families (1 | 3.2%) accounting for the largest median family size of 3 persons per family. On the other hand, single female/mother families (2 | 6.5%) represent the smallest median family size with 2.00 persons per family.
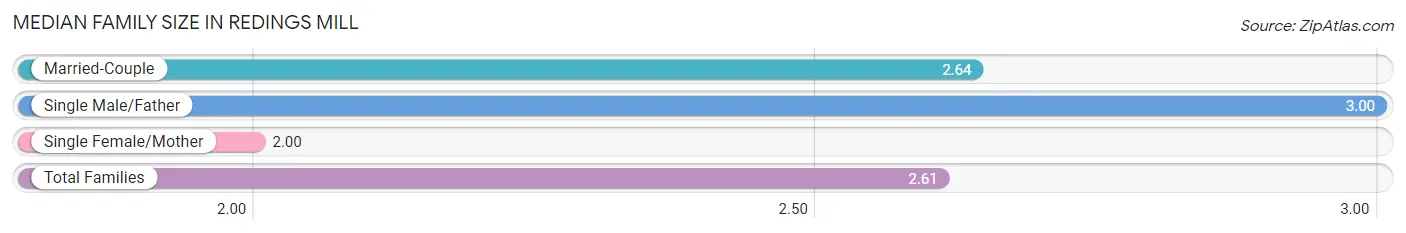
| Family Type | # Families | Family Size |
| Married-Couple | 28 (90.3%) | 2.64 |
| Single Male/Father | 1 (3.2%) | 3.00 |
| Single Female/Mother | 2 (6.5%) | 2.00 |
| Total Families | 31 (100.0%) | 2.61 |
Median Household Size in Redings Mill
The median household size in Redings Mill is 2.16 persons per household, with single male/father households (1 | 2.3%) accounting for the largest median household size of 3 persons per household. non-family households (13 | 29.5%) represent the smallest median household size with 1.08 persons per household.
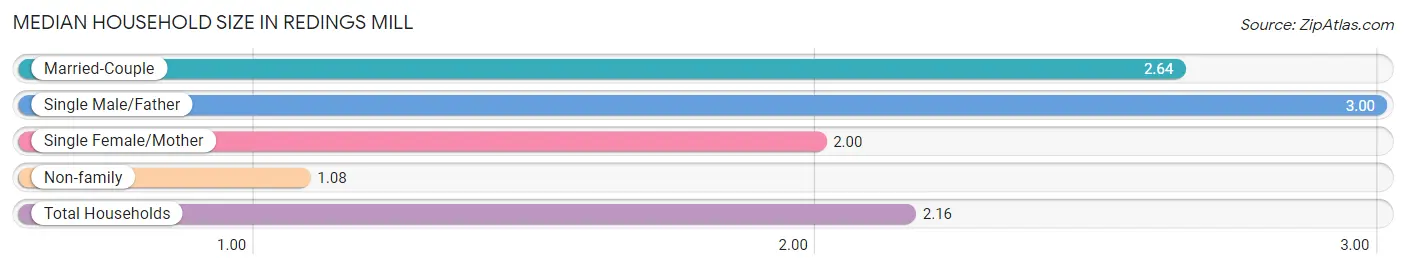
| Household Type | # Households | Household Size |
| Married-Couple | 28 (63.6%) | 2.64 |
| Single Male/Father | 1 (2.3%) | 3.00 |
| Single Female/Mother | 2 (4.5%) | 2.00 |
| Non-family | 13 (29.5%) | 1.08 |
| Total Households | 44 (100.0%) | 2.16 |
Household Size by Marriage Status in Redings Mill
Out of a total of 44 households in Redings Mill, 31 (70.5%) are family households, while 13 (29.5%) are nonfamily households. The most numerous type of family households are 2-person households, comprising 18, and the most common type of nonfamily households are 1-person households, comprising 12.
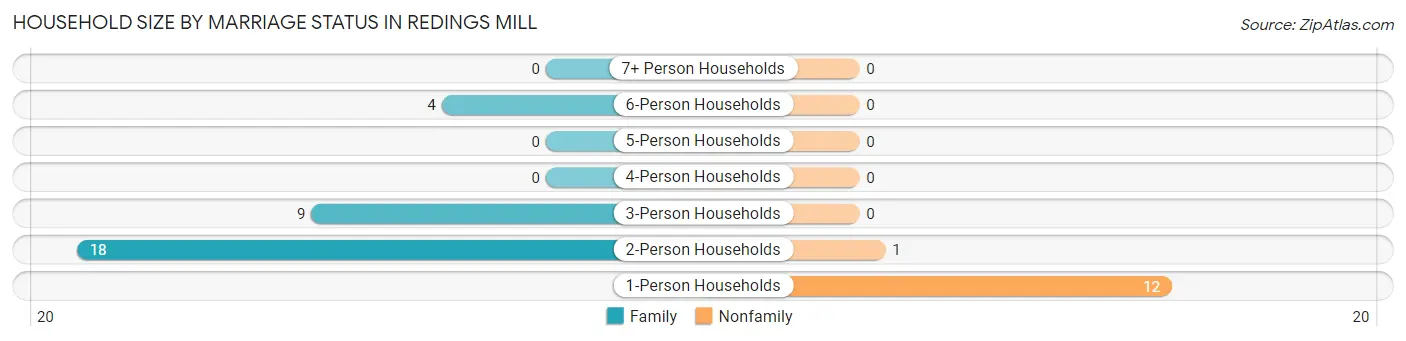
| Household Size | Family Households | Nonfamily Households |
| 1-Person Households | - | 12 (27.3%) |
| 2-Person Households | 18 (40.9%) | 1 (2.3%) |
| 3-Person Households | 9 (20.4%) | 0 (0.0%) |
| 4-Person Households | 0 (0.0%) | 0 (0.0%) |
| 5-Person Households | 0 (0.0%) | 0 (0.0%) |
| 6-Person Households | 4 (9.1%) | 0 (0.0%) |
| 7+ Person Households | 0 (0.0%) | 0 (0.0%) |
| Total | 31 (70.5%) | 13 (29.5%) |
Female Fertility in Redings Mill
Fertility by Age in Redings Mill
Average fertility rate in Redings Mill is 429.0 births per 1,000 women. Women in the age bracket of 20 to 34 years have the highest fertility rate with 692.0 births per 1,000 women. Women in the age bracket of 20 to 34 years acount for 100.0% of all women with births.
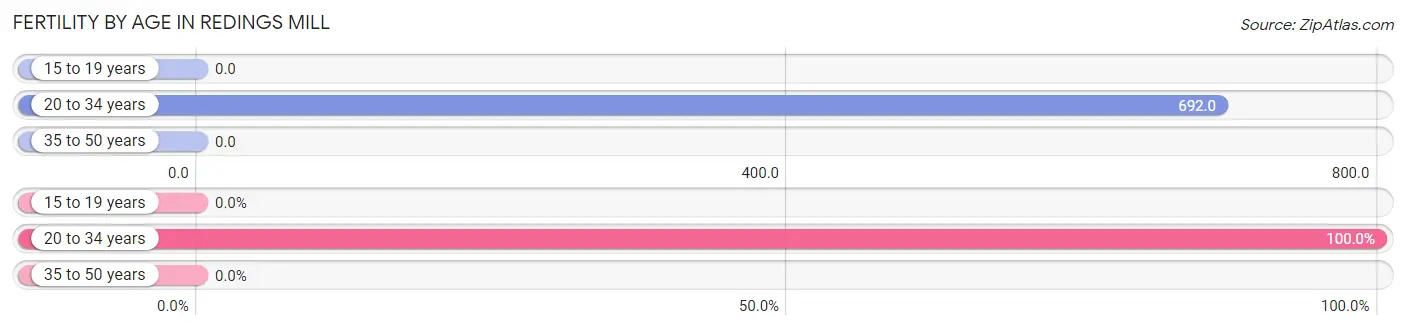
| Age Bracket | Women with Births | Births / 1,000 Women |
| 15 to 19 years | 0 (0.0%) | 0.0 |
| 20 to 34 years | 9 (100.0%) | 692.0 |
| 35 to 50 years | 0 (0.0%) | 0.0 |
| Total | 9 (100.0%) | 429.0 |
Fertility by Age by Marriage Status in Redings Mill
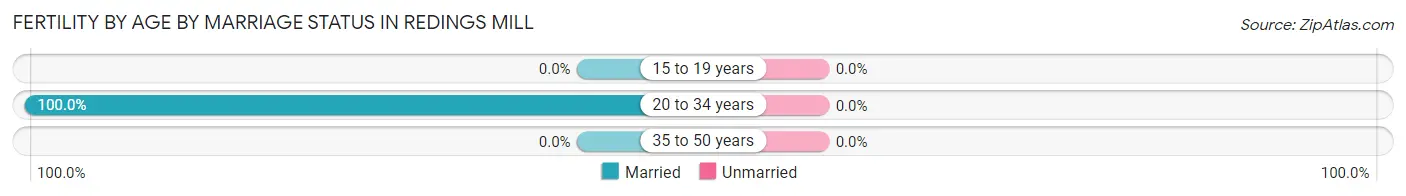
| Age Bracket | Married | Unmarried |
| 15 to 19 years | 0 (0.0%) | 0 (0.0%) |
| 20 to 34 years | 9 (100.0%) | 0 (0.0%) |
| 35 to 50 years | 0 (0.0%) | 0 (0.0%) |
| Total | 9 (100.0%) | 0 (0.0%) |
Fertility by Education in Redings Mill
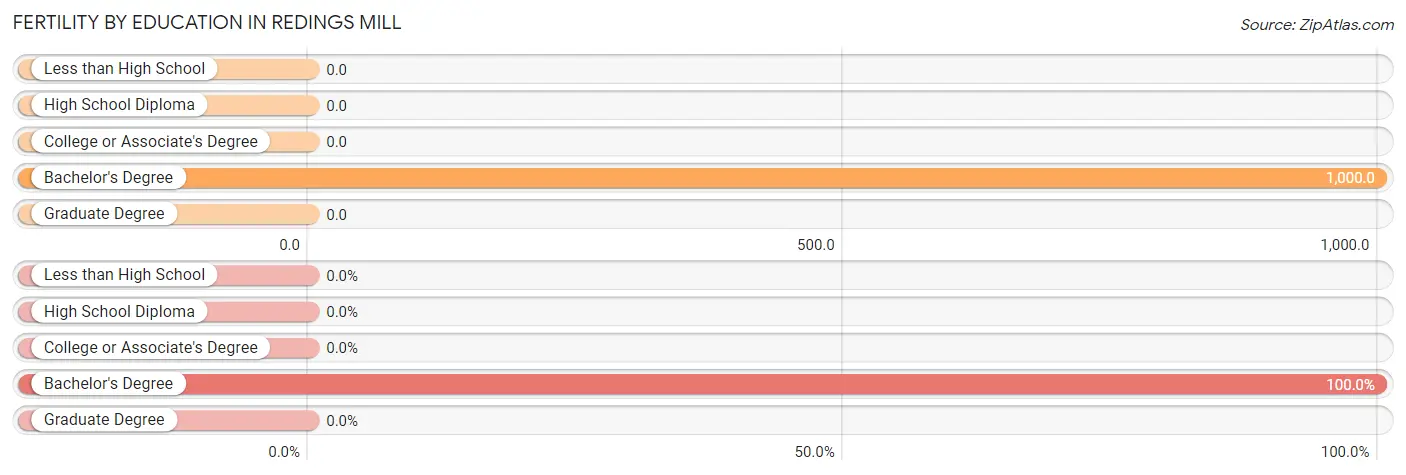
| Educational Attainment | Women with Births | Births / 1,000 Women |
| Less than High School | 0 (0.0%) | 0.0 |
| High School Diploma | 0 (0.0%) | 0.0 |
| College or Associate's Degree | 0 (0.0%) | 0.0 |
| Bachelor's Degree | 9 (100.0%) | 1,000.0 |
| Graduate Degree | 0 (0.0%) | 0.0 |
| Total | 9 (100.0%) | 429.0 |
Fertility by Education by Marriage Status in Redings Mill
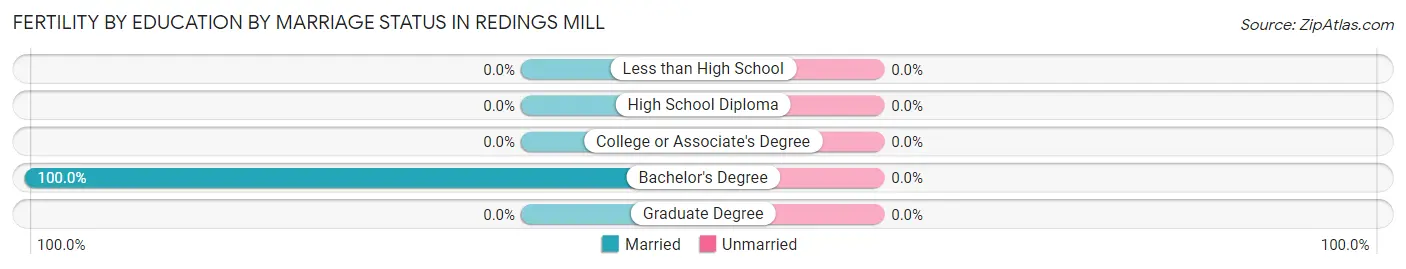
| Educational Attainment | Married | Unmarried |
| Less than High School | 0 (0.0%) | 0 (0.0%) |
| High School Diploma | 0 (0.0%) | 0 (0.0%) |
| College or Associate's Degree | 0 (0.0%) | 0 (0.0%) |
| Bachelor's Degree | 9 (100.0%) | 0 (0.0%) |
| Graduate Degree | 0 (0.0%) | 0 (0.0%) |
| Total | 9 (100.0%) | 0 (0.0%) |
Employment Characteristics in Redings Mill
Employment by Class of Employer in Redings Mill
Among the 24 employed individuals in Redings Mill, private company employees (22 | 91.7%), and not-for-profit organizations (2 | 8.3%) make up the most common classes of employment.
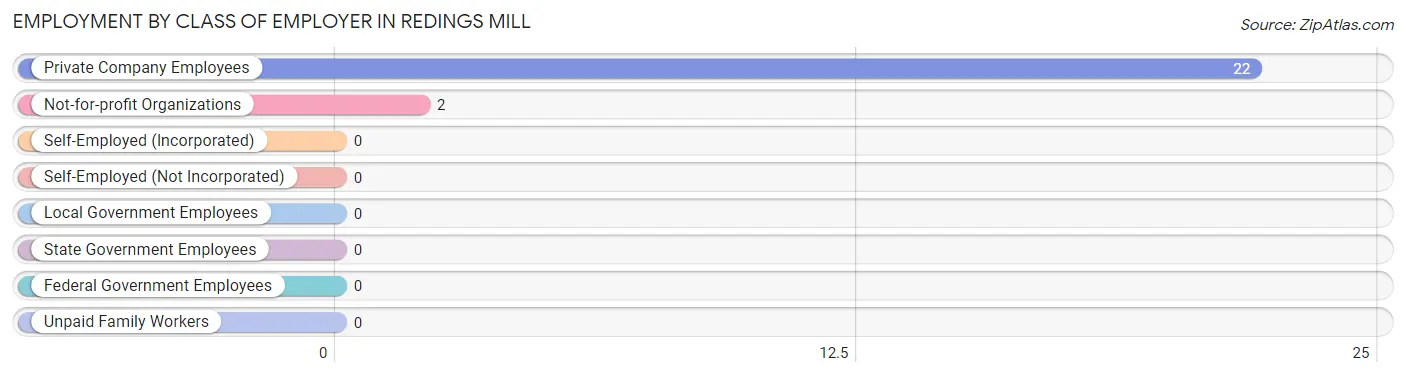
| Employer Class | # Employees | % Employees |
| Private Company Employees | 22 | 91.7% |
| Self-Employed (Incorporated) | 0 | 0.0% |
| Self-Employed (Not Incorporated) | 0 | 0.0% |
| Not-for-profit Organizations | 2 | 8.3% |
| Local Government Employees | 0 | 0.0% |
| State Government Employees | 0 | 0.0% |
| Federal Government Employees | 0 | 0.0% |
| Unpaid Family Workers | 0 | 0.0% |
| Total | 24 | 100.0% |
Employment Status by Age in Redings Mill
According to the labor force statistics for Redings Mill, out of the total population over 16 years of age (74), 45.9% or 34 individuals are in the labor force, with 2.9% or 1 of them unemployed. The age group with the highest labor force participation rate is 16 to 19 years, with 100.0% or 1 individuals in the labor force. Within the labor force, the 65 to 74 years age range has the highest percentage of unemployed individuals, with 100.0% or 1 of them being unemployed.
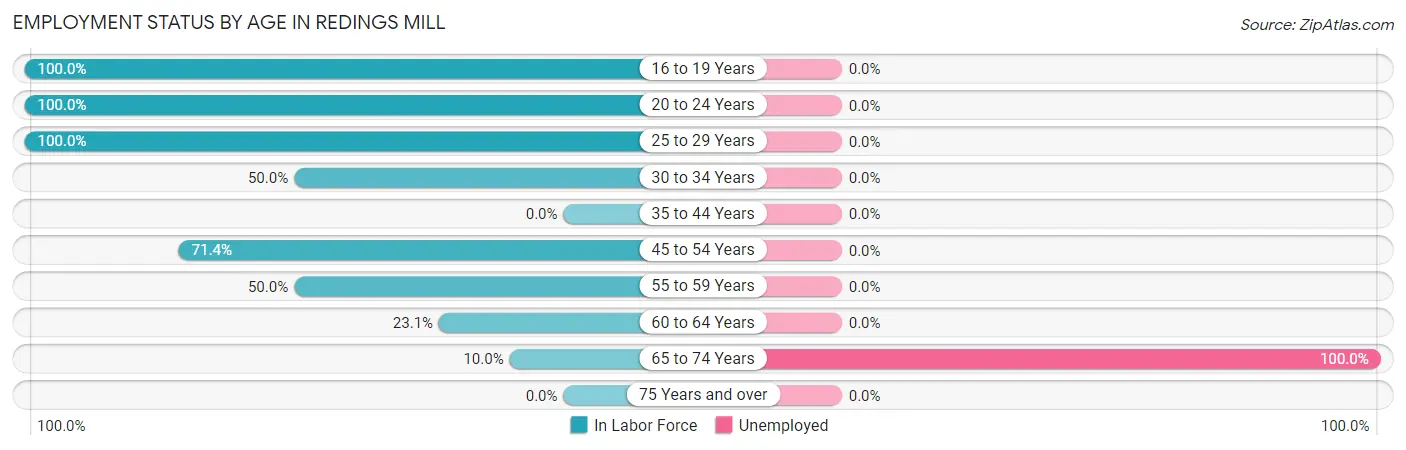
| Age Bracket | In Labor Force | Unemployed |
| 16 to 19 Years | 1 (100.0%) | 0 (0.0%) |
| 20 to 24 Years | 1 (100.0%) | 0 (0.0%) |
| 25 to 29 Years | 18 (100.0%) | 0 (0.0%) |
| 30 to 34 Years | 4 (50.0%) | 0 (0.0%) |
| 35 to 44 Years | 0 (0.0%) | 0 (0.0%) |
| 45 to 54 Years | 5 (71.4%) | 0 (0.0%) |
| 55 to 59 Years | 1 (50.0%) | 0 (0.0%) |
| 60 to 64 Years | 3 (23.1%) | 0 (0.0%) |
| 65 to 74 Years | 1 (10.0%) | 1 (100.0%) |
| 75 Years and over | 0 (0.0%) | 0 (0.0%) |
| Total | 34 (45.9%) | 1 (2.9%) |
Employment Status by Educational Attainment in Redings Mill
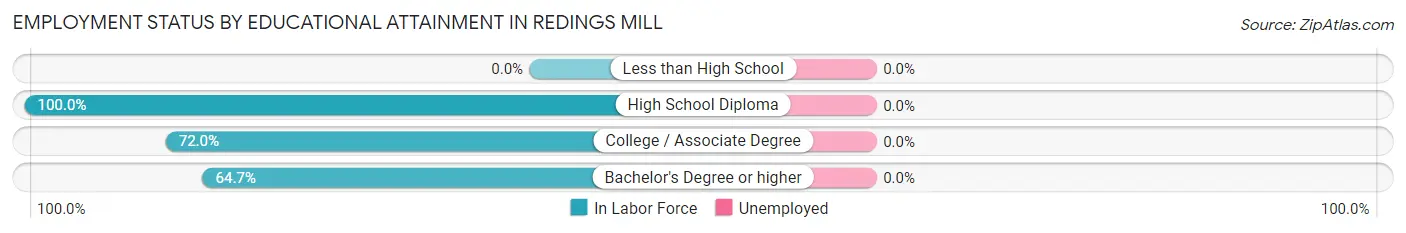
| Educational Attainment | In Labor Force | Unemployed |
| Less than High School | 0 (0.0%) | 0 (0.0%) |
| High School Diploma | 2 (100.0%) | 0 (0.0%) |
| College / Associate Degree | 18 (72.0%) | 0 (0.0%) |
| Bachelor's Degree or higher | 11 (64.7%) | 0 (0.0%) |
| Total | 31 (62.0%) | 0 (0.0%) |
Employment Occupations by Sex in Redings Mill
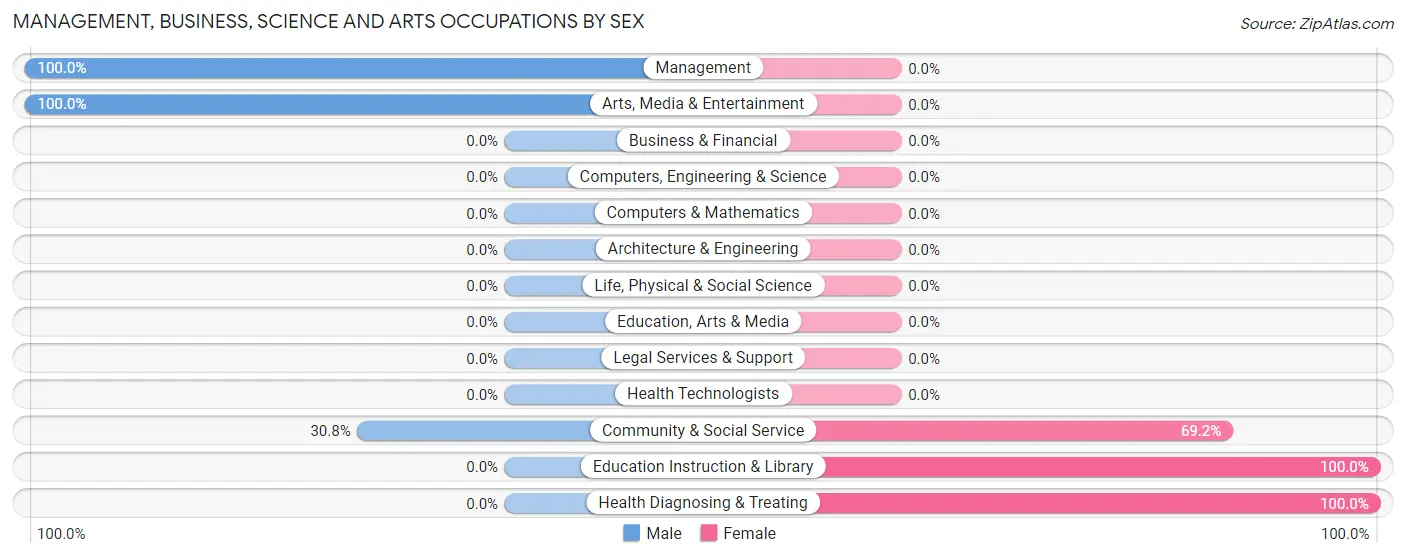
Management, Business, Science and Arts Occupations
The most common Management, Business, Science and Arts occupations in Redings Mill are Community & Social Service (13 | 39.4%), Education Instruction & Library (9 | 27.3%), Arts, Media & Entertainment (4 | 12.1%), Management (2 | 6.1%), and Health Diagnosing & Treating (1 | 3.0%).
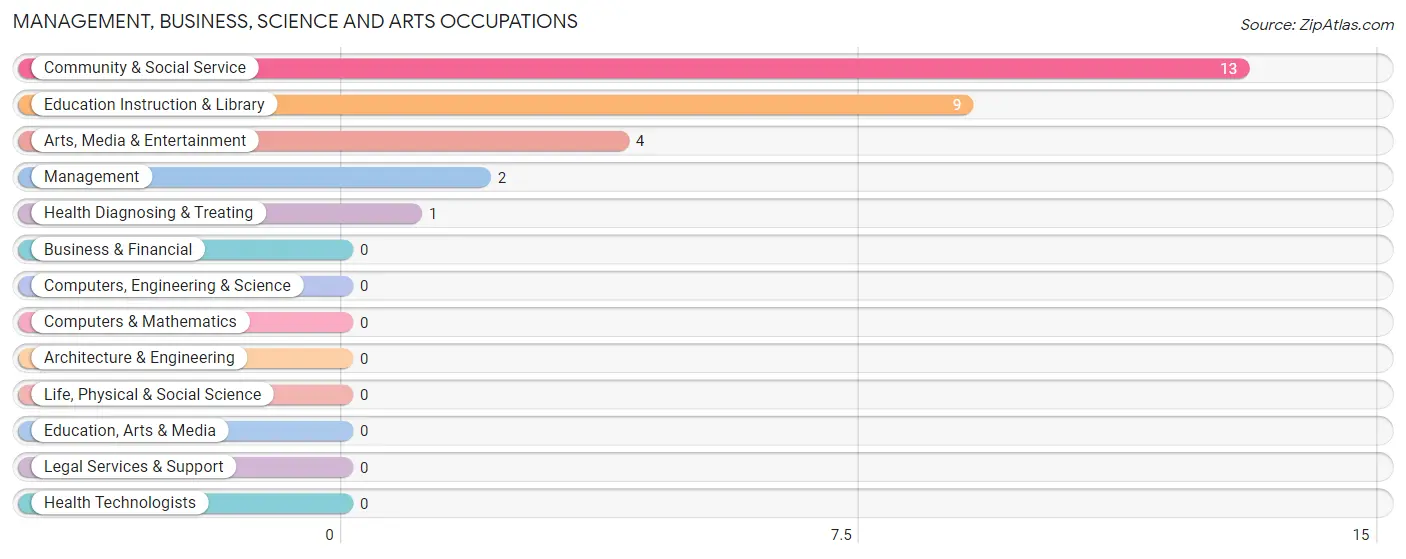
Management, Business, Science and Arts Occupations by Sex
Within the Management, Business, Science and Arts occupations in Redings Mill, the most male-oriented occupations are Management (100.0%), Arts, Media & Entertainment (100.0%), and Community & Social Service (30.8%), while the most female-oriented occupations are Education Instruction & Library (100.0%), Health Diagnosing & Treating (100.0%), and Community & Social Service (69.2%).
| Occupation | Male | Female |
| Management | 2 (100.0%) | 0 (0.0%) |
| Business & Financial | 0 (0.0%) | 0 (0.0%) |
| Computers, Engineering & Science | 0 (0.0%) | 0 (0.0%) |
| Computers & Mathematics | 0 (0.0%) | 0 (0.0%) |
| Architecture & Engineering | 0 (0.0%) | 0 (0.0%) |
| Life, Physical & Social Science | 0 (0.0%) | 0 (0.0%) |
| Community & Social Service | 4 (30.8%) | 9 (69.2%) |
| Education, Arts & Media | 0 (0.0%) | 0 (0.0%) |
| Legal Services & Support | 0 (0.0%) | 0 (0.0%) |
| Education Instruction & Library | 0 (0.0%) | 9 (100.0%) |
| Arts, Media & Entertainment | 4 (100.0%) | 0 (0.0%) |
| Health Diagnosing & Treating | 0 (0.0%) | 1 (100.0%) |
| Health Technologists | 0 (0.0%) | 0 (0.0%) |
| Total (Category) | 6 (37.5%) | 10 (62.5%) |
| Total (Overall) | 17 (51.5%) | 16 (48.5%) |
Services Occupations
Services Occupations by Sex
| Occupation | Male | Female |
| Healthcare Support | 0 (0.0%) | 0 (0.0%) |
| Security & Protection | 0 (0.0%) | 0 (0.0%) |
| Firefighting & Prevention | 0 (0.0%) | 0 (0.0%) |
| Law Enforcement | 0 (0.0%) | 0 (0.0%) |
| Food Preparation & Serving | 0 (0.0%) | 0 (0.0%) |
| Cleaning & Maintenance | 0 (0.0%) | 0 (0.0%) |
| Personal Care & Service | 0 (0.0%) | 0 (0.0%) |
| Total (Category) | 0 (0.0%) | 0 (0.0%) |
| Total (Overall) | 17 (51.5%) | 16 (48.5%) |
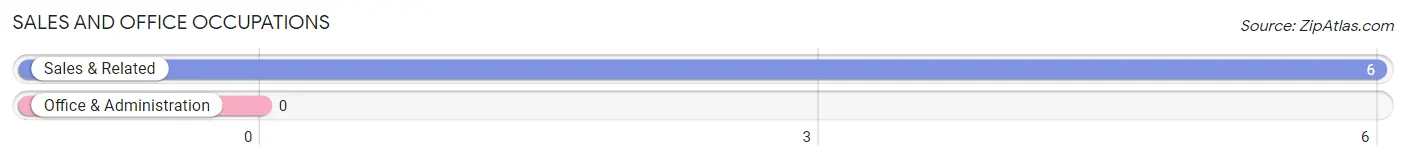
Sales and Office Occupations
The most common Sales and Office occupations in Redings Mill are , and Sales & Related (6 | 18.2%).
Sales and Office Occupations by Sex
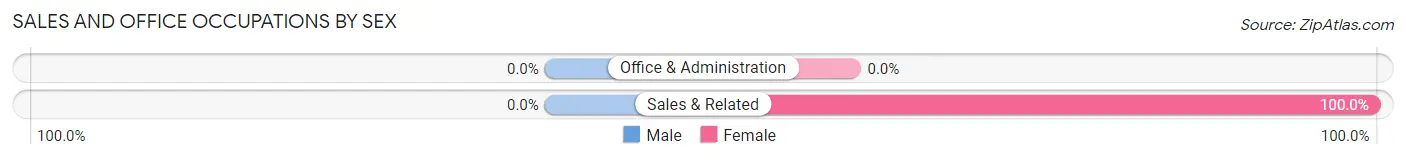
| Occupation | Male | Female |
| Sales & Related | 0 (0.0%) | 6 (100.0%) |
| Office & Administration | 0 (0.0%) | 0 (0.0%) |
| Total (Category) | 0 (0.0%) | 6 (100.0%) |
| Total (Overall) | 17 (51.5%) | 16 (48.5%) |
Natural Resources, Construction and Maintenance Occupations
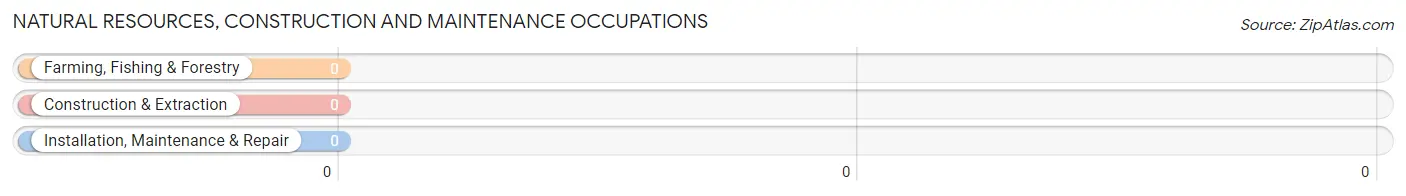
Natural Resources, Construction and Maintenance Occupations by Sex
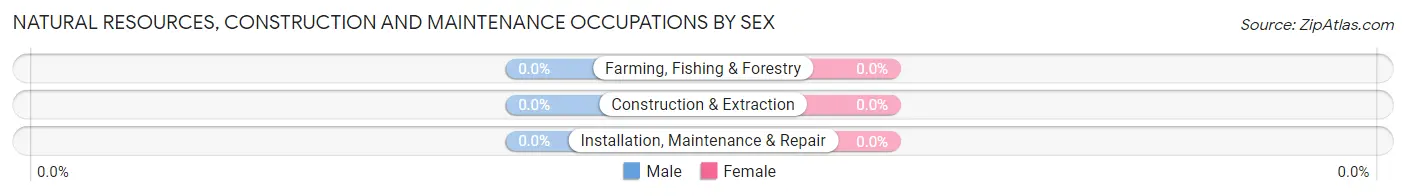
| Occupation | Male | Female |
| Farming, Fishing & Forestry | 0 (0.0%) | 0 (0.0%) |
| Construction & Extraction | 0 (0.0%) | 0 (0.0%) |
| Installation, Maintenance & Repair | 0 (0.0%) | 0 (0.0%) |
| Total (Category) | 0 (0.0%) | 0 (0.0%) |
| Total (Overall) | 17 (51.5%) | 16 (48.5%) |
Production, Transportation and Moving Occupations
The most common Production, Transportation and Moving occupations in Redings Mill are Production (10 | 30.3%), and Transportation (1 | 3.0%).
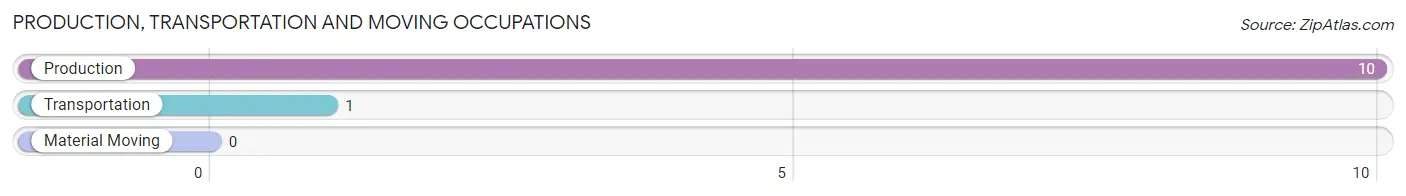
Production, Transportation and Moving Occupations by Sex
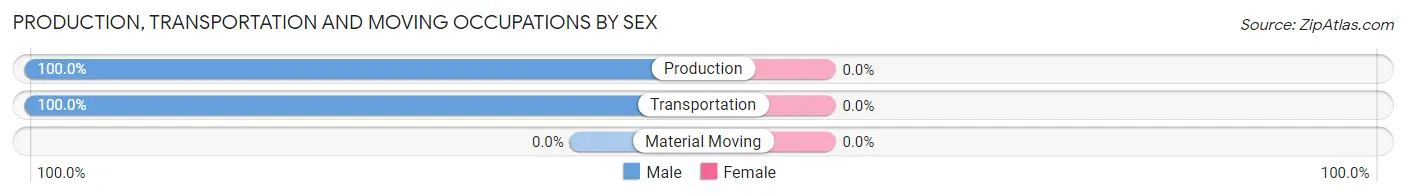
| Occupation | Male | Female |
| Production | 10 (100.0%) | 0 (0.0%) |
| Transportation | 1 (100.0%) | 0 (0.0%) |
| Material Moving | 0 (0.0%) | 0 (0.0%) |
| Total (Category) | 11 (100.0%) | 0 (0.0%) |
| Total (Overall) | 17 (51.5%) | 16 (48.5%) |
Employment Industries by Sex in Redings Mill
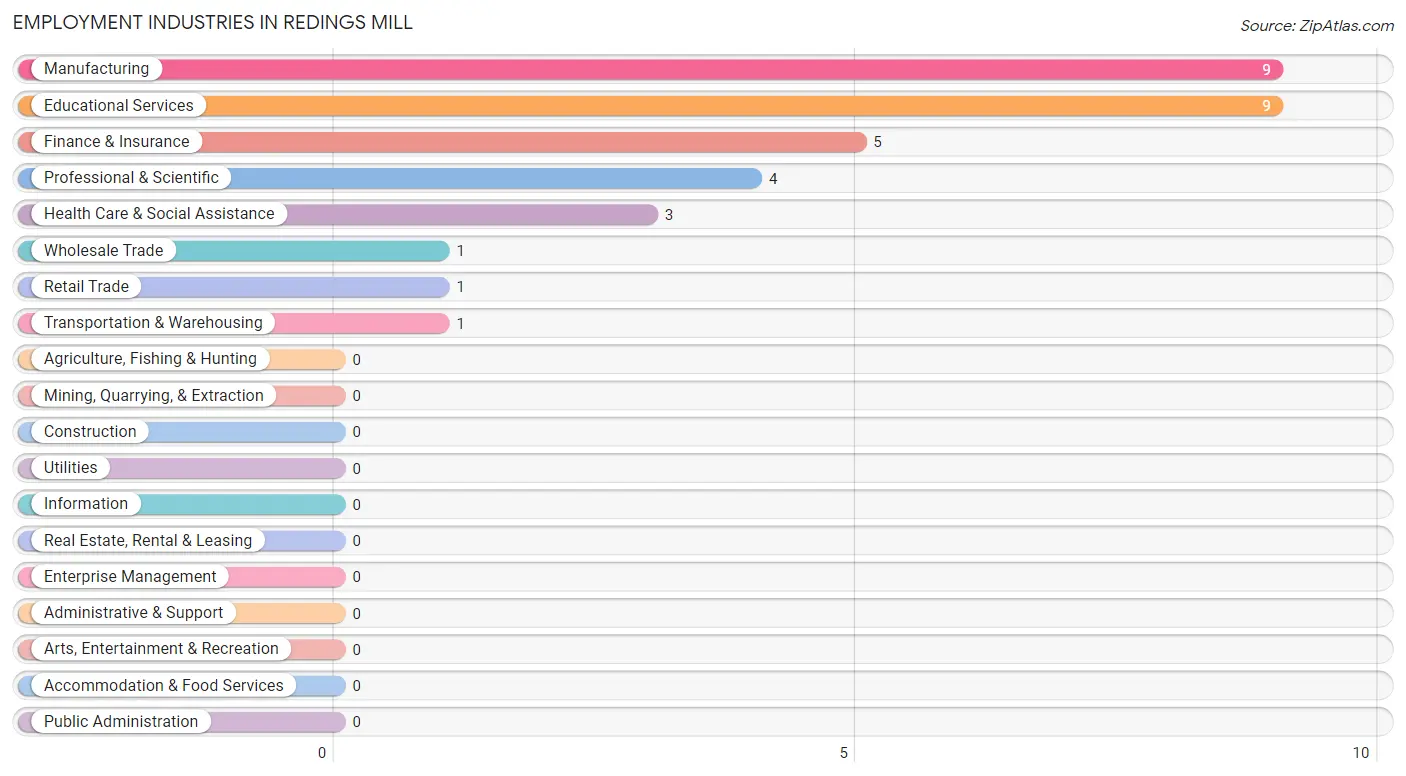
Employment Industries in Redings Mill
The major employment industries in Redings Mill include Manufacturing (9 | 27.3%), Educational Services (9 | 27.3%), Finance & Insurance (5 | 15.1%), Professional & Scientific (4 | 12.1%), and Health Care & Social Assistance (3 | 9.1%).
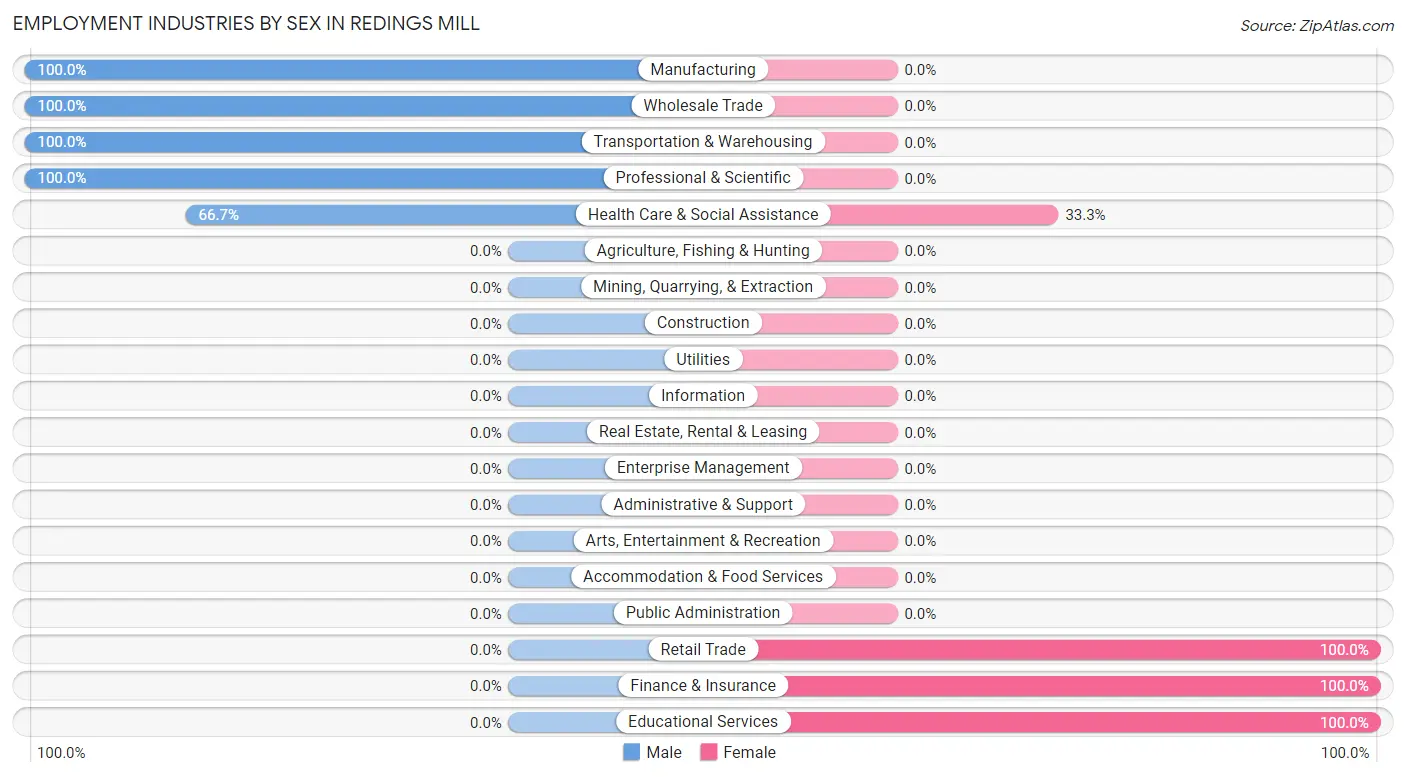
Employment Industries by Sex in Redings Mill
The Redings Mill industries that see more men than women are Manufacturing (100.0%), Wholesale Trade (100.0%), and Transportation & Warehousing (100.0%), whereas the industries that tend to have a higher number of women are Retail Trade (100.0%), Finance & Insurance (100.0%), and Educational Services (100.0%).
| Industry | Male | Female |
| Agriculture, Fishing & Hunting | 0 (0.0%) | 0 (0.0%) |
| Mining, Quarrying, & Extraction | 0 (0.0%) | 0 (0.0%) |
| Construction | 0 (0.0%) | 0 (0.0%) |
| Manufacturing | 9 (100.0%) | 0 (0.0%) |
| Wholesale Trade | 1 (100.0%) | 0 (0.0%) |
| Retail Trade | 0 (0.0%) | 1 (100.0%) |
| Transportation & Warehousing | 1 (100.0%) | 0 (0.0%) |
| Utilities | 0 (0.0%) | 0 (0.0%) |
| Information | 0 (0.0%) | 0 (0.0%) |
| Finance & Insurance | 0 (0.0%) | 5 (100.0%) |
| Real Estate, Rental & Leasing | 0 (0.0%) | 0 (0.0%) |
| Professional & Scientific | 4 (100.0%) | 0 (0.0%) |
| Enterprise Management | 0 (0.0%) | 0 (0.0%) |
| Administrative & Support | 0 (0.0%) | 0 (0.0%) |
| Educational Services | 0 (0.0%) | 9 (100.0%) |
| Health Care & Social Assistance | 2 (66.7%) | 1 (33.3%) |
| Arts, Entertainment & Recreation | 0 (0.0%) | 0 (0.0%) |
| Accommodation & Food Services | 0 (0.0%) | 0 (0.0%) |
| Public Administration | 0 (0.0%) | 0 (0.0%) |
| Total | 17 (51.5%) | 16 (48.5%) |
Education in Redings Mill
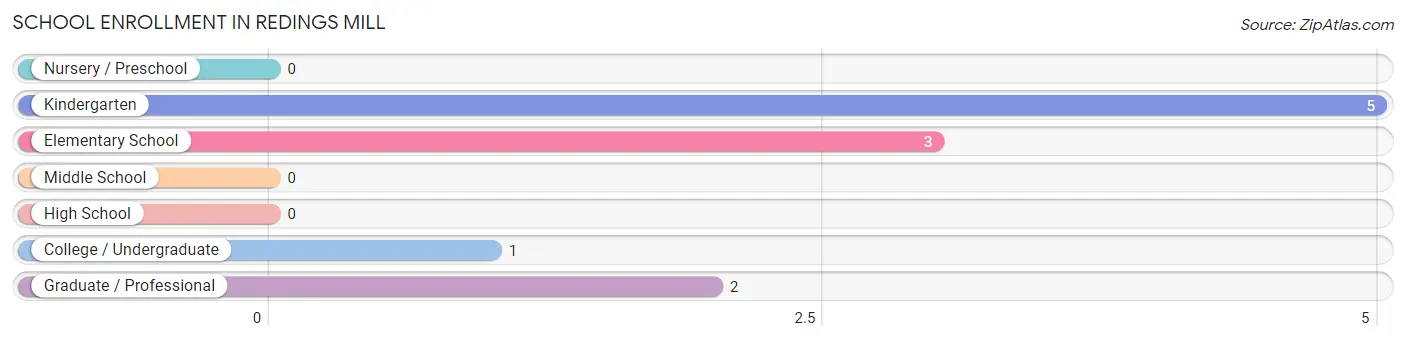
School Enrollment in Redings Mill
The most common levels of schooling among the 11 students in Redings Mill are kindergarten (5 | 45.5%), elementary school (3 | 27.3%), and graduate / professional (2 | 18.2%).
| School Level | # Students | % Students |
| Nursery / Preschool | 0 | 0.0% |
| Kindergarten | 5 | 45.5% |
| Elementary School | 3 | 27.3% |
| Middle School | 0 | 0.0% |
| High School | 0 | 0.0% |
| College / Undergraduate | 1 | 9.1% |
| Graduate / Professional | 2 | 18.2% |
| Total | 11 | 100.0% |
School Enrollment by Age by Funding Source in Redings Mill
Out of a total of 11 students who are enrolled in schools in Redings Mill, 6 (54.5%) attend a private institution, while the remaining 5 (45.5%) are enrolled in public schools. The age group of 5 to 9 year old has the highest likelihood of being enrolled in private schools, with 6 (75.0% in the age bracket) enrolled. Conversely, the age group of 18 to 19 year olds has the lowest likelihood of being enrolled in a private school, with 1 (100.0% in the age bracket) attending a public institution.
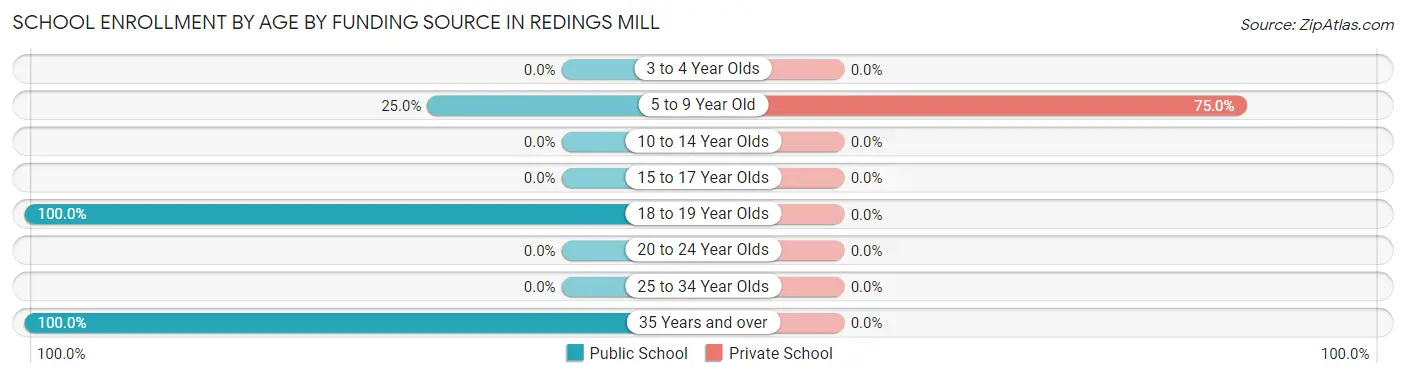
| Age Bracket | Public School | Private School |
| 3 to 4 Year Olds | 0 (0.0%) | 0 (0.0%) |
| 5 to 9 Year Old | 2 (25.0%) | 6 (75.0%) |
| 10 to 14 Year Olds | 0 (0.0%) | 0 (0.0%) |
| 15 to 17 Year Olds | 0 (0.0%) | 0 (0.0%) |
| 18 to 19 Year Olds | 1 (100.0%) | 0 (0.0%) |
| 20 to 24 Year Olds | 0 (0.0%) | 0 (0.0%) |
| 25 to 34 Year Olds | 0 (0.0%) | 0 (0.0%) |
| 35 Years and over | 2 (100.0%) | 0 (0.0%) |
| Total | 5 (45.5%) | 6 (54.5%) |
Educational Attainment by Field of Study in Redings Mill
Liberal arts & history (10 | 41.7%), education (5 | 20.8%), science & technology (3 | 12.5%), business (3 | 12.5%), and social sciences (2 | 8.3%) are the most common fields of study among 24 individuals in Redings Mill who have obtained a bachelor's degree or higher.
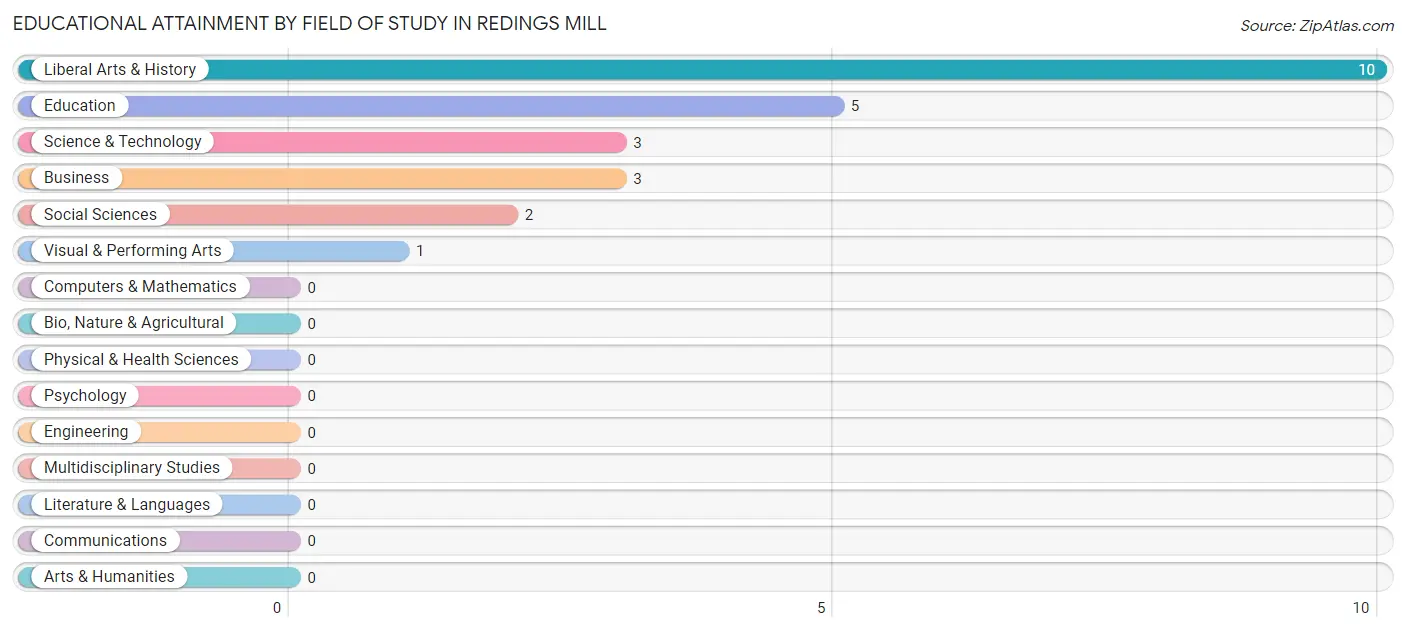
| Field of Study | # Graduates | % Graduates |
| Computers & Mathematics | 0 | 0.0% |
| Bio, Nature & Agricultural | 0 | 0.0% |
| Physical & Health Sciences | 0 | 0.0% |
| Psychology | 0 | 0.0% |
| Social Sciences | 2 | 8.3% |
| Engineering | 0 | 0.0% |
| Multidisciplinary Studies | 0 | 0.0% |
| Science & Technology | 3 | 12.5% |
| Business | 3 | 12.5% |
| Education | 5 | 20.8% |
| Literature & Languages | 0 | 0.0% |
| Liberal Arts & History | 10 | 41.7% |
| Visual & Performing Arts | 1 | 4.2% |
| Communications | 0 | 0.0% |
| Arts & Humanities | 0 | 0.0% |
| Total | 24 | 100.0% |
Transportation & Commute in Redings Mill
Vehicle Availability by Sex in Redings Mill
The most prevalent vehicle ownership categories in Redings Mill are males with 3 vehicles (11, accounting for 64.7%) and females with 3 vehicles (1, making up 157.1%).
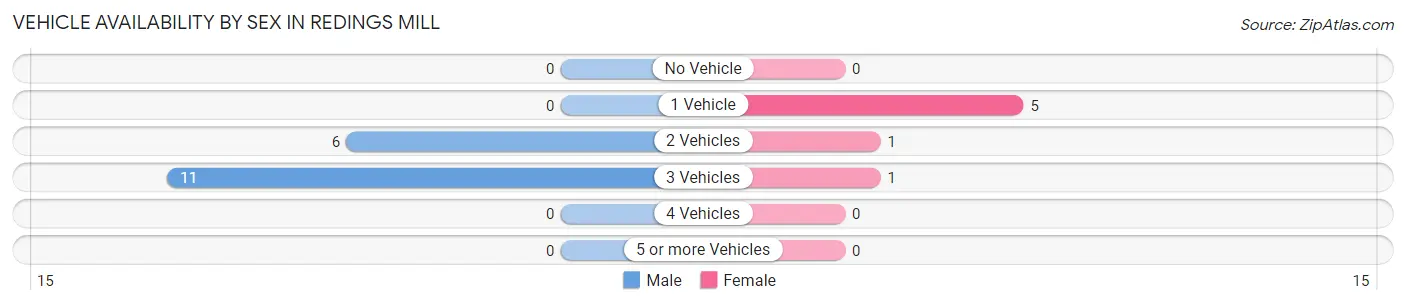
| Vehicles Available | Male | Female |
| No Vehicle | 0 (0.0%) | 0 (0.0%) |
| 1 Vehicle | 0 (0.0%) | 5 (71.4%) |
| 2 Vehicles | 6 (35.3%) | 1 (14.3%) |
| 3 Vehicles | 11 (64.7%) | 1 (14.3%) |
| 4 Vehicles | 0 (0.0%) | 0 (0.0%) |
| 5 or more Vehicles | 0 (0.0%) | 0 (0.0%) |
| Total | 17 (100.0%) | 7 (100.0%) |
Commute Time in Redings Mill
The most frequently occuring commute durations in Redings Mill are 20 to 24 minutes (9 commuters, 45.0%), 15 to 19 minutes (6 commuters, 30.0%), and 10 to 14 minutes (2 commuters, 10.0%).
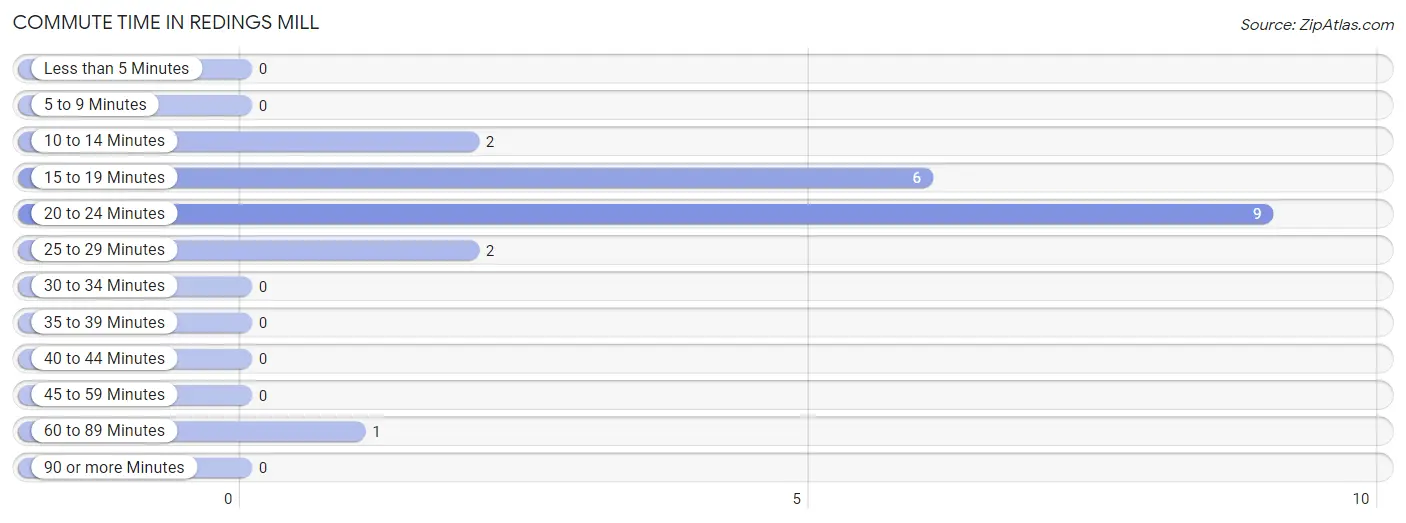
| Commute Time | # Commuters | % Commuters |
| Less than 5 Minutes | 0 | 0.0% |
| 5 to 9 Minutes | 0 | 0.0% |
| 10 to 14 Minutes | 2 | 10.0% |
| 15 to 19 Minutes | 6 | 30.0% |
| 20 to 24 Minutes | 9 | 45.0% |
| 25 to 29 Minutes | 2 | 10.0% |
| 30 to 34 Minutes | 0 | 0.0% |
| 35 to 39 Minutes | 0 | 0.0% |
| 40 to 44 Minutes | 0 | 0.0% |
| 45 to 59 Minutes | 0 | 0.0% |
| 60 to 89 Minutes | 1 | 5.0% |
| 90 or more Minutes | 0 | 0.0% |
Commute Time by Sex in Redings Mill
The most common commute times in Redings Mill are 20 to 24 minutes (9 commuters, 69.2%) for males and 15 to 19 minutes (6 commuters, 85.7%) for females.
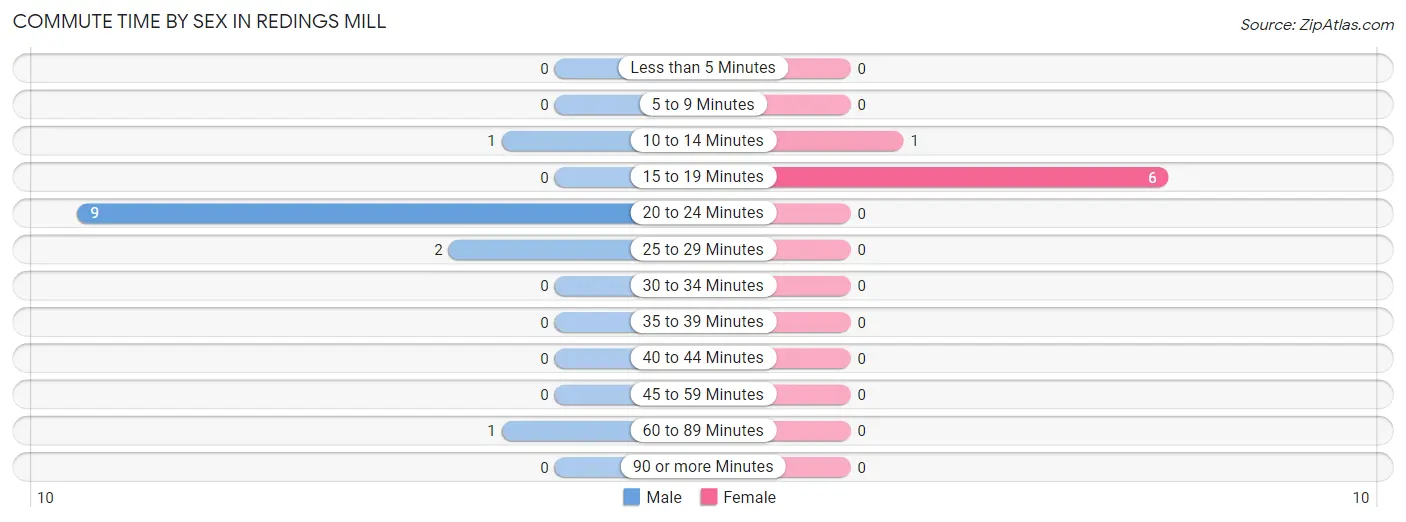
| Commute Time | Male | Female |
| Less than 5 Minutes | 0 (0.0%) | 0 (0.0%) |
| 5 to 9 Minutes | 0 (0.0%) | 0 (0.0%) |
| 10 to 14 Minutes | 1 (7.7%) | 1 (14.3%) |
| 15 to 19 Minutes | 0 (0.0%) | 6 (85.7%) |
| 20 to 24 Minutes | 9 (69.2%) | 0 (0.0%) |
| 25 to 29 Minutes | 2 (15.4%) | 0 (0.0%) |
| 30 to 34 Minutes | 0 (0.0%) | 0 (0.0%) |
| 35 to 39 Minutes | 0 (0.0%) | 0 (0.0%) |
| 40 to 44 Minutes | 0 (0.0%) | 0 (0.0%) |
| 45 to 59 Minutes | 0 (0.0%) | 0 (0.0%) |
| 60 to 89 Minutes | 1 (7.7%) | 0 (0.0%) |
| 90 or more Minutes | 0 (0.0%) | 0 (0.0%) |
Time of Departure to Work by Sex in Redings Mill
The most frequent times of departure to work in Redings Mill are 5:30 AM to 5:59 AM (9, 69.2%) for males and 8:00 AM to 8:29 AM (5, 71.4%) for females.
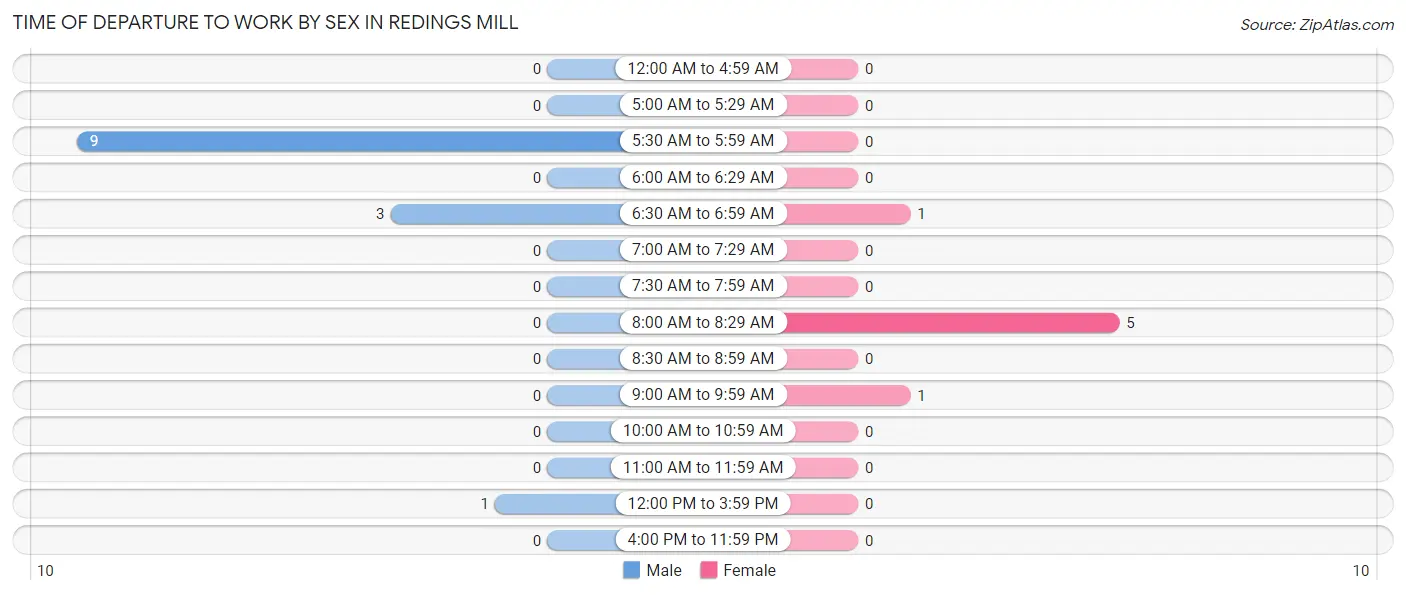
| Time of Departure | Male | Female |
| 12:00 AM to 4:59 AM | 0 (0.0%) | 0 (0.0%) |
| 5:00 AM to 5:29 AM | 0 (0.0%) | 0 (0.0%) |
| 5:30 AM to 5:59 AM | 9 (69.2%) | 0 (0.0%) |
| 6:00 AM to 6:29 AM | 0 (0.0%) | 0 (0.0%) |
| 6:30 AM to 6:59 AM | 3 (23.1%) | 1 (14.3%) |
| 7:00 AM to 7:29 AM | 0 (0.0%) | 0 (0.0%) |
| 7:30 AM to 7:59 AM | 0 (0.0%) | 0 (0.0%) |
| 8:00 AM to 8:29 AM | 0 (0.0%) | 5 (71.4%) |
| 8:30 AM to 8:59 AM | 0 (0.0%) | 0 (0.0%) |
| 9:00 AM to 9:59 AM | 0 (0.0%) | 1 (14.3%) |
| 10:00 AM to 10:59 AM | 0 (0.0%) | 0 (0.0%) |
| 11:00 AM to 11:59 AM | 0 (0.0%) | 0 (0.0%) |
| 12:00 PM to 3:59 PM | 1 (7.7%) | 0 (0.0%) |
| 4:00 PM to 11:59 PM | 0 (0.0%) | 0 (0.0%) |
| Total | 13 (100.0%) | 7 (100.0%) |
Housing Occupancy in Redings Mill
Occupancy by Ownership in Redings Mill
Of the total 44 dwellings in Redings Mill, owner-occupied units account for 39 (88.6%), while renter-occupied units make up 5 (11.4%).
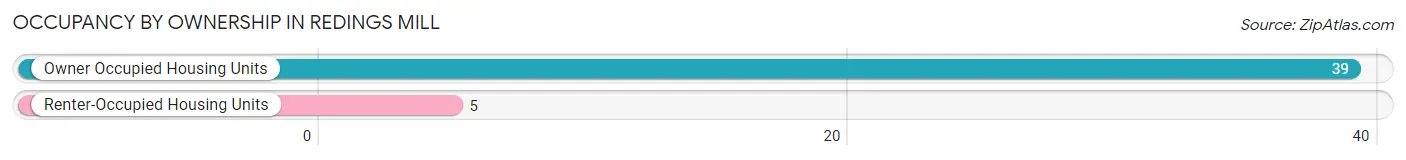
| Occupancy | # Housing Units | % Housing Units |
| Owner Occupied Housing Units | 39 | 88.6% |
| Renter-Occupied Housing Units | 5 | 11.4% |
| Total Occupied Housing Units | 44 | 100.0% |
Occupancy by Household Size in Redings Mill
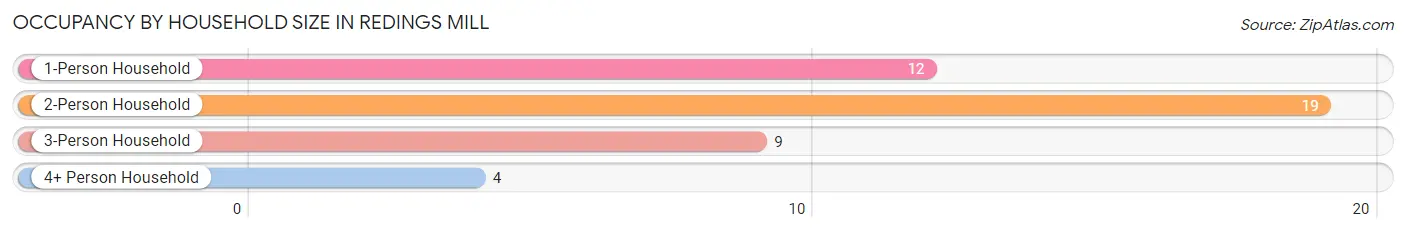
| Household Size | # Housing Units | % Housing Units |
| 1-Person Household | 12 | 27.3% |
| 2-Person Household | 19 | 43.2% |
| 3-Person Household | 9 | 20.4% |
| 4+ Person Household | 4 | 9.1% |
| Total Housing Units | 44 | 100.0% |
Occupancy by Ownership by Household Size in Redings Mill
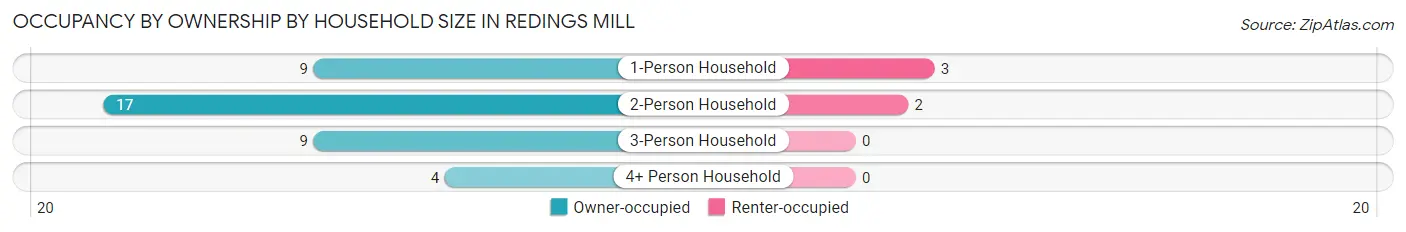
| Household Size | Owner-occupied | Renter-occupied |
| 1-Person Household | 9 (75.0%) | 3 (25.0%) |
| 2-Person Household | 17 (89.5%) | 2 (10.5%) |
| 3-Person Household | 9 (100.0%) | 0 (0.0%) |
| 4+ Person Household | 4 (100.0%) | 0 (0.0%) |
| Total Housing Units | 39 (88.6%) | 5 (11.4%) |
Occupancy by Educational Attainment in Redings Mill
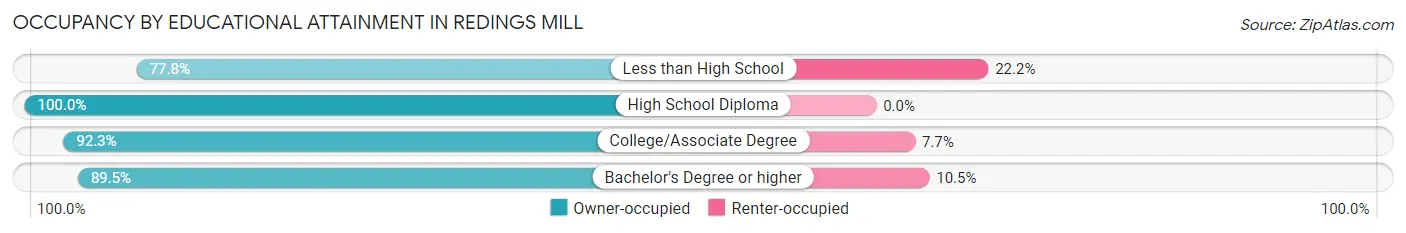
| Household Size | Owner-occupied | Renter-occupied |
| Less than High School | 7 (77.8%) | 2 (22.2%) |
| High School Diploma | 3 (100.0%) | 0 (0.0%) |
| College/Associate Degree | 12 (92.3%) | 1 (7.7%) |
| Bachelor's Degree or higher | 17 (89.5%) | 2 (10.5%) |
Occupancy by Age of Householder in Redings Mill
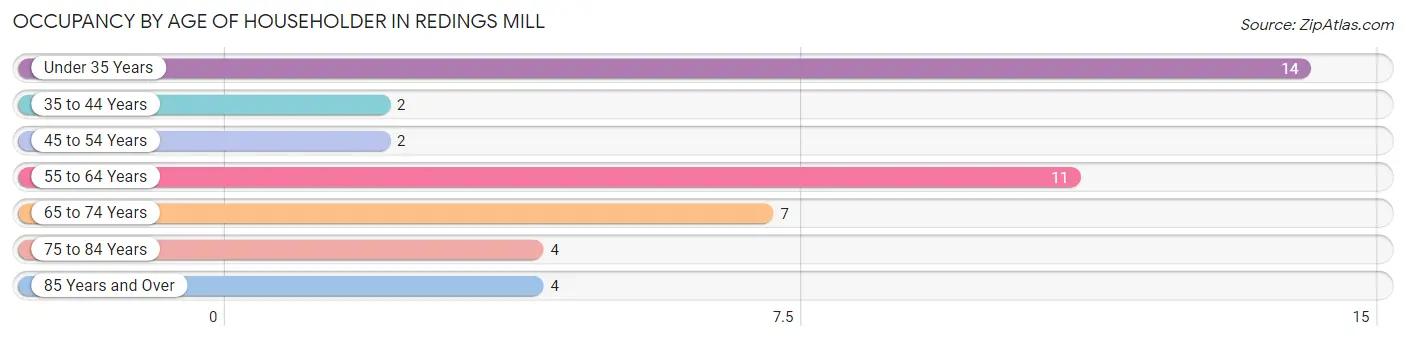
| Age Bracket | # Households | % Households |
| Under 35 Years | 14 | 31.8% |
| 35 to 44 Years | 2 | 4.5% |
| 45 to 54 Years | 2 | 4.5% |
| 55 to 64 Years | 11 | 25.0% |
| 65 to 74 Years | 7 | 15.9% |
| 75 to 84 Years | 4 | 9.1% |
| 85 Years and Over | 4 | 9.1% |
| Total | 44 | 100.0% |
Housing Finances in Redings Mill
Median Income by Occupancy in Redings Mill
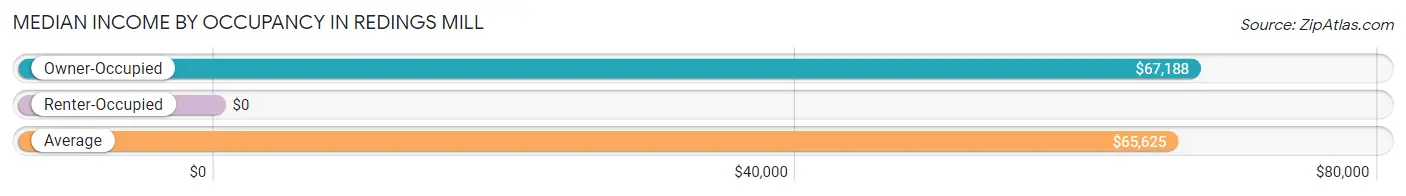
| Occupancy Type | # Households | Median Income |
| Owner-Occupied | 39 (88.6%) | $67,188 |
| Renter-Occupied | 5 (11.4%) | $0 |
| Average | 44 (100.0%) | $65,625 |
Occupancy by Householder Income Bracket in Redings Mill
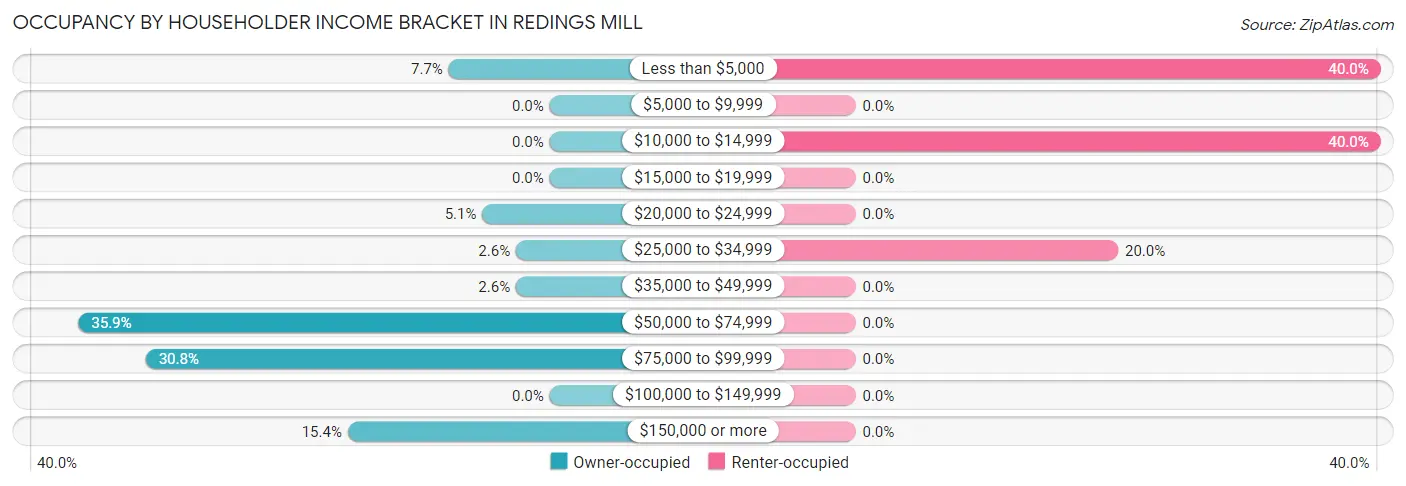
| Income Bracket | Owner-occupied | Renter-occupied |
| Less than $5,000 | 3 (7.7%) | 2 (40.0%) |
| $5,000 to $9,999 | 0 (0.0%) | 0 (0.0%) |
| $10,000 to $14,999 | 0 (0.0%) | 2 (40.0%) |
| $15,000 to $19,999 | 0 (0.0%) | 0 (0.0%) |
| $20,000 to $24,999 | 2 (5.1%) | 0 (0.0%) |
| $25,000 to $34,999 | 1 (2.6%) | 1 (20.0%) |
| $35,000 to $49,999 | 1 (2.6%) | 0 (0.0%) |
| $50,000 to $74,999 | 14 (35.9%) | 0 (0.0%) |
| $75,000 to $99,999 | 12 (30.8%) | 0 (0.0%) |
| $100,000 to $149,999 | 0 (0.0%) | 0 (0.0%) |
| $150,000 or more | 6 (15.4%) | 0 (0.0%) |
| Total | 39 (100.0%) | 5 (100.0%) |
Monthly Housing Cost Tiers in Redings Mill
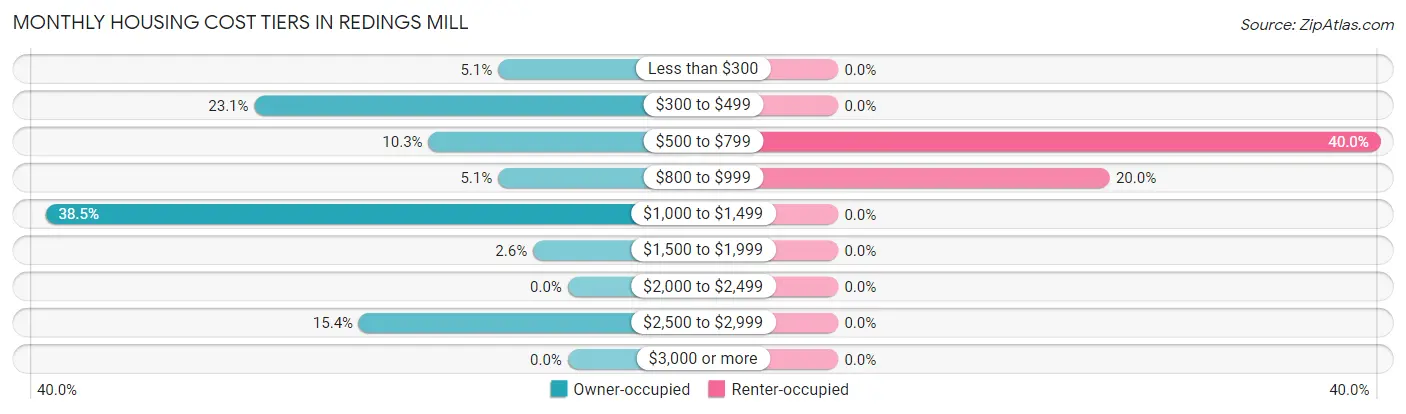
| Monthly Cost | Owner-occupied | Renter-occupied |
| Less than $300 | 2 (5.1%) | 0 (0.0%) |
| $300 to $499 | 9 (23.1%) | 0 (0.0%) |
| $500 to $799 | 4 (10.3%) | 2 (40.0%) |
| $800 to $999 | 2 (5.1%) | 1 (20.0%) |
| $1,000 to $1,499 | 15 (38.5%) | 0 (0.0%) |
| $1,500 to $1,999 | 1 (2.6%) | 0 (0.0%) |
| $2,000 to $2,499 | 0 (0.0%) | 0 (0.0%) |
| $2,500 to $2,999 | 6 (15.4%) | 0 (0.0%) |
| $3,000 or more | 0 (0.0%) | 0 (0.0%) |
| Total | 39 (100.0%) | 5 (100.0%) |
Physical Housing Characteristics in Redings Mill
Housing Structures in Redings Mill
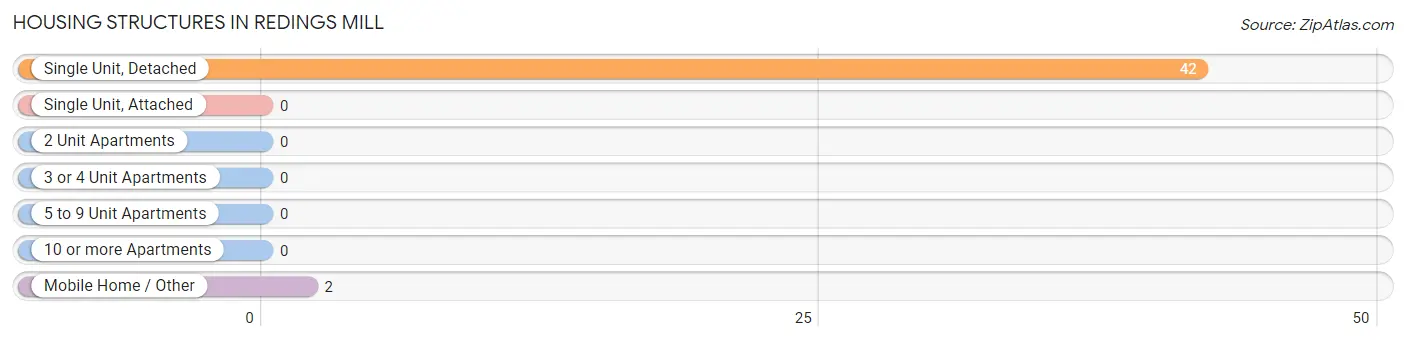
| Structure Type | # Housing Units | % Housing Units |
| Single Unit, Detached | 42 | 95.5% |
| Single Unit, Attached | 0 | 0.0% |
| 2 Unit Apartments | 0 | 0.0% |
| 3 or 4 Unit Apartments | 0 | 0.0% |
| 5 to 9 Unit Apartments | 0 | 0.0% |
| 10 or more Apartments | 0 | 0.0% |
| Mobile Home / Other | 2 | 4.5% |
| Total | 44 | 100.0% |
Housing Structures by Occupancy in Redings Mill
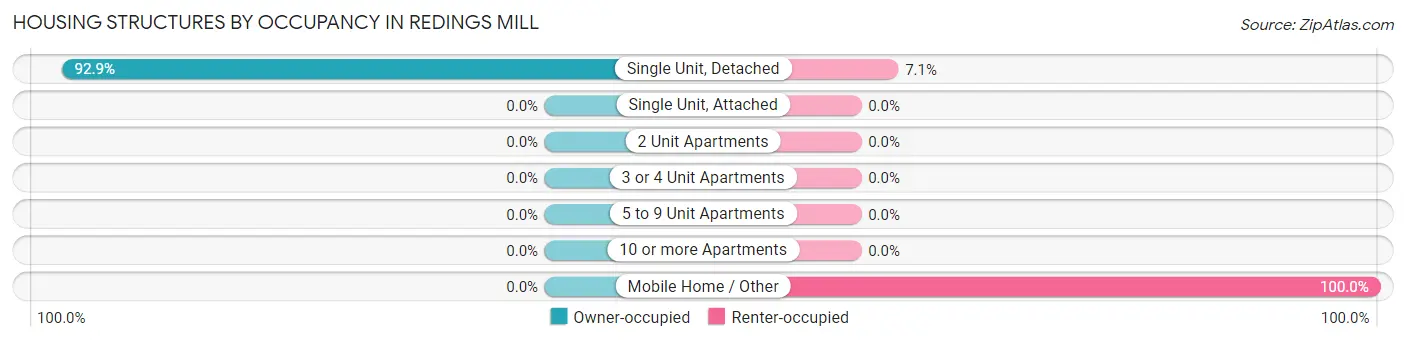
| Structure Type | Owner-occupied | Renter-occupied |
| Single Unit, Detached | 39 (92.9%) | 3 (7.1%) |
| Single Unit, Attached | 0 (0.0%) | 0 (0.0%) |
| 2 Unit Apartments | 0 (0.0%) | 0 (0.0%) |
| 3 or 4 Unit Apartments | 0 (0.0%) | 0 (0.0%) |
| 5 to 9 Unit Apartments | 0 (0.0%) | 0 (0.0%) |
| 10 or more Apartments | 0 (0.0%) | 0 (0.0%) |
| Mobile Home / Other | 0 (0.0%) | 2 (100.0%) |
| Total | 39 (88.6%) | 5 (11.4%) |
Housing Structures by Number of Rooms in Redings Mill
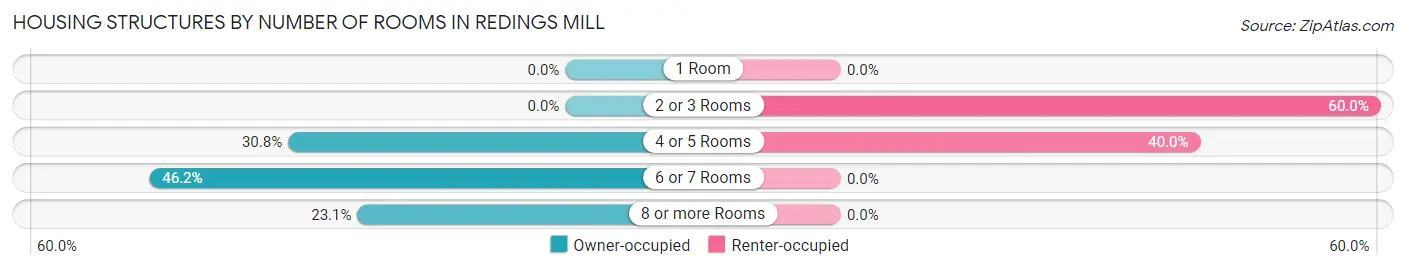
| Number of Rooms | Owner-occupied | Renter-occupied |
| 1 Room | 0 (0.0%) | 0 (0.0%) |
| 2 or 3 Rooms | 0 (0.0%) | 3 (60.0%) |
| 4 or 5 Rooms | 12 (30.8%) | 2 (40.0%) |
| 6 or 7 Rooms | 18 (46.2%) | 0 (0.0%) |
| 8 or more Rooms | 9 (23.1%) | 0 (0.0%) |
| Total | 39 (100.0%) | 5 (100.0%) |
Housing Structure by Heating Type in Redings Mill
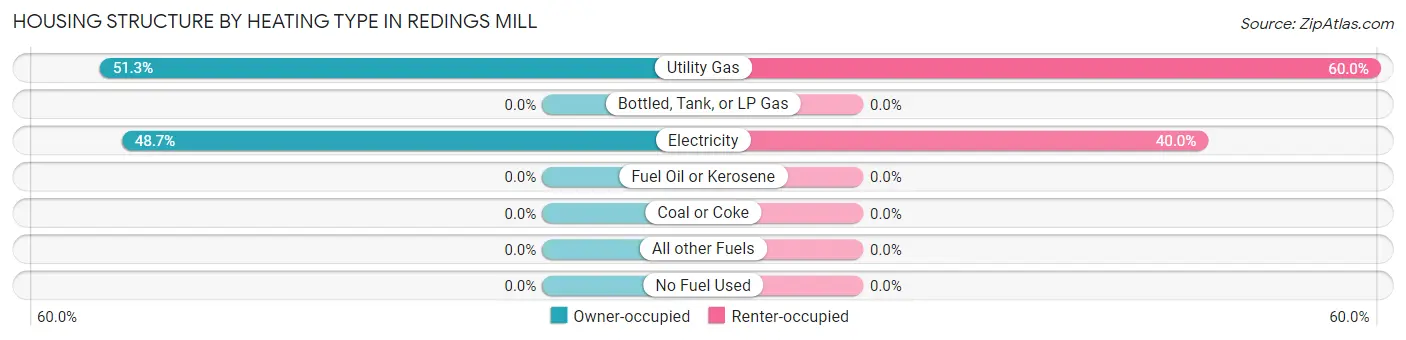
| Heating Type | Owner-occupied | Renter-occupied |
| Utility Gas | 20 (51.3%) | 3 (60.0%) |
| Bottled, Tank, or LP Gas | 0 (0.0%) | 0 (0.0%) |
| Electricity | 19 (48.7%) | 2 (40.0%) |
| Fuel Oil or Kerosene | 0 (0.0%) | 0 (0.0%) |
| Coal or Coke | 0 (0.0%) | 0 (0.0%) |
| All other Fuels | 0 (0.0%) | 0 (0.0%) |
| No Fuel Used | 0 (0.0%) | 0 (0.0%) |
| Total | 39 (100.0%) | 5 (100.0%) |
Household Vehicle Usage in Redings Mill
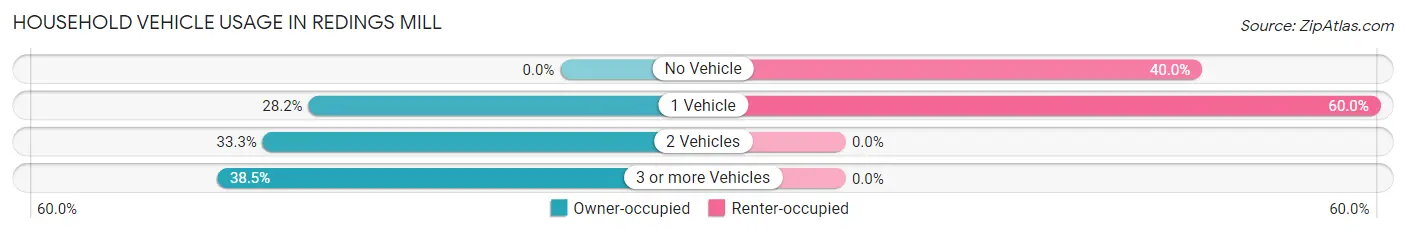
| Vehicles per Household | Owner-occupied | Renter-occupied |
| No Vehicle | 0 (0.0%) | 2 (40.0%) |
| 1 Vehicle | 11 (28.2%) | 3 (60.0%) |
| 2 Vehicles | 13 (33.3%) | 0 (0.0%) |
| 3 or more Vehicles | 15 (38.5%) | 0 (0.0%) |
| Total | 39 (100.0%) | 5 (100.0%) |
Real Estate & Mortgages in Redings Mill
Real Estate and Mortgage Overview in Redings Mill
| Characteristic | Without Mortgage | With Mortgage |
| Housing Units | 13 | 26 |
| Median Property Value | $142,500 | $166,700 |
| Median Household Income | $46,250 | $6 |
| Monthly Housing Costs | $417 | $0 |
| Real Estate Taxes | $1,219 | $13 |
Property Value by Mortgage Status in Redings Mill
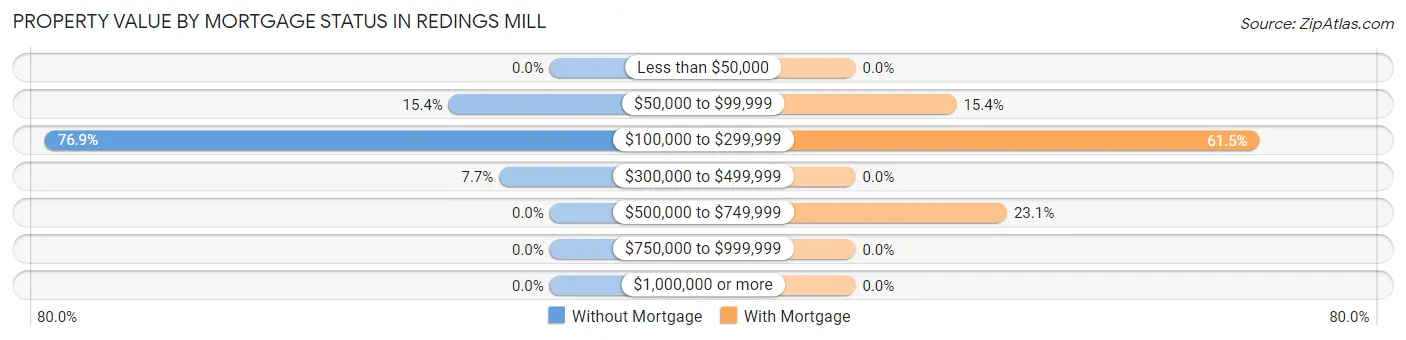
| Property Value | Without Mortgage | With Mortgage |
| Less than $50,000 | 0 (0.0%) | 0 (0.0%) |
| $50,000 to $99,999 | 2 (15.4%) | 4 (15.4%) |
| $100,000 to $299,999 | 10 (76.9%) | 16 (61.5%) |
| $300,000 to $499,999 | 1 (7.7%) | 0 (0.0%) |
| $500,000 to $749,999 | 0 (0.0%) | 6 (23.1%) |
| $750,000 to $999,999 | 0 (0.0%) | 0 (0.0%) |
| $1,000,000 or more | 0 (0.0%) | 0 (0.0%) |
| Total | 13 (100.0%) | 26 (100.0%) |
Household Income by Mortgage Status in Redings Mill
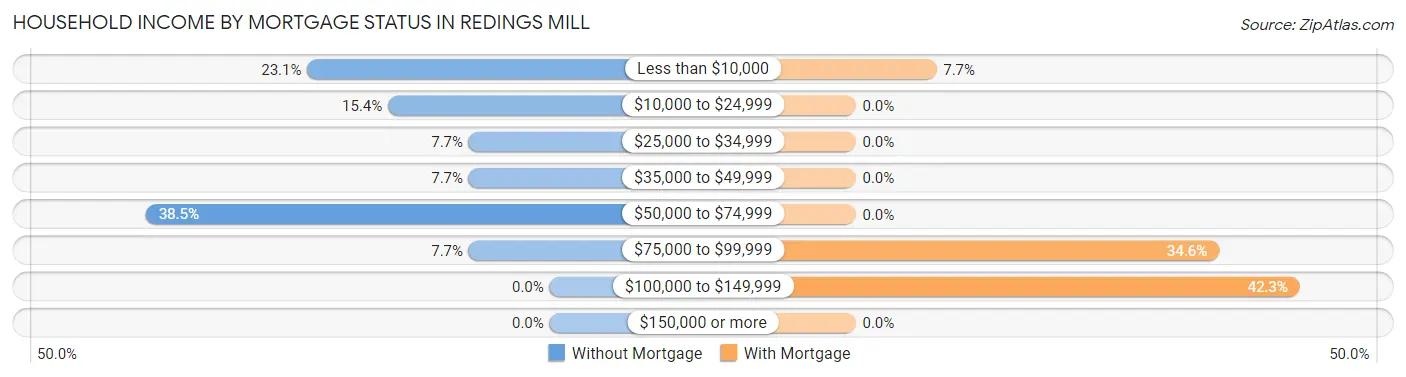
| Household Income | Without Mortgage | With Mortgage |
| Less than $10,000 | 3 (23.1%) | 2 (7.7%) |
| $10,000 to $24,999 | 2 (15.4%) | 0 (0.0%) |
| $25,000 to $34,999 | 1 (7.7%) | 0 (0.0%) |
| $35,000 to $49,999 | 1 (7.7%) | 0 (0.0%) |
| $50,000 to $74,999 | 5 (38.5%) | 0 (0.0%) |
| $75,000 to $99,999 | 1 (7.7%) | 9 (34.6%) |
| $100,000 to $149,999 | 0 (0.0%) | 11 (42.3%) |
| $150,000 or more | 0 (0.0%) | 0 (0.0%) |
| Total | 13 (100.0%) | 26 (100.0%) |
Property Value to Household Income Ratio in Redings Mill
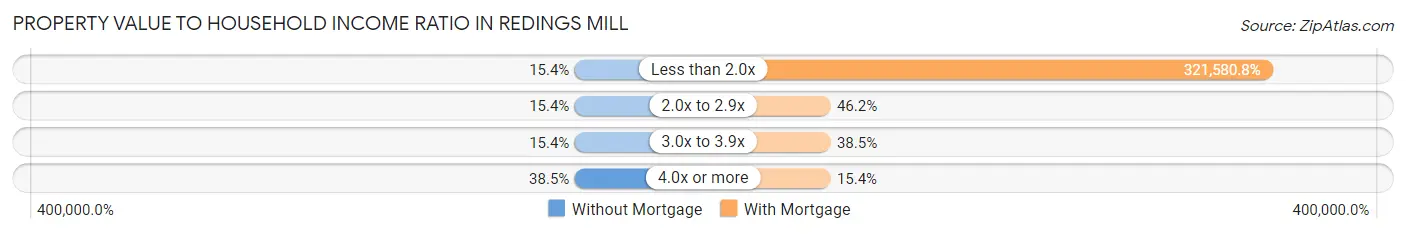
| Value-to-Income Ratio | Without Mortgage | With Mortgage |
| Less than 2.0x | 2 (15.4%) | 83,611 (321,580.8%) |
| 2.0x to 2.9x | 2 (15.4%) | 12 (46.2%) |
| 3.0x to 3.9x | 2 (15.4%) | 10 (38.5%) |
| 4.0x or more | 5 (38.5%) | 4 (15.4%) |
| Total | 13 (100.0%) | 26 (100.0%) |
Real Estate Taxes by Mortgage Status in Redings Mill
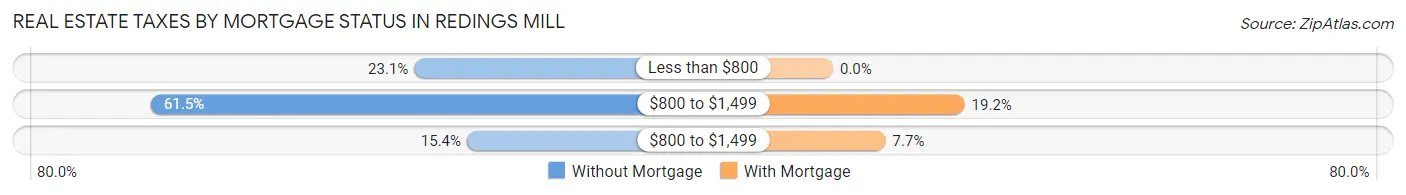
| Property Taxes | Without Mortgage | With Mortgage |
| Less than $800 | 3 (23.1%) | 0 (0.0%) |
| $800 to $1,499 | 8 (61.5%) | 5 (19.2%) |
| $800 to $1,499 | 2 (15.4%) | 2 (7.7%) |
| Total | 13 (100.0%) | 26 (100.0%) |
Health & Disability in Redings Mill
Health Insurance Coverage by Age in Redings Mill
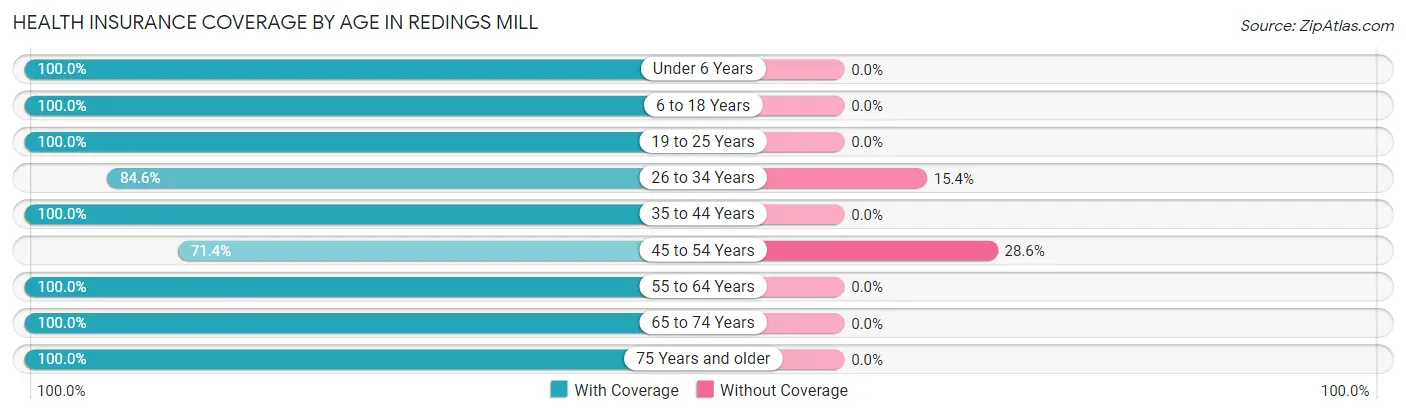
| Age Bracket | With Coverage | Without Coverage |
| Under 6 Years | 18 (100.0%) | 0 (0.0%) |
| 6 to 18 Years | 3 (100.0%) | 0 (0.0%) |
| 19 to 25 Years | 2 (100.0%) | 0 (0.0%) |
| 26 to 34 Years | 22 (84.6%) | 4 (15.4%) |
| 35 to 44 Years | 2 (100.0%) | 0 (0.0%) |
| 45 to 54 Years | 5 (71.4%) | 2 (28.6%) |
| 55 to 64 Years | 15 (100.0%) | 0 (0.0%) |
| 65 to 74 Years | 10 (100.0%) | 0 (0.0%) |
| 75 Years and older | 12 (100.0%) | 0 (0.0%) |
| Total | 89 (93.7%) | 6 (6.3%) |
Health Insurance Coverage by Citizenship Status in Redings Mill
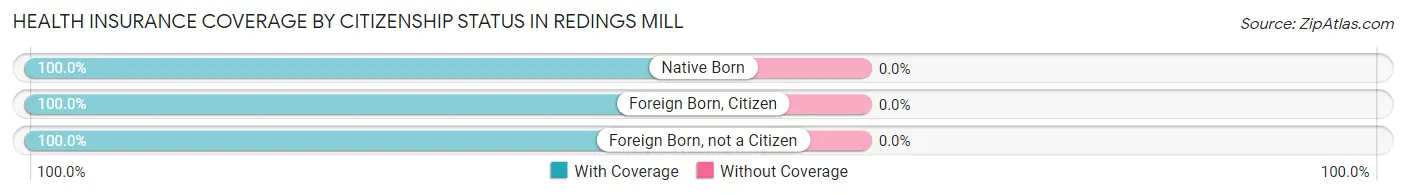
| Citizenship Status | With Coverage | Without Coverage |
| Native Born | 18 (100.0%) | 0 (0.0%) |
| Foreign Born, Citizen | 3 (100.0%) | 0 (0.0%) |
| Foreign Born, not a Citizen | 2 (100.0%) | 0 (0.0%) |
Health Insurance Coverage by Household Income in Redings Mill
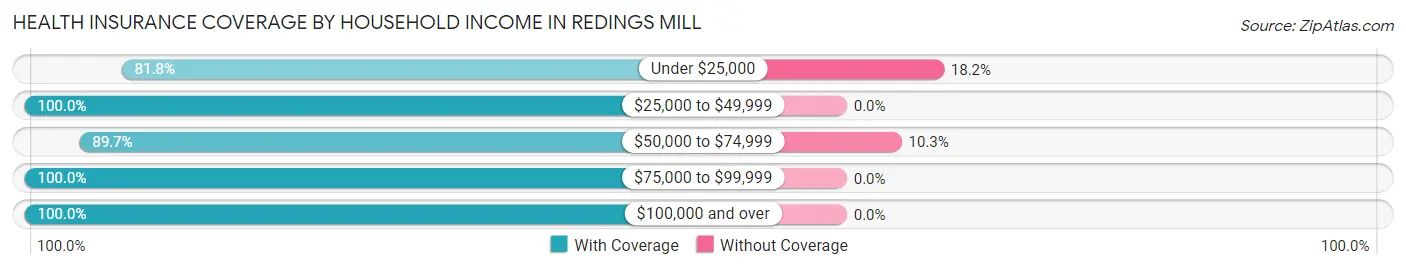
| Household Income | With Coverage | Without Coverage |
| Under $25,000 | 9 (81.8%) | 2 (18.2%) |
| $25,000 to $49,999 | 5 (100.0%) | 0 (0.0%) |
| $50,000 to $74,999 | 35 (89.7%) | 4 (10.3%) |
| $75,000 to $99,999 | 29 (100.0%) | 0 (0.0%) |
| $100,000 and over | 11 (100.0%) | 0 (0.0%) |
Public vs Private Health Insurance Coverage by Age in Redings Mill
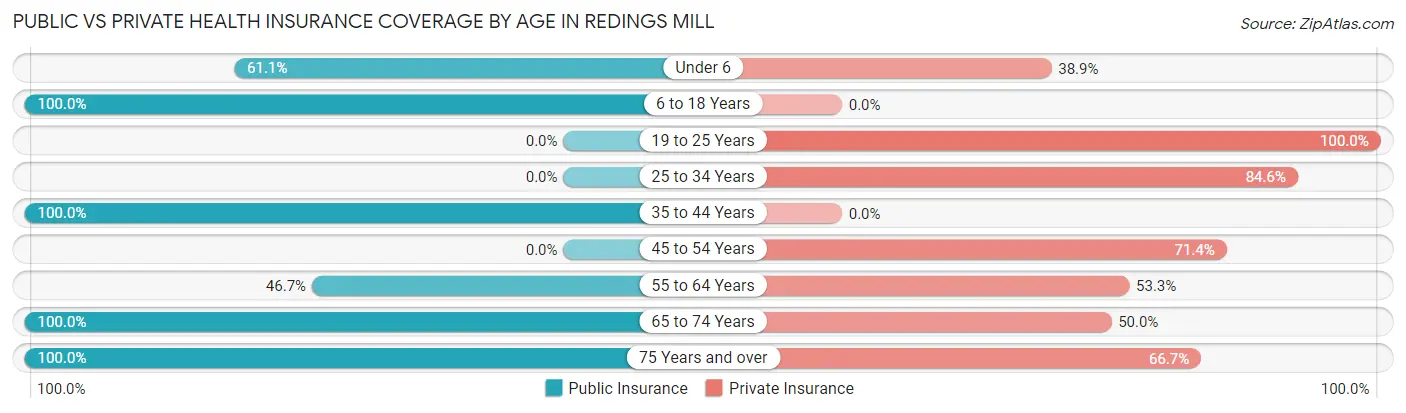
| Age Bracket | Public Insurance | Private Insurance |
| Under 6 | 11 (61.1%) | 7 (38.9%) |
| 6 to 18 Years | 3 (100.0%) | 0 (0.0%) |
| 19 to 25 Years | 0 (0.0%) | 2 (100.0%) |
| 25 to 34 Years | 0 (0.0%) | 22 (84.6%) |
| 35 to 44 Years | 2 (100.0%) | 0 (0.0%) |
| 45 to 54 Years | 0 (0.0%) | 5 (71.4%) |
| 55 to 64 Years | 7 (46.7%) | 8 (53.3%) |
| 65 to 74 Years | 10 (100.0%) | 5 (50.0%) |
| 75 Years and over | 12 (100.0%) | 8 (66.7%) |
| Total | 45 (47.4%) | 57 (60.0%) |
Disability Status by Sex by Age in Redings Mill
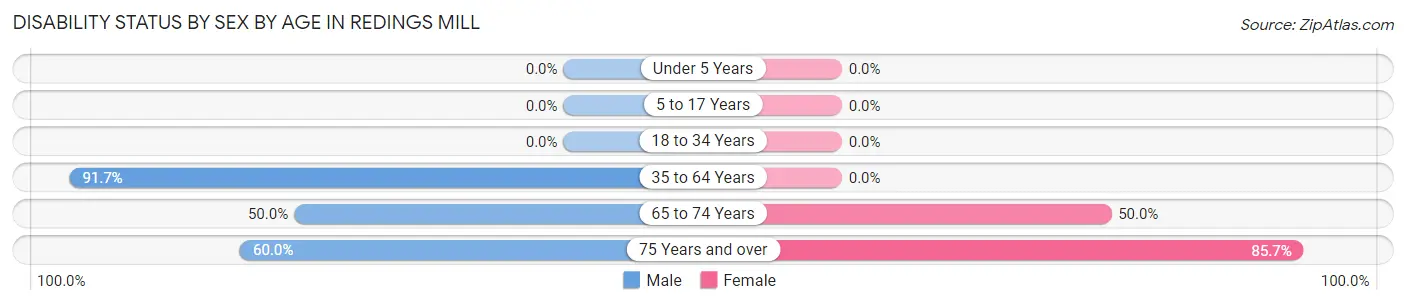
| Age Bracket | Male | Female |
| Under 5 Years | 0 (0.0%) | 0 (0.0%) |
| 5 to 17 Years | 0 (0.0%) | 0 (0.0%) |
| 18 to 34 Years | 0 (0.0%) | 0 (0.0%) |
| 35 to 64 Years | 11 (91.7%) | 0 (0.0%) |
| 65 to 74 Years | 3 (50.0%) | 2 (50.0%) |
| 75 Years and over | 3 (60.0%) | 6 (85.7%) |
Disability Class by Sex by Age in Redings Mill
Disability Class: Hearing Difficulty
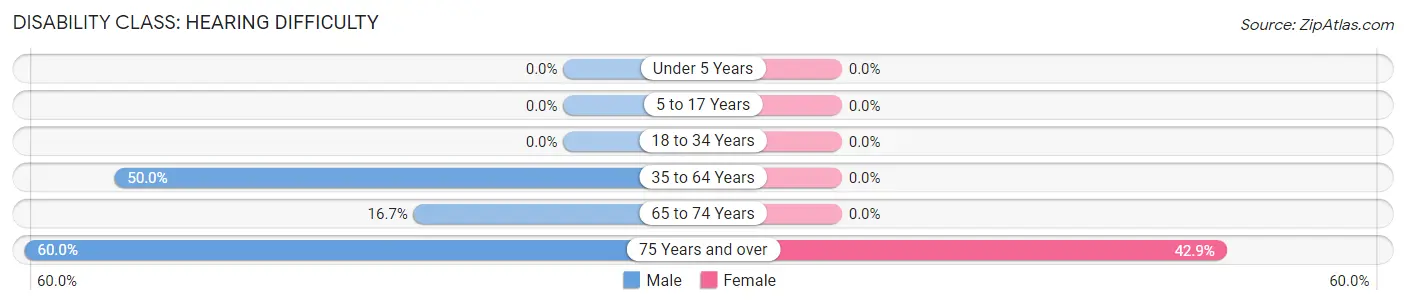
| Age Bracket | Male | Female |
| Under 5 Years | 0 (0.0%) | 0 (0.0%) |
| 5 to 17 Years | 0 (0.0%) | 0 (0.0%) |
| 18 to 34 Years | 0 (0.0%) | 0 (0.0%) |
| 35 to 64 Years | 6 (50.0%) | 0 (0.0%) |
| 65 to 74 Years | 1 (16.7%) | 0 (0.0%) |
| 75 Years and over | 3 (60.0%) | 3 (42.9%) |
Disability Class: Vision Difficulty
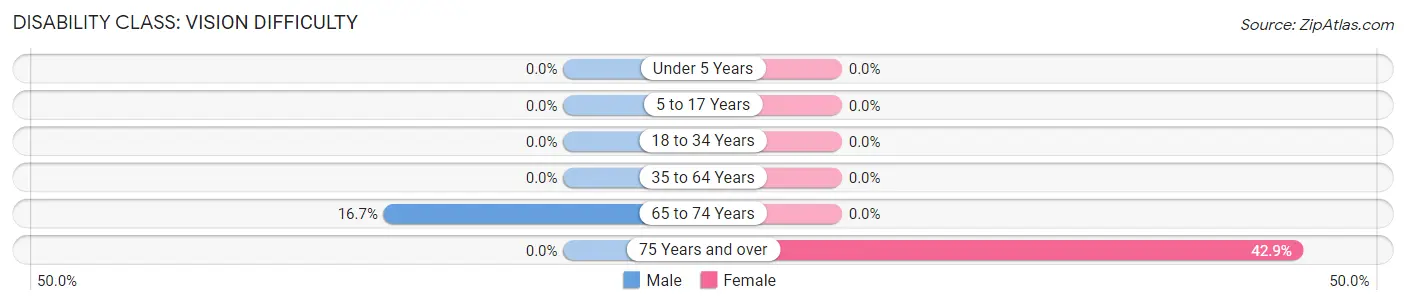
| Age Bracket | Male | Female |
| Under 5 Years | 0 (0.0%) | 0 (0.0%) |
| 5 to 17 Years | 0 (0.0%) | 0 (0.0%) |
| 18 to 34 Years | 0 (0.0%) | 0 (0.0%) |
| 35 to 64 Years | 0 (0.0%) | 0 (0.0%) |
| 65 to 74 Years | 1 (16.7%) | 0 (0.0%) |
| 75 Years and over | 0 (0.0%) | 3 (42.9%) |
Disability Class: Cognitive Difficulty
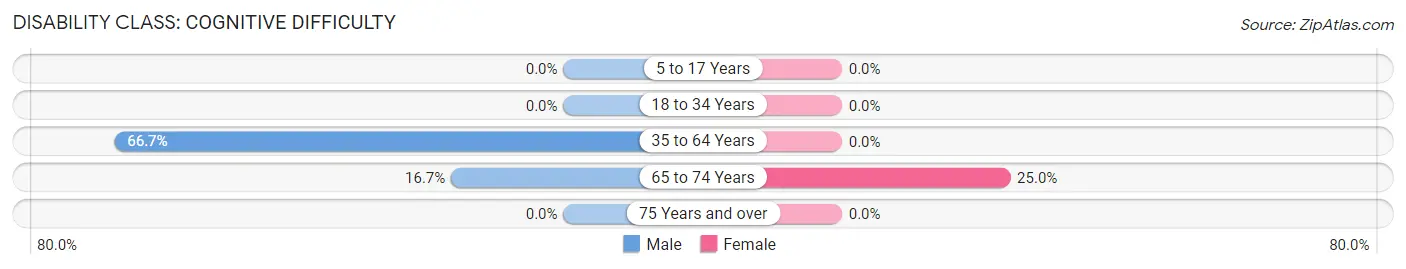
| Age Bracket | Male | Female |
| 5 to 17 Years | 0 (0.0%) | 0 (0.0%) |
| 18 to 34 Years | 0 (0.0%) | 0 (0.0%) |
| 35 to 64 Years | 8 (66.7%) | 0 (0.0%) |
| 65 to 74 Years | 1 (16.7%) | 1 (25.0%) |
| 75 Years and over | 0 (0.0%) | 0 (0.0%) |
Disability Class: Ambulatory Difficulty
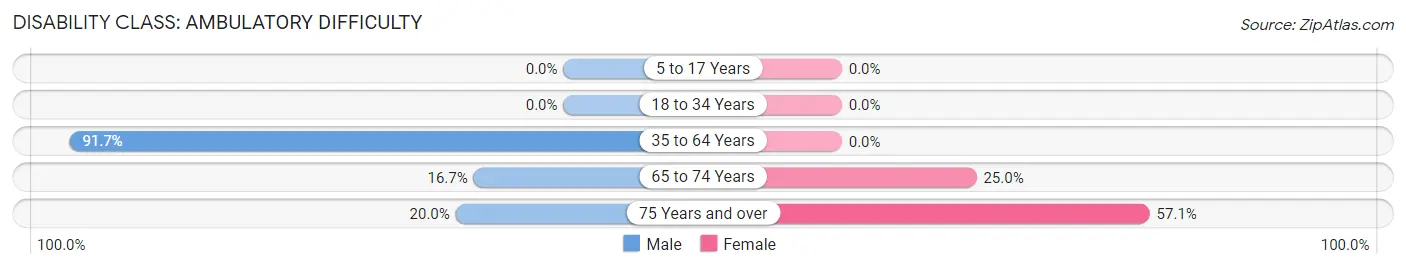
| Age Bracket | Male | Female |
| 5 to 17 Years | 0 (0.0%) | 0 (0.0%) |
| 18 to 34 Years | 0 (0.0%) | 0 (0.0%) |
| 35 to 64 Years | 11 (91.7%) | 0 (0.0%) |
| 65 to 74 Years | 1 (16.7%) | 1 (25.0%) |
| 75 Years and over | 1 (20.0%) | 4 (57.1%) |
Disability Class: Self-Care Difficulty
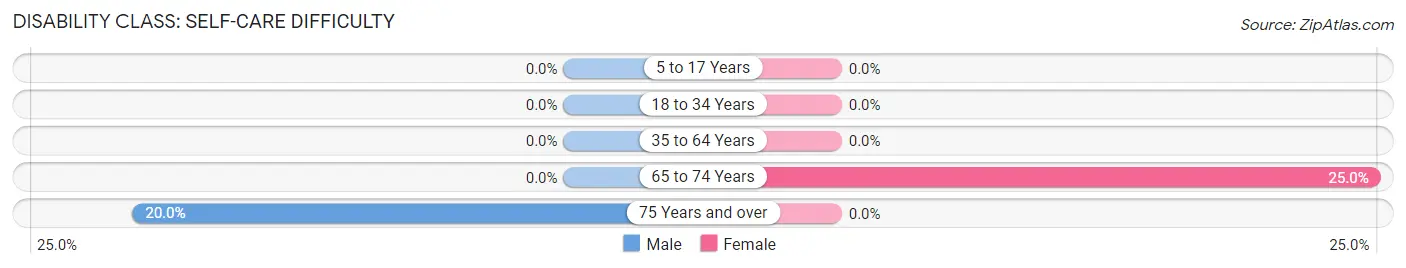
| Age Bracket | Male | Female |
| 5 to 17 Years | 0 (0.0%) | 0 (0.0%) |
| 18 to 34 Years | 0 (0.0%) | 0 (0.0%) |
| 35 to 64 Years | 0 (0.0%) | 0 (0.0%) |
| 65 to 74 Years | 0 (0.0%) | 1 (25.0%) |
| 75 Years and over | 1 (20.0%) | 0 (0.0%) |
Technology Access in Redings Mill
Computing Device Access in Redings Mill
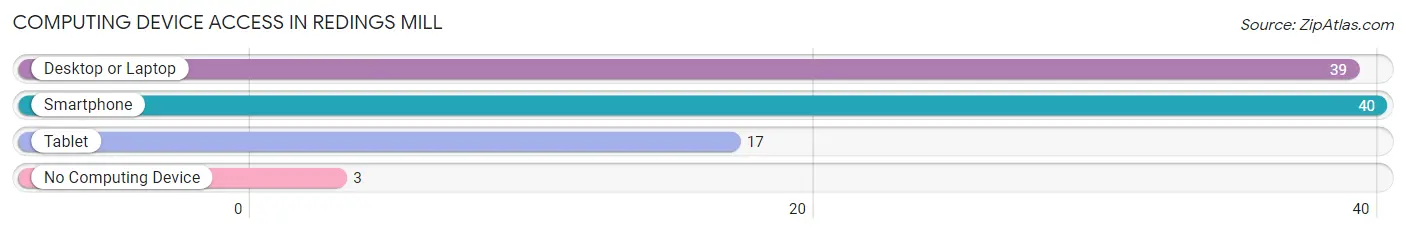
| Device Type | # Households | % Households |
| Desktop or Laptop | 39 | 88.6% |
| Smartphone | 40 | 90.9% |
| Tablet | 17 | 38.6% |
| No Computing Device | 3 | 6.8% |
| Total | 44 | 100.0% |
Internet Access in Redings Mill
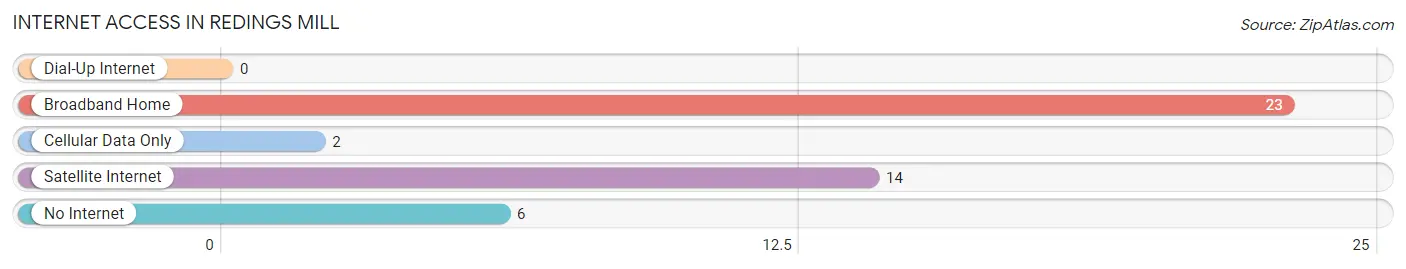
| Internet Type | # Households | % Households |
| Dial-Up Internet | 0 | 0.0% |
| Broadband Home | 23 | 52.3% |
| Cellular Data Only | 2 | 4.5% |
| Satellite Internet | 14 | 31.8% |
| No Internet | 6 | 13.6% |
| Total | 44 | 100.0% |
Redings Mill Summary
Redings Mill is a small unincorporated community located in Newton County, Missouri, United States. It is situated along the banks of the Little Osage River, approximately five miles south of Neosho. The community was founded in 1871 by William Reding, a German immigrant who had settled in the area in 1867.
History
William Reding was born in Germany in 1837 and immigrated to the United States in 1867. He settled in Newton County, Missouri, and purchased a tract of land along the Little Osage River. He built a mill on the property and began to operate it in 1871. The mill was used to grind grain and saw lumber, and it quickly became a popular destination for local farmers.
In 1872, Reding platted the town of Redings Mill and began to sell lots. The town grew quickly, and by 1880 it had a population of over 200 people. The town had a post office, a general store, a blacksmith shop, a school, and several churches.
In the early 1900s, the town began to decline as the railroad bypassed it and the mill closed. By the 1950s, the population had dropped to just over 100 people. Today, Redings Mill is a small, unincorporated community with a population of around 50 people.
Geography
Redings Mill is located in Newton County, Missouri, approximately five miles south of Neosho. The town is situated along the banks of the Little Osage River, which flows through the area. The town is surrounded by rolling hills and wooded areas, and is located in the Ozark Mountains.
The climate in Redings Mill is humid subtropical, with hot, humid summers and mild winters. The average annual temperature is around 60°F (15°C), and the average annual precipitation is around 40 inches (101 cm).
Economy
The economy of Redings Mill is largely based on agriculture. The town is surrounded by farmland, and many of the residents are involved in farming and ranching. The town also has a few small businesses, including a general store and a gas station.
Demographics
As of the 2010 census, the population of Redings Mill was 50 people. The racial makeup of the town was 97.0% White, 0.0% African American, 0.0% Native American, 0.0% Asian, 0.0% Pacific Islander, 0.0% from other races, and 3.0% from two or more races. Hispanic or Latino of any race were 0.0% of the population.
The median income for a household in Redings Mill was $30,000, and the median income for a family was $35,000. The per capita income for the town was $14,000. About 10.0% of families and 11.0% of the population were below the poverty line, including 16.7% of those under the age of 18 and none of those 65 or over.
Common Questions
What is Per Capita Income in Redings Mill?
Per Capita income in Redings Mill is $40,148.
What is the Median Family Income in Redings Mill?
Median Family Income in Redings Mill is $82,625.
What is the Median Household income in Redings Mill?
Median Household Income in Redings Mill is $65,625.
What is Inequality or Gini Index in Redings Mill?
Inequality or Gini Index in Redings Mill is 0.50.
What is the Total Population of Redings Mill?
Total Population of Redings Mill is 95.
What is the Total Male Population of Redings Mill?
Total Male Population of Redings Mill is 50.
What is the Total Female Population of Redings Mill?
Total Female Population of Redings Mill is 45.
What is the Ratio of Males per 100 Females in Redings Mill?
There are 111.11 Males per 100 Females in Redings Mill.
What is the Ratio of Females per 100 Males in Redings Mill?
There are 90.00 Females per 100 Males in Redings Mill.
What is the Median Population Age in Redings Mill?
Median Population Age in Redings Mill is 31.8 Years.
What is the Average Family Size in Redings Mill
Average Family Size in Redings Mill is 2.6 People.
What is the Average Household Size in Redings Mill
Average Household Size in Redings Mill is 2.2 People.
How Large is the Labor Force in Redings Mill?
There are 34 People in the Labor Forcein in Redings Mill.
What is the Percentage of People in the Labor Force in Redings Mill?
45.9% of People are in the Labor Force in Redings Mill.
What is the Unemployment Rate in Redings Mill?
Unemployment Rate in Redings Mill is 2.9%.