New Amsterdam, IN Map & Demographics
New Amsterdam Map
New Amsterdam Overview
$33,138
PER CAPITA INCOME
$103,565
AVG FAMILY INCOME
$103,565
AVG HOUSEHOLD INCOME
0.06
INEQUALITY / GINI INDEX
100
TOTAL POPULATION
70
MALE POPULATION
30
FEMALE POPULATION
233.33
MALES / 100 FEMALES
42.86
FEMALES / 100 MALES
50.3
MEDIAN AGE
3.2
AVG FAMILY SIZE
3.2
AVG HOUSEHOLD SIZE
95
LABOR FORCE [ PEOPLE ]
96.0%
PERCENT IN LABOR FORCE
2.1%
UNEMPLOYMENT RATE
New Amsterdam Area Codes
Income in New Amsterdam
Income Overview in New Amsterdam
Per Capita Income in New Amsterdam is $33,138, while median incomes of families and households are $103,565 and $103,565 respectively.
| Characteristic | Number | Measure |
| Per Capita Income | 100 | $33,138 |
| Median Family Income | 31 | $103,565 |
| Mean Family Income | 31 | $97,329 |
| Median Household Income | 31 | $103,565 |
| Mean Household Income | 31 | $97,329 |
| Income Deficit | 31 | $0 |
| Wage / Income Gap (%) | 100 | 0.00% |
| Wage / Income Gap ($) | 100 | 100.00¢ per $1 |
| Gini / Inequality Index | 100 | 0.06 |
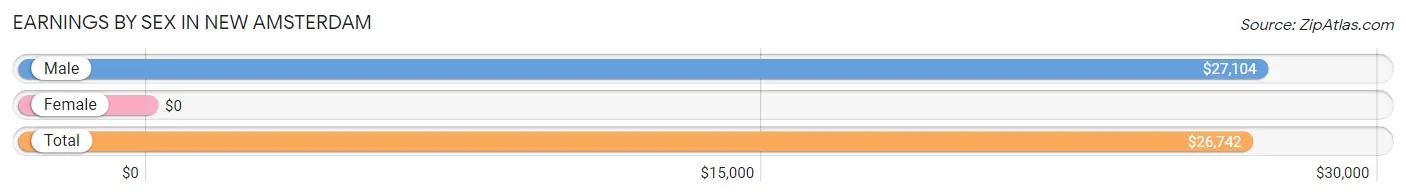
Earnings by Sex in New Amsterdam
| Sex | Number | Average Earnings |
| Male | 69 (71.9%) | $27,104 |
| Female | 27 (28.1%) | $0 |
| Total | 96 (100.0%) | $26,742 |
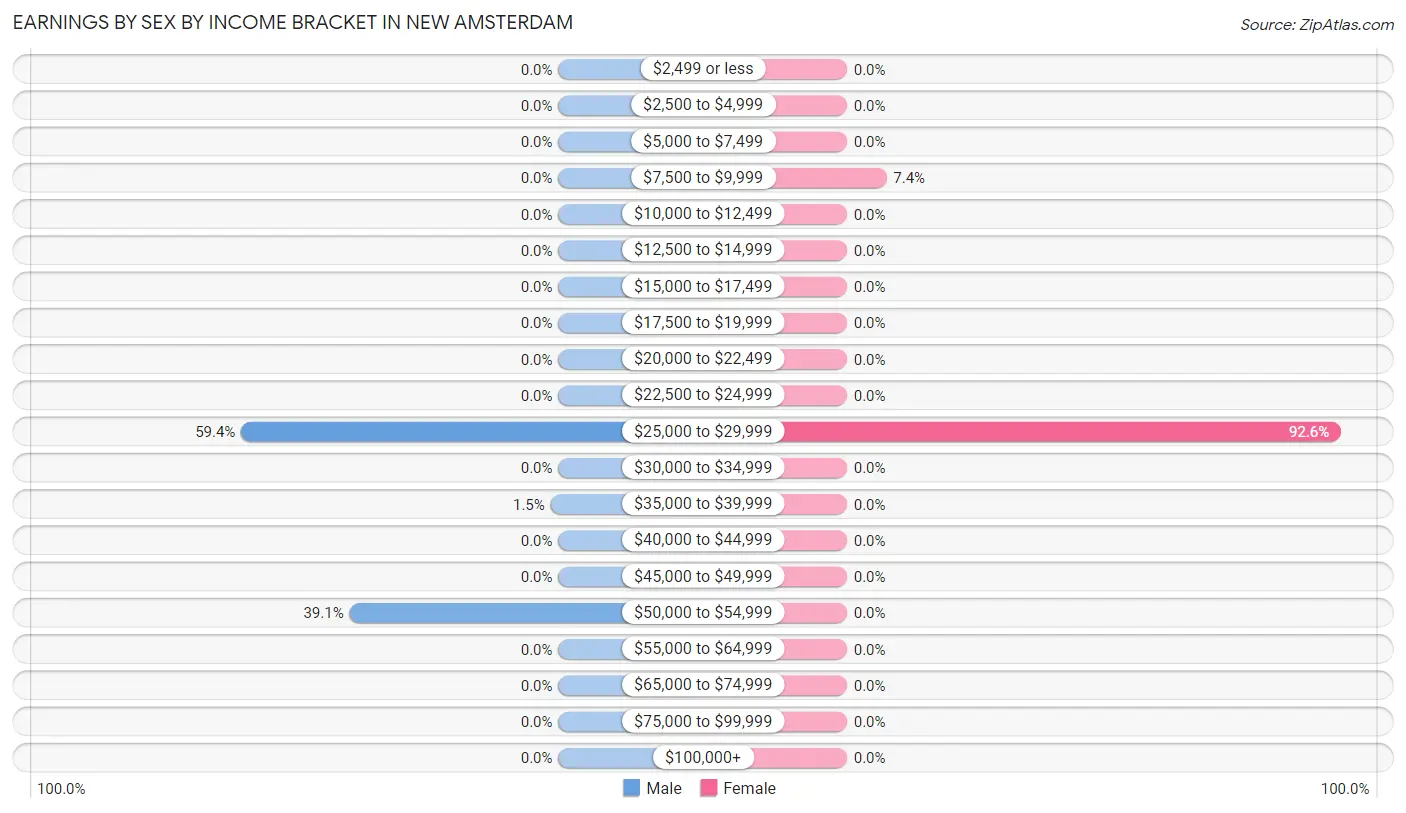
Earnings by Sex by Income Bracket in New Amsterdam
The most common earnings brackets in New Amsterdam are $25,000 to $29,999 for men (41 | 59.4%) and $25,000 to $29,999 for women (25 | 92.6%).
| Income | Male | Female |
| $2,499 or less | 0 (0.0%) | 0 (0.0%) |
| $2,500 to $4,999 | 0 (0.0%) | 0 (0.0%) |
| $5,000 to $7,499 | 0 (0.0%) | 0 (0.0%) |
| $7,500 to $9,999 | 0 (0.0%) | 2 (7.4%) |
| $10,000 to $12,499 | 0 (0.0%) | 0 (0.0%) |
| $12,500 to $14,999 | 0 (0.0%) | 0 (0.0%) |
| $15,000 to $17,499 | 0 (0.0%) | 0 (0.0%) |
| $17,500 to $19,999 | 0 (0.0%) | 0 (0.0%) |
| $20,000 to $22,499 | 0 (0.0%) | 0 (0.0%) |
| $22,500 to $24,999 | 0 (0.0%) | 0 (0.0%) |
| $25,000 to $29,999 | 41 (59.4%) | 25 (92.6%) |
| $30,000 to $34,999 | 0 (0.0%) | 0 (0.0%) |
| $35,000 to $39,999 | 1 (1.5%) | 0 (0.0%) |
| $40,000 to $44,999 | 0 (0.0%) | 0 (0.0%) |
| $45,000 to $49,999 | 0 (0.0%) | 0 (0.0%) |
| $50,000 to $54,999 | 27 (39.1%) | 0 (0.0%) |
| $55,000 to $64,999 | 0 (0.0%) | 0 (0.0%) |
| $65,000 to $74,999 | 0 (0.0%) | 0 (0.0%) |
| $75,000 to $99,999 | 0 (0.0%) | 0 (0.0%) |
| $100,000+ | 0 (0.0%) | 0 (0.0%) |
| Total | 69 (100.0%) | 27 (100.0%) |
Earnings by Sex by Educational Attainment in New Amsterdam
| Educational Attainment | Male Income | Female Income |
| Less than High School | - | - |
| High School Diploma | - | - |
| College or Associate's Degree | - | - |
| Bachelor's Degree | - | - |
| Graduate Degree | - | - |
| Total | - | - |
Family Income in New Amsterdam
Family Income Brackets in New Amsterdam
According to the New Amsterdam family income data, there are 27 families falling into the $100,000 to $149,999 income range, which is the most common income bracket and makes up 87.1% of all families.
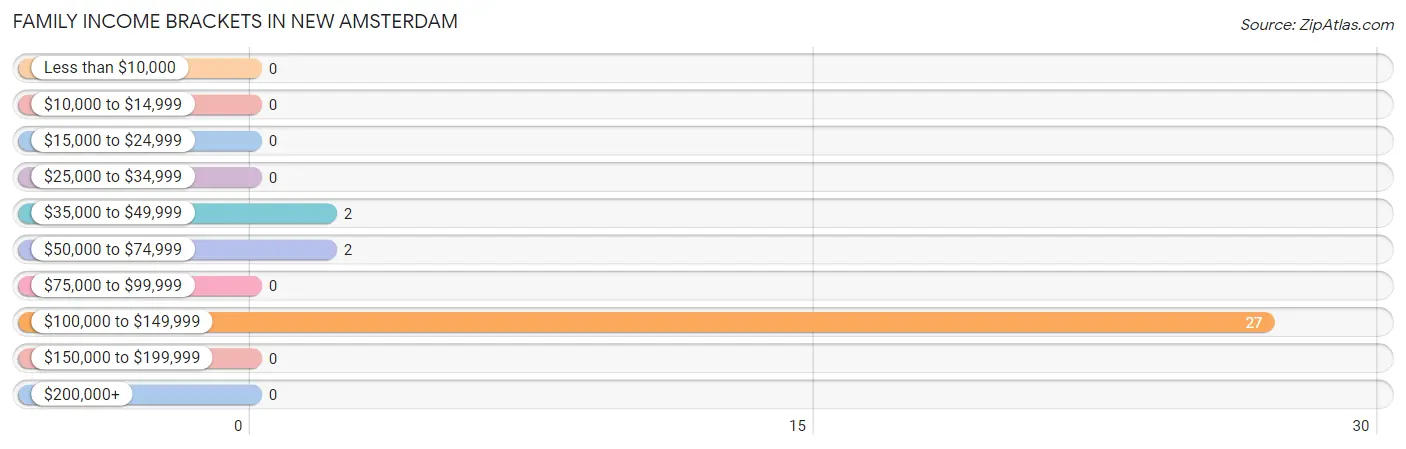
| Income Bracket | # Families | % Families |
| Less than $10,000 | 0 | 0.0% |
| $10,000 to $14,999 | 0 | 0.0% |
| $15,000 to $24,999 | 0 | 0.0% |
| $25,000 to $34,999 | 0 | 0.0% |
| $35,000 to $49,999 | 2 | 6.5% |
| $50,000 to $74,999 | 2 | 6.5% |
| $75,000 to $99,999 | 0 | 0.0% |
| $100,000 to $149,999 | 27 | 87.1% |
| $150,000 to $199,999 | 0 | 0.0% |
| $200,000+ | 0 | 0.0% |
Family Income by Famaliy Size in New Amsterdam
2-person families (4 | 12.9%) account for the highest median family income in New Amsterdam with $52,500 per family, while 2-person families (4 | 12.9%) have the highest median income of $26,250 per family member.
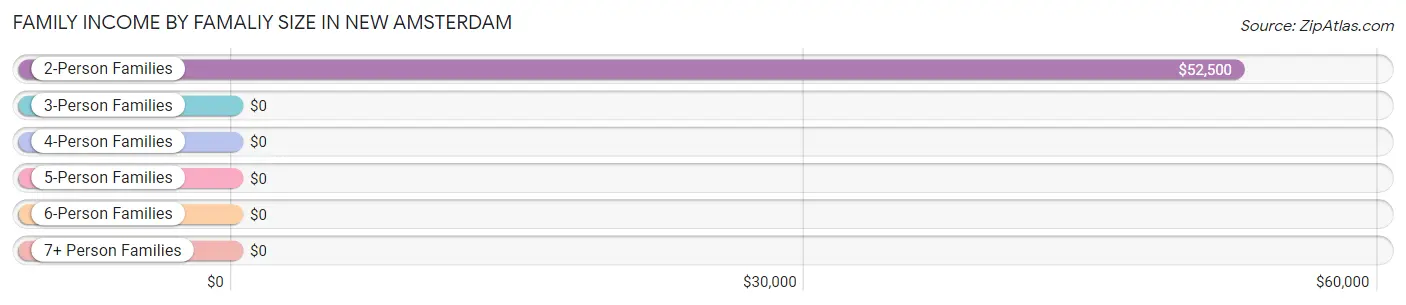
| Income Bracket | # Families | Median Income |
| 2-Person Families | 4 (12.9%) | $52,500 |
| 3-Person Families | 27 (87.1%) | $0 |
| 4-Person Families | 0 (0.0%) | $0 |
| 5-Person Families | 0 (0.0%) | $0 |
| 6-Person Families | 0 (0.0%) | $0 |
| 7+ Person Families | 0 (0.0%) | $0 |
| Total | 31 (100.0%) | $103,565 |
Family Income by Number of Earners in New Amsterdam
| Number of Earners | # Families | Median Income |
| No Earners | 1 (3.2%) | $0 |
| 1 Earner | 3 (9.7%) | $0 |
| 2 Earners | 0 (0.0%) | $0 |
| 3+ Earners | 27 (87.1%) | $0 |
| Total | 31 (100.0%) | $103,565 |
Household Income in New Amsterdam
Household Income Brackets in New Amsterdam
With 27 households falling in the category, the $100,000 to $149,999 income range is the most frequent in New Amsterdam, accounting for 87.1% of all households.
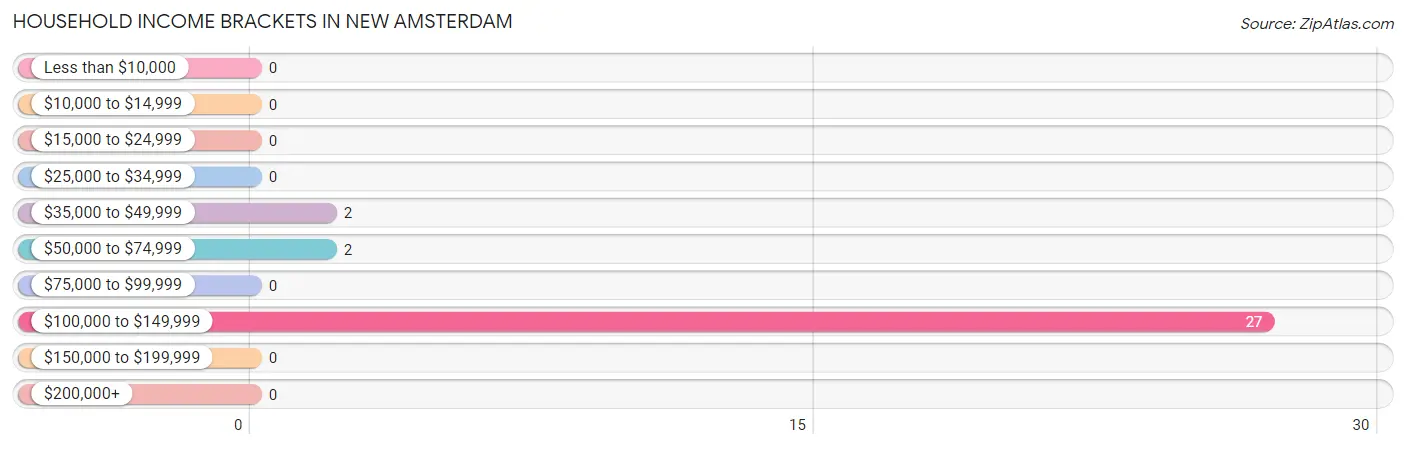
| Income Bracket | # Households | % Households |
| Less than $10,000 | 0 | 0.0% |
| $10,000 to $14,999 | 0 | 0.0% |
| $15,000 to $24,999 | 0 | 0.0% |
| $25,000 to $34,999 | 0 | 0.0% |
| $35,000 to $49,999 | 2 | 6.5% |
| $50,000 to $74,999 | 2 | 6.5% |
| $75,000 to $99,999 | 0 | 0.0% |
| $100,000 to $149,999 | 27 | 87.1% |
| $150,000 to $199,999 | 0 | 0.0% |
| $200,000+ | 0 | 0.0% |
Household Income by Householder Age in New Amsterdam
The median household income in New Amsterdam is $103,565, with the highest median household income of $52,500 found in the 65+ years age bracket for the primary householder. A total of 4 households (12.9%) fall into this category.
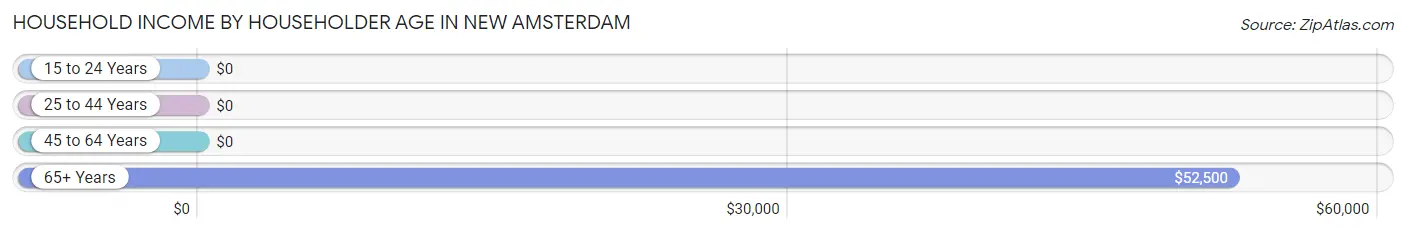
| Income Bracket | # Households | Median Income |
| 15 to 24 Years | 0 (0.0%) | $0 |
| 25 to 44 Years | 0 (0.0%) | $0 |
| 45 to 64 Years | 27 (87.1%) | $0 |
| 65+ Years | 4 (12.9%) | $52,500 |
| Total | 31 (100.0%) | $103,565 |
Poverty in New Amsterdam
Income Below Poverty by Sex and Age in New Amsterdam
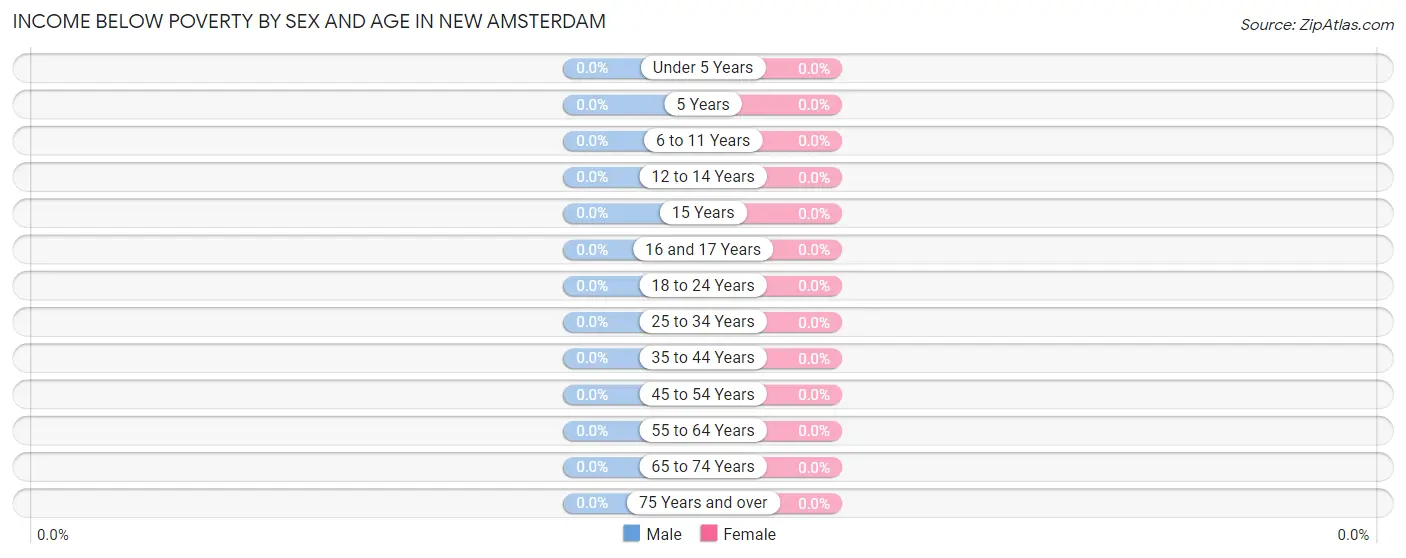
| Age Bracket | Male | Female |
| Under 5 Years | 0 (0.0%) | 0 (0.0%) |
| 5 Years | 0 (0.0%) | 0 (0.0%) |
| 6 to 11 Years | 0 (0.0%) | 0 (0.0%) |
| 12 to 14 Years | 0 (0.0%) | 0 (0.0%) |
| 15 Years | 0 (0.0%) | 0 (0.0%) |
| 16 and 17 Years | 0 (0.0%) | 0 (0.0%) |
| 18 to 24 Years | 0 (0.0%) | 0 (0.0%) |
| 25 to 34 Years | 0 (0.0%) | 0 (0.0%) |
| 35 to 44 Years | 0 (0.0%) | 0 (0.0%) |
| 45 to 54 Years | 0 (0.0%) | 0 (0.0%) |
| 55 to 64 Years | 0 (0.0%) | 0 (0.0%) |
| 65 to 74 Years | 0 (0.0%) | 0 (0.0%) |
| 75 Years and over | 0 (0.0%) | 0 (0.0%) |
| Total | 0 (0.0%) | 0 (0.0%) |
Income Above Poverty by Sex and Age in New Amsterdam
According to the poverty statistics in New Amsterdam, males aged 18 to 24 years and females aged under 5 years are the age groups that are most secure financially, with 100.0% of males and 100.0% of females in these age groups living above the poverty line.
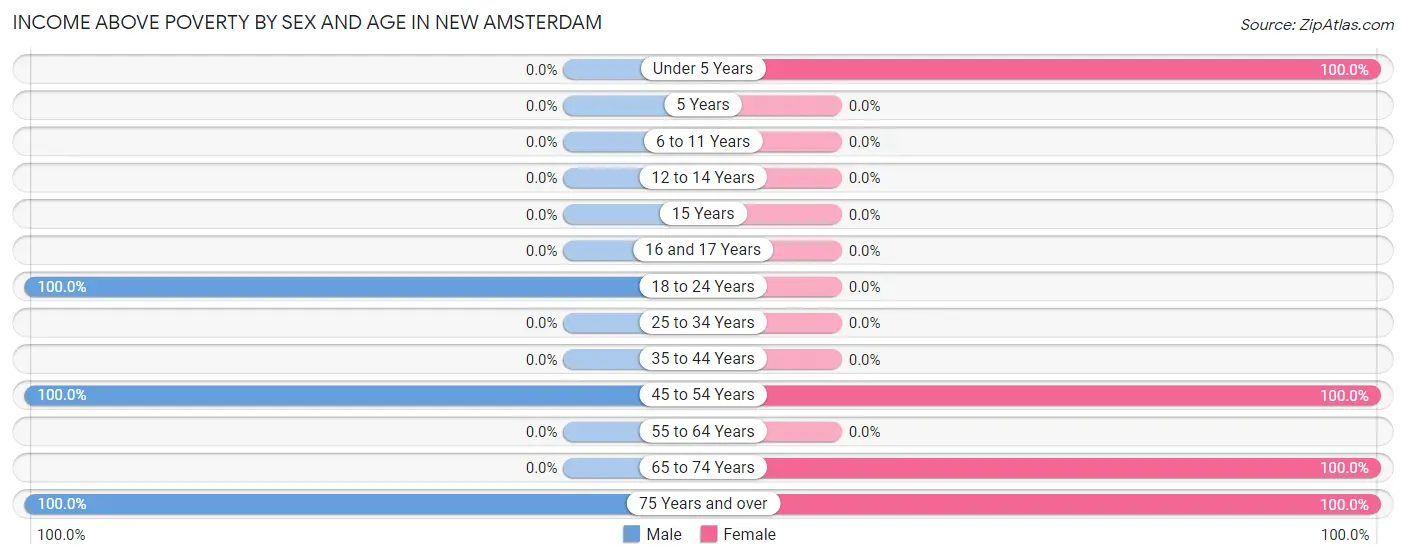
| Age Bracket | Male | Female |
| Under 5 Years | 0 (0.0%) | 1 (100.0%) |
| 5 Years | 0 (0.0%) | 0 (0.0%) |
| 6 to 11 Years | 0 (0.0%) | 0 (0.0%) |
| 12 to 14 Years | 0 (0.0%) | 0 (0.0%) |
| 15 Years | 0 (0.0%) | 0 (0.0%) |
| 16 and 17 Years | 0 (0.0%) | 0 (0.0%) |
| 18 to 24 Years | 41 (100.0%) | 0 (0.0%) |
| 25 to 34 Years | 0 (0.0%) | 0 (0.0%) |
| 35 to 44 Years | 0 (0.0%) | 0 (0.0%) |
| 45 to 54 Years | 27 (100.0%) | 25 (100.0%) |
| 55 to 64 Years | 0 (0.0%) | 0 (0.0%) |
| 65 to 74 Years | 0 (0.0%) | 1 (100.0%) |
| 75 Years and over | 2 (100.0%) | 3 (100.0%) |
| Total | 70 (100.0%) | 30 (100.0%) |
Income Below Poverty Among Married-Couple Families in New Amsterdam
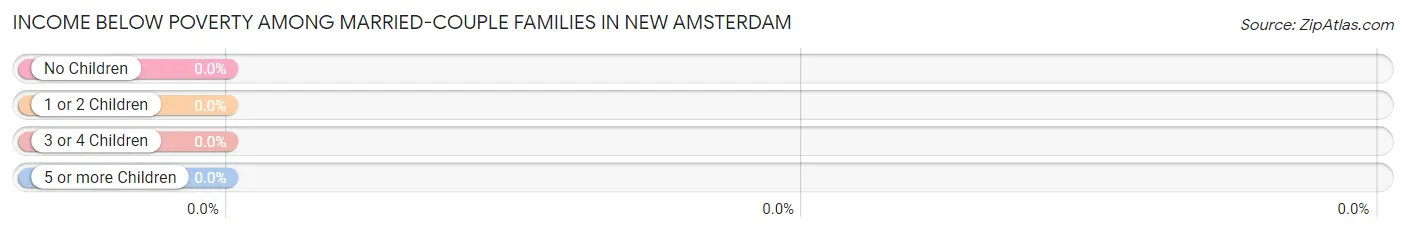
| Children | Above Poverty | Below Poverty |
| No Children | 29 (100.0%) | 0 (0.0%) |
| 1 or 2 Children | 0 (0.0%) | 0 (0.0%) |
| 3 or 4 Children | 0 (0.0%) | 0 (0.0%) |
| 5 or more Children | 0 (0.0%) | 0 (0.0%) |
| Total | 29 (100.0%) | 0 (0.0%) |
Income Below Poverty Among Single-Parent Households in New Amsterdam
| Children | Single Father | Single Mother |
| No Children | 0 (0.0%) | 0 (0.0%) |
| 1 or 2 Children | 0 (0.0%) | 0 (0.0%) |
| 3 or 4 Children | 0 (0.0%) | 0 (0.0%) |
| 5 or more Children | 0 (0.0%) | 0 (0.0%) |
| Total | 0 (0.0%) | 0 (0.0%) |
Income Below Poverty Among Married-Couple vs Single-Parent Households in New Amsterdam
| Children | Married-Couple Families | Single-Parent Households |
| No Children | 0 (0.0%) | 0 (0.0%) |
| 1 or 2 Children | 0 (0.0%) | 0 (0.0%) |
| 3 or 4 Children | 0 (0.0%) | 0 (0.0%) |
| 5 or more Children | 0 (0.0%) | 0 (0.0%) |
| Total | 0 (0.0%) | 0 (0.0%) |
Race in New Amsterdam
The most populous races in New Amsterdam are , and White / Caucasian (100 | 100.0%).
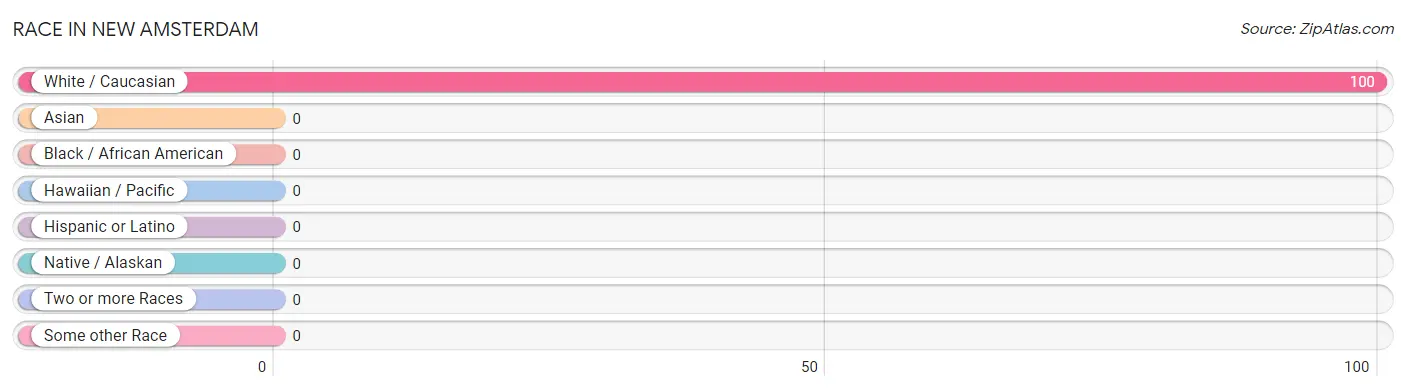
| Race | # Population | % Population |
| Asian | 0 | 0.0% |
| Black / African American | 0 | 0.0% |
| Hawaiian / Pacific | 0 | 0.0% |
| Hispanic or Latino | 0 | 0.0% |
| Native / Alaskan | 0 | 0.0% |
| White / Caucasian | 100 | 100.0% |
| Two or more Races | 0 | 0.0% |
| Some other Race | 0 | 0.0% |
| Total | 100 | 100.0% |
Ancestry in New Amsterdam
The most populous ancestries reported in New Amsterdam are English (95 | 95.0%), Welsh (95 | 95.0%), and American (2 | 2.0%), together accounting for 192.0% of all New Amsterdam residents.
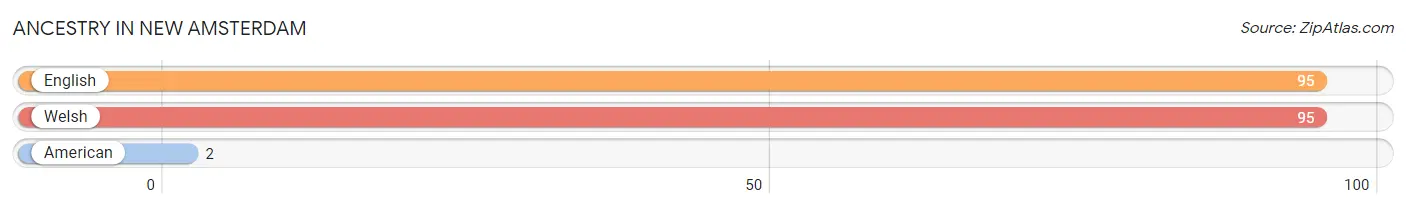
| Ancestry | # Population | % Population |
| American | 2 | 2.0% |
| English | 95 | 95.0% |
| Welsh | 95 | 95.0% | View All 3 Rows |
Immigrants in New Amsterdam

| Immigration Origin | # Population | % Population | View All 0 Rows |
Sex and Age in New Amsterdam
Sex and Age in New Amsterdam
The most populous age groups in New Amsterdam are 20 to 24 Years (41 | 58.6%) for men and 50 to 54 Years (25 | 83.3%) for women.
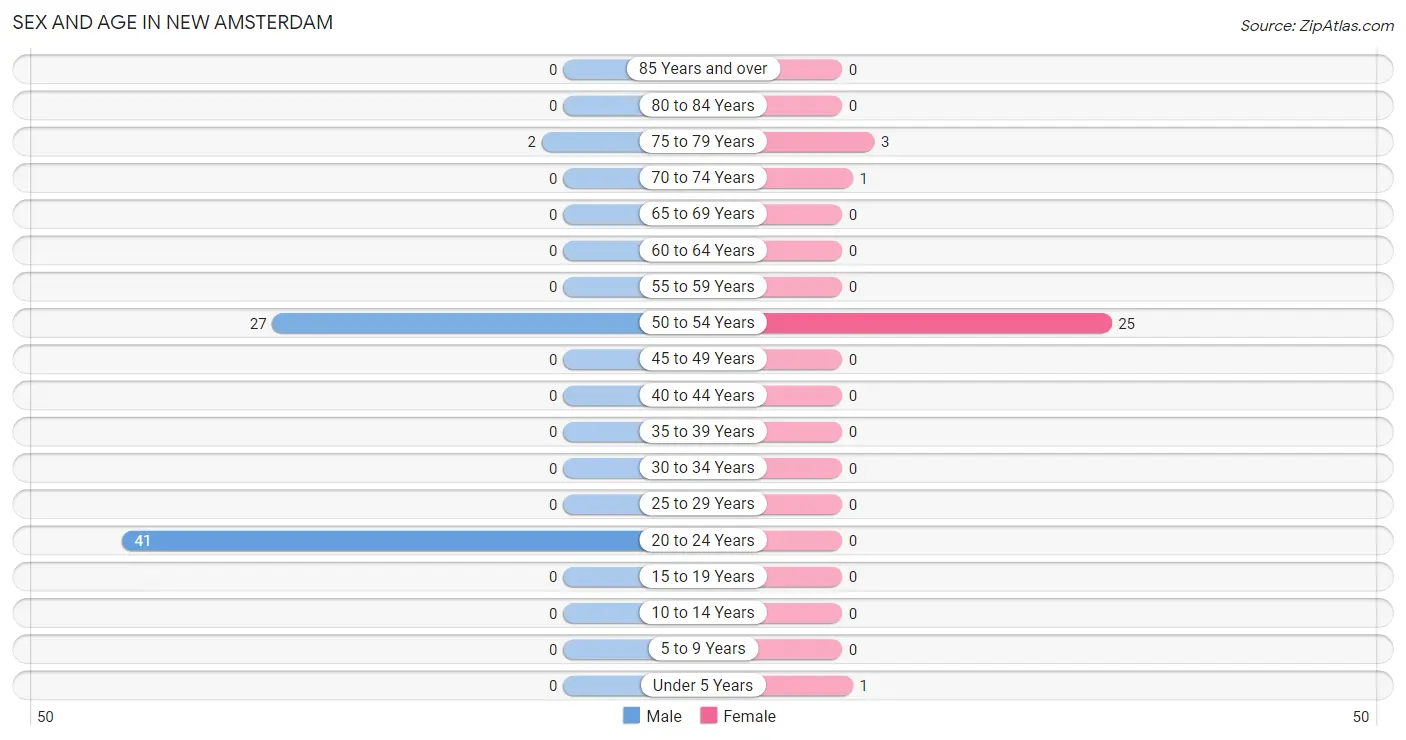
| Age Bracket | Male | Female |
| Under 5 Years | 0 (0.0%) | 1 (3.3%) |
| 5 to 9 Years | 0 (0.0%) | 0 (0.0%) |
| 10 to 14 Years | 0 (0.0%) | 0 (0.0%) |
| 15 to 19 Years | 0 (0.0%) | 0 (0.0%) |
| 20 to 24 Years | 41 (58.6%) | 0 (0.0%) |
| 25 to 29 Years | 0 (0.0%) | 0 (0.0%) |
| 30 to 34 Years | 0 (0.0%) | 0 (0.0%) |
| 35 to 39 Years | 0 (0.0%) | 0 (0.0%) |
| 40 to 44 Years | 0 (0.0%) | 0 (0.0%) |
| 45 to 49 Years | 0 (0.0%) | 0 (0.0%) |
| 50 to 54 Years | 27 (38.6%) | 25 (83.3%) |
| 55 to 59 Years | 0 (0.0%) | 0 (0.0%) |
| 60 to 64 Years | 0 (0.0%) | 0 (0.0%) |
| 65 to 69 Years | 0 (0.0%) | 0 (0.0%) |
| 70 to 74 Years | 0 (0.0%) | 1 (3.3%) |
| 75 to 79 Years | 2 (2.9%) | 3 (10.0%) |
| 80 to 84 Years | 0 (0.0%) | 0 (0.0%) |
| 85 Years and over | 0 (0.0%) | 0 (0.0%) |
| Total | 70 (100.0%) | 30 (100.0%) |
Families and Households in New Amsterdam
Median Family Size in New Amsterdam
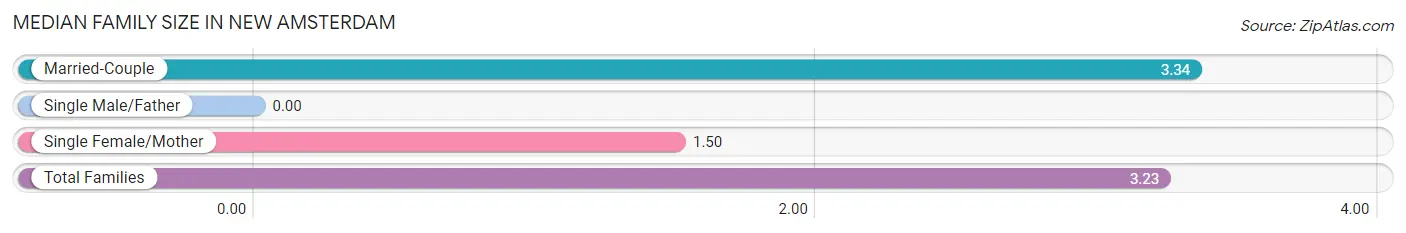
| Family Type | # Families | Family Size |
| Married-Couple | 29 (93.5%) | 3.34 |
| Single Male/Father | 0 (0.0%) | - |
| Single Female/Mother | 2 (6.5%) | 1.50 |
| Total Families | 31 (100.0%) | 3.23 |
Median Household Size in New Amsterdam
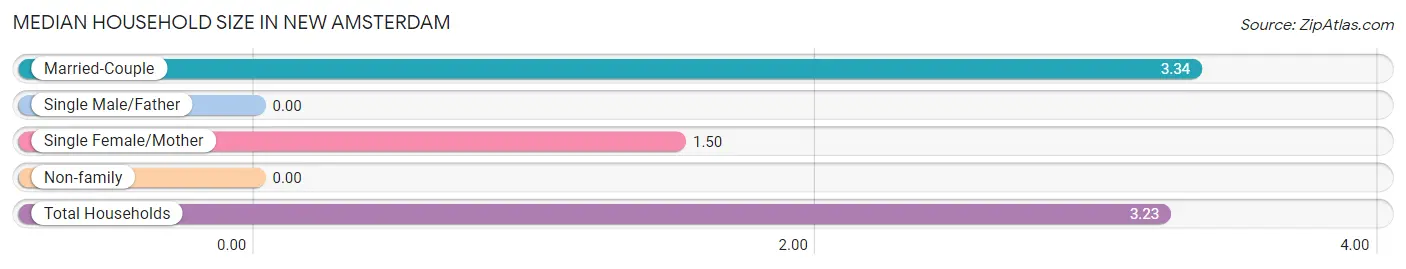
| Household Type | # Households | Household Size |
| Married-Couple | 29 (93.5%) | 3.34 |
| Single Male/Father | 0 (0.0%) | - |
| Single Female/Mother | 2 (6.5%) | 1.50 |
| Non-family | 0 (0.0%) | - |
| Total Households | 31 (100.0%) | 3.23 |
Household Size by Marriage Status in New Amsterdam
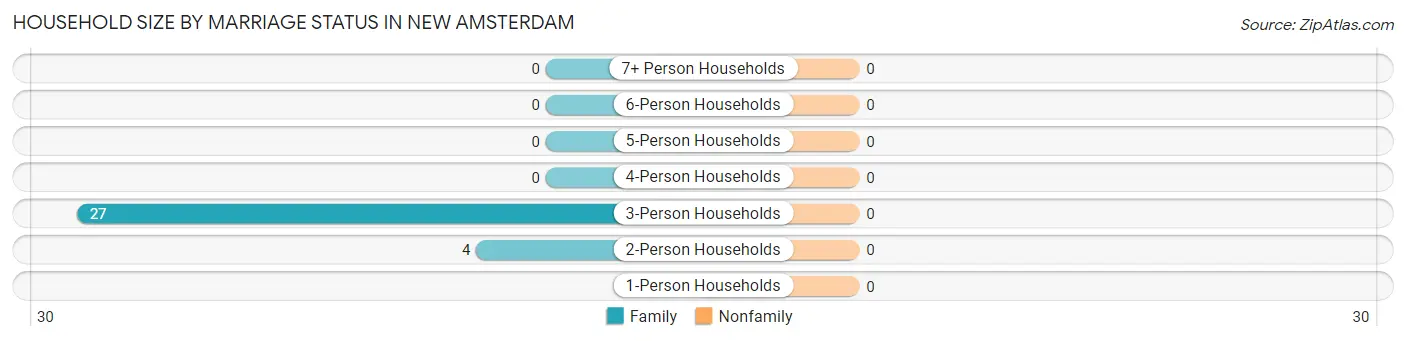
| Household Size | Family Households | Nonfamily Households |
| 1-Person Households | - | 0 (0.0%) |
| 2-Person Households | 4 (12.9%) | 0 (0.0%) |
| 3-Person Households | 27 (87.1%) | 0 (0.0%) |
| 4-Person Households | 0 (0.0%) | 0 (0.0%) |
| 5-Person Households | 0 (0.0%) | 0 (0.0%) |
| 6-Person Households | 0 (0.0%) | 0 (0.0%) |
| 7+ Person Households | 0 (0.0%) | 0 (0.0%) |
| Total | 31 (100.0%) | 0 (0.0%) |
Female Fertility in New Amsterdam
Fertility by Age in New Amsterdam
| Age Bracket | Women with Births | Births / 1,000 Women |
| 15 to 19 years | 0 (0.0%) | 0.0 |
| 20 to 34 years | 0 (0.0%) | 0.0 |
| 35 to 50 years | 0 (0.0%) | 0.0 |
| Total | 0 (0.0%) | 0.0 |
Fertility by Age by Marriage Status in New Amsterdam
| Age Bracket | Married | Unmarried |
| 15 to 19 years | 0 (0.0%) | 0 (0.0%) |
| 20 to 34 years | 0 (0.0%) | 0 (0.0%) |
| 35 to 50 years | 0 (0.0%) | 0 (0.0%) |
| Total | 0 (0.0%) | 0 (0.0%) |
Fertility by Education in New Amsterdam
| Educational Attainment | Women with Births | Births / 1,000 Women |
| Less than High School | 0 (0.0%) | 0.0 |
| High School Diploma | 0 (0.0%) | 0.0 |
| College or Associate's Degree | 0 (0.0%) | 0.0 |
| Bachelor's Degree | 0 (0.0%) | 0.0 |
| Graduate Degree | 0 (0.0%) | 0.0 |
| Total | 0 (0.0%) | 0.0 |
Fertility by Education by Marriage Status in New Amsterdam
| Educational Attainment | Married | Unmarried |
| Less than High School | 0 (0.0%) | 0 (0.0%) |
| High School Diploma | 0 (0.0%) | 0 (0.0%) |
| College or Associate's Degree | 0 (0.0%) | 0 (0.0%) |
| Bachelor's Degree | 0 (0.0%) | 0 (0.0%) |
| Graduate Degree | 0 (0.0%) | 0 (0.0%) |
| Total | 0 (0.0%) | 0 (0.0%) |
Employment Characteristics in New Amsterdam
Employment by Class of Employer in New Amsterdam
Among the 93 employed individuals in New Amsterdam, , and private company employees (93 | 100.0%) make up the most common classes of employment.
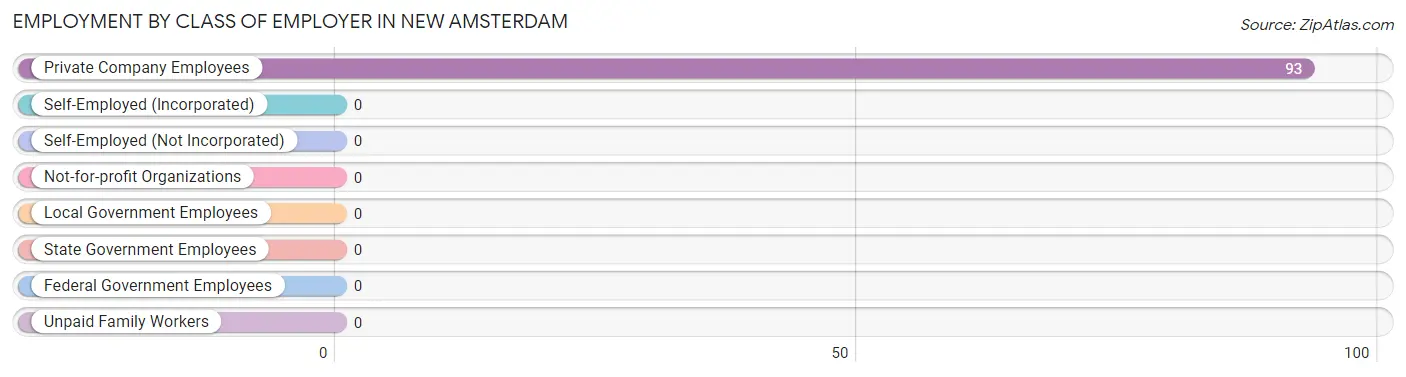
| Employer Class | # Employees | % Employees |
| Private Company Employees | 93 | 100.0% |
| Self-Employed (Incorporated) | 0 | 0.0% |
| Self-Employed (Not Incorporated) | 0 | 0.0% |
| Not-for-profit Organizations | 0 | 0.0% |
| Local Government Employees | 0 | 0.0% |
| State Government Employees | 0 | 0.0% |
| Federal Government Employees | 0 | 0.0% |
| Unpaid Family Workers | 0 | 0.0% |
| Total | 93 | 100.0% |
Employment Status by Age in New Amsterdam
According to the labor force statistics for New Amsterdam, out of the total population over 16 years of age (99), 96.0% or 95 individuals are in the labor force, with 2.1% or 2 of them unemployed. The age group with the highest labor force participation rate is 20 to 24 years, with 100.0% or 41 individuals in the labor force. Within the labor force, the 75 years and over age range has the highest percentage of unemployed individuals, with 100.0% or 2 of them being unemployed.
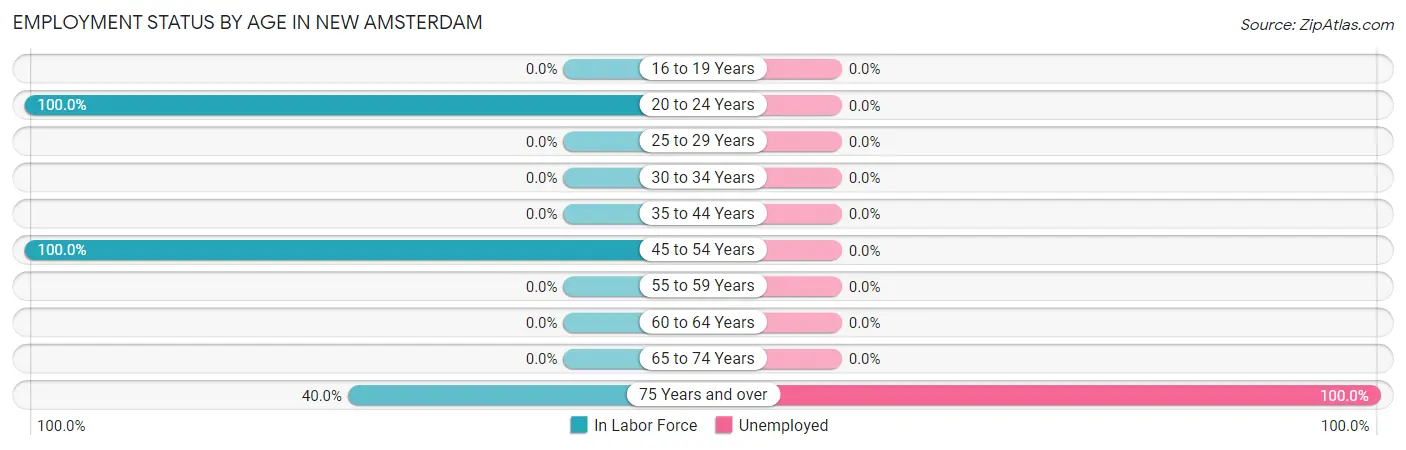
| Age Bracket | In Labor Force | Unemployed |
| 16 to 19 Years | 0 (0.0%) | 0 (0.0%) |
| 20 to 24 Years | 41 (100.0%) | 0 (0.0%) |
| 25 to 29 Years | 0 (0.0%) | 0 (0.0%) |
| 30 to 34 Years | 0 (0.0%) | 0 (0.0%) |
| 35 to 44 Years | 0 (0.0%) | 0 (0.0%) |
| 45 to 54 Years | 52 (100.0%) | 0 (0.0%) |
| 55 to 59 Years | 0 (0.0%) | 0 (0.0%) |
| 60 to 64 Years | 0 (0.0%) | 0 (0.0%) |
| 65 to 74 Years | 0 (0.0%) | 0 (0.0%) |
| 75 Years and over | 2 (40.0%) | 2 (100.0%) |
| Total | 95 (96.0%) | 2 (2.1%) |
Employment Status by Educational Attainment in New Amsterdam
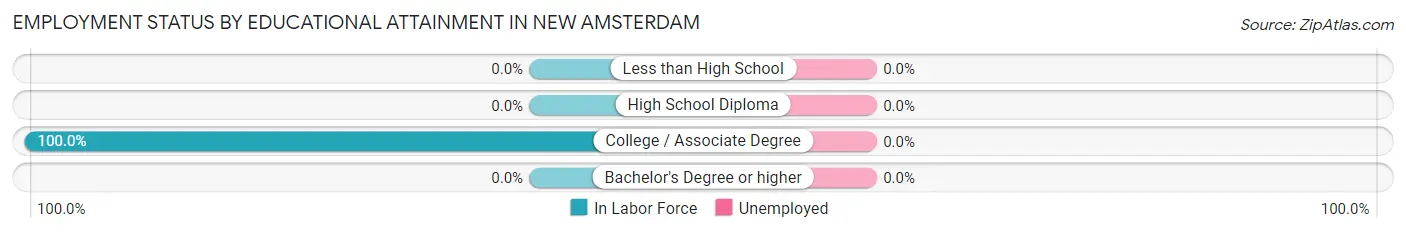
| Educational Attainment | In Labor Force | Unemployed |
| Less than High School | 0 (0.0%) | 0 (0.0%) |
| High School Diploma | 0 (0.0%) | 0 (0.0%) |
| College / Associate Degree | 52 (100.0%) | 0 (0.0%) |
| Bachelor's Degree or higher | 0 (0.0%) | 0 (0.0%) |
| Total | 52 (100.0%) | 0 (0.0%) |
Employment Occupations by Sex in New Amsterdam
Management, Business, Science and Arts Occupations
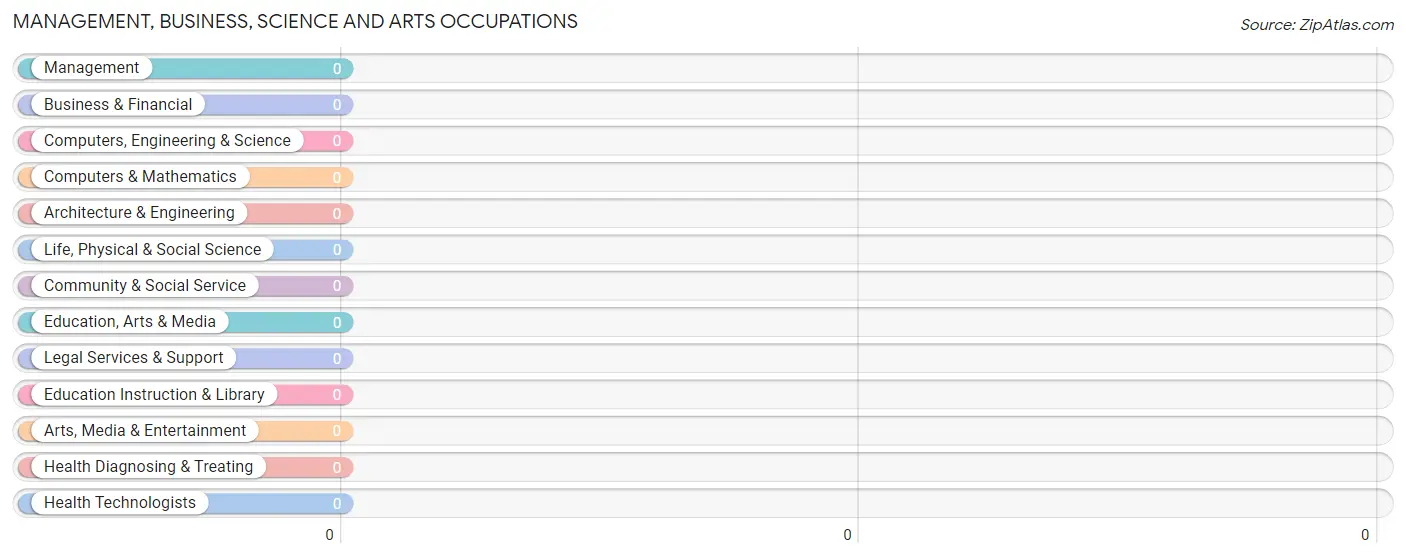
Management, Business, Science and Arts Occupations by Sex
| Occupation | Male | Female |
| Management | 0 (0.0%) | 0 (0.0%) |
| Business & Financial | 0 (0.0%) | 0 (0.0%) |
| Computers, Engineering & Science | 0 (0.0%) | 0 (0.0%) |
| Computers & Mathematics | 0 (0.0%) | 0 (0.0%) |
| Architecture & Engineering | 0 (0.0%) | 0 (0.0%) |
| Life, Physical & Social Science | 0 (0.0%) | 0 (0.0%) |
| Community & Social Service | 0 (0.0%) | 0 (0.0%) |
| Education, Arts & Media | 0 (0.0%) | 0 (0.0%) |
| Legal Services & Support | 0 (0.0%) | 0 (0.0%) |
| Education Instruction & Library | 0 (0.0%) | 0 (0.0%) |
| Arts, Media & Entertainment | 0 (0.0%) | 0 (0.0%) |
| Health Diagnosing & Treating | 0 (0.0%) | 0 (0.0%) |
| Health Technologists | 0 (0.0%) | 0 (0.0%) |
| Total (Category) | 0 (0.0%) | 0 (0.0%) |
| Total (Overall) | 68 (73.1%) | 25 (26.9%) |
Services Occupations
Services Occupations by Sex
| Occupation | Male | Female |
| Healthcare Support | 0 (0.0%) | 0 (0.0%) |
| Security & Protection | 0 (0.0%) | 0 (0.0%) |
| Firefighting & Prevention | 0 (0.0%) | 0 (0.0%) |
| Law Enforcement | 0 (0.0%) | 0 (0.0%) |
| Food Preparation & Serving | 0 (0.0%) | 0 (0.0%) |
| Cleaning & Maintenance | 0 (0.0%) | 0 (0.0%) |
| Personal Care & Service | 0 (0.0%) | 0 (0.0%) |
| Total (Category) | 0 (0.0%) | 0 (0.0%) |
| Total (Overall) | 68 (73.1%) | 25 (26.9%) |
Sales and Office Occupations
The most common Sales and Office occupations in New Amsterdam are , and Sales & Related (25 | 26.9%).
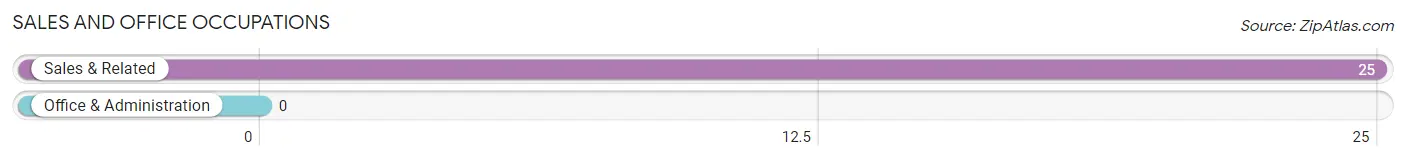
Sales and Office Occupations by Sex

| Occupation | Male | Female |
| Sales & Related | 0 (0.0%) | 25 (100.0%) |
| Office & Administration | 0 (0.0%) | 0 (0.0%) |
| Total (Category) | 0 (0.0%) | 25 (100.0%) |
| Total (Overall) | 68 (73.1%) | 25 (26.9%) |
Natural Resources, Construction and Maintenance Occupations
The most common Natural Resources, Construction and Maintenance occupations in New Amsterdam are Installation, Maintenance & Repair (41 | 44.1%), and Construction & Extraction (27 | 29.0%).

Natural Resources, Construction and Maintenance Occupations by Sex
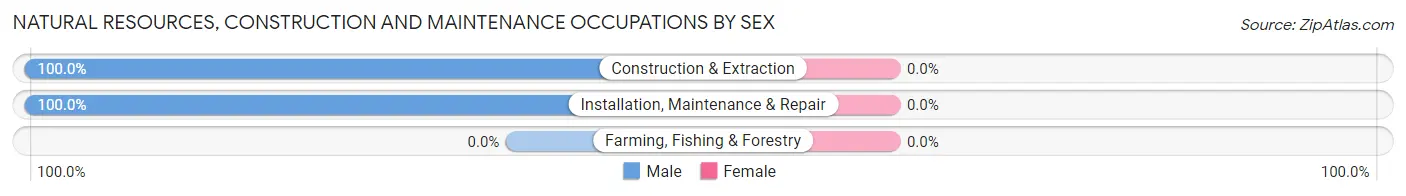
| Occupation | Male | Female |
| Farming, Fishing & Forestry | 0 (0.0%) | 0 (0.0%) |
| Construction & Extraction | 27 (100.0%) | 0 (0.0%) |
| Installation, Maintenance & Repair | 41 (100.0%) | 0 (0.0%) |
| Total (Category) | 68 (100.0%) | 0 (0.0%) |
| Total (Overall) | 68 (73.1%) | 25 (26.9%) |
Production, Transportation and Moving Occupations
Production, Transportation and Moving Occupations by Sex
| Occupation | Male | Female |
| Production | 0 (0.0%) | 0 (0.0%) |
| Transportation | 0 (0.0%) | 0 (0.0%) |
| Material Moving | 0 (0.0%) | 0 (0.0%) |
| Total (Category) | 0 (0.0%) | 0 (0.0%) |
| Total (Overall) | 68 (73.1%) | 25 (26.9%) |
Employment Industries by Sex in New Amsterdam
Employment Industries in New Amsterdam
The major employment industries in New Amsterdam include Construction (68 | 73.1%), and Retail Trade (25 | 26.9%).
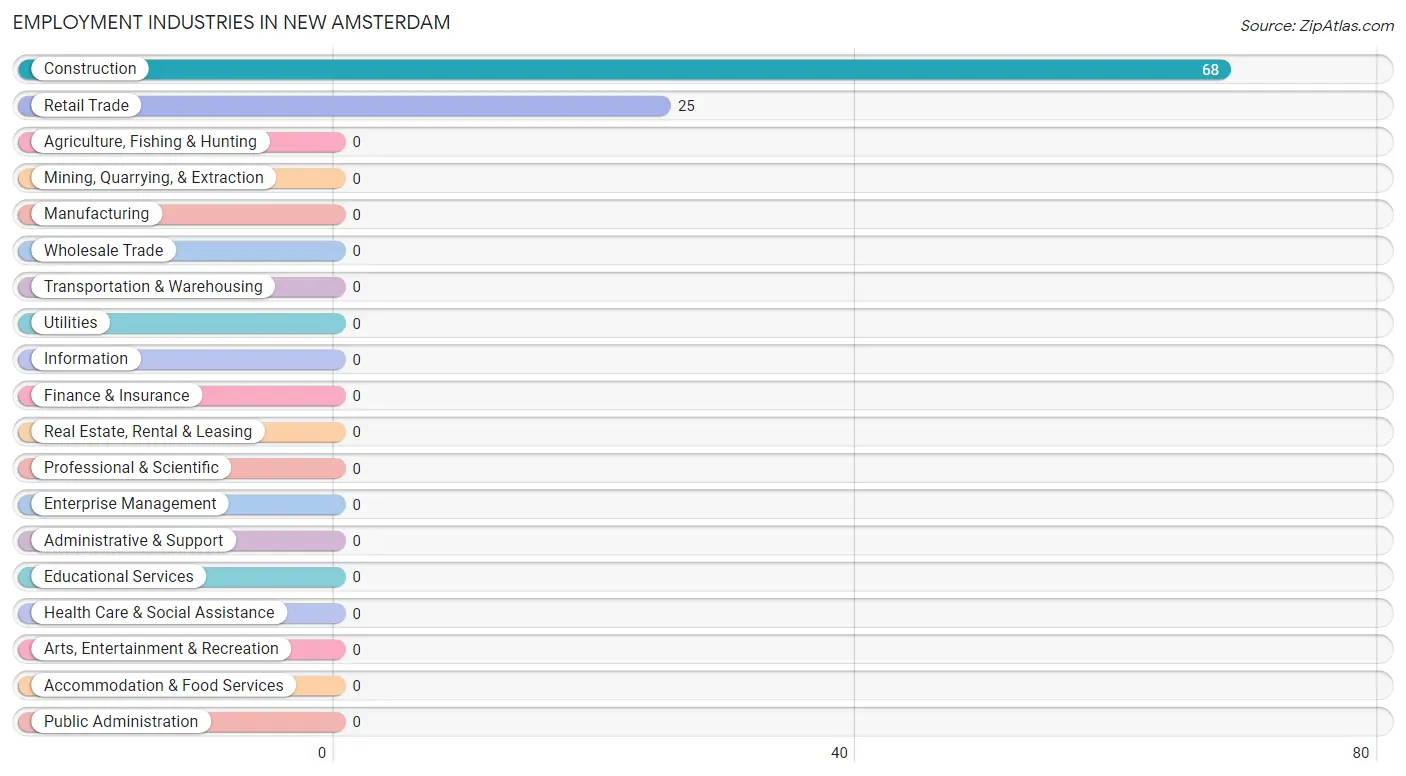
Employment Industries by Sex in New Amsterdam
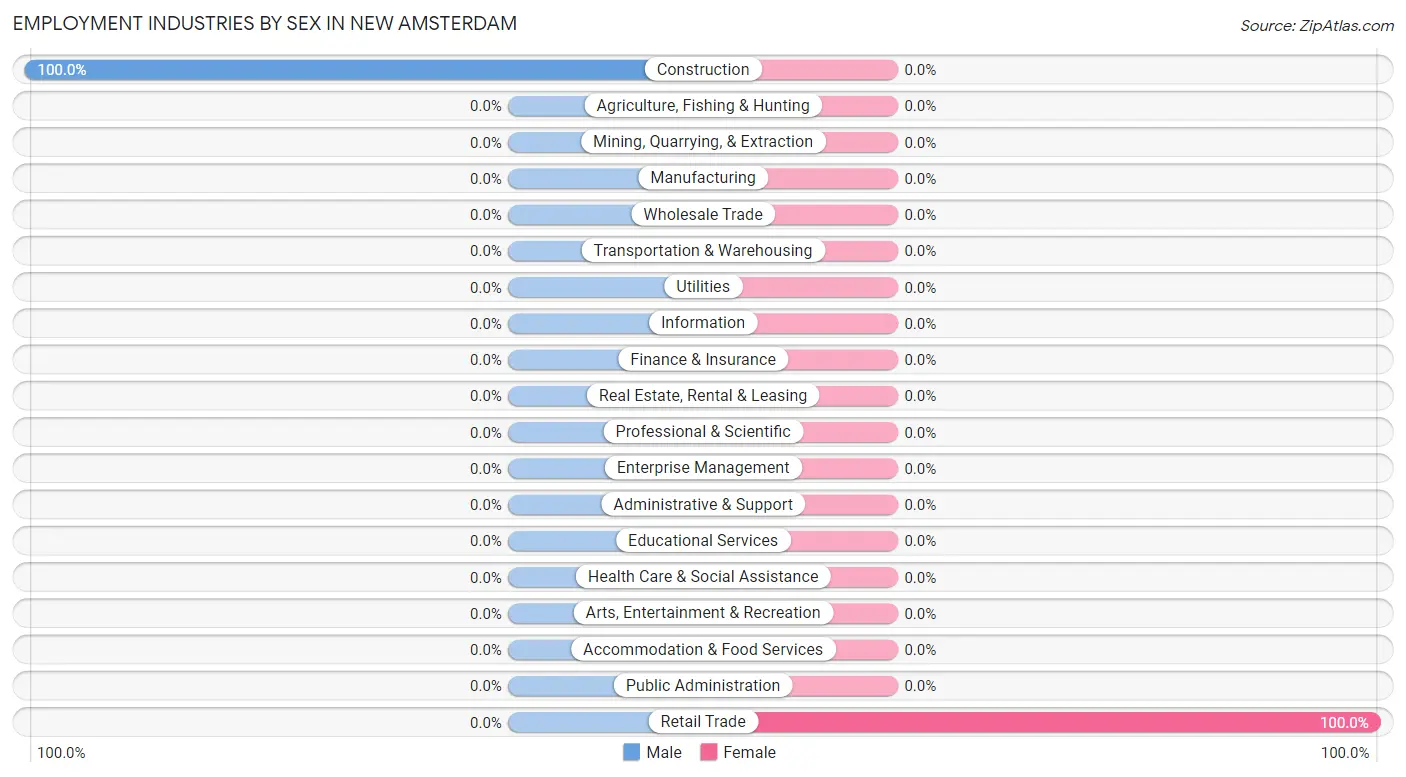
| Industry | Male | Female |
| Agriculture, Fishing & Hunting | 0 (0.0%) | 0 (0.0%) |
| Mining, Quarrying, & Extraction | 0 (0.0%) | 0 (0.0%) |
| Construction | 68 (100.0%) | 0 (0.0%) |
| Manufacturing | 0 (0.0%) | 0 (0.0%) |
| Wholesale Trade | 0 (0.0%) | 0 (0.0%) |
| Retail Trade | 0 (0.0%) | 25 (100.0%) |
| Transportation & Warehousing | 0 (0.0%) | 0 (0.0%) |
| Utilities | 0 (0.0%) | 0 (0.0%) |
| Information | 0 (0.0%) | 0 (0.0%) |
| Finance & Insurance | 0 (0.0%) | 0 (0.0%) |
| Real Estate, Rental & Leasing | 0 (0.0%) | 0 (0.0%) |
| Professional & Scientific | 0 (0.0%) | 0 (0.0%) |
| Enterprise Management | 0 (0.0%) | 0 (0.0%) |
| Administrative & Support | 0 (0.0%) | 0 (0.0%) |
| Educational Services | 0 (0.0%) | 0 (0.0%) |
| Health Care & Social Assistance | 0 (0.0%) | 0 (0.0%) |
| Arts, Entertainment & Recreation | 0 (0.0%) | 0 (0.0%) |
| Accommodation & Food Services | 0 (0.0%) | 0 (0.0%) |
| Public Administration | 0 (0.0%) | 0 (0.0%) |
| Total | 68 (73.1%) | 25 (26.9%) |
Education in New Amsterdam
School Enrollment in New Amsterdam
| School Level | # Students | % Students |
| Nursery / Preschool | 0 | 0.0% |
| Kindergarten | 0 | 0.0% |
| Elementary School | 0 | 0.0% |
| Middle School | 0 | 0.0% |
| High School | 0 | 0.0% |
| College / Undergraduate | 0 | 0.0% |
| Graduate / Professional | 0 | 0.0% |
| Total | 0 | 0.0% |
School Enrollment by Age by Funding Source in New Amsterdam
| Age Bracket | Public School | Private School |
| 3 to 4 Year Olds | 0 (0.0%) | 0 (0.0%) |
| 5 to 9 Year Old | 0 (0.0%) | 0 (0.0%) |
| 10 to 14 Year Olds | 0 (0.0%) | 0 (0.0%) |
| 15 to 17 Year Olds | 0 (0.0%) | 0 (0.0%) |
| 18 to 19 Year Olds | 0 (0.0%) | 0 (0.0%) |
| 20 to 24 Year Olds | 0 (0.0%) | 0 (0.0%) |
| 25 to 34 Year Olds | 0 (0.0%) | 0 (0.0%) |
| 35 Years and over | 0 (0.0%) | 0 (0.0%) |
| Total | 0 (0.0%) | 0 (0.0%) |
Educational Attainment by Field of Study in New Amsterdam
| Field of Study | # Graduates | % Graduates |
| Computers & Mathematics | 0 | 0.0% |
| Bio, Nature & Agricultural | 0 | 0.0% |
| Physical & Health Sciences | 0 | 0.0% |
| Psychology | 0 | 0.0% |
| Social Sciences | 0 | 0.0% |
| Engineering | 0 | 0.0% |
| Multidisciplinary Studies | 0 | 0.0% |
| Science & Technology | 0 | 0.0% |
| Business | 0 | 0.0% |
| Education | 0 | 0.0% |
| Literature & Languages | 0 | 0.0% |
| Liberal Arts & History | 0 | 0.0% |
| Visual & Performing Arts | 0 | 0.0% |
| Communications | 0 | 0.0% |
| Arts & Humanities | 0 | 0.0% |
| Total | 0 | 0.0% |
Transportation & Commute in New Amsterdam
Vehicle Availability by Sex in New Amsterdam
The most prevalent vehicle ownership categories in New Amsterdam are males with 4 vehicles (68, accounting for 100.0%) and females with 4 vehicles (25, making up 272.0%).
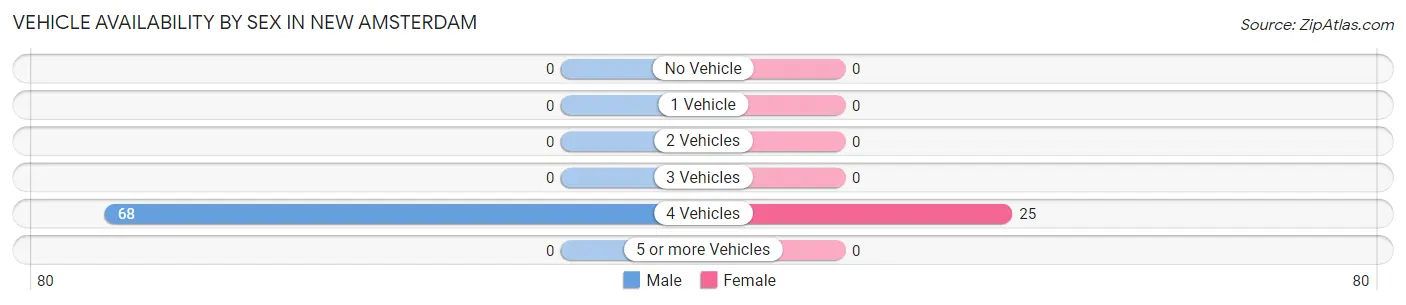
| Vehicles Available | Male | Female |
| No Vehicle | 0 (0.0%) | 0 (0.0%) |
| 1 Vehicle | 0 (0.0%) | 0 (0.0%) |
| 2 Vehicles | 0 (0.0%) | 0 (0.0%) |
| 3 Vehicles | 0 (0.0%) | 0 (0.0%) |
| 4 Vehicles | 68 (100.0%) | 25 (100.0%) |
| 5 or more Vehicles | 0 (0.0%) | 0 (0.0%) |
| Total | 68 (100.0%) | 25 (100.0%) |
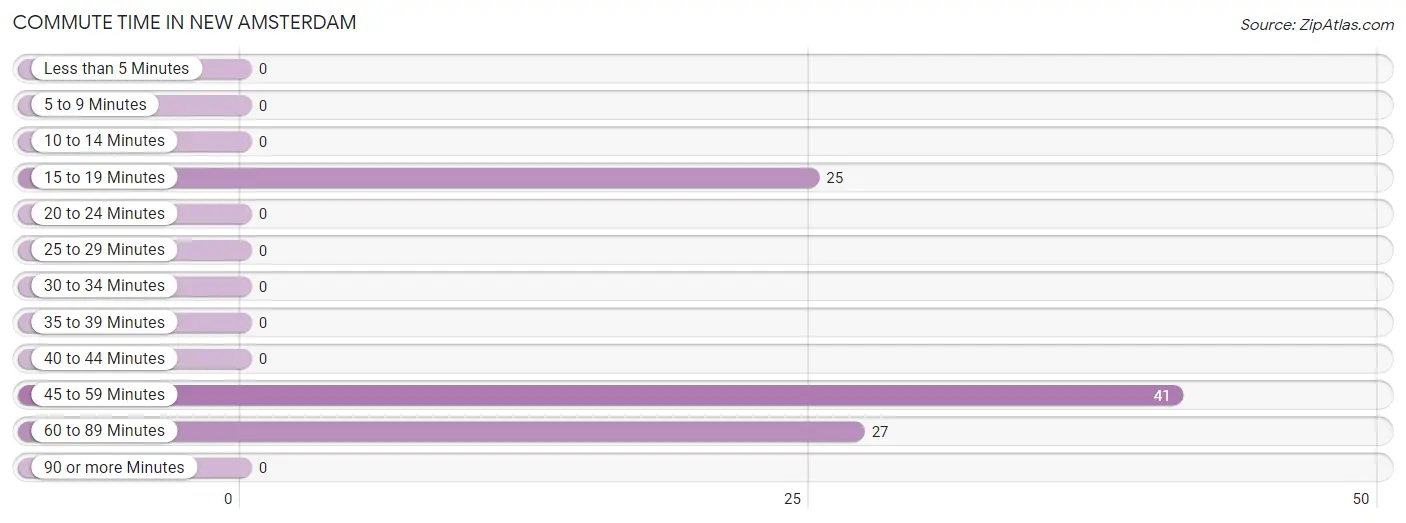
Commute Time in New Amsterdam
The most frequently occuring commute durations in New Amsterdam are 45 to 59 minutes (41 commuters, 44.1%), 60 to 89 minutes (27 commuters, 29.0%), and 15 to 19 minutes (25 commuters, 26.9%).
| Commute Time | # Commuters | % Commuters |
| Less than 5 Minutes | 0 | 0.0% |
| 5 to 9 Minutes | 0 | 0.0% |
| 10 to 14 Minutes | 0 | 0.0% |
| 15 to 19 Minutes | 25 | 26.9% |
| 20 to 24 Minutes | 0 | 0.0% |
| 25 to 29 Minutes | 0 | 0.0% |
| 30 to 34 Minutes | 0 | 0.0% |
| 35 to 39 Minutes | 0 | 0.0% |
| 40 to 44 Minutes | 0 | 0.0% |
| 45 to 59 Minutes | 41 | 44.1% |
| 60 to 89 Minutes | 27 | 29.0% |
| 90 or more Minutes | 0 | 0.0% |
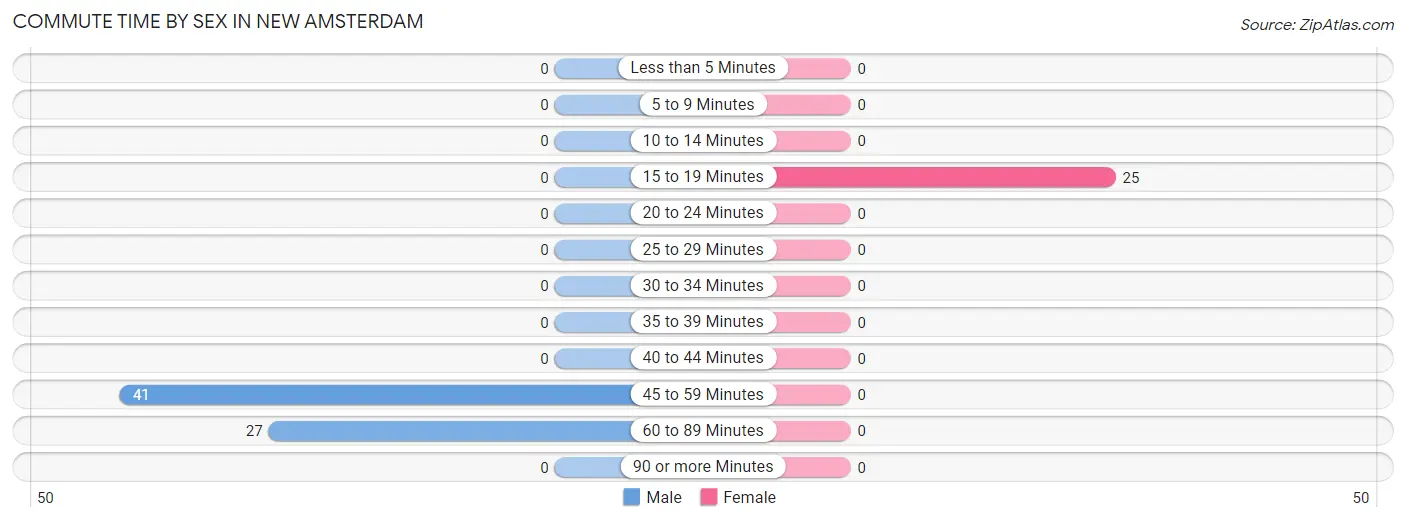
Commute Time by Sex in New Amsterdam
The most common commute times in New Amsterdam are 45 to 59 minutes (41 commuters, 60.3%) for males and 15 to 19 minutes (25 commuters, 100.0%) for females.
| Commute Time | Male | Female |
| Less than 5 Minutes | 0 (0.0%) | 0 (0.0%) |
| 5 to 9 Minutes | 0 (0.0%) | 0 (0.0%) |
| 10 to 14 Minutes | 0 (0.0%) | 0 (0.0%) |
| 15 to 19 Minutes | 0 (0.0%) | 25 (100.0%) |
| 20 to 24 Minutes | 0 (0.0%) | 0 (0.0%) |
| 25 to 29 Minutes | 0 (0.0%) | 0 (0.0%) |
| 30 to 34 Minutes | 0 (0.0%) | 0 (0.0%) |
| 35 to 39 Minutes | 0 (0.0%) | 0 (0.0%) |
| 40 to 44 Minutes | 0 (0.0%) | 0 (0.0%) |
| 45 to 59 Minutes | 41 (60.3%) | 0 (0.0%) |
| 60 to 89 Minutes | 27 (39.7%) | 0 (0.0%) |
| 90 or more Minutes | 0 (0.0%) | 0 (0.0%) |
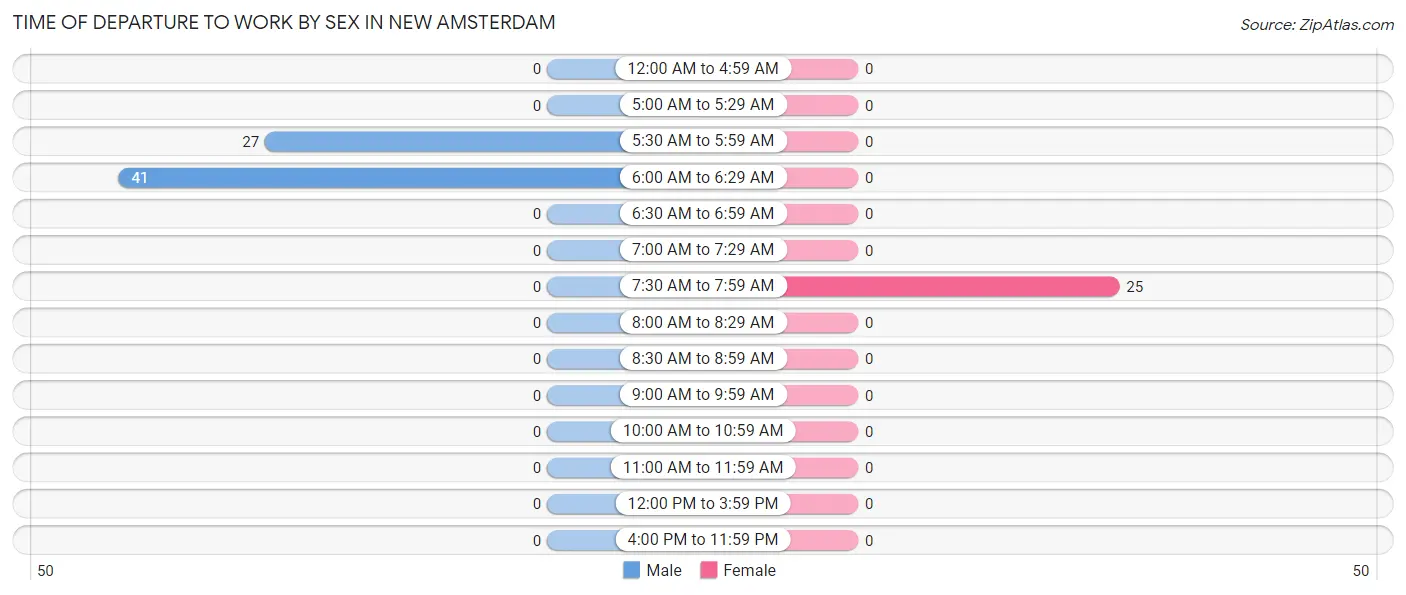
Time of Departure to Work by Sex in New Amsterdam
The most frequent times of departure to work in New Amsterdam are 6:00 AM to 6:29 AM (41, 60.3%) for males and 7:30 AM to 7:59 AM (25, 100.0%) for females.
| Time of Departure | Male | Female |
| 12:00 AM to 4:59 AM | 0 (0.0%) | 0 (0.0%) |
| 5:00 AM to 5:29 AM | 0 (0.0%) | 0 (0.0%) |
| 5:30 AM to 5:59 AM | 27 (39.7%) | 0 (0.0%) |
| 6:00 AM to 6:29 AM | 41 (60.3%) | 0 (0.0%) |
| 6:30 AM to 6:59 AM | 0 (0.0%) | 0 (0.0%) |
| 7:00 AM to 7:29 AM | 0 (0.0%) | 0 (0.0%) |
| 7:30 AM to 7:59 AM | 0 (0.0%) | 25 (100.0%) |
| 8:00 AM to 8:29 AM | 0 (0.0%) | 0 (0.0%) |
| 8:30 AM to 8:59 AM | 0 (0.0%) | 0 (0.0%) |
| 9:00 AM to 9:59 AM | 0 (0.0%) | 0 (0.0%) |
| 10:00 AM to 10:59 AM | 0 (0.0%) | 0 (0.0%) |
| 11:00 AM to 11:59 AM | 0 (0.0%) | 0 (0.0%) |
| 12:00 PM to 3:59 PM | 0 (0.0%) | 0 (0.0%) |
| 4:00 PM to 11:59 PM | 0 (0.0%) | 0 (0.0%) |
| Total | 68 (100.0%) | 25 (100.0%) |
Housing Occupancy in New Amsterdam
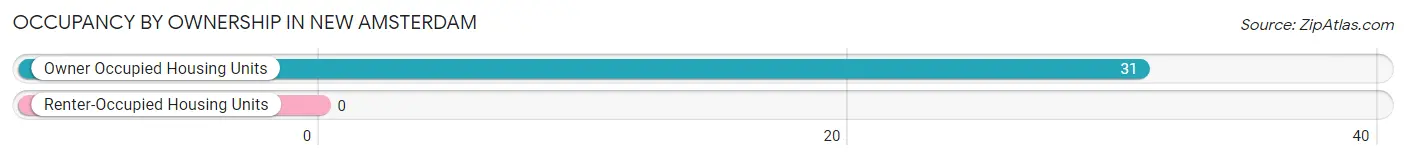
Occupancy by Ownership in New Amsterdam
Of the total 31 dwellings in New Amsterdam, owner-occupied units account for 31 (100.0%), while renter-occupied units make up 0 (0.0%).
| Occupancy | # Housing Units | % Housing Units |
| Owner Occupied Housing Units | 31 | 100.0% |
| Renter-Occupied Housing Units | 0 | 0.0% |
| Total Occupied Housing Units | 31 | 100.0% |
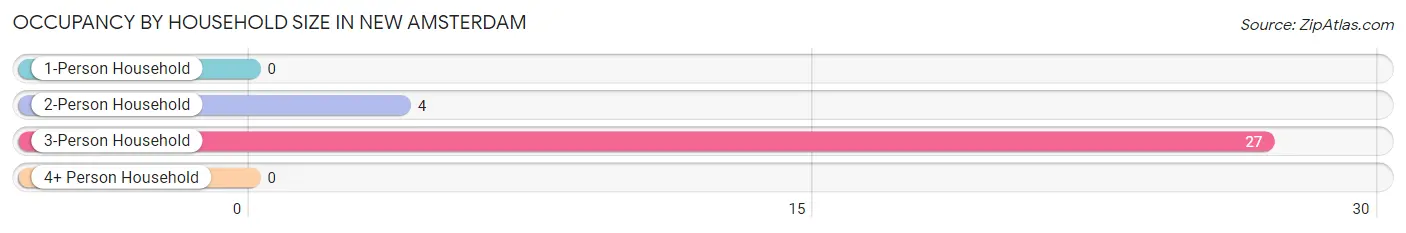
Occupancy by Household Size in New Amsterdam
| Household Size | # Housing Units | % Housing Units |
| 1-Person Household | 0 | 0.0% |
| 2-Person Household | 4 | 12.9% |
| 3-Person Household | 27 | 87.1% |
| 4+ Person Household | 0 | 0.0% |
| Total Housing Units | 31 | 100.0% |
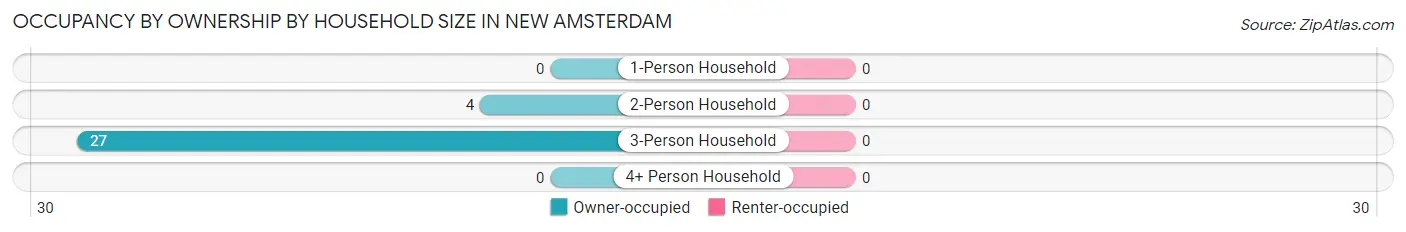
Occupancy by Ownership by Household Size in New Amsterdam
| Household Size | Owner-occupied | Renter-occupied |
| 1-Person Household | 0 (0.0%) | 0 (0.0%) |
| 2-Person Household | 4 (100.0%) | 0 (0.0%) |
| 3-Person Household | 27 (100.0%) | 0 (0.0%) |
| 4+ Person Household | 0 (0.0%) | 0 (0.0%) |
| Total Housing Units | 31 (100.0%) | 0 (0.0%) |
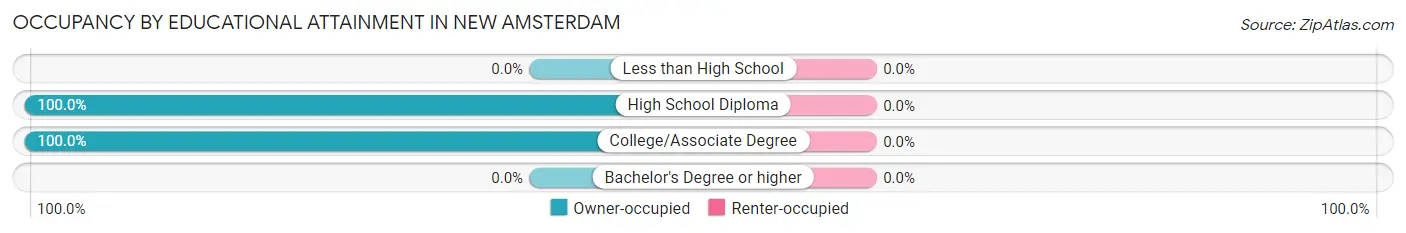
Occupancy by Educational Attainment in New Amsterdam
| Household Size | Owner-occupied | Renter-occupied |
| Less than High School | 0 (0.0%) | 0 (0.0%) |
| High School Diploma | 1 (100.0%) | 0 (0.0%) |
| College/Associate Degree | 30 (100.0%) | 0 (0.0%) |
| Bachelor's Degree or higher | 0 (0.0%) | 0 (0.0%) |
Occupancy by Age of Householder in New Amsterdam
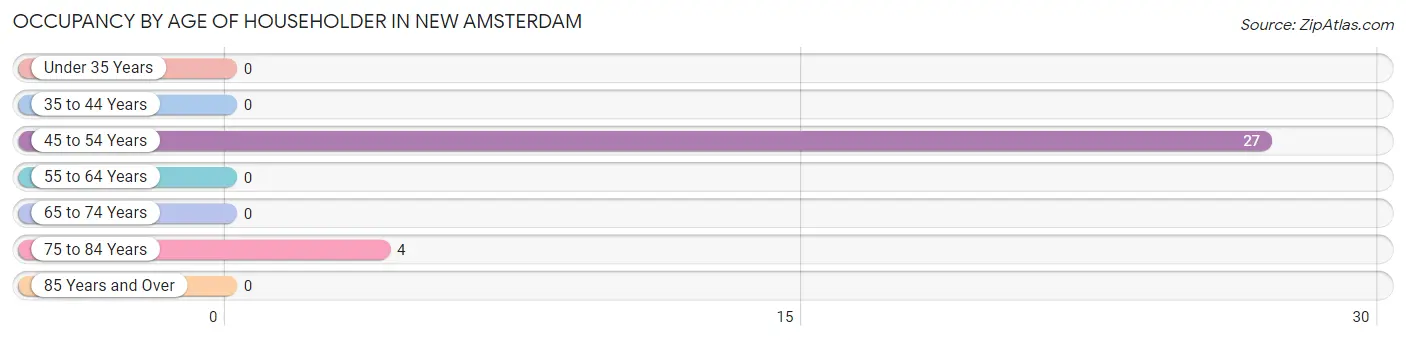
| Age Bracket | # Households | % Households |
| Under 35 Years | 0 | 0.0% |
| 35 to 44 Years | 0 | 0.0% |
| 45 to 54 Years | 27 | 87.1% |
| 55 to 64 Years | 0 | 0.0% |
| 65 to 74 Years | 0 | 0.0% |
| 75 to 84 Years | 4 | 12.9% |
| 85 Years and Over | 0 | 0.0% |
| Total | 31 | 100.0% |
Housing Finances in New Amsterdam
Median Income by Occupancy in New Amsterdam
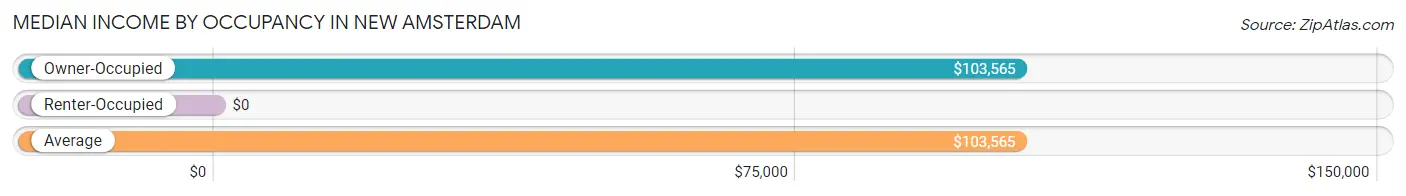
| Occupancy Type | # Households | Median Income |
| Owner-Occupied | 31 (100.0%) | $103,565 |
| Renter-Occupied | 0 (0.0%) | $0 |
| Average | 31 (100.0%) | $103,565 |
Occupancy by Householder Income Bracket in New Amsterdam
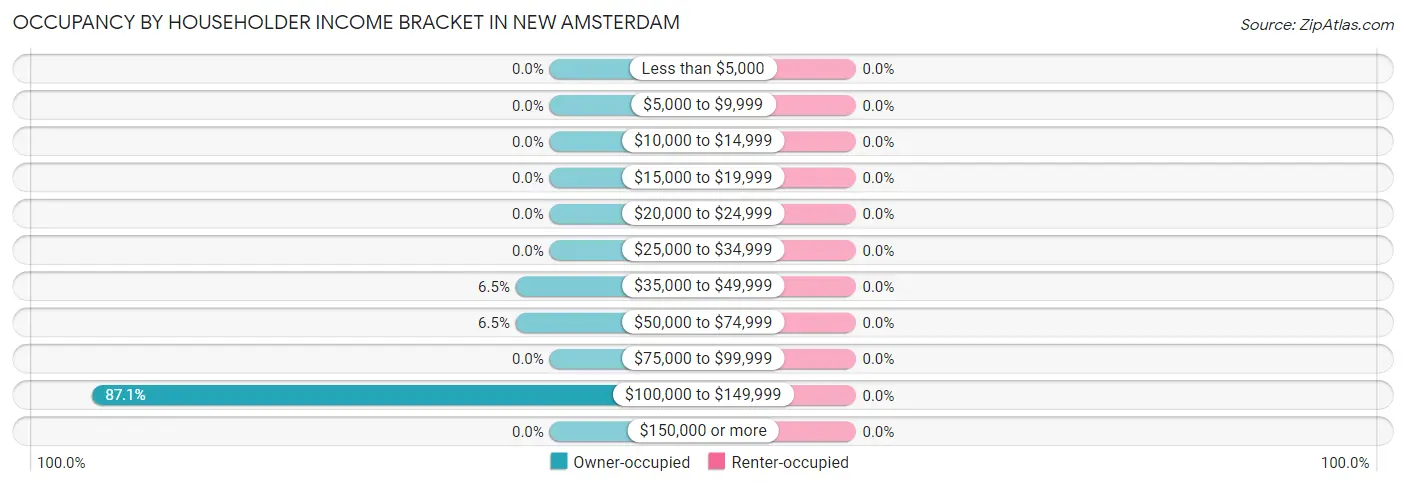
| Income Bracket | Owner-occupied | Renter-occupied |
| Less than $5,000 | 0 (0.0%) | 0 (0.0%) |
| $5,000 to $9,999 | 0 (0.0%) | 0 (0.0%) |
| $10,000 to $14,999 | 0 (0.0%) | 0 (0.0%) |
| $15,000 to $19,999 | 0 (0.0%) | 0 (0.0%) |
| $20,000 to $24,999 | 0 (0.0%) | 0 (0.0%) |
| $25,000 to $34,999 | 0 (0.0%) | 0 (0.0%) |
| $35,000 to $49,999 | 2 (6.5%) | 0 (0.0%) |
| $50,000 to $74,999 | 2 (6.5%) | 0 (0.0%) |
| $75,000 to $99,999 | 0 (0.0%) | 0 (0.0%) |
| $100,000 to $149,999 | 27 (87.1%) | 0 (0.0%) |
| $150,000 or more | 0 (0.0%) | 0 (0.0%) |
| Total | 31 (100.0%) | 0 (0.0%) |
Monthly Housing Cost Tiers in New Amsterdam
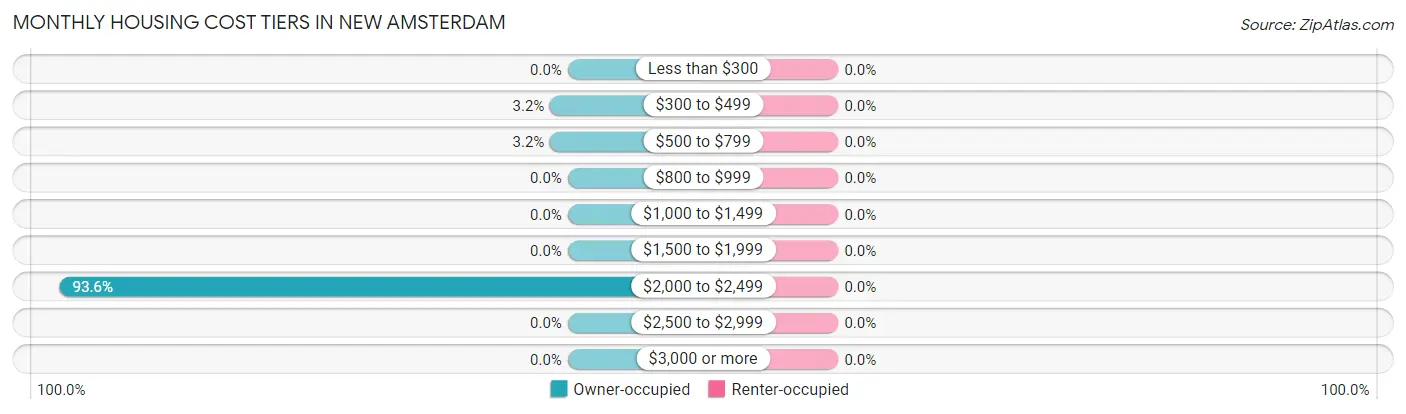
| Monthly Cost | Owner-occupied | Renter-occupied |
| Less than $300 | 0 (0.0%) | 0 (0.0%) |
| $300 to $499 | 1 (3.2%) | 0 (0.0%) |
| $500 to $799 | 1 (3.2%) | 0 (0.0%) |
| $800 to $999 | 0 (0.0%) | 0 (0.0%) |
| $1,000 to $1,499 | 0 (0.0%) | 0 (0.0%) |
| $1,500 to $1,999 | 0 (0.0%) | 0 (0.0%) |
| $2,000 to $2,499 | 29 (93.5%) | 0 (0.0%) |
| $2,500 to $2,999 | 0 (0.0%) | 0 (0.0%) |
| $3,000 or more | 0 (0.0%) | 0 (0.0%) |
| Total | 31 (100.0%) | 0 (0.0%) |
Physical Housing Characteristics in New Amsterdam
Housing Structures in New Amsterdam
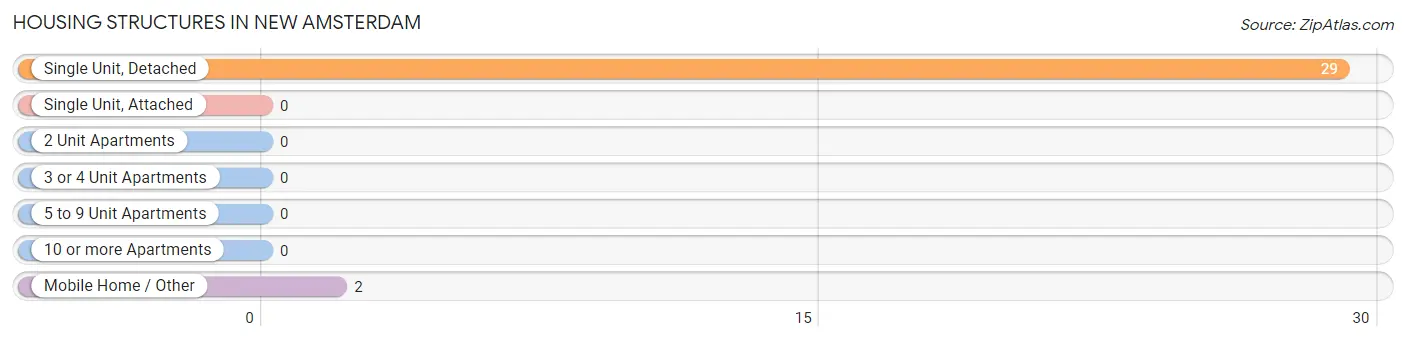
| Structure Type | # Housing Units | % Housing Units |
| Single Unit, Detached | 29 | 93.5% |
| Single Unit, Attached | 0 | 0.0% |
| 2 Unit Apartments | 0 | 0.0% |
| 3 or 4 Unit Apartments | 0 | 0.0% |
| 5 to 9 Unit Apartments | 0 | 0.0% |
| 10 or more Apartments | 0 | 0.0% |
| Mobile Home / Other | 2 | 6.5% |
| Total | 31 | 100.0% |
Housing Structures by Occupancy in New Amsterdam
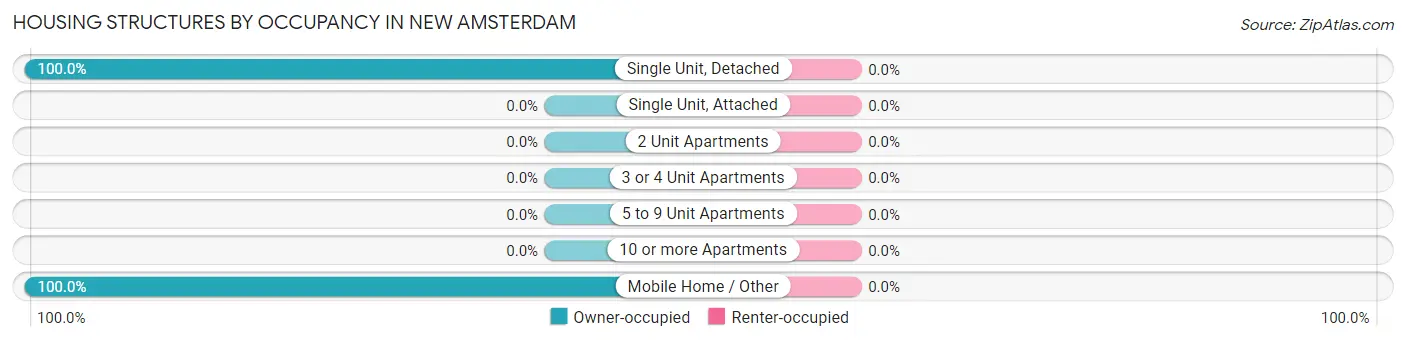
| Structure Type | Owner-occupied | Renter-occupied |
| Single Unit, Detached | 29 (100.0%) | 0 (0.0%) |
| Single Unit, Attached | 0 (0.0%) | 0 (0.0%) |
| 2 Unit Apartments | 0 (0.0%) | 0 (0.0%) |
| 3 or 4 Unit Apartments | 0 (0.0%) | 0 (0.0%) |
| 5 to 9 Unit Apartments | 0 (0.0%) | 0 (0.0%) |
| 10 or more Apartments | 0 (0.0%) | 0 (0.0%) |
| Mobile Home / Other | 2 (100.0%) | 0 (0.0%) |
| Total | 31 (100.0%) | 0 (0.0%) |
Housing Structures by Number of Rooms in New Amsterdam
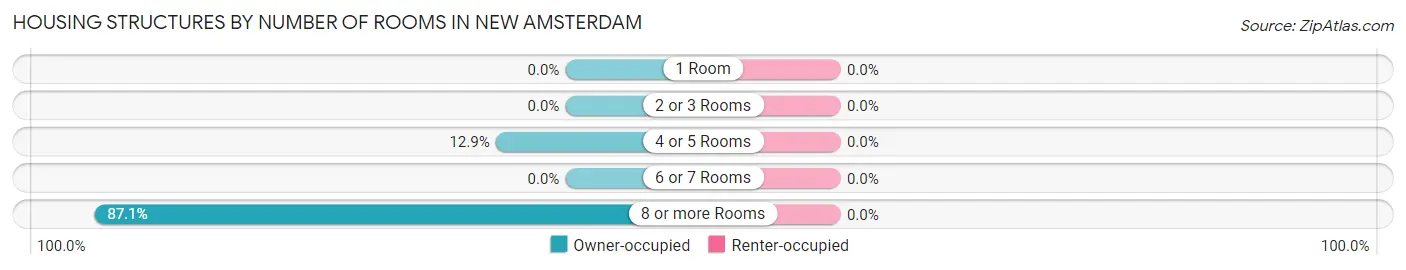
| Number of Rooms | Owner-occupied | Renter-occupied |
| 1 Room | 0 (0.0%) | 0 (0.0%) |
| 2 or 3 Rooms | 0 (0.0%) | 0 (0.0%) |
| 4 or 5 Rooms | 4 (12.9%) | 0 (0.0%) |
| 6 or 7 Rooms | 0 (0.0%) | 0 (0.0%) |
| 8 or more Rooms | 27 (87.1%) | 0 (0.0%) |
| Total | 31 (100.0%) | 0 (0.0%) |
Housing Structure by Heating Type in New Amsterdam
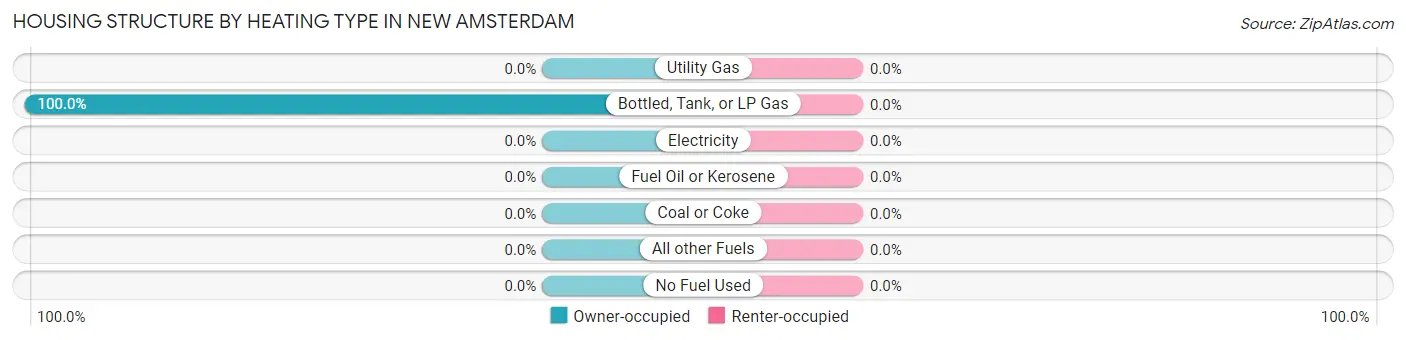
| Heating Type | Owner-occupied | Renter-occupied |
| Utility Gas | 0 (0.0%) | 0 (0.0%) |
| Bottled, Tank, or LP Gas | 31 (100.0%) | 0 (0.0%) |
| Electricity | 0 (0.0%) | 0 (0.0%) |
| Fuel Oil or Kerosene | 0 (0.0%) | 0 (0.0%) |
| Coal or Coke | 0 (0.0%) | 0 (0.0%) |
| All other Fuels | 0 (0.0%) | 0 (0.0%) |
| No Fuel Used | 0 (0.0%) | 0 (0.0%) |
| Total | 31 (100.0%) | 0 (0.0%) |
Household Vehicle Usage in New Amsterdam
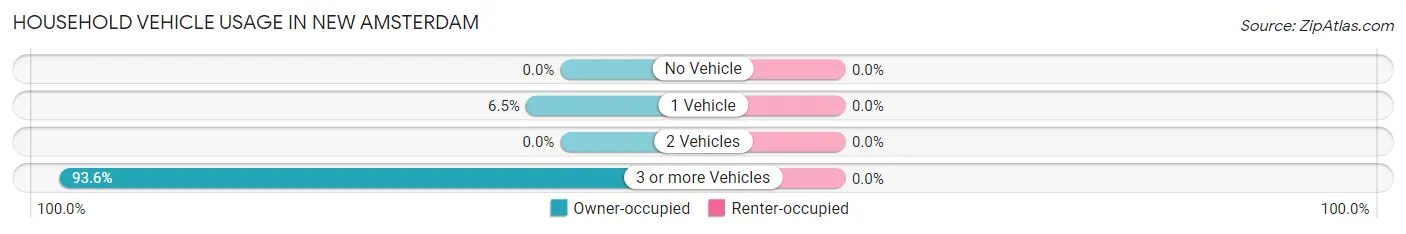
| Vehicles per Household | Owner-occupied | Renter-occupied |
| No Vehicle | 0 (0.0%) | 0 (0.0%) |
| 1 Vehicle | 2 (6.5%) | 0 (0.0%) |
| 2 Vehicles | 0 (0.0%) | 0 (0.0%) |
| 3 or more Vehicles | 29 (93.5%) | 0 (0.0%) |
| Total | 31 (100.0%) | 0 (0.0%) |
Real Estate & Mortgages in New Amsterdam
Real Estate and Mortgage Overview in New Amsterdam
| Characteristic | Without Mortgage | With Mortgage |
| Housing Units | 3 | 28 |
| Median Property Value | - | - |
| Median Household Income | - | - |
| Monthly Housing Costs | - | - |
| Real Estate Taxes | - | - |
Property Value by Mortgage Status in New Amsterdam
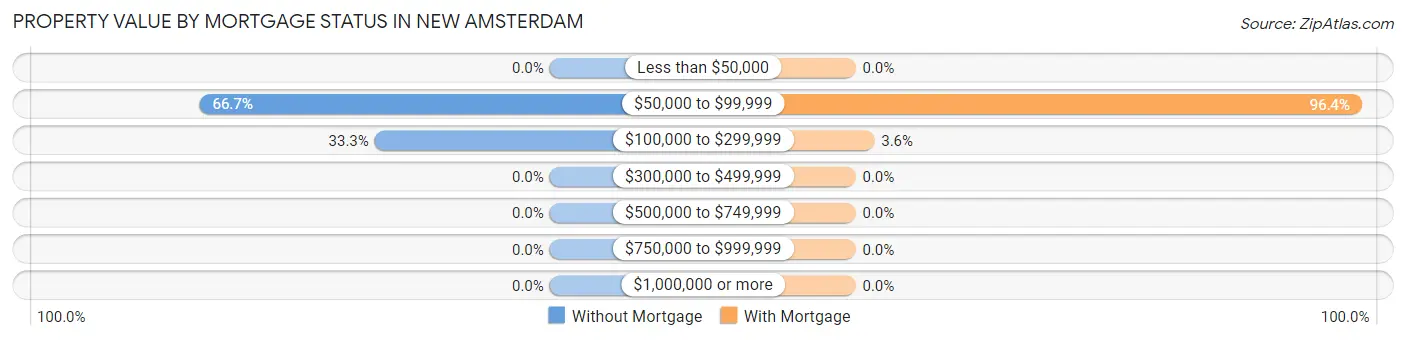
| Property Value | Without Mortgage | With Mortgage |
| Less than $50,000 | 0 (0.0%) | 0 (0.0%) |
| $50,000 to $99,999 | 2 (66.7%) | 27 (96.4%) |
| $100,000 to $299,999 | 1 (33.3%) | 1 (3.6%) |
| $300,000 to $499,999 | 0 (0.0%) | 0 (0.0%) |
| $500,000 to $749,999 | 0 (0.0%) | 0 (0.0%) |
| $750,000 to $999,999 | 0 (0.0%) | 0 (0.0%) |
| $1,000,000 or more | 0 (0.0%) | 0 (0.0%) |
| Total | 3 (100.0%) | 28 (100.0%) |
Household Income by Mortgage Status in New Amsterdam
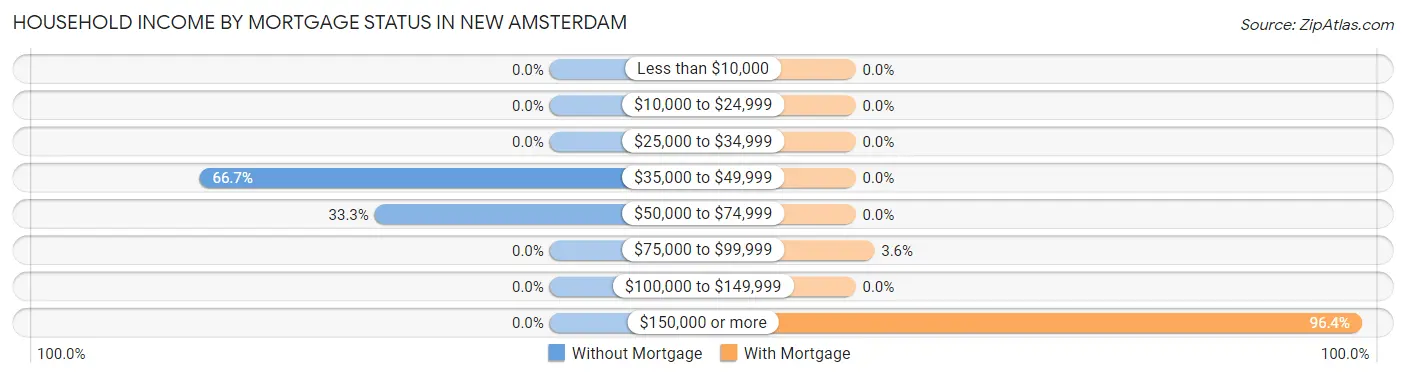
| Household Income | Without Mortgage | With Mortgage |
| Less than $10,000 | 0 (0.0%) | 0 (0.0%) |
| $10,000 to $24,999 | 0 (0.0%) | 0 (0.0%) |
| $25,000 to $34,999 | 0 (0.0%) | 0 (0.0%) |
| $35,000 to $49,999 | 2 (66.7%) | 0 (0.0%) |
| $50,000 to $74,999 | 1 (33.3%) | 0 (0.0%) |
| $75,000 to $99,999 | 0 (0.0%) | 1 (3.6%) |
| $100,000 to $149,999 | 0 (0.0%) | 0 (0.0%) |
| $150,000 or more | 0 (0.0%) | 27 (96.4%) |
| Total | 3 (100.0%) | 28 (100.0%) |
Property Value to Household Income Ratio in New Amsterdam
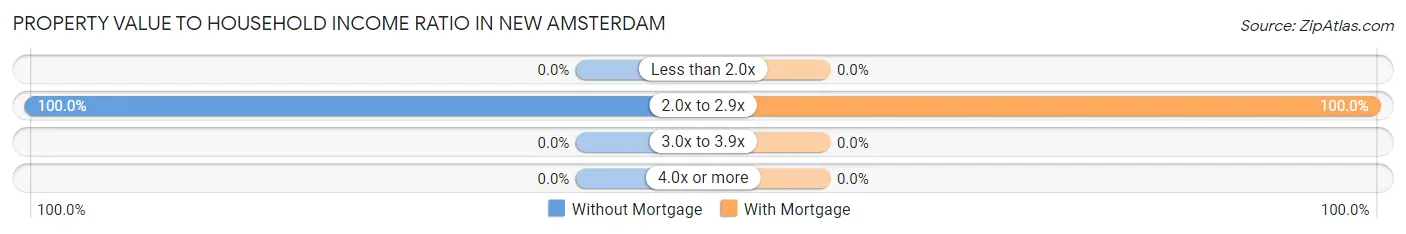
| Value-to-Income Ratio | Without Mortgage | With Mortgage |
| Less than 2.0x | 0 (0.0%) | 0 (0.0%) |
| 2.0x to 2.9x | 3 (100.0%) | 28 (100.0%) |
| 3.0x to 3.9x | 0 (0.0%) | 0 (0.0%) |
| 4.0x or more | 0 (0.0%) | 0 (0.0%) |
| Total | 3 (100.0%) | 28 (100.0%) |
Real Estate Taxes by Mortgage Status in New Amsterdam
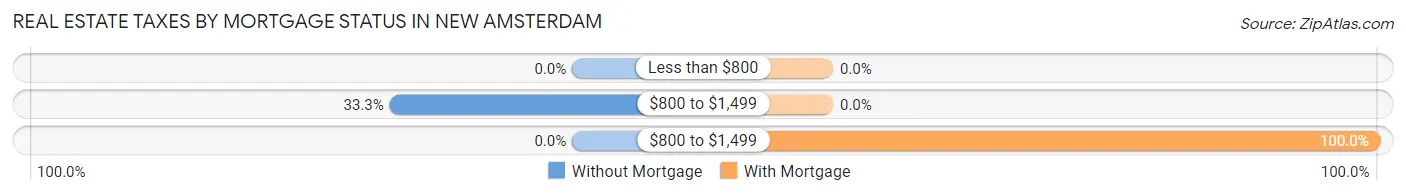
| Property Taxes | Without Mortgage | With Mortgage |
| Less than $800 | 0 (0.0%) | 0 (0.0%) |
| $800 to $1,499 | 1 (33.3%) | 0 (0.0%) |
| $800 to $1,499 | 0 (0.0%) | 28 (100.0%) |
| Total | 3 (100.0%) | 28 (100.0%) |
Health & Disability in New Amsterdam
Health Insurance Coverage by Age in New Amsterdam
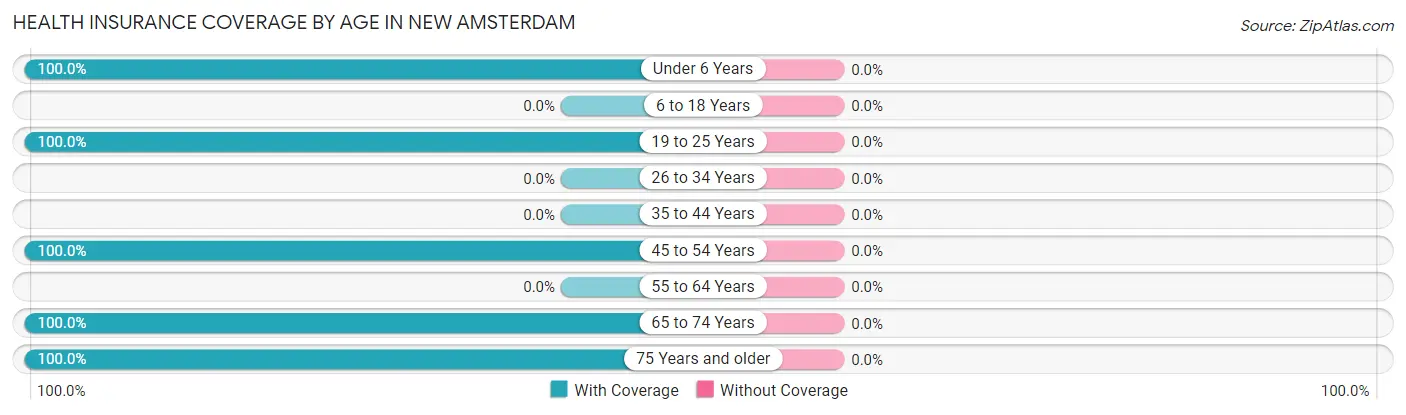
| Age Bracket | With Coverage | Without Coverage |
| Under 6 Years | 1 (100.0%) | 0 (0.0%) |
| 6 to 18 Years | 0 (0.0%) | 0 (0.0%) |
| 19 to 25 Years | 41 (100.0%) | 0 (0.0%) |
| 26 to 34 Years | 0 (0.0%) | 0 (0.0%) |
| 35 to 44 Years | 0 (0.0%) | 0 (0.0%) |
| 45 to 54 Years | 52 (100.0%) | 0 (0.0%) |
| 55 to 64 Years | 0 (0.0%) | 0 (0.0%) |
| 65 to 74 Years | 1 (100.0%) | 0 (0.0%) |
| 75 Years and older | 5 (100.0%) | 0 (0.0%) |
| Total | 100 (100.0%) | 0 (0.0%) |
Health Insurance Coverage by Citizenship Status in New Amsterdam
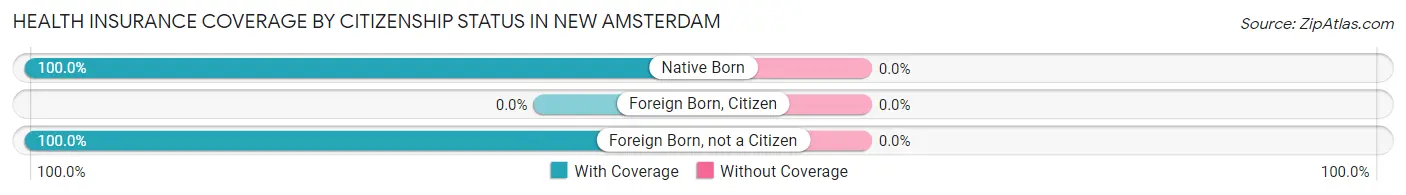
| Citizenship Status | With Coverage | Without Coverage |
| Native Born | 1 (100.0%) | 0 (0.0%) |
| Foreign Born, Citizen | 0 (0.0%) | 0 (0.0%) |
| Foreign Born, not a Citizen | 41 (100.0%) | 0 (0.0%) |
Health Insurance Coverage by Household Income in New Amsterdam
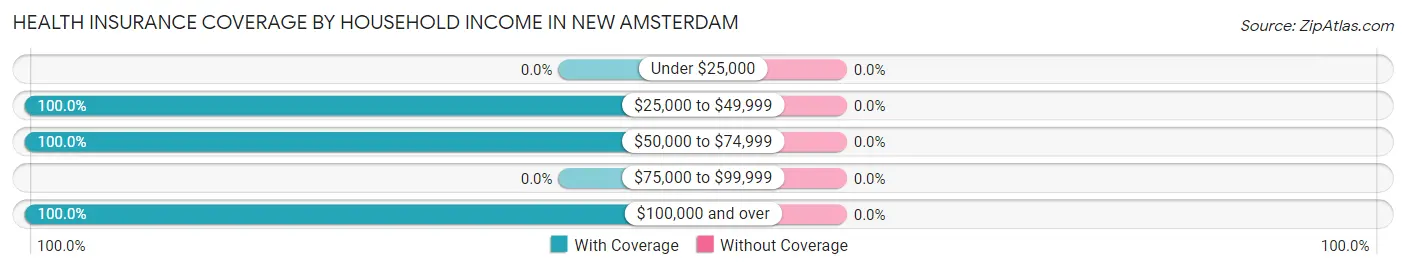
| Household Income | With Coverage | Without Coverage |
| Under $25,000 | 0 (0.0%) | 0 (0.0%) |
| $25,000 to $49,999 | 3 (100.0%) | 0 (0.0%) |
| $50,000 to $74,999 | 4 (100.0%) | 0 (0.0%) |
| $75,000 to $99,999 | 0 (0.0%) | 0 (0.0%) |
| $100,000 and over | 93 (100.0%) | 0 (0.0%) |
Public vs Private Health Insurance Coverage by Age in New Amsterdam
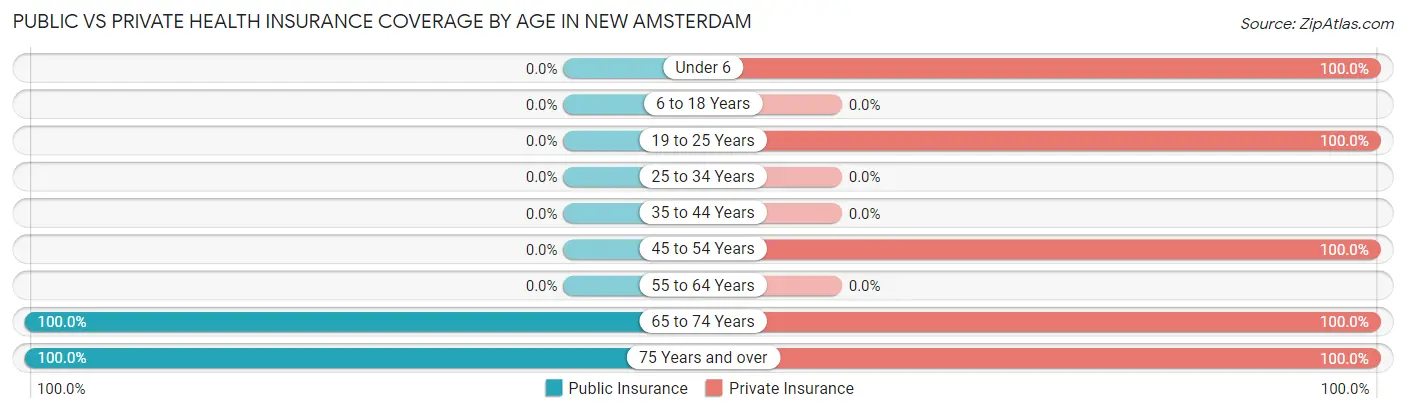
| Age Bracket | Public Insurance | Private Insurance |
| Under 6 | 0 (0.0%) | 1 (100.0%) |
| 6 to 18 Years | 0 (0.0%) | 0 (0.0%) |
| 19 to 25 Years | 0 (0.0%) | 41 (100.0%) |
| 25 to 34 Years | 0 (0.0%) | 0 (0.0%) |
| 35 to 44 Years | 0 (0.0%) | 0 (0.0%) |
| 45 to 54 Years | 0 (0.0%) | 52 (100.0%) |
| 55 to 64 Years | 0 (0.0%) | 0 (0.0%) |
| 65 to 74 Years | 1 (100.0%) | 1 (100.0%) |
| 75 Years and over | 5 (100.0%) | 5 (100.0%) |
| Total | 6 (6.0%) | 100 (100.0%) |
Disability Status by Sex by Age in New Amsterdam
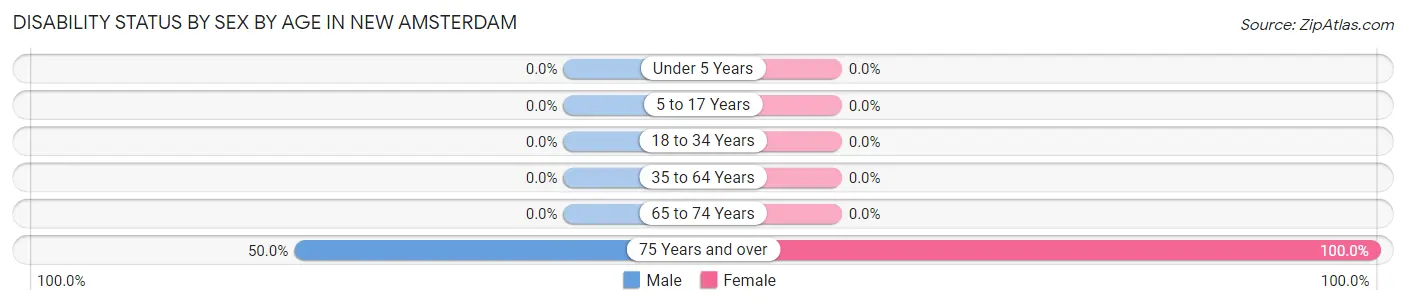
| Age Bracket | Male | Female |
| Under 5 Years | 0 (0.0%) | 0 (0.0%) |
| 5 to 17 Years | 0 (0.0%) | 0 (0.0%) |
| 18 to 34 Years | 0 (0.0%) | 0 (0.0%) |
| 35 to 64 Years | 0 (0.0%) | 0 (0.0%) |
| 65 to 74 Years | 0 (0.0%) | 0 (0.0%) |
| 75 Years and over | 1 (50.0%) | 3 (100.0%) |
Disability Class by Sex by Age in New Amsterdam
Disability Class: Hearing Difficulty
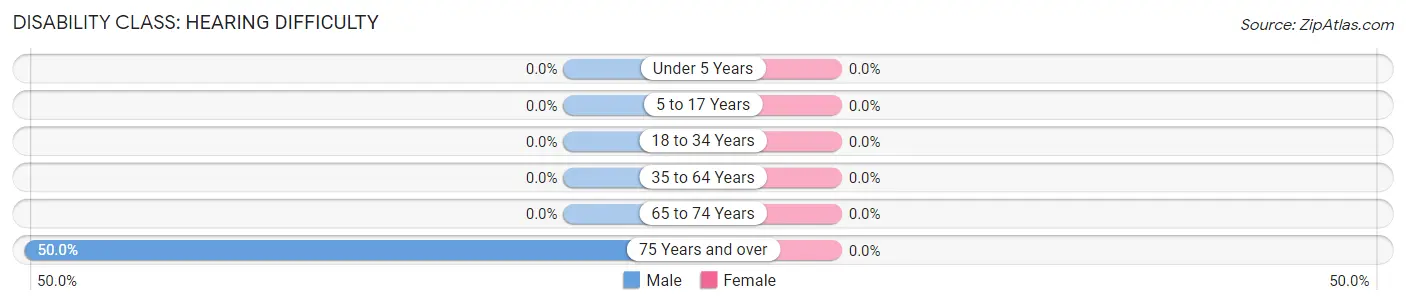
| Age Bracket | Male | Female |
| Under 5 Years | 0 (0.0%) | 0 (0.0%) |
| 5 to 17 Years | 0 (0.0%) | 0 (0.0%) |
| 18 to 34 Years | 0 (0.0%) | 0 (0.0%) |
| 35 to 64 Years | 0 (0.0%) | 0 (0.0%) |
| 65 to 74 Years | 0 (0.0%) | 0 (0.0%) |
| 75 Years and over | 1 (50.0%) | 0 (0.0%) |
Disability Class: Vision Difficulty
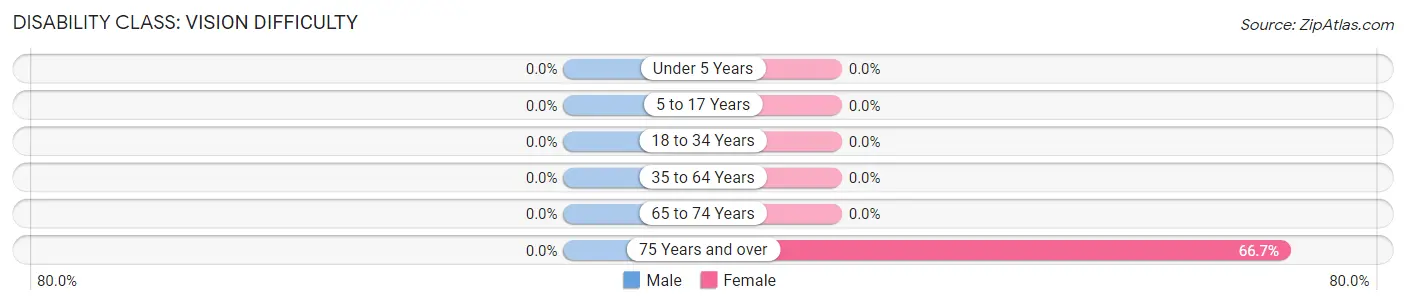
| Age Bracket | Male | Female |
| Under 5 Years | 0 (0.0%) | 0 (0.0%) |
| 5 to 17 Years | 0 (0.0%) | 0 (0.0%) |
| 18 to 34 Years | 0 (0.0%) | 0 (0.0%) |
| 35 to 64 Years | 0 (0.0%) | 0 (0.0%) |
| 65 to 74 Years | 0 (0.0%) | 0 (0.0%) |
| 75 Years and over | 0 (0.0%) | 2 (66.7%) |
Disability Class: Cognitive Difficulty
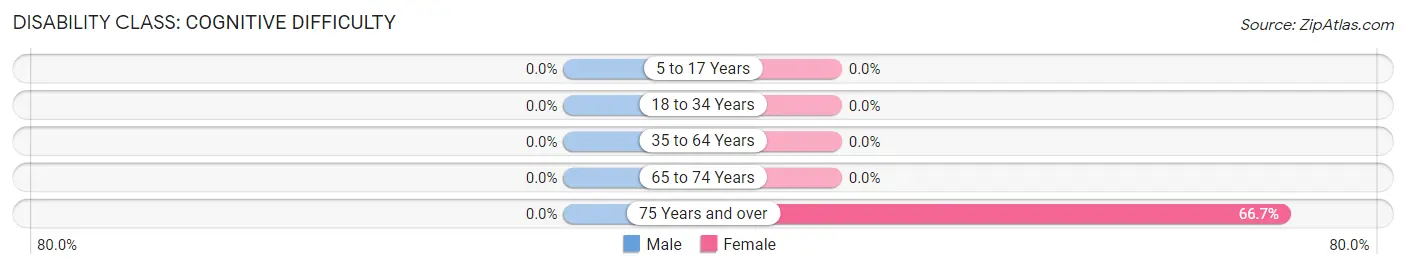
| Age Bracket | Male | Female |
| 5 to 17 Years | 0 (0.0%) | 0 (0.0%) |
| 18 to 34 Years | 0 (0.0%) | 0 (0.0%) |
| 35 to 64 Years | 0 (0.0%) | 0 (0.0%) |
| 65 to 74 Years | 0 (0.0%) | 0 (0.0%) |
| 75 Years and over | 0 (0.0%) | 2 (66.7%) |
Disability Class: Ambulatory Difficulty
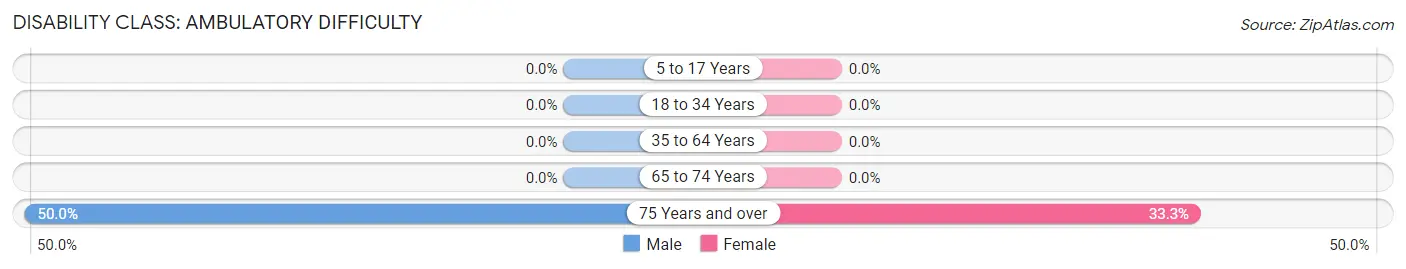
| Age Bracket | Male | Female |
| 5 to 17 Years | 0 (0.0%) | 0 (0.0%) |
| 18 to 34 Years | 0 (0.0%) | 0 (0.0%) |
| 35 to 64 Years | 0 (0.0%) | 0 (0.0%) |
| 65 to 74 Years | 0 (0.0%) | 0 (0.0%) |
| 75 Years and over | 1 (50.0%) | 1 (33.3%) |
Disability Class: Self-Care Difficulty
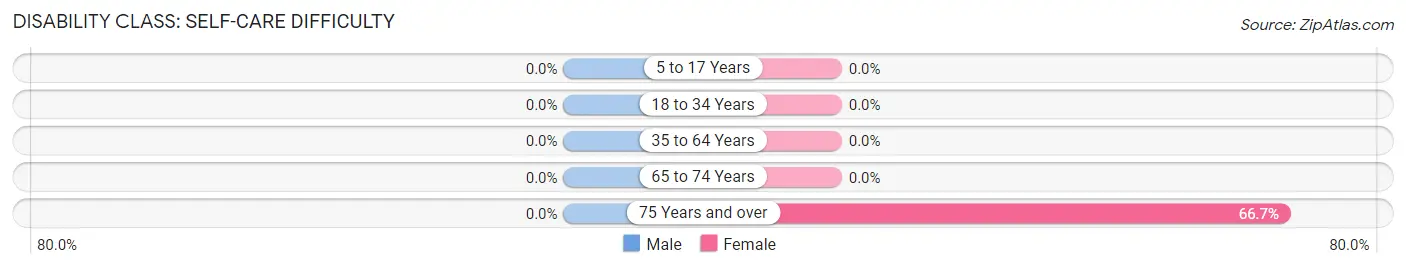
| Age Bracket | Male | Female |
| 5 to 17 Years | 0 (0.0%) | 0 (0.0%) |
| 18 to 34 Years | 0 (0.0%) | 0 (0.0%) |
| 35 to 64 Years | 0 (0.0%) | 0 (0.0%) |
| 65 to 74 Years | 0 (0.0%) | 0 (0.0%) |
| 75 Years and over | 0 (0.0%) | 2 (66.7%) |
Technology Access in New Amsterdam
Computing Device Access in New Amsterdam
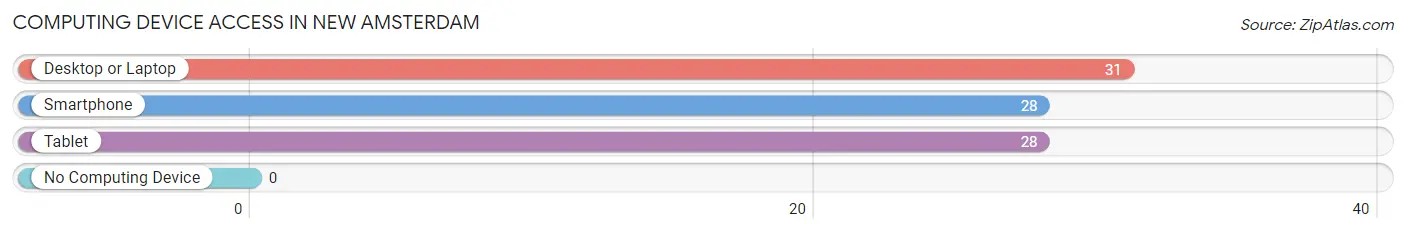
| Device Type | # Households | % Households |
| Desktop or Laptop | 31 | 100.0% |
| Smartphone | 28 | 90.3% |
| Tablet | 28 | 90.3% |
| No Computing Device | 0 | 0.0% |
| Total | 31 | 100.0% |
Internet Access in New Amsterdam
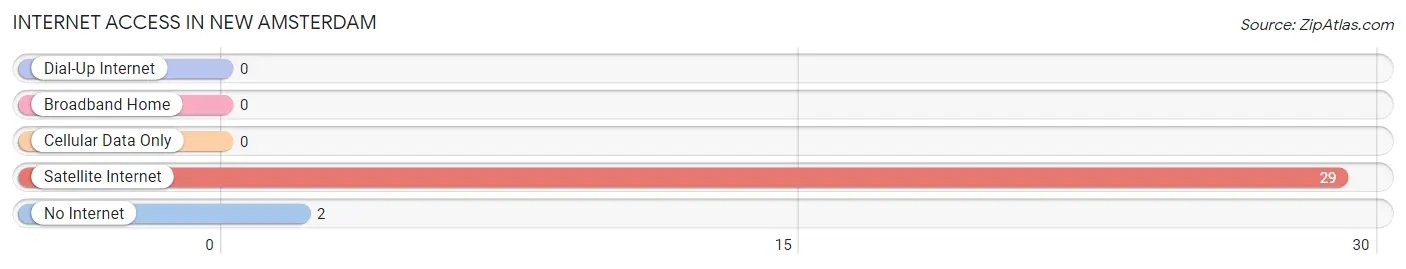
| Internet Type | # Households | % Households |
| Dial-Up Internet | 0 | 0.0% |
| Broadband Home | 0 | 0.0% |
| Cellular Data Only | 0 | 0.0% |
| Satellite Internet | 29 | 93.5% |
| No Internet | 2 | 6.5% |
| Total | 31 | 100.0% |
New Amsterdam Summary
New Amsterdam is a small town located in the state of Indiana, United States. It is situated in the northern part of the state, in the county of Allen. The town has a population of approximately 1,000 people, and is part of the Fort Wayne metropolitan area.
History
New Amsterdam was founded in 1837 by a group of settlers from the Netherlands. The town was named after the Dutch city of Amsterdam, and was originally intended to be a Dutch settlement. The settlers built a church, a school, and a few other buildings, and the town quickly grew.
In 1841, the town was incorporated as a village, and in 1845 it was officially recognized as a town. The town continued to grow, and by the late 19th century it had become a thriving community.
In the early 20th century, the town experienced a period of decline, as many of its residents moved away in search of better opportunities. However, in the late 20th century, the town began to experience a resurgence, as new businesses and industries moved into the area.
Geography
New Amsterdam is located in the northern part of Indiana, in the county of Allen. The town is situated on the banks of the Maumee River, and is surrounded by rolling hills and farmland. The town is located approximately 25 miles from Fort Wayne, the state’s second largest city.
The climate in New Amsterdam is generally mild, with hot summers and cold winters. The average temperature in the summer is around 75 degrees Fahrenheit, and in the winter it is around 30 degrees Fahrenheit.
Economy
The economy of New Amsterdam is largely based on agriculture and manufacturing. The town is home to several large farms, which produce a variety of crops, including corn, soybeans, and wheat. The town is also home to several manufacturing companies, which produce a variety of products, including furniture, clothing, and automotive parts.
In addition to agriculture and manufacturing, the town is also home to several small businesses, including restaurants, shops, and other services. The town is also home to a number of tourist attractions, including a historic museum and a nature center.
Demographics
As of the 2010 census, the population of New Amsterdam was 1,000 people. The town is predominantly white, with approximately 95% of the population being of European descent. The town also has a small Hispanic population, with approximately 5% of the population being of Hispanic or Latino origin.
The median household income in New Amsterdam is approximately $45,000, and the median home value is approximately $100,000. The town has a low unemployment rate, and the majority of the population is employed in either agriculture or manufacturing.
Conclusion
New Amsterdam is a small town located in the northern part of Indiana, United States. The town was founded in 1837 by a group of settlers from the Netherlands, and has since grown into a thriving community. The town’s economy is largely based on agriculture and manufacturing, and the town is home to several tourist attractions. The population of New Amsterdam is predominantly white, with a small Hispanic population. The town has a low unemployment rate, and the median household income is approximately $45,000.
Common Questions
What is Per Capita Income in New Amsterdam?
Per Capita income in New Amsterdam is $33,138.
What is the Median Family Income in New Amsterdam?
Median Family Income in New Amsterdam is $103,565.
What is the Median Household income in New Amsterdam?
Median Household Income in New Amsterdam is $103,565.
What is Inequality or Gini Index in New Amsterdam?
Inequality or Gini Index in New Amsterdam is 0.06.
What is the Total Population of New Amsterdam?
Total Population of New Amsterdam is 100.
What is the Total Male Population of New Amsterdam?
Total Male Population of New Amsterdam is 70.
What is the Total Female Population of New Amsterdam?
Total Female Population of New Amsterdam is 30.
What is the Ratio of Males per 100 Females in New Amsterdam?
There are 233.33 Males per 100 Females in New Amsterdam.
What is the Ratio of Females per 100 Males in New Amsterdam?
There are 42.86 Females per 100 Males in New Amsterdam.
What is the Median Population Age in New Amsterdam?
Median Population Age in New Amsterdam is 50.3 Years.
What is the Average Family Size in New Amsterdam
Average Family Size in New Amsterdam is 3.2 People.
What is the Average Household Size in New Amsterdam
Average Household Size in New Amsterdam is 3.2 People.
How Large is the Labor Force in New Amsterdam?
There are 95 People in the Labor Forcein in New Amsterdam.
What is the Percentage of People in the Labor Force in New Amsterdam?
96.0% of People are in the Labor Force in New Amsterdam.
What is the Unemployment Rate in New Amsterdam?
Unemployment Rate in New Amsterdam is 2.1%.