Valencia, NM Map & Demographics
Valencia Map
Valencia Overview
$34,286
PER CAPITA INCOME
$73,250
AVG FAMILY INCOME
$59,743
AVG HOUSEHOLD INCOME
28.1%
WAGE / INCOME GAP [ % ]
71.9¢/ $1
WAGE / INCOME GAP [ $ ]
0.41
INEQUALITY / GINI INDEX
2,012
TOTAL POPULATION
1,120
MALE POPULATION
892
FEMALE POPULATION
125.56
MALES / 100 FEMALES
79.64
FEMALES / 100 MALES
42.5
MEDIAN AGE
3.7
AVG FAMILY SIZE
2.6
AVG HOUSEHOLD SIZE
993
LABOR FORCE [ PEOPLE ]
58.6%
PERCENT IN LABOR FORCE
8.3%
UNEMPLOYMENT RATE
Income in Valencia
Income Overview in Valencia
Per Capita Income in Valencia is $34,286, while median incomes of families and households are $73,250 and $59,743 respectively.
| Characteristic | Number | Measure |
| Per Capita Income | 2,012 | $34,286 |
| Median Family Income | 391 | $73,250 |
| Mean Family Income | 391 | $94,584 |
| Median Household Income | 785 | $59,743 |
| Mean Household Income | 785 | $77,230 |
| Income Deficit | 391 | $0 |
| Wage / Income Gap (%) | 2,012 | 28.10% |
| Wage / Income Gap ($) | 2,012 | 71.90¢ per $1 |
| Gini / Inequality Index | 2,012 | 0.41 |
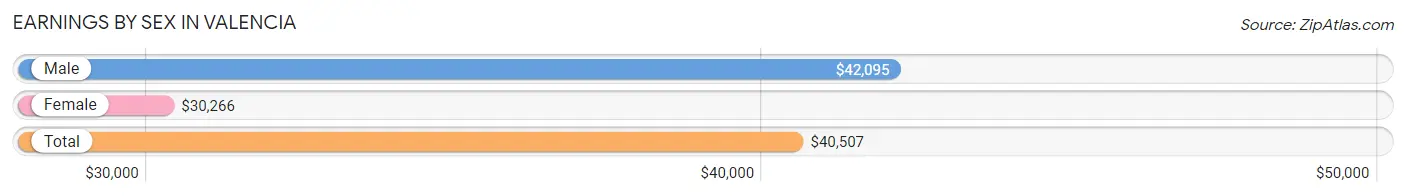
Earnings by Sex in Valencia
Average Earnings in Valencia are $40,507, $42,095 for men and $30,266 for women, a difference of 28.1%.
| Sex | Number | Average Earnings |
| Male | 588 (56.3%) | $42,095 |
| Female | 456 (43.7%) | $30,266 |
| Total | 1,044 (100.0%) | $40,507 |
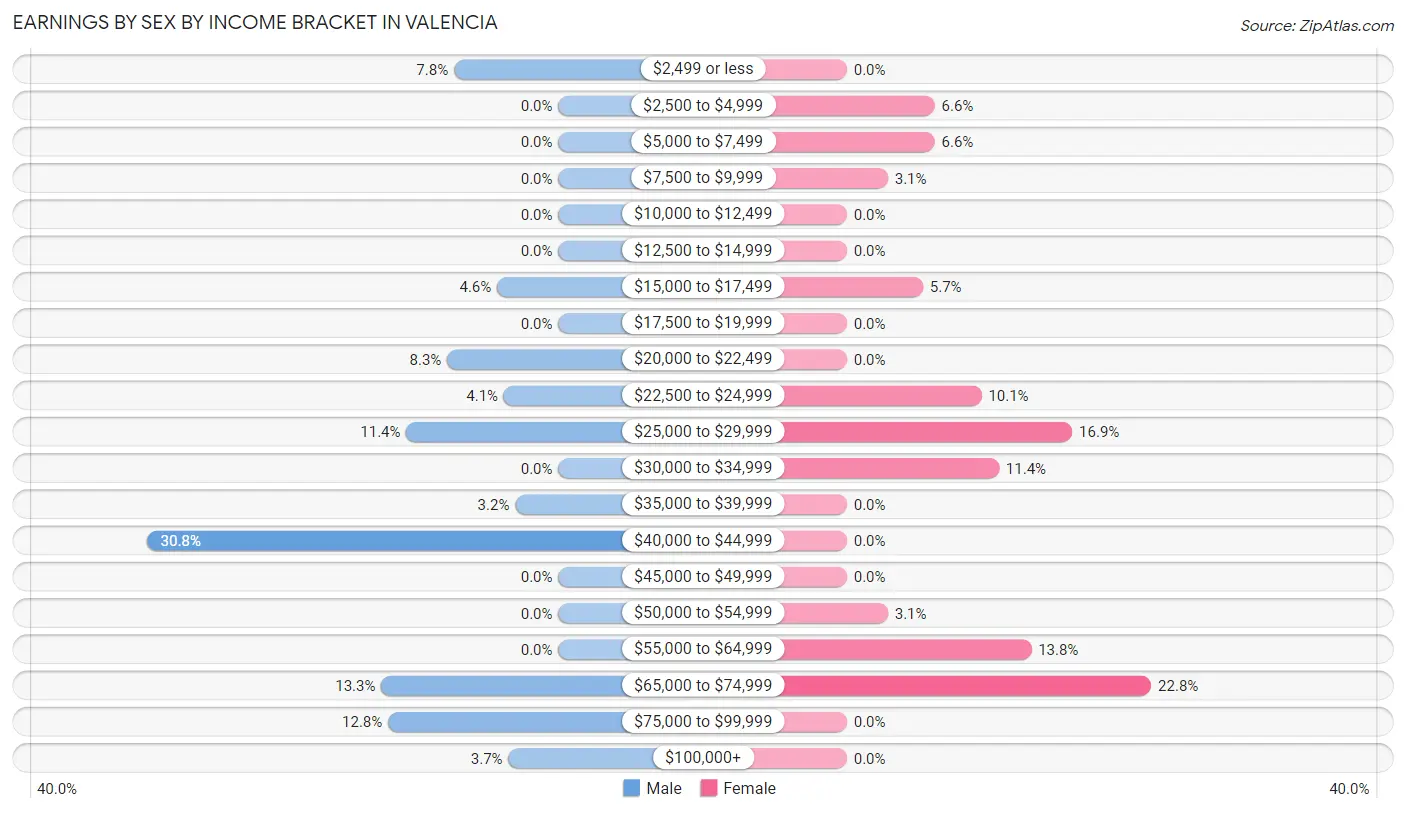
Earnings by Sex by Income Bracket in Valencia
The most common earnings brackets in Valencia are $40,000 to $44,999 for men (181 | 30.8%) and $65,000 to $74,999 for women (104 | 22.8%).
| Income | Male | Female |
| $2,499 or less | 46 (7.8%) | 0 (0.0%) |
| $2,500 to $4,999 | 0 (0.0%) | 30 (6.6%) |
| $5,000 to $7,499 | 0 (0.0%) | 30 (6.6%) |
| $7,500 to $9,999 | 0 (0.0%) | 14 (3.1%) |
| $10,000 to $12,499 | 0 (0.0%) | 0 (0.0%) |
| $12,500 to $14,999 | 0 (0.0%) | 0 (0.0%) |
| $15,000 to $17,499 | 27 (4.6%) | 26 (5.7%) |
| $17,500 to $19,999 | 0 (0.0%) | 0 (0.0%) |
| $20,000 to $22,499 | 49 (8.3%) | 0 (0.0%) |
| $22,500 to $24,999 | 24 (4.1%) | 46 (10.1%) |
| $25,000 to $29,999 | 67 (11.4%) | 77 (16.9%) |
| $30,000 to $34,999 | 0 (0.0%) | 52 (11.4%) |
| $35,000 to $39,999 | 19 (3.2%) | 0 (0.0%) |
| $40,000 to $44,999 | 181 (30.8%) | 0 (0.0%) |
| $45,000 to $49,999 | 0 (0.0%) | 0 (0.0%) |
| $50,000 to $54,999 | 0 (0.0%) | 14 (3.1%) |
| $55,000 to $64,999 | 0 (0.0%) | 63 (13.8%) |
| $65,000 to $74,999 | 78 (13.3%) | 104 (22.8%) |
| $75,000 to $99,999 | 75 (12.8%) | 0 (0.0%) |
| $100,000+ | 22 (3.7%) | 0 (0.0%) |
| Total | 588 (100.0%) | 456 (100.0%) |
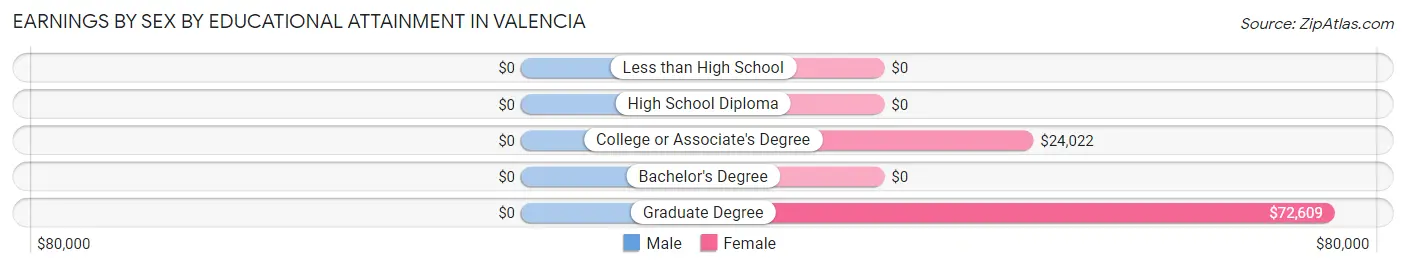
Earnings by Sex by Educational Attainment in Valencia
| Educational Attainment | Male Income | Female Income |
| Less than High School | - | - |
| High School Diploma | - | - |
| College or Associate's Degree | - | - |
| Bachelor's Degree | - | - |
| Graduate Degree | - | - |
| Total | $43,645 | $30,266 |
Family Income in Valencia
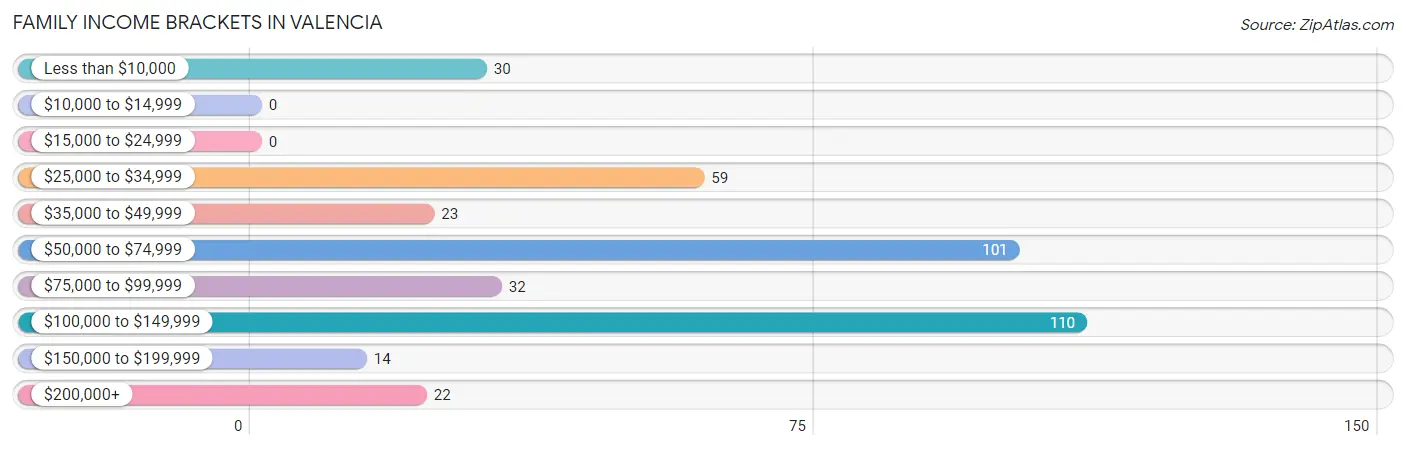
Family Income Brackets in Valencia
According to the Valencia family income data, there are 110 families falling into the $100,000 to $149,999 income range, which is the most common income bracket and makes up 28.1% of all families.
| Income Bracket | # Families | % Families |
| Less than $10,000 | 30 | 7.7% |
| $10,000 to $14,999 | 0 | 0.0% |
| $15,000 to $24,999 | 0 | 0.0% |
| $25,000 to $34,999 | 59 | 15.1% |
| $35,000 to $49,999 | 23 | 5.9% |
| $50,000 to $74,999 | 101 | 25.8% |
| $75,000 to $99,999 | 32 | 8.2% |
| $100,000 to $149,999 | 110 | 28.1% |
| $150,000 to $199,999 | 14 | 3.6% |
| $200,000+ | 22 | 5.6% |
Family Income by Famaliy Size in Valencia
| Income Bracket | # Families | Median Income |
| 2-Person Families | 238 (60.9%) | $0 |
| 3-Person Families | 77 (19.7%) | $0 |
| 4-Person Families | 41 (10.5%) | $0 |
| 5-Person Families | 13 (3.3%) | $0 |
| 6-Person Families | 22 (5.6%) | $0 |
| 7+ Person Families | 0 (0.0%) | $0 |
| Total | 391 (100.0%) | $73,250 |
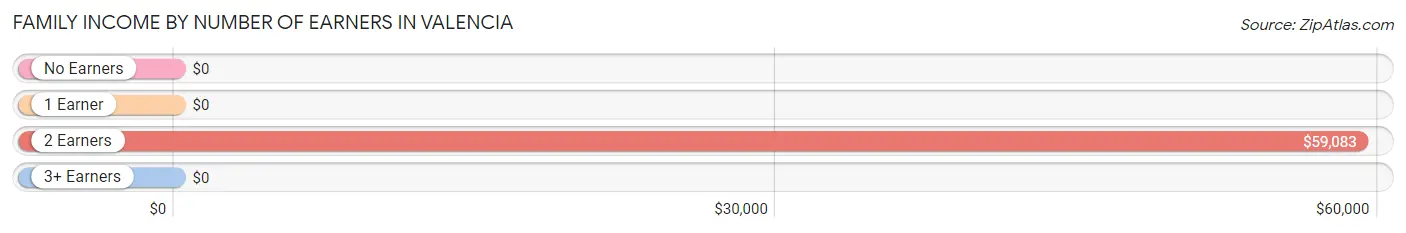
Family Income by Number of Earners in Valencia
| Number of Earners | # Families | Median Income |
| No Earners | 97 (24.8%) | $0 |
| 1 Earner | 177 (45.3%) | $0 |
| 2 Earners | 95 (24.3%) | $59,083 |
| 3+ Earners | 22 (5.6%) | $0 |
| Total | 391 (100.0%) | $73,250 |
Household Income in Valencia
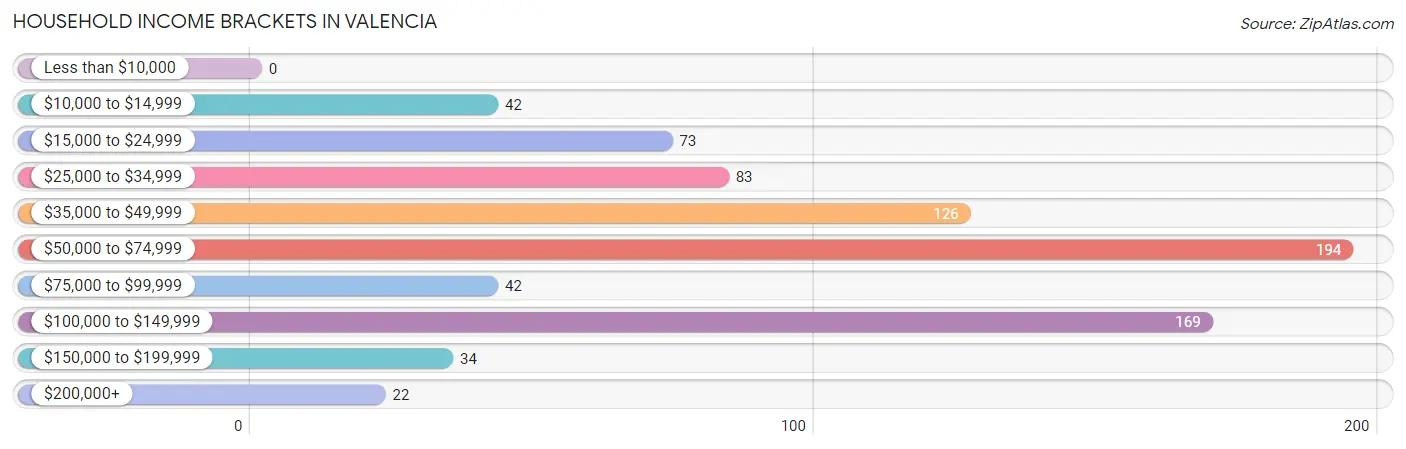
Household Income Brackets in Valencia
With 194 households falling in the category, the $50,000 to $74,999 income range is the most frequent in Valencia, accounting for 24.7% of all households.
| Income Bracket | # Households | % Households |
| Less than $10,000 | 0 | 0.0% |
| $10,000 to $14,999 | 42 | 5.4% |
| $15,000 to $24,999 | 73 | 9.3% |
| $25,000 to $34,999 | 83 | 10.6% |
| $35,000 to $49,999 | 126 | 16.1% |
| $50,000 to $74,999 | 194 | 24.7% |
| $75,000 to $99,999 | 42 | 5.4% |
| $100,000 to $149,999 | 169 | 21.5% |
| $150,000 to $199,999 | 34 | 4.3% |
| $200,000+ | 22 | 2.8% |
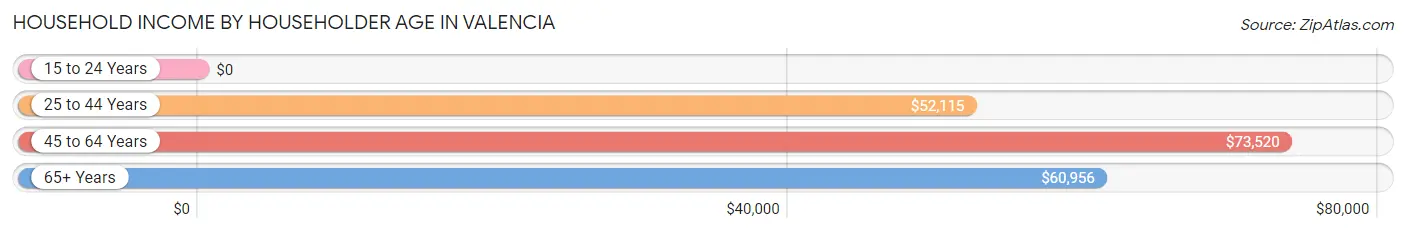
Household Income by Householder Age in Valencia
The median household income in Valencia is $59,743, with the highest median household income of $73,520 found in the 45 to 64 years age bracket for the primary householder. A total of 431 households (54.9%) fall into this category. Meanwhile, the 15 to 24 years age bracket for the primary householder has the lowest median household income of $0, with 49 households (6.2%) in this group.
| Income Bracket | # Households | Median Income |
| 15 to 24 Years | 49 (6.2%) | $0 |
| 25 to 44 Years | 156 (19.9%) | $52,115 |
| 45 to 64 Years | 431 (54.9%) | $73,520 |
| 65+ Years | 149 (19.0%) | $60,956 |
| Total | 785 (100.0%) | $59,743 |
Poverty in Valencia
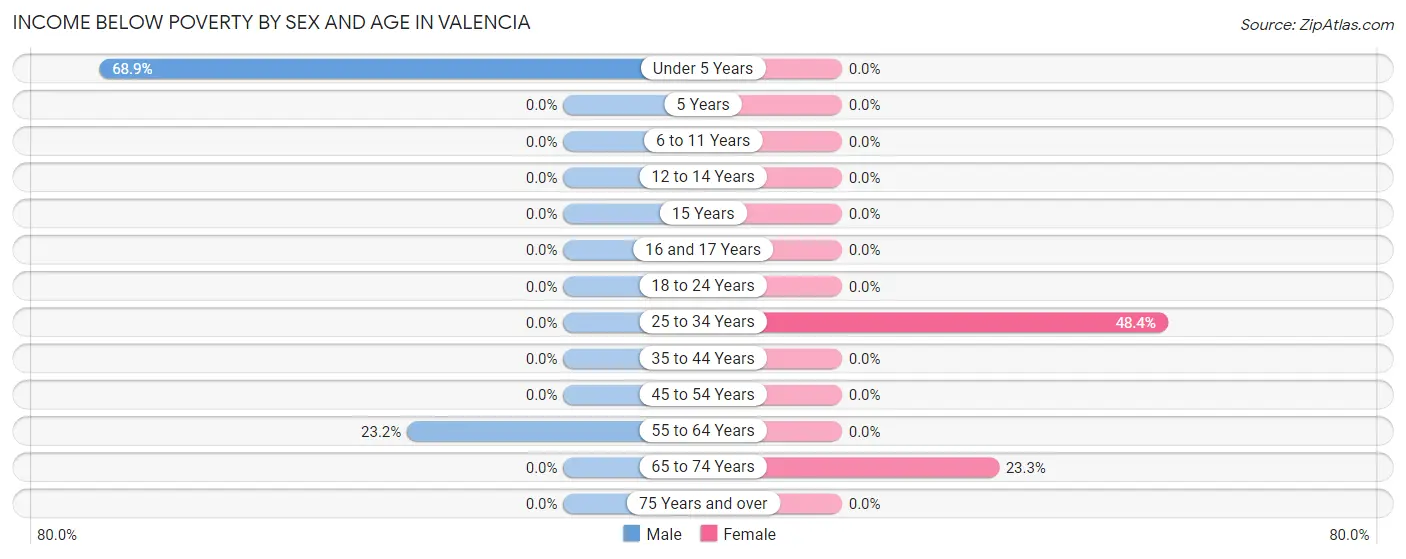
Income Below Poverty by Sex and Age in Valencia
With 11.1% poverty level for males and 12.1% for females among the residents of Valencia, under 5 year old males and 25 to 34 year old females are the most vulnerable to poverty, with 82 males (68.9%) and 60 females (48.4%) in their respective age groups living below the poverty level.
| Age Bracket | Male | Female |
| Under 5 Years | 82 (68.9%) | 0 (0.0%) |
| 5 Years | 0 (0.0%) | 0 (0.0%) |
| 6 to 11 Years | 0 (0.0%) | 0 (0.0%) |
| 12 to 14 Years | 0 (0.0%) | 0 (0.0%) |
| 15 Years | 0 (0.0%) | 0 (0.0%) |
| 16 and 17 Years | 0 (0.0%) | 0 (0.0%) |
| 18 to 24 Years | 0 (0.0%) | 0 (0.0%) |
| 25 to 34 Years | 0 (0.0%) | 60 (48.4%) |
| 35 to 44 Years | 0 (0.0%) | 0 (0.0%) |
| 45 to 54 Years | 0 (0.0%) | 0 (0.0%) |
| 55 to 64 Years | 42 (23.2%) | 0 (0.0%) |
| 65 to 74 Years | 0 (0.0%) | 48 (23.3%) |
| 75 Years and over | 0 (0.0%) | 0 (0.0%) |
| Total | 124 (11.1%) | 108 (12.1%) |
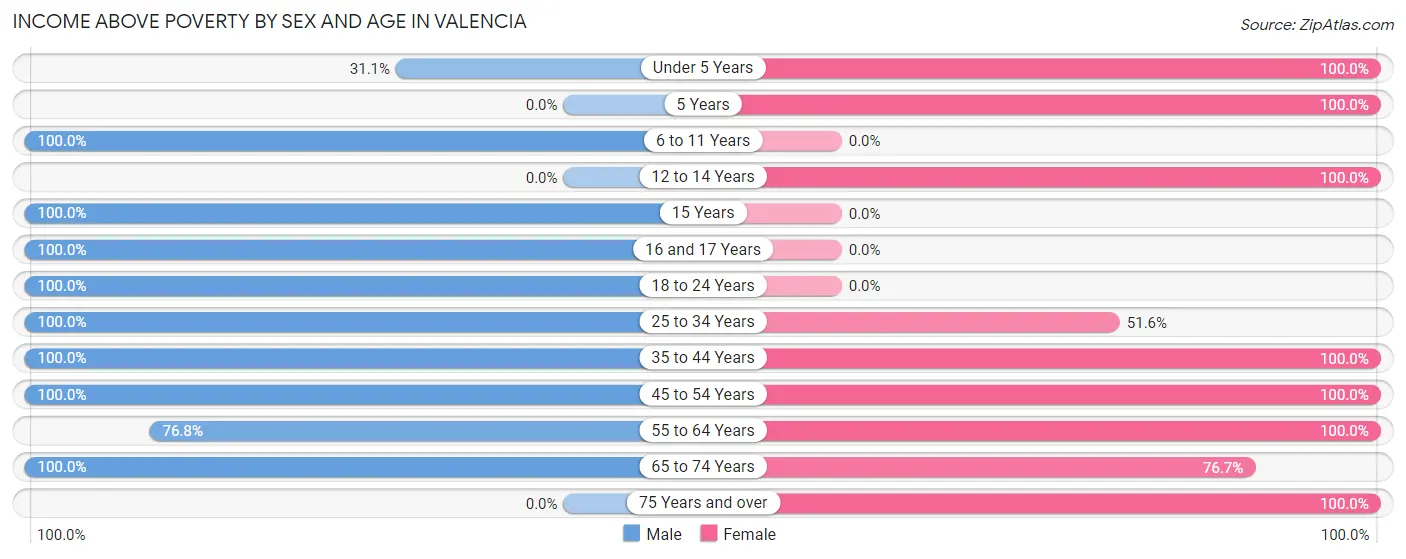
Income Above Poverty by Sex and Age in Valencia
According to the poverty statistics in Valencia, males aged 6 to 11 years and females aged under 5 years are the age groups that are most secure financially, with 100.0% of males and 100.0% of females in these age groups living above the poverty line.
| Age Bracket | Male | Female |
| Under 5 Years | 37 (31.1%) | 21 (100.0%) |
| 5 Years | 0 (0.0%) | 34 (100.0%) |
| 6 to 11 Years | 52 (100.0%) | 0 (0.0%) |
| 12 to 14 Years | 0 (0.0%) | 65 (100.0%) |
| 15 Years | 26 (100.0%) | 0 (0.0%) |
| 16 and 17 Years | 46 (100.0%) | 0 (0.0%) |
| 18 to 24 Years | 76 (100.0%) | 0 (0.0%) |
| 25 to 34 Years | 353 (100.0%) | 64 (51.6%) |
| 35 to 44 Years | 22 (100.0%) | 92 (100.0%) |
| 45 to 54 Years | 126 (100.0%) | 93 (100.0%) |
| 55 to 64 Years | 139 (76.8%) | 240 (100.0%) |
| 65 to 74 Years | 119 (100.0%) | 158 (76.7%) |
| 75 Years and over | 0 (0.0%) | 17 (100.0%) |
| Total | 996 (88.9%) | 784 (87.9%) |
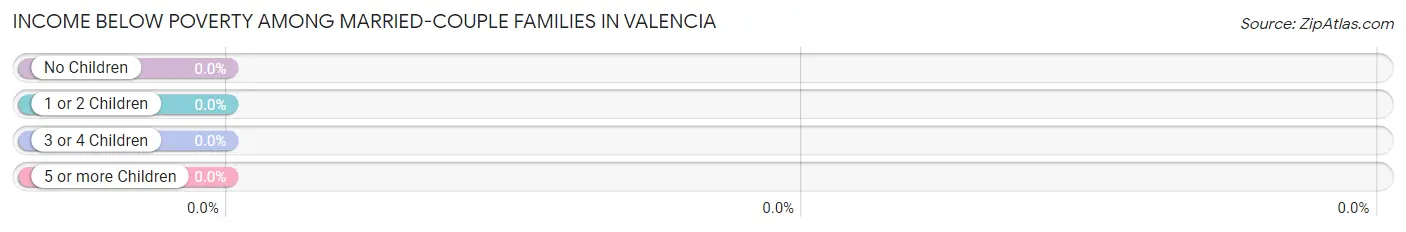
Income Below Poverty Among Married-Couple Families in Valencia
| Children | Above Poverty | Below Poverty |
| No Children | 174 (100.0%) | 0 (0.0%) |
| 1 or 2 Children | 39 (100.0%) | 0 (0.0%) |
| 3 or 4 Children | 22 (100.0%) | 0 (0.0%) |
| 5 or more Children | 0 (0.0%) | 0 (0.0%) |
| Total | 235 (100.0%) | 0 (0.0%) |
Income Below Poverty Among Single-Parent Households in Valencia
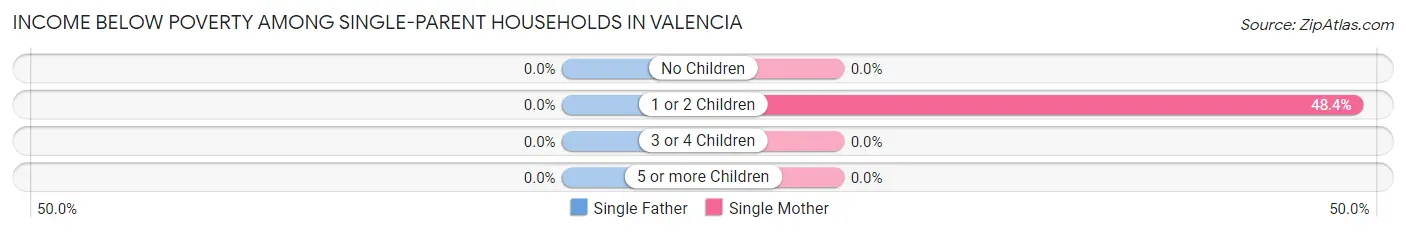
| Children | Single Father | Single Mother |
| No Children | 0 (0.0%) | 0 (0.0%) |
| 1 or 2 Children | 0 (0.0%) | 30 (48.4%) |
| 3 or 4 Children | 0 (0.0%) | 0 (0.0%) |
| 5 or more Children | 0 (0.0%) | 0 (0.0%) |
| Total | 0 (0.0%) | 30 (26.3%) |
Income Below Poverty Among Married-Couple vs Single-Parent Households in Valencia
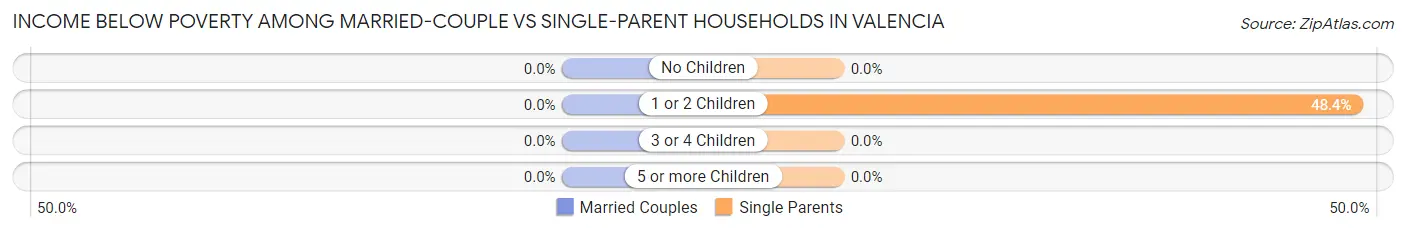
| Children | Married-Couple Families | Single-Parent Households |
| No Children | 0 (0.0%) | 0 (0.0%) |
| 1 or 2 Children | 0 (0.0%) | 30 (48.4%) |
| 3 or 4 Children | 0 (0.0%) | 0 (0.0%) |
| 5 or more Children | 0 (0.0%) | 0 (0.0%) |
| Total | 0 (0.0%) | 30 (19.2%) |
Race in Valencia
The most populous races in Valencia are White / Caucasian (1,310 | 65.1%), Hispanic or Latino (1,305 | 64.9%), and Two or more Races (603 | 30.0%).
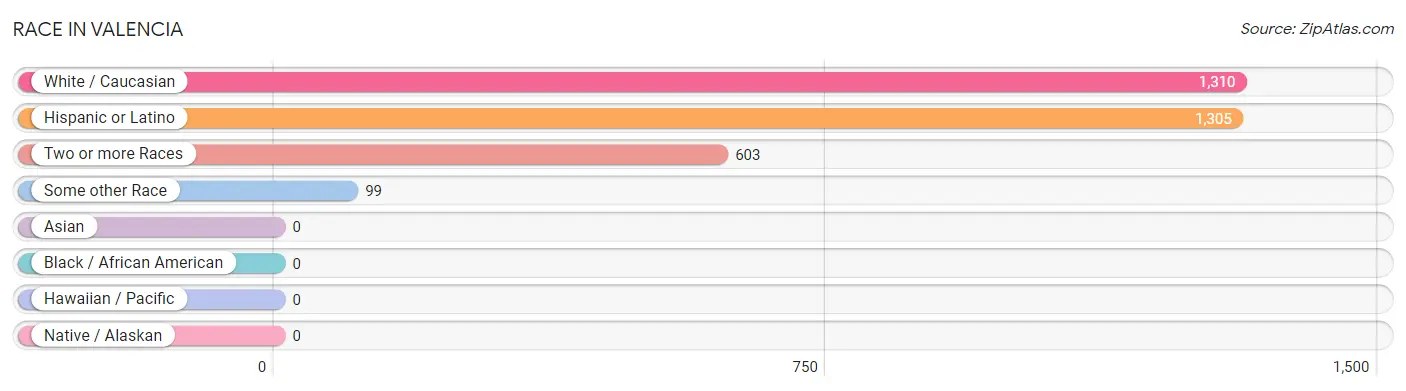
| Race | # Population | % Population |
| Asian | 0 | 0.0% |
| Black / African American | 0 | 0.0% |
| Hawaiian / Pacific | 0 | 0.0% |
| Hispanic or Latino | 1,305 | 64.9% |
| Native / Alaskan | 0 | 0.0% |
| White / Caucasian | 1,310 | 65.1% |
| Two or more Races | 603 | 30.0% |
| Some other Race | 99 | 4.9% |
| Total | 2,012 | 100.0% |
Ancestry in Valencia
The most populous ancestries reported in Valencia are Mexican (692 | 34.4%), American (254 | 12.6%), Spaniard (170 | 8.5%), Italian (153 | 7.6%), and German (146 | 7.3%), together accounting for 70.3% of all Valencia residents.
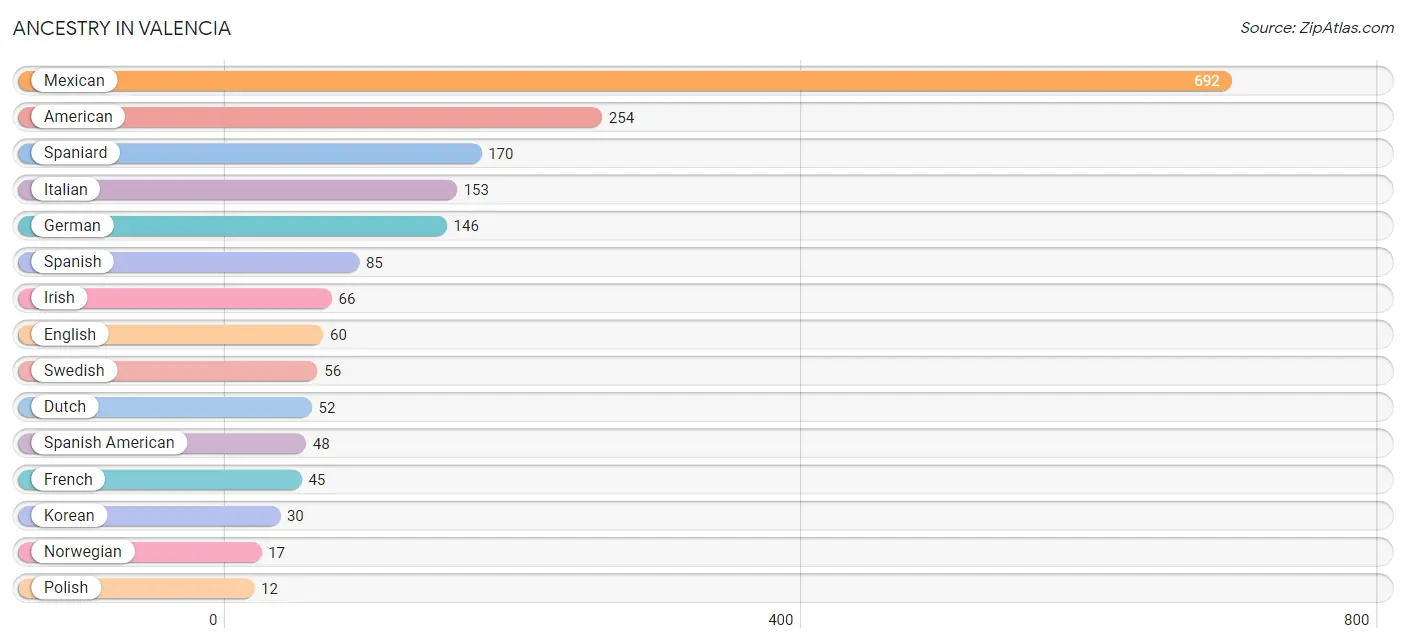
| Ancestry | # Population | % Population |
| American | 254 | 12.6% |
| Dutch | 52 | 2.6% |
| English | 60 | 3.0% |
| French | 45 | 2.2% |
| German | 146 | 7.3% |
| Irish | 66 | 3.3% |
| Italian | 153 | 7.6% |
| Korean | 30 | 1.5% |
| Mexican | 692 | 34.4% |
| Norwegian | 17 | 0.8% |
| Polish | 12 | 0.6% |
| Scotch-Irish | 10 | 0.5% |
| Spaniard | 170 | 8.5% |
| Spanish | 85 | 4.2% |
| Spanish American | 48 | 2.4% |
| Swedish | 56 | 2.8% |
| Yugoslavian | 5 | 0.3% | View All 17 Rows |
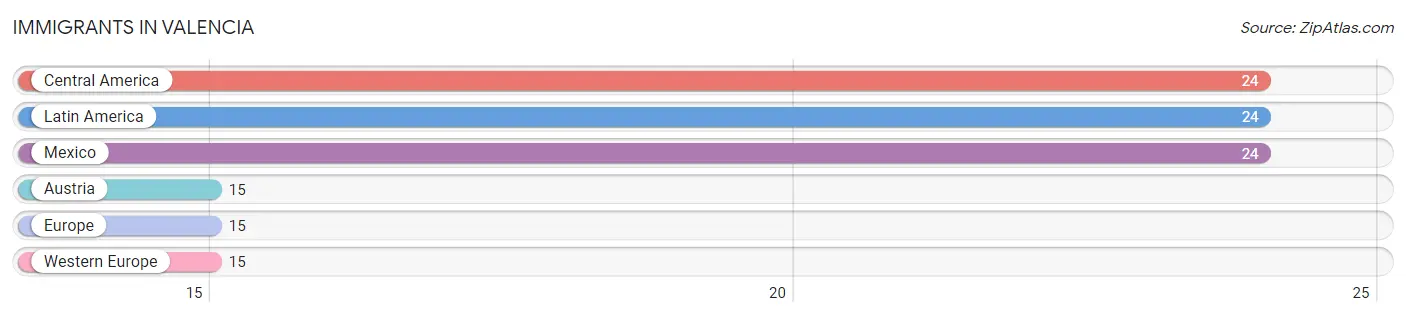
Immigrants in Valencia
The most numerous immigrant groups reported in Valencia came from Central America (24 | 1.2%), Latin America (24 | 1.2%), Mexico (24 | 1.2%), Austria (15 | 0.7%), and Europe (15 | 0.7%), together accounting for 5.1% of all Valencia residents.
| Immigration Origin | # Population | % Population |
| Austria | 15 | 0.7% |
| Central America | 24 | 1.2% |
| Europe | 15 | 0.7% |
| Latin America | 24 | 1.2% |
| Mexico | 24 | 1.2% |
| Western Europe | 15 | 0.7% | View All 6 Rows |
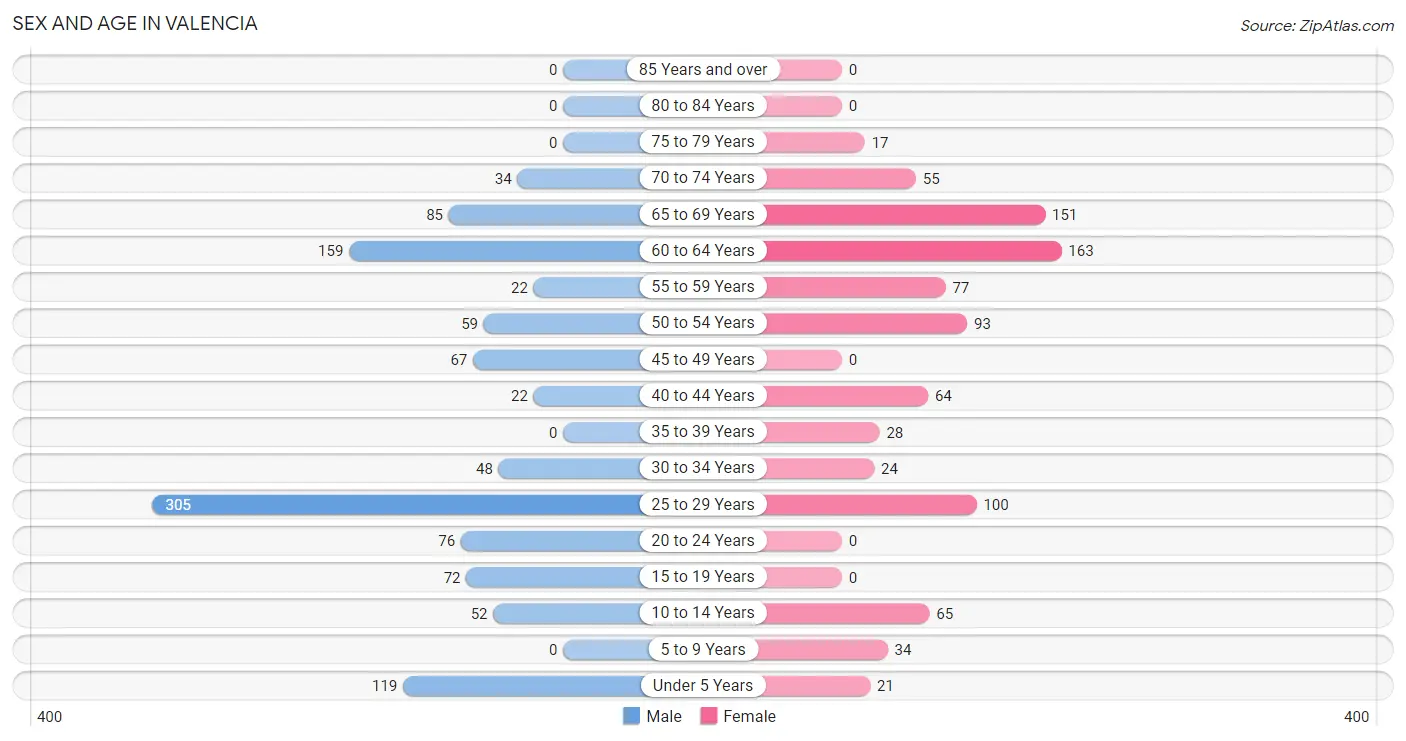
Sex and Age in Valencia
Sex and Age in Valencia
The most populous age groups in Valencia are 25 to 29 Years (305 | 27.2%) for men and 60 to 64 Years (163 | 18.3%) for women.
| Age Bracket | Male | Female |
| Under 5 Years | 119 (10.6%) | 21 (2.4%) |
| 5 to 9 Years | 0 (0.0%) | 34 (3.8%) |
| 10 to 14 Years | 52 (4.6%) | 65 (7.3%) |
| 15 to 19 Years | 72 (6.4%) | 0 (0.0%) |
| 20 to 24 Years | 76 (6.8%) | 0 (0.0%) |
| 25 to 29 Years | 305 (27.2%) | 100 (11.2%) |
| 30 to 34 Years | 48 (4.3%) | 24 (2.7%) |
| 35 to 39 Years | 0 (0.0%) | 28 (3.1%) |
| 40 to 44 Years | 22 (2.0%) | 64 (7.2%) |
| 45 to 49 Years | 67 (6.0%) | 0 (0.0%) |
| 50 to 54 Years | 59 (5.3%) | 93 (10.4%) |
| 55 to 59 Years | 22 (2.0%) | 77 (8.6%) |
| 60 to 64 Years | 159 (14.2%) | 163 (18.3%) |
| 65 to 69 Years | 85 (7.6%) | 151 (16.9%) |
| 70 to 74 Years | 34 (3.0%) | 55 (6.2%) |
| 75 to 79 Years | 0 (0.0%) | 17 (1.9%) |
| 80 to 84 Years | 0 (0.0%) | 0 (0.0%) |
| 85 Years and over | 0 (0.0%) | 0 (0.0%) |
| Total | 1,120 (100.0%) | 892 (100.0%) |
Families and Households in Valencia
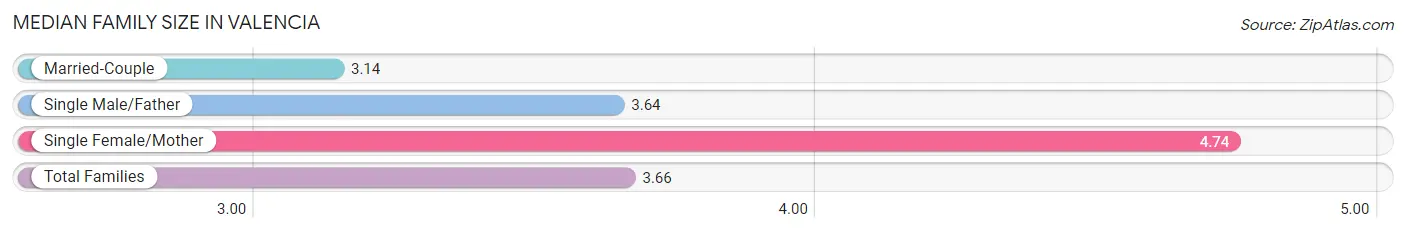
Median Family Size in Valencia
The median family size in Valencia is 3.66 persons per family, with single female/mother families (114 | 29.2%) accounting for the largest median family size of 4.74 persons per family. On the other hand, married-couple families (235 | 60.1%) represent the smallest median family size with 3.14 persons per family.
| Family Type | # Families | Family Size |
| Married-Couple | 235 (60.1%) | 3.14 |
| Single Male/Father | 42 (10.7%) | 3.64 |
| Single Female/Mother | 114 (29.2%) | 4.74 |
| Total Families | 391 (100.0%) | 3.66 |
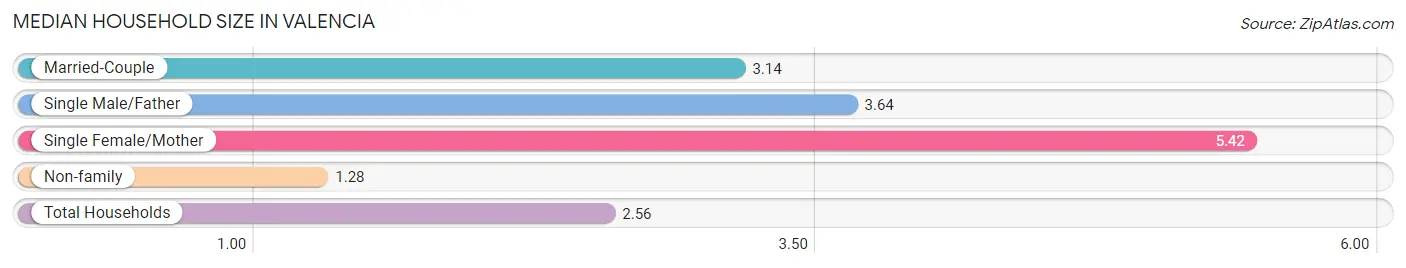
Median Household Size in Valencia
The median household size in Valencia is 2.56 persons per household, with single female/mother households (114 | 14.5%) accounting for the largest median household size of 5.42 persons per household. non-family households (394 | 50.2%) represent the smallest median household size with 1.28 persons per household.
| Household Type | # Households | Household Size |
| Married-Couple | 235 (29.9%) | 3.14 |
| Single Male/Father | 42 (5.3%) | 3.64 |
| Single Female/Mother | 114 (14.5%) | 5.42 |
| Non-family | 394 (50.2%) | 1.28 |
| Total Households | 785 (100.0%) | 2.56 |
Household Size by Marriage Status in Valencia
Out of a total of 785 households in Valencia, 391 (49.8%) are family households, while 394 (50.2%) are nonfamily households. The most numerous type of family households are 2-person households, comprising 226, and the most common type of nonfamily households are 1-person households, comprising 329.
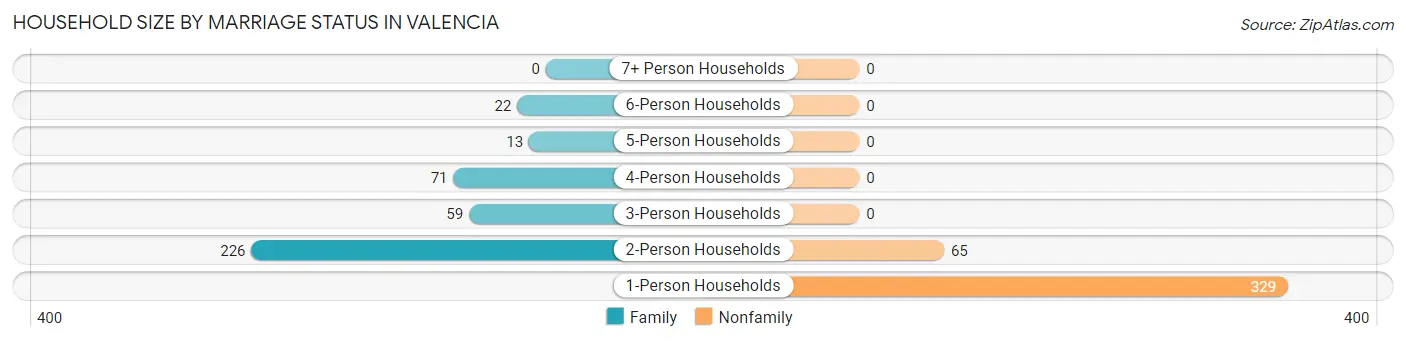
| Household Size | Family Households | Nonfamily Households |
| 1-Person Households | - | 329 (41.9%) |
| 2-Person Households | 226 (28.8%) | 65 (8.3%) |
| 3-Person Households | 59 (7.5%) | 0 (0.0%) |
| 4-Person Households | 71 (9.0%) | 0 (0.0%) |
| 5-Person Households | 13 (1.7%) | 0 (0.0%) |
| 6-Person Households | 22 (2.8%) | 0 (0.0%) |
| 7+ Person Households | 0 (0.0%) | 0 (0.0%) |
| Total | 391 (49.8%) | 394 (50.2%) |
Female Fertility in Valencia
Fertility by Age in Valencia
Average fertility rate in Valencia is 167.0 births per 1,000 women. Women in the age bracket of 20 to 34 years have the highest fertility rate with 355.0 births per 1,000 women. Women in the age bracket of 20 to 34 years acount for 100.0% of all women with births.
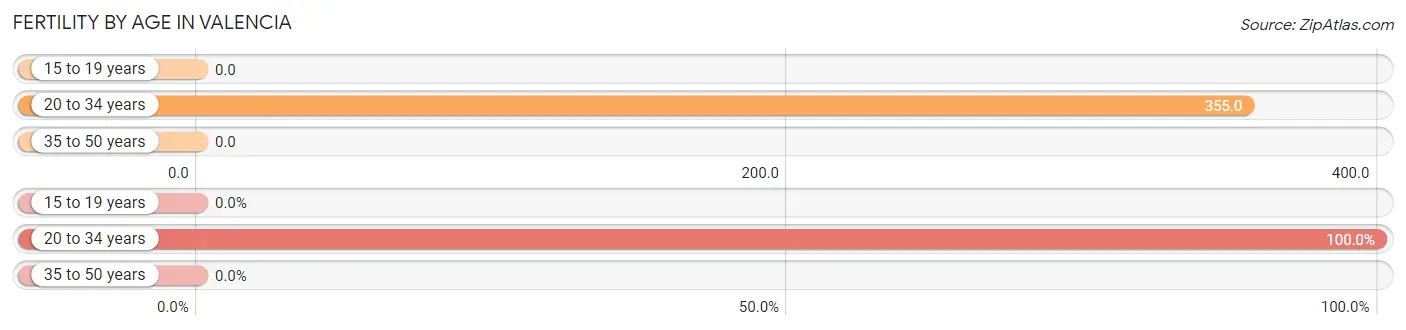
| Age Bracket | Women with Births | Births / 1,000 Women |
| 15 to 19 years | 0 (0.0%) | 0.0 |
| 20 to 34 years | 44 (100.0%) | 355.0 |
| 35 to 50 years | 0 (0.0%) | 0.0 |
| Total | 44 (100.0%) | 167.0 |
Fertility by Age by Marriage Status in Valencia
31.8% of women with births (44) in Valencia are married. The highest percentage of unmarried women with births falls into 20 to 34 years age bracket with 68.2% of them unmarried at the time of birth, while the lowest percentage of unmarried women with births belong to 20 to 34 years age bracket with 68.2% of them unmarried.
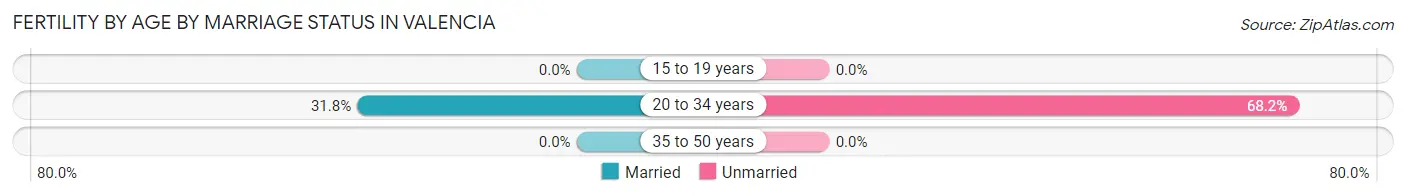
| Age Bracket | Married | Unmarried |
| 15 to 19 years | 0 (0.0%) | 0 (0.0%) |
| 20 to 34 years | 14 (31.8%) | 30 (68.2%) |
| 35 to 50 years | 0 (0.0%) | 0 (0.0%) |
| Total | 14 (31.8%) | 30 (68.2%) |
Fertility by Education in Valencia
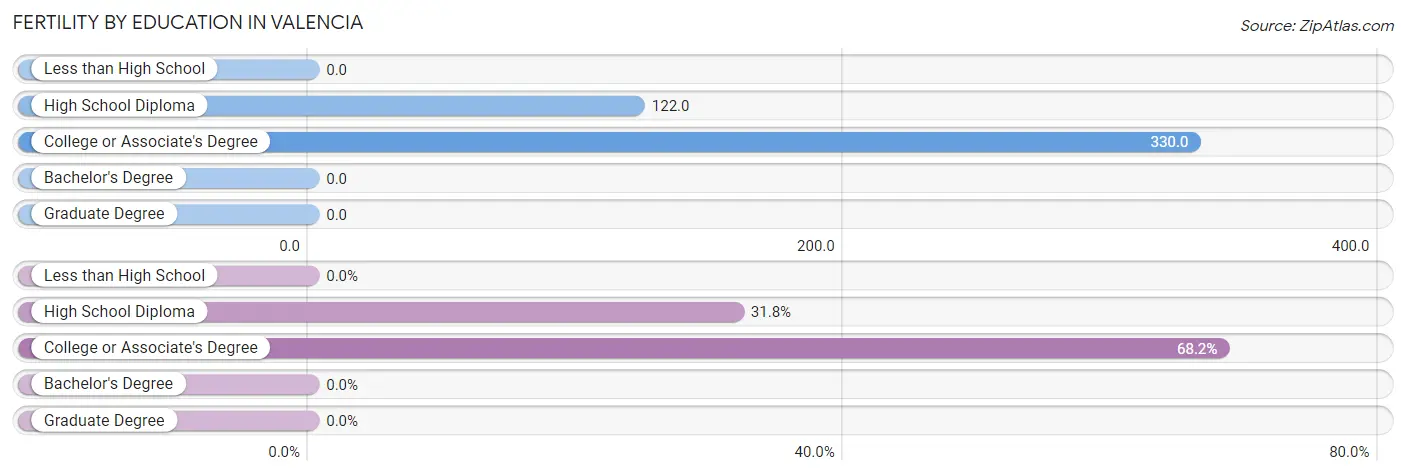
| Educational Attainment | Women with Births | Births / 1,000 Women |
| Less than High School | 0 (0.0%) | 0.0 |
| High School Diploma | 14 (31.8%) | 122.0 |
| College or Associate's Degree | 30 (68.2%) | 330.0 |
| Bachelor's Degree | 0 (0.0%) | 0.0 |
| Graduate Degree | 0 (0.0%) | 0.0 |
| Total | 44 (100.0%) | 167.0 |
Fertility by Education by Marriage Status in Valencia
68.2% of women with births in Valencia are unmarried. Women with the educational attainment of high school diploma are most likely to be married with 100.0% of them married at childbirth, while women with the educational attainment of college or associate's degree are least likely to be married with 100.0% of them unmarried at childbirth.
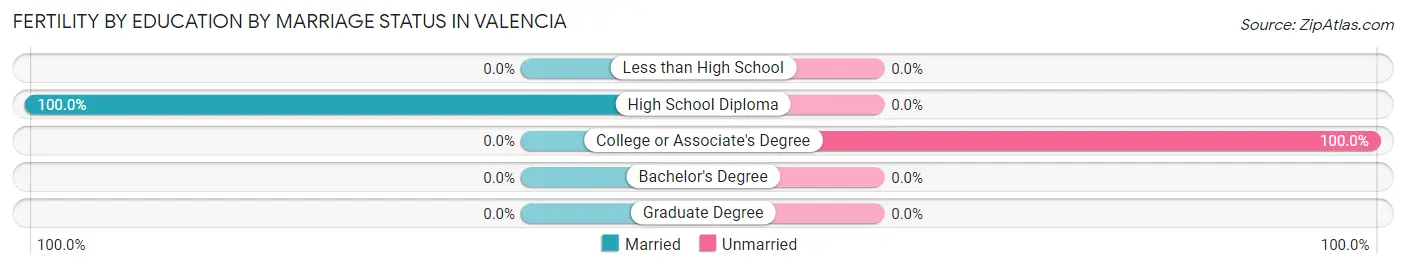
| Educational Attainment | Married | Unmarried |
| Less than High School | 0 (0.0%) | 0 (0.0%) |
| High School Diploma | 14 (100.0%) | 0 (0.0%) |
| College or Associate's Degree | 0 (0.0%) | 30 (100.0%) |
| Bachelor's Degree | 0 (0.0%) | 0 (0.0%) |
| Graduate Degree | 0 (0.0%) | 0 (0.0%) |
| Total | 14 (31.8%) | 30 (68.2%) |
Employment Characteristics in Valencia
Employment by Class of Employer in Valencia
Among the 911 employed individuals in Valencia, private company employees (671 | 73.7%), local government employees (126 | 13.8%), and state government employees (83 | 9.1%) make up the most common classes of employment.
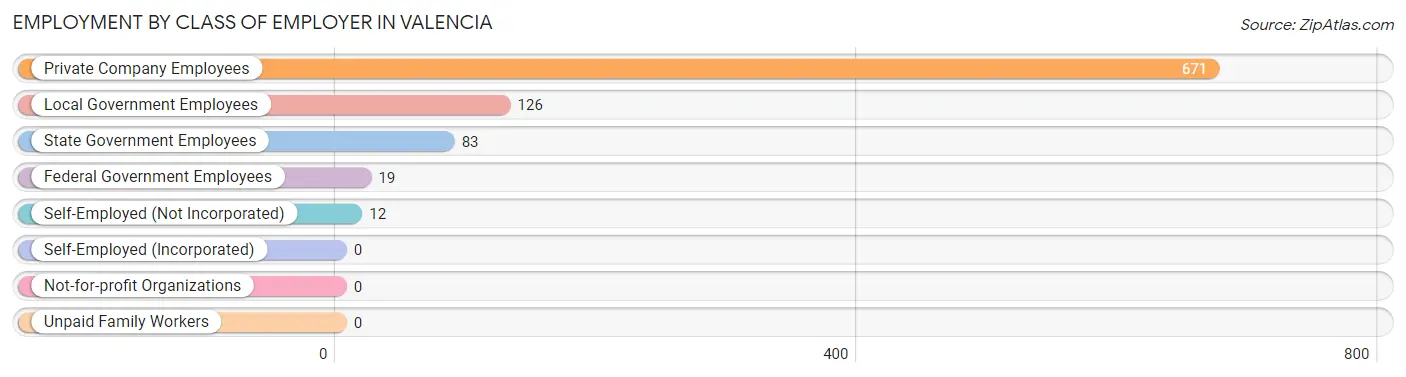
| Employer Class | # Employees | % Employees |
| Private Company Employees | 671 | 73.7% |
| Self-Employed (Incorporated) | 0 | 0.0% |
| Self-Employed (Not Incorporated) | 12 | 1.3% |
| Not-for-profit Organizations | 0 | 0.0% |
| Local Government Employees | 126 | 13.8% |
| State Government Employees | 83 | 9.1% |
| Federal Government Employees | 19 | 2.1% |
| Unpaid Family Workers | 0 | 0.0% |
| Total | 911 | 100.0% |
Employment Status by Age in Valencia
According to the labor force statistics for Valencia, out of the total population over 16 years of age (1,695), 58.6% or 993 individuals are in the labor force, with 8.3% or 82 of them unemployed. The age group with the highest labor force participation rate is 20 to 24 years, with 100.0% or 76 individuals in the labor force. Within the labor force, the 16 to 19 years age range has the highest percentage of unemployed individuals, with 100.0% or 25 of them being unemployed.
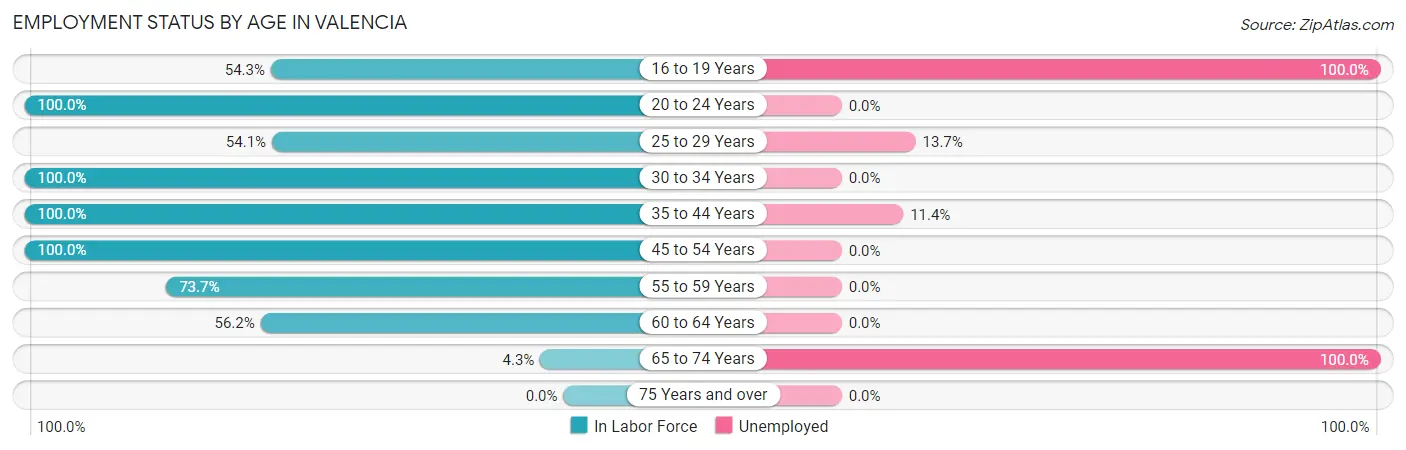
| Age Bracket | In Labor Force | Unemployed |
| 16 to 19 Years | 25 (54.3%) | 25 (100.0%) |
| 20 to 24 Years | 76 (100.0%) | 0 (0.0%) |
| 25 to 29 Years | 219 (54.1%) | 30 (13.7%) |
| 30 to 34 Years | 72 (100.0%) | 0 (0.0%) |
| 35 to 44 Years | 114 (100.0%) | 13 (11.4%) |
| 45 to 54 Years | 219 (100.0%) | 0 (0.0%) |
| 55 to 59 Years | 73 (73.7%) | 0 (0.0%) |
| 60 to 64 Years | 181 (56.2%) | 0 (0.0%) |
| 65 to 74 Years | 14 (4.3%) | 14 (100.0%) |
| 75 Years and over | 0 (0.0%) | 0 (0.0%) |
| Total | 993 (58.6%) | 82 (8.3%) |
Employment Status by Educational Attainment in Valencia
According to labor force statistics for Valencia, 71.3% of individuals (878) out of the total population between 25 and 64 years of age (1,231) are in the labor force, with 4.9% or 43 of them being unemployed. The group with the highest labor force participation rate are those with the educational attainment of bachelor's degree or higher, with 100.0% or 314 individuals in the labor force. Within the labor force, individuals with high school diploma education have the highest percentage of unemployment, with 9.9% or 30 of them being unemployed.
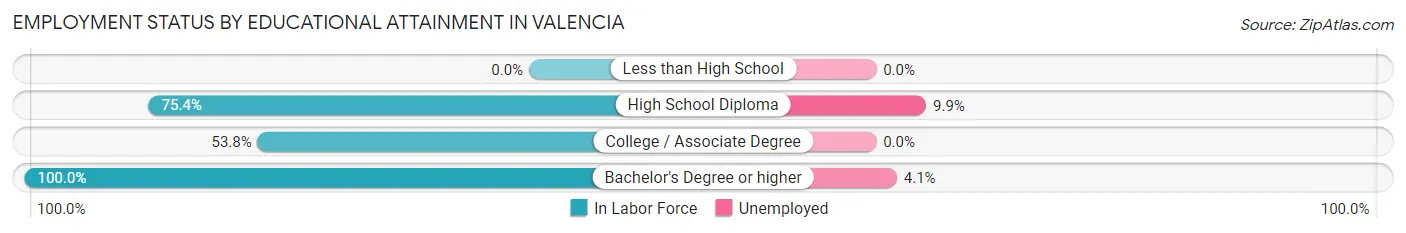
| Educational Attainment | In Labor Force | Unemployed |
| Less than High School | 0 (0.0%) | 0 (0.0%) |
| High School Diploma | 304 (75.4%) | 40 (9.9%) |
| College / Associate Degree | 260 (53.8%) | 0 (0.0%) |
| Bachelor's Degree or higher | 314 (100.0%) | 13 (4.1%) |
| Total | 878 (71.3%) | 60 (4.9%) |
Employment Occupations by Sex in Valencia
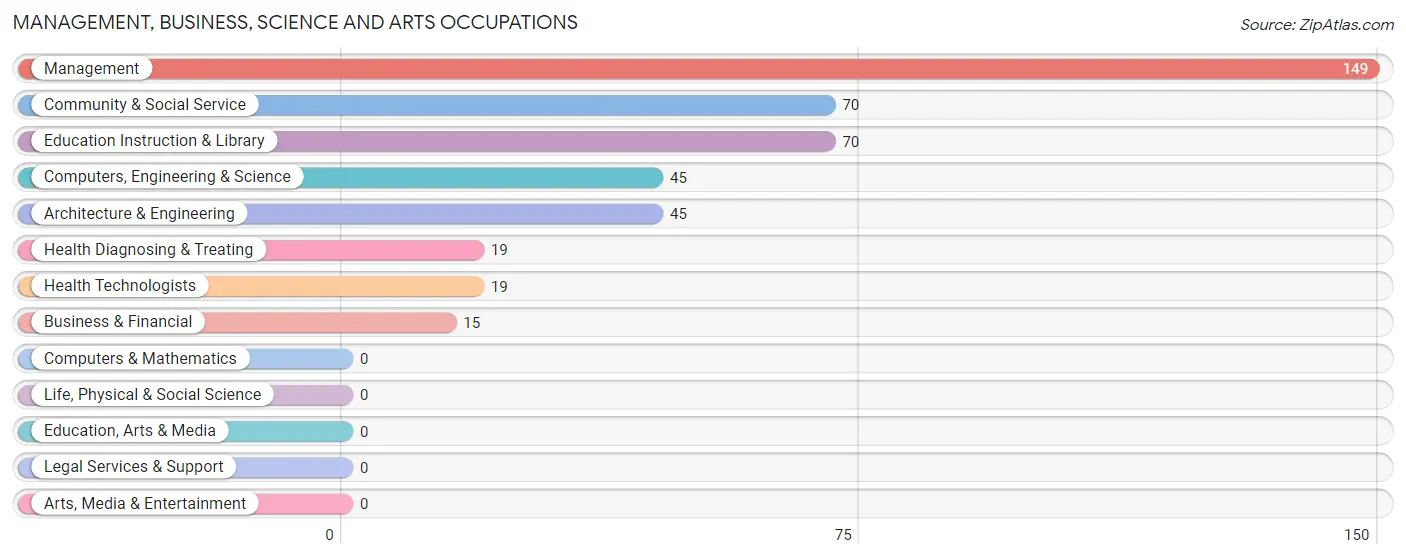
Management, Business, Science and Arts Occupations
The most common Management, Business, Science and Arts occupations in Valencia are Management (149 | 16.4%), Community & Social Service (70 | 7.7%), Education Instruction & Library (70 | 7.7%), Computers, Engineering & Science (45 | 4.9%), and Architecture & Engineering (45 | 4.9%).
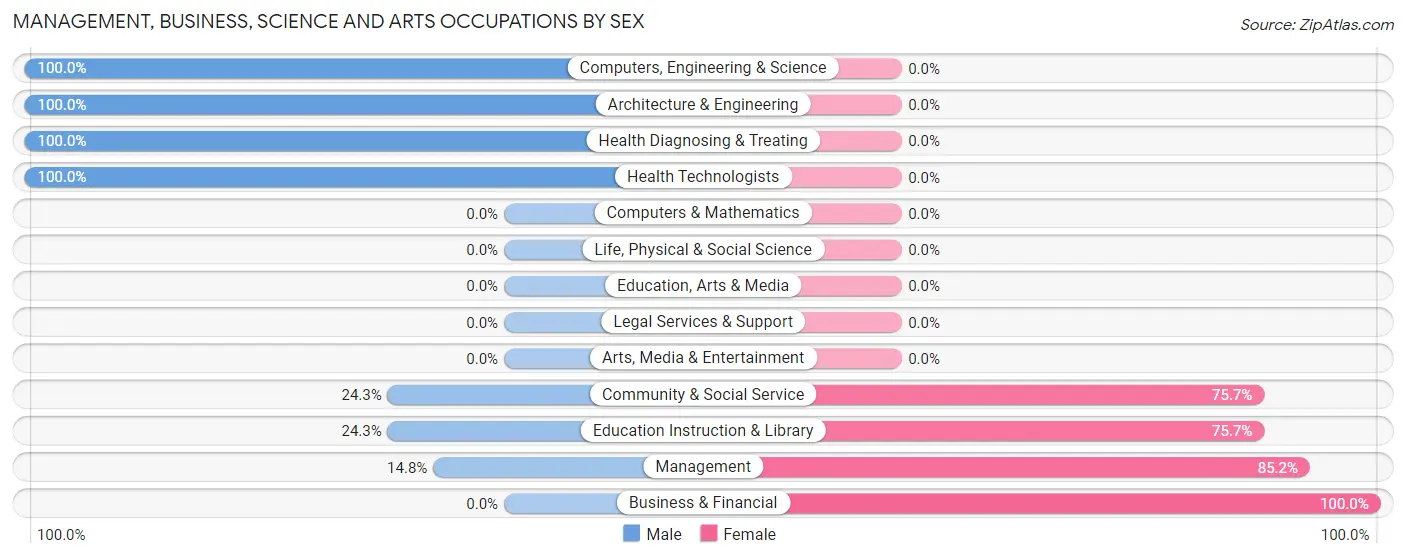
Management, Business, Science and Arts Occupations by Sex
Within the Management, Business, Science and Arts occupations in Valencia, the most male-oriented occupations are Computers, Engineering & Science (100.0%), Architecture & Engineering (100.0%), and Health Diagnosing & Treating (100.0%), while the most female-oriented occupations are Business & Financial (100.0%), Management (85.2%), and Community & Social Service (75.7%).
| Occupation | Male | Female |
| Management | 22 (14.8%) | 127 (85.2%) |
| Business & Financial | 0 (0.0%) | 15 (100.0%) |
| Computers, Engineering & Science | 45 (100.0%) | 0 (0.0%) |
| Computers & Mathematics | 0 (0.0%) | 0 (0.0%) |
| Architecture & Engineering | 45 (100.0%) | 0 (0.0%) |
| Life, Physical & Social Science | 0 (0.0%) | 0 (0.0%) |
| Community & Social Service | 17 (24.3%) | 53 (75.7%) |
| Education, Arts & Media | 0 (0.0%) | 0 (0.0%) |
| Legal Services & Support | 0 (0.0%) | 0 (0.0%) |
| Education Instruction & Library | 17 (24.3%) | 53 (75.7%) |
| Arts, Media & Entertainment | 0 (0.0%) | 0 (0.0%) |
| Health Diagnosing & Treating | 19 (100.0%) | 0 (0.0%) |
| Health Technologists | 19 (100.0%) | 0 (0.0%) |
| Total (Category) | 103 (34.6%) | 195 (65.4%) |
| Total (Overall) | 526 (57.7%) | 385 (42.3%) |
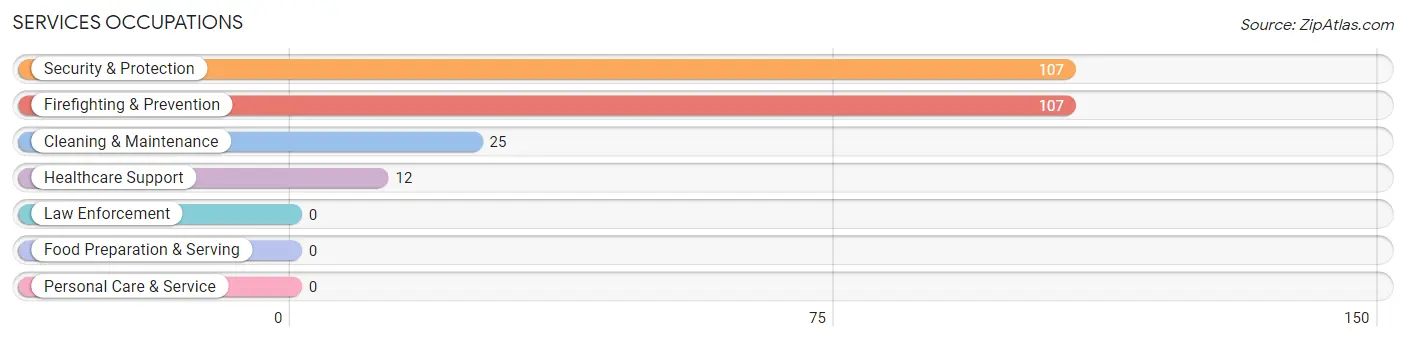
Services Occupations
The most common Services occupations in Valencia are Security & Protection (107 | 11.7%), Firefighting & Prevention (107 | 11.7%), Cleaning & Maintenance (25 | 2.7%), and Healthcare Support (12 | 1.3%).
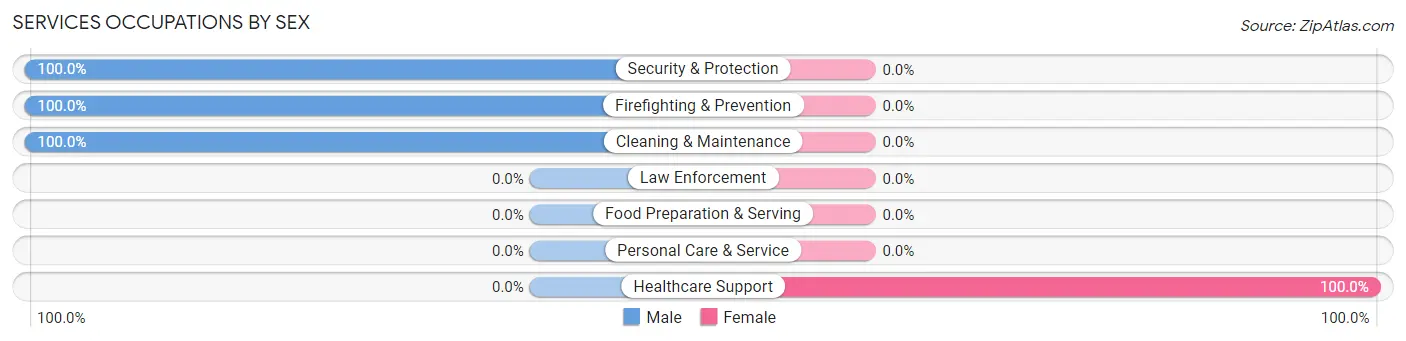
Services Occupations by Sex
| Occupation | Male | Female |
| Healthcare Support | 0 (0.0%) | 12 (100.0%) |
| Security & Protection | 107 (100.0%) | 0 (0.0%) |
| Firefighting & Prevention | 107 (100.0%) | 0 (0.0%) |
| Law Enforcement | 0 (0.0%) | 0 (0.0%) |
| Food Preparation & Serving | 0 (0.0%) | 0 (0.0%) |
| Cleaning & Maintenance | 25 (100.0%) | 0 (0.0%) |
| Personal Care & Service | 0 (0.0%) | 0 (0.0%) |
| Total (Category) | 132 (91.7%) | 12 (8.3%) |
| Total (Overall) | 526 (57.7%) | 385 (42.3%) |
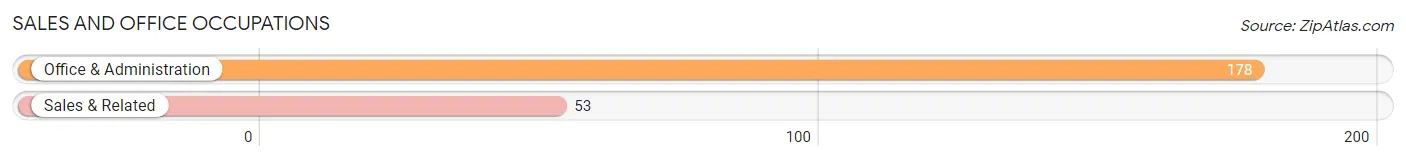
Sales and Office Occupations
The most common Sales and Office occupations in Valencia are Office & Administration (178 | 19.5%), and Sales & Related (53 | 5.8%).
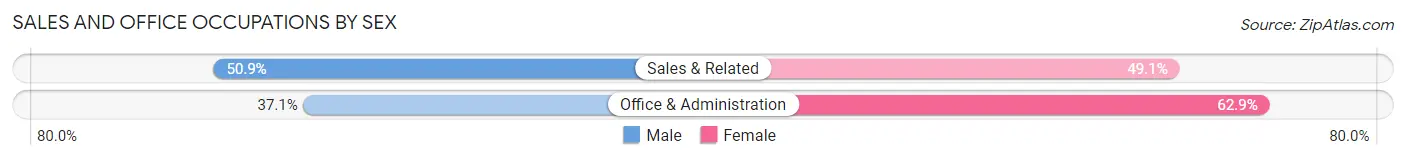
Sales and Office Occupations by Sex
| Occupation | Male | Female |
| Sales & Related | 27 (50.9%) | 26 (49.1%) |
| Office & Administration | 66 (37.1%) | 112 (62.9%) |
| Total (Category) | 93 (40.3%) | 138 (59.7%) |
| Total (Overall) | 526 (57.7%) | 385 (42.3%) |
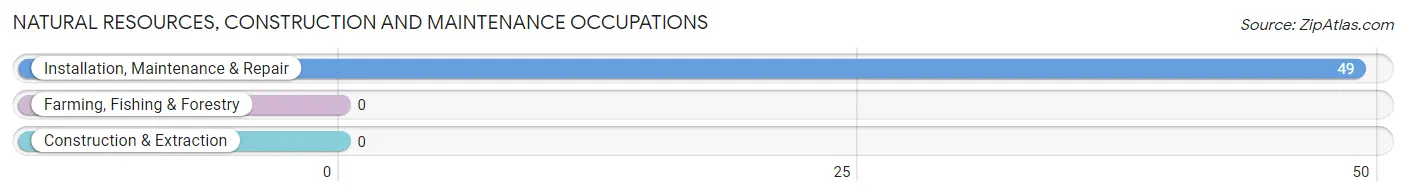
Natural Resources, Construction and Maintenance Occupations
The most common Natural Resources, Construction and Maintenance occupations in Valencia are , and Installation, Maintenance & Repair (49 | 5.4%).
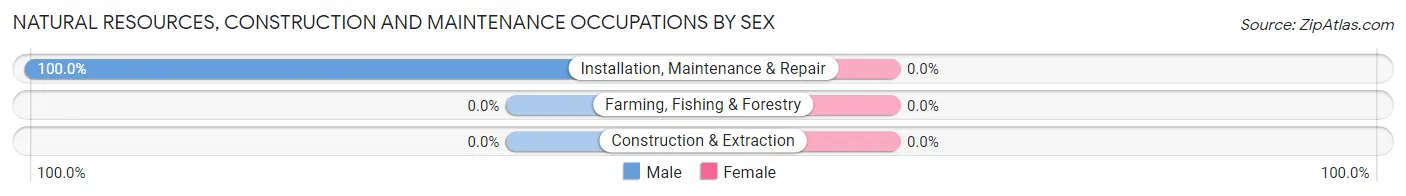
Natural Resources, Construction and Maintenance Occupations by Sex
| Occupation | Male | Female |
| Farming, Fishing & Forestry | 0 (0.0%) | 0 (0.0%) |
| Construction & Extraction | 0 (0.0%) | 0 (0.0%) |
| Installation, Maintenance & Repair | 49 (100.0%) | 0 (0.0%) |
| Total (Category) | 49 (100.0%) | 0 (0.0%) |
| Total (Overall) | 526 (57.7%) | 385 (42.3%) |
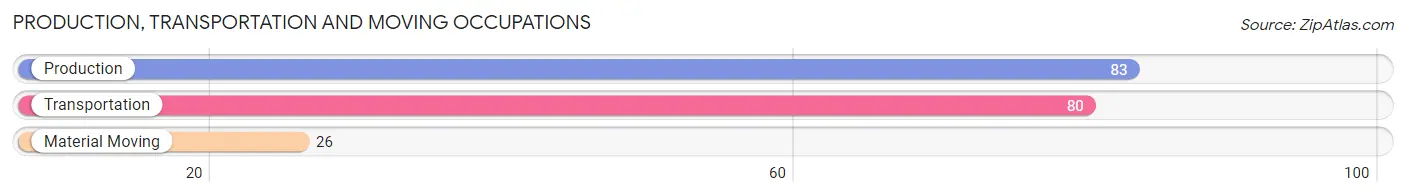
Production, Transportation and Moving Occupations
The most common Production, Transportation and Moving occupations in Valencia are Production (83 | 9.1%), Transportation (80 | 8.8%), and Material Moving (26 | 2.9%).
Production, Transportation and Moving Occupations by Sex
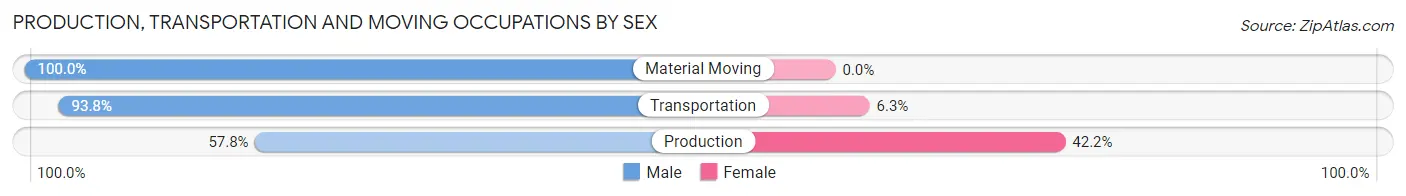
| Occupation | Male | Female |
| Production | 48 (57.8%) | 35 (42.2%) |
| Transportation | 75 (93.8%) | 5 (6.2%) |
| Material Moving | 26 (100.0%) | 0 (0.0%) |
| Total (Category) | 149 (78.8%) | 40 (21.2%) |
| Total (Overall) | 526 (57.7%) | 385 (42.3%) |
Employment Industries by Sex in Valencia
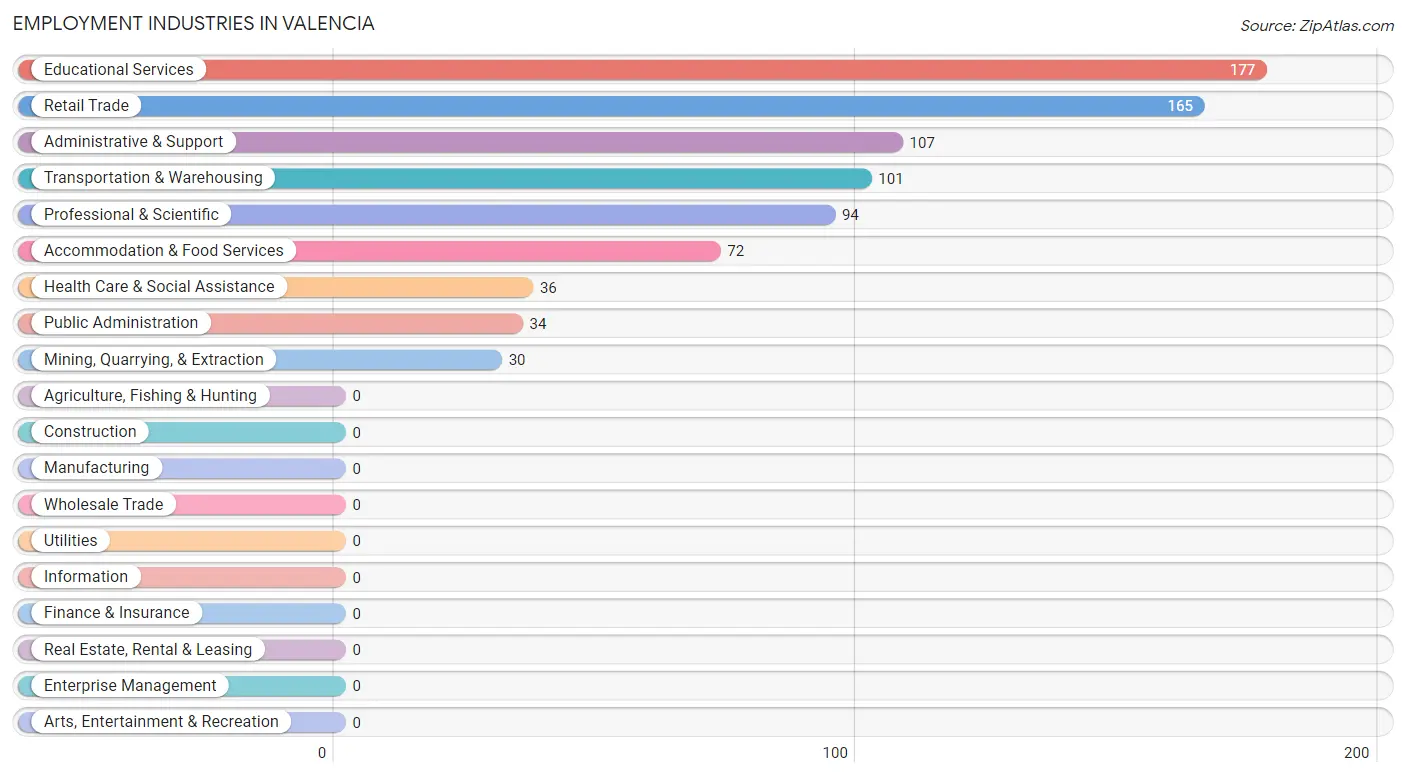
Employment Industries in Valencia
The major employment industries in Valencia include Educational Services (177 | 19.4%), Retail Trade (165 | 18.1%), Administrative & Support (107 | 11.7%), Transportation & Warehousing (101 | 11.1%), and Professional & Scientific (94 | 10.3%).
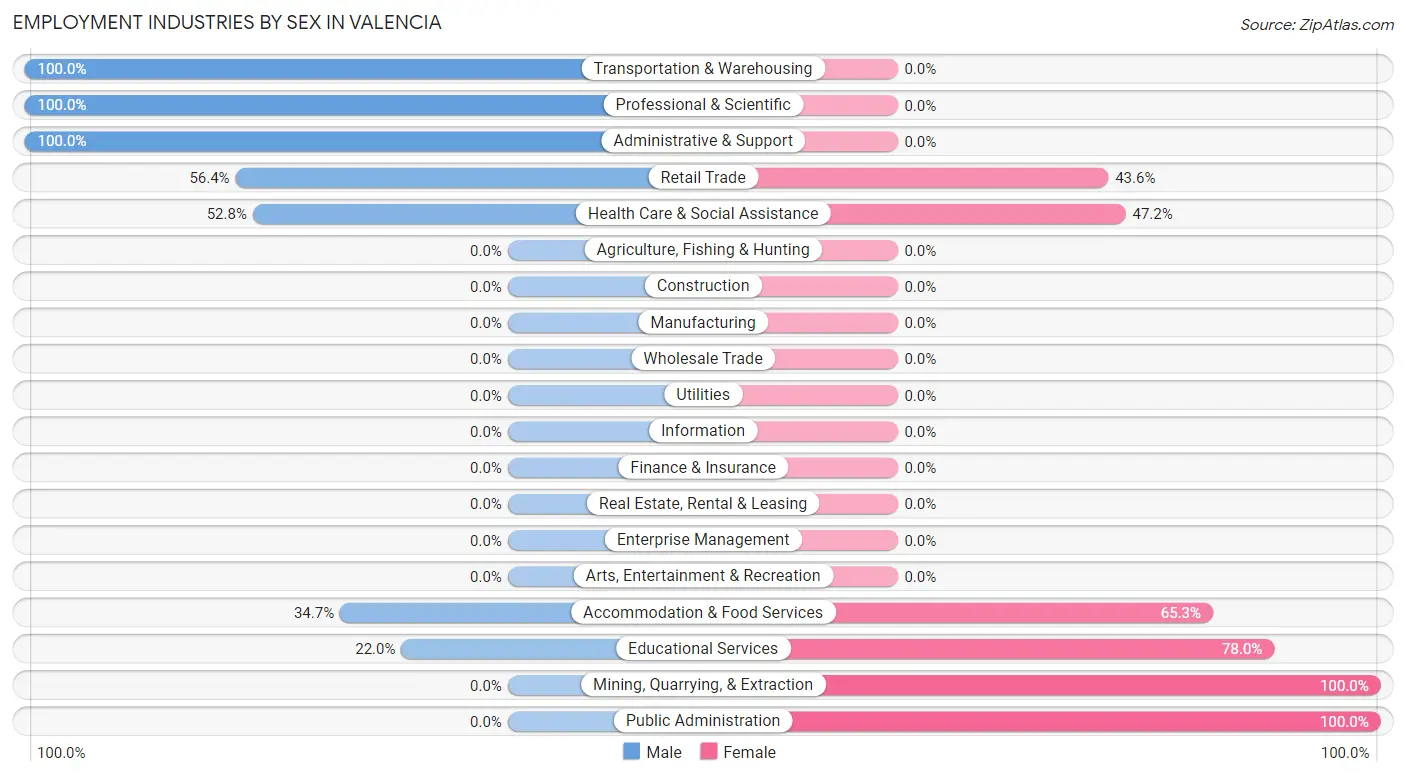
Employment Industries by Sex in Valencia
The Valencia industries that see more men than women are Transportation & Warehousing (100.0%), Professional & Scientific (100.0%), and Administrative & Support (100.0%), whereas the industries that tend to have a higher number of women are Mining, Quarrying, & Extraction (100.0%), Public Administration (100.0%), and Educational Services (78.0%).
| Industry | Male | Female |
| Agriculture, Fishing & Hunting | 0 (0.0%) | 0 (0.0%) |
| Mining, Quarrying, & Extraction | 0 (0.0%) | 30 (100.0%) |
| Construction | 0 (0.0%) | 0 (0.0%) |
| Manufacturing | 0 (0.0%) | 0 (0.0%) |
| Wholesale Trade | 0 (0.0%) | 0 (0.0%) |
| Retail Trade | 93 (56.4%) | 72 (43.6%) |
| Transportation & Warehousing | 101 (100.0%) | 0 (0.0%) |
| Utilities | 0 (0.0%) | 0 (0.0%) |
| Information | 0 (0.0%) | 0 (0.0%) |
| Finance & Insurance | 0 (0.0%) | 0 (0.0%) |
| Real Estate, Rental & Leasing | 0 (0.0%) | 0 (0.0%) |
| Professional & Scientific | 94 (100.0%) | 0 (0.0%) |
| Enterprise Management | 0 (0.0%) | 0 (0.0%) |
| Administrative & Support | 107 (100.0%) | 0 (0.0%) |
| Educational Services | 39 (22.0%) | 138 (78.0%) |
| Health Care & Social Assistance | 19 (52.8%) | 17 (47.2%) |
| Arts, Entertainment & Recreation | 0 (0.0%) | 0 (0.0%) |
| Accommodation & Food Services | 25 (34.7%) | 47 (65.3%) |
| Public Administration | 0 (0.0%) | 34 (100.0%) |
| Total | 526 (57.7%) | 385 (42.3%) |
Education in Valencia
School Enrollment in Valencia
The most common levels of schooling among the 499 students in Valencia are college / undergraduate (242 | 48.5%), high school (105 | 21.0%), and middle school (58 | 11.6%).
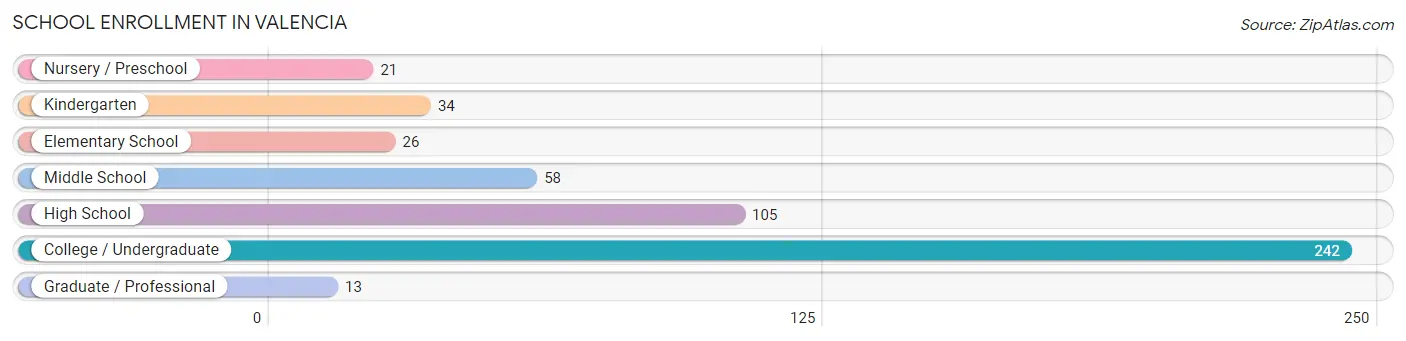
| School Level | # Students | % Students |
| Nursery / Preschool | 21 | 4.2% |
| Kindergarten | 34 | 6.8% |
| Elementary School | 26 | 5.2% |
| Middle School | 58 | 11.6% |
| High School | 105 | 21.0% |
| College / Undergraduate | 242 | 48.5% |
| Graduate / Professional | 13 | 2.6% |
| Total | 499 | 100.0% |
School Enrollment by Age by Funding Source in Valencia
Out of a total of 499 students who are enrolled in schools in Valencia, 90 (18.0%) attend a private institution, while the remaining 409 (82.0%) are enrolled in public schools. The age group of 3 to 4 year olds has the highest likelihood of being enrolled in private schools, with 21 (100.0% in the age bracket) enrolled. Conversely, the age group of 5 to 9 year old has the lowest likelihood of being enrolled in a private school, with 34 (100.0% in the age bracket) attending a public institution.
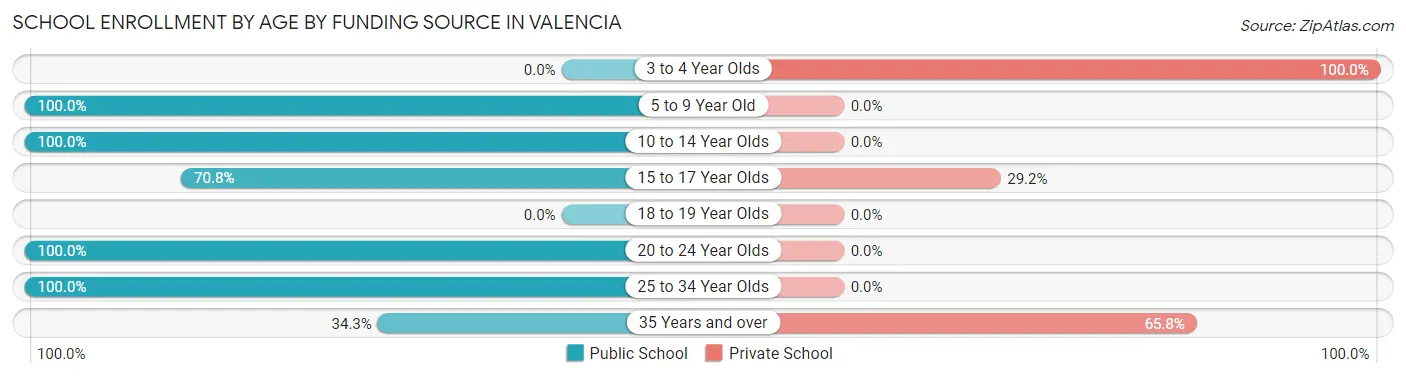
| Age Bracket | Public School | Private School |
| 3 to 4 Year Olds | 0 (0.0%) | 21 (100.0%) |
| 5 to 9 Year Old | 34 (100.0%) | 0 (0.0%) |
| 10 to 14 Year Olds | 117 (100.0%) | 0 (0.0%) |
| 15 to 17 Year Olds | 51 (70.8%) | 21 (29.2%) |
| 18 to 19 Year Olds | 0 (0.0%) | 0 (0.0%) |
| 20 to 24 Year Olds | 49 (100.0%) | 0 (0.0%) |
| 25 to 34 Year Olds | 133 (100.0%) | 0 (0.0%) |
| 35 Years and over | 25 (34.3%) | 48 (65.7%) |
| Total | 409 (82.0%) | 90 (18.0%) |
Educational Attainment by Field of Study in Valencia
Physical & health sciences (119 | 30.7%), education (88 | 22.7%), business (57 | 14.7%), social sciences (38 | 9.8%), and arts & humanities (37 | 9.5%) are the most common fields of study among 388 individuals in Valencia who have obtained a bachelor's degree or higher.
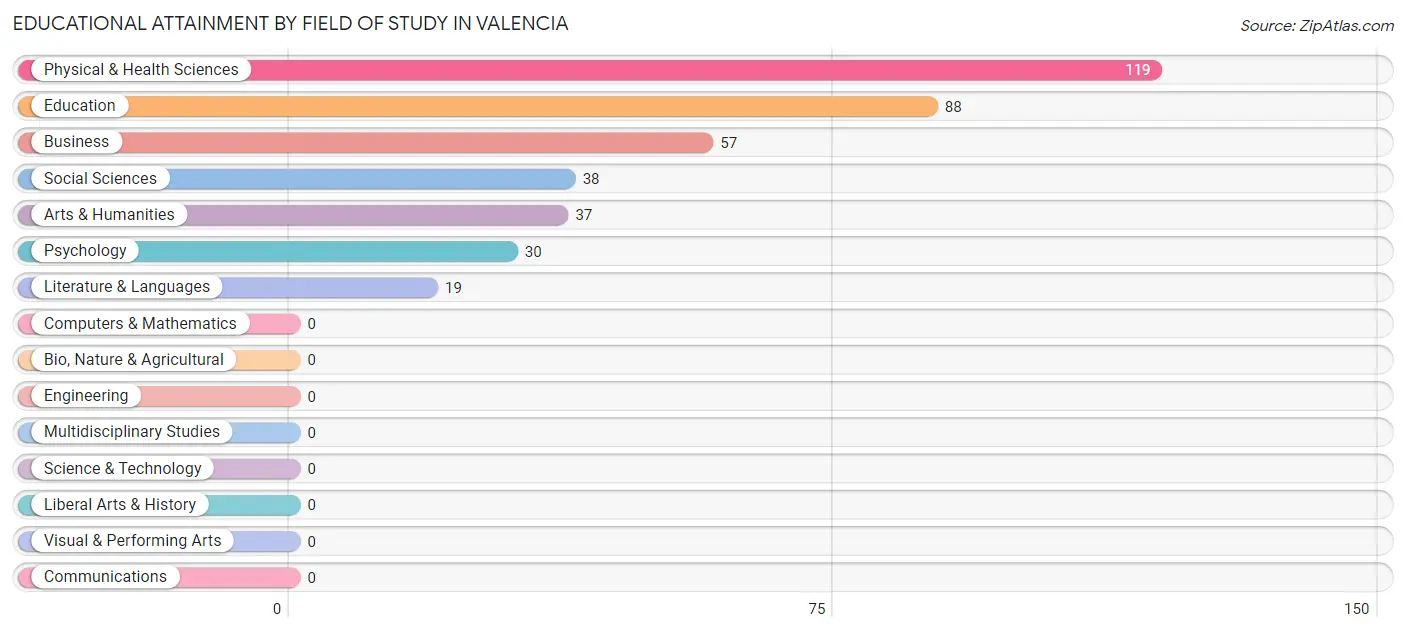
| Field of Study | # Graduates | % Graduates |
| Computers & Mathematics | 0 | 0.0% |
| Bio, Nature & Agricultural | 0 | 0.0% |
| Physical & Health Sciences | 119 | 30.7% |
| Psychology | 30 | 7.7% |
| Social Sciences | 38 | 9.8% |
| Engineering | 0 | 0.0% |
| Multidisciplinary Studies | 0 | 0.0% |
| Science & Technology | 0 | 0.0% |
| Business | 57 | 14.7% |
| Education | 88 | 22.7% |
| Literature & Languages | 19 | 4.9% |
| Liberal Arts & History | 0 | 0.0% |
| Visual & Performing Arts | 0 | 0.0% |
| Communications | 0 | 0.0% |
| Arts & Humanities | 37 | 9.5% |
| Total | 388 | 100.0% |
Transportation & Commute in Valencia
Vehicle Availability by Sex in Valencia
The most prevalent vehicle ownership categories in Valencia are males with 2 vehicles (319, accounting for 60.7%) and females with 2 vehicles (55, making up 82.9%).
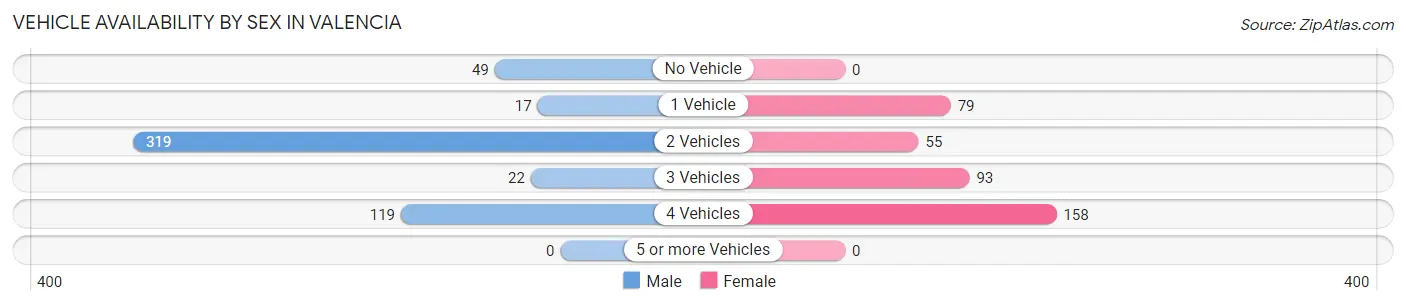
| Vehicles Available | Male | Female |
| No Vehicle | 49 (9.3%) | 0 (0.0%) |
| 1 Vehicle | 17 (3.2%) | 79 (20.5%) |
| 2 Vehicles | 319 (60.7%) | 55 (14.3%) |
| 3 Vehicles | 22 (4.2%) | 93 (24.2%) |
| 4 Vehicles | 119 (22.6%) | 158 (41.0%) |
| 5 or more Vehicles | 0 (0.0%) | 0 (0.0%) |
| Total | 526 (100.0%) | 385 (100.0%) |
Commute Time in Valencia
The most frequently occuring commute durations in Valencia are 40 to 44 minutes (222 commuters, 24.4%), 45 to 59 minutes (169 commuters, 18.5%), and 15 to 19 minutes (112 commuters, 12.3%).
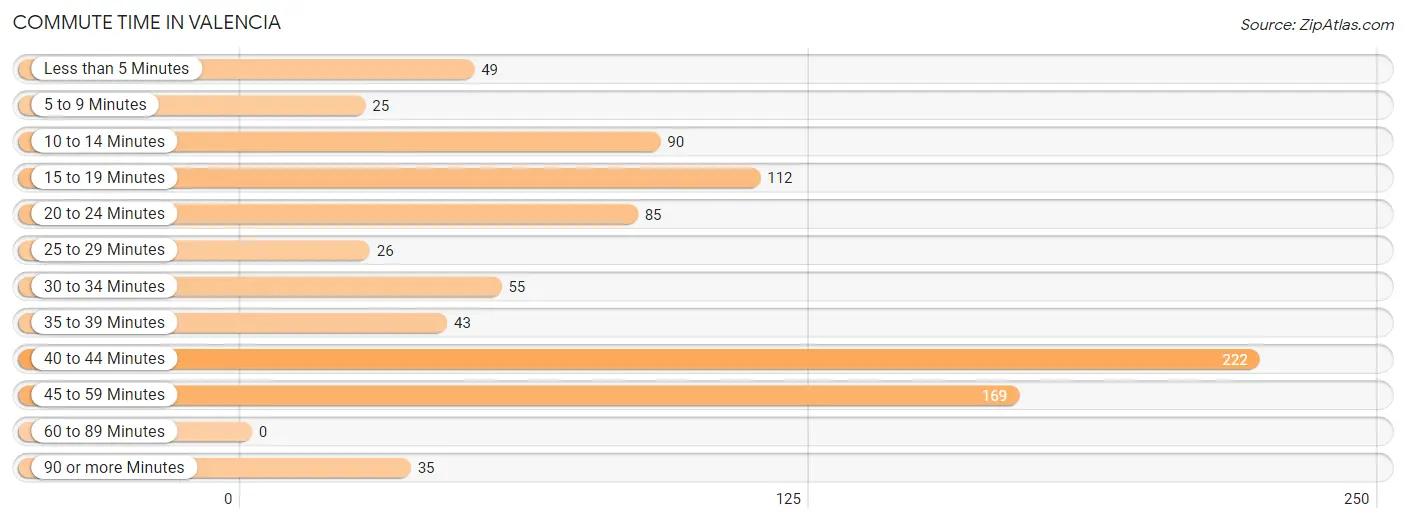
| Commute Time | # Commuters | % Commuters |
| Less than 5 Minutes | 49 | 5.4% |
| 5 to 9 Minutes | 25 | 2.7% |
| 10 to 14 Minutes | 90 | 9.9% |
| 15 to 19 Minutes | 112 | 12.3% |
| 20 to 24 Minutes | 85 | 9.3% |
| 25 to 29 Minutes | 26 | 2.9% |
| 30 to 34 Minutes | 55 | 6.0% |
| 35 to 39 Minutes | 43 | 4.7% |
| 40 to 44 Minutes | 222 | 24.4% |
| 45 to 59 Minutes | 169 | 18.5% |
| 60 to 89 Minutes | 0 | 0.0% |
| 90 or more Minutes | 35 | 3.8% |
Commute Time by Sex in Valencia
The most common commute times in Valencia are 45 to 59 minutes (152 commuters, 28.9%) for males and 40 to 44 minutes (101 commuters, 26.2%) for females.
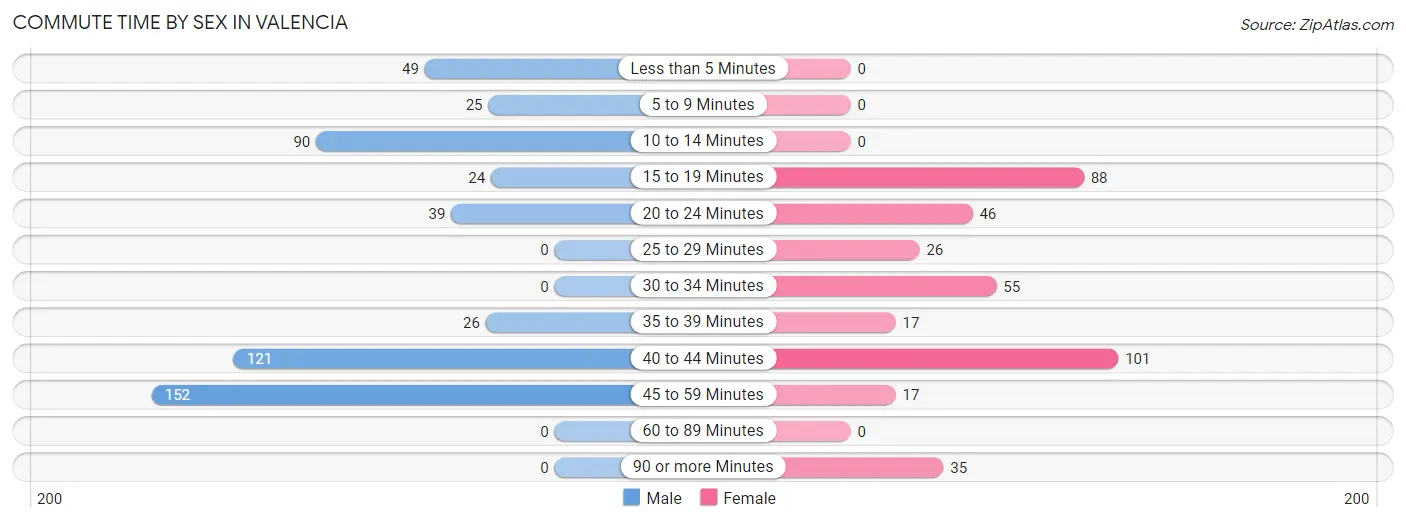
| Commute Time | Male | Female |
| Less than 5 Minutes | 49 (9.3%) | 0 (0.0%) |
| 5 to 9 Minutes | 25 (4.8%) | 0 (0.0%) |
| 10 to 14 Minutes | 90 (17.1%) | 0 (0.0%) |
| 15 to 19 Minutes | 24 (4.6%) | 88 (22.9%) |
| 20 to 24 Minutes | 39 (7.4%) | 46 (11.9%) |
| 25 to 29 Minutes | 0 (0.0%) | 26 (6.8%) |
| 30 to 34 Minutes | 0 (0.0%) | 55 (14.3%) |
| 35 to 39 Minutes | 26 (4.9%) | 17 (4.4%) |
| 40 to 44 Minutes | 121 (23.0%) | 101 (26.2%) |
| 45 to 59 Minutes | 152 (28.9%) | 17 (4.4%) |
| 60 to 89 Minutes | 0 (0.0%) | 0 (0.0%) |
| 90 or more Minutes | 0 (0.0%) | 35 (9.1%) |
Time of Departure to Work by Sex in Valencia
The most frequent times of departure to work in Valencia are 6:30 AM to 6:59 AM (169, 32.1%) for males and 7:00 AM to 7:29 AM (135, 35.1%) for females.
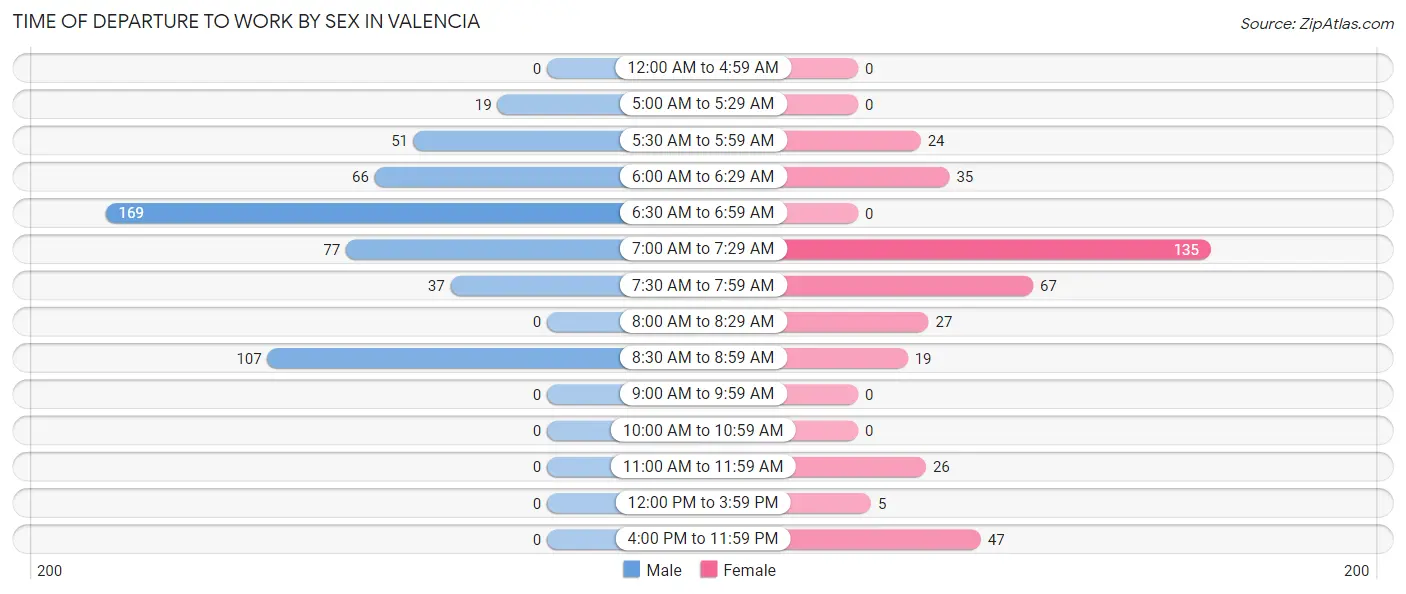
| Time of Departure | Male | Female |
| 12:00 AM to 4:59 AM | 0 (0.0%) | 0 (0.0%) |
| 5:00 AM to 5:29 AM | 19 (3.6%) | 0 (0.0%) |
| 5:30 AM to 5:59 AM | 51 (9.7%) | 24 (6.2%) |
| 6:00 AM to 6:29 AM | 66 (12.6%) | 35 (9.1%) |
| 6:30 AM to 6:59 AM | 169 (32.1%) | 0 (0.0%) |
| 7:00 AM to 7:29 AM | 77 (14.6%) | 135 (35.1%) |
| 7:30 AM to 7:59 AM | 37 (7.0%) | 67 (17.4%) |
| 8:00 AM to 8:29 AM | 0 (0.0%) | 27 (7.0%) |
| 8:30 AM to 8:59 AM | 107 (20.3%) | 19 (4.9%) |
| 9:00 AM to 9:59 AM | 0 (0.0%) | 0 (0.0%) |
| 10:00 AM to 10:59 AM | 0 (0.0%) | 0 (0.0%) |
| 11:00 AM to 11:59 AM | 0 (0.0%) | 26 (6.8%) |
| 12:00 PM to 3:59 PM | 0 (0.0%) | 5 (1.3%) |
| 4:00 PM to 11:59 PM | 0 (0.0%) | 47 (12.2%) |
| Total | 526 (100.0%) | 385 (100.0%) |
Housing Occupancy in Valencia
Occupancy by Ownership in Valencia
Of the total 785 dwellings in Valencia, owner-occupied units account for 674 (85.9%), while renter-occupied units make up 111 (14.1%).
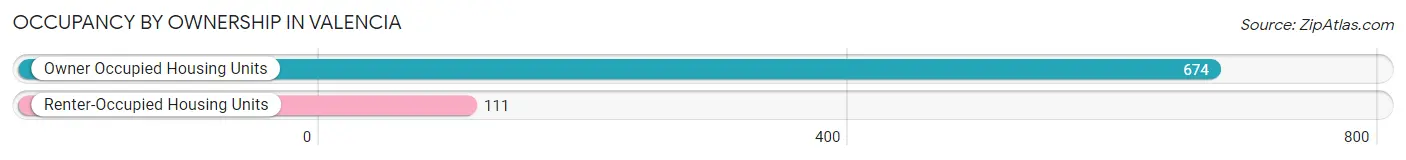
| Occupancy | # Housing Units | % Housing Units |
| Owner Occupied Housing Units | 674 | 85.9% |
| Renter-Occupied Housing Units | 111 | 14.1% |
| Total Occupied Housing Units | 785 | 100.0% |
Occupancy by Household Size in Valencia
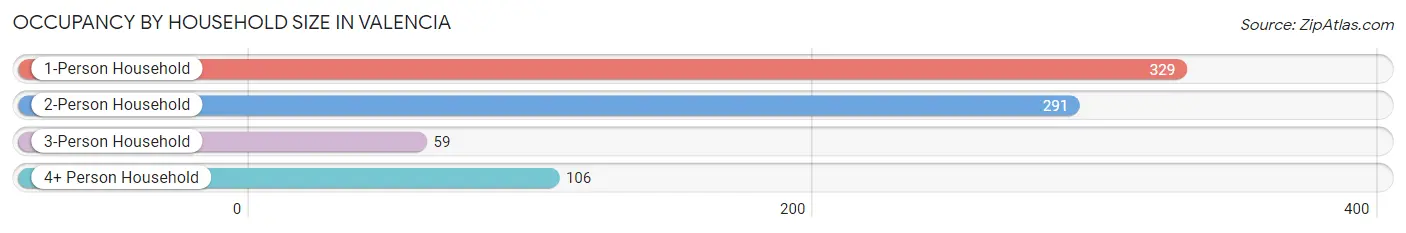
| Household Size | # Housing Units | % Housing Units |
| 1-Person Household | 329 | 41.9% |
| 2-Person Household | 291 | 37.1% |
| 3-Person Household | 59 | 7.5% |
| 4+ Person Household | 106 | 13.5% |
| Total Housing Units | 785 | 100.0% |
Occupancy by Ownership by Household Size in Valencia
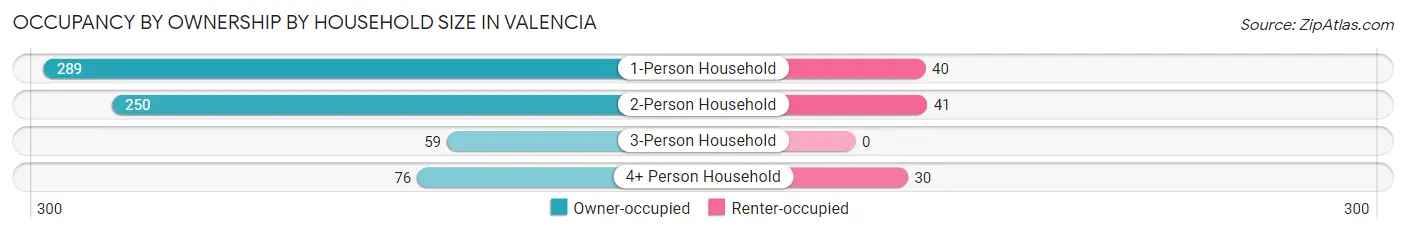
| Household Size | Owner-occupied | Renter-occupied |
| 1-Person Household | 289 (87.8%) | 40 (12.2%) |
| 2-Person Household | 250 (85.9%) | 41 (14.1%) |
| 3-Person Household | 59 (100.0%) | 0 (0.0%) |
| 4+ Person Household | 76 (71.7%) | 30 (28.3%) |
| Total Housing Units | 674 (85.9%) | 111 (14.1%) |
Occupancy by Educational Attainment in Valencia
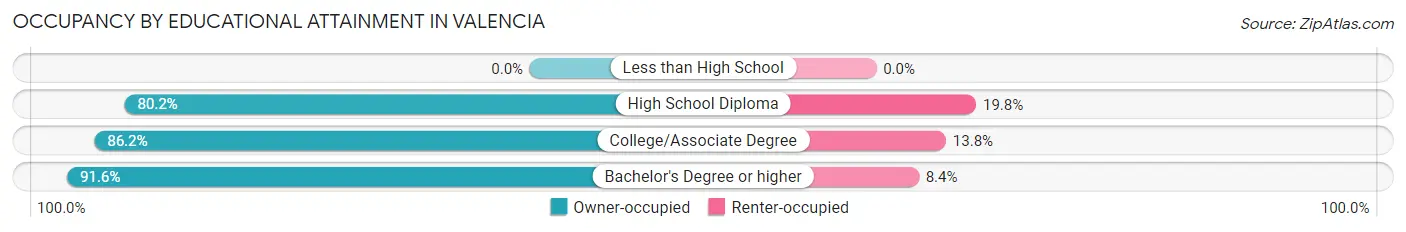
| Household Size | Owner-occupied | Renter-occupied |
| Less than High School | 0 (0.0%) | 0 (0.0%) |
| High School Diploma | 162 (80.2%) | 40 (19.8%) |
| College/Associate Degree | 349 (86.2%) | 56 (13.8%) |
| Bachelor's Degree or higher | 163 (91.6%) | 15 (8.4%) |
Occupancy by Age of Householder in Valencia
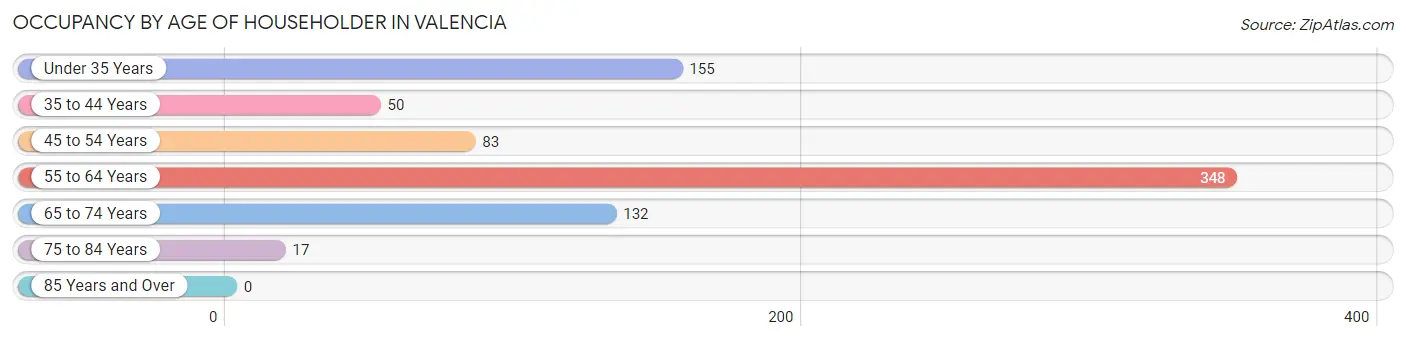
| Age Bracket | # Households | % Households |
| Under 35 Years | 155 | 19.8% |
| 35 to 44 Years | 50 | 6.4% |
| 45 to 54 Years | 83 | 10.6% |
| 55 to 64 Years | 348 | 44.3% |
| 65 to 74 Years | 132 | 16.8% |
| 75 to 84 Years | 17 | 2.2% |
| 85 Years and Over | 0 | 0.0% |
| Total | 785 | 100.0% |
Housing Finances in Valencia
Median Income by Occupancy in Valencia
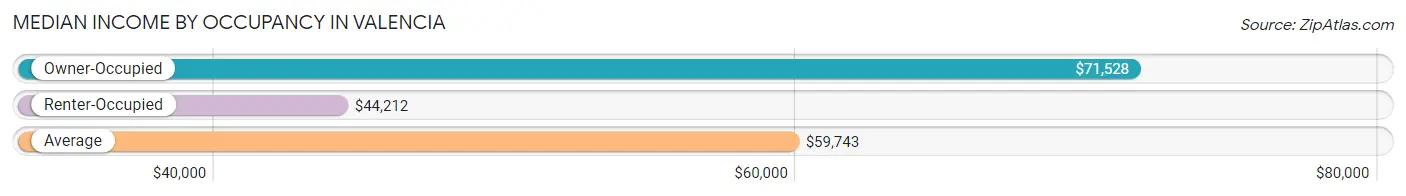
| Occupancy Type | # Households | Median Income |
| Owner-Occupied | 674 (85.9%) | $71,528 |
| Renter-Occupied | 111 (14.1%) | $44,212 |
| Average | 785 (100.0%) | $59,743 |
Occupancy by Householder Income Bracket in Valencia
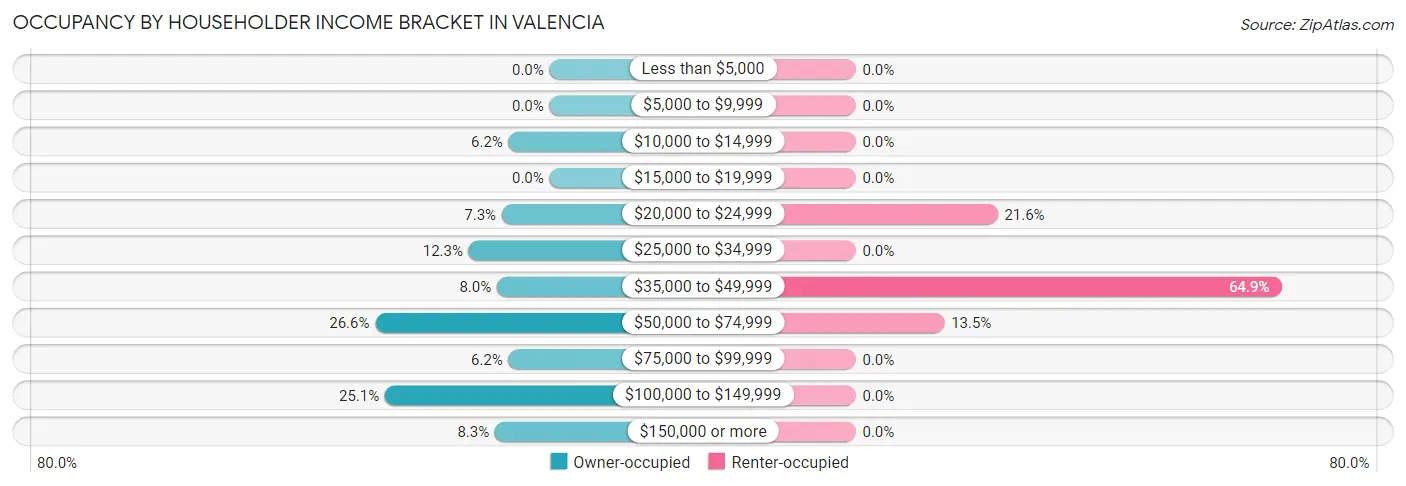
| Income Bracket | Owner-occupied | Renter-occupied |
| Less than $5,000 | 0 (0.0%) | 0 (0.0%) |
| $5,000 to $9,999 | 0 (0.0%) | 0 (0.0%) |
| $10,000 to $14,999 | 42 (6.2%) | 0 (0.0%) |
| $15,000 to $19,999 | 0 (0.0%) | 0 (0.0%) |
| $20,000 to $24,999 | 49 (7.3%) | 24 (21.6%) |
| $25,000 to $34,999 | 83 (12.3%) | 0 (0.0%) |
| $35,000 to $49,999 | 54 (8.0%) | 72 (64.9%) |
| $50,000 to $74,999 | 179 (26.6%) | 15 (13.5%) |
| $75,000 to $99,999 | 42 (6.2%) | 0 (0.0%) |
| $100,000 to $149,999 | 169 (25.1%) | 0 (0.0%) |
| $150,000 or more | 56 (8.3%) | 0 (0.0%) |
| Total | 674 (100.0%) | 111 (100.0%) |
Monthly Housing Cost Tiers in Valencia
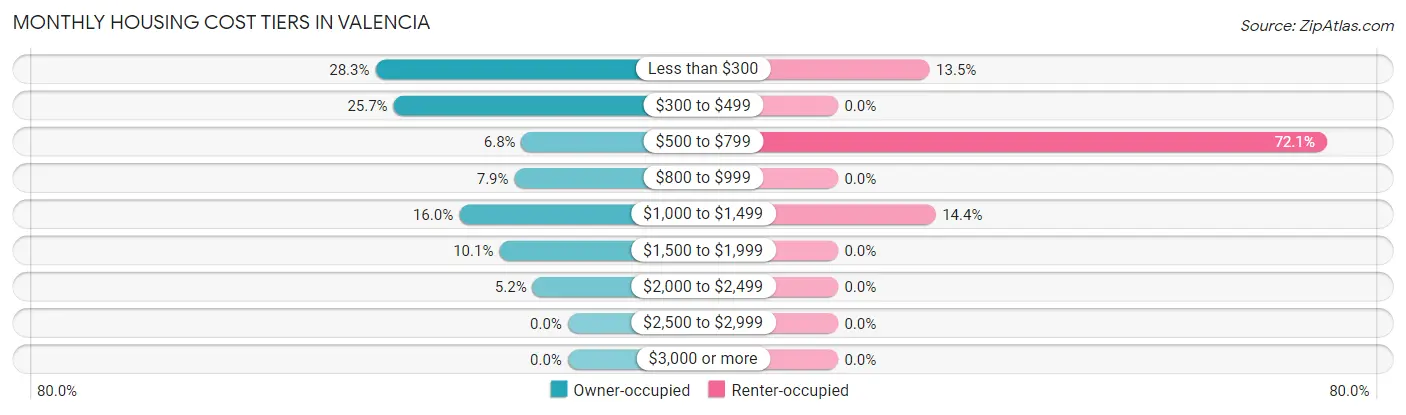
| Monthly Cost | Owner-occupied | Renter-occupied |
| Less than $300 | 191 (28.3%) | 15 (13.5%) |
| $300 to $499 | 173 (25.7%) | 0 (0.0%) |
| $500 to $799 | 46 (6.8%) | 80 (72.1%) |
| $800 to $999 | 53 (7.9%) | 0 (0.0%) |
| $1,000 to $1,499 | 108 (16.0%) | 16 (14.4%) |
| $1,500 to $1,999 | 68 (10.1%) | 0 (0.0%) |
| $2,000 to $2,499 | 35 (5.2%) | 0 (0.0%) |
| $2,500 to $2,999 | 0 (0.0%) | 0 (0.0%) |
| $3,000 or more | 0 (0.0%) | 0 (0.0%) |
| Total | 674 (100.0%) | 111 (100.0%) |
Physical Housing Characteristics in Valencia
Housing Structures in Valencia
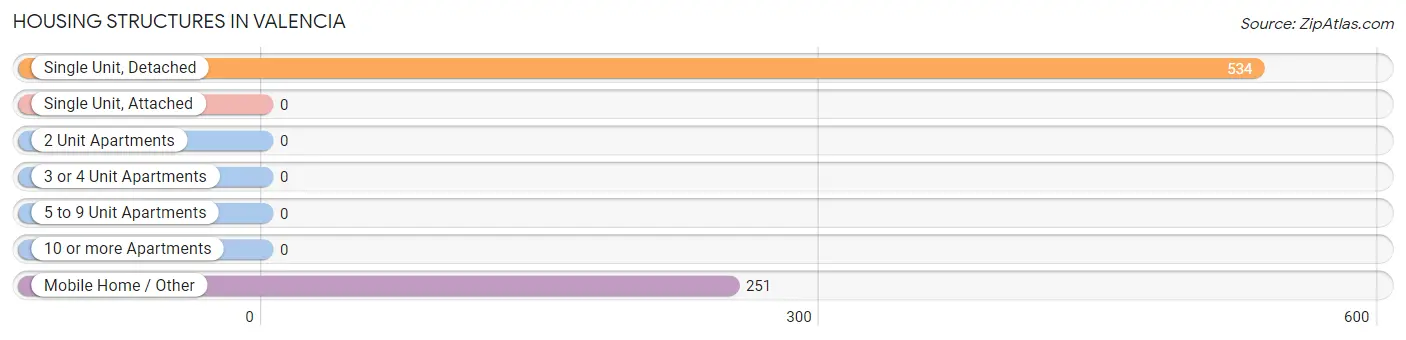
| Structure Type | # Housing Units | % Housing Units |
| Single Unit, Detached | 534 | 68.0% |
| Single Unit, Attached | 0 | 0.0% |
| 2 Unit Apartments | 0 | 0.0% |
| 3 or 4 Unit Apartments | 0 | 0.0% |
| 5 to 9 Unit Apartments | 0 | 0.0% |
| 10 or more Apartments | 0 | 0.0% |
| Mobile Home / Other | 251 | 32.0% |
| Total | 785 | 100.0% |
Housing Structures by Occupancy in Valencia
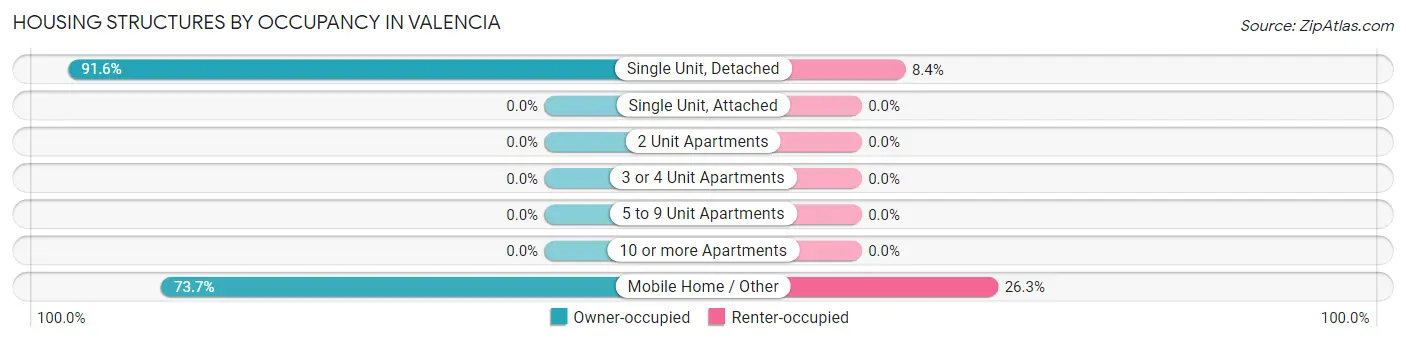
| Structure Type | Owner-occupied | Renter-occupied |
| Single Unit, Detached | 489 (91.6%) | 45 (8.4%) |
| Single Unit, Attached | 0 (0.0%) | 0 (0.0%) |
| 2 Unit Apartments | 0 (0.0%) | 0 (0.0%) |
| 3 or 4 Unit Apartments | 0 (0.0%) | 0 (0.0%) |
| 5 to 9 Unit Apartments | 0 (0.0%) | 0 (0.0%) |
| 10 or more Apartments | 0 (0.0%) | 0 (0.0%) |
| Mobile Home / Other | 185 (73.7%) | 66 (26.3%) |
| Total | 674 (85.9%) | 111 (14.1%) |
Housing Structures by Number of Rooms in Valencia
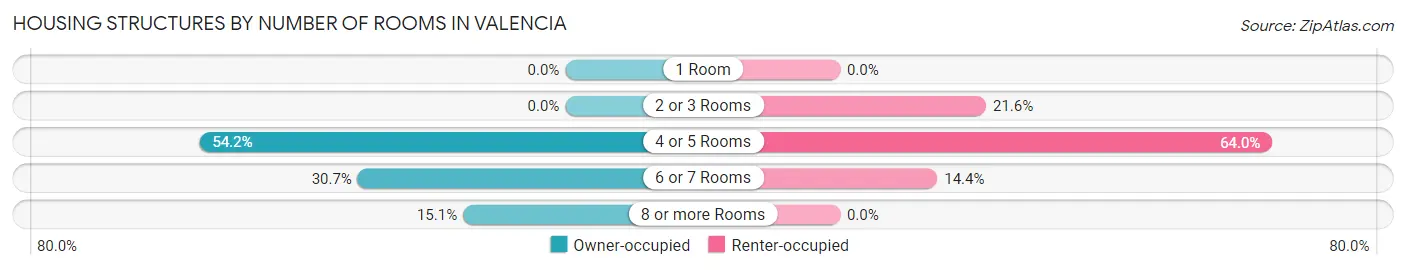
| Number of Rooms | Owner-occupied | Renter-occupied |
| 1 Room | 0 (0.0%) | 0 (0.0%) |
| 2 or 3 Rooms | 0 (0.0%) | 24 (21.6%) |
| 4 or 5 Rooms | 365 (54.1%) | 71 (64.0%) |
| 6 or 7 Rooms | 207 (30.7%) | 16 (14.4%) |
| 8 or more Rooms | 102 (15.1%) | 0 (0.0%) |
| Total | 674 (100.0%) | 111 (100.0%) |
Housing Structure by Heating Type in Valencia
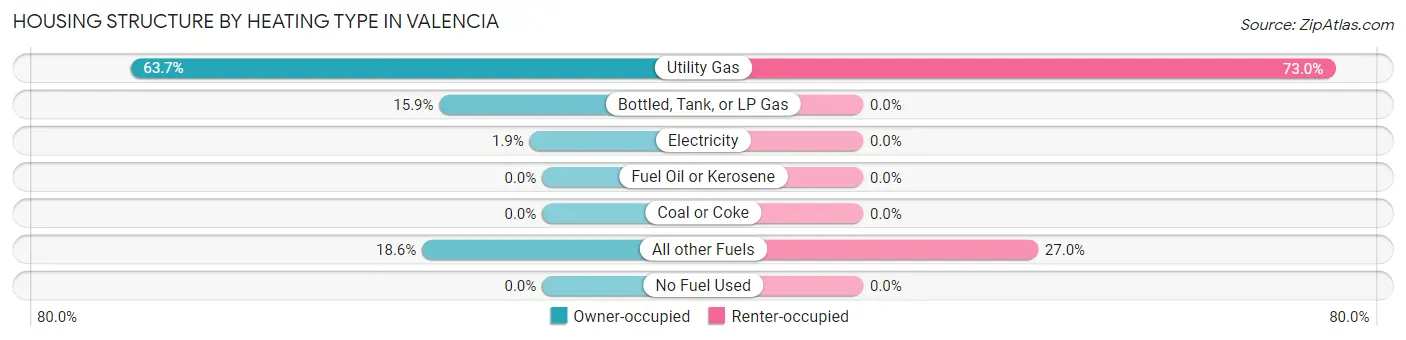
| Heating Type | Owner-occupied | Renter-occupied |
| Utility Gas | 429 (63.6%) | 81 (73.0%) |
| Bottled, Tank, or LP Gas | 107 (15.9%) | 0 (0.0%) |
| Electricity | 13 (1.9%) | 0 (0.0%) |
| Fuel Oil or Kerosene | 0 (0.0%) | 0 (0.0%) |
| Coal or Coke | 0 (0.0%) | 0 (0.0%) |
| All other Fuels | 125 (18.5%) | 30 (27.0%) |
| No Fuel Used | 0 (0.0%) | 0 (0.0%) |
| Total | 674 (100.0%) | 111 (100.0%) |
Household Vehicle Usage in Valencia
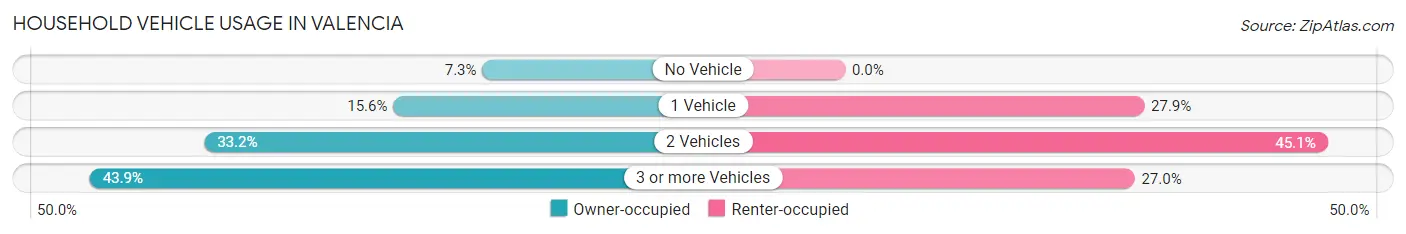
| Vehicles per Household | Owner-occupied | Renter-occupied |
| No Vehicle | 49 (7.3%) | 0 (0.0%) |
| 1 Vehicle | 105 (15.6%) | 31 (27.9%) |
| 2 Vehicles | 224 (33.2%) | 50 (45.1%) |
| 3 or more Vehicles | 296 (43.9%) | 30 (27.0%) |
| Total | 674 (100.0%) | 111 (100.0%) |
Real Estate & Mortgages in Valencia
Real Estate and Mortgage Overview in Valencia
| Characteristic | Without Mortgage | With Mortgage |
| Housing Units | 421 | 253 |
| Median Property Value | $209,500 | $281,800 |
| Median Household Income | $61,544 | $42 |
| Monthly Housing Costs | $321 | $0 |
| Real Estate Taxes | $1,120 | $0 |
Property Value by Mortgage Status in Valencia
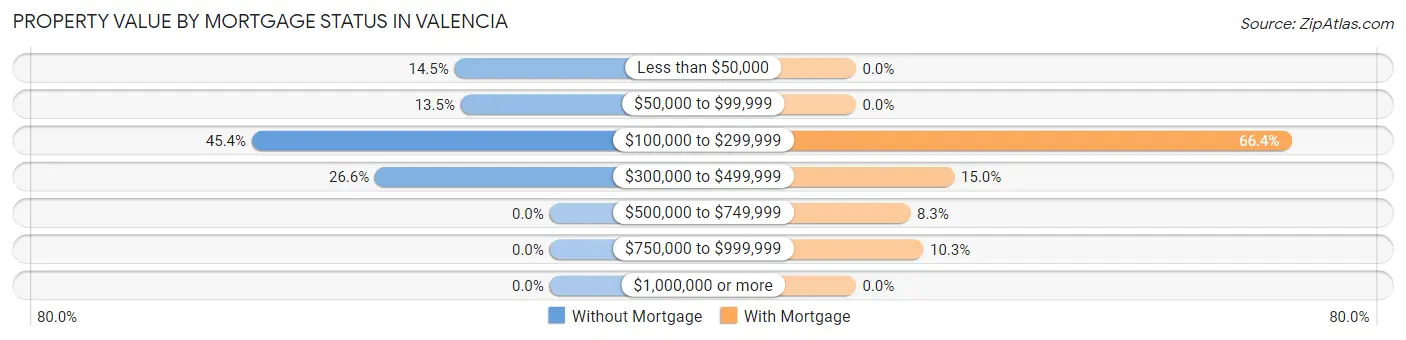
| Property Value | Without Mortgage | With Mortgage |
| Less than $50,000 | 61 (14.5%) | 0 (0.0%) |
| $50,000 to $99,999 | 57 (13.5%) | 0 (0.0%) |
| $100,000 to $299,999 | 191 (45.4%) | 168 (66.4%) |
| $300,000 to $499,999 | 112 (26.6%) | 38 (15.0%) |
| $500,000 to $749,999 | 0 (0.0%) | 21 (8.3%) |
| $750,000 to $999,999 | 0 (0.0%) | 26 (10.3%) |
| $1,000,000 or more | 0 (0.0%) | 0 (0.0%) |
| Total | 421 (100.0%) | 253 (100.0%) |
Household Income by Mortgage Status in Valencia
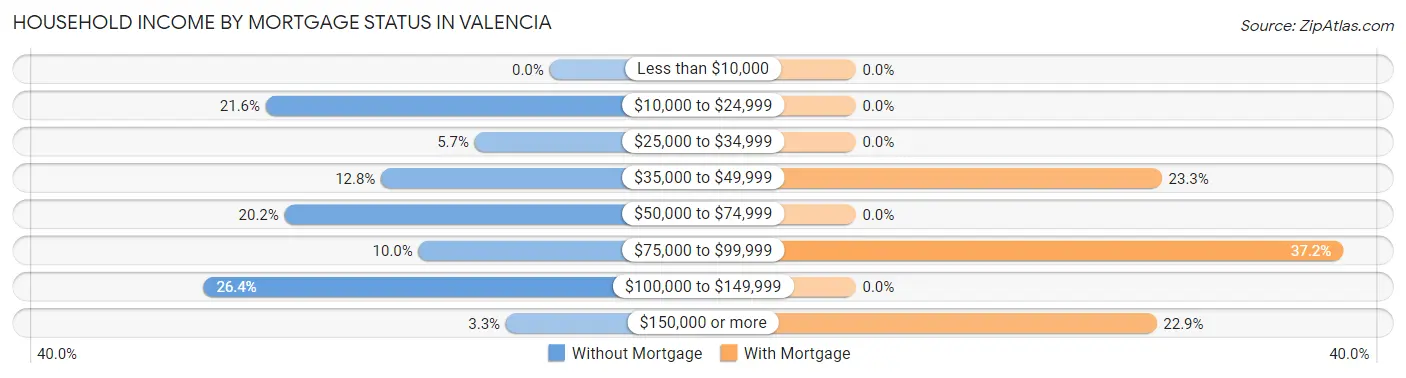
| Household Income | Without Mortgage | With Mortgage |
| Less than $10,000 | 0 (0.0%) | 0 (0.0%) |
| $10,000 to $24,999 | 91 (21.6%) | 0 (0.0%) |
| $25,000 to $34,999 | 24 (5.7%) | 0 (0.0%) |
| $35,000 to $49,999 | 54 (12.8%) | 59 (23.3%) |
| $50,000 to $74,999 | 85 (20.2%) | 0 (0.0%) |
| $75,000 to $99,999 | 42 (10.0%) | 94 (37.1%) |
| $100,000 to $149,999 | 111 (26.4%) | 0 (0.0%) |
| $150,000 or more | 14 (3.3%) | 58 (22.9%) |
| Total | 421 (100.0%) | 253 (100.0%) |
Property Value to Household Income Ratio in Valencia
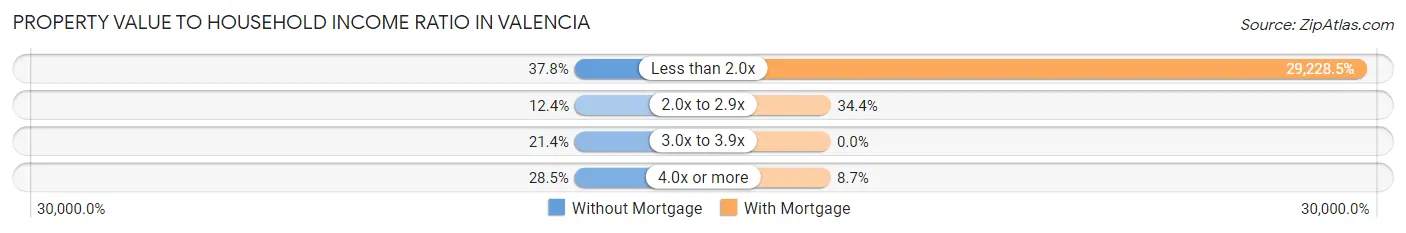
| Value-to-Income Ratio | Without Mortgage | With Mortgage |
| Less than 2.0x | 159 (37.8%) | 73,948 (29,228.5%) |
| 2.0x to 2.9x | 52 (12.3%) | 87 (34.4%) |
| 3.0x to 3.9x | 90 (21.4%) | 0 (0.0%) |
| 4.0x or more | 120 (28.5%) | 22 (8.7%) |
| Total | 421 (100.0%) | 253 (100.0%) |
Real Estate Taxes by Mortgage Status in Valencia
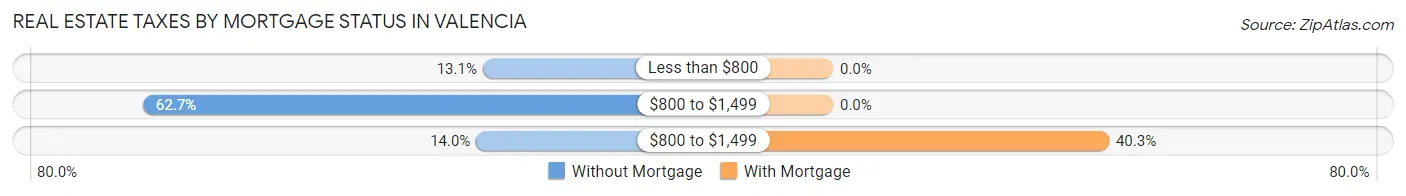
| Property Taxes | Without Mortgage | With Mortgage |
| Less than $800 | 55 (13.1%) | 0 (0.0%) |
| $800 to $1,499 | 264 (62.7%) | 0 (0.0%) |
| $800 to $1,499 | 59 (14.0%) | 102 (40.3%) |
| Total | 421 (100.0%) | 253 (100.0%) |
Health & Disability in Valencia
Health Insurance Coverage by Age in Valencia
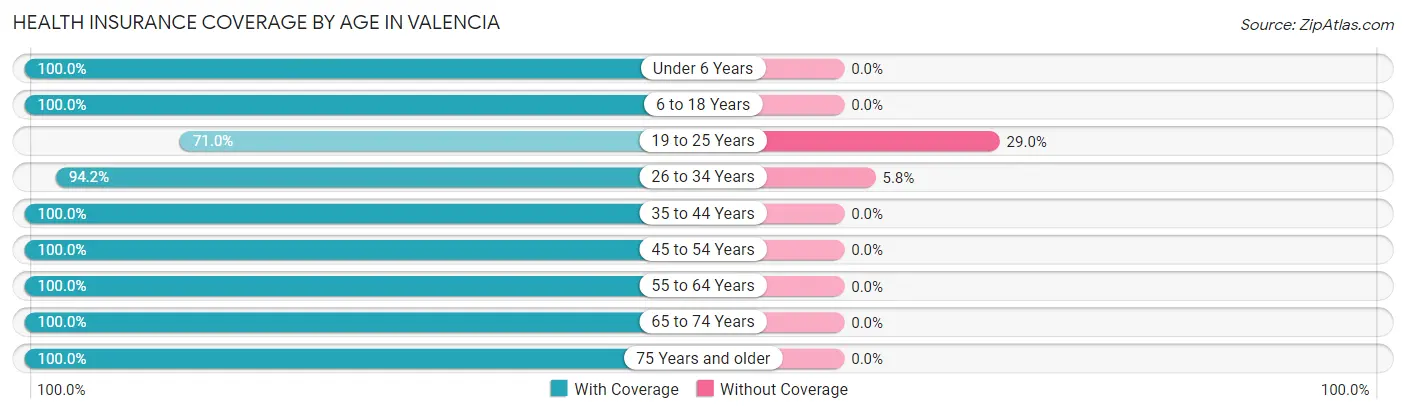
| Age Bracket | With Coverage | Without Coverage |
| Under 6 Years | 174 (100.0%) | 0 (0.0%) |
| 6 to 18 Years | 189 (100.0%) | 0 (0.0%) |
| 19 to 25 Years | 76 (71.0%) | 31 (29.0%) |
| 26 to 34 Years | 420 (94.2%) | 26 (5.8%) |
| 35 to 44 Years | 114 (100.0%) | 0 (0.0%) |
| 45 to 54 Years | 219 (100.0%) | 0 (0.0%) |
| 55 to 64 Years | 421 (100.0%) | 0 (0.0%) |
| 65 to 74 Years | 325 (100.0%) | 0 (0.0%) |
| 75 Years and older | 17 (100.0%) | 0 (0.0%) |
| Total | 1,955 (97.2%) | 57 (2.8%) |
Health Insurance Coverage by Citizenship Status in Valencia
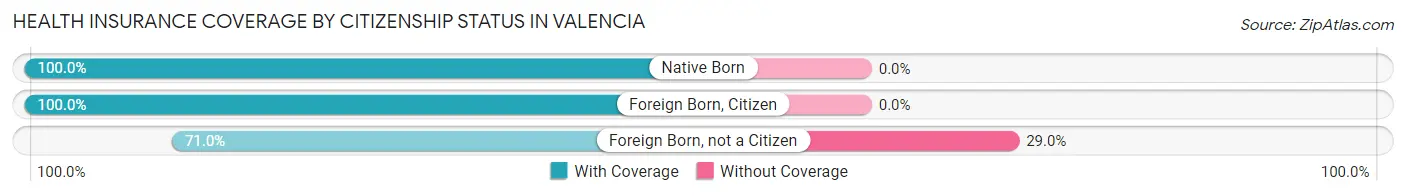
| Citizenship Status | With Coverage | Without Coverage |
| Native Born | 174 (100.0%) | 0 (0.0%) |
| Foreign Born, Citizen | 189 (100.0%) | 0 (0.0%) |
| Foreign Born, not a Citizen | 76 (71.0%) | 31 (29.0%) |
Health Insurance Coverage by Household Income in Valencia
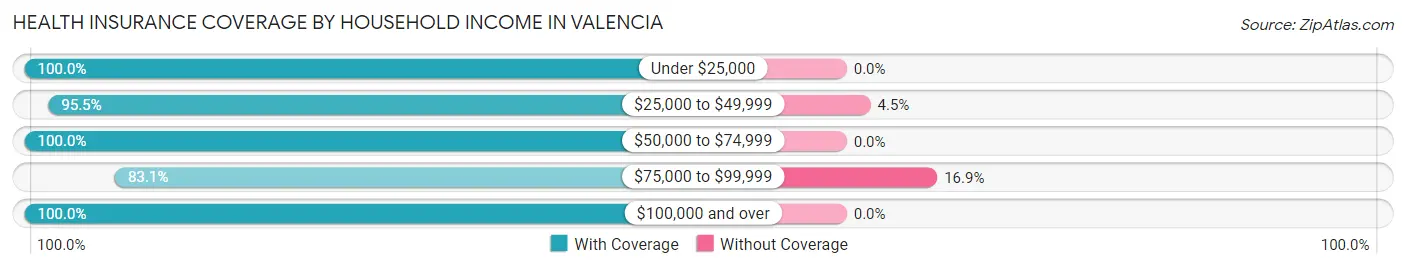
| Household Income | With Coverage | Without Coverage |
| Under $25,000 | 115 (100.0%) | 0 (0.0%) |
| $25,000 to $49,999 | 557 (95.5%) | 26 (4.5%) |
| $50,000 to $74,999 | 546 (100.0%) | 0 (0.0%) |
| $75,000 to $99,999 | 152 (83.1%) | 31 (16.9%) |
| $100,000 and over | 585 (100.0%) | 0 (0.0%) |
Public vs Private Health Insurance Coverage by Age in Valencia
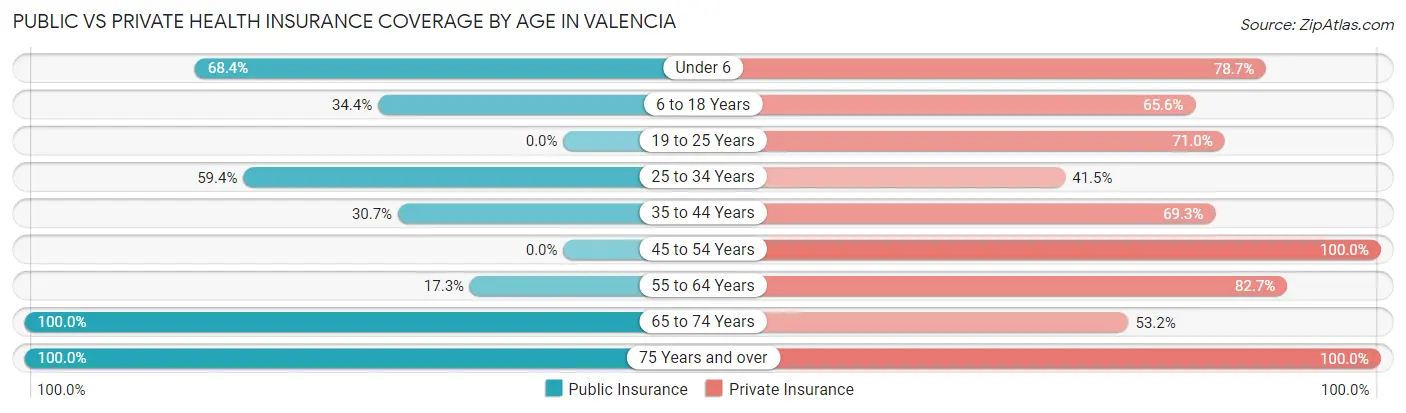
| Age Bracket | Public Insurance | Private Insurance |
| Under 6 | 119 (68.4%) | 137 (78.7%) |
| 6 to 18 Years | 65 (34.4%) | 124 (65.6%) |
| 19 to 25 Years | 0 (0.0%) | 76 (71.0%) |
| 25 to 34 Years | 265 (59.4%) | 185 (41.5%) |
| 35 to 44 Years | 35 (30.7%) | 79 (69.3%) |
| 45 to 54 Years | 0 (0.0%) | 219 (100.0%) |
| 55 to 64 Years | 73 (17.3%) | 348 (82.7%) |
| 65 to 74 Years | 325 (100.0%) | 173 (53.2%) |
| 75 Years and over | 17 (100.0%) | 17 (100.0%) |
| Total | 899 (44.7%) | 1,358 (67.5%) |
Disability Status by Sex by Age in Valencia
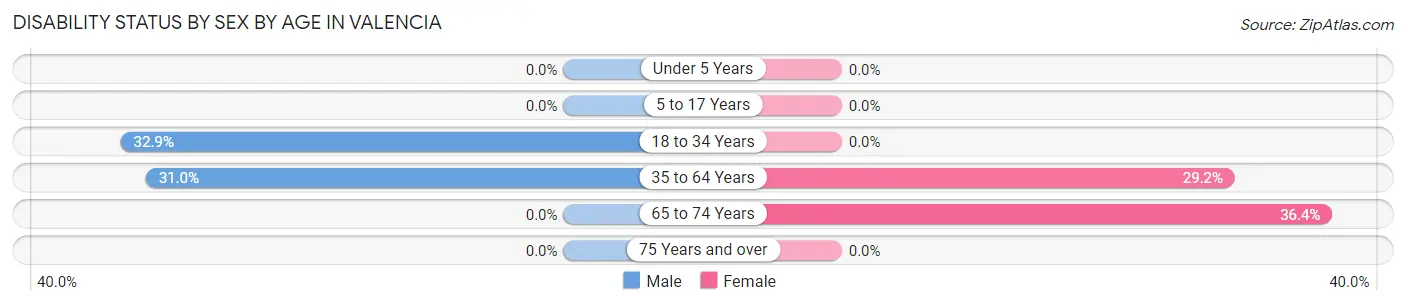
| Age Bracket | Male | Female |
| Under 5 Years | 0 (0.0%) | 0 (0.0%) |
| 5 to 17 Years | 0 (0.0%) | 0 (0.0%) |
| 18 to 34 Years | 141 (32.9%) | 0 (0.0%) |
| 35 to 64 Years | 102 (31.0%) | 124 (29.2%) |
| 65 to 74 Years | 0 (0.0%) | 75 (36.4%) |
| 75 Years and over | 0 (0.0%) | 0 (0.0%) |
Disability Class by Sex by Age in Valencia
Disability Class: Hearing Difficulty
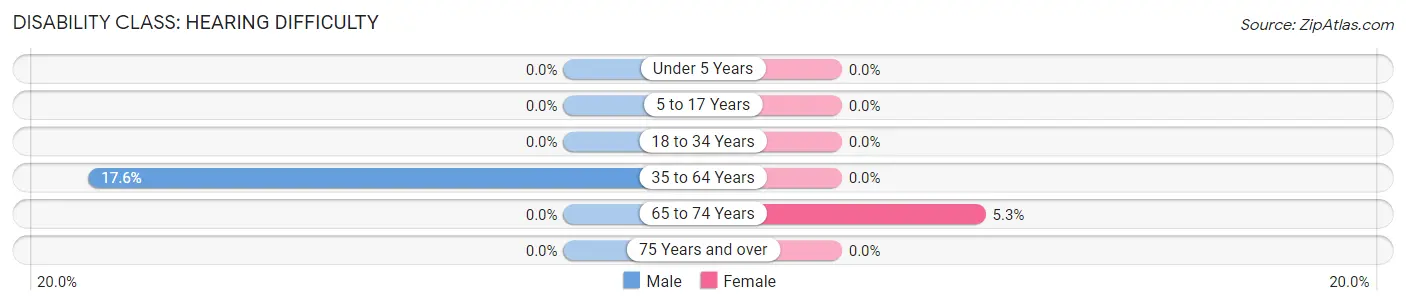
| Age Bracket | Male | Female |
| Under 5 Years | 0 (0.0%) | 0 (0.0%) |
| 5 to 17 Years | 0 (0.0%) | 0 (0.0%) |
| 18 to 34 Years | 0 (0.0%) | 0 (0.0%) |
| 35 to 64 Years | 58 (17.6%) | 0 (0.0%) |
| 65 to 74 Years | 0 (0.0%) | 11 (5.3%) |
| 75 Years and over | 0 (0.0%) | 0 (0.0%) |
Disability Class: Vision Difficulty
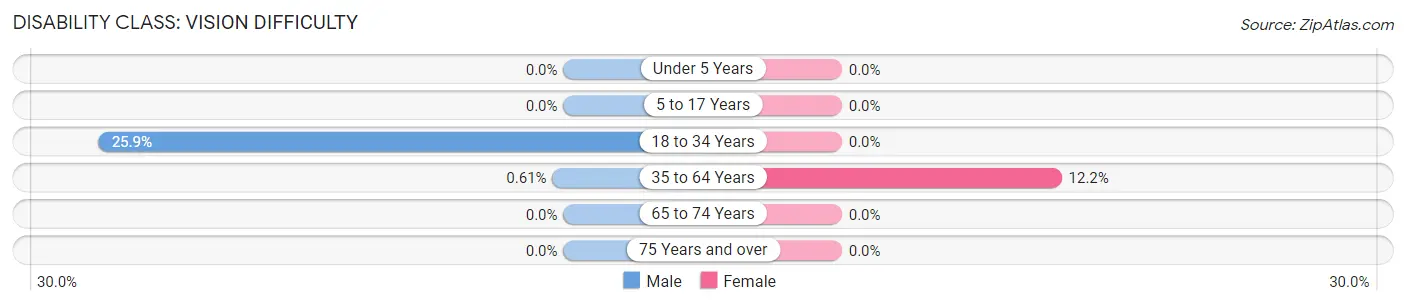
| Age Bracket | Male | Female |
| Under 5 Years | 0 (0.0%) | 0 (0.0%) |
| 5 to 17 Years | 0 (0.0%) | 0 (0.0%) |
| 18 to 34 Years | 111 (25.9%) | 0 (0.0%) |
| 35 to 64 Years | 2 (0.6%) | 52 (12.2%) |
| 65 to 74 Years | 0 (0.0%) | 0 (0.0%) |
| 75 Years and over | 0 (0.0%) | 0 (0.0%) |
Disability Class: Cognitive Difficulty
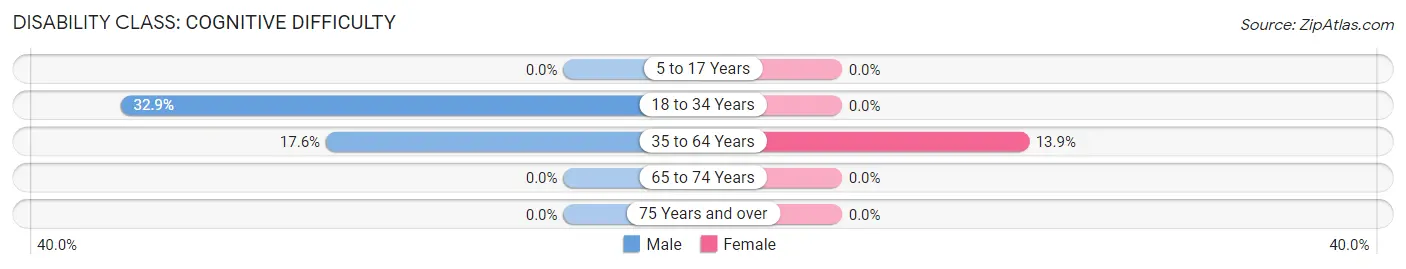
| Age Bracket | Male | Female |
| 5 to 17 Years | 0 (0.0%) | 0 (0.0%) |
| 18 to 34 Years | 141 (32.9%) | 0 (0.0%) |
| 35 to 64 Years | 58 (17.6%) | 59 (13.9%) |
| 65 to 74 Years | 0 (0.0%) | 0 (0.0%) |
| 75 Years and over | 0 (0.0%) | 0 (0.0%) |
Disability Class: Ambulatory Difficulty
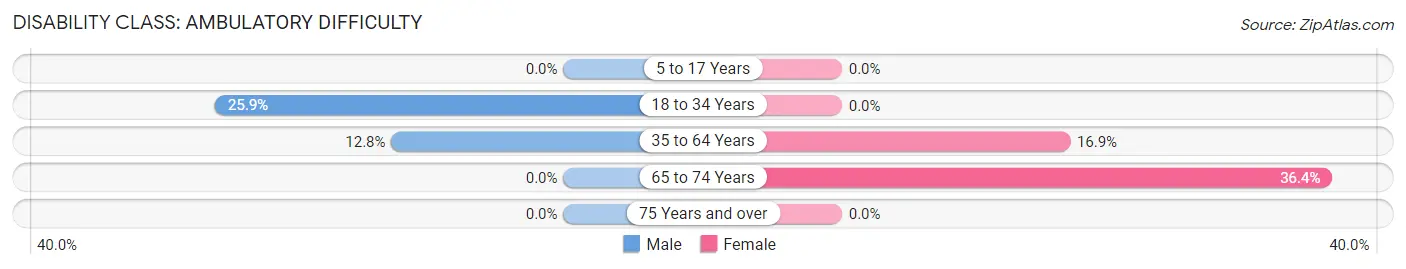
| Age Bracket | Male | Female |
| 5 to 17 Years | 0 (0.0%) | 0 (0.0%) |
| 18 to 34 Years | 111 (25.9%) | 0 (0.0%) |
| 35 to 64 Years | 42 (12.8%) | 72 (16.9%) |
| 65 to 74 Years | 0 (0.0%) | 75 (36.4%) |
| 75 Years and over | 0 (0.0%) | 0 (0.0%) |
Disability Class: Self-Care Difficulty
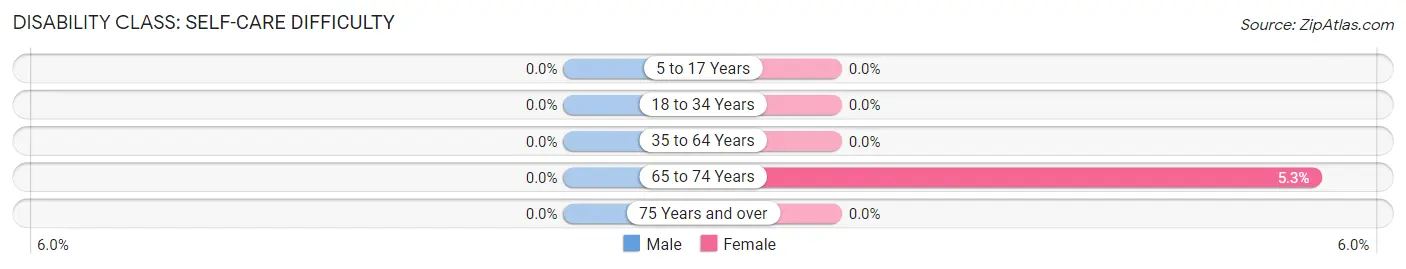
| Age Bracket | Male | Female |
| 5 to 17 Years | 0 (0.0%) | 0 (0.0%) |
| 18 to 34 Years | 0 (0.0%) | 0 (0.0%) |
| 35 to 64 Years | 0 (0.0%) | 0 (0.0%) |
| 65 to 74 Years | 0 (0.0%) | 11 (5.3%) |
| 75 Years and over | 0 (0.0%) | 0 (0.0%) |
Technology Access in Valencia
Computing Device Access in Valencia
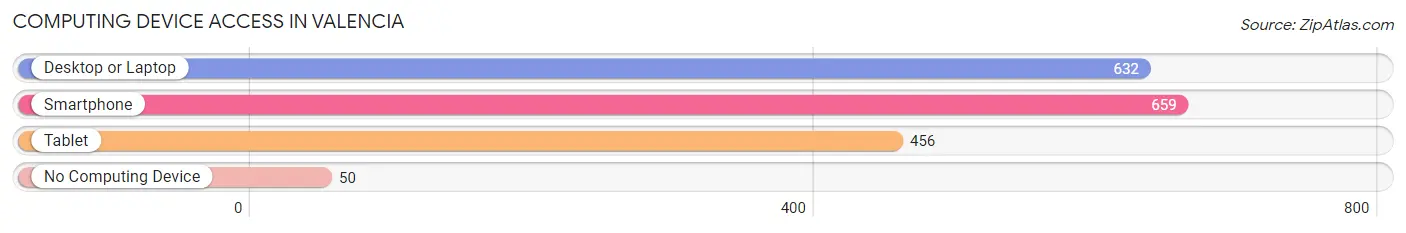
| Device Type | # Households | % Households |
| Desktop or Laptop | 632 | 80.5% |
| Smartphone | 659 | 84.0% |
| Tablet | 456 | 58.1% |
| No Computing Device | 50 | 6.4% |
| Total | 785 | 100.0% |
Internet Access in Valencia
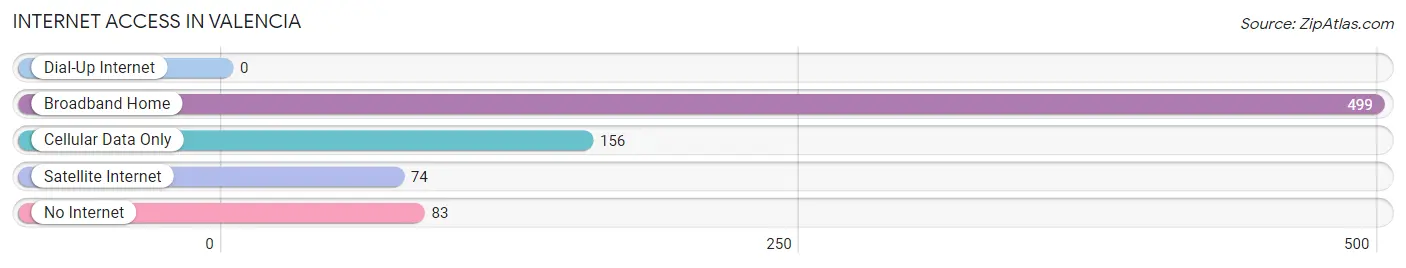
| Internet Type | # Households | % Households |
| Dial-Up Internet | 0 | 0.0% |
| Broadband Home | 499 | 63.6% |
| Cellular Data Only | 156 | 19.9% |
| Satellite Internet | 74 | 9.4% |
| No Internet | 83 | 10.6% |
| Total | 785 | 100.0% |
Valencia Summary
Valencia County, New Mexico is located in the central part of the state, just south of Albuquerque. It is bordered by Bernalillo County to the north, Socorro County to the east, Torrance County to the south, and Sandoval County to the west. The county seat is Los Lunas, and the largest city is Belen. The county was established in 1852 and named after the Spanish province of Valencia.
Geography
Valencia County is located in the Rio Grande Valley, and is part of the Albuquerque metropolitan area. The county covers an area of 1,945 square miles, and is the third largest county in New Mexico. The county is mostly flat, with elevations ranging from 4,500 to 6,000 feet above sea level. The Rio Grande River forms the western border of the county, and the Manzano Mountains are located in the eastern part of the county.
The climate of Valencia County is semi-arid, with hot summers and mild winters. The average annual precipitation is about 12 inches, and the average annual temperature is about 60 degrees Fahrenheit.
Economy
Valencia County has a diverse economy, with a mix of agriculture, manufacturing, and service industries. The county is home to several large companies, including Intel, Sandia National Laboratories, and the University of New Mexico.
Agriculture is an important part of the economy, with the county producing a variety of crops, including alfalfa, cotton, corn, and wheat. Livestock production is also important, with cattle, sheep, and goats being raised in the county.
Manufacturing is also an important part of the economy, with the county producing a variety of products, including electronics, food products, and furniture.
Demographics
As of the 2010 census, Valencia County had a population of 76,569. The population is mostly Hispanic, with about 70% of the population identifying as Hispanic or Latino. The median household income is $45,845, and the median age is 33.
Valencia County is home to several Native American tribes, including the Isleta Pueblo, the Sandia Pueblo, and the Cochiti Pueblo. The county also has a large military presence, with Kirtland Air Force Base located in the county.
Conclusion
Valencia County, New Mexico is a diverse and vibrant county located in the central part of the state. The county has a mix of agriculture, manufacturing, and service industries, and is home to several large companies. The population is mostly Hispanic, and the median household income is $45,845. The county is also home to several Native American tribes, and has a large military presence. Valencia County is an important part of the state of New Mexico, and is a great place to live and work.
Common Questions
What is Per Capita Income in Valencia?
Per Capita income in Valencia is $34,286.
What is the Median Family Income in Valencia?
Median Family Income in Valencia is $73,250.
What is the Median Household income in Valencia?
Median Household Income in Valencia is $59,743.
What is Income or Wage Gap in Valencia?
Income or Wage Gap in Valencia is 28.1%.
Women in Valencia earn 71.9 cents for every dollar earned by a man.
What is Inequality or Gini Index in Valencia?
Inequality or Gini Index in Valencia is 0.41.
What is the Total Population of Valencia?
Total Population of Valencia is 2,012.
What is the Total Male Population of Valencia?
Total Male Population of Valencia is 1,120.
What is the Total Female Population of Valencia?
Total Female Population of Valencia is 892.
What is the Ratio of Males per 100 Females in Valencia?
There are 125.56 Males per 100 Females in Valencia.
What is the Ratio of Females per 100 Males in Valencia?
There are 79.64 Females per 100 Males in Valencia.
What is the Median Population Age in Valencia?
Median Population Age in Valencia is 42.5 Years.
What is the Average Family Size in Valencia
Average Family Size in Valencia is 3.7 People.
What is the Average Household Size in Valencia
Average Household Size in Valencia is 2.6 People.
How Large is the Labor Force in Valencia?
There are 993 People in the Labor Forcein in Valencia.
What is the Percentage of People in the Labor Force in Valencia?
58.6% of People are in the Labor Force in Valencia.
What is the Unemployment Rate in Valencia?
Unemployment Rate in Valencia is 8.3%.