Pedro Bay, AK Map & Demographics
Pedro Bay Map
Pedro Bay Overview
$76,008
PER CAPITA INCOME
$75,833
AVG HOUSEHOLD INCOME
0.40
INEQUALITY / GINI INDEX
13
TOTAL POPULATION
3
MALE POPULATION
10
FEMALE POPULATION
30.00
MALES / 100 FEMALES
333.33
FEMALES / 100 MALES
57.5
MEDIAN AGE
2.0
AVG FAMILY SIZE
1.3
AVG HOUSEHOLD SIZE
8
LABOR FORCE [ PEOPLE ]
72.7%
PERCENT IN LABOR FORCE
25.0%
UNEMPLOYMENT RATE
Pedro Bay Zip Codes
Pedro Bay Area Codes
Income in Pedro Bay
Income Overview in Pedro Bay
| Characteristic | Number | Measure |
| Per Capita Income | 13 | $76,008 |
| Median Family Income | 3 | $0 |
| Mean Family Income | 3 | $0 |
| Median Household Income | 10 | $75,833 |
| Mean Household Income | 10 | $100,330 |
| Income Deficit | 3 | $0 |
| Wage / Income Gap (%) | 13 | 0.00% |
| Wage / Income Gap ($) | 13 | 100.00¢ per $1 |
| Gini / Inequality Index | 13 | 0.40 |
Earnings by Sex in Pedro Bay
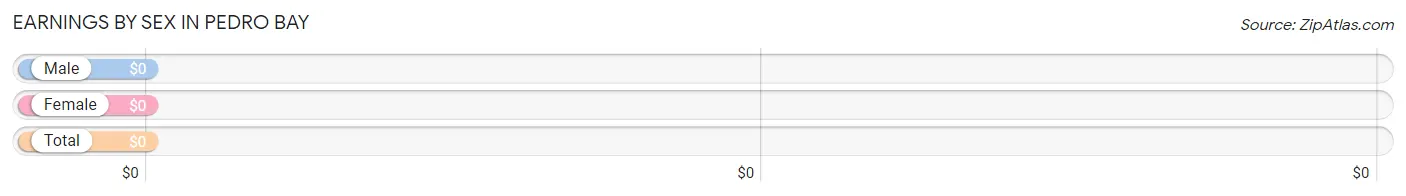
| Sex | Number | Average Earnings |
| Male | 3 (27.3%) | $0 |
| Female | 8 (72.7%) | $0 |
| Total | 11 (100.0%) | $0 |
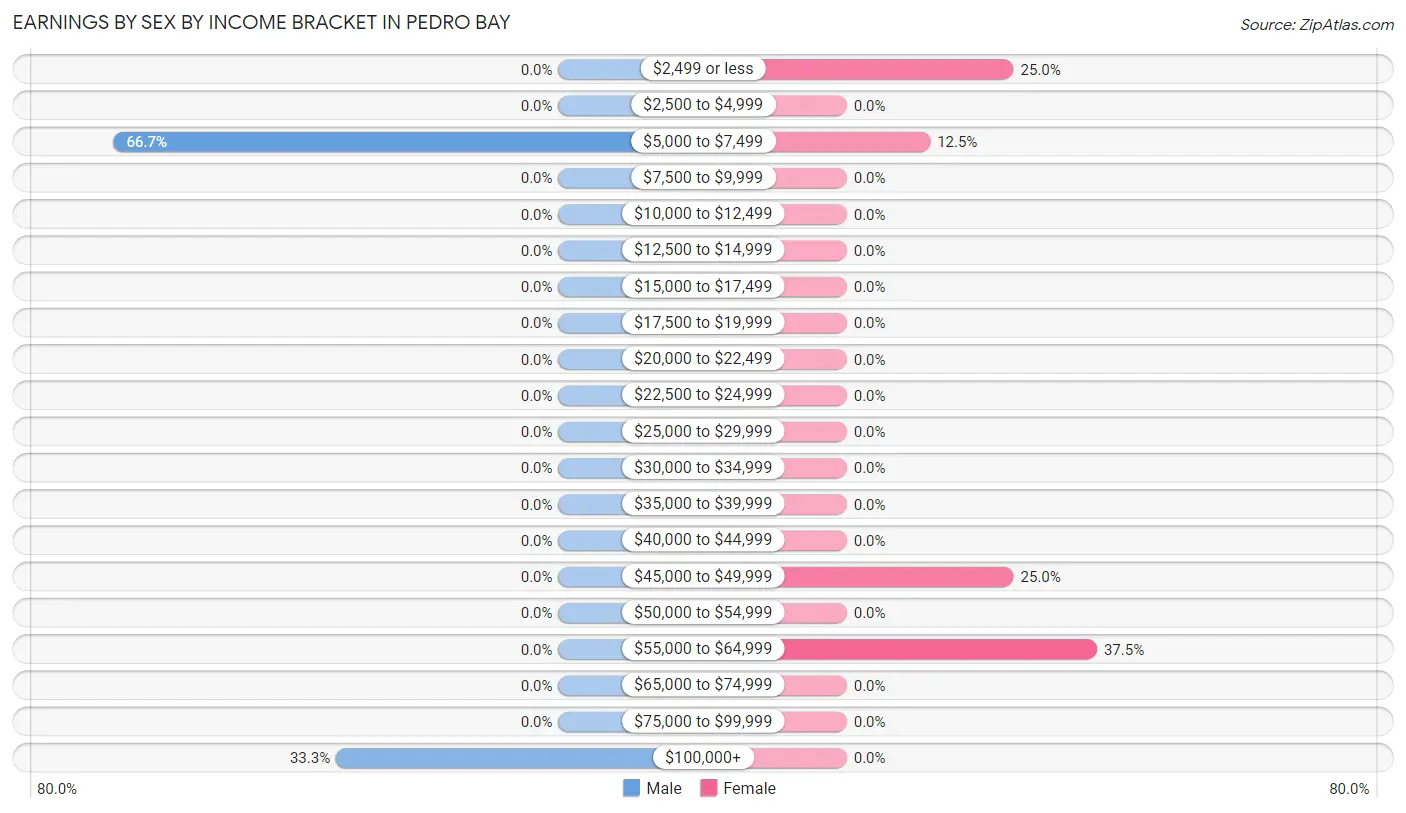
Earnings by Sex by Income Bracket in Pedro Bay
The most common earnings brackets in Pedro Bay are $5,000 to $7,499 for men (2 | 66.7%) and $55,000 to $64,999 for women (3 | 37.5%).
| Income | Male | Female |
| $2,499 or less | 0 (0.0%) | 2 (25.0%) |
| $2,500 to $4,999 | 0 (0.0%) | 0 (0.0%) |
| $5,000 to $7,499 | 2 (66.7%) | 1 (12.5%) |
| $7,500 to $9,999 | 0 (0.0%) | 0 (0.0%) |
| $10,000 to $12,499 | 0 (0.0%) | 0 (0.0%) |
| $12,500 to $14,999 | 0 (0.0%) | 0 (0.0%) |
| $15,000 to $17,499 | 0 (0.0%) | 0 (0.0%) |
| $17,500 to $19,999 | 0 (0.0%) | 0 (0.0%) |
| $20,000 to $22,499 | 0 (0.0%) | 0 (0.0%) |
| $22,500 to $24,999 | 0 (0.0%) | 0 (0.0%) |
| $25,000 to $29,999 | 0 (0.0%) | 0 (0.0%) |
| $30,000 to $34,999 | 0 (0.0%) | 0 (0.0%) |
| $35,000 to $39,999 | 0 (0.0%) | 0 (0.0%) |
| $40,000 to $44,999 | 0 (0.0%) | 0 (0.0%) |
| $45,000 to $49,999 | 0 (0.0%) | 2 (25.0%) |
| $50,000 to $54,999 | 0 (0.0%) | 0 (0.0%) |
| $55,000 to $64,999 | 0 (0.0%) | 3 (37.5%) |
| $65,000 to $74,999 | 0 (0.0%) | 0 (0.0%) |
| $75,000 to $99,999 | 0 (0.0%) | 0 (0.0%) |
| $100,000+ | 1 (33.3%) | 0 (0.0%) |
| Total | 3 (100.0%) | 8 (100.0%) |
Earnings by Sex by Educational Attainment in Pedro Bay
| Educational Attainment | Male Income | Female Income |
| Less than High School | - | - |
| High School Diploma | - | - |
| College or Associate's Degree | - | - |
| Bachelor's Degree | - | - |
| Graduate Degree | - | - |
| Total | - | - |
Family Income in Pedro Bay
Family Income Brackets in Pedro Bay
According to the Pedro Bay family income data, there are 3 families falling into the $75,000 to $99,999 income range, which is the most common income bracket and makes up 100.0% of all families.
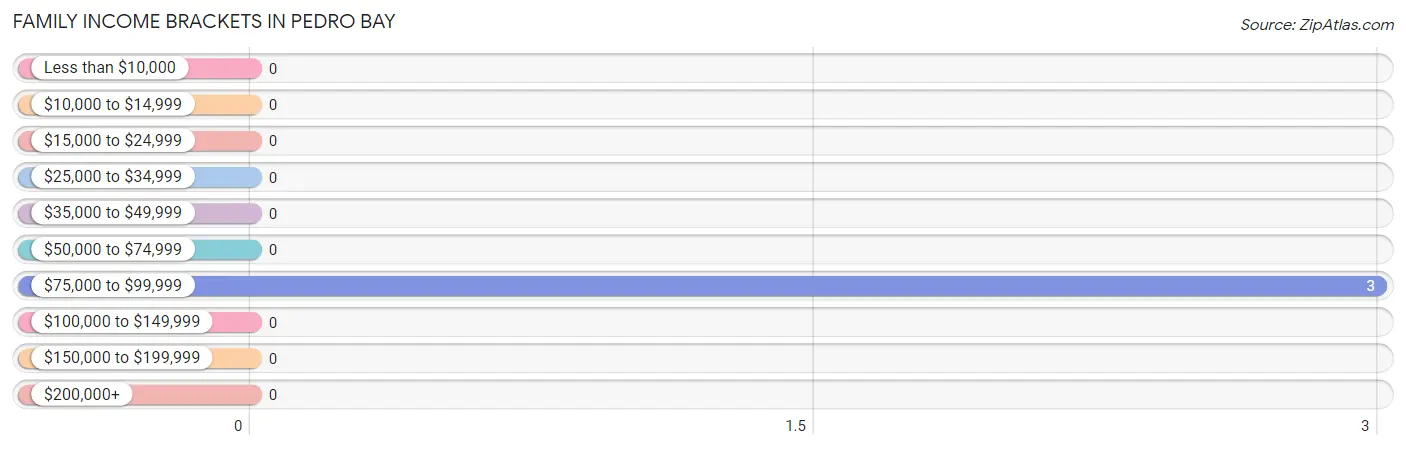
| Income Bracket | # Families | % Families |
| Less than $10,000 | 0 | 0.0% |
| $10,000 to $14,999 | 0 | 0.0% |
| $15,000 to $24,999 | 0 | 0.0% |
| $25,000 to $34,999 | 0 | 0.0% |
| $35,000 to $49,999 | 0 | 0.0% |
| $50,000 to $74,999 | 0 | 0.0% |
| $75,000 to $99,999 | 3 | 100.0% |
| $100,000 to $149,999 | 0 | 0.0% |
| $150,000 to $199,999 | 0 | 0.0% |
| $200,000+ | 0 | 0.0% |
Family Income by Famaliy Size in Pedro Bay
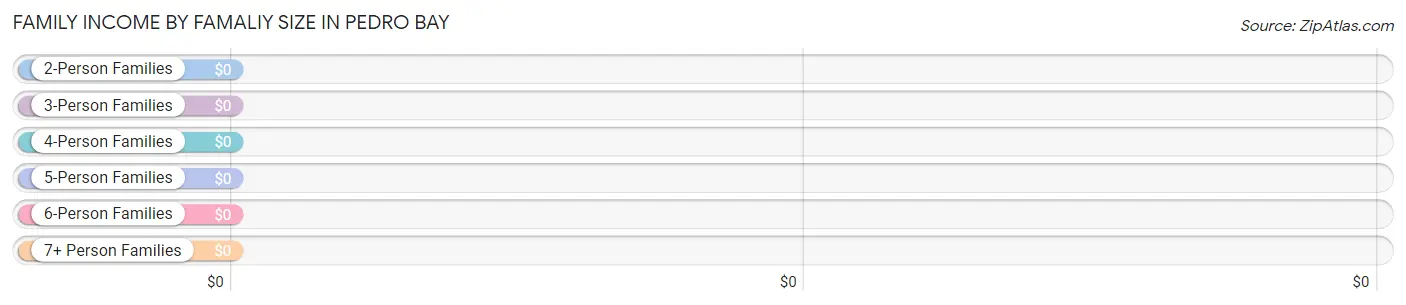
| Income Bracket | # Families | Median Income |
| 2-Person Families | 0 (0.0%) | $0 |
| 3-Person Families | 3 (100.0%) | $0 |
| 4-Person Families | 0 (0.0%) | $0 |
| 5-Person Families | 0 (0.0%) | $0 |
| 6-Person Families | 0 (0.0%) | $0 |
| 7+ Person Families | 0 (0.0%) | $0 |
| Total | 3 (100.0%) | $0 |
Family Income by Number of Earners in Pedro Bay
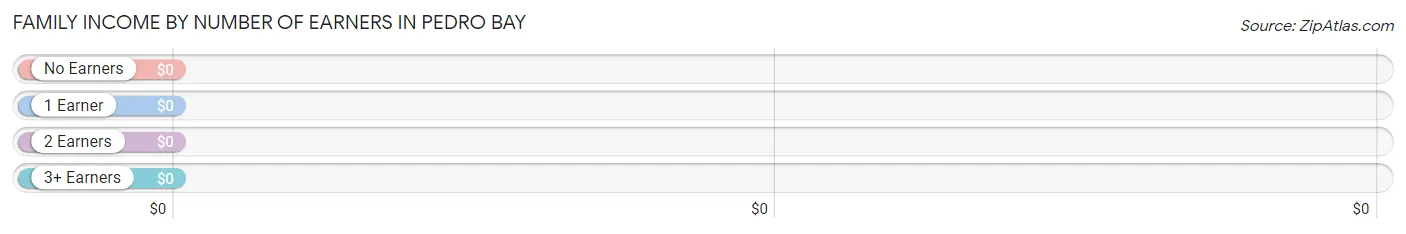
| Number of Earners | # Families | Median Income |
| No Earners | 0 (0.0%) | $0 |
| 1 Earner | 0 (0.0%) | $0 |
| 2 Earners | 3 (100.0%) | $0 |
| 3+ Earners | 0 (0.0%) | $0 |
| Total | 3 (100.0%) | $0 |
Household Income in Pedro Bay
Household Income Brackets in Pedro Bay
With 3 households falling in the category, the $75,000 to $99,999 income range is the most frequent in Pedro Bay, accounting for 30.0% of all households.
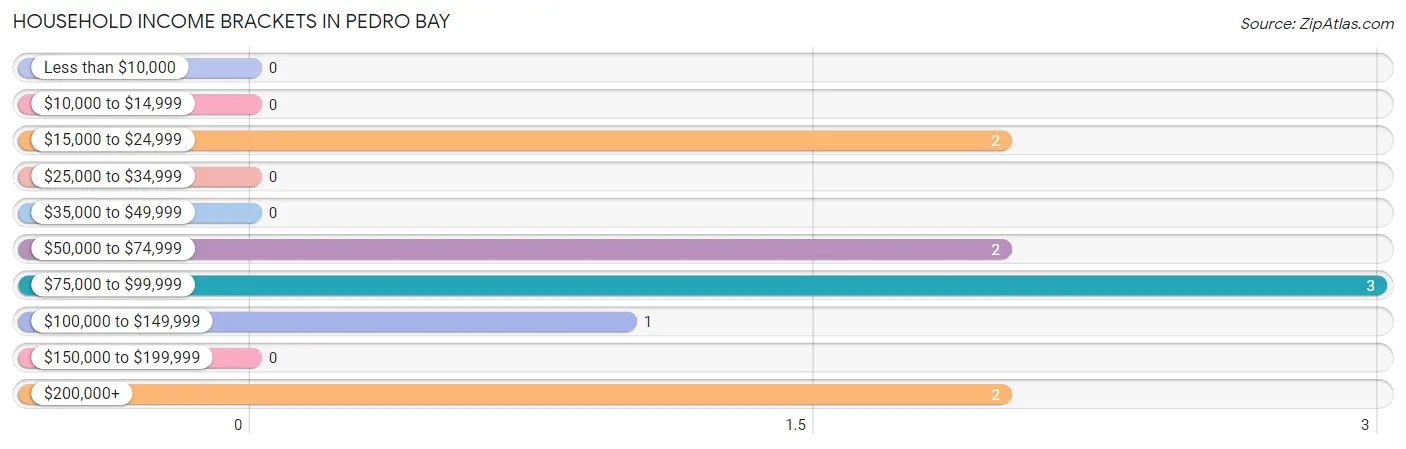
| Income Bracket | # Households | % Households |
| Less than $10,000 | 0 | 0.0% |
| $10,000 to $14,999 | 0 | 0.0% |
| $15,000 to $24,999 | 2 | 20.0% |
| $25,000 to $34,999 | 0 | 0.0% |
| $35,000 to $49,999 | 0 | 0.0% |
| $50,000 to $74,999 | 2 | 20.0% |
| $75,000 to $99,999 | 3 | 30.0% |
| $100,000 to $149,999 | 1 | 10.0% |
| $150,000 to $199,999 | 0 | 0.0% |
| $200,000+ | 2 | 20.0% |
Household Income by Householder Age in Pedro Bay
The median household income in Pedro Bay is $75,833, with the highest median household income of $68,750 found in the 45 to 64 years age bracket for the primary householder. A total of 8 households (80.0%) fall into this category.
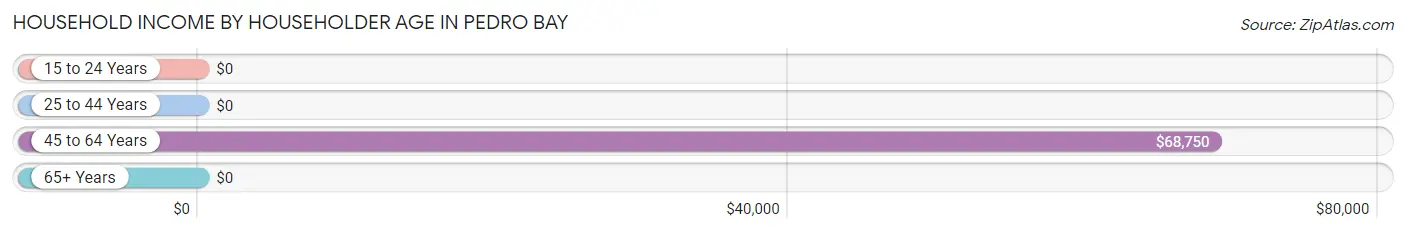
| Income Bracket | # Households | Median Income |
| 15 to 24 Years | 0 (0.0%) | $0 |
| 25 to 44 Years | 0 (0.0%) | $0 |
| 45 to 64 Years | 8 (80.0%) | $68,750 |
| 65+ Years | 2 (20.0%) | $0 |
| Total | 10 (100.0%) | $75,833 |
Poverty in Pedro Bay
Income Below Poverty by Sex and Age in Pedro Bay
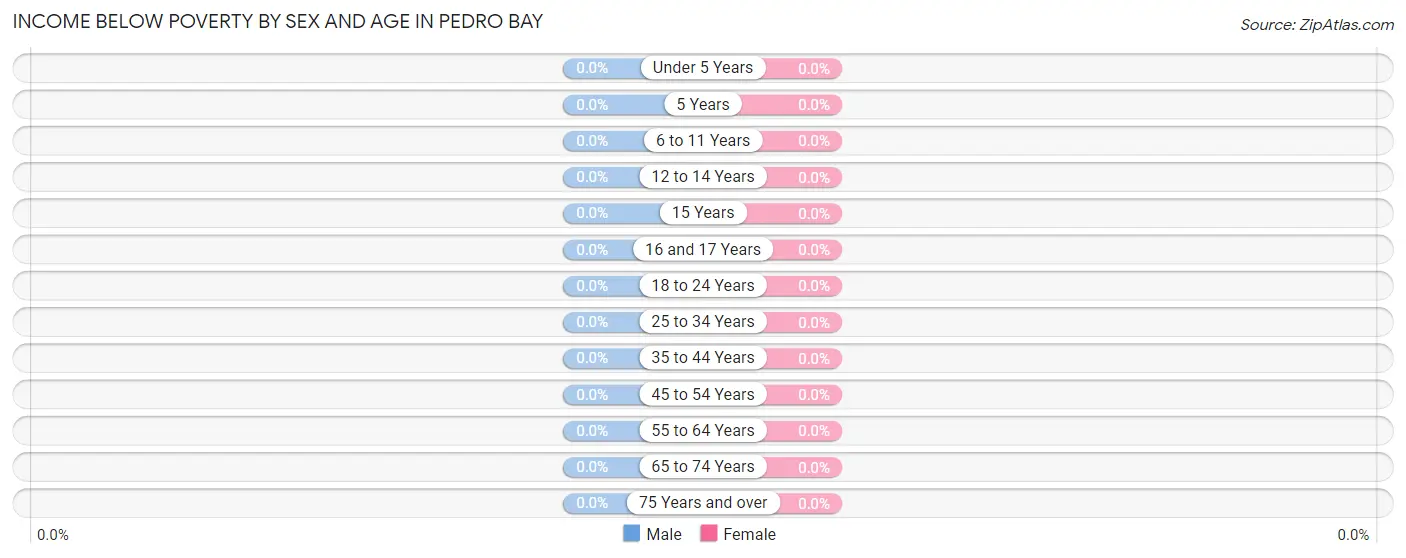
| Age Bracket | Male | Female |
| Under 5 Years | 0 (0.0%) | 0 (0.0%) |
| 5 Years | 0 (0.0%) | 0 (0.0%) |
| 6 to 11 Years | 0 (0.0%) | 0 (0.0%) |
| 12 to 14 Years | 0 (0.0%) | 0 (0.0%) |
| 15 Years | 0 (0.0%) | 0 (0.0%) |
| 16 and 17 Years | 0 (0.0%) | 0 (0.0%) |
| 18 to 24 Years | 0 (0.0%) | 0 (0.0%) |
| 25 to 34 Years | 0 (0.0%) | 0 (0.0%) |
| 35 to 44 Years | 0 (0.0%) | 0 (0.0%) |
| 45 to 54 Years | 0 (0.0%) | 0 (0.0%) |
| 55 to 64 Years | 0 (0.0%) | 0 (0.0%) |
| 65 to 74 Years | 0 (0.0%) | 0 (0.0%) |
| 75 Years and over | 0 (0.0%) | 0 (0.0%) |
| Total | 0 (0.0%) | 0 (0.0%) |
Income Above Poverty by Sex and Age in Pedro Bay
According to the poverty statistics in Pedro Bay, males aged 55 to 64 years and females aged under 5 years are the age groups that are most secure financially, with 100.0% of males and 100.0% of females in these age groups living above the poverty line.
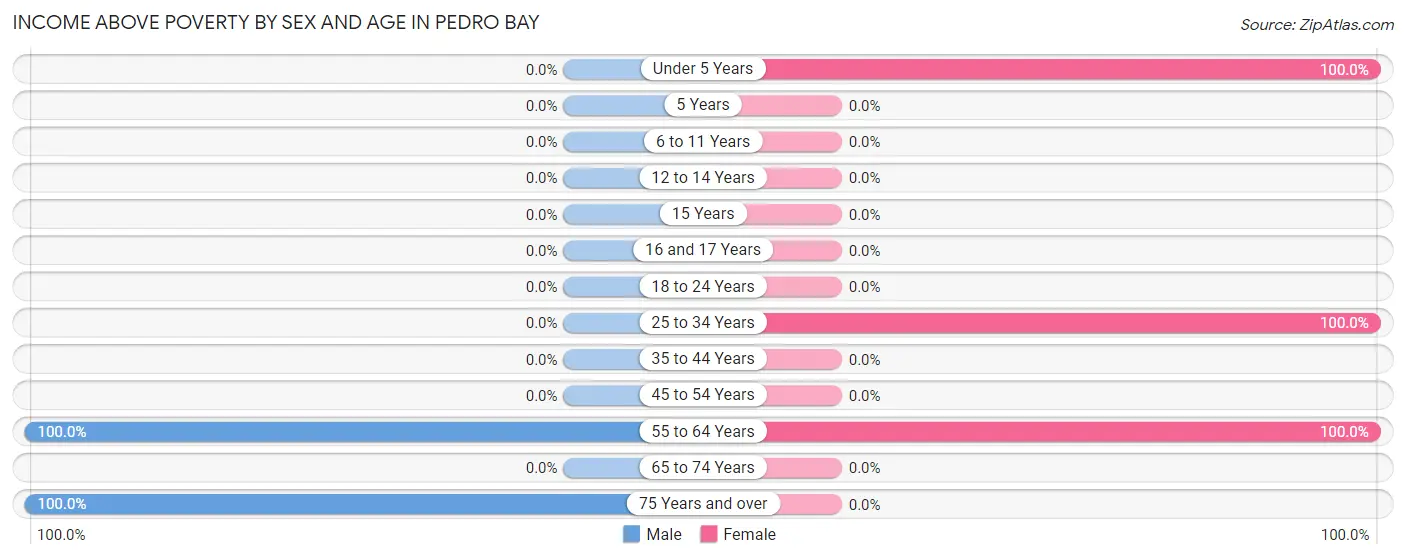
| Age Bracket | Male | Female |
| Under 5 Years | 0 (0.0%) | 2 (100.0%) |
| 5 Years | 0 (0.0%) | 0 (0.0%) |
| 6 to 11 Years | 0 (0.0%) | 0 (0.0%) |
| 12 to 14 Years | 0 (0.0%) | 0 (0.0%) |
| 15 Years | 0 (0.0%) | 0 (0.0%) |
| 16 and 17 Years | 0 (0.0%) | 0 (0.0%) |
| 18 to 24 Years | 0 (0.0%) | 0 (0.0%) |
| 25 to 34 Years | 0 (0.0%) | 1 (100.0%) |
| 35 to 44 Years | 0 (0.0%) | 0 (0.0%) |
| 45 to 54 Years | 0 (0.0%) | 0 (0.0%) |
| 55 to 64 Years | 1 (100.0%) | 7 (100.0%) |
| 65 to 74 Years | 0 (0.0%) | 0 (0.0%) |
| 75 Years and over | 2 (100.0%) | 0 (0.0%) |
| Total | 3 (100.0%) | 10 (100.0%) |
Income Below Poverty Among Married-Couple Families in Pedro Bay
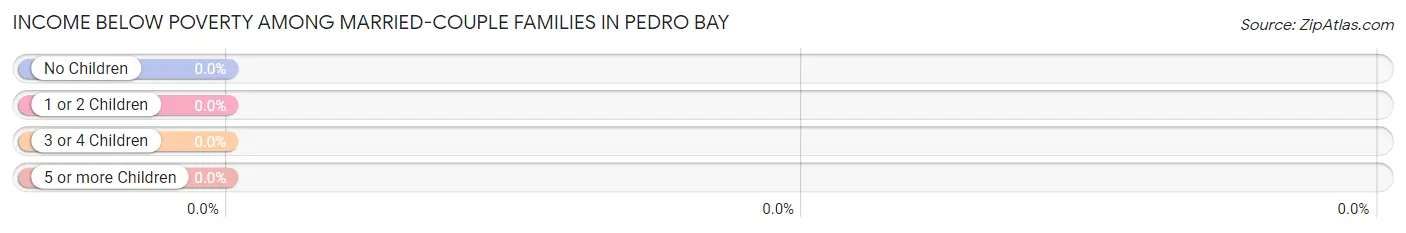
| Children | Above Poverty | Below Poverty |
| No Children | 0 (0.0%) | 0 (0.0%) |
| 1 or 2 Children | 0 (0.0%) | 0 (0.0%) |
| 3 or 4 Children | 0 (0.0%) | 0 (0.0%) |
| 5 or more Children | 0 (0.0%) | 0 (0.0%) |
| Total | 0 (0.0%) | 0 (0.0%) |
Income Below Poverty Among Single-Parent Households in Pedro Bay
| Children | Single Father | Single Mother |
| No Children | 0 (0.0%) | 0 (0.0%) |
| 1 or 2 Children | 0 (0.0%) | 0 (0.0%) |
| 3 or 4 Children | 0 (0.0%) | 0 (0.0%) |
| 5 or more Children | 0 (0.0%) | 0 (0.0%) |
| Total | 0 (0.0%) | 0 (0.0%) |
Income Below Poverty Among Married-Couple vs Single-Parent Households in Pedro Bay
| Children | Married-Couple Families | Single-Parent Households |
| No Children | 0 (0.0%) | 0 (0.0%) |
| 1 or 2 Children | 0 (0.0%) | 0 (0.0%) |
| 3 or 4 Children | 0 (0.0%) | 0 (0.0%) |
| 5 or more Children | 0 (0.0%) | 0 (0.0%) |
| Total | 0 (0.0%) | 0 (0.0%) |
Race in Pedro Bay
The most populous races in Pedro Bay are Native / Alaskan (10 | 76.9%), Two or more Races (2 | 15.4%), and White / Caucasian (1 | 7.7%).
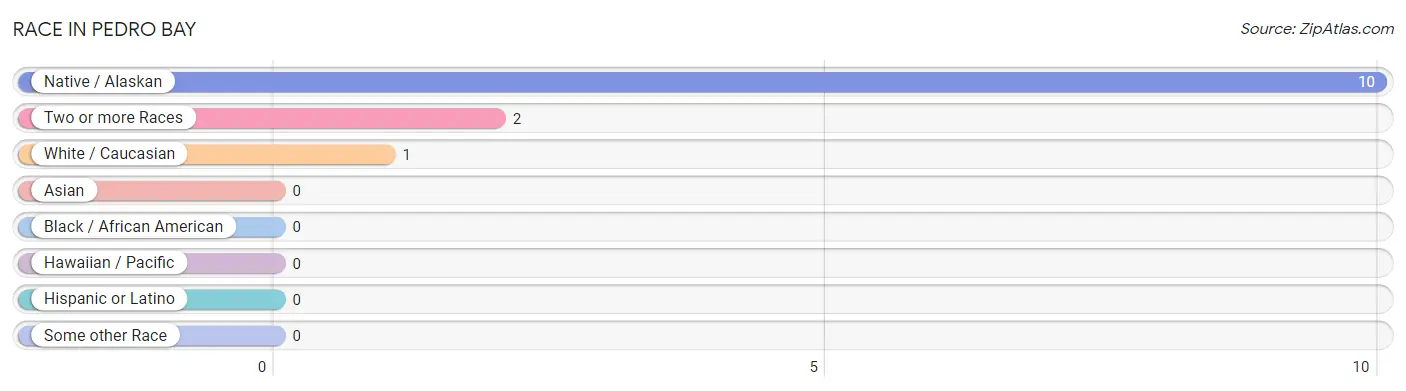
| Race | # Population | % Population |
| Asian | 0 | 0.0% |
| Black / African American | 0 | 0.0% |
| Hawaiian / Pacific | 0 | 0.0% |
| Hispanic or Latino | 0 | 0.0% |
| Native / Alaskan | 10 | 76.9% |
| White / Caucasian | 1 | 7.7% |
| Two or more Races | 2 | 15.4% |
| Some other Race | 0 | 0.0% |
| Total | 13 | 100.0% |
Ancestry in Pedro Bay
The most populous ancestries reported in Pedro Bay are Alaskan Athabascan (12 | 92.3%), Swedish (2 | 15.4%), and Scotch-Irish (1 | 7.7%), together accounting for 115.4% of all Pedro Bay residents.
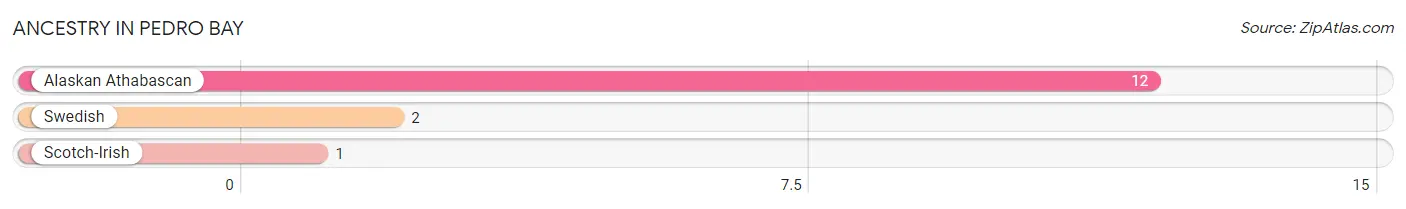
| Ancestry | # Population | % Population |
| Alaskan Athabascan | 12 | 92.3% |
| Scotch-Irish | 1 | 7.7% |
| Swedish | 2 | 15.4% | View All 3 Rows |
Immigrants in Pedro Bay

| Immigration Origin | # Population | % Population | View All 0 Rows |
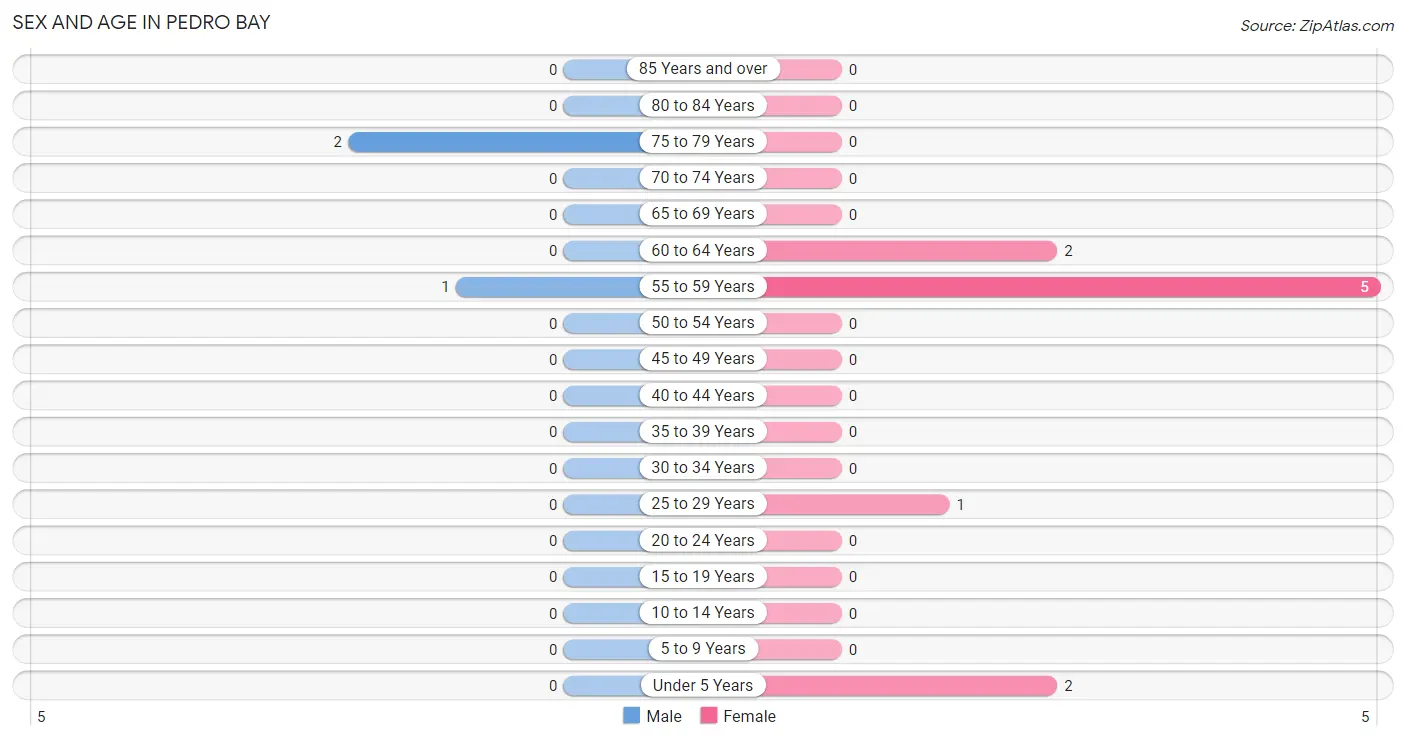
Sex and Age in Pedro Bay
Sex and Age in Pedro Bay
The most populous age groups in Pedro Bay are 75 to 79 Years (2 | 66.7%) for men and 55 to 59 Years (5 | 50.0%) for women.
| Age Bracket | Male | Female |
| Under 5 Years | 0 (0.0%) | 2 (20.0%) |
| 5 to 9 Years | 0 (0.0%) | 0 (0.0%) |
| 10 to 14 Years | 0 (0.0%) | 0 (0.0%) |
| 15 to 19 Years | 0 (0.0%) | 0 (0.0%) |
| 20 to 24 Years | 0 (0.0%) | 0 (0.0%) |
| 25 to 29 Years | 0 (0.0%) | 1 (10.0%) |
| 30 to 34 Years | 0 (0.0%) | 0 (0.0%) |
| 35 to 39 Years | 0 (0.0%) | 0 (0.0%) |
| 40 to 44 Years | 0 (0.0%) | 0 (0.0%) |
| 45 to 49 Years | 0 (0.0%) | 0 (0.0%) |
| 50 to 54 Years | 0 (0.0%) | 0 (0.0%) |
| 55 to 59 Years | 1 (33.3%) | 5 (50.0%) |
| 60 to 64 Years | 0 (0.0%) | 2 (20.0%) |
| 65 to 69 Years | 0 (0.0%) | 0 (0.0%) |
| 70 to 74 Years | 0 (0.0%) | 0 (0.0%) |
| 75 to 79 Years | 2 (66.7%) | 0 (0.0%) |
| 80 to 84 Years | 0 (0.0%) | 0 (0.0%) |
| 85 Years and over | 0 (0.0%) | 0 (0.0%) |
| Total | 3 (100.0%) | 10 (100.0%) |
Families and Households in Pedro Bay
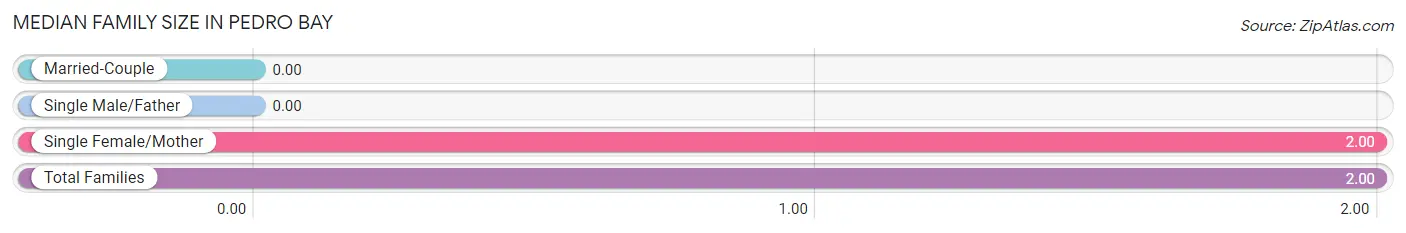
Median Family Size in Pedro Bay
| Family Type | # Families | Family Size |
| Married-Couple | 0 (0.0%) | - |
| Single Male/Father | 0 (0.0%) | - |
| Single Female/Mother | 3 (100.0%) | 2.00 |
| Total Families | 3 (100.0%) | 2.00 |
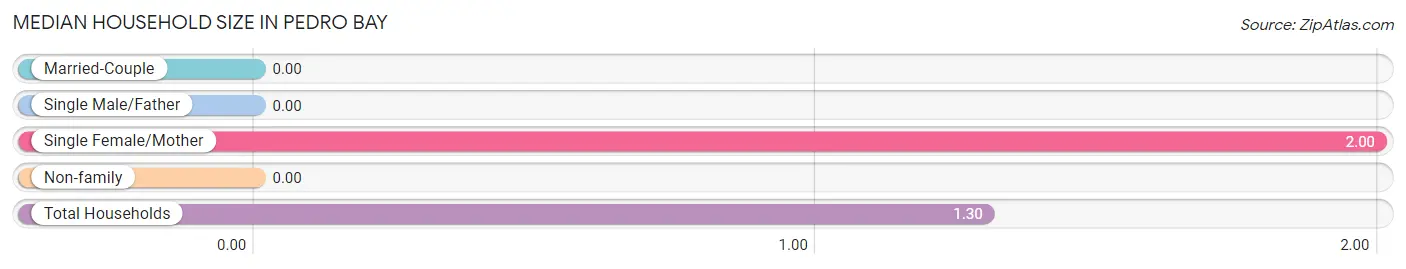
Median Household Size in Pedro Bay
| Household Type | # Households | Household Size |
| Married-Couple | 0 (0.0%) | - |
| Single Male/Father | 0 (0.0%) | - |
| Single Female/Mother | 3 (30.0%) | 2.00 |
| Non-family | 7 (70.0%) | - |
| Total Households | 10 (100.0%) | 1.30 |
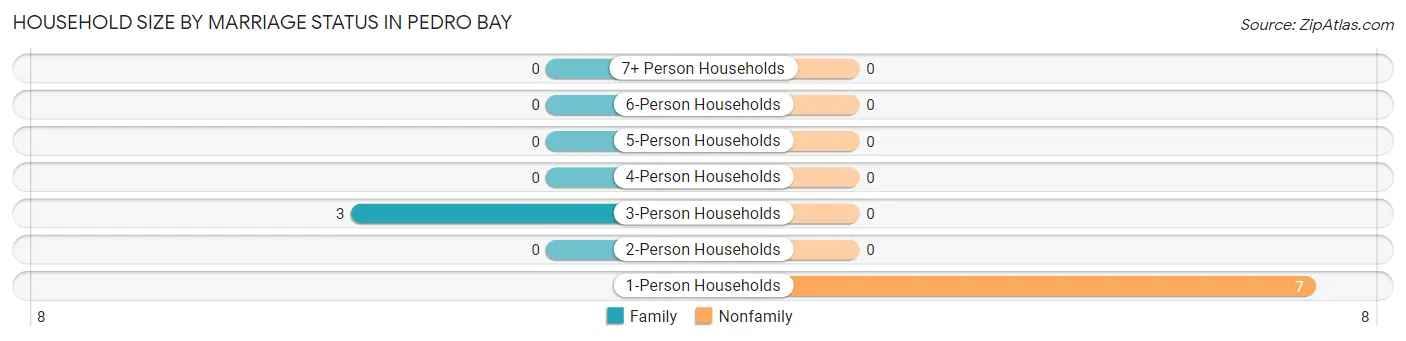
Household Size by Marriage Status in Pedro Bay
Out of a total of 10 households in Pedro Bay, 3 (30.0%) are family households, while 7 (70.0%) are nonfamily households. The most numerous type of family households are 3-person households, comprising 3, and the most common type of nonfamily households are 1-person households, comprising 7.
| Household Size | Family Households | Nonfamily Households |
| 1-Person Households | - | 7 (70.0%) |
| 2-Person Households | 0 (0.0%) | 0 (0.0%) |
| 3-Person Households | 3 (30.0%) | 0 (0.0%) |
| 4-Person Households | 0 (0.0%) | 0 (0.0%) |
| 5-Person Households | 0 (0.0%) | 0 (0.0%) |
| 6-Person Households | 0 (0.0%) | 0 (0.0%) |
| 7+ Person Households | 0 (0.0%) | 0 (0.0%) |
| Total | 3 (30.0%) | 7 (70.0%) |
Female Fertility in Pedro Bay
Fertility by Age in Pedro Bay
| Age Bracket | Women with Births | Births / 1,000 Women |
| 15 to 19 years | 0 (0.0%) | 0.0 |
| 20 to 34 years | 0 (0.0%) | 0.0 |
| 35 to 50 years | 0 (0.0%) | 0.0 |
| Total | 0 (0.0%) | 0.0 |
Fertility by Age by Marriage Status in Pedro Bay
| Age Bracket | Married | Unmarried |
| 15 to 19 years | 0 (0.0%) | 0 (0.0%) |
| 20 to 34 years | 0 (0.0%) | 0 (0.0%) |
| 35 to 50 years | 0 (0.0%) | 0 (0.0%) |
| Total | 0 (0.0%) | 0 (0.0%) |
Fertility by Education in Pedro Bay
| Educational Attainment | Women with Births | Births / 1,000 Women |
| Less than High School | 0 (0.0%) | 0.0 |
| High School Diploma | 0 (0.0%) | 0.0 |
| College or Associate's Degree | 0 (0.0%) | 0.0 |
| Bachelor's Degree | 0 (0.0%) | 0.0 |
| Graduate Degree | 0 (0.0%) | 0.0 |
| Total | 0 (0.0%) | 0.0 |
Fertility by Education by Marriage Status in Pedro Bay
| Educational Attainment | Married | Unmarried |
| Less than High School | 0 (0.0%) | 0 (0.0%) |
| High School Diploma | 0 (0.0%) | 0 (0.0%) |
| College or Associate's Degree | 0 (0.0%) | 0 (0.0%) |
| Bachelor's Degree | 0 (0.0%) | 0 (0.0%) |
| Graduate Degree | 0 (0.0%) | 0 (0.0%) |
| Total | 0 (0.0%) | 0 (0.0%) |
Employment Characteristics in Pedro Bay
Employment by Class of Employer in Pedro Bay
Among the 6 employed individuals in Pedro Bay, local government employees (5 | 83.3%), and self-employed (not incorporated) (1 | 16.7%) make up the most common classes of employment.
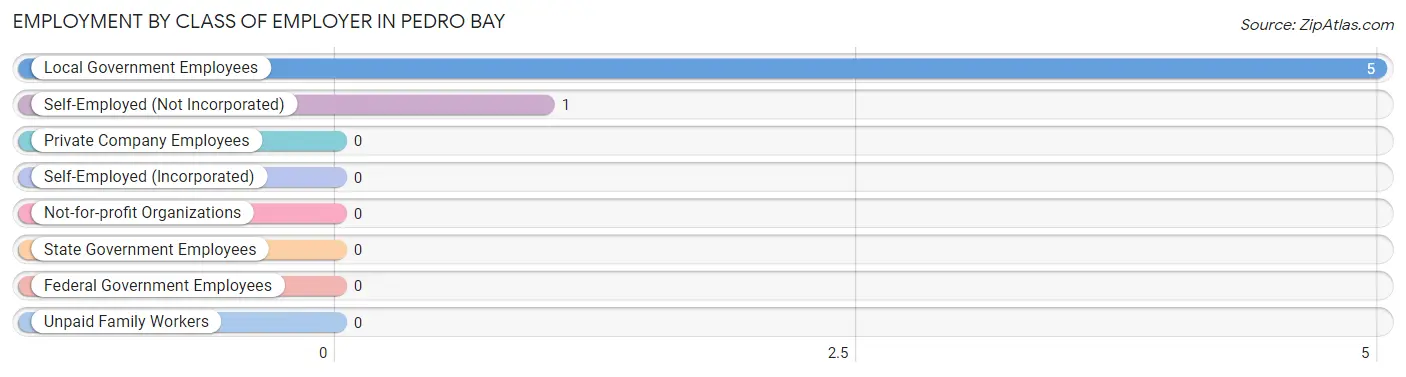
| Employer Class | # Employees | % Employees |
| Private Company Employees | 0 | 0.0% |
| Self-Employed (Incorporated) | 0 | 0.0% |
| Self-Employed (Not Incorporated) | 1 | 16.7% |
| Not-for-profit Organizations | 0 | 0.0% |
| Local Government Employees | 5 | 83.3% |
| State Government Employees | 0 | 0.0% |
| Federal Government Employees | 0 | 0.0% |
| Unpaid Family Workers | 0 | 0.0% |
| Total | 6 | 100.0% |
Employment Status by Age in Pedro Bay
According to the labor force statistics for Pedro Bay, out of the total population over 16 years of age (11), 72.7% or 8 individuals are in the labor force, with 25.0% or 2 of them unemployed. The age group with the highest labor force participation rate is 60 to 64 years, with 100.0% or 2 individuals in the labor force. Within the labor force, the 75 years and over age range has the highest percentage of unemployed individuals, with 100.0% or 2 of them being unemployed.
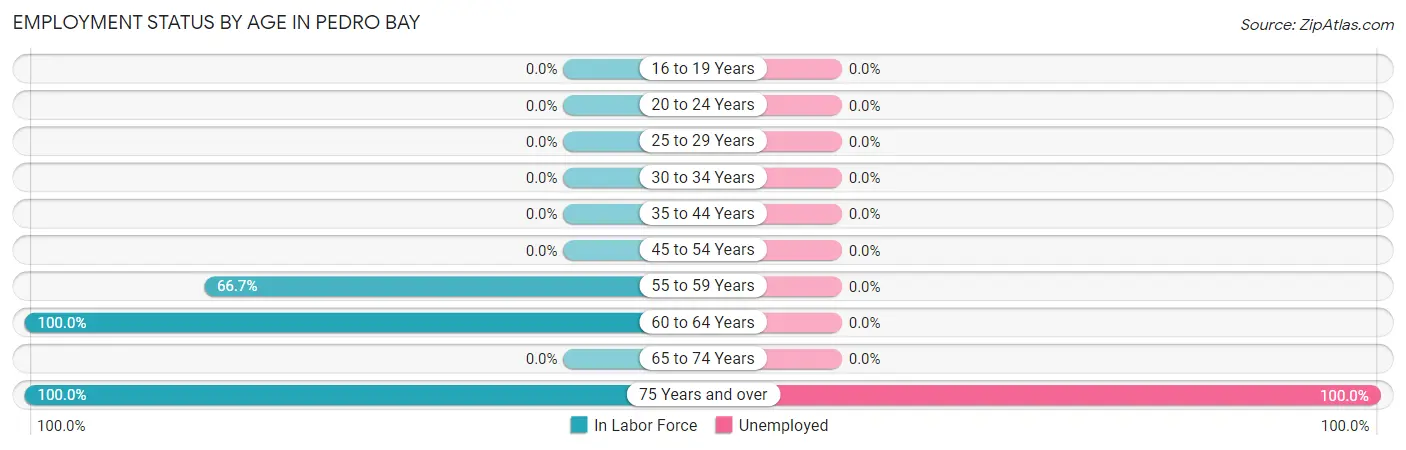
| Age Bracket | In Labor Force | Unemployed |
| 16 to 19 Years | 0 (0.0%) | 0 (0.0%) |
| 20 to 24 Years | 0 (0.0%) | 0 (0.0%) |
| 25 to 29 Years | 0 (0.0%) | 0 (0.0%) |
| 30 to 34 Years | 0 (0.0%) | 0 (0.0%) |
| 35 to 44 Years | 0 (0.0%) | 0 (0.0%) |
| 45 to 54 Years | 0 (0.0%) | 0 (0.0%) |
| 55 to 59 Years | 4 (66.7%) | 0 (0.0%) |
| 60 to 64 Years | 2 (100.0%) | 0 (0.0%) |
| 65 to 74 Years | 0 (0.0%) | 0 (0.0%) |
| 75 Years and over | 2 (100.0%) | 2 (100.0%) |
| Total | 8 (72.7%) | 2 (25.0%) |
Employment Status by Educational Attainment in Pedro Bay
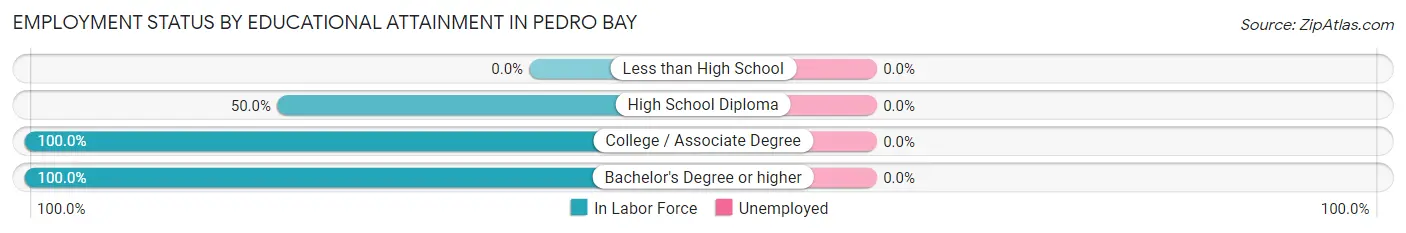
| Educational Attainment | In Labor Force | Unemployed |
| Less than High School | 0 (0.0%) | 0 (0.0%) |
| High School Diploma | 3 (50.0%) | 0 (0.0%) |
| College / Associate Degree | 2 (100.0%) | 0 (0.0%) |
| Bachelor's Degree or higher | 1 (100.0%) | 0 (0.0%) |
| Total | 6 (66.7%) | 0 (0.0%) |
Employment Occupations by Sex in Pedro Bay
Management, Business, Science and Arts Occupations
The most common Management, Business, Science and Arts occupations in Pedro Bay are , and Management (1 | 16.7%).
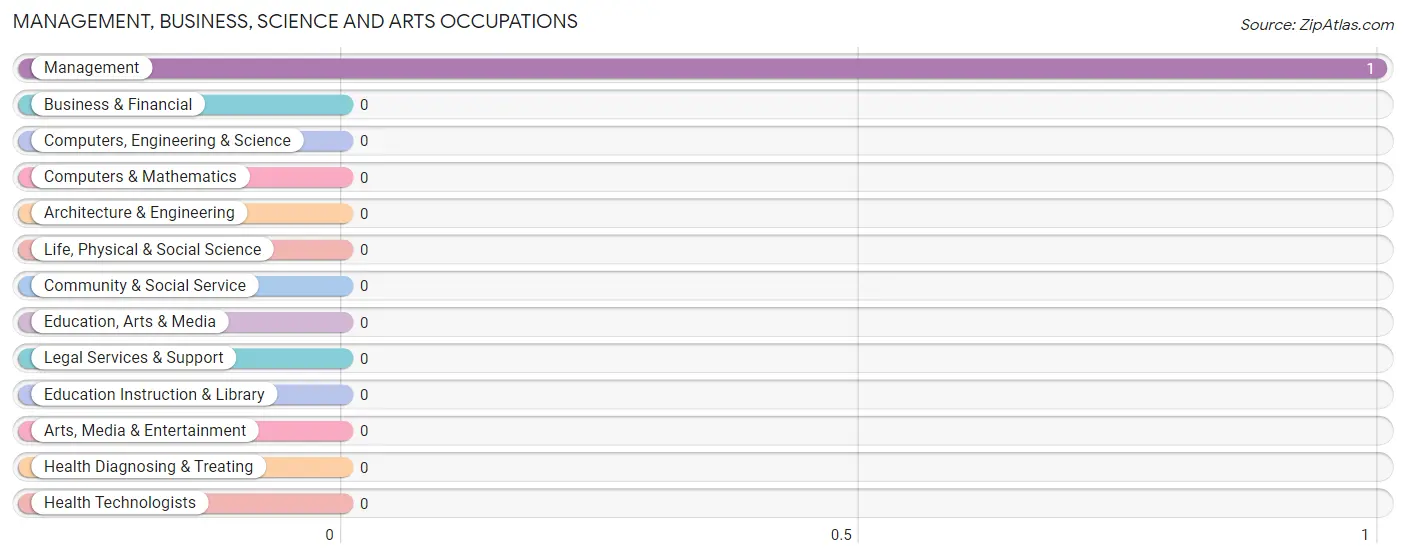
Management, Business, Science and Arts Occupations by Sex
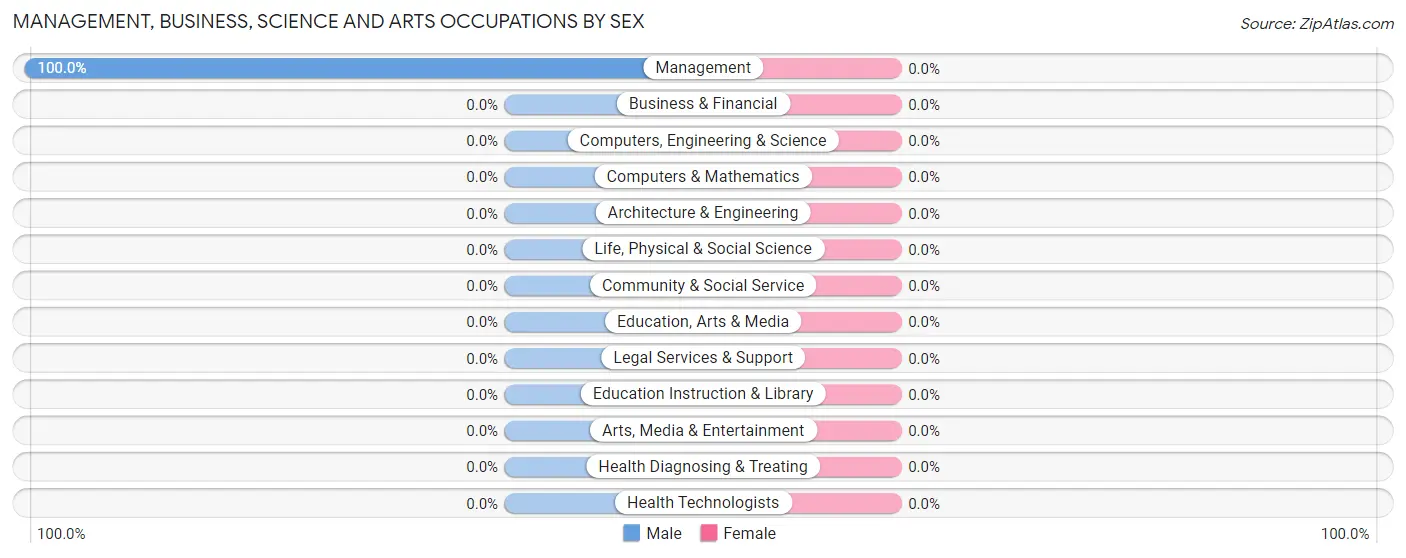
| Occupation | Male | Female |
| Management | 1 (100.0%) | 0 (0.0%) |
| Business & Financial | 0 (0.0%) | 0 (0.0%) |
| Computers, Engineering & Science | 0 (0.0%) | 0 (0.0%) |
| Computers & Mathematics | 0 (0.0%) | 0 (0.0%) |
| Architecture & Engineering | 0 (0.0%) | 0 (0.0%) |
| Life, Physical & Social Science | 0 (0.0%) | 0 (0.0%) |
| Community & Social Service | 0 (0.0%) | 0 (0.0%) |
| Education, Arts & Media | 0 (0.0%) | 0 (0.0%) |
| Legal Services & Support | 0 (0.0%) | 0 (0.0%) |
| Education Instruction & Library | 0 (0.0%) | 0 (0.0%) |
| Arts, Media & Entertainment | 0 (0.0%) | 0 (0.0%) |
| Health Diagnosing & Treating | 0 (0.0%) | 0 (0.0%) |
| Health Technologists | 0 (0.0%) | 0 (0.0%) |
| Total (Category) | 1 (100.0%) | 0 (0.0%) |
| Total (Overall) | 1 (16.7%) | 5 (83.3%) |
Services Occupations
Services Occupations by Sex
| Occupation | Male | Female |
| Healthcare Support | 0 (0.0%) | 0 (0.0%) |
| Security & Protection | 0 (0.0%) | 0 (0.0%) |
| Firefighting & Prevention | 0 (0.0%) | 0 (0.0%) |
| Law Enforcement | 0 (0.0%) | 0 (0.0%) |
| Food Preparation & Serving | 0 (0.0%) | 0 (0.0%) |
| Cleaning & Maintenance | 0 (0.0%) | 0 (0.0%) |
| Personal Care & Service | 0 (0.0%) | 0 (0.0%) |
| Total (Category) | 0 (0.0%) | 0 (0.0%) |
| Total (Overall) | 1 (16.7%) | 5 (83.3%) |
Sales and Office Occupations
The most common Sales and Office occupations in Pedro Bay are , and Office & Administration (2 | 33.3%).
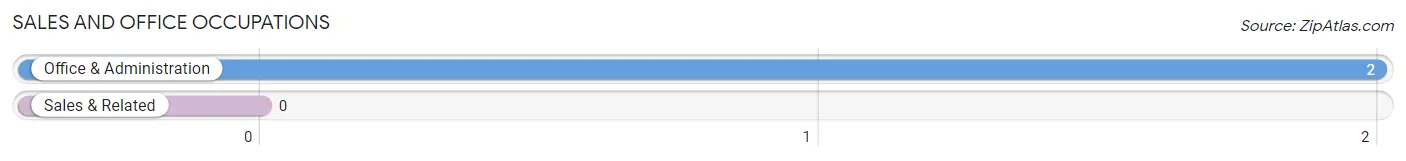
Sales and Office Occupations by Sex
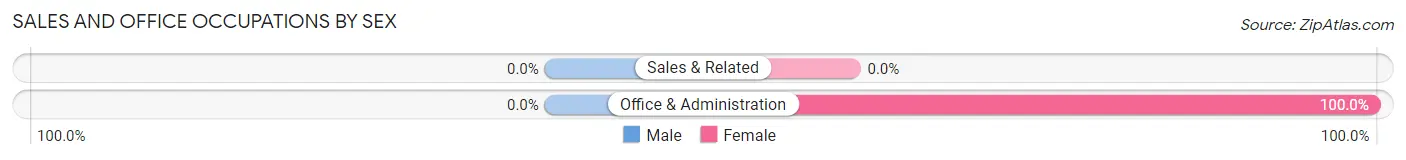
| Occupation | Male | Female |
| Sales & Related | 0 (0.0%) | 0 (0.0%) |
| Office & Administration | 0 (0.0%) | 2 (100.0%) |
| Total (Category) | 0 (0.0%) | 2 (100.0%) |
| Total (Overall) | 1 (16.7%) | 5 (83.3%) |
Natural Resources, Construction and Maintenance Occupations
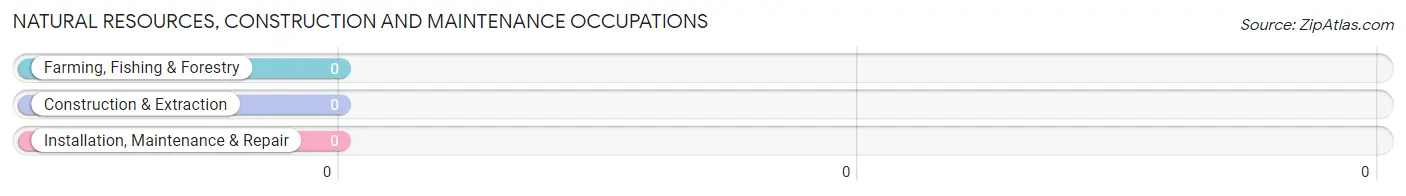
Natural Resources, Construction and Maintenance Occupations by Sex
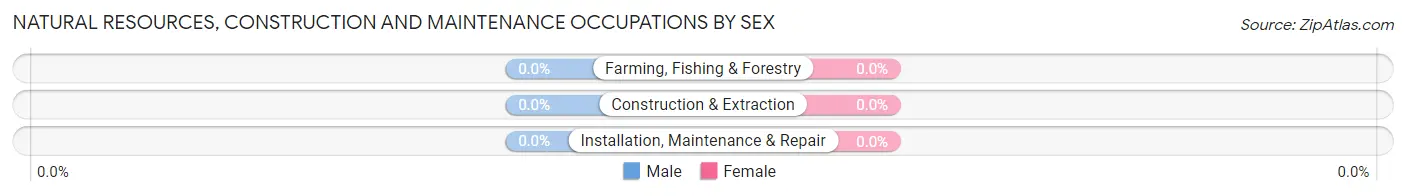
| Occupation | Male | Female |
| Farming, Fishing & Forestry | 0 (0.0%) | 0 (0.0%) |
| Construction & Extraction | 0 (0.0%) | 0 (0.0%) |
| Installation, Maintenance & Repair | 0 (0.0%) | 0 (0.0%) |
| Total (Category) | 0 (0.0%) | 0 (0.0%) |
| Total (Overall) | 1 (16.7%) | 5 (83.3%) |
Production, Transportation and Moving Occupations
The most common Production, Transportation and Moving occupations in Pedro Bay are , and Material Moving (3 | 50.0%).
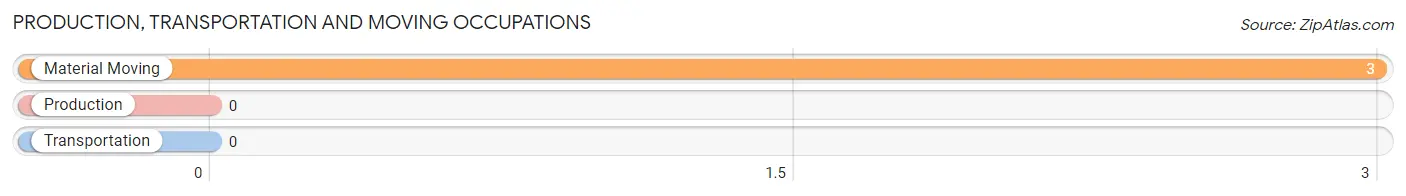
Production, Transportation and Moving Occupations by Sex
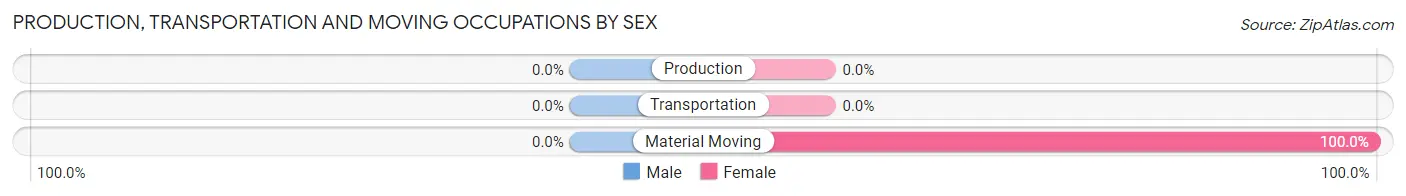
| Occupation | Male | Female |
| Production | 0 (0.0%) | 0 (0.0%) |
| Transportation | 0 (0.0%) | 0 (0.0%) |
| Material Moving | 0 (0.0%) | 3 (100.0%) |
| Total (Category) | 0 (0.0%) | 3 (100.0%) |
| Total (Overall) | 1 (16.7%) | 5 (83.3%) |
Employment Industries by Sex in Pedro Bay
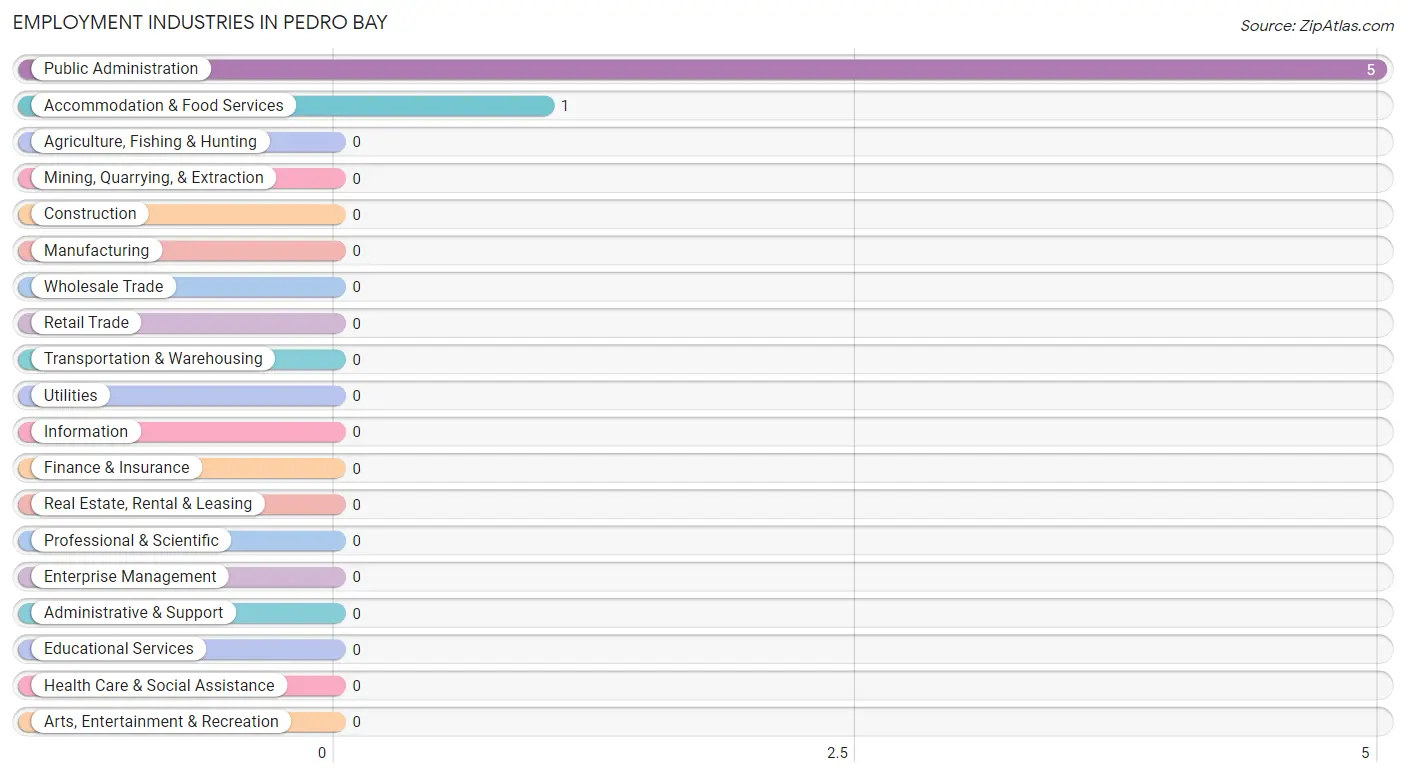
Employment Industries in Pedro Bay
The major employment industries in Pedro Bay include Public Administration (5 | 83.3%), and Accommodation & Food Services (1 | 16.7%).
Employment Industries by Sex in Pedro Bay
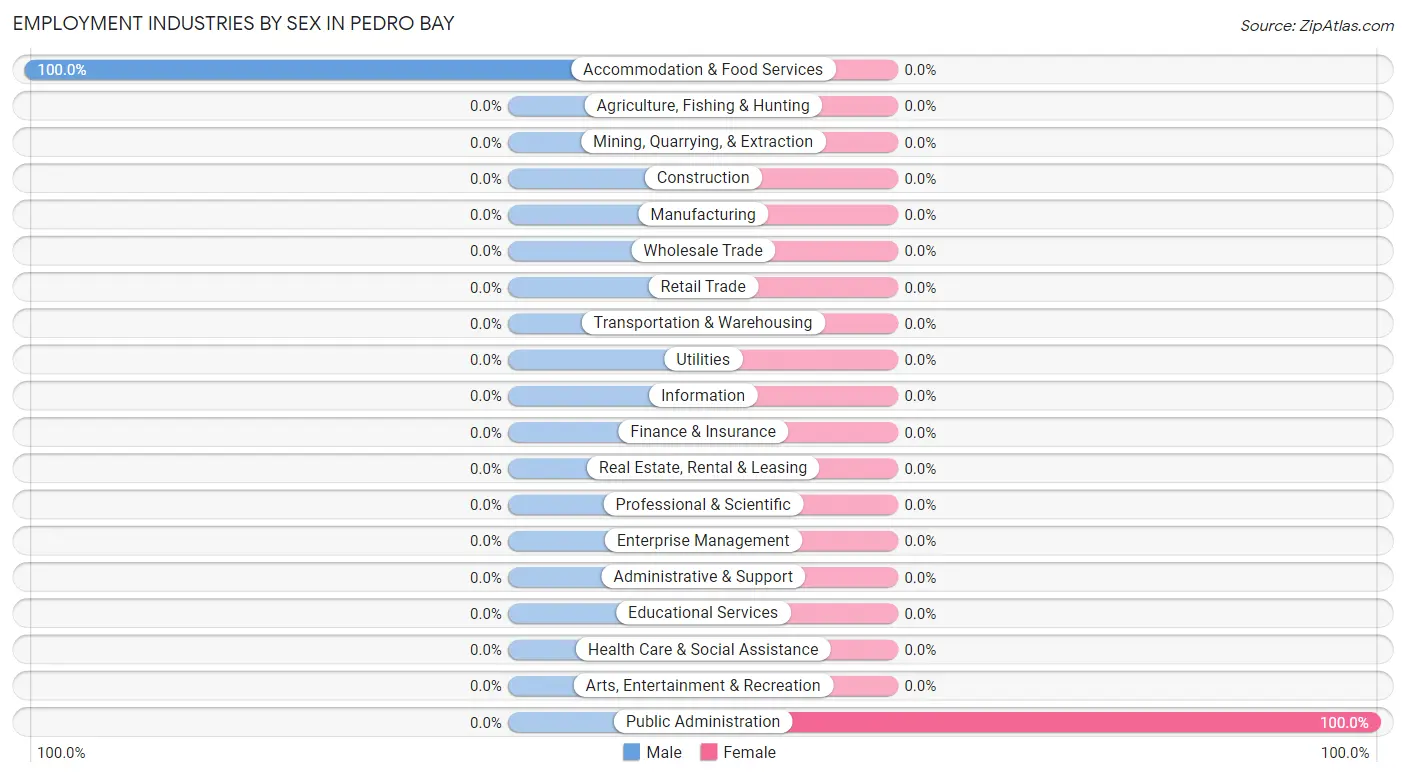
| Industry | Male | Female |
| Agriculture, Fishing & Hunting | 0 (0.0%) | 0 (0.0%) |
| Mining, Quarrying, & Extraction | 0 (0.0%) | 0 (0.0%) |
| Construction | 0 (0.0%) | 0 (0.0%) |
| Manufacturing | 0 (0.0%) | 0 (0.0%) |
| Wholesale Trade | 0 (0.0%) | 0 (0.0%) |
| Retail Trade | 0 (0.0%) | 0 (0.0%) |
| Transportation & Warehousing | 0 (0.0%) | 0 (0.0%) |
| Utilities | 0 (0.0%) | 0 (0.0%) |
| Information | 0 (0.0%) | 0 (0.0%) |
| Finance & Insurance | 0 (0.0%) | 0 (0.0%) |
| Real Estate, Rental & Leasing | 0 (0.0%) | 0 (0.0%) |
| Professional & Scientific | 0 (0.0%) | 0 (0.0%) |
| Enterprise Management | 0 (0.0%) | 0 (0.0%) |
| Administrative & Support | 0 (0.0%) | 0 (0.0%) |
| Educational Services | 0 (0.0%) | 0 (0.0%) |
| Health Care & Social Assistance | 0 (0.0%) | 0 (0.0%) |
| Arts, Entertainment & Recreation | 0 (0.0%) | 0 (0.0%) |
| Accommodation & Food Services | 1 (100.0%) | 0 (0.0%) |
| Public Administration | 0 (0.0%) | 5 (100.0%) |
| Total | 1 (16.7%) | 5 (83.3%) |
Education in Pedro Bay
School Enrollment in Pedro Bay
| School Level | # Students | % Students |
| Nursery / Preschool | 0 | 0.0% |
| Kindergarten | 0 | 0.0% |
| Elementary School | 0 | 0.0% |
| Middle School | 0 | 0.0% |
| High School | 0 | 0.0% |
| College / Undergraduate | 0 | 0.0% |
| Graduate / Professional | 0 | 0.0% |
| Total | 0 | 0.0% |
School Enrollment by Age by Funding Source in Pedro Bay
| Age Bracket | Public School | Private School |
| 3 to 4 Year Olds | 0 (0.0%) | 0 (0.0%) |
| 5 to 9 Year Old | 0 (0.0%) | 0 (0.0%) |
| 10 to 14 Year Olds | 0 (0.0%) | 0 (0.0%) |
| 15 to 17 Year Olds | 0 (0.0%) | 0 (0.0%) |
| 18 to 19 Year Olds | 0 (0.0%) | 0 (0.0%) |
| 20 to 24 Year Olds | 0 (0.0%) | 0 (0.0%) |
| 25 to 34 Year Olds | 0 (0.0%) | 0 (0.0%) |
| 35 Years and over | 0 (0.0%) | 0 (0.0%) |
| Total | 0 (0.0%) | 0 (0.0%) |
Educational Attainment by Field of Study in Pedro Bay
, and social sciences (1 | 100.0%) are the most common fields of study among 1 individuals in Pedro Bay who have obtained a bachelor's degree or higher.
| Field of Study | # Graduates | % Graduates |
| Computers & Mathematics | 0 | 0.0% |
| Bio, Nature & Agricultural | 0 | 0.0% |
| Physical & Health Sciences | 0 | 0.0% |
| Psychology | 0 | 0.0% |
| Social Sciences | 1 | 100.0% |
| Engineering | 0 | 0.0% |
| Multidisciplinary Studies | 0 | 0.0% |
| Science & Technology | 0 | 0.0% |
| Business | 0 | 0.0% |
| Education | 0 | 0.0% |
| Literature & Languages | 0 | 0.0% |
| Liberal Arts & History | 0 | 0.0% |
| Visual & Performing Arts | 0 | 0.0% |
| Communications | 0 | 0.0% |
| Arts & Humanities | 0 | 0.0% |
| Total | 1 | 100.0% |
Transportation & Commute in Pedro Bay
Vehicle Availability by Sex in Pedro Bay
The most prevalent vehicle ownership categories in Pedro Bay are males with no vehicle (1, accounting for 100.0%) and females with no vehicle (0, making up 20.0%).
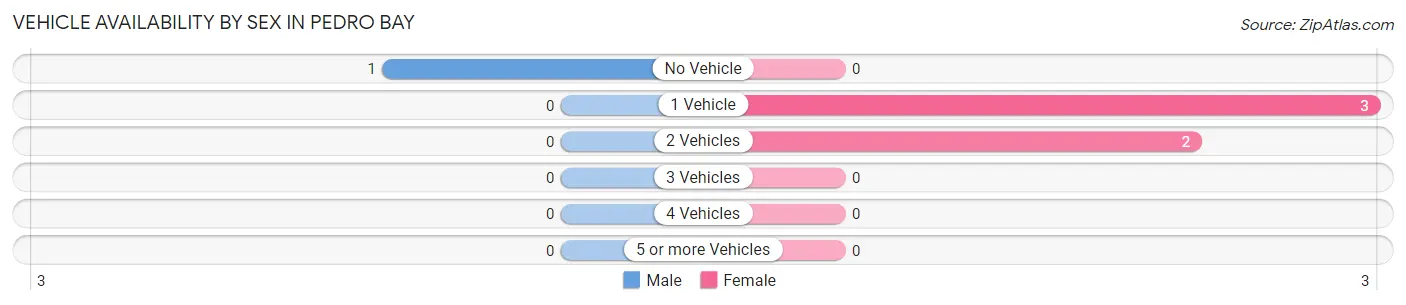
| Vehicles Available | Male | Female |
| No Vehicle | 1 (100.0%) | 0 (0.0%) |
| 1 Vehicle | 0 (0.0%) | 3 (60.0%) |
| 2 Vehicles | 0 (0.0%) | 2 (40.0%) |
| 3 Vehicles | 0 (0.0%) | 0 (0.0%) |
| 4 Vehicles | 0 (0.0%) | 0 (0.0%) |
| 5 or more Vehicles | 0 (0.0%) | 0 (0.0%) |
| Total | 1 (100.0%) | 5 (100.0%) |
Commute Time in Pedro Bay
The most frequently occuring commute durations in Pedro Bay are 5 to 9 minutes (3 commuters, 60.0%), 25 to 29 minutes (2 commuters, 40.0%), and less than 5 minutes (0 commuters, 0.0%).
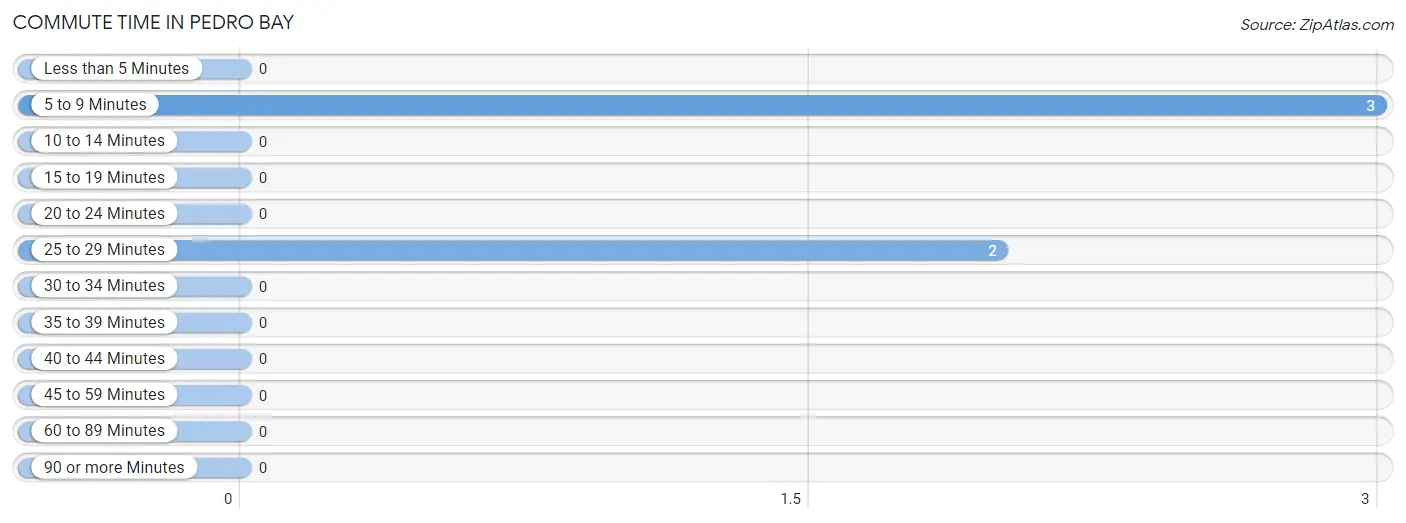
| Commute Time | # Commuters | % Commuters |
| Less than 5 Minutes | 0 | 0.0% |
| 5 to 9 Minutes | 3 | 60.0% |
| 10 to 14 Minutes | 0 | 0.0% |
| 15 to 19 Minutes | 0 | 0.0% |
| 20 to 24 Minutes | 0 | 0.0% |
| 25 to 29 Minutes | 2 | 40.0% |
| 30 to 34 Minutes | 0 | 0.0% |
| 35 to 39 Minutes | 0 | 0.0% |
| 40 to 44 Minutes | 0 | 0.0% |
| 45 to 59 Minutes | 0 | 0.0% |
| 60 to 89 Minutes | 0 | 0.0% |
| 90 or more Minutes | 0 | 0.0% |
Commute Time by Sex in Pedro Bay
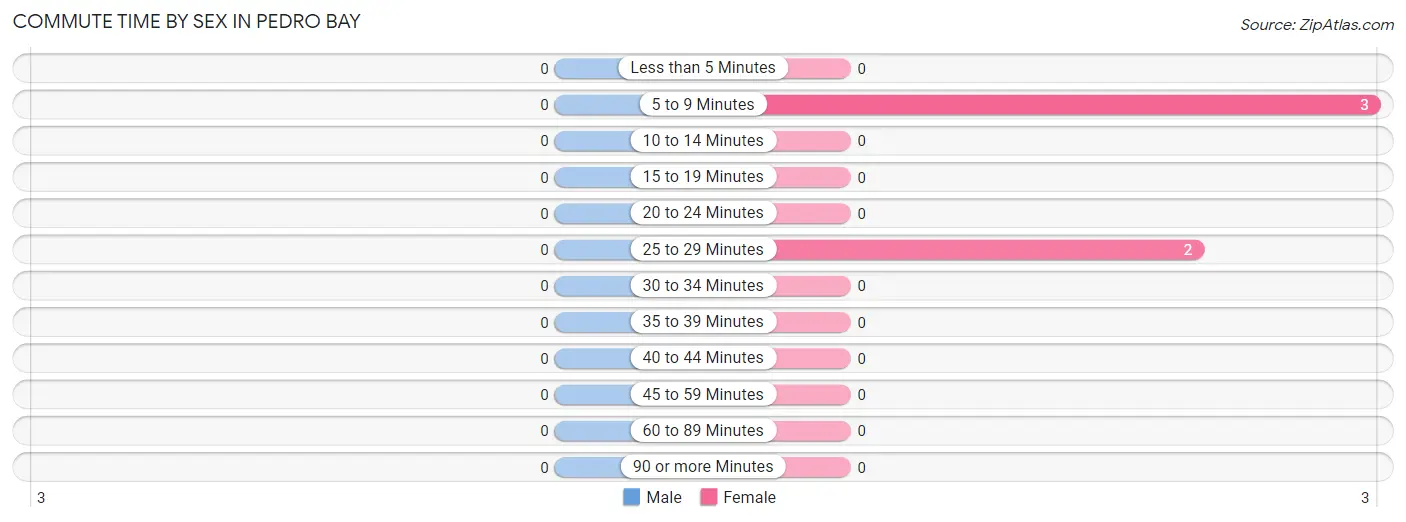
| Commute Time | Male | Female |
| Less than 5 Minutes | 0 (0.0%) | 0 (0.0%) |
| 5 to 9 Minutes | 0 (0.0%) | 3 (60.0%) |
| 10 to 14 Minutes | 0 (0.0%) | 0 (0.0%) |
| 15 to 19 Minutes | 0 (0.0%) | 0 (0.0%) |
| 20 to 24 Minutes | 0 (0.0%) | 0 (0.0%) |
| 25 to 29 Minutes | 0 (0.0%) | 2 (40.0%) |
| 30 to 34 Minutes | 0 (0.0%) | 0 (0.0%) |
| 35 to 39 Minutes | 0 (0.0%) | 0 (0.0%) |
| 40 to 44 Minutes | 0 (0.0%) | 0 (0.0%) |
| 45 to 59 Minutes | 0 (0.0%) | 0 (0.0%) |
| 60 to 89 Minutes | 0 (0.0%) | 0 (0.0%) |
| 90 or more Minutes | 0 (0.0%) | 0 (0.0%) |
Time of Departure to Work by Sex in Pedro Bay
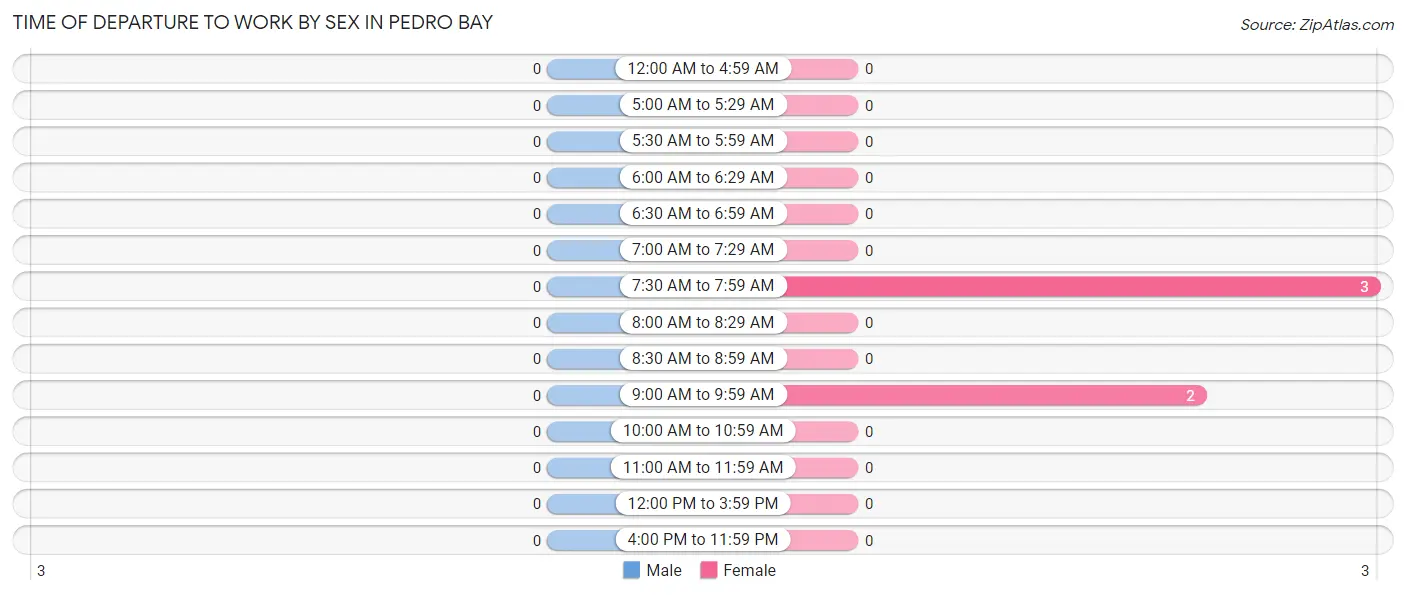
| Time of Departure | Male | Female |
| 12:00 AM to 4:59 AM | 0 (0.0%) | 0 (0.0%) |
| 5:00 AM to 5:29 AM | 0 (0.0%) | 0 (0.0%) |
| 5:30 AM to 5:59 AM | 0 (0.0%) | 0 (0.0%) |
| 6:00 AM to 6:29 AM | 0 (0.0%) | 0 (0.0%) |
| 6:30 AM to 6:59 AM | 0 (0.0%) | 0 (0.0%) |
| 7:00 AM to 7:29 AM | 0 (0.0%) | 0 (0.0%) |
| 7:30 AM to 7:59 AM | 0 (0.0%) | 3 (60.0%) |
| 8:00 AM to 8:29 AM | 0 (0.0%) | 0 (0.0%) |
| 8:30 AM to 8:59 AM | 0 (0.0%) | 0 (0.0%) |
| 9:00 AM to 9:59 AM | 0 (0.0%) | 2 (40.0%) |
| 10:00 AM to 10:59 AM | 0 (0.0%) | 0 (0.0%) |
| 11:00 AM to 11:59 AM | 0 (0.0%) | 0 (0.0%) |
| 12:00 PM to 3:59 PM | 0 (0.0%) | 0 (0.0%) |
| 4:00 PM to 11:59 PM | 0 (0.0%) | 0 (0.0%) |
| Total | 0 (0.0%) | 5 (100.0%) |
Housing Occupancy in Pedro Bay
Occupancy by Ownership in Pedro Bay
Of the total 10 dwellings in Pedro Bay, owner-occupied units account for 10 (100.0%), while renter-occupied units make up 0 (0.0%).
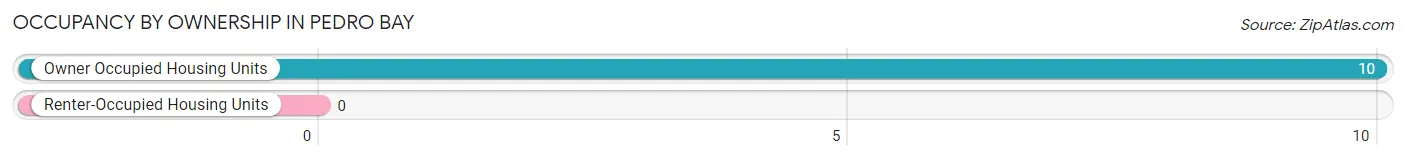
| Occupancy | # Housing Units | % Housing Units |
| Owner Occupied Housing Units | 10 | 100.0% |
| Renter-Occupied Housing Units | 0 | 0.0% |
| Total Occupied Housing Units | 10 | 100.0% |
Occupancy by Household Size in Pedro Bay
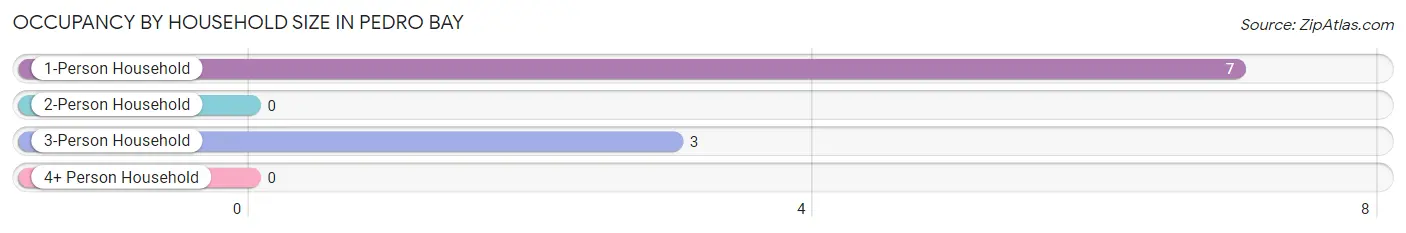
| Household Size | # Housing Units | % Housing Units |
| 1-Person Household | 7 | 70.0% |
| 2-Person Household | 0 | 0.0% |
| 3-Person Household | 3 | 30.0% |
| 4+ Person Household | 0 | 0.0% |
| Total Housing Units | 10 | 100.0% |
Occupancy by Ownership by Household Size in Pedro Bay
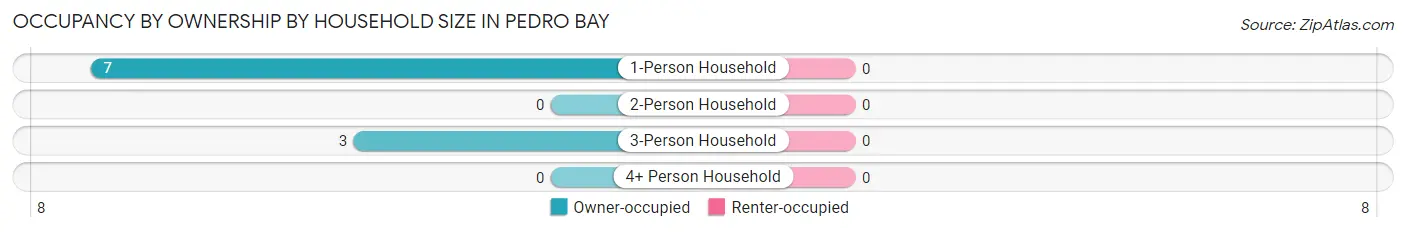
| Household Size | Owner-occupied | Renter-occupied |
| 1-Person Household | 7 (100.0%) | 0 (0.0%) |
| 2-Person Household | 0 (0.0%) | 0 (0.0%) |
| 3-Person Household | 3 (100.0%) | 0 (0.0%) |
| 4+ Person Household | 0 (0.0%) | 0 (0.0%) |
| Total Housing Units | 10 (100.0%) | 0 (0.0%) |
Occupancy by Educational Attainment in Pedro Bay
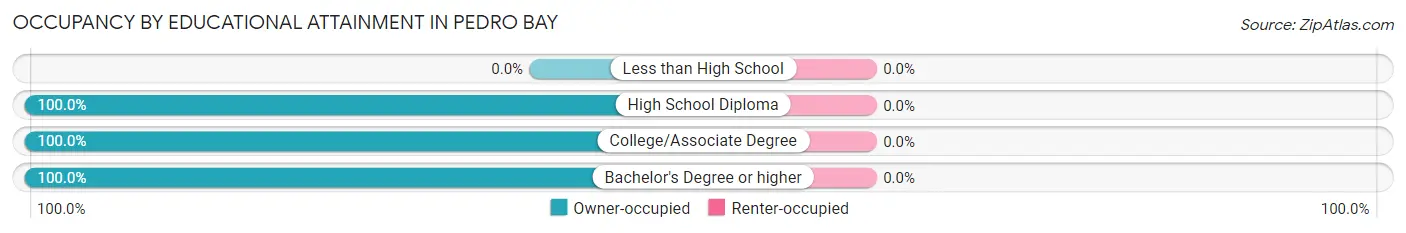
| Household Size | Owner-occupied | Renter-occupied |
| Less than High School | 0 (0.0%) | 0 (0.0%) |
| High School Diploma | 7 (100.0%) | 0 (0.0%) |
| College/Associate Degree | 2 (100.0%) | 0 (0.0%) |
| Bachelor's Degree or higher | 1 (100.0%) | 0 (0.0%) |
Occupancy by Age of Householder in Pedro Bay
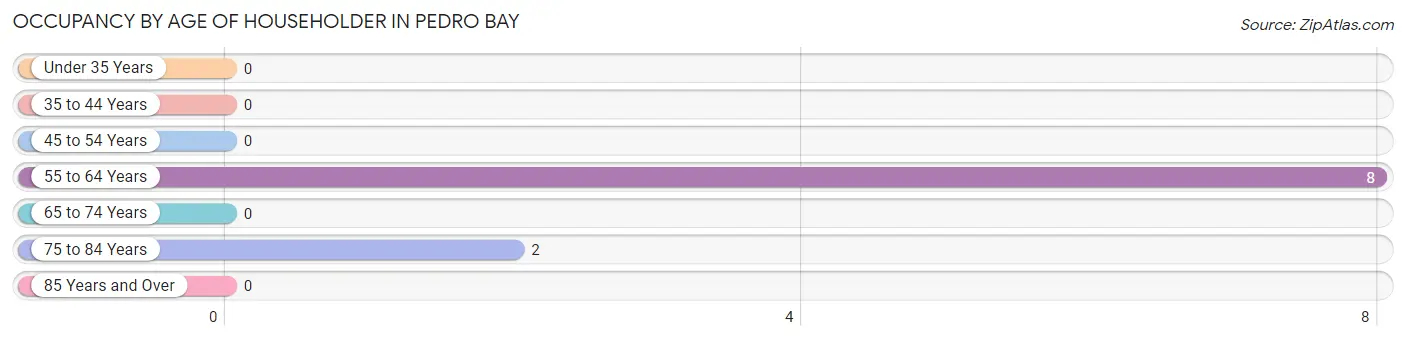
| Age Bracket | # Households | % Households |
| Under 35 Years | 0 | 0.0% |
| 35 to 44 Years | 0 | 0.0% |
| 45 to 54 Years | 0 | 0.0% |
| 55 to 64 Years | 8 | 80.0% |
| 65 to 74 Years | 0 | 0.0% |
| 75 to 84 Years | 2 | 20.0% |
| 85 Years and Over | 0 | 0.0% |
| Total | 10 | 100.0% |
Housing Finances in Pedro Bay
Median Income by Occupancy in Pedro Bay
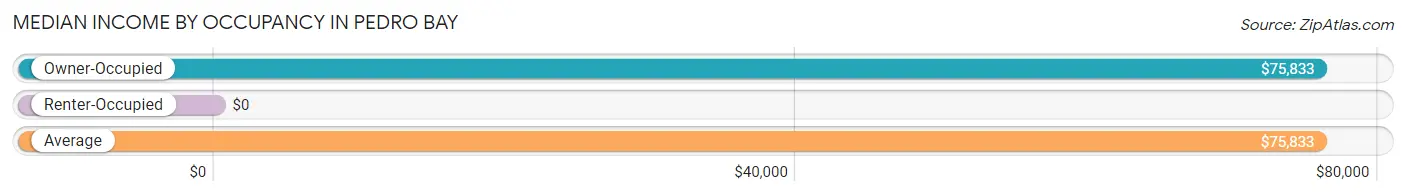
| Occupancy Type | # Households | Median Income |
| Owner-Occupied | 10 (100.0%) | $75,833 |
| Renter-Occupied | 0 (0.0%) | $0 |
| Average | 10 (100.0%) | $75,833 |
Occupancy by Householder Income Bracket in Pedro Bay
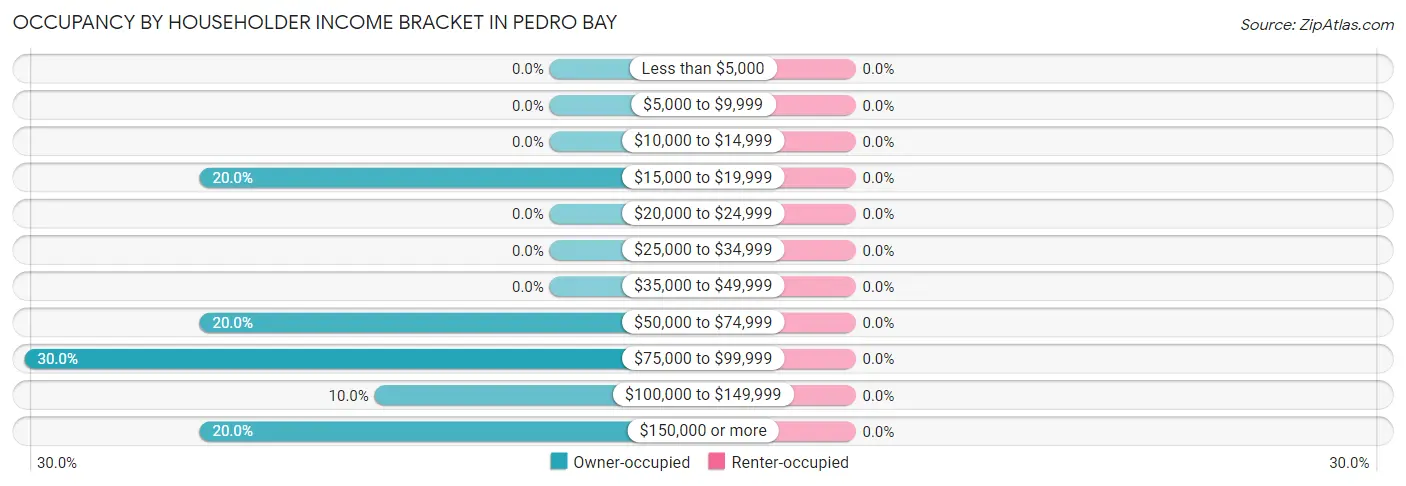
| Income Bracket | Owner-occupied | Renter-occupied |
| Less than $5,000 | 0 (0.0%) | 0 (0.0%) |
| $5,000 to $9,999 | 0 (0.0%) | 0 (0.0%) |
| $10,000 to $14,999 | 0 (0.0%) | 0 (0.0%) |
| $15,000 to $19,999 | 2 (20.0%) | 0 (0.0%) |
| $20,000 to $24,999 | 0 (0.0%) | 0 (0.0%) |
| $25,000 to $34,999 | 0 (0.0%) | 0 (0.0%) |
| $35,000 to $49,999 | 0 (0.0%) | 0 (0.0%) |
| $50,000 to $74,999 | 2 (20.0%) | 0 (0.0%) |
| $75,000 to $99,999 | 3 (30.0%) | 0 (0.0%) |
| $100,000 to $149,999 | 1 (10.0%) | 0 (0.0%) |
| $150,000 or more | 2 (20.0%) | 0 (0.0%) |
| Total | 10 (100.0%) | 0 (0.0%) |
Monthly Housing Cost Tiers in Pedro Bay
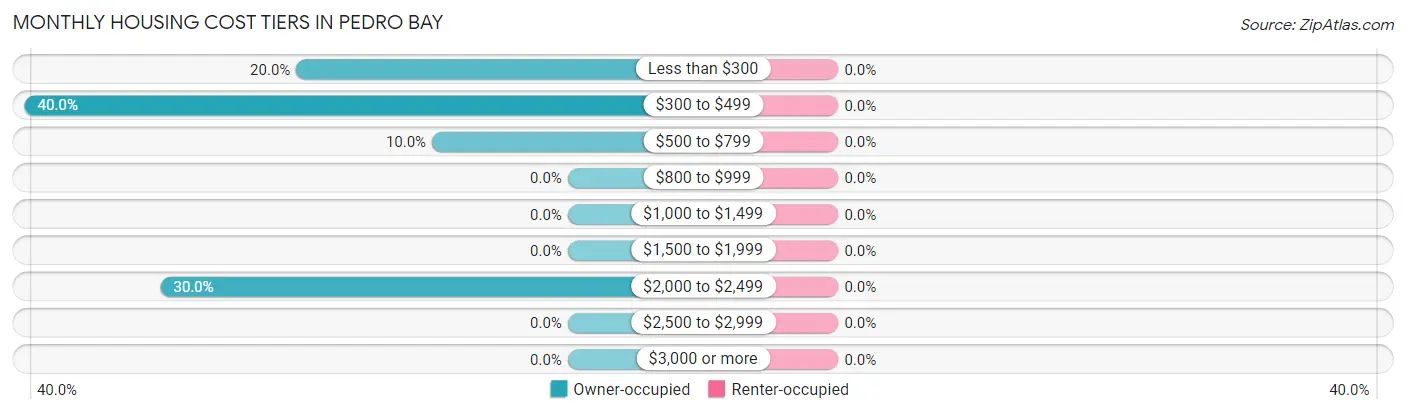
| Monthly Cost | Owner-occupied | Renter-occupied |
| Less than $300 | 2 (20.0%) | 0 (0.0%) |
| $300 to $499 | 4 (40.0%) | 0 (0.0%) |
| $500 to $799 | 1 (10.0%) | 0 (0.0%) |
| $800 to $999 | 0 (0.0%) | 0 (0.0%) |
| $1,000 to $1,499 | 0 (0.0%) | 0 (0.0%) |
| $1,500 to $1,999 | 0 (0.0%) | 0 (0.0%) |
| $2,000 to $2,499 | 3 (30.0%) | 0 (0.0%) |
| $2,500 to $2,999 | 0 (0.0%) | 0 (0.0%) |
| $3,000 or more | 0 (0.0%) | 0 (0.0%) |
| Total | 10 (100.0%) | 0 (0.0%) |
Physical Housing Characteristics in Pedro Bay
Housing Structures in Pedro Bay
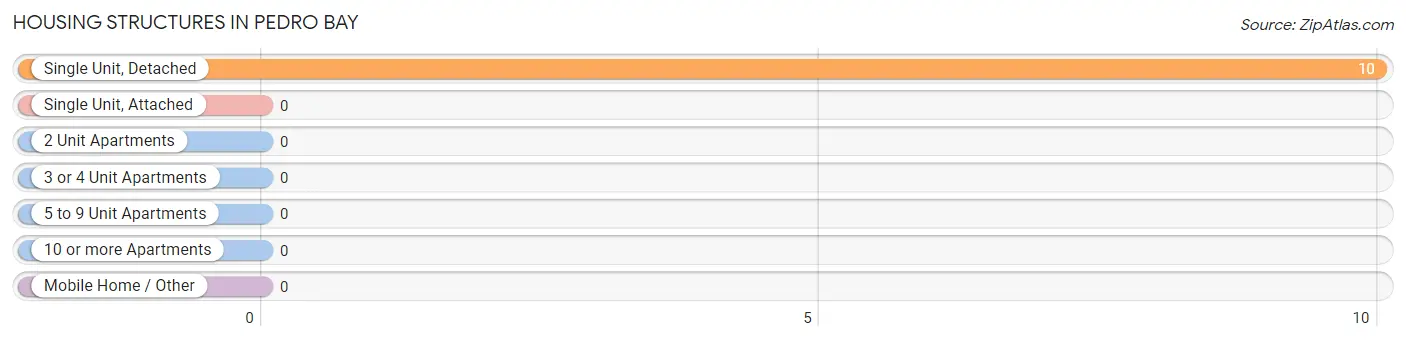
| Structure Type | # Housing Units | % Housing Units |
| Single Unit, Detached | 10 | 100.0% |
| Single Unit, Attached | 0 | 0.0% |
| 2 Unit Apartments | 0 | 0.0% |
| 3 or 4 Unit Apartments | 0 | 0.0% |
| 5 to 9 Unit Apartments | 0 | 0.0% |
| 10 or more Apartments | 0 | 0.0% |
| Mobile Home / Other | 0 | 0.0% |
| Total | 10 | 100.0% |
Housing Structures by Occupancy in Pedro Bay
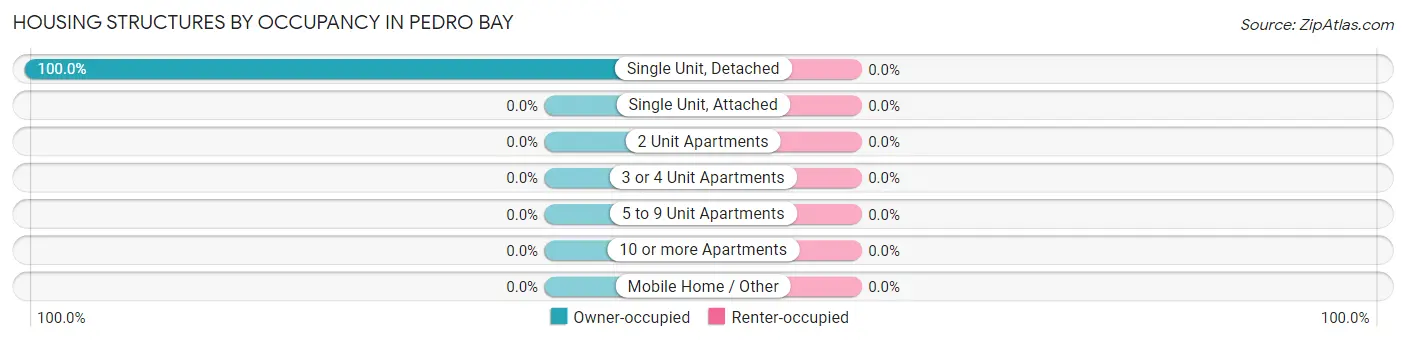
| Structure Type | Owner-occupied | Renter-occupied |
| Single Unit, Detached | 10 (100.0%) | 0 (0.0%) |
| Single Unit, Attached | 0 (0.0%) | 0 (0.0%) |
| 2 Unit Apartments | 0 (0.0%) | 0 (0.0%) |
| 3 or 4 Unit Apartments | 0 (0.0%) | 0 (0.0%) |
| 5 to 9 Unit Apartments | 0 (0.0%) | 0 (0.0%) |
| 10 or more Apartments | 0 (0.0%) | 0 (0.0%) |
| Mobile Home / Other | 0 (0.0%) | 0 (0.0%) |
| Total | 10 (100.0%) | 0 (0.0%) |
Housing Structures by Number of Rooms in Pedro Bay
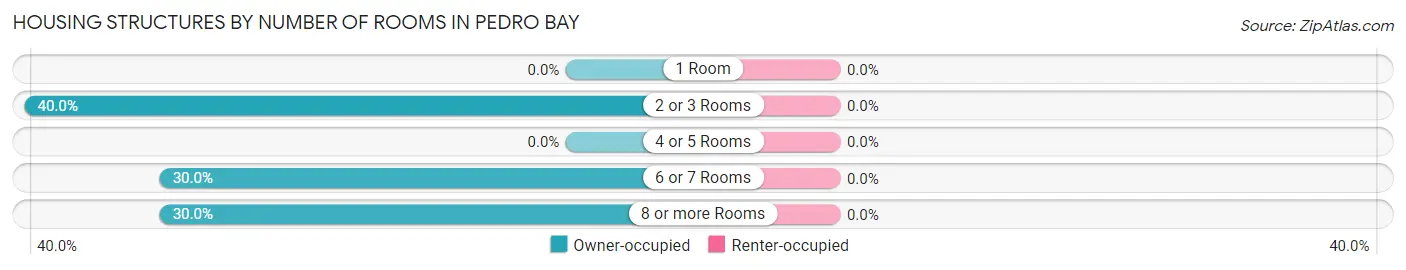
| Number of Rooms | Owner-occupied | Renter-occupied |
| 1 Room | 0 (0.0%) | 0 (0.0%) |
| 2 or 3 Rooms | 4 (40.0%) | 0 (0.0%) |
| 4 or 5 Rooms | 0 (0.0%) | 0 (0.0%) |
| 6 or 7 Rooms | 3 (30.0%) | 0 (0.0%) |
| 8 or more Rooms | 3 (30.0%) | 0 (0.0%) |
| Total | 10 (100.0%) | 0 (0.0%) |
Housing Structure by Heating Type in Pedro Bay
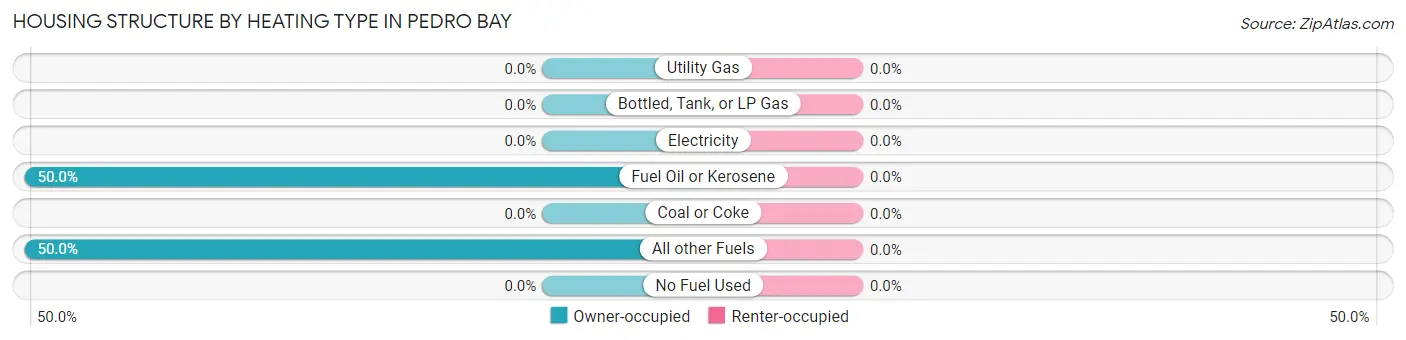
| Heating Type | Owner-occupied | Renter-occupied |
| Utility Gas | 0 (0.0%) | 0 (0.0%) |
| Bottled, Tank, or LP Gas | 0 (0.0%) | 0 (0.0%) |
| Electricity | 0 (0.0%) | 0 (0.0%) |
| Fuel Oil or Kerosene | 5 (50.0%) | 0 (0.0%) |
| Coal or Coke | 0 (0.0%) | 0 (0.0%) |
| All other Fuels | 5 (50.0%) | 0 (0.0%) |
| No Fuel Used | 0 (0.0%) | 0 (0.0%) |
| Total | 10 (100.0%) | 0 (0.0%) |
Household Vehicle Usage in Pedro Bay
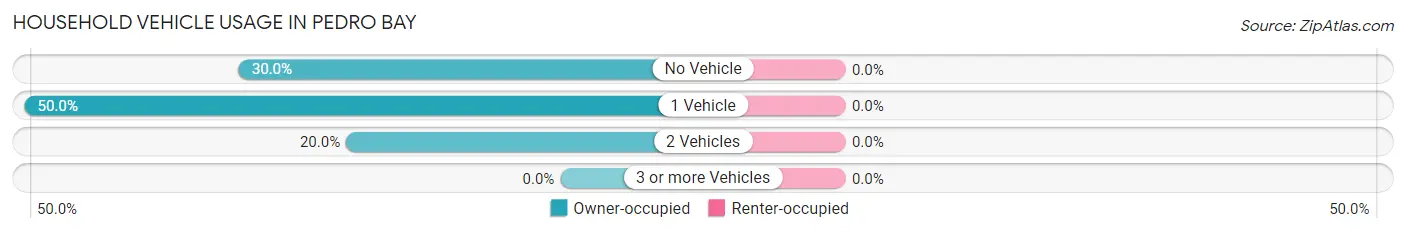
| Vehicles per Household | Owner-occupied | Renter-occupied |
| No Vehicle | 3 (30.0%) | 0 (0.0%) |
| 1 Vehicle | 5 (50.0%) | 0 (0.0%) |
| 2 Vehicles | 2 (20.0%) | 0 (0.0%) |
| 3 or more Vehicles | 0 (0.0%) | 0 (0.0%) |
| Total | 10 (100.0%) | 0 (0.0%) |
Real Estate & Mortgages in Pedro Bay
Real Estate and Mortgage Overview in Pedro Bay
| Characteristic | Without Mortgage | With Mortgage |
| Housing Units | 7 | 3 |
| Median Property Value | $193,800 | $0 |
| Median Household Income | - | - |
| Monthly Housing Costs | $388 | $0 |
| Real Estate Taxes | - | - |
Property Value by Mortgage Status in Pedro Bay
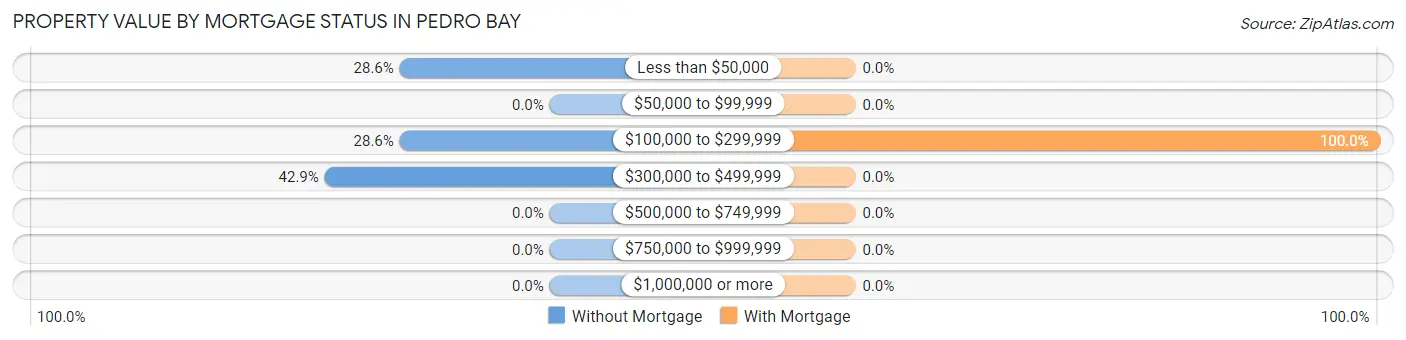
| Property Value | Without Mortgage | With Mortgage |
| Less than $50,000 | 2 (28.6%) | 0 (0.0%) |
| $50,000 to $99,999 | 0 (0.0%) | 0 (0.0%) |
| $100,000 to $299,999 | 2 (28.6%) | 3 (100.0%) |
| $300,000 to $499,999 | 3 (42.9%) | 0 (0.0%) |
| $500,000 to $749,999 | 0 (0.0%) | 0 (0.0%) |
| $750,000 to $999,999 | 0 (0.0%) | 0 (0.0%) |
| $1,000,000 or more | 0 (0.0%) | 0 (0.0%) |
| Total | 7 (100.0%) | 3 (100.0%) |
Household Income by Mortgage Status in Pedro Bay
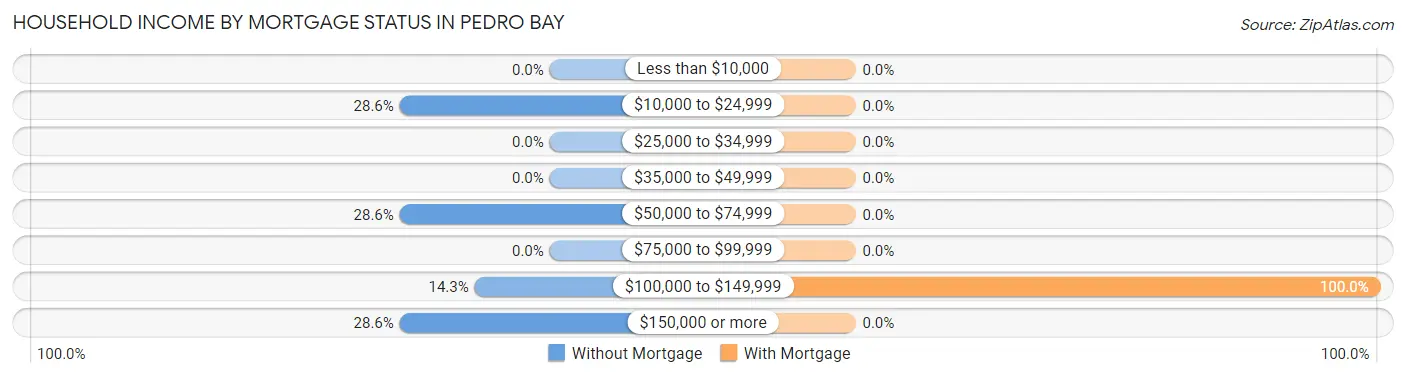
| Household Income | Without Mortgage | With Mortgage |
| Less than $10,000 | 0 (0.0%) | 0 (0.0%) |
| $10,000 to $24,999 | 2 (28.6%) | 0 (0.0%) |
| $25,000 to $34,999 | 0 (0.0%) | 0 (0.0%) |
| $35,000 to $49,999 | 0 (0.0%) | 0 (0.0%) |
| $50,000 to $74,999 | 2 (28.6%) | 0 (0.0%) |
| $75,000 to $99,999 | 0 (0.0%) | 0 (0.0%) |
| $100,000 to $149,999 | 1 (14.3%) | 3 (100.0%) |
| $150,000 or more | 2 (28.6%) | 0 (0.0%) |
| Total | 7 (100.0%) | 3 (100.0%) |
Property Value to Household Income Ratio in Pedro Bay
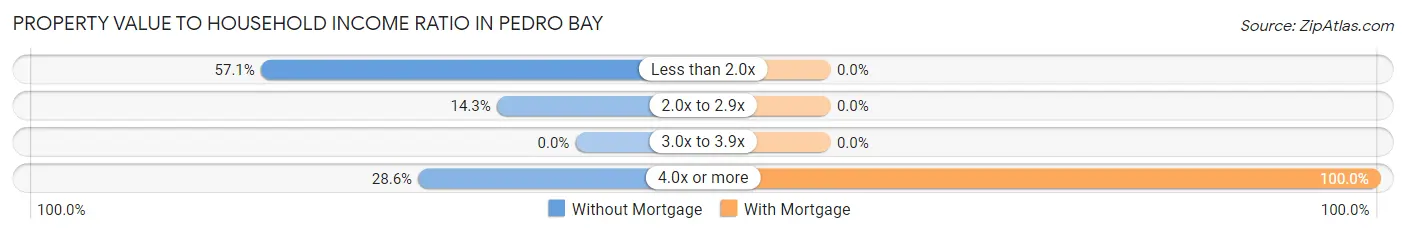
| Value-to-Income Ratio | Without Mortgage | With Mortgage |
| Less than 2.0x | 4 (57.1%) | 0 (0.0%) |
| 2.0x to 2.9x | 1 (14.3%) | 0 (0.0%) |
| 3.0x to 3.9x | 0 (0.0%) | 0 (0.0%) |
| 4.0x or more | 2 (28.6%) | 3 (100.0%) |
| Total | 7 (100.0%) | 3 (100.0%) |
Real Estate Taxes by Mortgage Status in Pedro Bay
| Property Taxes | Without Mortgage | With Mortgage |
| Less than $800 | 0 (0.0%) | 0 (0.0%) |
| $800 to $1,499 | 0 (0.0%) | 0 (0.0%) |
| $800 to $1,499 | 0 (0.0%) | 0 (0.0%) |
| Total | 7 (100.0%) | 3 (100.0%) |
Health & Disability in Pedro Bay
Health Insurance Coverage by Age in Pedro Bay
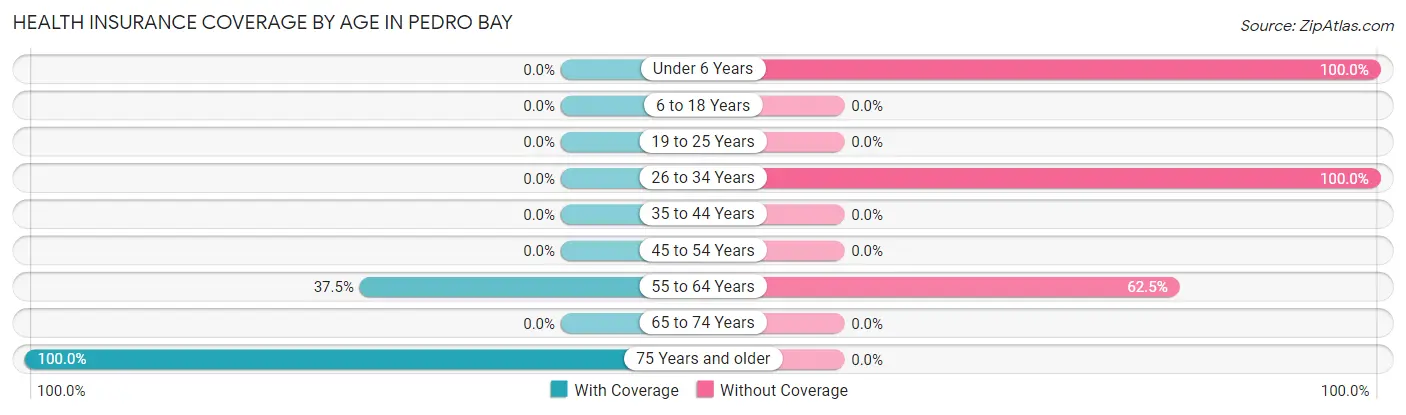
| Age Bracket | With Coverage | Without Coverage |
| Under 6 Years | 0 (0.0%) | 2 (100.0%) |
| 6 to 18 Years | 0 (0.0%) | 0 (0.0%) |
| 19 to 25 Years | 0 (0.0%) | 0 (0.0%) |
| 26 to 34 Years | 0 (0.0%) | 1 (100.0%) |
| 35 to 44 Years | 0 (0.0%) | 0 (0.0%) |
| 45 to 54 Years | 0 (0.0%) | 0 (0.0%) |
| 55 to 64 Years | 3 (37.5%) | 5 (62.5%) |
| 65 to 74 Years | 0 (0.0%) | 0 (0.0%) |
| 75 Years and older | 2 (100.0%) | 0 (0.0%) |
| Total | 5 (38.5%) | 8 (61.5%) |
Health Insurance Coverage by Citizenship Status in Pedro Bay
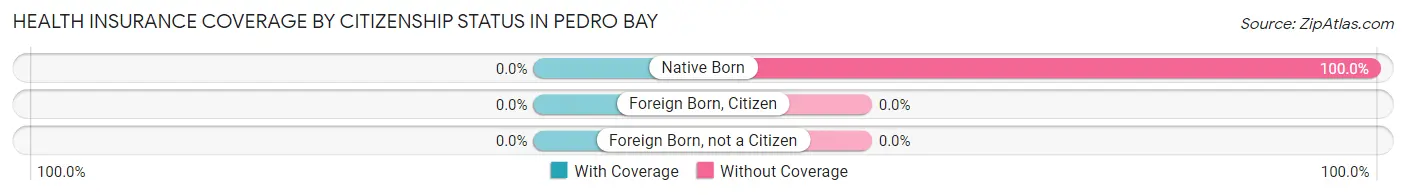
| Citizenship Status | With Coverage | Without Coverage |
| Native Born | 0 (0.0%) | 2 (100.0%) |
| Foreign Born, Citizen | 0 (0.0%) | 0 (0.0%) |
| Foreign Born, not a Citizen | 0 (0.0%) | 0 (0.0%) |
Health Insurance Coverage by Household Income in Pedro Bay
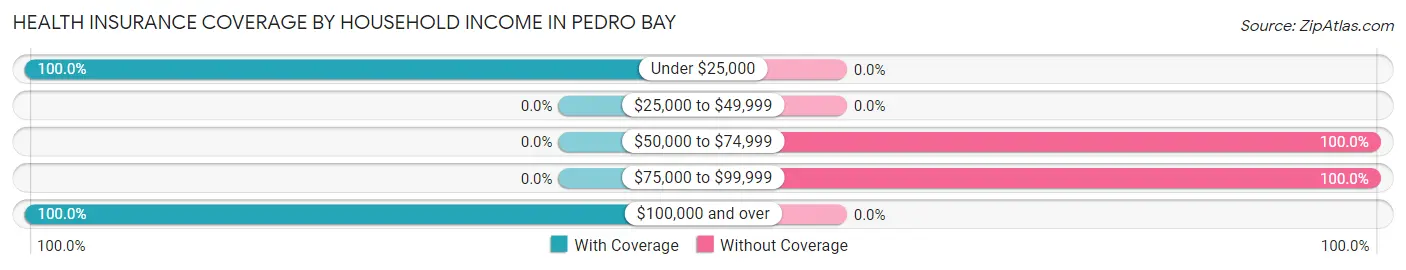
| Household Income | With Coverage | Without Coverage |
| Under $25,000 | 2 (100.0%) | 0 (0.0%) |
| $25,000 to $49,999 | 0 (0.0%) | 0 (0.0%) |
| $50,000 to $74,999 | 0 (0.0%) | 2 (100.0%) |
| $75,000 to $99,999 | 0 (0.0%) | 6 (100.0%) |
| $100,000 and over | 3 (100.0%) | 0 (0.0%) |
Public vs Private Health Insurance Coverage by Age in Pedro Bay
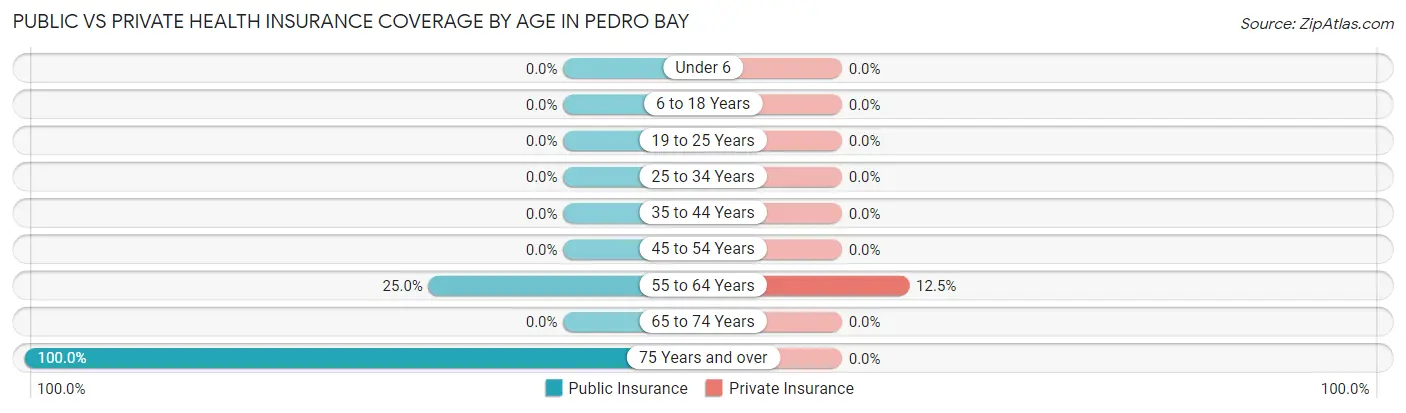
| Age Bracket | Public Insurance | Private Insurance |
| Under 6 | 0 (0.0%) | 0 (0.0%) |
| 6 to 18 Years | 0 (0.0%) | 0 (0.0%) |
| 19 to 25 Years | 0 (0.0%) | 0 (0.0%) |
| 25 to 34 Years | 0 (0.0%) | 0 (0.0%) |
| 35 to 44 Years | 0 (0.0%) | 0 (0.0%) |
| 45 to 54 Years | 0 (0.0%) | 0 (0.0%) |
| 55 to 64 Years | 2 (25.0%) | 1 (12.5%) |
| 65 to 74 Years | 0 (0.0%) | 0 (0.0%) |
| 75 Years and over | 2 (100.0%) | 0 (0.0%) |
| Total | 4 (30.8%) | 1 (7.7%) |
Disability Status by Sex by Age in Pedro Bay
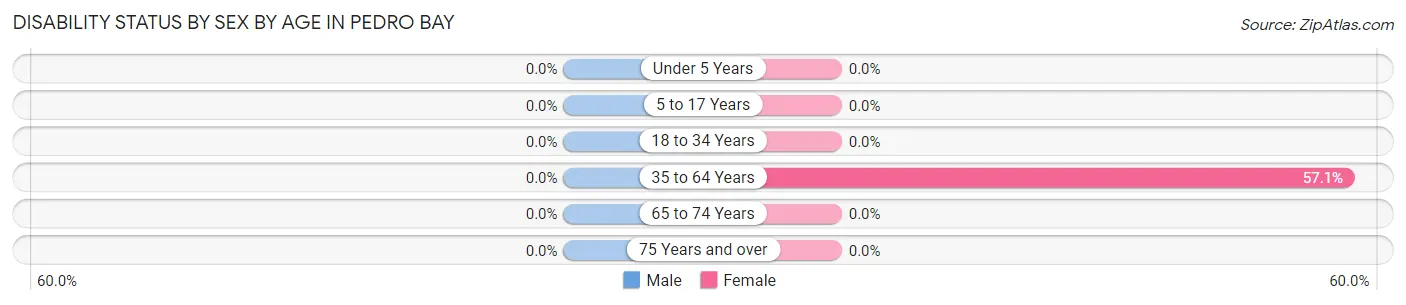
| Age Bracket | Male | Female |
| Under 5 Years | 0 (0.0%) | 0 (0.0%) |
| 5 to 17 Years | 0 (0.0%) | 0 (0.0%) |
| 18 to 34 Years | 0 (0.0%) | 0 (0.0%) |
| 35 to 64 Years | 0 (0.0%) | 4 (57.1%) |
| 65 to 74 Years | 0 (0.0%) | 0 (0.0%) |
| 75 Years and over | 0 (0.0%) | 0 (0.0%) |
Disability Class by Sex by Age in Pedro Bay
Disability Class: Hearing Difficulty
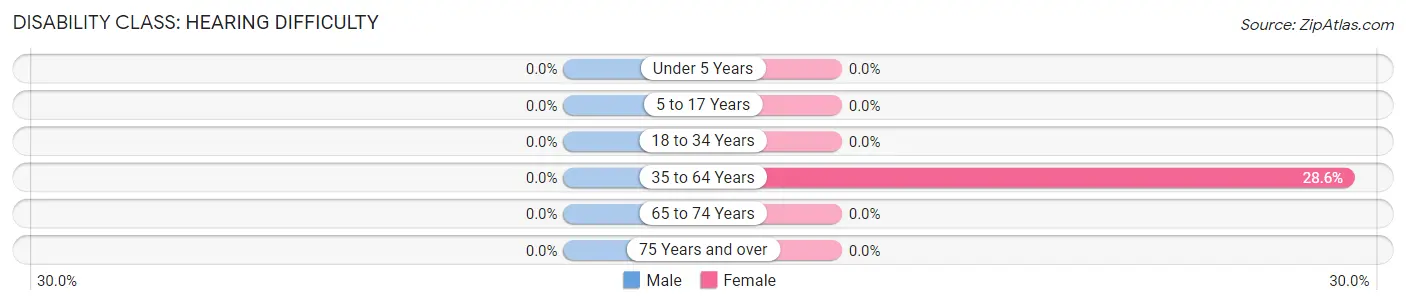
| Age Bracket | Male | Female |
| Under 5 Years | 0 (0.0%) | 0 (0.0%) |
| 5 to 17 Years | 0 (0.0%) | 0 (0.0%) |
| 18 to 34 Years | 0 (0.0%) | 0 (0.0%) |
| 35 to 64 Years | 0 (0.0%) | 2 (28.6%) |
| 65 to 74 Years | 0 (0.0%) | 0 (0.0%) |
| 75 Years and over | 0 (0.0%) | 0 (0.0%) |
Disability Class: Vision Difficulty
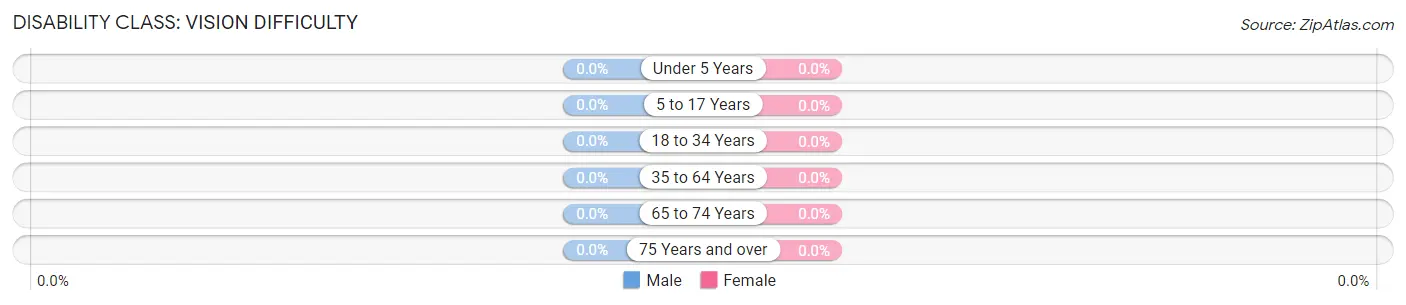
| Age Bracket | Male | Female |
| Under 5 Years | 0 (0.0%) | 0 (0.0%) |
| 5 to 17 Years | 0 (0.0%) | 0 (0.0%) |
| 18 to 34 Years | 0 (0.0%) | 0 (0.0%) |
| 35 to 64 Years | 0 (0.0%) | 0 (0.0%) |
| 65 to 74 Years | 0 (0.0%) | 0 (0.0%) |
| 75 Years and over | 0 (0.0%) | 0 (0.0%) |
Disability Class: Cognitive Difficulty
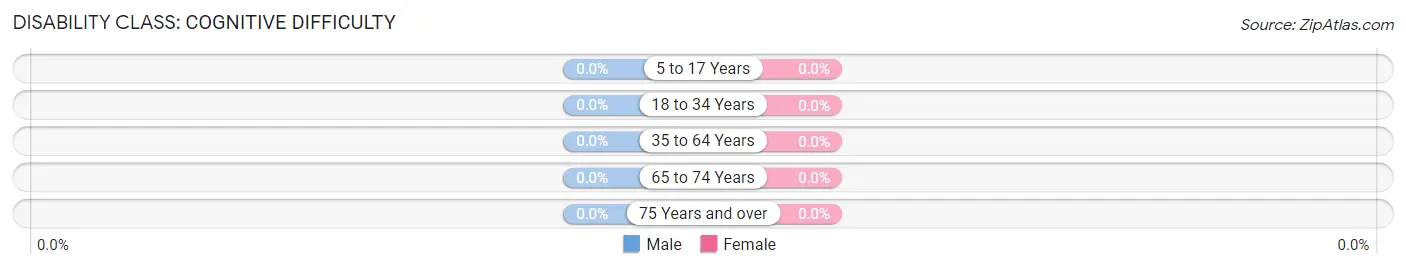
| Age Bracket | Male | Female |
| 5 to 17 Years | 0 (0.0%) | 0 (0.0%) |
| 18 to 34 Years | 0 (0.0%) | 0 (0.0%) |
| 35 to 64 Years | 0 (0.0%) | 0 (0.0%) |
| 65 to 74 Years | 0 (0.0%) | 0 (0.0%) |
| 75 Years and over | 0 (0.0%) | 0 (0.0%) |
Disability Class: Ambulatory Difficulty
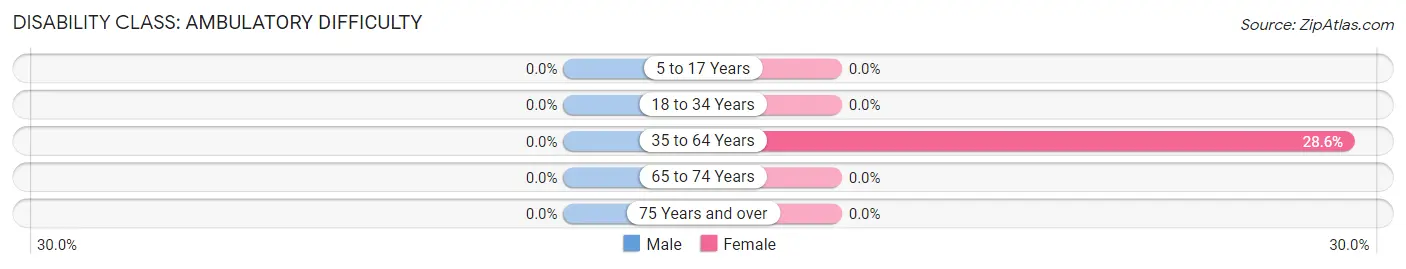
| Age Bracket | Male | Female |
| 5 to 17 Years | 0 (0.0%) | 0 (0.0%) |
| 18 to 34 Years | 0 (0.0%) | 0 (0.0%) |
| 35 to 64 Years | 0 (0.0%) | 2 (28.6%) |
| 65 to 74 Years | 0 (0.0%) | 0 (0.0%) |
| 75 Years and over | 0 (0.0%) | 0 (0.0%) |
Disability Class: Self-Care Difficulty
| Age Bracket | Male | Female |
| 5 to 17 Years | 0 (0.0%) | 0 (0.0%) |
| 18 to 34 Years | 0 (0.0%) | 0 (0.0%) |
| 35 to 64 Years | 0 (0.0%) | 0 (0.0%) |
| 65 to 74 Years | 0 (0.0%) | 0 (0.0%) |
| 75 Years and over | 0 (0.0%) | 0 (0.0%) |
Technology Access in Pedro Bay
Computing Device Access in Pedro Bay
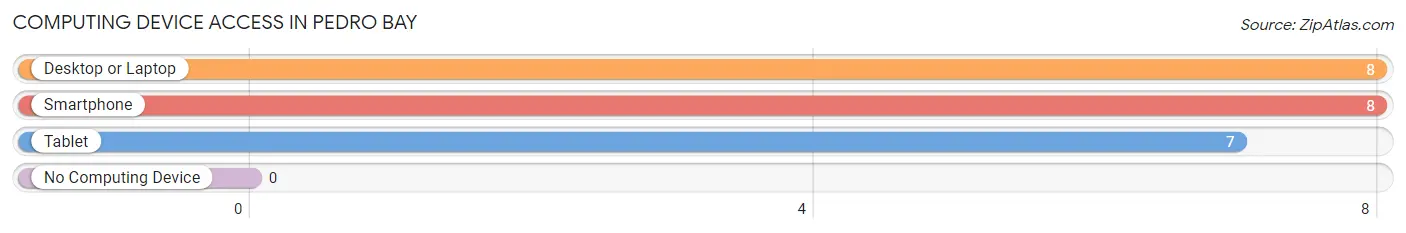
| Device Type | # Households | % Households |
| Desktop or Laptop | 8 | 80.0% |
| Smartphone | 8 | 80.0% |
| Tablet | 7 | 70.0% |
| No Computing Device | 0 | 0.0% |
| Total | 10 | 100.0% |
Internet Access in Pedro Bay
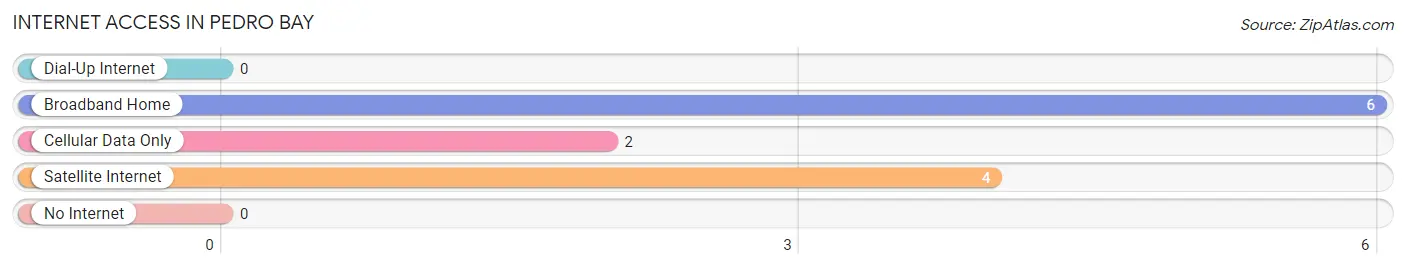
| Internet Type | # Households | % Households |
| Dial-Up Internet | 0 | 0.0% |
| Broadband Home | 6 | 60.0% |
| Cellular Data Only | 2 | 20.0% |
| Satellite Internet | 4 | 40.0% |
| No Internet | 0 | 0.0% |
| Total | 10 | 100.0% |
Pedro Bay Summary
Pedro Bay is a small unincorporated community located in the Lake and Peninsula Borough of Alaska. It is situated on the western shore of the Alaska Peninsula, approximately 40 miles south of King Salmon. The community is accessible by air and boat, and is home to a population of approximately 200 people.
History
Pedro Bay was first settled in the late 1800s by a group of Russian fur traders. The area was used as a trading post for the fur trade, and the community was named after the Russian fur trader, Pedro. In the early 1900s, the area was used as a fishing camp by the local Native Alaskan population. The community was officially established in the 1920s, when the Alaska Railroad was built through the area.
Geography
Pedro Bay is located on the western shore of the Alaska Peninsula, approximately 40 miles south of King Salmon. The community is situated on a small bay, which is surrounded by mountains and forests. The area is known for its rugged beauty, and is home to a variety of wildlife, including bears, moose, and caribou. The climate in the area is generally mild, with temperatures ranging from the mid-30s in the winter to the mid-60s in the summer.
Economy
The economy of Pedro Bay is largely based on fishing and tourism. The area is home to a number of commercial fishing operations, which provide employment for many of the local residents. The community also serves as a popular destination for sport fishing, and is home to a number of lodges and resorts. In addition, the area is home to a number of small businesses, including a general store, a post office, and a restaurant.
Demographics
As of the 2010 census, the population of Pedro Bay was estimated to be approximately 200 people. The majority of the population is of Native Alaskan descent, with the largest ethnic group being Yup'ik Eskimos. The median age of the population is 33 years, and the median household income is $45,000. The majority of the population is employed in the fishing and tourism industries.
Conclusion
Pedro Bay is a small unincorporated community located in the Lake and Peninsula Borough of Alaska. It is situated on the western shore of the Alaska Peninsula, approximately 40 miles south of King Salmon. The community is home to a population of approximately 200 people, and is largely supported by the fishing and tourism industries. The majority of the population is of Native Alaskan descent, and the median age of the population is 33 years. Pedro Bay is known for its rugged beauty, and is a popular destination for sport fishing and other outdoor activities.
Common Questions
What is Per Capita Income in Pedro Bay?
Per Capita income in Pedro Bay is $76,008.
What is the Median Household income in Pedro Bay?
Median Household Income in Pedro Bay is $75,833.
What is Inequality or Gini Index in Pedro Bay?
Inequality or Gini Index in Pedro Bay is 0.40.
What is the Total Population of Pedro Bay?
Total Population of Pedro Bay is 13.
What is the Total Male Population of Pedro Bay?
Total Male Population of Pedro Bay is 3.
What is the Total Female Population of Pedro Bay?
Total Female Population of Pedro Bay is 10.
What is the Ratio of Males per 100 Females in Pedro Bay?
There are 30.00 Males per 100 Females in Pedro Bay.
What is the Ratio of Females per 100 Males in Pedro Bay?
There are 333.33 Females per 100 Males in Pedro Bay.
What is the Median Population Age in Pedro Bay?
Median Population Age in Pedro Bay is 57.5 Years.
What is the Average Family Size in Pedro Bay
Average Family Size in Pedro Bay is 2.0 People.
What is the Average Household Size in Pedro Bay
Average Household Size in Pedro Bay is 1.3 People.
How Large is the Labor Force in Pedro Bay?
There are 8 People in the Labor Forcein in Pedro Bay.
What is the Percentage of People in the Labor Force in Pedro Bay?
72.7% of People are in the Labor Force in Pedro Bay.
What is the Unemployment Rate in Pedro Bay?
Unemployment Rate in Pedro Bay is 25.0%.