Anderson, AK Map & Demographics
Anderson Map
Anderson Overview
$41,469
PER CAPITA INCOME
$124,375
AVG FAMILY INCOME
$111,250
AVG HOUSEHOLD INCOME
0.31
INEQUALITY / GINI INDEX
173
TOTAL POPULATION
114
MALE POPULATION
59
FEMALE POPULATION
193.22
MALES / 100 FEMALES
51.75
FEMALES / 100 MALES
30.4
MEDIAN AGE
3.1
AVG FAMILY SIZE
2.2
AVG HOUSEHOLD SIZE
99
LABOR FORCE [ PEOPLE ]
70.2%
PERCENT IN LABOR FORCE
6.0%
UNEMPLOYMENT RATE
Anderson Zip Codes
Anderson Area Codes
Income in Anderson
Income Overview in Anderson
Per Capita Income in Anderson is $41,469, while median incomes of families and households are $124,375 and $111,250 respectively.
| Characteristic | Number | Measure |
| Per Capita Income | 173 | $41,469 |
| Median Family Income | 33 | $124,375 |
| Mean Family Income | 33 | $123,303 |
| Median Household Income | 55 | $111,250 |
| Mean Household Income | 55 | $109,407 |
| Income Deficit | 33 | $0 |
| Wage / Income Gap (%) | 173 | 0.00% |
| Wage / Income Gap ($) | 173 | 100.00¢ per $1 |
| Gini / Inequality Index | 173 | 0.31 |
Earnings by Sex in Anderson
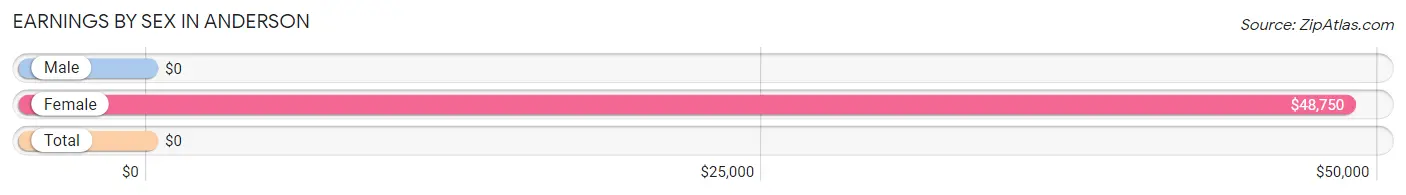
| Sex | Number | Average Earnings |
| Male | 76 (73.1%) | $0 |
| Female | 28 (26.9%) | $48,750 |
| Total | 104 (100.0%) | $0 |
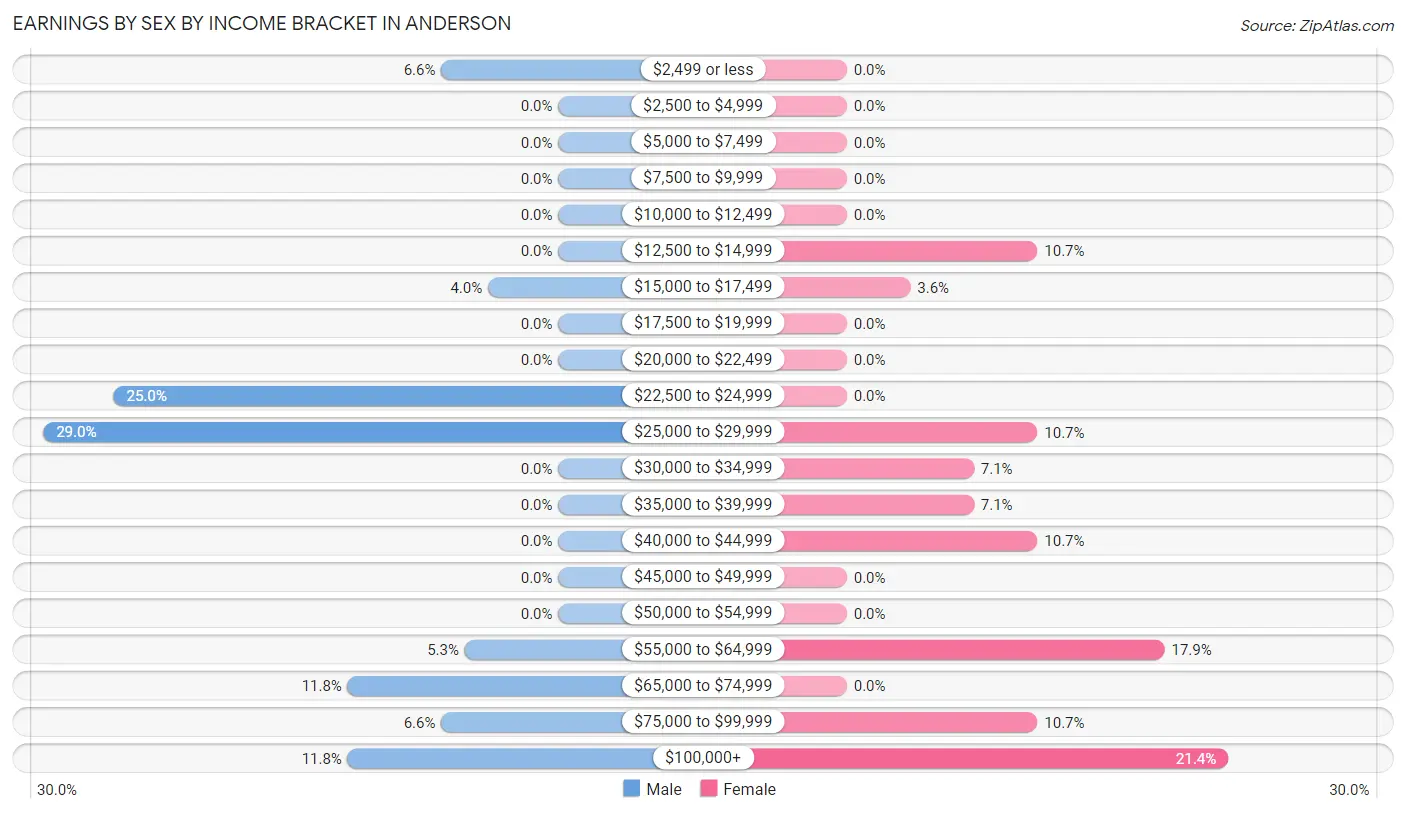
Earnings by Sex by Income Bracket in Anderson
The most common earnings brackets in Anderson are $25,000 to $29,999 for men (22 | 28.9%) and $100,000+ for women (6 | 21.4%).
| Income | Male | Female |
| $2,499 or less | 5 (6.6%) | 0 (0.0%) |
| $2,500 to $4,999 | 0 (0.0%) | 0 (0.0%) |
| $5,000 to $7,499 | 0 (0.0%) | 0 (0.0%) |
| $7,500 to $9,999 | 0 (0.0%) | 0 (0.0%) |
| $10,000 to $12,499 | 0 (0.0%) | 0 (0.0%) |
| $12,500 to $14,999 | 0 (0.0%) | 3 (10.7%) |
| $15,000 to $17,499 | 3 (4.0%) | 1 (3.6%) |
| $17,500 to $19,999 | 0 (0.0%) | 0 (0.0%) |
| $20,000 to $22,499 | 0 (0.0%) | 0 (0.0%) |
| $22,500 to $24,999 | 19 (25.0%) | 0 (0.0%) |
| $25,000 to $29,999 | 22 (28.9%) | 3 (10.7%) |
| $30,000 to $34,999 | 0 (0.0%) | 2 (7.1%) |
| $35,000 to $39,999 | 0 (0.0%) | 2 (7.1%) |
| $40,000 to $44,999 | 0 (0.0%) | 3 (10.7%) |
| $45,000 to $49,999 | 0 (0.0%) | 0 (0.0%) |
| $50,000 to $54,999 | 0 (0.0%) | 0 (0.0%) |
| $55,000 to $64,999 | 4 (5.3%) | 5 (17.9%) |
| $65,000 to $74,999 | 9 (11.8%) | 0 (0.0%) |
| $75,000 to $99,999 | 5 (6.6%) | 3 (10.7%) |
| $100,000+ | 9 (11.8%) | 6 (21.4%) |
| Total | 76 (100.0%) | 28 (100.0%) |
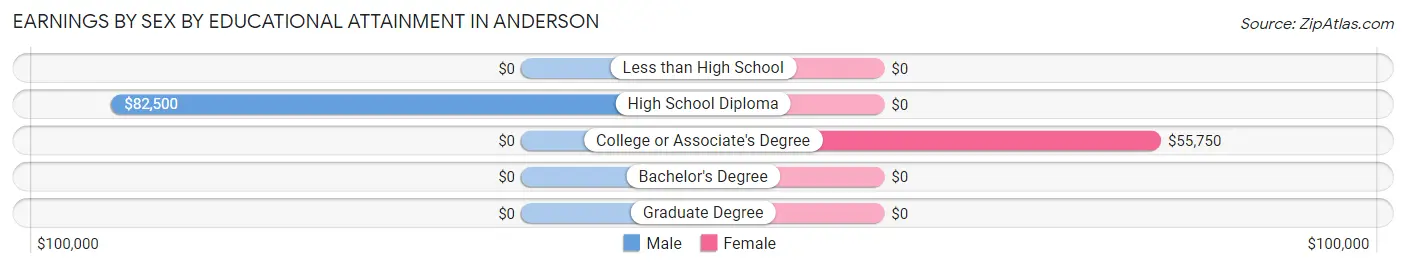
Earnings by Sex by Educational Attainment in Anderson
Average earnings in Anderson are $67,222 for men and $55,250 for women, a difference of 17.8%. Men with an educational attainment of high school diploma enjoy the highest average annual earnings of $82,500, while those with high school diploma education earn the least with $82,500. Women with an educational attainment of college or associate's degree earn the most with the average annual earnings of $55,750, while those with college or associate's degree education have the smallest earnings of $55,750.
| Educational Attainment | Male Income | Female Income |
| Less than High School | - | - |
| High School Diploma | $82,500 | $0 |
| College or Associate's Degree | - | - |
| Bachelor's Degree | - | - |
| Graduate Degree | - | - |
| Total | $67,222 | $55,250 |
Family Income in Anderson
Family Income Brackets in Anderson
According to the Anderson family income data, there are 10 families falling into the $100,000 to $149,999 income range, which is the most common income bracket and makes up 30.3% of all families.
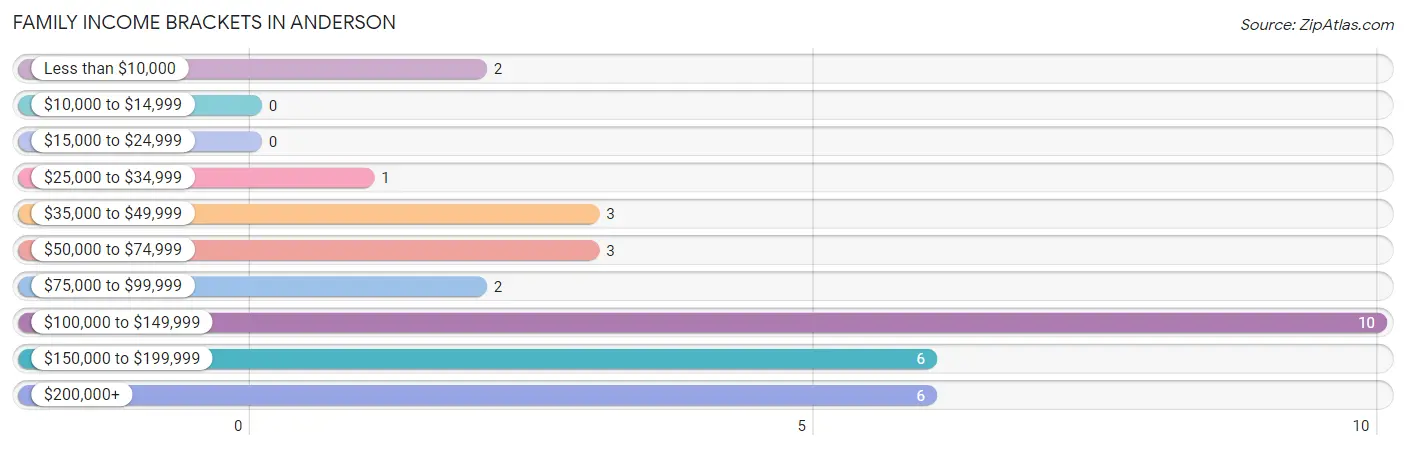
| Income Bracket | # Families | % Families |
| Less than $10,000 | 2 | 6.1% |
| $10,000 to $14,999 | 0 | 0.0% |
| $15,000 to $24,999 | 0 | 0.0% |
| $25,000 to $34,999 | 1 | 3.0% |
| $35,000 to $49,999 | 3 | 9.1% |
| $50,000 to $74,999 | 3 | 9.1% |
| $75,000 to $99,999 | 2 | 6.1% |
| $100,000 to $149,999 | 10 | 30.3% |
| $150,000 to $199,999 | 6 | 18.2% |
| $200,000+ | 6 | 18.2% |
Family Income by Famaliy Size in Anderson
4-person families (10 | 30.3%) account for the highest median family income in Anderson with $188,750 per family, while 2-person families (16 | 48.5%) have the highest median income of $55,416 per family member.
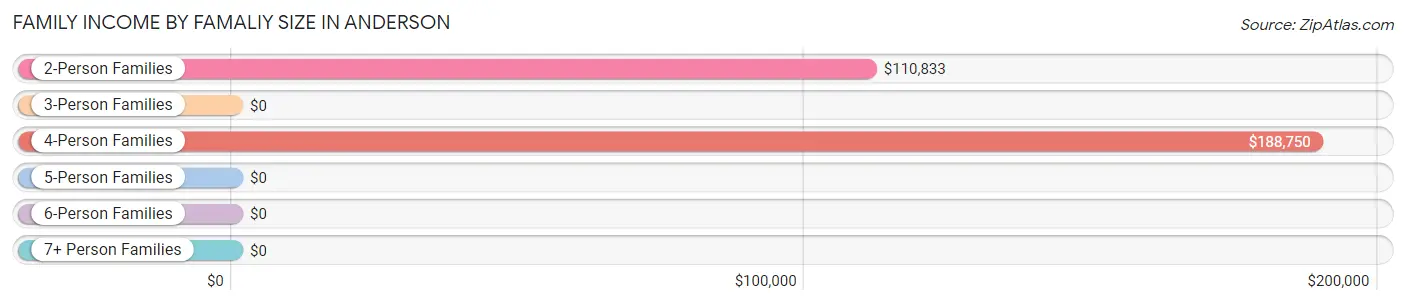
| Income Bracket | # Families | Median Income |
| 2-Person Families | 16 (48.5%) | $110,833 |
| 3-Person Families | 6 (18.2%) | $0 |
| 4-Person Families | 10 (30.3%) | $188,750 |
| 5-Person Families | 0 (0.0%) | $0 |
| 6-Person Families | 1 (3.0%) | $0 |
| 7+ Person Families | 0 (0.0%) | $0 |
| Total | 33 (100.0%) | $124,375 |
Family Income by Number of Earners in Anderson
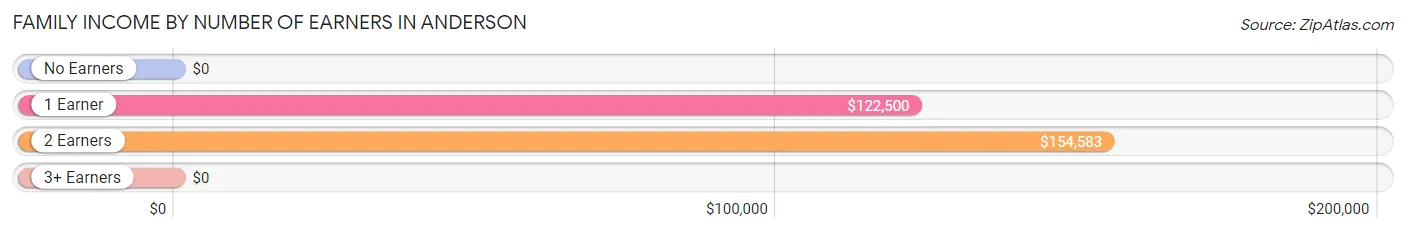
| Number of Earners | # Families | Median Income |
| No Earners | 8 (24.2%) | $0 |
| 1 Earner | 8 (24.2%) | $122,500 |
| 2 Earners | 17 (51.5%) | $154,583 |
| 3+ Earners | 0 (0.0%) | $0 |
| Total | 33 (100.0%) | $124,375 |
Household Income in Anderson
Household Income Brackets in Anderson
With 14 households falling in the category, the $100,000 to $149,999 income range is the most frequent in Anderson, accounting for 25.5% of all households.
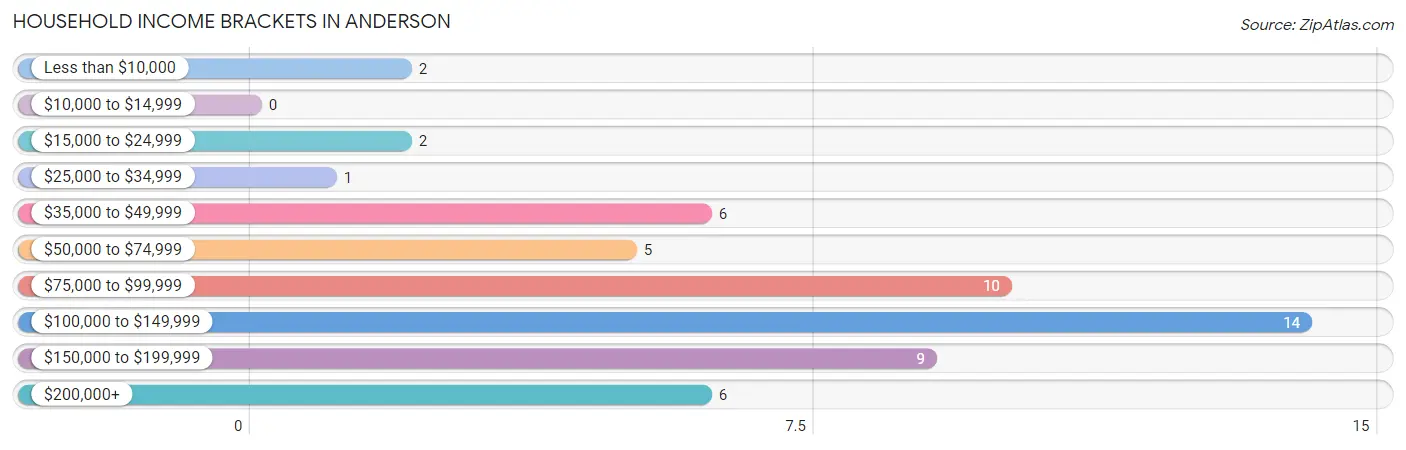
| Income Bracket | # Households | % Households |
| Less than $10,000 | 2 | 3.6% |
| $10,000 to $14,999 | 0 | 0.0% |
| $15,000 to $24,999 | 2 | 3.6% |
| $25,000 to $34,999 | 1 | 1.8% |
| $35,000 to $49,999 | 6 | 10.9% |
| $50,000 to $74,999 | 5 | 9.1% |
| $75,000 to $99,999 | 10 | 18.2% |
| $100,000 to $149,999 | 14 | 25.5% |
| $150,000 to $199,999 | 9 | 16.4% |
| $200,000+ | 6 | 10.9% |
Household Income by Householder Age in Anderson
The median household income in Anderson is $111,250, with the highest median household income of $154,167 found in the 25 to 44 years age bracket for the primary householder. A total of 18 households (32.7%) fall into this category. Meanwhile, the 15 to 24 years age bracket for the primary householder has the lowest median household income of $0, with 1 households (1.8%) in this group.
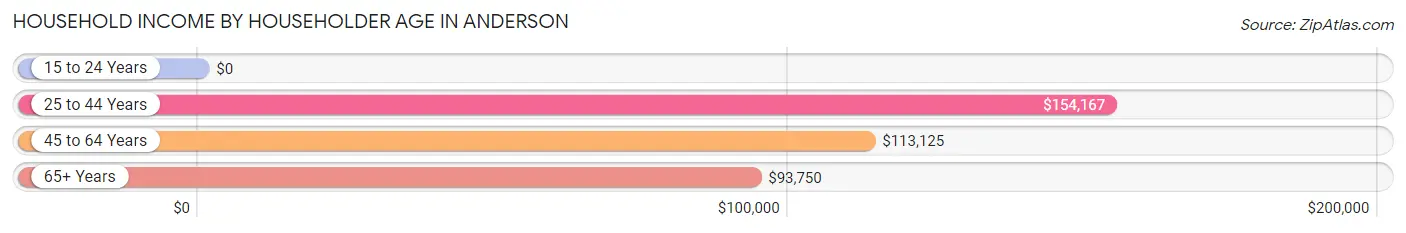
| Income Bracket | # Households | Median Income |
| 15 to 24 Years | 1 (1.8%) | $0 |
| 25 to 44 Years | 18 (32.7%) | $154,167 |
| 45 to 64 Years | 21 (38.2%) | $113,125 |
| 65+ Years | 15 (27.3%) | $93,750 |
| Total | 55 (100.0%) | $111,250 |
Poverty in Anderson
Income Below Poverty by Sex and Age in Anderson
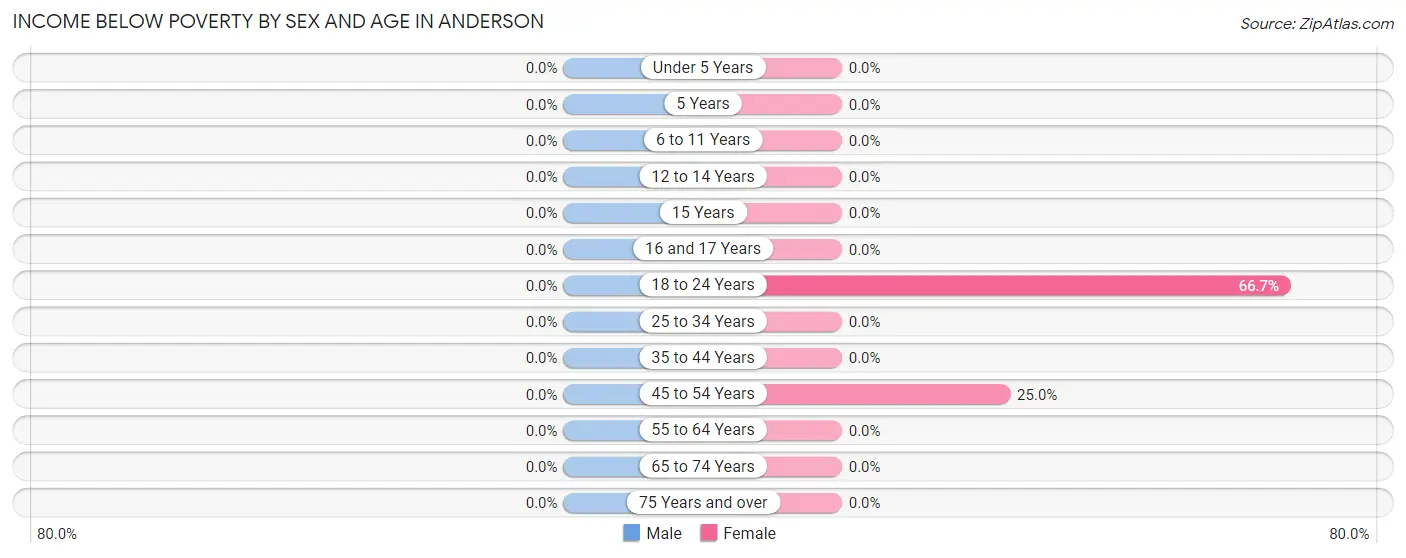
| Age Bracket | Male | Female |
| Under 5 Years | 0 (0.0%) | 0 (0.0%) |
| 5 Years | 0 (0.0%) | 0 (0.0%) |
| 6 to 11 Years | 0 (0.0%) | 0 (0.0%) |
| 12 to 14 Years | 0 (0.0%) | 0 (0.0%) |
| 15 Years | 0 (0.0%) | 0 (0.0%) |
| 16 and 17 Years | 0 (0.0%) | 0 (0.0%) |
| 18 to 24 Years | 0 (0.0%) | 2 (66.7%) |
| 25 to 34 Years | 0 (0.0%) | 0 (0.0%) |
| 35 to 44 Years | 0 (0.0%) | 0 (0.0%) |
| 45 to 54 Years | 0 (0.0%) | 2 (25.0%) |
| 55 to 64 Years | 0 (0.0%) | 0 (0.0%) |
| 65 to 74 Years | 0 (0.0%) | 0 (0.0%) |
| 75 Years and over | 0 (0.0%) | 0 (0.0%) |
| Total | 0 (0.0%) | 4 (6.8%) |
Income Above Poverty by Sex and Age in Anderson
According to the poverty statistics in Anderson, males aged 5 years and females aged under 5 years are the age groups that are most secure financially, with 100.0% of males and 100.0% of females in these age groups living above the poverty line.
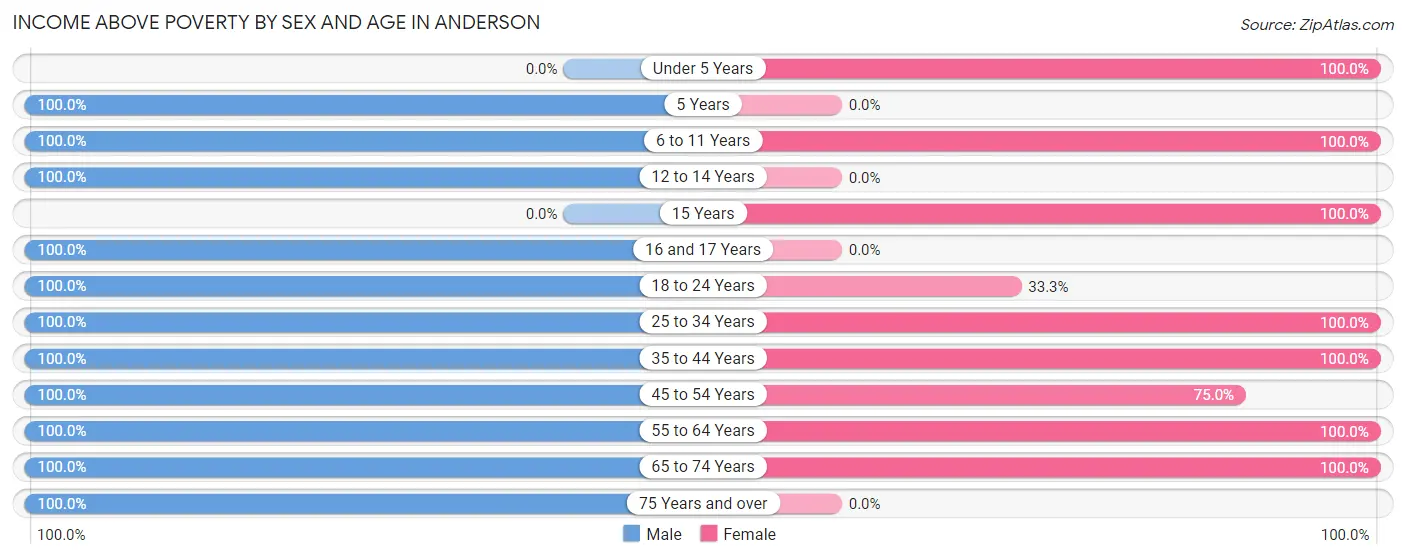
| Age Bracket | Male | Female |
| Under 5 Years | 0 (0.0%) | 2 (100.0%) |
| 5 Years | 2 (100.0%) | 0 (0.0%) |
| 6 to 11 Years | 8 (100.0%) | 13 (100.0%) |
| 12 to 14 Years | 5 (100.0%) | 0 (0.0%) |
| 15 Years | 0 (0.0%) | 2 (100.0%) |
| 16 and 17 Years | 6 (100.0%) | 0 (0.0%) |
| 18 to 24 Years | 1 (100.0%) | 1 (33.3%) |
| 25 to 34 Years | 1 (100.0%) | 6 (100.0%) |
| 35 to 44 Years | 10 (100.0%) | 12 (100.0%) |
| 45 to 54 Years | 7 (100.0%) | 6 (75.0%) |
| 55 to 64 Years | 9 (100.0%) | 10 (100.0%) |
| 65 to 74 Years | 15 (100.0%) | 3 (100.0%) |
| 75 Years and over | 1 (100.0%) | 0 (0.0%) |
| Total | 65 (100.0%) | 55 (93.2%) |
Income Below Poverty Among Married-Couple Families in Anderson
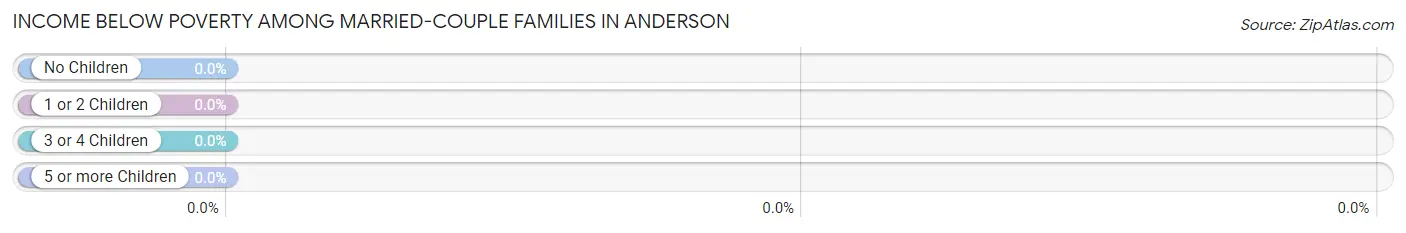
| Children | Above Poverty | Below Poverty |
| No Children | 13 (100.0%) | 0 (0.0%) |
| 1 or 2 Children | 13 (100.0%) | 0 (0.0%) |
| 3 or 4 Children | 1 (100.0%) | 0 (0.0%) |
| 5 or more Children | 0 (0.0%) | 0 (0.0%) |
| Total | 27 (100.0%) | 0 (0.0%) |
Income Below Poverty Among Single-Parent Households in Anderson
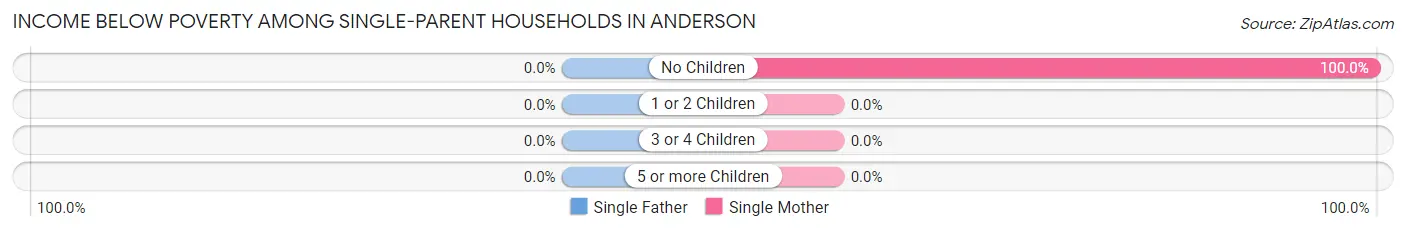
| Children | Single Father | Single Mother |
| No Children | 0 (0.0%) | 2 (100.0%) |
| 1 or 2 Children | 0 (0.0%) | 0 (0.0%) |
| 3 or 4 Children | 0 (0.0%) | 0 (0.0%) |
| 5 or more Children | 0 (0.0%) | 0 (0.0%) |
| Total | 0 (0.0%) | 2 (66.7%) |
Income Below Poverty Among Married-Couple vs Single-Parent Households in Anderson
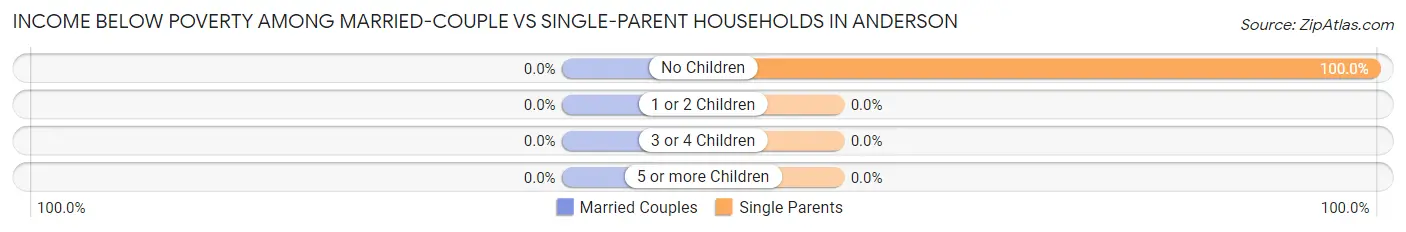
| Children | Married-Couple Families | Single-Parent Households |
| No Children | 0 (0.0%) | 2 (100.0%) |
| 1 or 2 Children | 0 (0.0%) | 0 (0.0%) |
| 3 or 4 Children | 0 (0.0%) | 0 (0.0%) |
| 5 or more Children | 0 (0.0%) | 0 (0.0%) |
| Total | 0 (0.0%) | 2 (33.3%) |
Race in Anderson
The most populous races in Anderson are White / Caucasian (155 | 89.6%), Hispanic or Latino (10 | 5.8%), and Black / African American (9 | 5.2%).
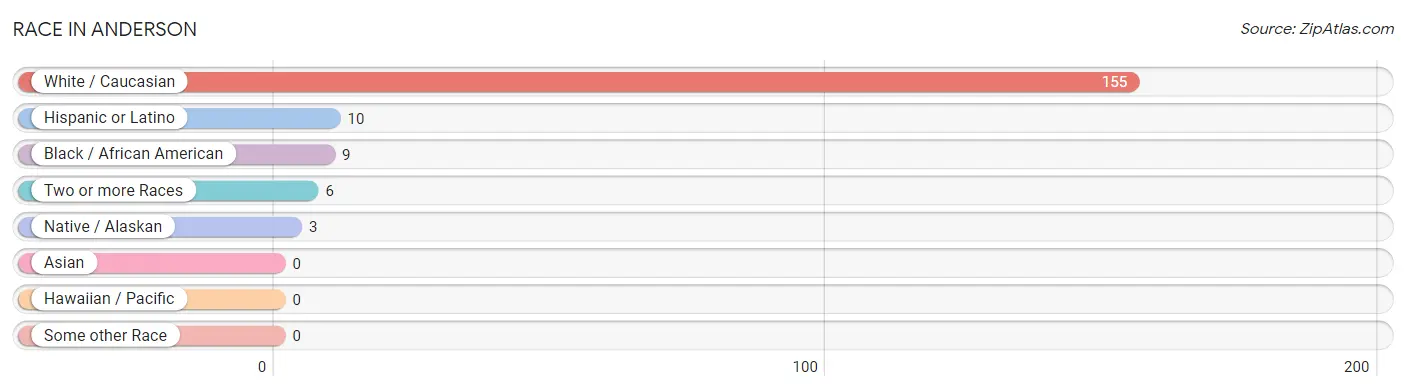
| Race | # Population | % Population |
| Asian | 0 | 0.0% |
| Black / African American | 9 | 5.2% |
| Hawaiian / Pacific | 0 | 0.0% |
| Hispanic or Latino | 10 | 5.8% |
| Native / Alaskan | 3 | 1.7% |
| White / Caucasian | 155 | 89.6% |
| Two or more Races | 6 | 3.5% |
| Some other Race | 0 | 0.0% |
| Total | 173 | 100.0% |
Ancestry in Anderson
The most populous ancestries reported in Anderson are German (48 | 27.8%), Italian (33 | 19.1%), Irish (18 | 10.4%), Spanish (10 | 5.8%), and Barbadian (9 | 5.2%), together accounting for 68.2% of all Anderson residents.
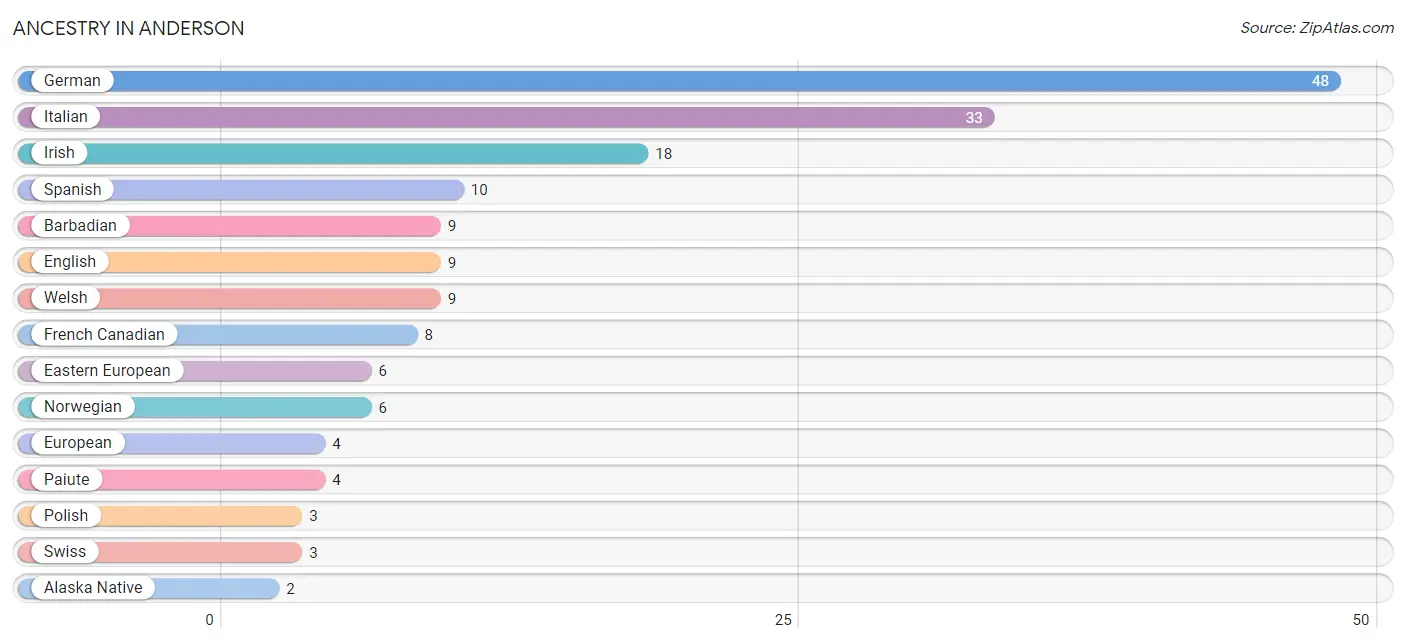
| Ancestry | # Population | % Population |
| Alaska Native | 2 | 1.2% |
| Alaskan Athabascan | 1 | 0.6% |
| Aleut | 2 | 1.2% |
| Barbadian | 9 | 5.2% |
| Celtic | 1 | 0.6% |
| Danish | 1 | 0.6% |
| Dutch | 1 | 0.6% |
| Eastern European | 6 | 3.5% |
| English | 9 | 5.2% |
| European | 4 | 2.3% |
| French Canadian | 8 | 4.6% |
| German | 48 | 27.8% |
| Irish | 18 | 10.4% |
| Italian | 33 | 19.1% |
| Norwegian | 6 | 3.5% |
| Paiute | 4 | 2.3% |
| Polish | 3 | 1.7% |
| Scottish | 1 | 0.6% |
| Spanish | 10 | 5.8% |
| Swiss | 3 | 1.7% |
| Welsh | 9 | 5.2% | View All 21 Rows |
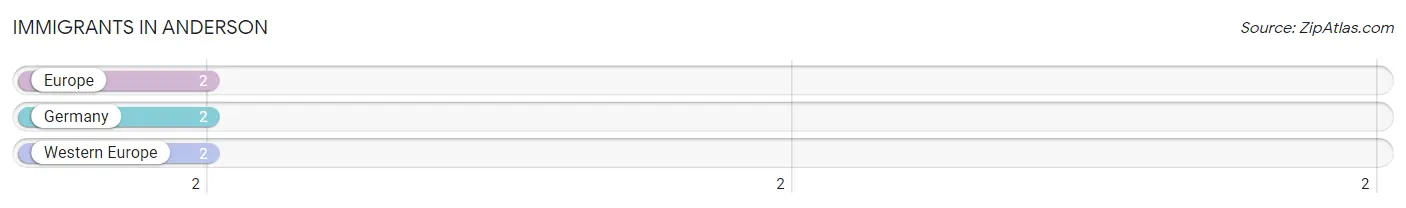
Immigrants in Anderson
The most numerous immigrant groups reported in Anderson came from Europe (2 | 1.2%), Germany (2 | 1.2%), and Western Europe (2 | 1.2%), together accounting for 3.5% of all Anderson residents.
| Immigration Origin | # Population | % Population |
| Europe | 2 | 1.2% |
| Germany | 2 | 1.2% |
| Western Europe | 2 | 1.2% | View All 3 Rows |
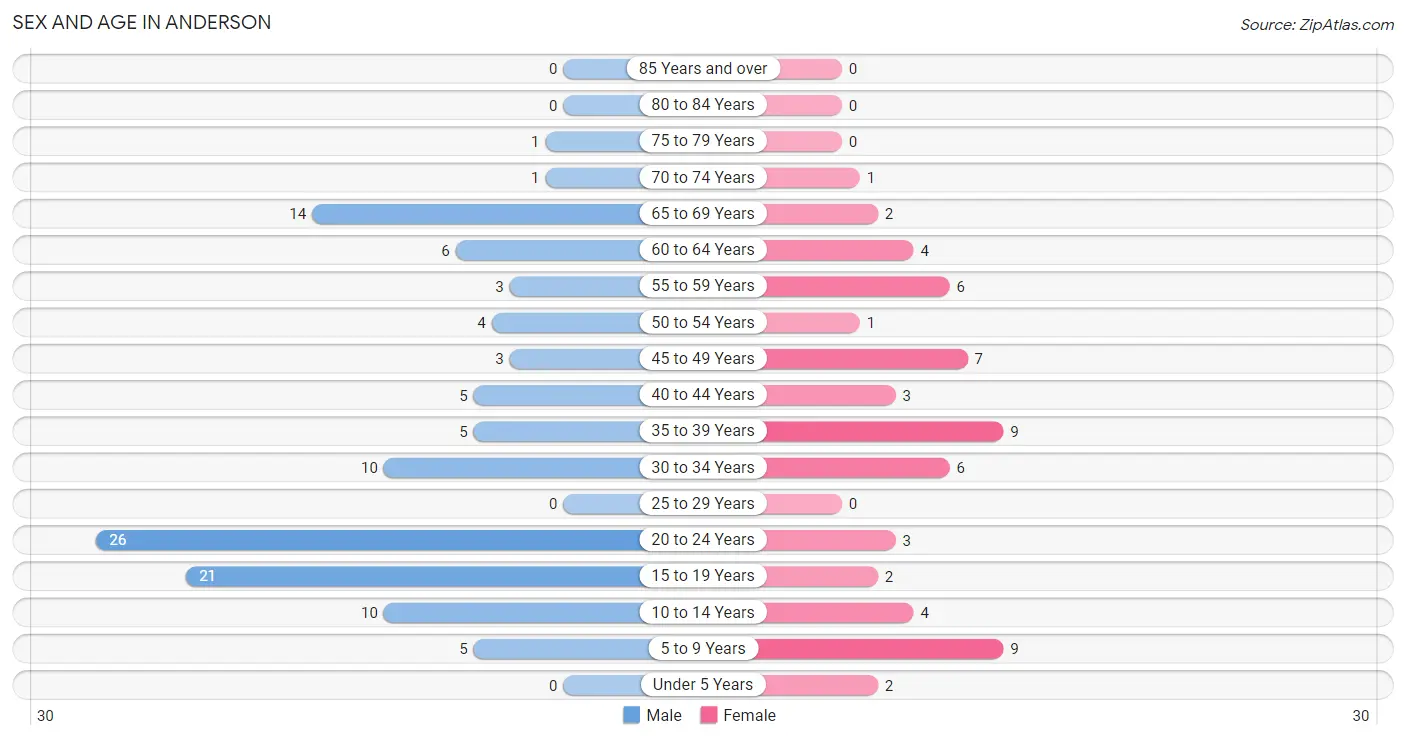
Sex and Age in Anderson
Sex and Age in Anderson
The most populous age groups in Anderson are 20 to 24 Years (26 | 22.8%) for men and 5 to 9 Years (9 | 15.2%) for women.
| Age Bracket | Male | Female |
| Under 5 Years | 0 (0.0%) | 2 (3.4%) |
| 5 to 9 Years | 5 (4.4%) | 9 (15.2%) |
| 10 to 14 Years | 10 (8.8%) | 4 (6.8%) |
| 15 to 19 Years | 21 (18.4%) | 2 (3.4%) |
| 20 to 24 Years | 26 (22.8%) | 3 (5.1%) |
| 25 to 29 Years | 0 (0.0%) | 0 (0.0%) |
| 30 to 34 Years | 10 (8.8%) | 6 (10.2%) |
| 35 to 39 Years | 5 (4.4%) | 9 (15.2%) |
| 40 to 44 Years | 5 (4.4%) | 3 (5.1%) |
| 45 to 49 Years | 3 (2.6%) | 7 (11.9%) |
| 50 to 54 Years | 4 (3.5%) | 1 (1.7%) |
| 55 to 59 Years | 3 (2.6%) | 6 (10.2%) |
| 60 to 64 Years | 6 (5.3%) | 4 (6.8%) |
| 65 to 69 Years | 14 (12.3%) | 2 (3.4%) |
| 70 to 74 Years | 1 (0.9%) | 1 (1.7%) |
| 75 to 79 Years | 1 (0.9%) | 0 (0.0%) |
| 80 to 84 Years | 0 (0.0%) | 0 (0.0%) |
| 85 Years and over | 0 (0.0%) | 0 (0.0%) |
| Total | 114 (100.0%) | 59 (100.0%) |
Families and Households in Anderson
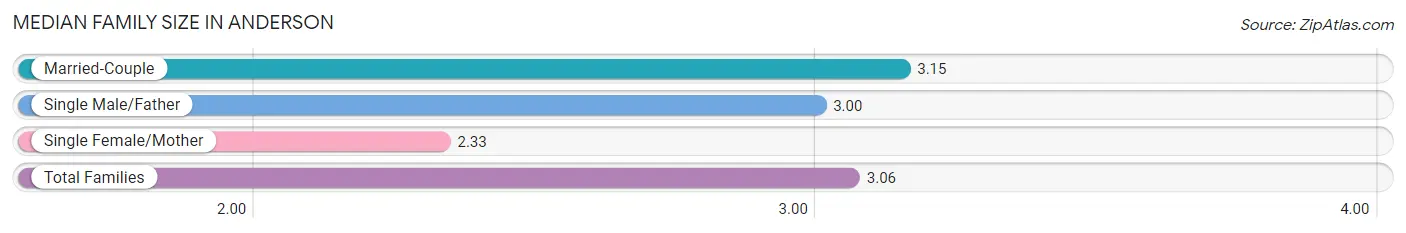
Median Family Size in Anderson
The median family size in Anderson is 3.06 persons per family, with married-couple families (27 | 81.8%) accounting for the largest median family size of 3.15 persons per family. On the other hand, single female/mother families (3 | 9.1%) represent the smallest median family size with 2.33 persons per family.
| Family Type | # Families | Family Size |
| Married-Couple | 27 (81.8%) | 3.15 |
| Single Male/Father | 3 (9.1%) | 3.00 |
| Single Female/Mother | 3 (9.1%) | 2.33 |
| Total Families | 33 (100.0%) | 3.06 |
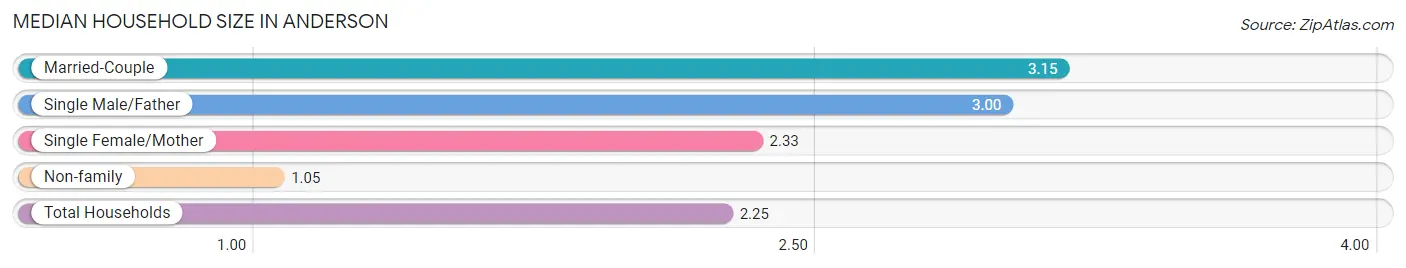
Median Household Size in Anderson
The median household size in Anderson is 2.25 persons per household, with married-couple households (27 | 49.1%) accounting for the largest median household size of 3.15 persons per household. non-family households (22 | 40.0%) represent the smallest median household size with 1.05 persons per household.
| Household Type | # Households | Household Size |
| Married-Couple | 27 (49.1%) | 3.15 |
| Single Male/Father | 3 (5.4%) | 3.00 |
| Single Female/Mother | 3 (5.4%) | 2.33 |
| Non-family | 22 (40.0%) | 1.05 |
| Total Households | 55 (100.0%) | 2.25 |
Household Size by Marriage Status in Anderson
Out of a total of 55 households in Anderson, 33 (60.0%) are family households, while 22 (40.0%) are nonfamily households. The most numerous type of family households are 2-person households, comprising 16, and the most common type of nonfamily households are 1-person households, comprising 19.
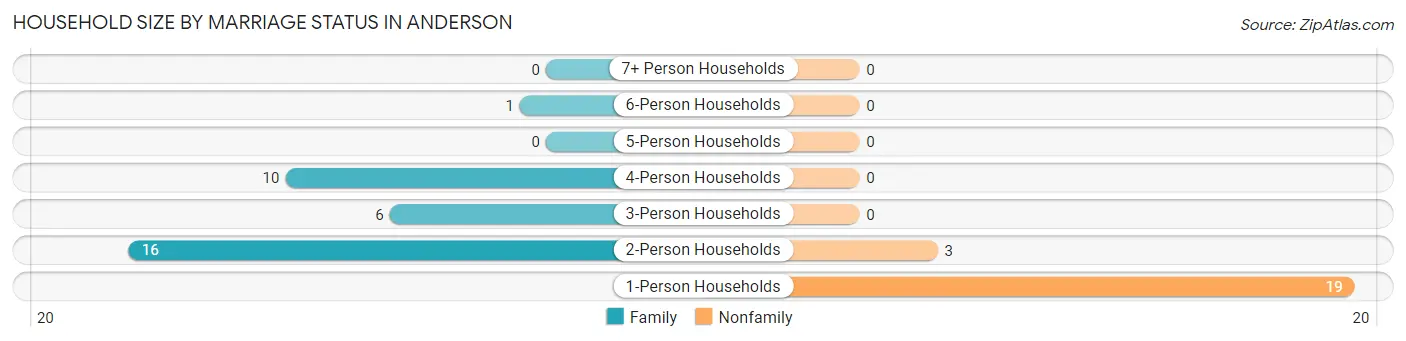
| Household Size | Family Households | Nonfamily Households |
| 1-Person Households | - | 19 (34.5%) |
| 2-Person Households | 16 (29.1%) | 3 (5.4%) |
| 3-Person Households | 6 (10.9%) | 0 (0.0%) |
| 4-Person Households | 10 (18.2%) | 0 (0.0%) |
| 5-Person Households | 0 (0.0%) | 0 (0.0%) |
| 6-Person Households | 1 (1.8%) | 0 (0.0%) |
| 7+ Person Households | 0 (0.0%) | 0 (0.0%) |
| Total | 33 (60.0%) | 22 (40.0%) |
Female Fertility in Anderson
Fertility by Age in Anderson
| Age Bracket | Women with Births | Births / 1,000 Women |
| 15 to 19 years | 0 (0.0%) | 0.0 |
| 20 to 34 years | 0 (0.0%) | 0.0 |
| 35 to 50 years | 0 (0.0%) | 0.0 |
| Total | 0 (0.0%) | 0.0 |
Fertility by Age by Marriage Status in Anderson
| Age Bracket | Married | Unmarried |
| 15 to 19 years | 0 (0.0%) | 0 (0.0%) |
| 20 to 34 years | 0 (0.0%) | 0 (0.0%) |
| 35 to 50 years | 0 (0.0%) | 0 (0.0%) |
| Total | 0 (0.0%) | 0 (0.0%) |
Fertility by Education in Anderson
| Educational Attainment | Women with Births | Births / 1,000 Women |
| Less than High School | 0 (0.0%) | 0.0 |
| High School Diploma | 0 (0.0%) | 0.0 |
| College or Associate's Degree | 0 (0.0%) | 0.0 |
| Bachelor's Degree | 0 (0.0%) | 0.0 |
| Graduate Degree | 0 (0.0%) | 0.0 |
| Total | 0 (0.0%) | 0.0 |
Fertility by Education by Marriage Status in Anderson
| Educational Attainment | Married | Unmarried |
| Less than High School | 0 (0.0%) | 0 (0.0%) |
| High School Diploma | 0 (0.0%) | 0 (0.0%) |
| College or Associate's Degree | 0 (0.0%) | 0 (0.0%) |
| Bachelor's Degree | 0 (0.0%) | 0 (0.0%) |
| Graduate Degree | 0 (0.0%) | 0 (0.0%) |
| Total | 0 (0.0%) | 0 (0.0%) |
Employment Characteristics in Anderson
Employment by Class of Employer in Anderson
Among the 96 employed individuals in Anderson, federal government employees (57 | 59.4%), private company employees (15 | 15.6%), and not-for-profit organizations (15 | 15.6%) make up the most common classes of employment.
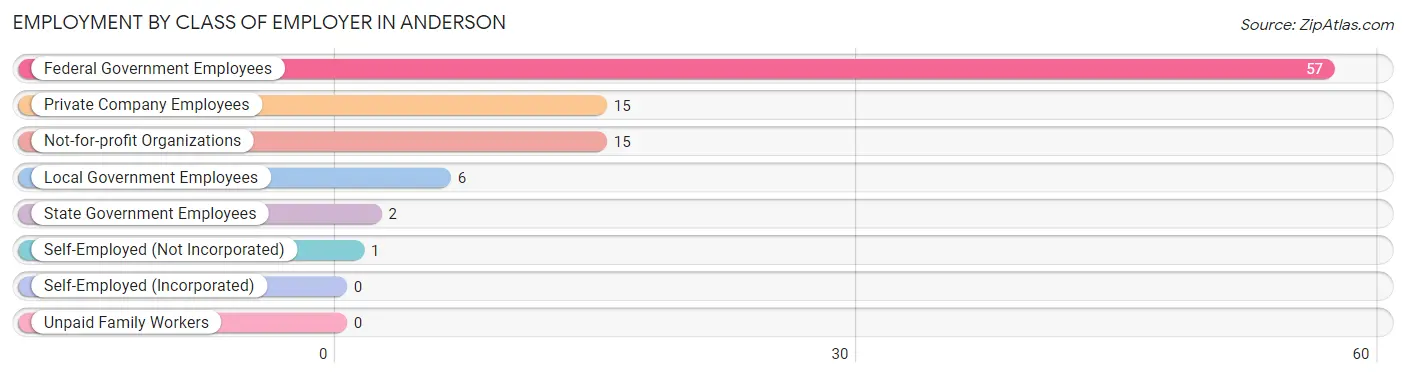
| Employer Class | # Employees | % Employees |
| Private Company Employees | 15 | 15.6% |
| Self-Employed (Incorporated) | 0 | 0.0% |
| Self-Employed (Not Incorporated) | 1 | 1.0% |
| Not-for-profit Organizations | 15 | 15.6% |
| Local Government Employees | 6 | 6.2% |
| State Government Employees | 2 | 2.1% |
| Federal Government Employees | 57 | 59.4% |
| Unpaid Family Workers | 0 | 0.0% |
| Total | 96 | 100.0% |
Employment Status by Age in Anderson
According to the labor force statistics for Anderson, out of the total population over 16 years of age (141), 70.2% or 99 individuals are in the labor force, with 6.0% or 6 of them unemployed. The age group with the highest labor force participation rate is 35 to 44 years, with 100.0% or 22 individuals in the labor force. Within the labor force, the 65 to 74 years age range has the highest percentage of unemployed individuals, with 100.0% or 2 of them being unemployed.
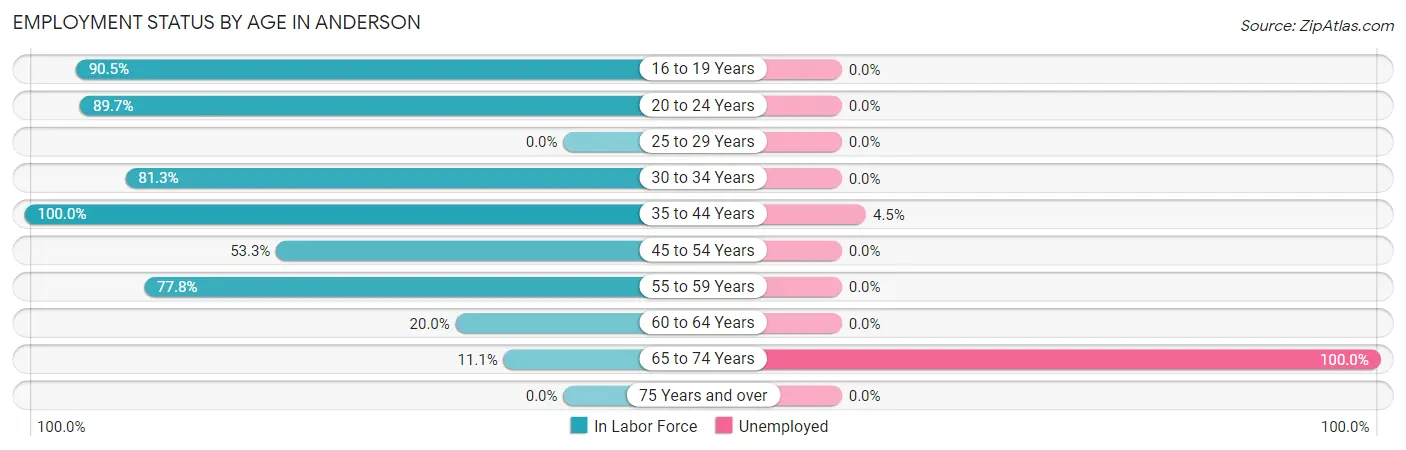
| Age Bracket | In Labor Force | Unemployed |
| 16 to 19 Years | 19 (90.5%) | 0 (0.0%) |
| 20 to 24 Years | 26 (89.7%) | 0 (0.0%) |
| 25 to 29 Years | 0 (0.0%) | 0 (0.0%) |
| 30 to 34 Years | 13 (81.3%) | 0 (0.0%) |
| 35 to 44 Years | 22 (100.0%) | 1 (4.5%) |
| 45 to 54 Years | 8 (53.3%) | 0 (0.0%) |
| 55 to 59 Years | 7 (77.8%) | 0 (0.0%) |
| 60 to 64 Years | 2 (20.0%) | 0 (0.0%) |
| 65 to 74 Years | 2 (11.1%) | 2 (100.0%) |
| 75 Years and over | 0 (0.0%) | 0 (0.0%) |
| Total | 99 (70.2%) | 6 (6.0%) |
Employment Status by Educational Attainment in Anderson
According to labor force statistics for Anderson, 72.2% of individuals (52) out of the total population between 25 and 64 years of age (72) are in the labor force, with 2.3% or 1 of them being unemployed. The group with the highest labor force participation rate are those with the educational attainment of college / associate degree, with 83.7% or 36 individuals in the labor force. Within the labor force, individuals with college / associate degree education have the highest percentage of unemployment, with 3.7% or 1 of them being unemployed.
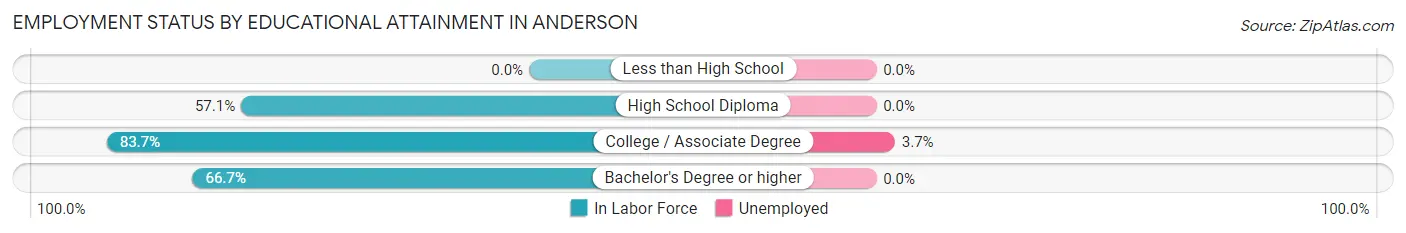
| Educational Attainment | In Labor Force | Unemployed |
| Less than High School | 0 (0.0%) | 0 (0.0%) |
| High School Diploma | 12 (57.1%) | 0 (0.0%) |
| College / Associate Degree | 36 (83.7%) | 2 (3.7%) |
| Bachelor's Degree or higher | 4 (66.7%) | 0 (0.0%) |
| Total | 52 (72.2%) | 2 (2.3%) |
Employment Occupations by Sex in Anderson
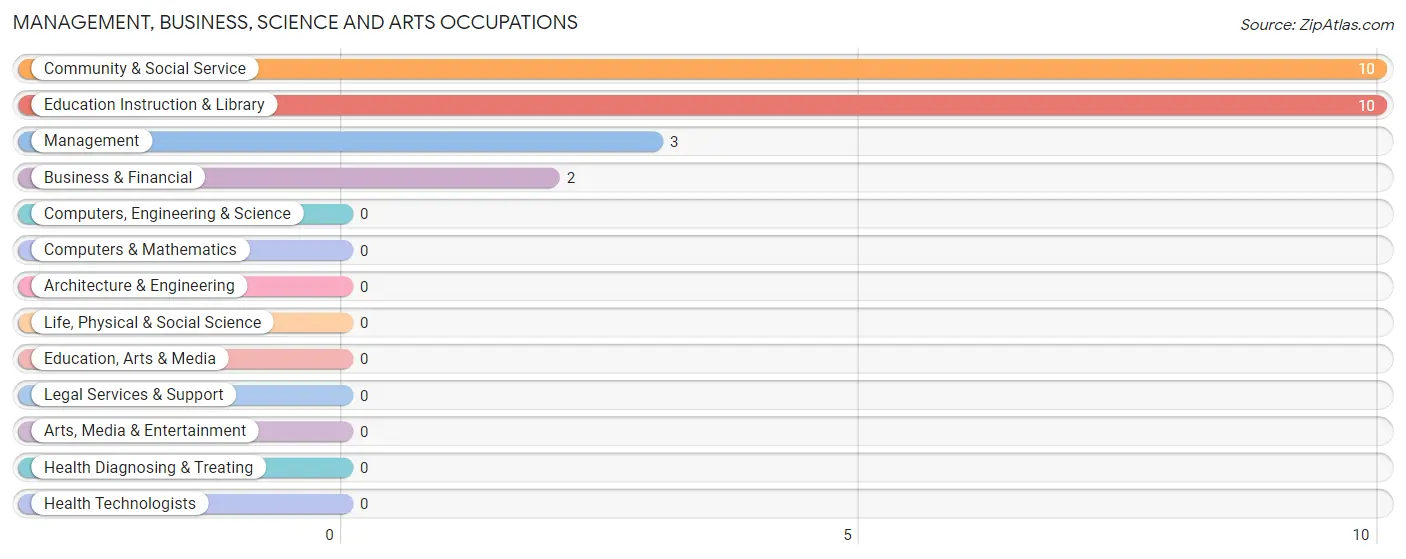
Management, Business, Science and Arts Occupations
The most common Management, Business, Science and Arts occupations in Anderson are Community & Social Service (10 | 21.3%), Education Instruction & Library (10 | 21.3%), Management (3 | 6.4%), and Business & Financial (2 | 4.3%).
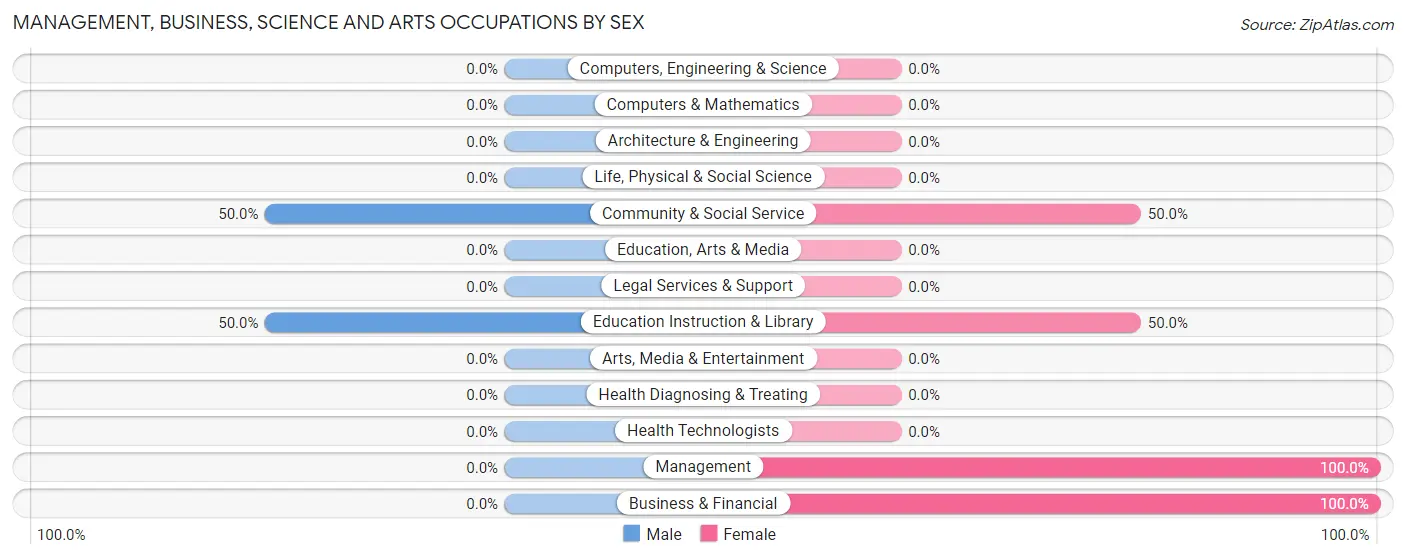
Management, Business, Science and Arts Occupations by Sex
Within the Management, Business, Science and Arts occupations in Anderson, the most male-oriented occupations are Community & Social Service (50.0%), and Education Instruction & Library (50.0%), while the most female-oriented occupations are Management (100.0%), Business & Financial (100.0%), and Community & Social Service (50.0%).
| Occupation | Male | Female |
| Management | 0 (0.0%) | 3 (100.0%) |
| Business & Financial | 0 (0.0%) | 2 (100.0%) |
| Computers, Engineering & Science | 0 (0.0%) | 0 (0.0%) |
| Computers & Mathematics | 0 (0.0%) | 0 (0.0%) |
| Architecture & Engineering | 0 (0.0%) | 0 (0.0%) |
| Life, Physical & Social Science | 0 (0.0%) | 0 (0.0%) |
| Community & Social Service | 5 (50.0%) | 5 (50.0%) |
| Education, Arts & Media | 0 (0.0%) | 0 (0.0%) |
| Legal Services & Support | 0 (0.0%) | 0 (0.0%) |
| Education Instruction & Library | 5 (50.0%) | 5 (50.0%) |
| Arts, Media & Entertainment | 0 (0.0%) | 0 (0.0%) |
| Health Diagnosing & Treating | 0 (0.0%) | 0 (0.0%) |
| Health Technologists | 0 (0.0%) | 0 (0.0%) |
| Total (Category) | 5 (33.3%) | 10 (66.7%) |
| Total (Overall) | 21 (44.7%) | 26 (55.3%) |
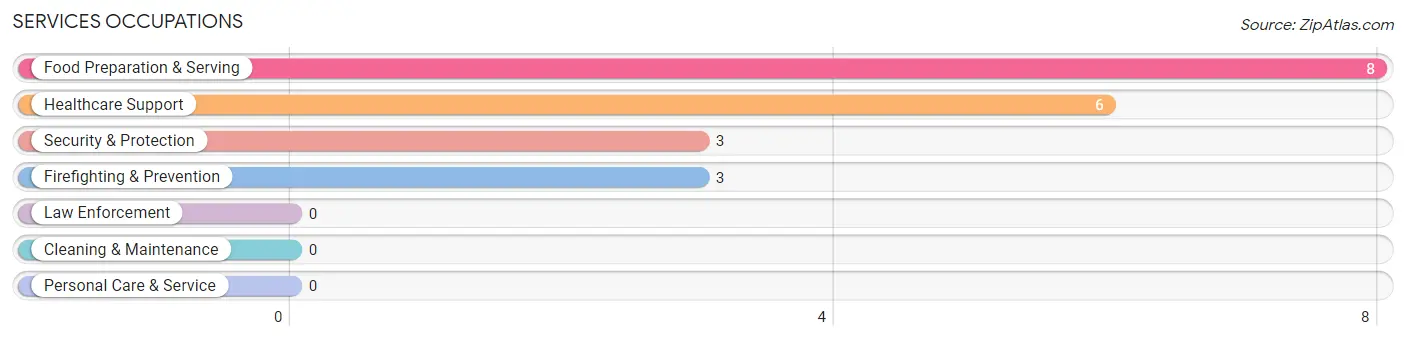
Services Occupations
The most common Services occupations in Anderson are Food Preparation & Serving (8 | 17.0%), Healthcare Support (6 | 12.8%), Security & Protection (3 | 6.4%), and Firefighting & Prevention (3 | 6.4%).
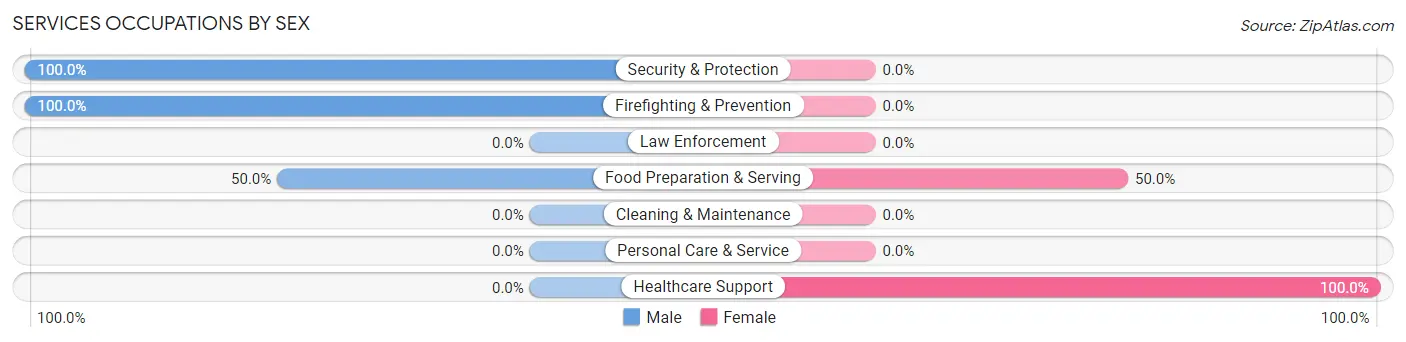
Services Occupations by Sex
Within the Services occupations in Anderson, the most male-oriented occupations are Security & Protection (100.0%), Firefighting & Prevention (100.0%), and Food Preparation & Serving (50.0%), while the most female-oriented occupations are Healthcare Support (100.0%), and Food Preparation & Serving (50.0%).
| Occupation | Male | Female |
| Healthcare Support | 0 (0.0%) | 6 (100.0%) |
| Security & Protection | 3 (100.0%) | 0 (0.0%) |
| Firefighting & Prevention | 3 (100.0%) | 0 (0.0%) |
| Law Enforcement | 0 (0.0%) | 0 (0.0%) |
| Food Preparation & Serving | 4 (50.0%) | 4 (50.0%) |
| Cleaning & Maintenance | 0 (0.0%) | 0 (0.0%) |
| Personal Care & Service | 0 (0.0%) | 0 (0.0%) |
| Total (Category) | 7 (41.2%) | 10 (58.8%) |
| Total (Overall) | 21 (44.7%) | 26 (55.3%) |
Sales and Office Occupations
The most common Sales and Office occupations in Anderson are Office & Administration (6 | 12.8%), and Sales & Related (1 | 2.1%).
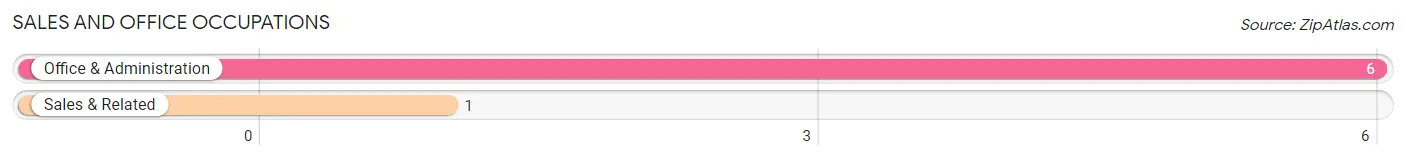
Sales and Office Occupations by Sex
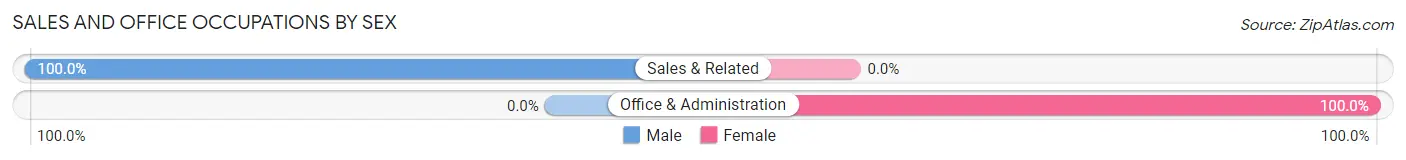
| Occupation | Male | Female |
| Sales & Related | 1 (100.0%) | 0 (0.0%) |
| Office & Administration | 0 (0.0%) | 6 (100.0%) |
| Total (Category) | 1 (14.3%) | 6 (85.7%) |
| Total (Overall) | 21 (44.7%) | 26 (55.3%) |
Natural Resources, Construction and Maintenance Occupations
The most common Natural Resources, Construction and Maintenance occupations in Anderson are Construction & Extraction (3 | 6.4%), and Installation, Maintenance & Repair (2 | 4.3%).
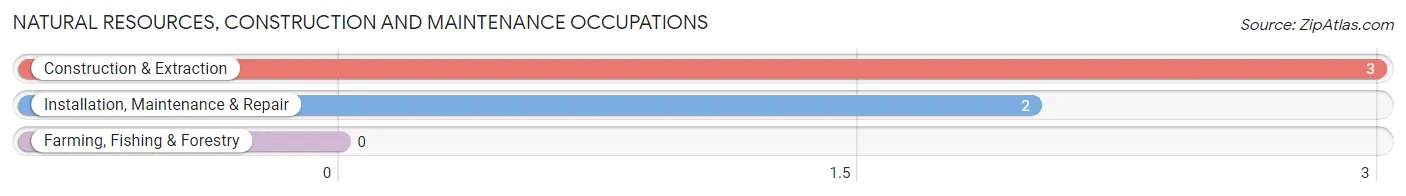
Natural Resources, Construction and Maintenance Occupations by Sex
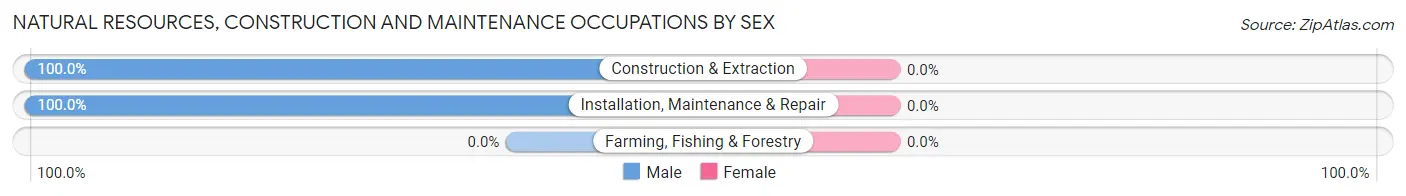
| Occupation | Male | Female |
| Farming, Fishing & Forestry | 0 (0.0%) | 0 (0.0%) |
| Construction & Extraction | 3 (100.0%) | 0 (0.0%) |
| Installation, Maintenance & Repair | 2 (100.0%) | 0 (0.0%) |
| Total (Category) | 5 (100.0%) | 0 (0.0%) |
| Total (Overall) | 21 (44.7%) | 26 (55.3%) |
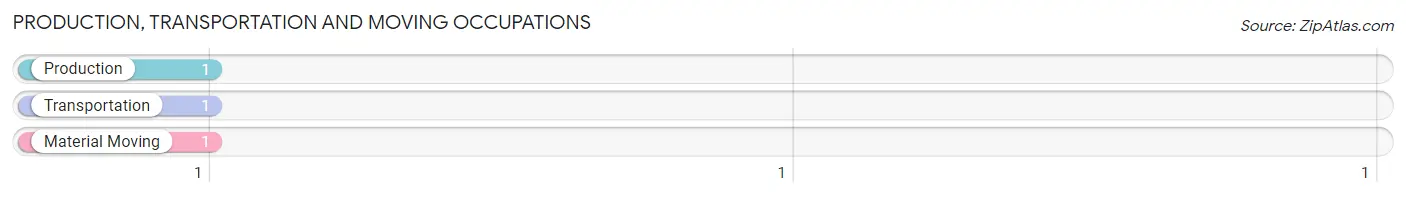
Production, Transportation and Moving Occupations
The most common Production, Transportation and Moving occupations in Anderson are Production (1 | 2.1%), Transportation (1 | 2.1%), and Material Moving (1 | 2.1%).
Production, Transportation and Moving Occupations by Sex
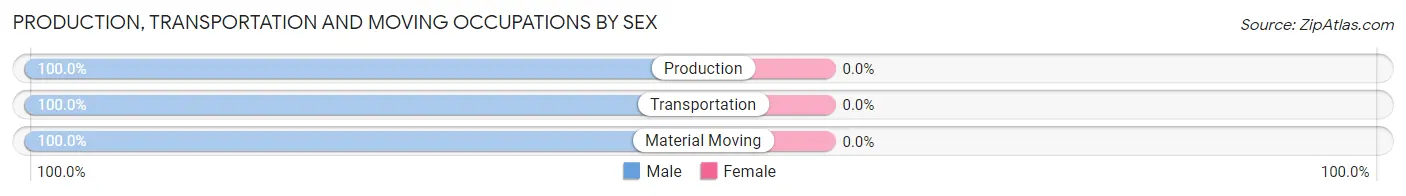
| Occupation | Male | Female |
| Production | 1 (100.0%) | 0 (0.0%) |
| Transportation | 1 (100.0%) | 0 (0.0%) |
| Material Moving | 1 (100.0%) | 0 (0.0%) |
| Total (Category) | 3 (100.0%) | 0 (0.0%) |
| Total (Overall) | 21 (44.7%) | 26 (55.3%) |
Employment Industries by Sex in Anderson
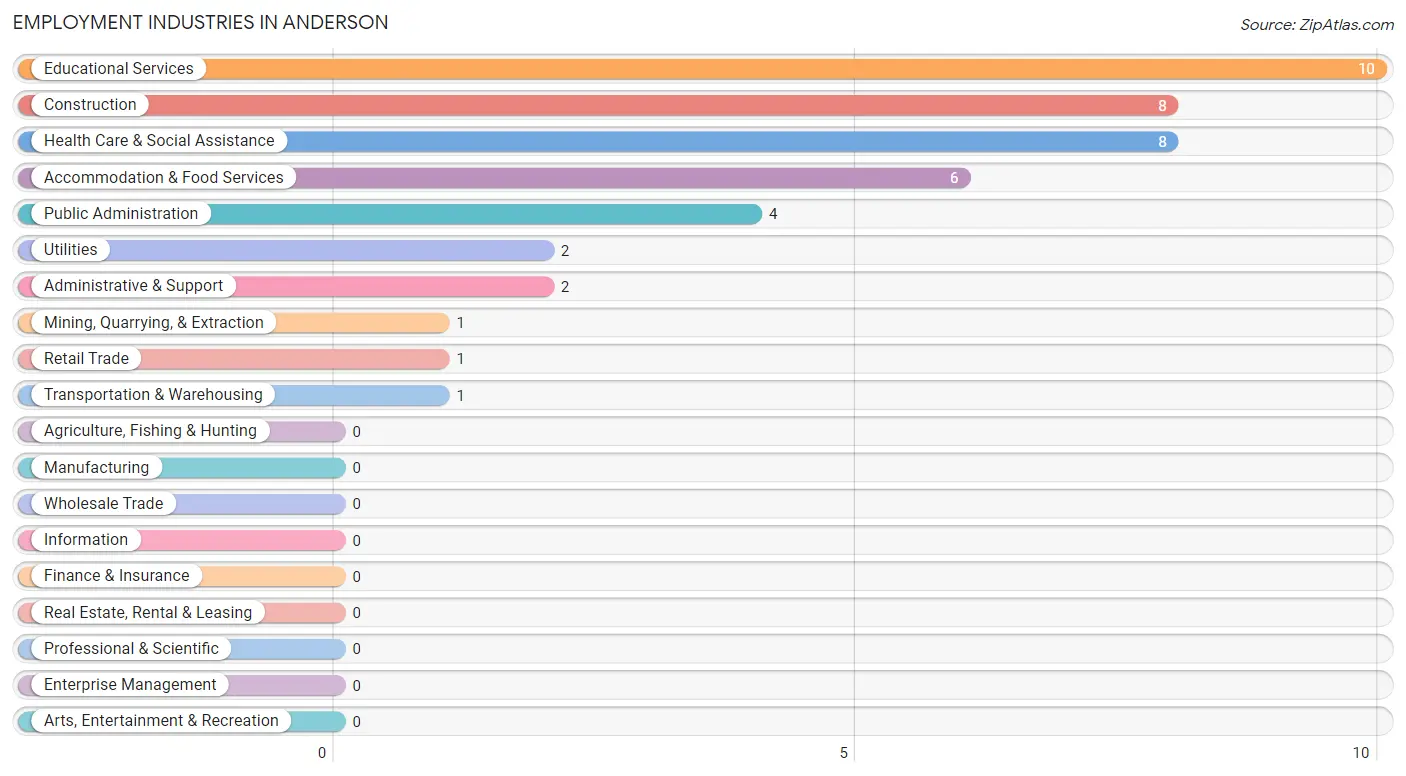
Employment Industries in Anderson
The major employment industries in Anderson include Educational Services (10 | 21.3%), Construction (8 | 17.0%), Health Care & Social Assistance (8 | 17.0%), Accommodation & Food Services (6 | 12.8%), and Public Administration (4 | 8.5%).
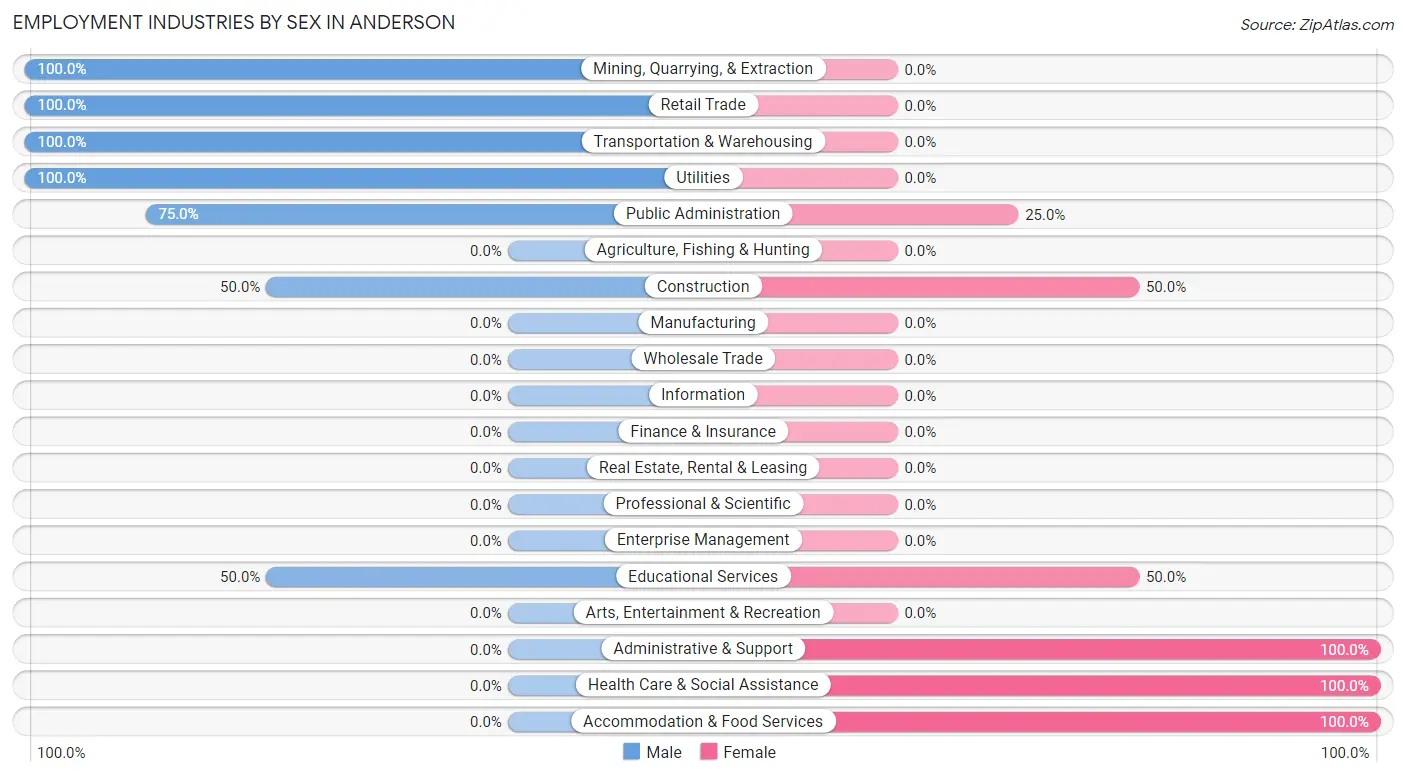
Employment Industries by Sex in Anderson
The Anderson industries that see more men than women are Mining, Quarrying, & Extraction (100.0%), Retail Trade (100.0%), and Transportation & Warehousing (100.0%), whereas the industries that tend to have a higher number of women are Administrative & Support (100.0%), Health Care & Social Assistance (100.0%), and Accommodation & Food Services (100.0%).
| Industry | Male | Female |
| Agriculture, Fishing & Hunting | 0 (0.0%) | 0 (0.0%) |
| Mining, Quarrying, & Extraction | 1 (100.0%) | 0 (0.0%) |
| Construction | 4 (50.0%) | 4 (50.0%) |
| Manufacturing | 0 (0.0%) | 0 (0.0%) |
| Wholesale Trade | 0 (0.0%) | 0 (0.0%) |
| Retail Trade | 1 (100.0%) | 0 (0.0%) |
| Transportation & Warehousing | 1 (100.0%) | 0 (0.0%) |
| Utilities | 2 (100.0%) | 0 (0.0%) |
| Information | 0 (0.0%) | 0 (0.0%) |
| Finance & Insurance | 0 (0.0%) | 0 (0.0%) |
| Real Estate, Rental & Leasing | 0 (0.0%) | 0 (0.0%) |
| Professional & Scientific | 0 (0.0%) | 0 (0.0%) |
| Enterprise Management | 0 (0.0%) | 0 (0.0%) |
| Administrative & Support | 0 (0.0%) | 2 (100.0%) |
| Educational Services | 5 (50.0%) | 5 (50.0%) |
| Health Care & Social Assistance | 0 (0.0%) | 8 (100.0%) |
| Arts, Entertainment & Recreation | 0 (0.0%) | 0 (0.0%) |
| Accommodation & Food Services | 0 (0.0%) | 6 (100.0%) |
| Public Administration | 3 (75.0%) | 1 (25.0%) |
| Total | 21 (44.7%) | 26 (55.3%) |
Education in Anderson
School Enrollment in Anderson
The most common levels of schooling among the 44 students in Anderson are middle school (14 | 31.8%), elementary school (12 | 27.3%), and high school (8 | 18.2%).
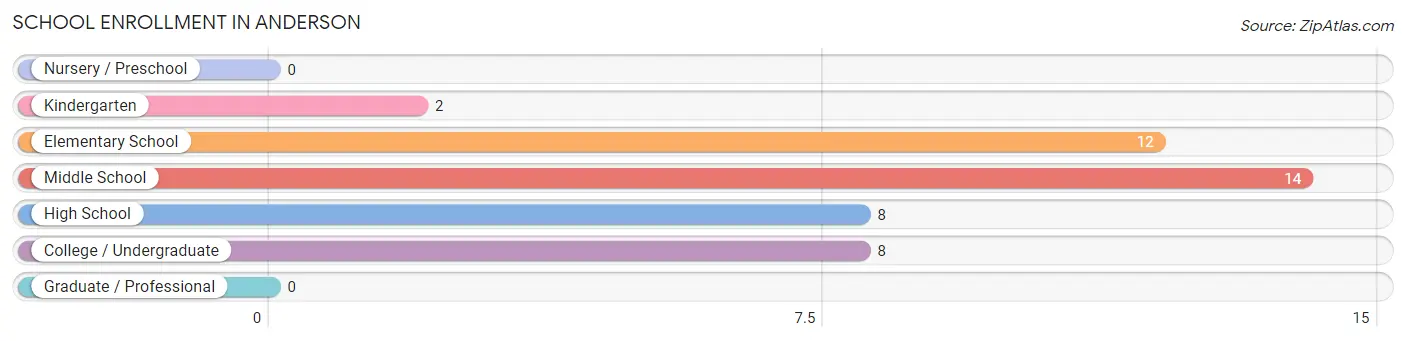
| School Level | # Students | % Students |
| Nursery / Preschool | 0 | 0.0% |
| Kindergarten | 2 | 4.5% |
| Elementary School | 12 | 27.3% |
| Middle School | 14 | 31.8% |
| High School | 8 | 18.2% |
| College / Undergraduate | 8 | 18.2% |
| Graduate / Professional | 0 | 0.0% |
| Total | 44 | 100.0% |
School Enrollment by Age by Funding Source in Anderson
Out of a total of 44 students who are enrolled in schools in Anderson, 15 (34.1%) attend a private institution, while the remaining 29 (65.9%) are enrolled in public schools. The age group of 20 to 24 year olds has the highest likelihood of being enrolled in private schools, with 8 (100.0% in the age bracket) enrolled. Conversely, the age group of 15 to 17 year olds has the lowest likelihood of being enrolled in a private school, with 8 (100.0% in the age bracket) attending a public institution.
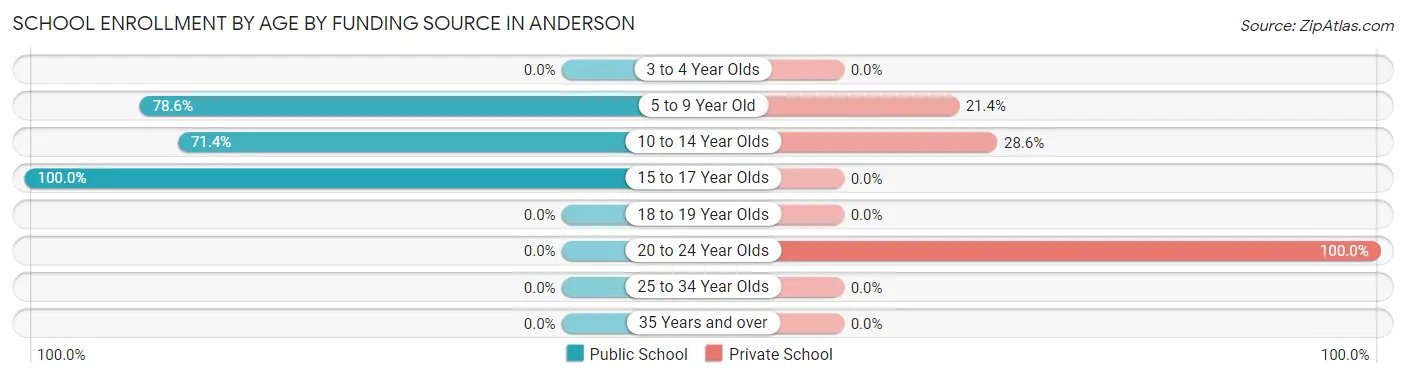
| Age Bracket | Public School | Private School |
| 3 to 4 Year Olds | 0 (0.0%) | 0 (0.0%) |
| 5 to 9 Year Old | 11 (78.6%) | 3 (21.4%) |
| 10 to 14 Year Olds | 10 (71.4%) | 4 (28.6%) |
| 15 to 17 Year Olds | 8 (100.0%) | 0 (0.0%) |
| 18 to 19 Year Olds | 0 (0.0%) | 0 (0.0%) |
| 20 to 24 Year Olds | 0 (0.0%) | 8 (100.0%) |
| 25 to 34 Year Olds | 0 (0.0%) | 0 (0.0%) |
| 35 Years and over | 0 (0.0%) | 0 (0.0%) |
| Total | 29 (65.9%) | 15 (34.1%) |
Educational Attainment by Field of Study in Anderson
Engineering (4 | 25.0%), arts & humanities (4 | 25.0%), visual & performing arts (3 | 18.8%), bio, nature & agricultural (2 | 12.5%), and physical & health sciences (2 | 12.5%) are the most common fields of study among 16 individuals in Anderson who have obtained a bachelor's degree or higher.
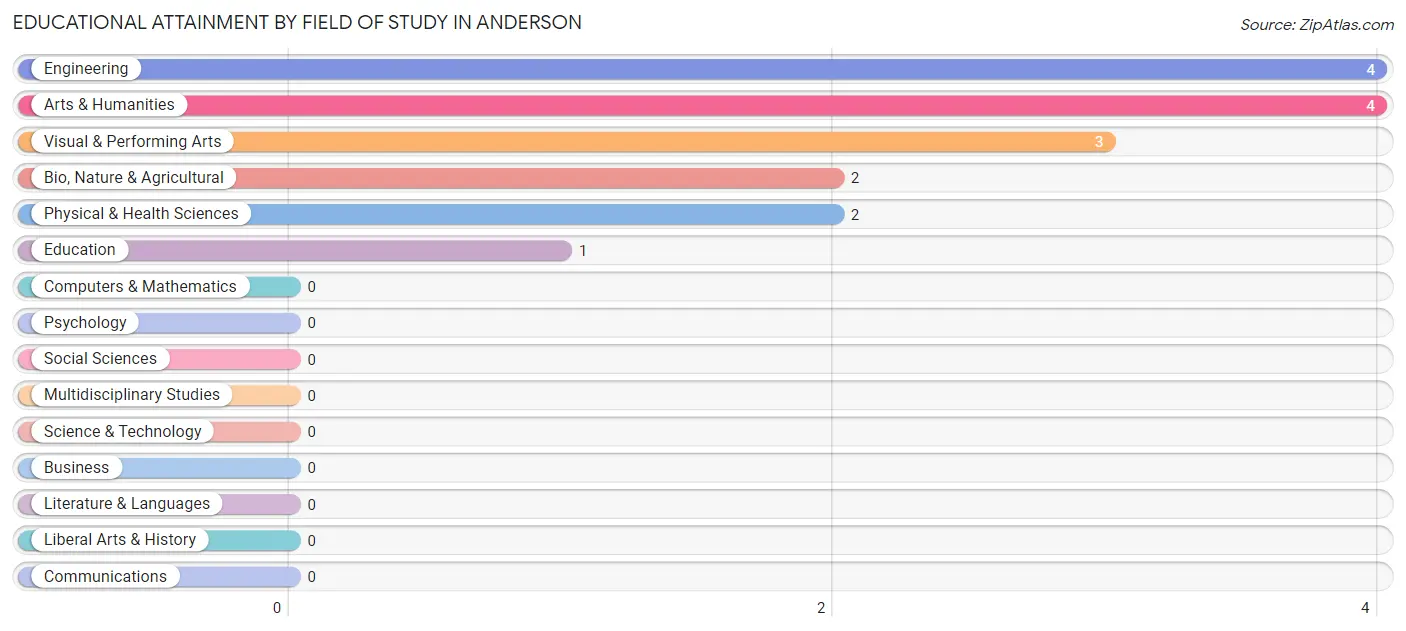
| Field of Study | # Graduates | % Graduates |
| Computers & Mathematics | 0 | 0.0% |
| Bio, Nature & Agricultural | 2 | 12.5% |
| Physical & Health Sciences | 2 | 12.5% |
| Psychology | 0 | 0.0% |
| Social Sciences | 0 | 0.0% |
| Engineering | 4 | 25.0% |
| Multidisciplinary Studies | 0 | 0.0% |
| Science & Technology | 0 | 0.0% |
| Business | 0 | 0.0% |
| Education | 1 | 6.2% |
| Literature & Languages | 0 | 0.0% |
| Liberal Arts & History | 0 | 0.0% |
| Visual & Performing Arts | 3 | 18.8% |
| Communications | 0 | 0.0% |
| Arts & Humanities | 4 | 25.0% |
| Total | 16 | 100.0% |
Transportation & Commute in Anderson
Vehicle Availability by Sex in Anderson
The most prevalent vehicle ownership categories in Anderson are males with 2 vehicles (14, accounting for 66.7%) and females with 2 vehicles (11, making up 53.8%).
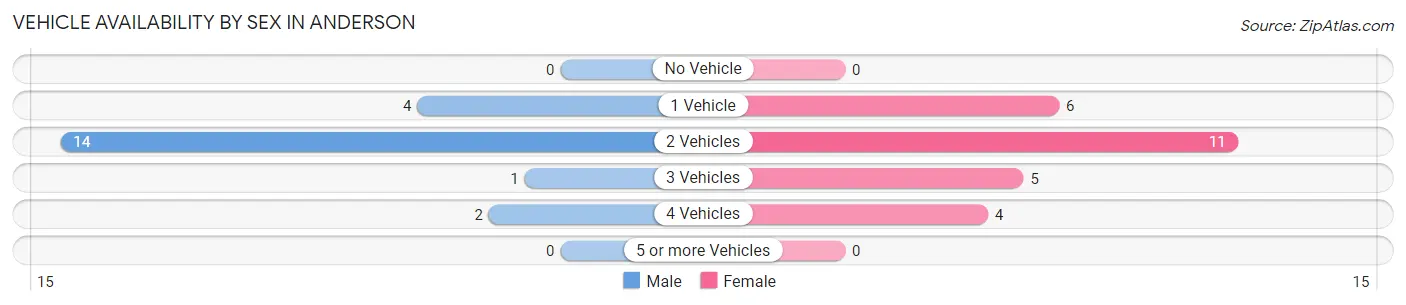
| Vehicles Available | Male | Female |
| No Vehicle | 0 (0.0%) | 0 (0.0%) |
| 1 Vehicle | 4 (19.1%) | 6 (23.1%) |
| 2 Vehicles | 14 (66.7%) | 11 (42.3%) |
| 3 Vehicles | 1 (4.8%) | 5 (19.2%) |
| 4 Vehicles | 2 (9.5%) | 4 (15.4%) |
| 5 or more Vehicles | 0 (0.0%) | 0 (0.0%) |
| Total | 21 (100.0%) | 26 (100.0%) |
Commute Time in Anderson
The most frequently occuring commute durations in Anderson are 5 to 9 minutes (41 commuters, 43.2%), less than 5 minutes (17 commuters, 17.9%), and 10 to 14 minutes (17 commuters, 17.9%).
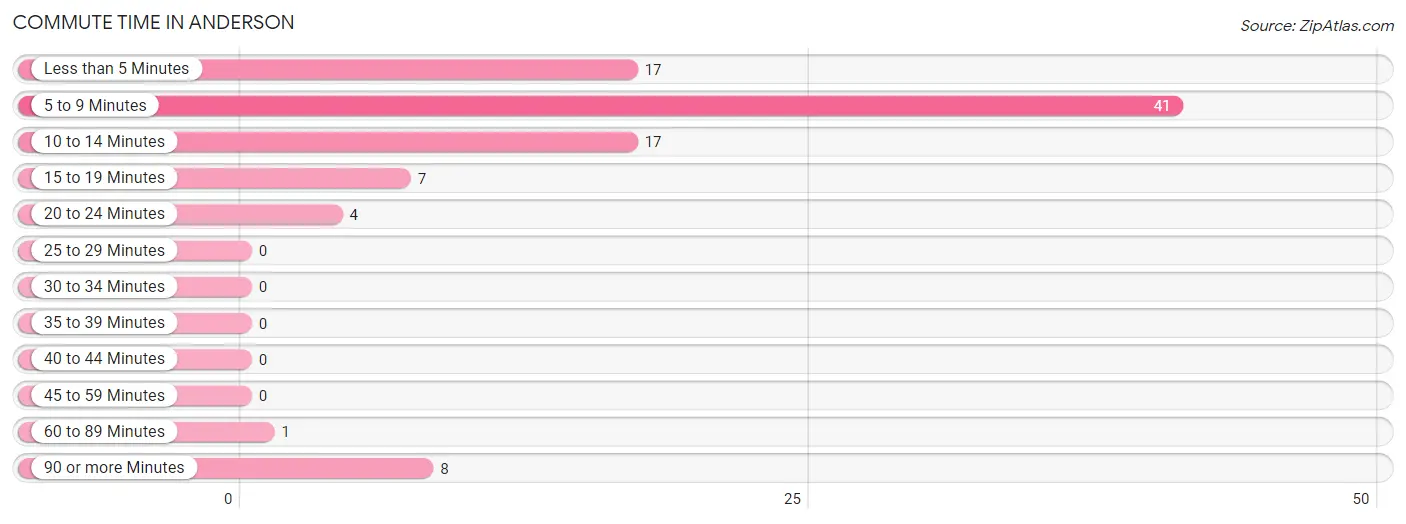
| Commute Time | # Commuters | % Commuters |
| Less than 5 Minutes | 17 | 17.9% |
| 5 to 9 Minutes | 41 | 43.2% |
| 10 to 14 Minutes | 17 | 17.9% |
| 15 to 19 Minutes | 7 | 7.4% |
| 20 to 24 Minutes | 4 | 4.2% |
| 25 to 29 Minutes | 0 | 0.0% |
| 30 to 34 Minutes | 0 | 0.0% |
| 35 to 39 Minutes | 0 | 0.0% |
| 40 to 44 Minutes | 0 | 0.0% |
| 45 to 59 Minutes | 0 | 0.0% |
| 60 to 89 Minutes | 1 | 1.1% |
| 90 or more Minutes | 8 | 8.4% |
Commute Time by Sex in Anderson
The most common commute times in Anderson are 5 to 9 minutes (37 commuters, 52.9%) for males and 10 to 14 minutes (8 commuters, 32.0%) for females.
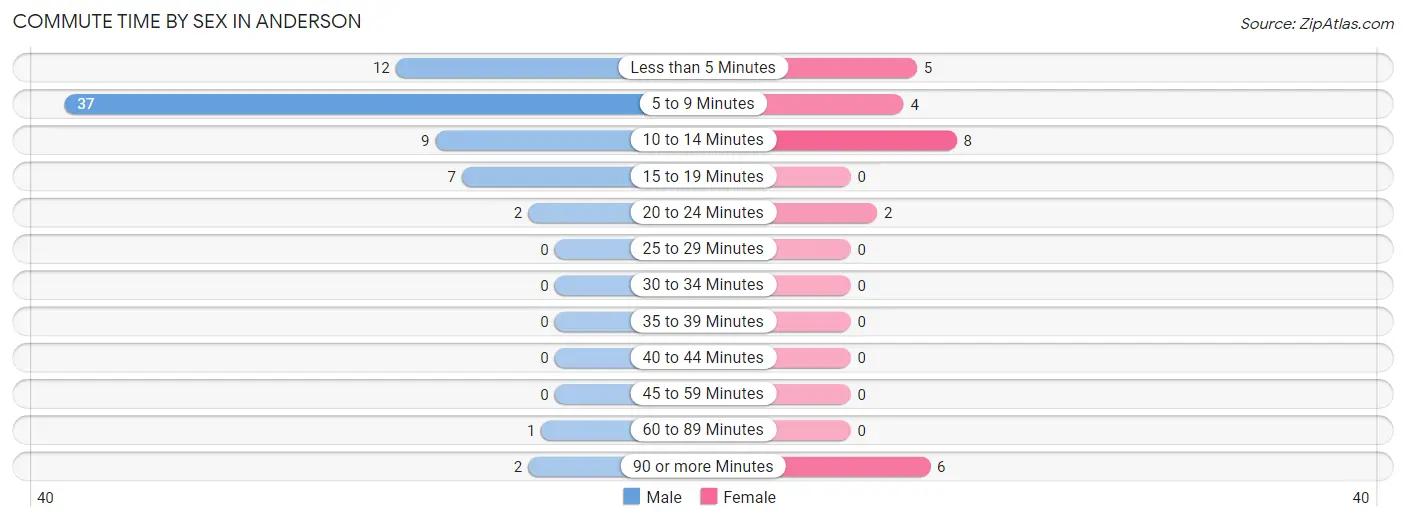
| Commute Time | Male | Female |
| Less than 5 Minutes | 12 (17.1%) | 5 (20.0%) |
| 5 to 9 Minutes | 37 (52.9%) | 4 (16.0%) |
| 10 to 14 Minutes | 9 (12.9%) | 8 (32.0%) |
| 15 to 19 Minutes | 7 (10.0%) | 0 (0.0%) |
| 20 to 24 Minutes | 2 (2.9%) | 2 (8.0%) |
| 25 to 29 Minutes | 0 (0.0%) | 0 (0.0%) |
| 30 to 34 Minutes | 0 (0.0%) | 0 (0.0%) |
| 35 to 39 Minutes | 0 (0.0%) | 0 (0.0%) |
| 40 to 44 Minutes | 0 (0.0%) | 0 (0.0%) |
| 45 to 59 Minutes | 0 (0.0%) | 0 (0.0%) |
| 60 to 89 Minutes | 1 (1.4%) | 0 (0.0%) |
| 90 or more Minutes | 2 (2.9%) | 6 (24.0%) |
Time of Departure to Work by Sex in Anderson
The most frequent times of departure to work in Anderson are 7:00 AM to 7:29 AM (16, 22.9%) for males and 5:00 AM to 5:29 AM (5, 20.0%) for females.
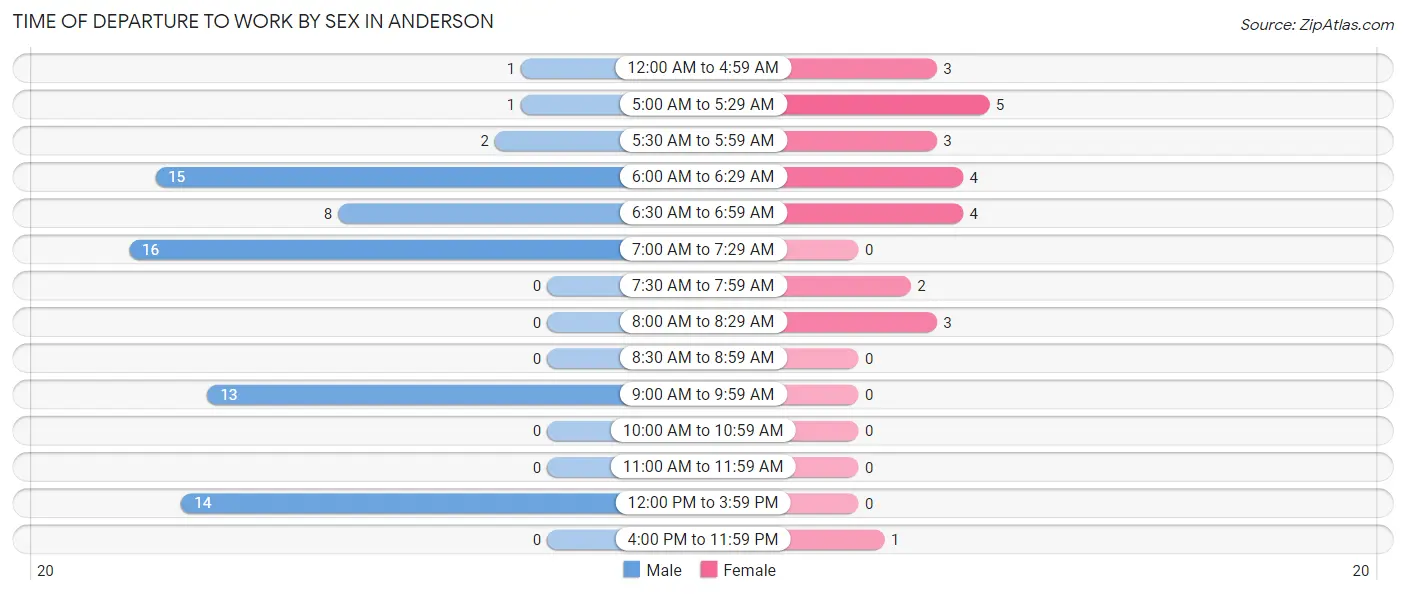
| Time of Departure | Male | Female |
| 12:00 AM to 4:59 AM | 1 (1.4%) | 3 (12.0%) |
| 5:00 AM to 5:29 AM | 1 (1.4%) | 5 (20.0%) |
| 5:30 AM to 5:59 AM | 2 (2.9%) | 3 (12.0%) |
| 6:00 AM to 6:29 AM | 15 (21.4%) | 4 (16.0%) |
| 6:30 AM to 6:59 AM | 8 (11.4%) | 4 (16.0%) |
| 7:00 AM to 7:29 AM | 16 (22.9%) | 0 (0.0%) |
| 7:30 AM to 7:59 AM | 0 (0.0%) | 2 (8.0%) |
| 8:00 AM to 8:29 AM | 0 (0.0%) | 3 (12.0%) |
| 8:30 AM to 8:59 AM | 0 (0.0%) | 0 (0.0%) |
| 9:00 AM to 9:59 AM | 13 (18.6%) | 0 (0.0%) |
| 10:00 AM to 10:59 AM | 0 (0.0%) | 0 (0.0%) |
| 11:00 AM to 11:59 AM | 0 (0.0%) | 0 (0.0%) |
| 12:00 PM to 3:59 PM | 14 (20.0%) | 0 (0.0%) |
| 4:00 PM to 11:59 PM | 0 (0.0%) | 1 (4.0%) |
| Total | 70 (100.0%) | 25 (100.0%) |
Housing Occupancy in Anderson
Occupancy by Ownership in Anderson
Of the total 55 dwellings in Anderson, owner-occupied units account for 50 (90.9%), while renter-occupied units make up 5 (9.1%).
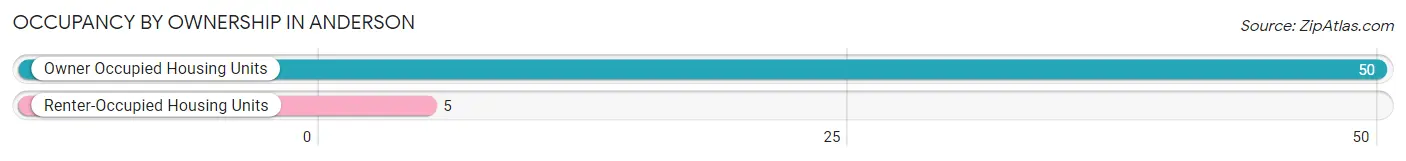
| Occupancy | # Housing Units | % Housing Units |
| Owner Occupied Housing Units | 50 | 90.9% |
| Renter-Occupied Housing Units | 5 | 9.1% |
| Total Occupied Housing Units | 55 | 100.0% |
Occupancy by Household Size in Anderson
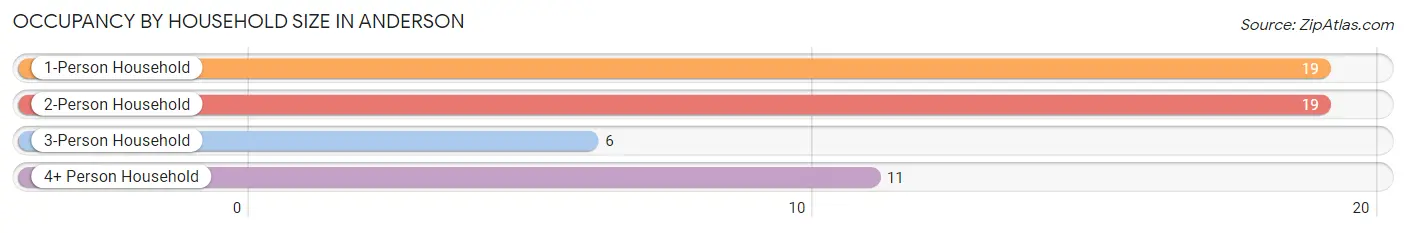
| Household Size | # Housing Units | % Housing Units |
| 1-Person Household | 19 | 34.5% |
| 2-Person Household | 19 | 34.5% |
| 3-Person Household | 6 | 10.9% |
| 4+ Person Household | 11 | 20.0% |
| Total Housing Units | 55 | 100.0% |
Occupancy by Ownership by Household Size in Anderson
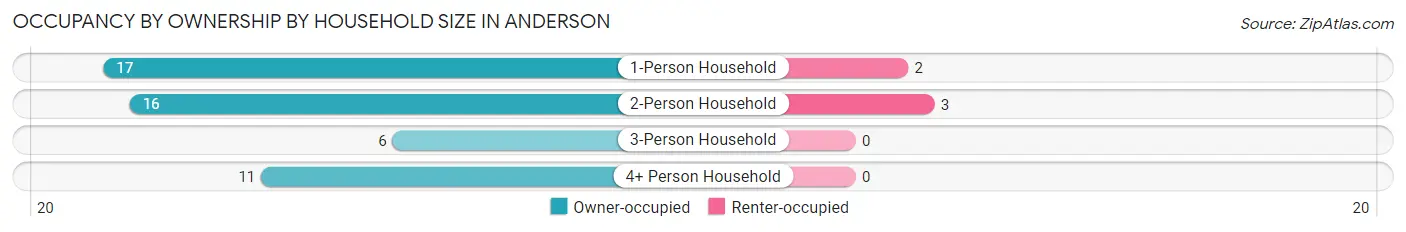
| Household Size | Owner-occupied | Renter-occupied |
| 1-Person Household | 17 (89.5%) | 2 (10.5%) |
| 2-Person Household | 16 (84.2%) | 3 (15.8%) |
| 3-Person Household | 6 (100.0%) | 0 (0.0%) |
| 4+ Person Household | 11 (100.0%) | 0 (0.0%) |
| Total Housing Units | 50 (90.9%) | 5 (9.1%) |
Occupancy by Educational Attainment in Anderson
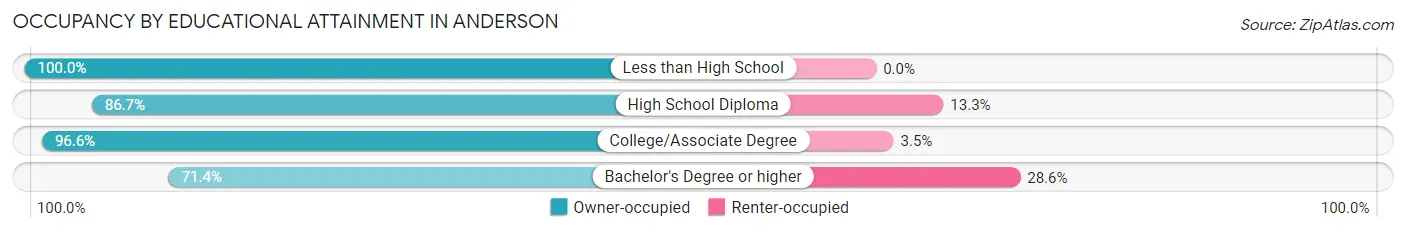
| Household Size | Owner-occupied | Renter-occupied |
| Less than High School | 4 (100.0%) | 0 (0.0%) |
| High School Diploma | 13 (86.7%) | 2 (13.3%) |
| College/Associate Degree | 28 (96.6%) | 1 (3.5%) |
| Bachelor's Degree or higher | 5 (71.4%) | 2 (28.6%) |
Occupancy by Age of Householder in Anderson
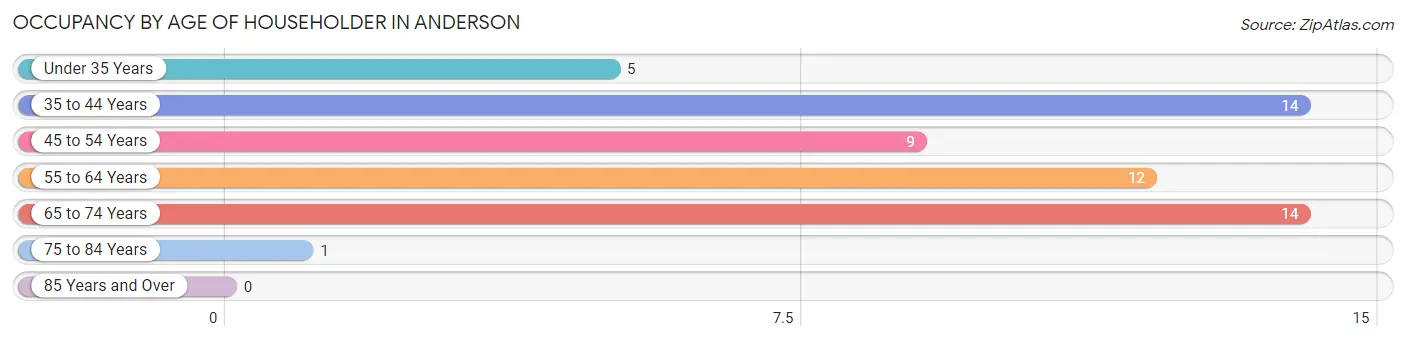
| Age Bracket | # Households | % Households |
| Under 35 Years | 5 | 9.1% |
| 35 to 44 Years | 14 | 25.5% |
| 45 to 54 Years | 9 | 16.4% |
| 55 to 64 Years | 12 | 21.8% |
| 65 to 74 Years | 14 | 25.5% |
| 75 to 84 Years | 1 | 1.8% |
| 85 Years and Over | 0 | 0.0% |
| Total | 55 | 100.0% |
Housing Finances in Anderson
Median Income by Occupancy in Anderson
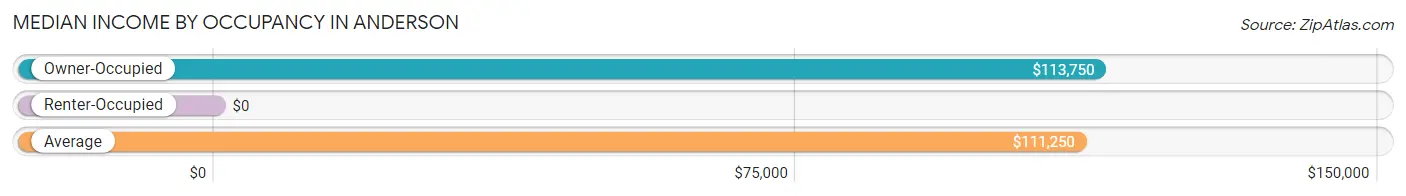
| Occupancy Type | # Households | Median Income |
| Owner-Occupied | 50 (90.9%) | $113,750 |
| Renter-Occupied | 5 (9.1%) | $0 |
| Average | 55 (100.0%) | $111,250 |
Occupancy by Householder Income Bracket in Anderson
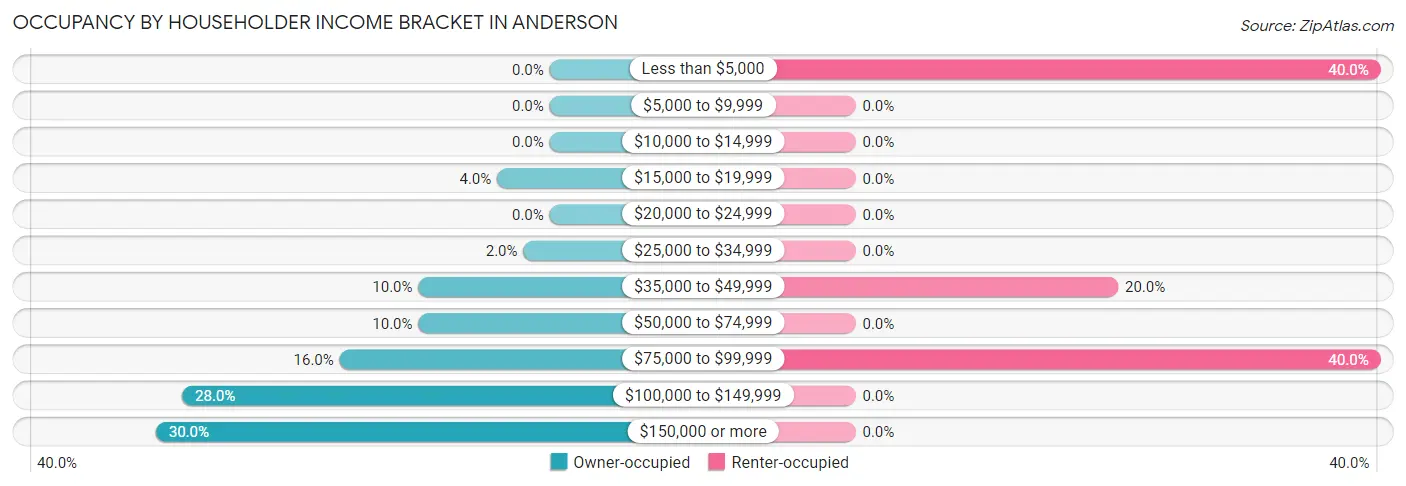
| Income Bracket | Owner-occupied | Renter-occupied |
| Less than $5,000 | 0 (0.0%) | 2 (40.0%) |
| $5,000 to $9,999 | 0 (0.0%) | 0 (0.0%) |
| $10,000 to $14,999 | 0 (0.0%) | 0 (0.0%) |
| $15,000 to $19,999 | 2 (4.0%) | 0 (0.0%) |
| $20,000 to $24,999 | 0 (0.0%) | 0 (0.0%) |
| $25,000 to $34,999 | 1 (2.0%) | 0 (0.0%) |
| $35,000 to $49,999 | 5 (10.0%) | 1 (20.0%) |
| $50,000 to $74,999 | 5 (10.0%) | 0 (0.0%) |
| $75,000 to $99,999 | 8 (16.0%) | 2 (40.0%) |
| $100,000 to $149,999 | 14 (28.0%) | 0 (0.0%) |
| $150,000 or more | 15 (30.0%) | 0 (0.0%) |
| Total | 50 (100.0%) | 5 (100.0%) |
Monthly Housing Cost Tiers in Anderson
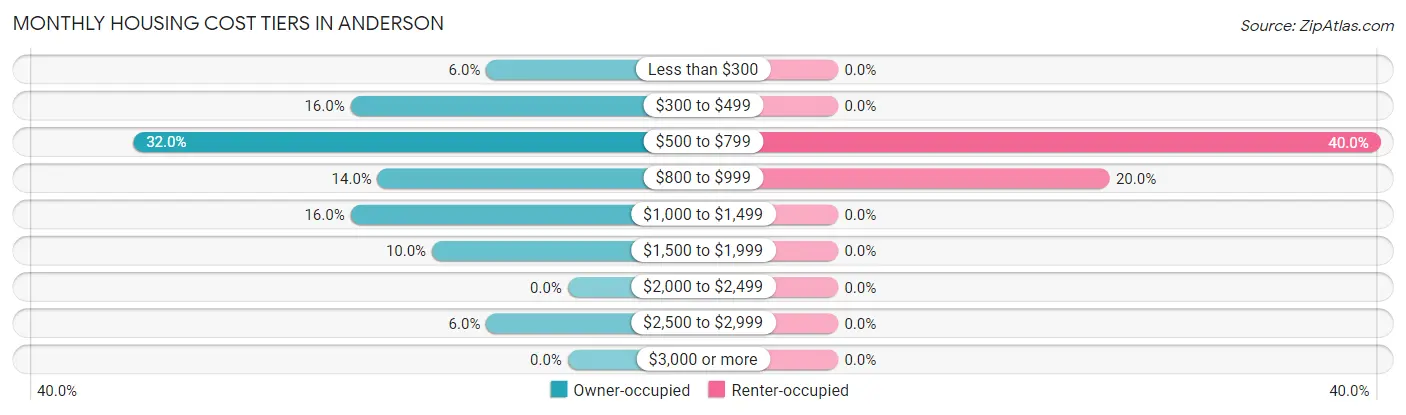
| Monthly Cost | Owner-occupied | Renter-occupied |
| Less than $300 | 3 (6.0%) | 0 (0.0%) |
| $300 to $499 | 8 (16.0%) | 0 (0.0%) |
| $500 to $799 | 16 (32.0%) | 2 (40.0%) |
| $800 to $999 | 7 (14.0%) | 1 (20.0%) |
| $1,000 to $1,499 | 8 (16.0%) | 0 (0.0%) |
| $1,500 to $1,999 | 5 (10.0%) | 0 (0.0%) |
| $2,000 to $2,499 | 0 (0.0%) | 0 (0.0%) |
| $2,500 to $2,999 | 3 (6.0%) | 0 (0.0%) |
| $3,000 or more | 0 (0.0%) | 0 (0.0%) |
| Total | 50 (100.0%) | 5 (100.0%) |
Physical Housing Characteristics in Anderson
Housing Structures in Anderson
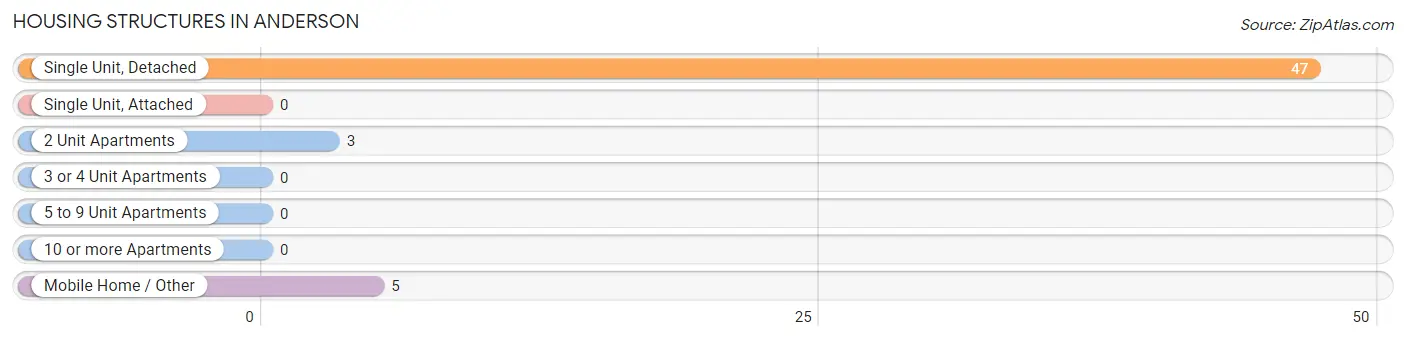
| Structure Type | # Housing Units | % Housing Units |
| Single Unit, Detached | 47 | 85.5% |
| Single Unit, Attached | 0 | 0.0% |
| 2 Unit Apartments | 3 | 5.4% |
| 3 or 4 Unit Apartments | 0 | 0.0% |
| 5 to 9 Unit Apartments | 0 | 0.0% |
| 10 or more Apartments | 0 | 0.0% |
| Mobile Home / Other | 5 | 9.1% |
| Total | 55 | 100.0% |
Housing Structures by Occupancy in Anderson
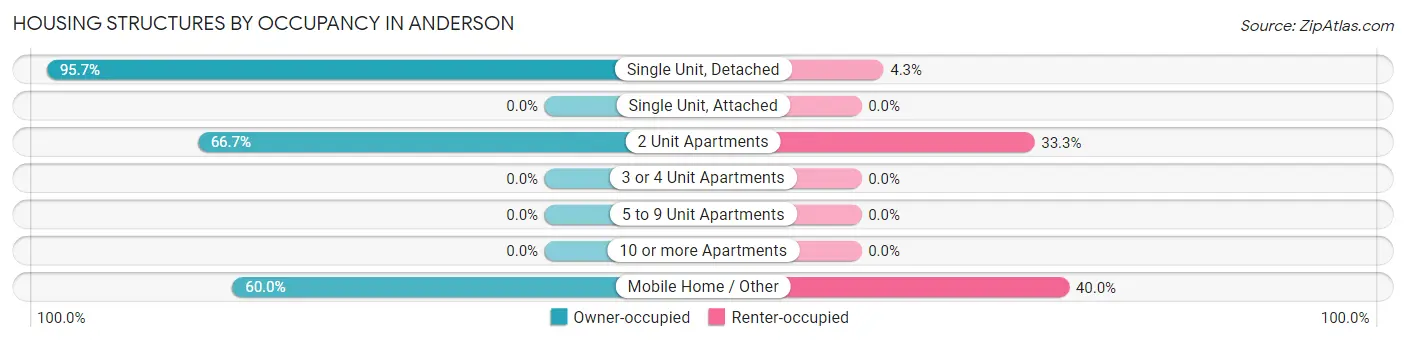
| Structure Type | Owner-occupied | Renter-occupied |
| Single Unit, Detached | 45 (95.7%) | 2 (4.3%) |
| Single Unit, Attached | 0 (0.0%) | 0 (0.0%) |
| 2 Unit Apartments | 2 (66.7%) | 1 (33.3%) |
| 3 or 4 Unit Apartments | 0 (0.0%) | 0 (0.0%) |
| 5 to 9 Unit Apartments | 0 (0.0%) | 0 (0.0%) |
| 10 or more Apartments | 0 (0.0%) | 0 (0.0%) |
| Mobile Home / Other | 3 (60.0%) | 2 (40.0%) |
| Total | 50 (90.9%) | 5 (9.1%) |
Housing Structures by Number of Rooms in Anderson
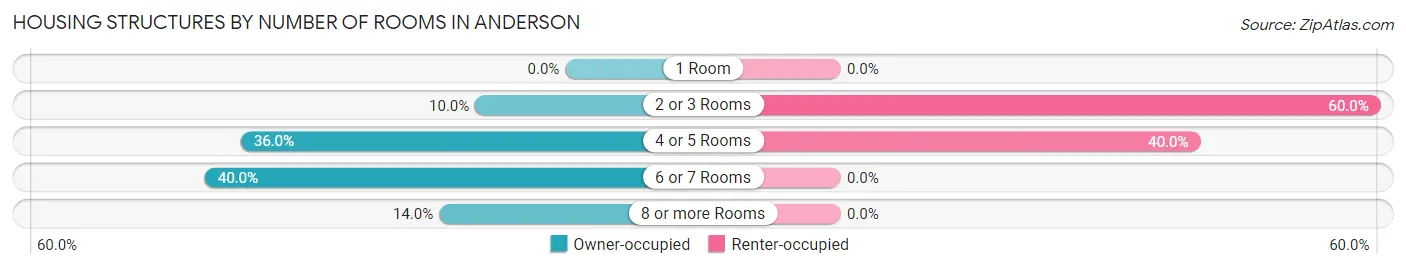
| Number of Rooms | Owner-occupied | Renter-occupied |
| 1 Room | 0 (0.0%) | 0 (0.0%) |
| 2 or 3 Rooms | 5 (10.0%) | 3 (60.0%) |
| 4 or 5 Rooms | 18 (36.0%) | 2 (40.0%) |
| 6 or 7 Rooms | 20 (40.0%) | 0 (0.0%) |
| 8 or more Rooms | 7 (14.0%) | 0 (0.0%) |
| Total | 50 (100.0%) | 5 (100.0%) |
Housing Structure by Heating Type in Anderson
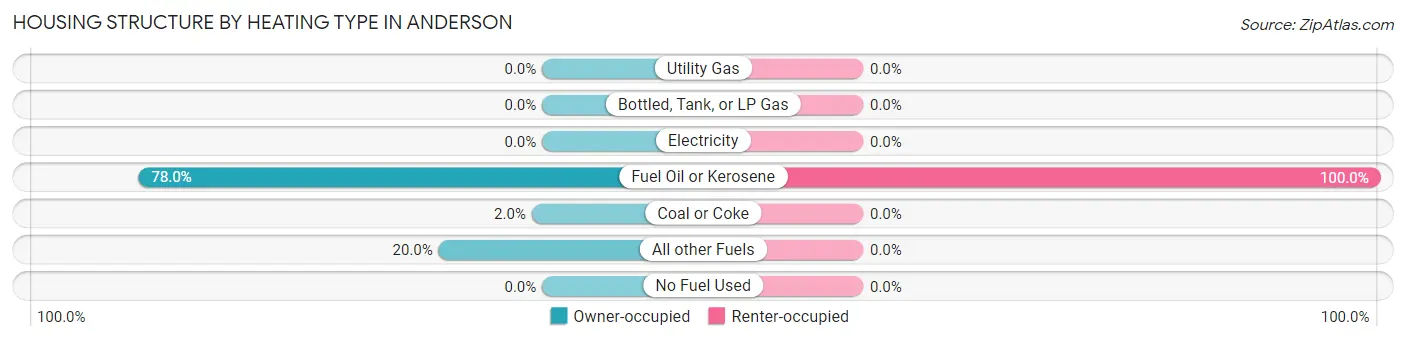
| Heating Type | Owner-occupied | Renter-occupied |
| Utility Gas | 0 (0.0%) | 0 (0.0%) |
| Bottled, Tank, or LP Gas | 0 (0.0%) | 0 (0.0%) |
| Electricity | 0 (0.0%) | 0 (0.0%) |
| Fuel Oil or Kerosene | 39 (78.0%) | 5 (100.0%) |
| Coal or Coke | 1 (2.0%) | 0 (0.0%) |
| All other Fuels | 10 (20.0%) | 0 (0.0%) |
| No Fuel Used | 0 (0.0%) | 0 (0.0%) |
| Total | 50 (100.0%) | 5 (100.0%) |
Household Vehicle Usage in Anderson
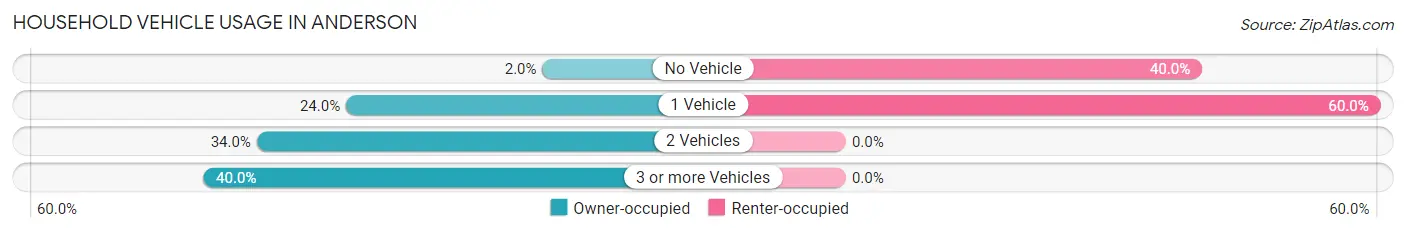
| Vehicles per Household | Owner-occupied | Renter-occupied |
| No Vehicle | 1 (2.0%) | 2 (40.0%) |
| 1 Vehicle | 12 (24.0%) | 3 (60.0%) |
| 2 Vehicles | 17 (34.0%) | 0 (0.0%) |
| 3 or more Vehicles | 20 (40.0%) | 0 (0.0%) |
| Total | 50 (100.0%) | 5 (100.0%) |
Real Estate & Mortgages in Anderson
Real Estate and Mortgage Overview in Anderson
| Characteristic | Without Mortgage | With Mortgage |
| Housing Units | 34 | 16 |
| Median Property Value | $158,300 | $0 |
| Median Household Income | $98,750 | $8 |
| Monthly Housing Costs | $622 | $0 |
| Real Estate Taxes | - | - |
Property Value by Mortgage Status in Anderson
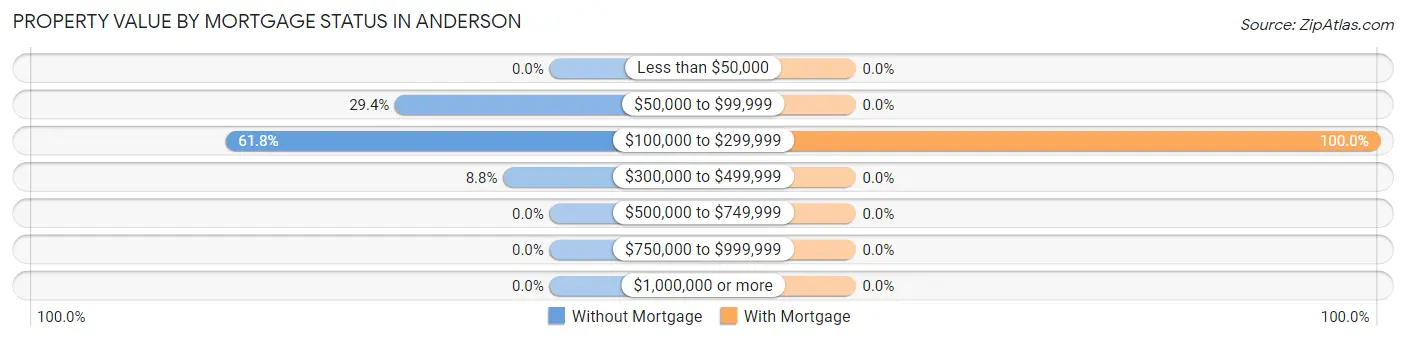
| Property Value | Without Mortgage | With Mortgage |
| Less than $50,000 | 0 (0.0%) | 0 (0.0%) |
| $50,000 to $99,999 | 10 (29.4%) | 0 (0.0%) |
| $100,000 to $299,999 | 21 (61.8%) | 16 (100.0%) |
| $300,000 to $499,999 | 3 (8.8%) | 0 (0.0%) |
| $500,000 to $749,999 | 0 (0.0%) | 0 (0.0%) |
| $750,000 to $999,999 | 0 (0.0%) | 0 (0.0%) |
| $1,000,000 or more | 0 (0.0%) | 0 (0.0%) |
| Total | 34 (100.0%) | 16 (100.0%) |
Household Income by Mortgage Status in Anderson
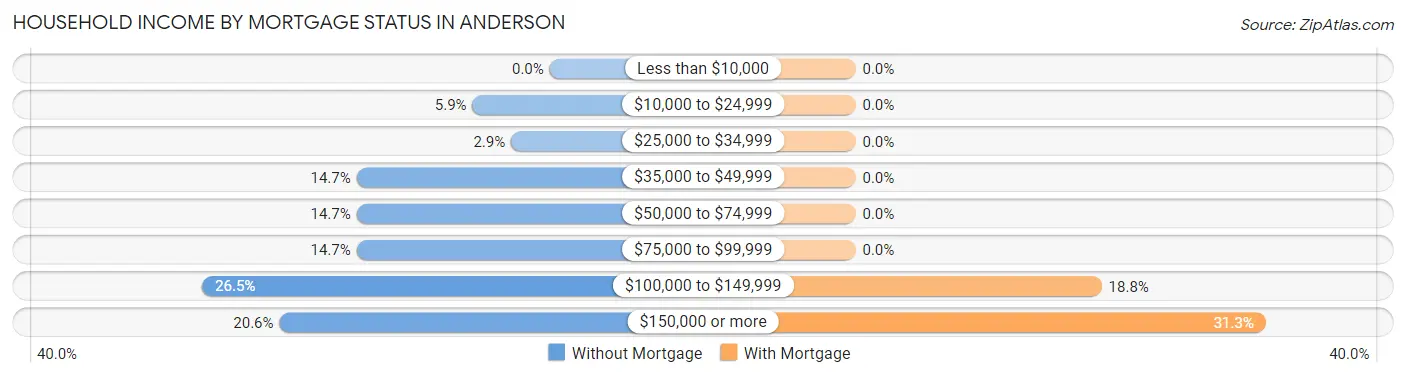
| Household Income | Without Mortgage | With Mortgage |
| Less than $10,000 | 0 (0.0%) | 0 (0.0%) |
| $10,000 to $24,999 | 2 (5.9%) | 0 (0.0%) |
| $25,000 to $34,999 | 1 (2.9%) | 0 (0.0%) |
| $35,000 to $49,999 | 5 (14.7%) | 0 (0.0%) |
| $50,000 to $74,999 | 5 (14.7%) | 0 (0.0%) |
| $75,000 to $99,999 | 5 (14.7%) | 0 (0.0%) |
| $100,000 to $149,999 | 9 (26.5%) | 3 (18.8%) |
| $150,000 or more | 7 (20.6%) | 5 (31.2%) |
| Total | 34 (100.0%) | 16 (100.0%) |
Property Value to Household Income Ratio in Anderson
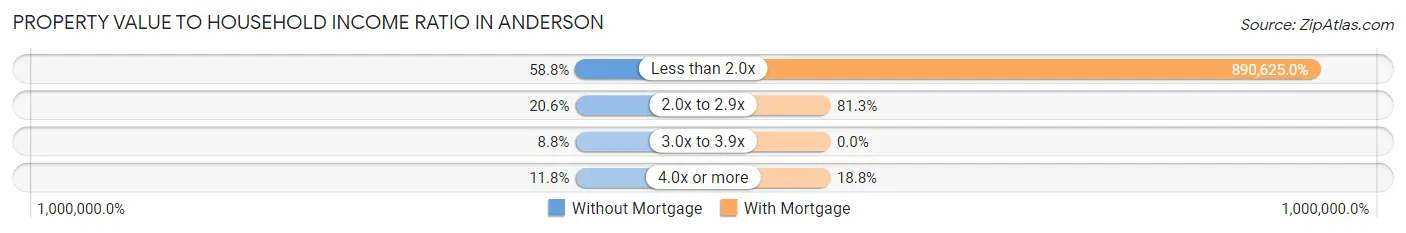
| Value-to-Income Ratio | Without Mortgage | With Mortgage |
| Less than 2.0x | 20 (58.8%) | 142,500 (890,625.0%) |
| 2.0x to 2.9x | 7 (20.6%) | 13 (81.2%) |
| 3.0x to 3.9x | 3 (8.8%) | 0 (0.0%) |
| 4.0x or more | 4 (11.8%) | 3 (18.8%) |
| Total | 34 (100.0%) | 16 (100.0%) |
Real Estate Taxes by Mortgage Status in Anderson
| Property Taxes | Without Mortgage | With Mortgage |
| Less than $800 | 0 (0.0%) | 0 (0.0%) |
| $800 to $1,499 | 0 (0.0%) | 0 (0.0%) |
| $800 to $1,499 | 0 (0.0%) | 0 (0.0%) |
| Total | 34 (100.0%) | 16 (100.0%) |
Health & Disability in Anderson
Health Insurance Coverage by Age in Anderson
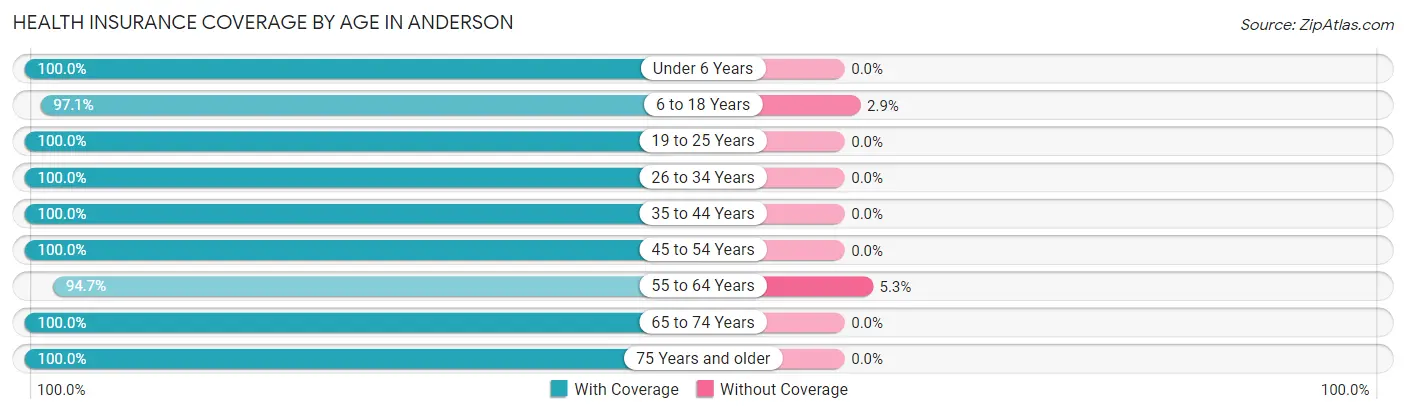
| Age Bracket | With Coverage | Without Coverage |
| Under 6 Years | 4 (100.0%) | 0 (0.0%) |
| 6 to 18 Years | 33 (97.1%) | 1 (2.9%) |
| 19 to 25 Years | 4 (100.0%) | 0 (0.0%) |
| 26 to 34 Years | 7 (100.0%) | 0 (0.0%) |
| 35 to 44 Years | 22 (100.0%) | 0 (0.0%) |
| 45 to 54 Years | 15 (100.0%) | 0 (0.0%) |
| 55 to 64 Years | 18 (94.7%) | 1 (5.3%) |
| 65 to 74 Years | 18 (100.0%) | 0 (0.0%) |
| 75 Years and older | 1 (100.0%) | 0 (0.0%) |
| Total | 122 (98.4%) | 2 (1.6%) |
Health Insurance Coverage by Citizenship Status in Anderson
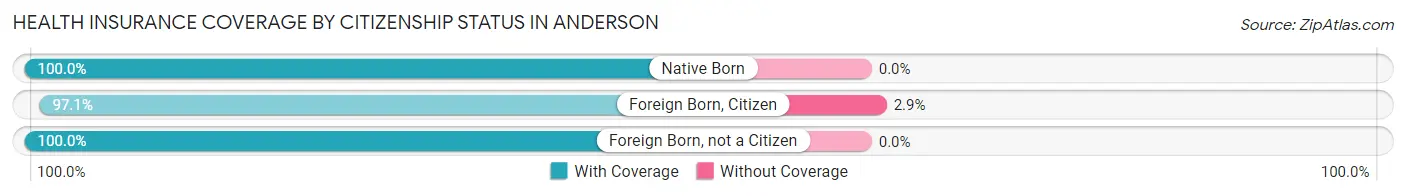
| Citizenship Status | With Coverage | Without Coverage |
| Native Born | 4 (100.0%) | 0 (0.0%) |
| Foreign Born, Citizen | 33 (97.1%) | 1 (2.9%) |
| Foreign Born, not a Citizen | 4 (100.0%) | 0 (0.0%) |
Health Insurance Coverage by Household Income in Anderson
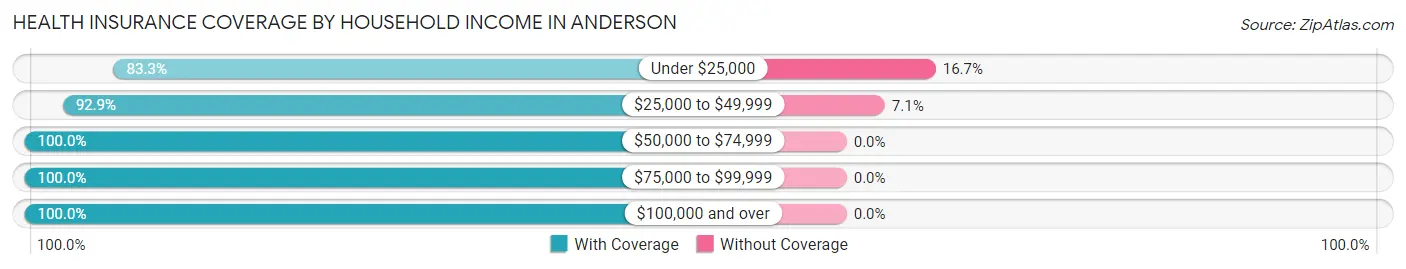
| Household Income | With Coverage | Without Coverage |
| Under $25,000 | 5 (83.3%) | 1 (16.7%) |
| $25,000 to $49,999 | 13 (92.9%) | 1 (7.1%) |
| $50,000 to $74,999 | 9 (100.0%) | 0 (0.0%) |
| $75,000 to $99,999 | 11 (100.0%) | 0 (0.0%) |
| $100,000 and over | 84 (100.0%) | 0 (0.0%) |
Public vs Private Health Insurance Coverage by Age in Anderson
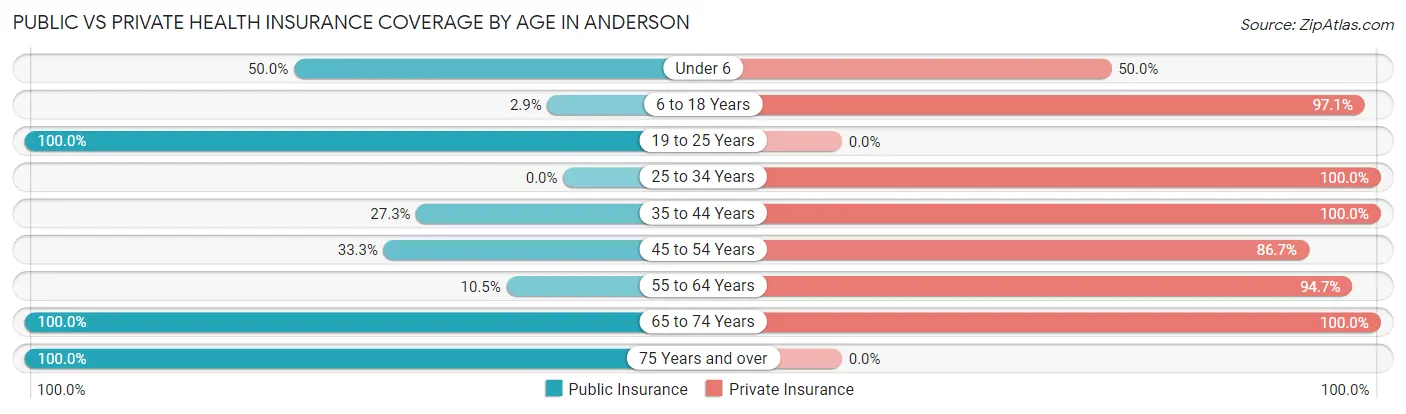
| Age Bracket | Public Insurance | Private Insurance |
| Under 6 | 2 (50.0%) | 2 (50.0%) |
| 6 to 18 Years | 1 (2.9%) | 33 (97.1%) |
| 19 to 25 Years | 4 (100.0%) | 0 (0.0%) |
| 25 to 34 Years | 0 (0.0%) | 7 (100.0%) |
| 35 to 44 Years | 6 (27.3%) | 22 (100.0%) |
| 45 to 54 Years | 5 (33.3%) | 13 (86.7%) |
| 55 to 64 Years | 2 (10.5%) | 18 (94.7%) |
| 65 to 74 Years | 18 (100.0%) | 18 (100.0%) |
| 75 Years and over | 1 (100.0%) | 0 (0.0%) |
| Total | 39 (31.5%) | 113 (91.1%) |
Disability Status by Sex by Age in Anderson
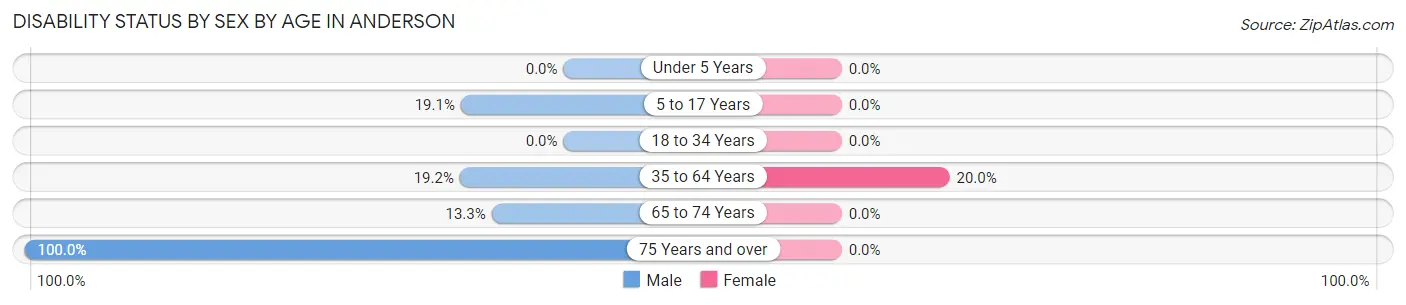
| Age Bracket | Male | Female |
| Under 5 Years | 0 (0.0%) | 0 (0.0%) |
| 5 to 17 Years | 4 (19.1%) | 0 (0.0%) |
| 18 to 34 Years | 0 (0.0%) | 0 (0.0%) |
| 35 to 64 Years | 5 (19.2%) | 6 (20.0%) |
| 65 to 74 Years | 2 (13.3%) | 0 (0.0%) |
| 75 Years and over | 1 (100.0%) | 0 (0.0%) |
Disability Class by Sex by Age in Anderson
Disability Class: Hearing Difficulty
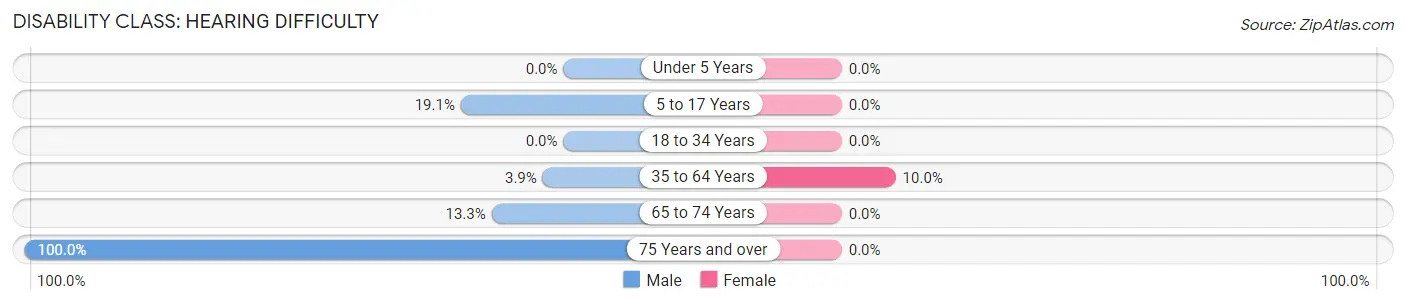
| Age Bracket | Male | Female |
| Under 5 Years | 0 (0.0%) | 0 (0.0%) |
| 5 to 17 Years | 4 (19.1%) | 0 (0.0%) |
| 18 to 34 Years | 0 (0.0%) | 0 (0.0%) |
| 35 to 64 Years | 1 (3.8%) | 3 (10.0%) |
| 65 to 74 Years | 2 (13.3%) | 0 (0.0%) |
| 75 Years and over | 1 (100.0%) | 0 (0.0%) |
Disability Class: Vision Difficulty

| Age Bracket | Male | Female |
| Under 5 Years | 0 (0.0%) | 0 (0.0%) |
| 5 to 17 Years | 0 (0.0%) | 0 (0.0%) |
| 18 to 34 Years | 0 (0.0%) | 0 (0.0%) |
| 35 to 64 Years | 0 (0.0%) | 0 (0.0%) |
| 65 to 74 Years | 0 (0.0%) | 0 (0.0%) |
| 75 Years and over | 0 (0.0%) | 0 (0.0%) |
Disability Class: Cognitive Difficulty
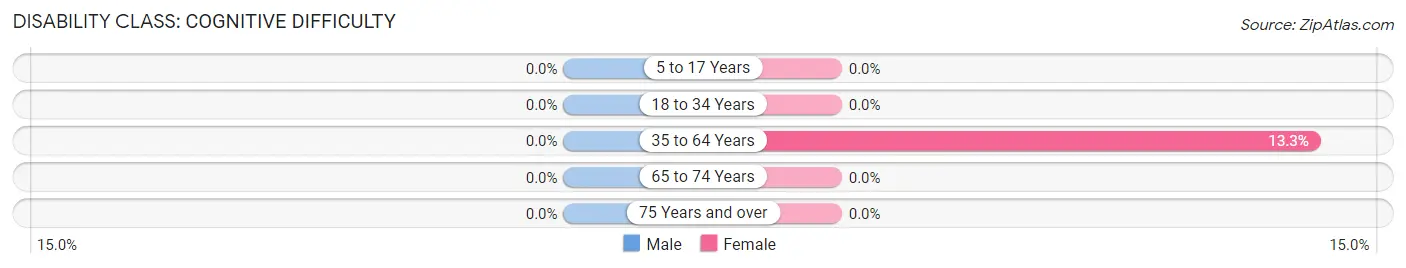
| Age Bracket | Male | Female |
| 5 to 17 Years | 0 (0.0%) | 0 (0.0%) |
| 18 to 34 Years | 0 (0.0%) | 0 (0.0%) |
| 35 to 64 Years | 0 (0.0%) | 4 (13.3%) |
| 65 to 74 Years | 0 (0.0%) | 0 (0.0%) |
| 75 Years and over | 0 (0.0%) | 0 (0.0%) |
Disability Class: Ambulatory Difficulty
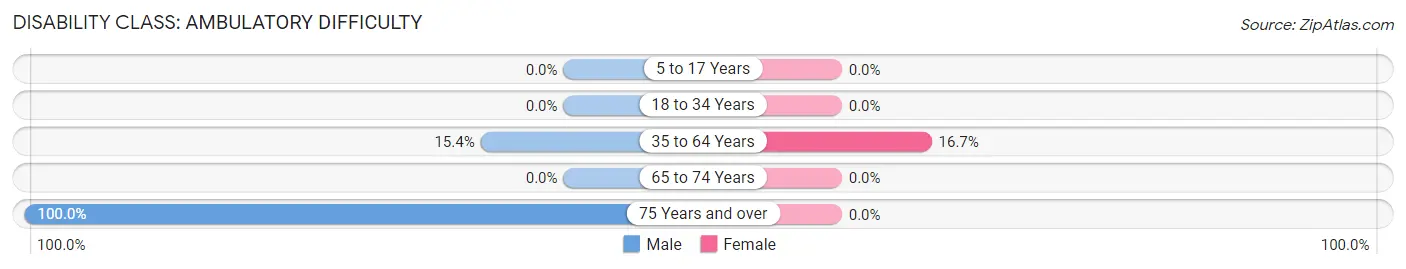
| Age Bracket | Male | Female |
| 5 to 17 Years | 0 (0.0%) | 0 (0.0%) |
| 18 to 34 Years | 0 (0.0%) | 0 (0.0%) |
| 35 to 64 Years | 4 (15.4%) | 5 (16.7%) |
| 65 to 74 Years | 0 (0.0%) | 0 (0.0%) |
| 75 Years and over | 1 (100.0%) | 0 (0.0%) |
Disability Class: Self-Care Difficulty
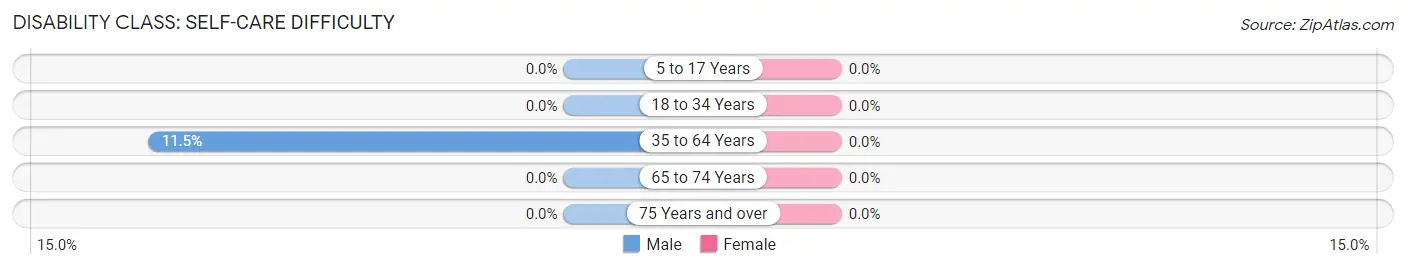
| Age Bracket | Male | Female |
| 5 to 17 Years | 0 (0.0%) | 0 (0.0%) |
| 18 to 34 Years | 0 (0.0%) | 0 (0.0%) |
| 35 to 64 Years | 3 (11.5%) | 0 (0.0%) |
| 65 to 74 Years | 0 (0.0%) | 0 (0.0%) |
| 75 Years and over | 0 (0.0%) | 0 (0.0%) |
Technology Access in Anderson
Computing Device Access in Anderson
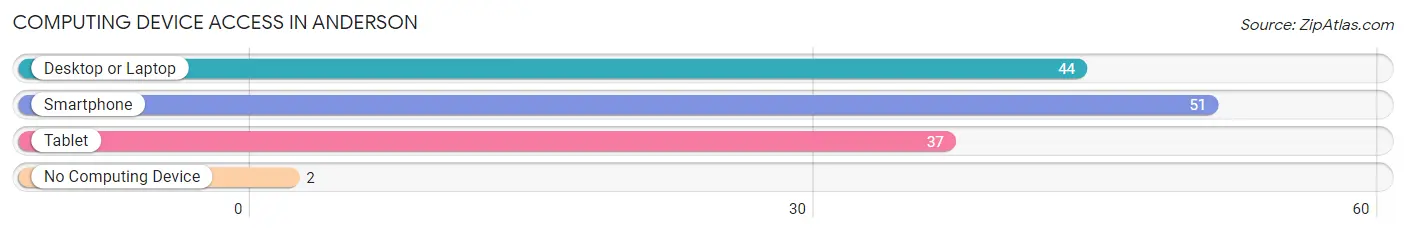
| Device Type | # Households | % Households |
| Desktop or Laptop | 44 | 80.0% |
| Smartphone | 51 | 92.7% |
| Tablet | 37 | 67.3% |
| No Computing Device | 2 | 3.6% |
| Total | 55 | 100.0% |
Internet Access in Anderson
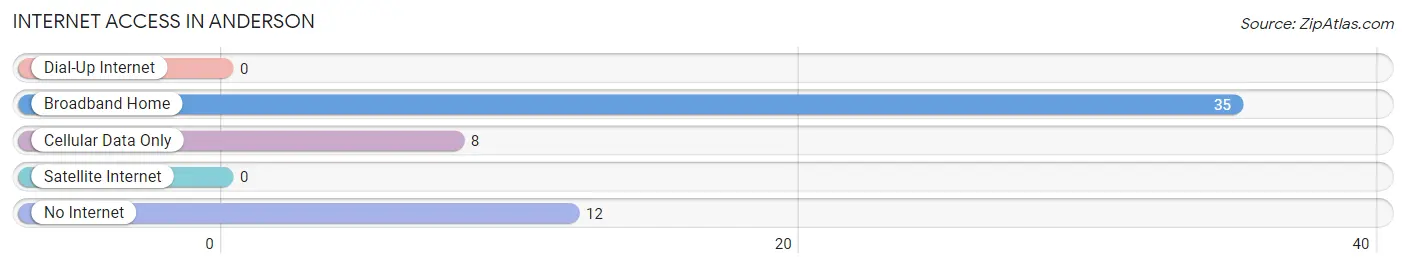
| Internet Type | # Households | % Households |
| Dial-Up Internet | 0 | 0.0% |
| Broadband Home | 35 | 63.6% |
| Cellular Data Only | 8 | 14.5% |
| Satellite Internet | 0 | 0.0% |
| No Internet | 12 | 21.8% |
| Total | 55 | 100.0% |
Anderson Summary
Anderson is a city located in the Matanuska-Susitna Borough of Alaska. It is located on the south bank of the Susitna River, approximately 40 miles northeast of Anchorage. The city was named after the Anderson family, who were among the first settlers in the area.
History
The area around Anderson was first inhabited by the Dena’ina Athabascan people. The first non-native settlers arrived in the area in the early 1900s. The Anderson family, who were among the first settlers, established a homestead in the area in 1912. The Anderson family was instrumental in the development of the area, and the city was named after them.
In the early 1900s, the area was primarily used for farming and ranching. In the 1920s, the Alaska Railroad was built through the area, and the city of Anderson was officially incorporated in 1947.
In the 1950s, the area experienced a population boom due to the construction of the nearby military base, Fort Richardson. The population of Anderson grew from just over 200 in 1950 to over 1,000 in 1960.
Geography
Anderson is located in the Matanuska-Susitna Borough of Alaska. It is situated on the south bank of the Susitna River, approximately 40 miles northeast of Anchorage. The city is surrounded by mountains and is located in a valley. The climate in Anderson is generally mild, with temperatures ranging from -20°F in the winter to 80°F in the summer.
Economy
The economy of Anderson is largely based on agriculture and tourism. The city is home to several farms and ranches, which produce a variety of crops and livestock. The city is also a popular tourist destination, with visitors coming to enjoy the area’s natural beauty and outdoor activities.
The city is also home to several businesses, including a grocery store, a hardware store, and a restaurant. The city is also home to a small airport, which serves the surrounding area.
Demographics
As of the 2010 census, the population of Anderson was 1,845. The racial makeup of the city was 94.3% White, 0.7% Native American, 0.3% Asian, 0.2% Pacific Islander, 0.1% Black or African American, and 4.4% from other races. The median household income in Anderson was $50,938, and the median family income was $58,938. The per capita income in Anderson was $22,938.
Conclusion
Anderson is a small city located in the Matanuska-Susitna Borough of Alaska. It is situated on the south bank of the Susitna River, approximately 40 miles northeast of Anchorage. The city was named after the Anderson family, who were among the first settlers in the area. The economy of Anderson is largely based on agriculture and tourism, and the city is home to several businesses. As of the 2010 census, the population of Anderson was 1,845. The racial makeup of the city was 94.3% White, 0.7% Native American, 0.3% Asian, 0.2% Pacific Islander, 0.1% Black or African American, and 4.4% from other races. The median household income in Anderson was $50,938, and the median family income was $58,938. The per capita income in Anderson was $22,938.
Common Questions
What is Per Capita Income in Anderson?
Per Capita income in Anderson is $41,469.
What is the Median Family Income in Anderson?
Median Family Income in Anderson is $124,375.
What is the Median Household income in Anderson?
Median Household Income in Anderson is $111,250.
What is Inequality or Gini Index in Anderson?
Inequality or Gini Index in Anderson is 0.31.
What is the Total Population of Anderson?
Total Population of Anderson is 173.
What is the Total Male Population of Anderson?
Total Male Population of Anderson is 114.
What is the Total Female Population of Anderson?
Total Female Population of Anderson is 59.
What is the Ratio of Males per 100 Females in Anderson?
There are 193.22 Males per 100 Females in Anderson.
What is the Ratio of Females per 100 Males in Anderson?
There are 51.75 Females per 100 Males in Anderson.
What is the Median Population Age in Anderson?
Median Population Age in Anderson is 30.4 Years.
What is the Average Family Size in Anderson
Average Family Size in Anderson is 3.1 People.
What is the Average Household Size in Anderson
Average Household Size in Anderson is 2.2 People.
How Large is the Labor Force in Anderson?
There are 99 People in the Labor Forcein in Anderson.
What is the Percentage of People in the Labor Force in Anderson?
70.2% of People are in the Labor Force in Anderson.
What is the Unemployment Rate in Anderson?
Unemployment Rate in Anderson is 6.0%.