Many Farms, AZ Map & Demographics
Many Farms Map
Many Farms Overview
$19,849
PER CAPITA INCOME
$29,659
AVG HOUSEHOLD INCOME
7.0%
WAGE / INCOME GAP [ % ]
93.0¢/ $1
WAGE / INCOME GAP [ $ ]
0.50
INEQUALITY / GINI INDEX
693
TOTAL POPULATION
461
MALE POPULATION
232
FEMALE POPULATION
198.71
MALES / 100 FEMALES
50.33
FEMALES / 100 MALES
37.2
MEDIAN AGE
4.4
AVG FAMILY SIZE
2.5
AVG HOUSEHOLD SIZE
233
LABOR FORCE [ PEOPLE ]
40.0%
PERCENT IN LABOR FORCE
1.3%
UNEMPLOYMENT RATE
Many Farms Zip Codes
Many Farms Area Codes
Income in Many Farms
Income Overview in Many Farms
| Characteristic | Number | Measure |
| Per Capita Income | 693 | $19,849 |
| Median Family Income | 113 | $0 |
| Mean Family Income | 113 | $59,160 |
| Median Household Income | 271 | $29,659 |
| Mean Household Income | 271 | $43,652 |
| Income Deficit | 113 | $0 |
| Wage / Income Gap (%) | 693 | 7.00% |
| Wage / Income Gap ($) | 693 | 93.00¢ per $1 |
| Gini / Inequality Index | 693 | 0.50 |
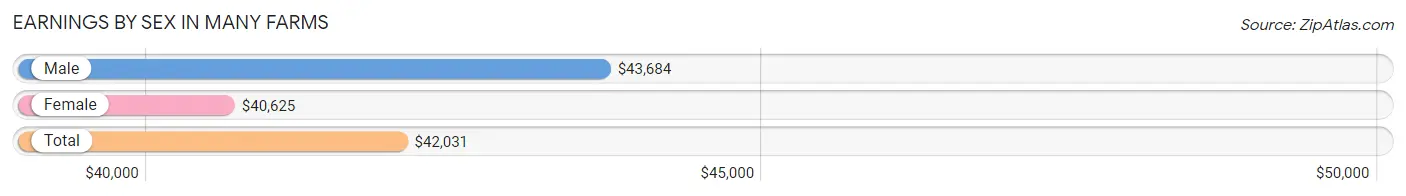
Earnings by Sex in Many Farms
Average Earnings in Many Farms are $42,031, $43,684 for men and $40,625 for women, a difference of 7.0%.
| Sex | Number | Average Earnings |
| Male | 134 (55.4%) | $43,684 |
| Female | 108 (44.6%) | $40,625 |
| Total | 242 (100.0%) | $42,031 |
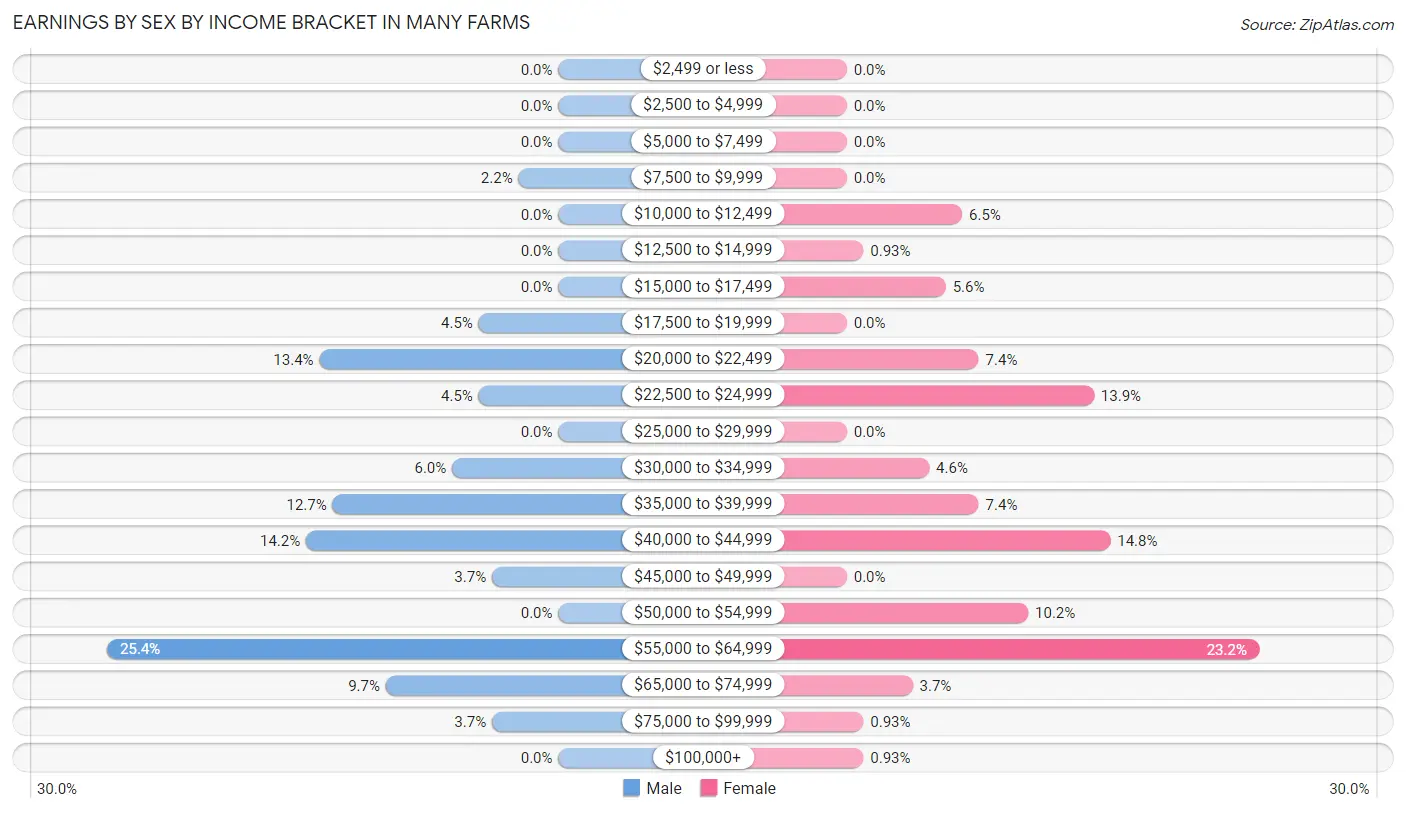
Earnings by Sex by Income Bracket in Many Farms
The most common earnings brackets in Many Farms are $55,000 to $64,999 for men (34 | 25.4%) and $55,000 to $64,999 for women (25 | 23.2%).
| Income | Male | Female |
| $2,499 or less | 0 (0.0%) | 0 (0.0%) |
| $2,500 to $4,999 | 0 (0.0%) | 0 (0.0%) |
| $5,000 to $7,499 | 0 (0.0%) | 0 (0.0%) |
| $7,500 to $9,999 | 3 (2.2%) | 0 (0.0%) |
| $10,000 to $12,499 | 0 (0.0%) | 7 (6.5%) |
| $12,500 to $14,999 | 0 (0.0%) | 1 (0.9%) |
| $15,000 to $17,499 | 0 (0.0%) | 6 (5.6%) |
| $17,500 to $19,999 | 6 (4.5%) | 0 (0.0%) |
| $20,000 to $22,499 | 18 (13.4%) | 8 (7.4%) |
| $22,500 to $24,999 | 6 (4.5%) | 15 (13.9%) |
| $25,000 to $29,999 | 0 (0.0%) | 0 (0.0%) |
| $30,000 to $34,999 | 8 (6.0%) | 5 (4.6%) |
| $35,000 to $39,999 | 17 (12.7%) | 8 (7.4%) |
| $40,000 to $44,999 | 19 (14.2%) | 16 (14.8%) |
| $45,000 to $49,999 | 5 (3.7%) | 0 (0.0%) |
| $50,000 to $54,999 | 0 (0.0%) | 11 (10.2%) |
| $55,000 to $64,999 | 34 (25.4%) | 25 (23.2%) |
| $65,000 to $74,999 | 13 (9.7%) | 4 (3.7%) |
| $75,000 to $99,999 | 5 (3.7%) | 1 (0.9%) |
| $100,000+ | 0 (0.0%) | 1 (0.9%) |
| Total | 134 (100.0%) | 108 (100.0%) |
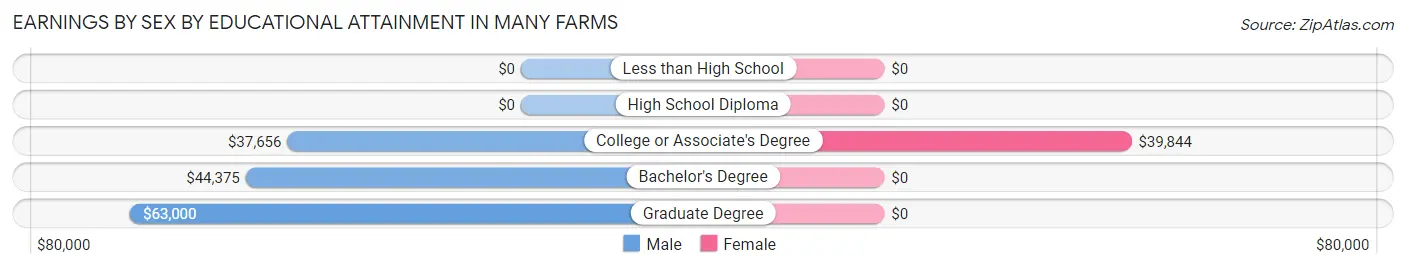
Earnings by Sex by Educational Attainment in Many Farms
Average earnings in Many Farms are $43,684 for men and $40,781 for women, a difference of 6.7%. Men with an educational attainment of graduate degree enjoy the highest average annual earnings of $63,000, while those with college or associate's degree education earn the least with $37,656. Women with an educational attainment of college or associate's degree earn the most with the average annual earnings of $39,844, while those with college or associate's degree education have the smallest earnings of $39,844.
| Educational Attainment | Male Income | Female Income |
| Less than High School | - | - |
| High School Diploma | - | - |
| College or Associate's Degree | $37,656 | $39,844 |
| Bachelor's Degree | $44,375 | $0 |
| Graduate Degree | $63,000 | $0 |
| Total | $43,684 | $40,781 |
Family Income in Many Farms
Family Income Brackets in Many Farms
According to the Many Farms family income data, there are 25 families falling into the $75,000 to $99,999 income range, which is the most common income bracket and makes up 22.1% of all families.
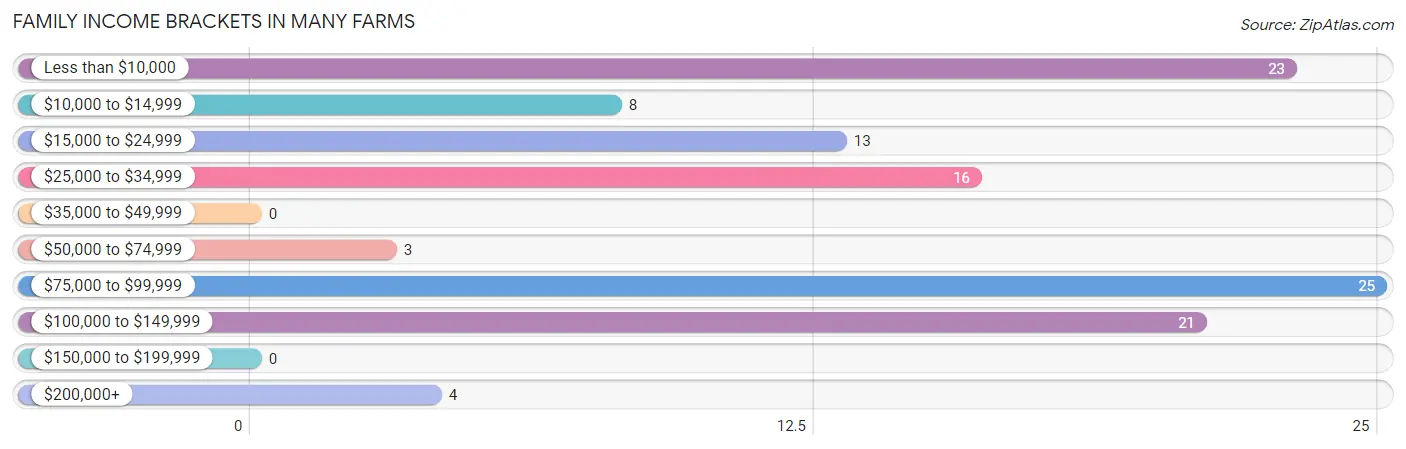
| Income Bracket | # Families | % Families |
| Less than $10,000 | 23 | 20.4% |
| $10,000 to $14,999 | 8 | 7.1% |
| $15,000 to $24,999 | 13 | 11.5% |
| $25,000 to $34,999 | 16 | 14.2% |
| $35,000 to $49,999 | 0 | 0.0% |
| $50,000 to $74,999 | 3 | 2.7% |
| $75,000 to $99,999 | 25 | 22.1% |
| $100,000 to $149,999 | 21 | 18.6% |
| $150,000 to $199,999 | 0 | 0.0% |
| $200,000+ | 4 | 3.5% |
Family Income by Famaliy Size in Many Farms
4-person families (40 | 35.4%) account for the highest median family income in Many Farms with $90,278 per family, while 4-person families (40 | 35.4%) have the highest median income of $22,570 per family member.
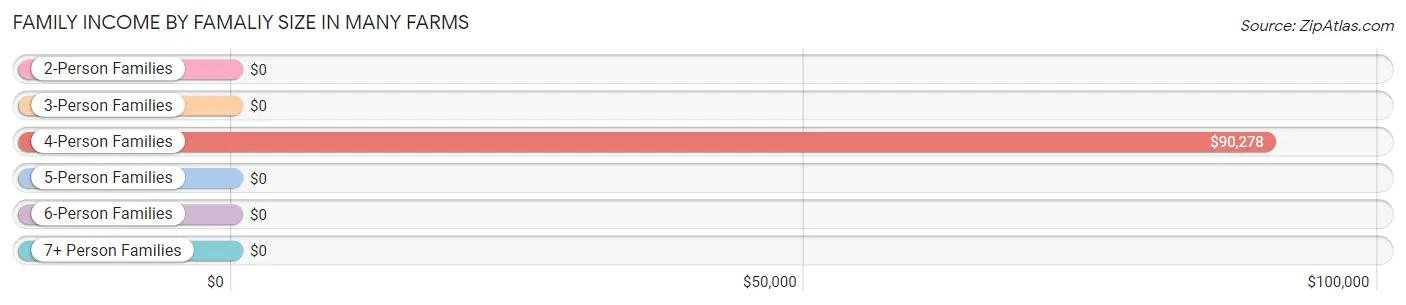
| Income Bracket | # Families | Median Income |
| 2-Person Families | 51 (45.1%) | $0 |
| 3-Person Families | 5 (4.4%) | $0 |
| 4-Person Families | 40 (35.4%) | $90,278 |
| 5-Person Families | 12 (10.6%) | $0 |
| 6-Person Families | 5 (4.4%) | $0 |
| 7+ Person Families | 0 (0.0%) | $0 |
| Total | 113 (100.0%) | $0 |
Family Income by Number of Earners in Many Farms
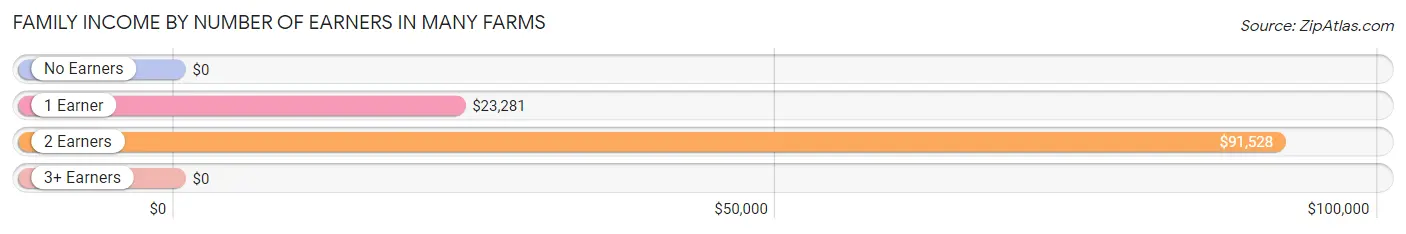
| Number of Earners | # Families | Median Income |
| No Earners | 50 (44.3%) | $0 |
| 1 Earner | 21 (18.6%) | $23,281 |
| 2 Earners | 33 (29.2%) | $91,528 |
| 3+ Earners | 9 (8.0%) | $0 |
| Total | 113 (100.0%) | $0 |
Household Income in Many Farms
Household Income Brackets in Many Farms
With 48 households falling in the category, the less than $10,000 income range is the most frequent in Many Farms, accounting for 17.7% of all households.
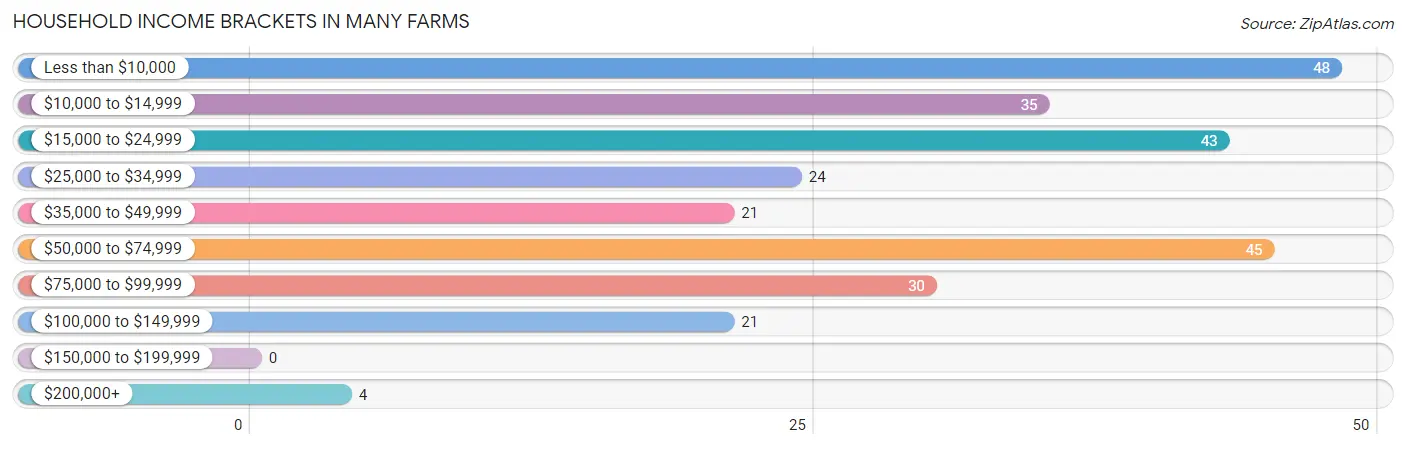
| Income Bracket | # Households | % Households |
| Less than $10,000 | 48 | 17.7% |
| $10,000 to $14,999 | 35 | 12.9% |
| $15,000 to $24,999 | 43 | 15.9% |
| $25,000 to $34,999 | 24 | 8.9% |
| $35,000 to $49,999 | 21 | 7.7% |
| $50,000 to $74,999 | 45 | 16.6% |
| $75,000 to $99,999 | 30 | 11.1% |
| $100,000 to $149,999 | 21 | 7.7% |
| $150,000 to $199,999 | 0 | 0.0% |
| $200,000+ | 4 | 1.5% |
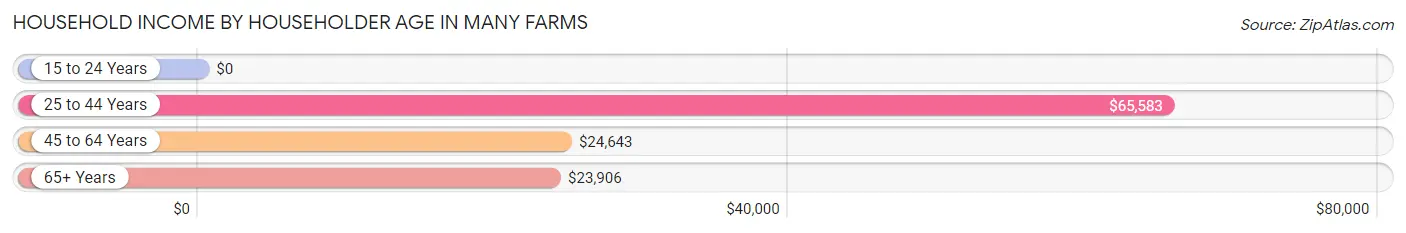
Household Income by Householder Age in Many Farms
The median household income in Many Farms is $29,659, with the highest median household income of $65,583 found in the 25 to 44 years age bracket for the primary householder. A total of 71 households (26.2%) fall into this category. Meanwhile, the 15 to 24 years age bracket for the primary householder has the lowest median household income of $0, with 3 households (1.1%) in this group.
| Income Bracket | # Households | Median Income |
| 15 to 24 Years | 3 (1.1%) | $0 |
| 25 to 44 Years | 71 (26.2%) | $65,583 |
| 45 to 64 Years | 156 (57.6%) | $24,643 |
| 65+ Years | 41 (15.1%) | $23,906 |
| Total | 271 (100.0%) | $29,659 |
Poverty in Many Farms
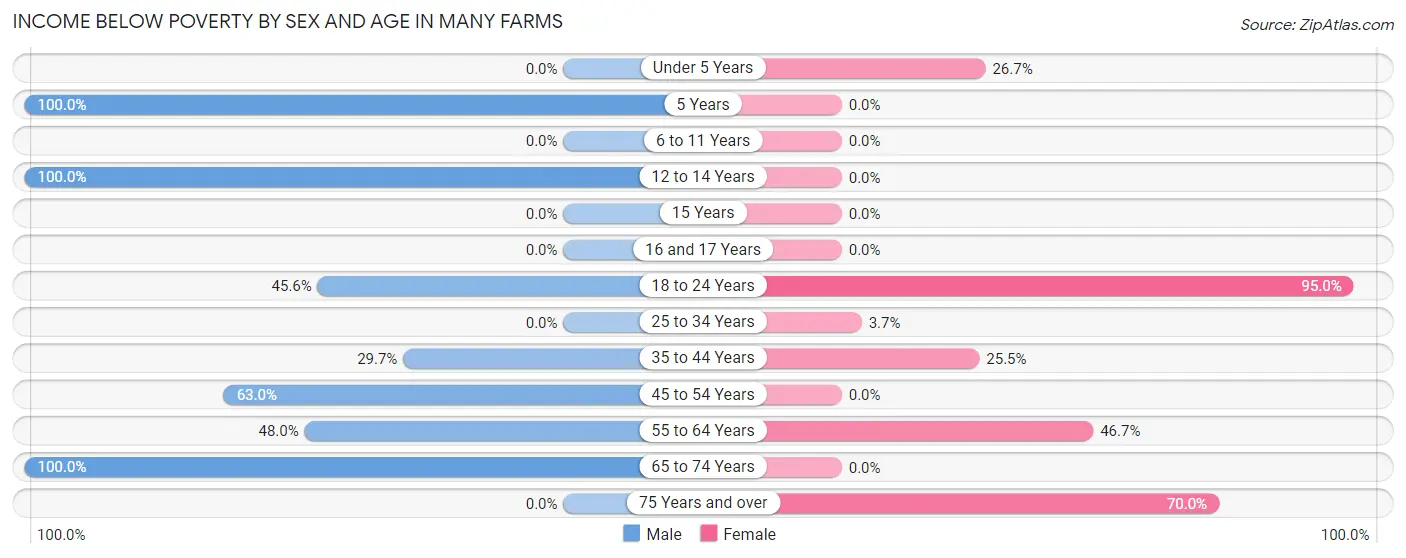
Income Below Poverty by Sex and Age in Many Farms
With 37.7% poverty level for males and 41.0% for females among the residents of Many Farms, 5 year old males and 18 to 24 year old females are the most vulnerable to poverty, with 21 males (100.0%) and 38 females (95.0%) in their respective age groups living below the poverty level.
| Age Bracket | Male | Female |
| Under 5 Years | 0 (0.0%) | 8 (26.7%) |
| 5 Years | 21 (100.0%) | 0 (0.0%) |
| 6 to 11 Years | 0 (0.0%) | 0 (0.0%) |
| 12 to 14 Years | 12 (100.0%) | 0 (0.0%) |
| 15 Years | 0 (0.0%) | 0 (0.0%) |
| 16 and 17 Years | 0 (0.0%) | 0 (0.0%) |
| 18 to 24 Years | 26 (45.6%) | 38 (95.0%) |
| 25 to 34 Years | 0 (0.0%) | 1 (3.7%) |
| 35 to 44 Years | 22 (29.7%) | 12 (25.5%) |
| 45 to 54 Years | 29 (63.0%) | 0 (0.0%) |
| 55 to 64 Years | 49 (48.0%) | 28 (46.7%) |
| 65 to 74 Years | 14 (100.0%) | 0 (0.0%) |
| 75 Years and over | 0 (0.0%) | 7 (70.0%) |
| Total | 173 (37.7%) | 94 (41.0%) |
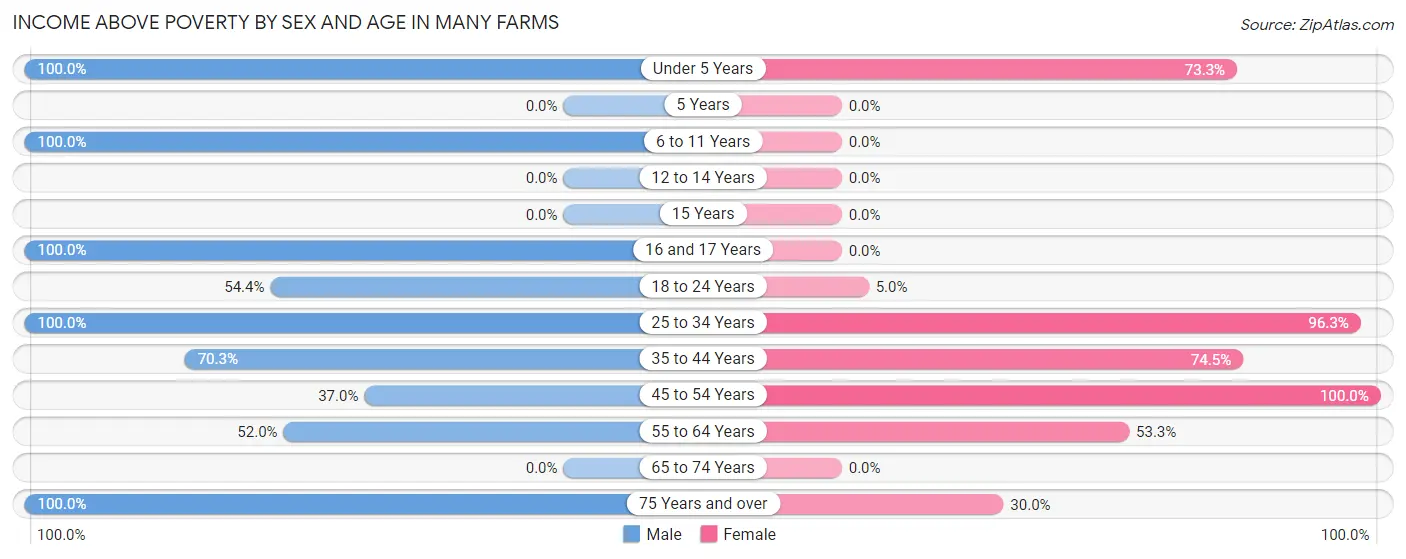
Income Above Poverty by Sex and Age in Many Farms
According to the poverty statistics in Many Farms, males aged under 5 years and females aged 45 to 54 years are the age groups that are most secure financially, with 100.0% of males and 100.0% of females in these age groups living above the poverty line.
| Age Bracket | Male | Female |
| Under 5 Years | 32 (100.0%) | 22 (73.3%) |
| 5 Years | 0 (0.0%) | 0 (0.0%) |
| 6 to 11 Years | 13 (100.0%) | 0 (0.0%) |
| 12 to 14 Years | 0 (0.0%) | 0 (0.0%) |
| 15 Years | 0 (0.0%) | 0 (0.0%) |
| 16 and 17 Years | 6 (100.0%) | 0 (0.0%) |
| 18 to 24 Years | 31 (54.4%) | 2 (5.0%) |
| 25 to 34 Years | 62 (100.0%) | 26 (96.3%) |
| 35 to 44 Years | 52 (70.3%) | 35 (74.5%) |
| 45 to 54 Years | 17 (37.0%) | 15 (100.0%) |
| 55 to 64 Years | 53 (52.0%) | 32 (53.3%) |
| 65 to 74 Years | 0 (0.0%) | 0 (0.0%) |
| 75 Years and over | 20 (100.0%) | 3 (30.0%) |
| Total | 286 (62.3%) | 135 (59.0%) |
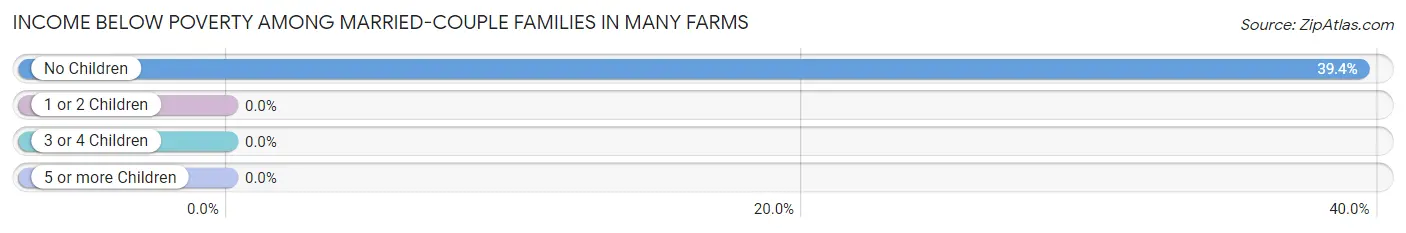
Income Below Poverty Among Married-Couple Families in Many Farms
The poverty statistics for married-couple families in Many Farms show that 22.8% or 13 of the total 57 families live below the poverty line. Families with no children have the highest poverty rate of 39.4%, comprising of 13 families. On the other hand, families with 1 or 2 children have the lowest poverty rate of 0.0%, which includes 0 families.
| Children | Above Poverty | Below Poverty |
| No Children | 20 (60.6%) | 13 (39.4%) |
| 1 or 2 Children | 19 (100.0%) | 0 (0.0%) |
| 3 or 4 Children | 5 (100.0%) | 0 (0.0%) |
| 5 or more Children | 0 (0.0%) | 0 (0.0%) |
| Total | 44 (77.2%) | 13 (22.8%) |
Income Below Poverty Among Single-Parent Households in Many Farms
According to the poverty data in Many Farms, 42.1% or 8 single-father households and 62.2% or 23 single-mother households are living below the poverty line. Among single-father households, those with no children have the highest poverty rate, with 8 households (42.1%) experiencing poverty. Likewise, among single-mother households, those with 1 or 2 children have the highest poverty rate, with 15 households (100.0%) falling below the poverty line.
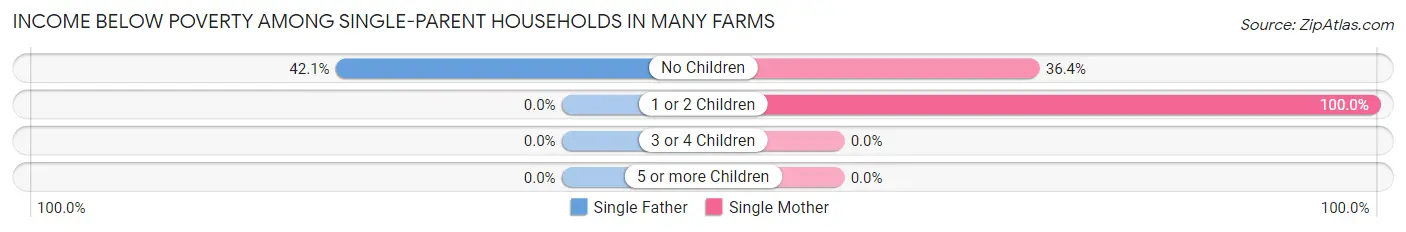
| Children | Single Father | Single Mother |
| No Children | 8 (42.1%) | 8 (36.4%) |
| 1 or 2 Children | 0 (0.0%) | 15 (100.0%) |
| 3 or 4 Children | 0 (0.0%) | 0 (0.0%) |
| 5 or more Children | 0 (0.0%) | 0 (0.0%) |
| Total | 8 (42.1%) | 23 (62.2%) |
Income Below Poverty Among Married-Couple vs Single-Parent Households in Many Farms
The poverty data for Many Farms shows that 13 of the married-couple family households (22.8%) and 31 of the single-parent households (55.4%) are living below the poverty level. Within the married-couple family households, those with no children have the highest poverty rate, with 13 households (39.4%) falling below the poverty line. Among the single-parent households, those with 1 or 2 children have the highest poverty rate, with 15 household (100.0%) living below poverty.
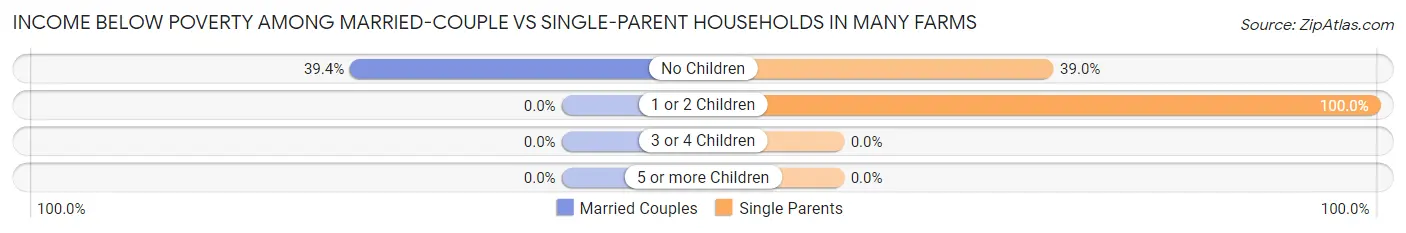
| Children | Married-Couple Families | Single-Parent Households |
| No Children | 13 (39.4%) | 16 (39.0%) |
| 1 or 2 Children | 0 (0.0%) | 15 (100.0%) |
| 3 or 4 Children | 0 (0.0%) | 0 (0.0%) |
| 5 or more Children | 0 (0.0%) | 0 (0.0%) |
| Total | 13 (22.8%) | 31 (55.4%) |
Race in Many Farms
The most populous races in Many Farms are Native / Alaskan (651 | 93.9%), Hispanic or Latino (42 | 6.1%), and White / Caucasian (25 | 3.6%).
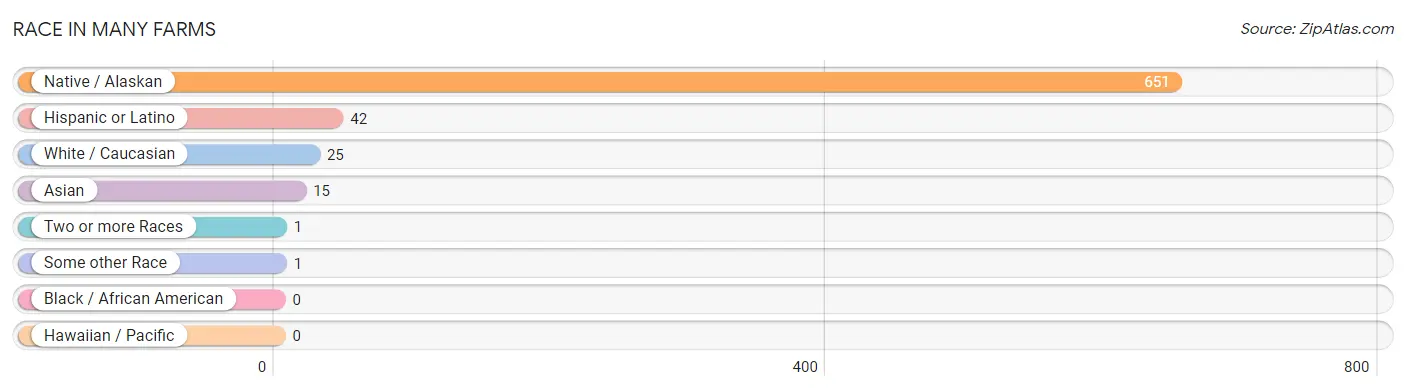
| Race | # Population | % Population |
| Asian | 15 | 2.2% |
| Black / African American | 0 | 0.0% |
| Hawaiian / Pacific | 0 | 0.0% |
| Hispanic or Latino | 42 | 6.1% |
| Native / Alaskan | 651 | 93.9% |
| White / Caucasian | 25 | 3.6% |
| Two or more Races | 1 | 0.1% |
| Some other Race | 1 | 0.1% |
| Total | 693 | 100.0% |
Ancestry in Many Farms
The most populous ancestries reported in Many Farms are Navajo (622 | 89.7%), Mexican (41 | 5.9%), Thai (15 | 2.2%), Apache (8 | 1.1%), and Sioux (8 | 1.1%), together accounting for 100.1% of all Many Farms residents.
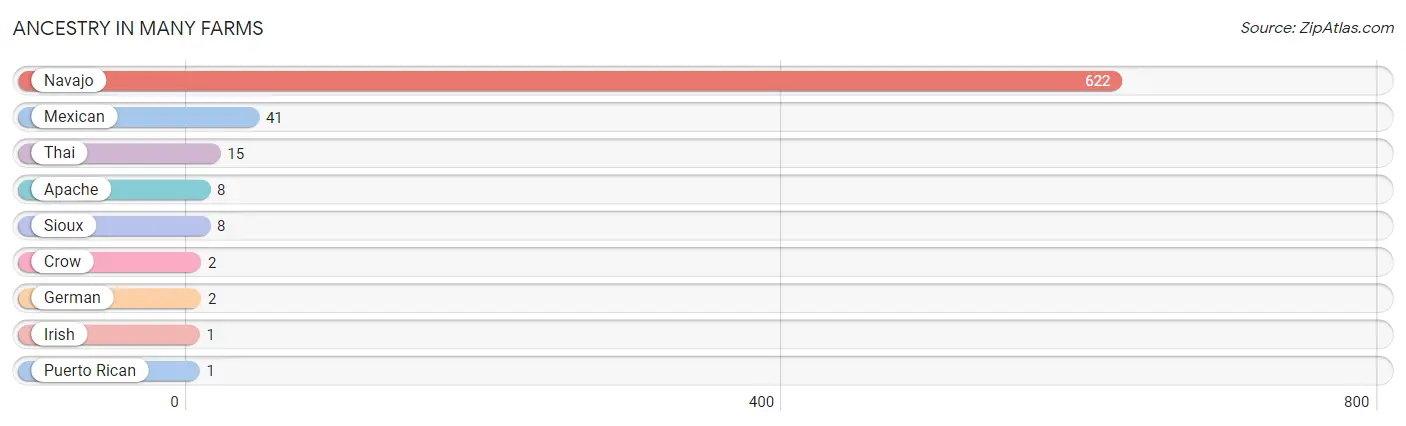
| Ancestry | # Population | % Population |
| Apache | 8 | 1.1% |
| Crow | 2 | 0.3% |
| German | 2 | 0.3% |
| Irish | 1 | 0.1% |
| Mexican | 41 | 5.9% |
| Navajo | 622 | 89.7% |
| Puerto Rican | 1 | 0.1% |
| Sioux | 8 | 1.1% |
| Thai | 15 | 2.2% | View All 9 Rows |
Immigrants in Many Farms
The most numerous immigrant groups reported in Many Farms came from Asia (15 | 2.2%), India (15 | 2.2%), and South Central Asia (15 | 2.2%), together accounting for 6.5% of all Many Farms residents.
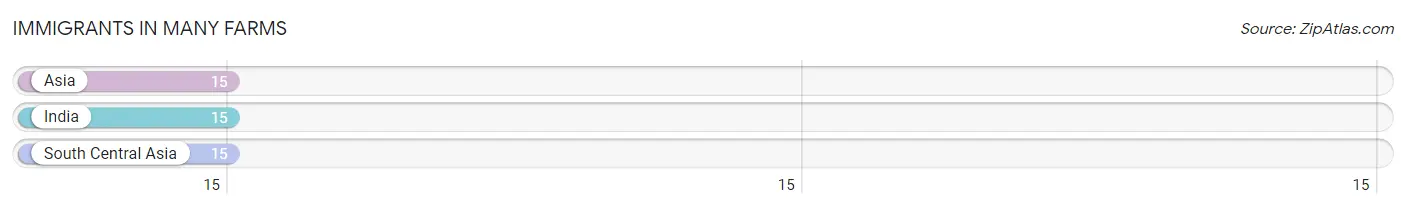
| Immigration Origin | # Population | % Population |
| Asia | 15 | 2.2% |
| India | 15 | 2.2% |
| South Central Asia | 15 | 2.2% | View All 3 Rows |
Sex and Age in Many Farms
Sex and Age in Many Farms
The most populous age groups in Many Farms are 55 to 59 Years (57 | 12.4%) for men and 35 to 39 Years (42 | 18.1%) for women.
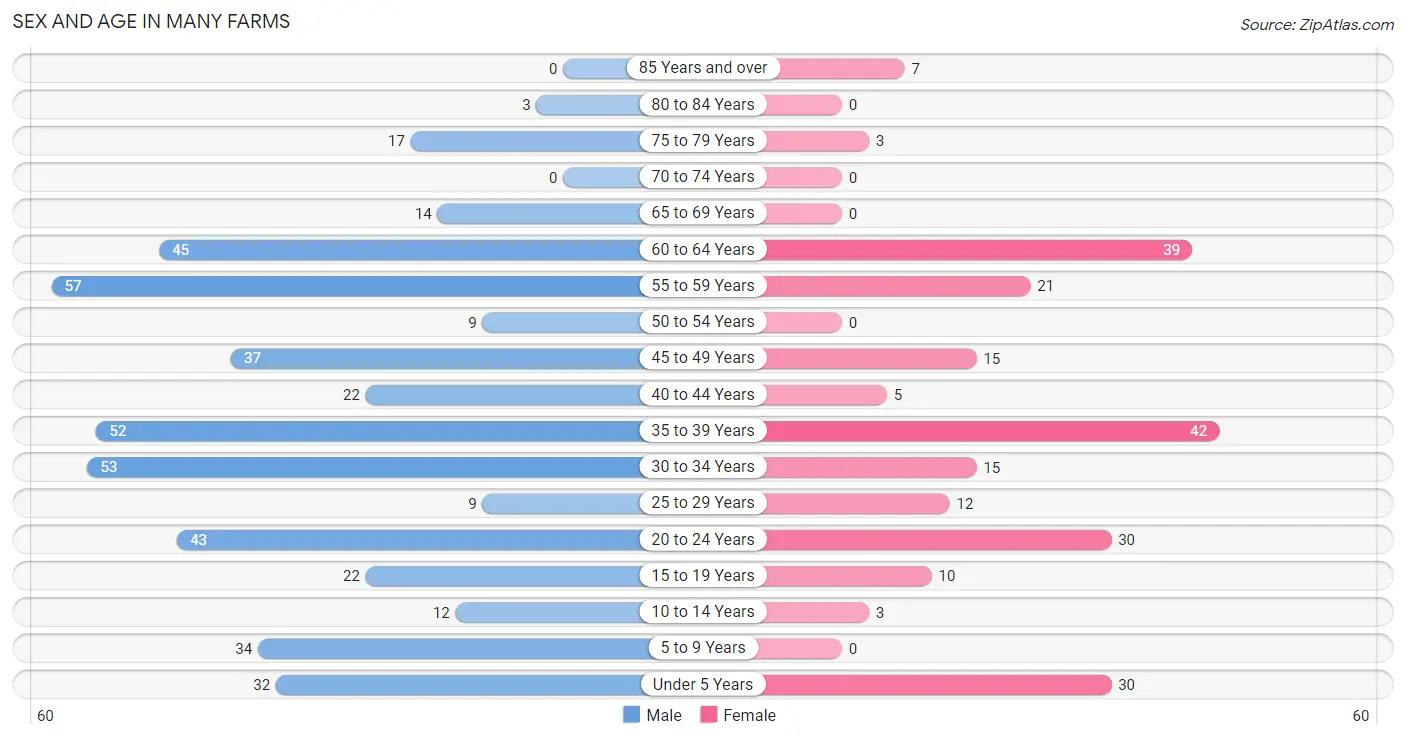
| Age Bracket | Male | Female |
| Under 5 Years | 32 (6.9%) | 30 (12.9%) |
| 5 to 9 Years | 34 (7.4%) | 0 (0.0%) |
| 10 to 14 Years | 12 (2.6%) | 3 (1.3%) |
| 15 to 19 Years | 22 (4.8%) | 10 (4.3%) |
| 20 to 24 Years | 43 (9.3%) | 30 (12.9%) |
| 25 to 29 Years | 9 (1.9%) | 12 (5.2%) |
| 30 to 34 Years | 53 (11.5%) | 15 (6.5%) |
| 35 to 39 Years | 52 (11.3%) | 42 (18.1%) |
| 40 to 44 Years | 22 (4.8%) | 5 (2.2%) |
| 45 to 49 Years | 37 (8.0%) | 15 (6.5%) |
| 50 to 54 Years | 9 (1.9%) | 0 (0.0%) |
| 55 to 59 Years | 57 (12.4%) | 21 (9.0%) |
| 60 to 64 Years | 45 (9.8%) | 39 (16.8%) |
| 65 to 69 Years | 14 (3.0%) | 0 (0.0%) |
| 70 to 74 Years | 0 (0.0%) | 0 (0.0%) |
| 75 to 79 Years | 17 (3.7%) | 3 (1.3%) |
| 80 to 84 Years | 3 (0.6%) | 0 (0.0%) |
| 85 Years and over | 0 (0.0%) | 7 (3.0%) |
| Total | 461 (100.0%) | 232 (100.0%) |
Families and Households in Many Farms
Median Family Size in Many Farms
The median family size in Many Farms is 4.37 persons per family, with single female/mother families (37 | 32.7%) accounting for the largest median family size of 5.68 persons per family. On the other hand, single male/father families (19 | 16.8%) represent the smallest median family size with 3.47 persons per family.
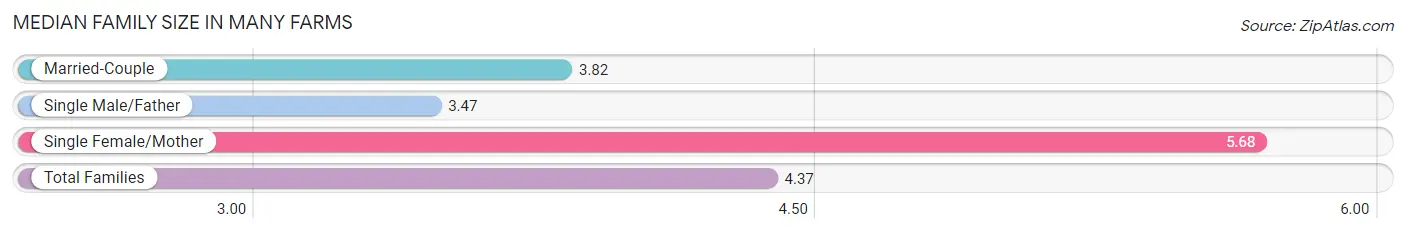
| Family Type | # Families | Family Size |
| Married-Couple | 57 (50.4%) | 3.82 |
| Single Male/Father | 19 (16.8%) | 3.47 |
| Single Female/Mother | 37 (32.7%) | 5.68 |
| Total Families | 113 (100.0%) | 4.37 |
Median Household Size in Many Farms
The median household size in Many Farms is 2.52 persons per household, with single female/mother households (37 | 13.7%) accounting for the largest median household size of 5.84 persons per household. non-family households (158 | 58.3%) represent the smallest median household size with 1.16 persons per household.
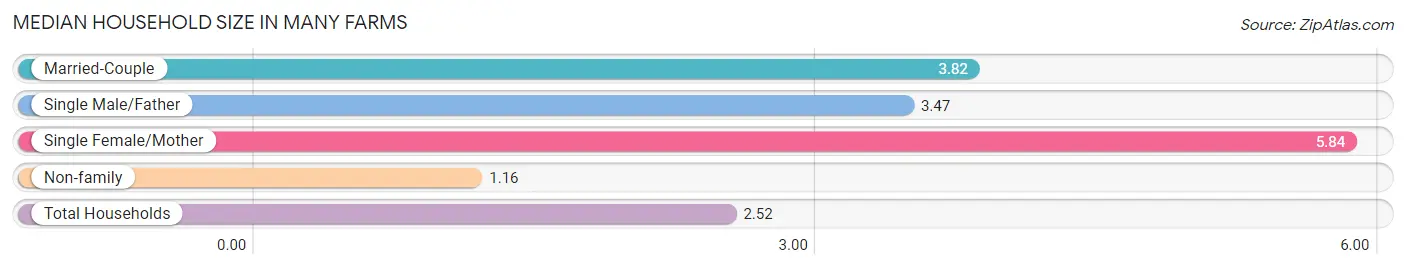
| Household Type | # Households | Household Size |
| Married-Couple | 57 (21.0%) | 3.82 |
| Single Male/Father | 19 (7.0%) | 3.47 |
| Single Female/Mother | 37 (13.7%) | 5.84 |
| Non-family | 158 (58.3%) | 1.16 |
| Total Households | 271 (100.0%) | 2.52 |
Household Size by Marriage Status in Many Farms
Out of a total of 271 households in Many Farms, 113 (41.7%) are family households, while 158 (58.3%) are nonfamily households. The most numerous type of family households are 2-person households, comprising 51, and the most common type of nonfamily households are 1-person households, comprising 136.
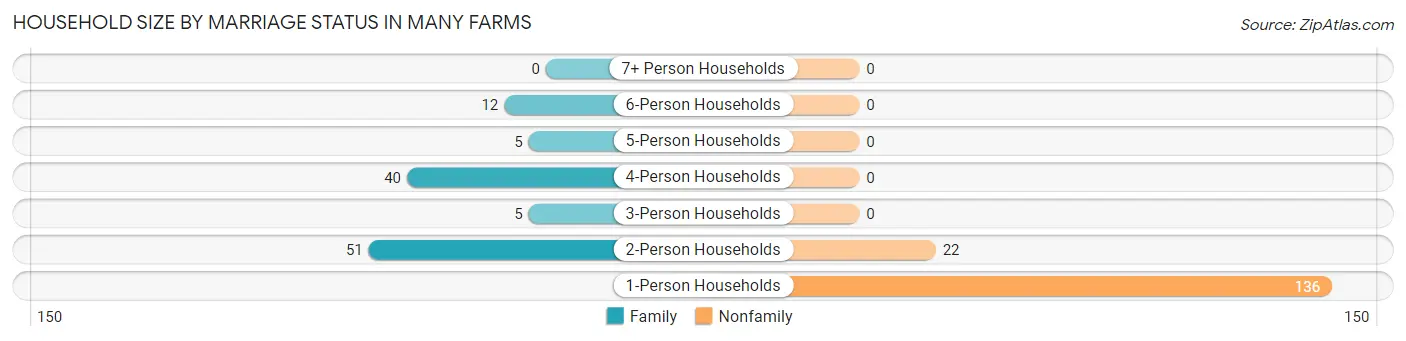
| Household Size | Family Households | Nonfamily Households |
| 1-Person Households | - | 136 (50.2%) |
| 2-Person Households | 51 (18.8%) | 22 (8.1%) |
| 3-Person Households | 5 (1.8%) | 0 (0.0%) |
| 4-Person Households | 40 (14.8%) | 0 (0.0%) |
| 5-Person Households | 5 (1.8%) | 0 (0.0%) |
| 6-Person Households | 12 (4.4%) | 0 (0.0%) |
| 7+ Person Households | 0 (0.0%) | 0 (0.0%) |
| Total | 113 (41.7%) | 158 (58.3%) |
Female Fertility in Many Farms
Fertility by Age in Many Farms
Average fertility rate in Many Farms is 248.0 births per 1,000 women. Women in the age bracket of 20 to 34 years have the highest fertility rate with 333.0 births per 1,000 women. Women in the age bracket of 20 to 34 years acount for 59.4% of all women with births.
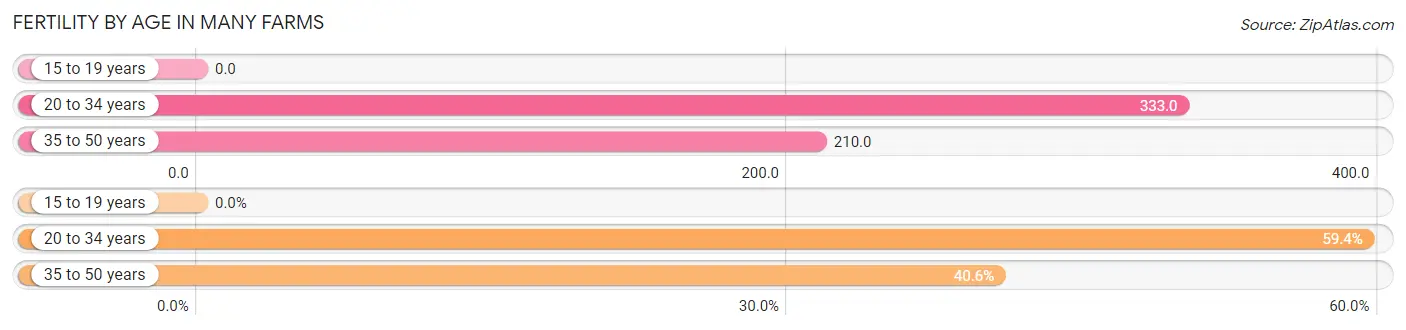
| Age Bracket | Women with Births | Births / 1,000 Women |
| 15 to 19 years | 0 (0.0%) | 0.0 |
| 20 to 34 years | 19 (59.4%) | 333.0 |
| 35 to 50 years | 13 (40.6%) | 210.0 |
| Total | 32 (100.0%) | 248.0 |
Fertility by Age by Marriage Status in Many Farms
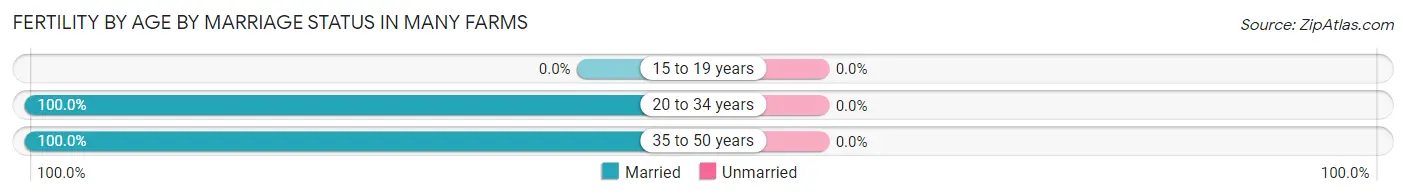
| Age Bracket | Married | Unmarried |
| 15 to 19 years | 0 (0.0%) | 0 (0.0%) |
| 20 to 34 years | 19 (100.0%) | 0 (0.0%) |
| 35 to 50 years | 13 (100.0%) | 0 (0.0%) |
| Total | 32 (100.0%) | 0 (0.0%) |
Fertility by Education in Many Farms
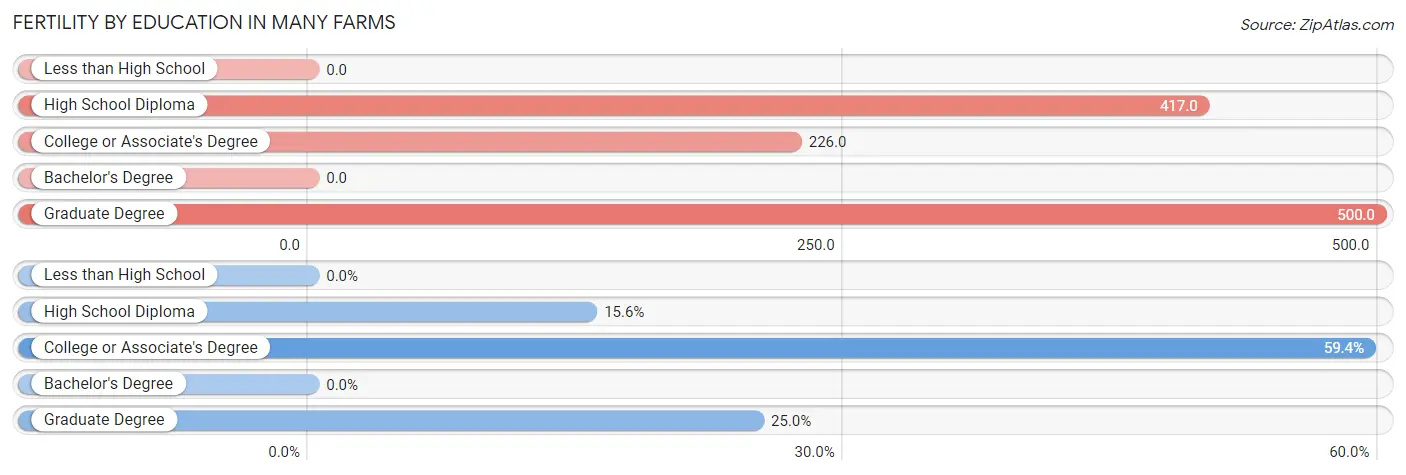
| Educational Attainment | Women with Births | Births / 1,000 Women |
| Less than High School | 0 (0.0%) | 0.0 |
| High School Diploma | 5 (15.6%) | 417.0 |
| College or Associate's Degree | 19 (59.4%) | 226.0 |
| Bachelor's Degree | 0 (0.0%) | 0.0 |
| Graduate Degree | 8 (25.0%) | 500.0 |
| Total | 32 (100.0%) | 248.0 |
Fertility by Education by Marriage Status in Many Farms
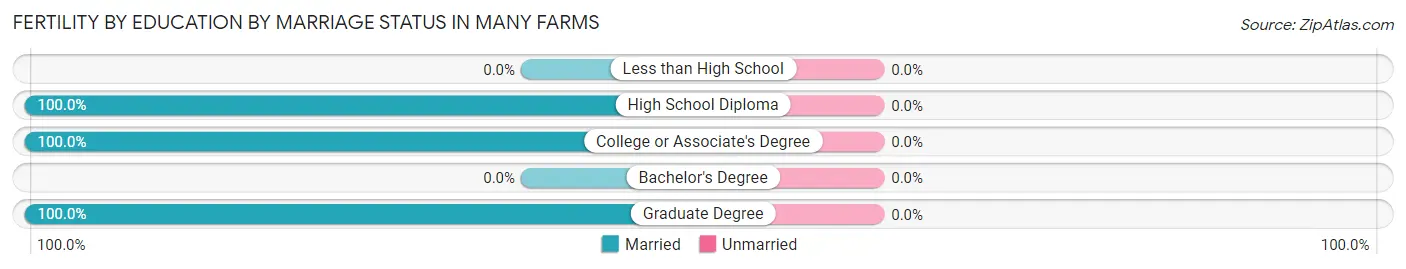
| Educational Attainment | Married | Unmarried |
| Less than High School | 0 (0.0%) | 0 (0.0%) |
| High School Diploma | 5 (100.0%) | 0 (0.0%) |
| College or Associate's Degree | 19 (100.0%) | 0 (0.0%) |
| Bachelor's Degree | 0 (0.0%) | 0 (0.0%) |
| Graduate Degree | 8 (100.0%) | 0 (0.0%) |
| Total | 32 (100.0%) | 0 (0.0%) |
Employment Characteristics in Many Farms
Employment by Class of Employer in Many Farms
Among the 230 employed individuals in Many Farms, private company employees (83 | 36.1%), federal government employees (64 | 27.8%), and state government employees (40 | 17.4%) make up the most common classes of employment.
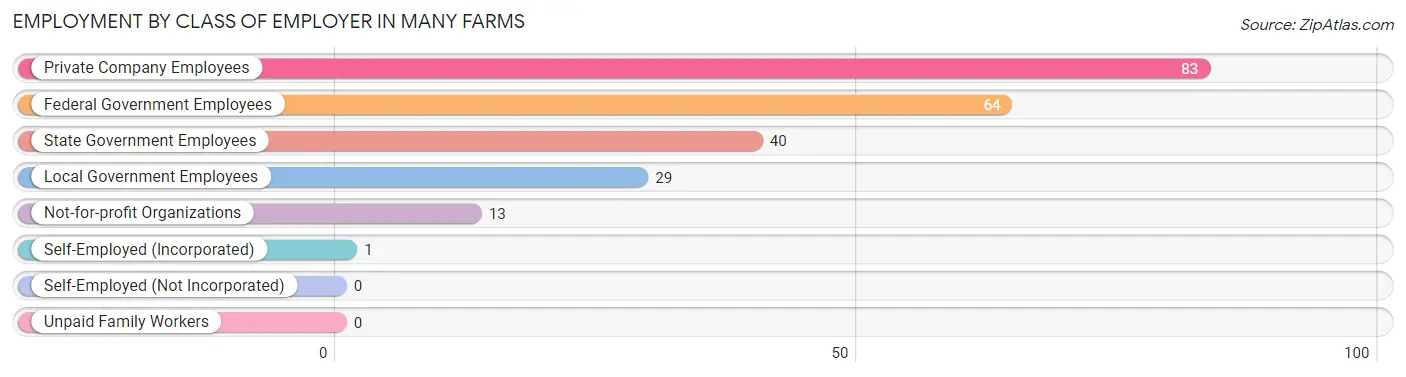
| Employer Class | # Employees | % Employees |
| Private Company Employees | 83 | 36.1% |
| Self-Employed (Incorporated) | 1 | 0.4% |
| Self-Employed (Not Incorporated) | 0 | 0.0% |
| Not-for-profit Organizations | 13 | 5.7% |
| Local Government Employees | 29 | 12.6% |
| State Government Employees | 40 | 17.4% |
| Federal Government Employees | 64 | 27.8% |
| Unpaid Family Workers | 0 | 0.0% |
| Total | 230 | 100.0% |
Employment Status by Age in Many Farms
According to the labor force statistics for Many Farms, out of the total population over 16 years of age (582), 40.0% or 233 individuals are in the labor force, with 1.3% or 3 of them unemployed. The age group with the highest labor force participation rate is 30 to 34 years, with 85.3% or 58 individuals in the labor force. Within the labor force, the 65 to 74 years age range has the highest percentage of unemployed individuals, with 100.0% or 3 of them being unemployed.
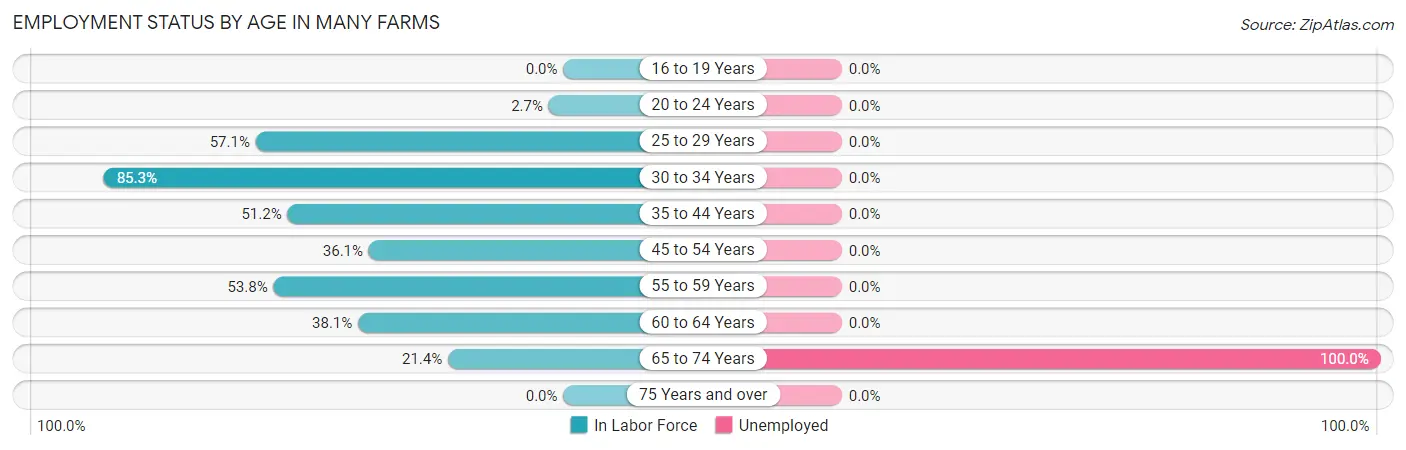
| Age Bracket | In Labor Force | Unemployed |
| 16 to 19 Years | 0 (0.0%) | 0 (0.0%) |
| 20 to 24 Years | 2 (2.7%) | 0 (0.0%) |
| 25 to 29 Years | 12 (57.1%) | 0 (0.0%) |
| 30 to 34 Years | 58 (85.3%) | 0 (0.0%) |
| 35 to 44 Years | 62 (51.2%) | 0 (0.0%) |
| 45 to 54 Years | 22 (36.1%) | 0 (0.0%) |
| 55 to 59 Years | 42 (53.8%) | 0 (0.0%) |
| 60 to 64 Years | 32 (38.1%) | 0 (0.0%) |
| 65 to 74 Years | 3 (21.4%) | 3 (100.0%) |
| 75 Years and over | 0 (0.0%) | 0 (0.0%) |
| Total | 233 (40.0%) | 3 (1.3%) |
Employment Status by Educational Attainment in Many Farms
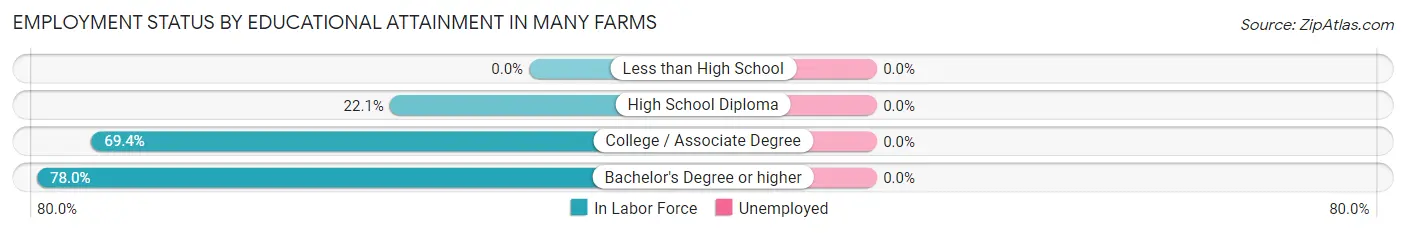
| Educational Attainment | In Labor Force | Unemployed |
| Less than High School | 0 (0.0%) | 0 (0.0%) |
| High School Diploma | 25 (22.1%) | 0 (0.0%) |
| College / Associate Degree | 118 (69.4%) | 0 (0.0%) |
| Bachelor's Degree or higher | 85 (78.0%) | 0 (0.0%) |
| Total | 228 (52.7%) | 0 (0.0%) |
Employment Occupations by Sex in Many Farms
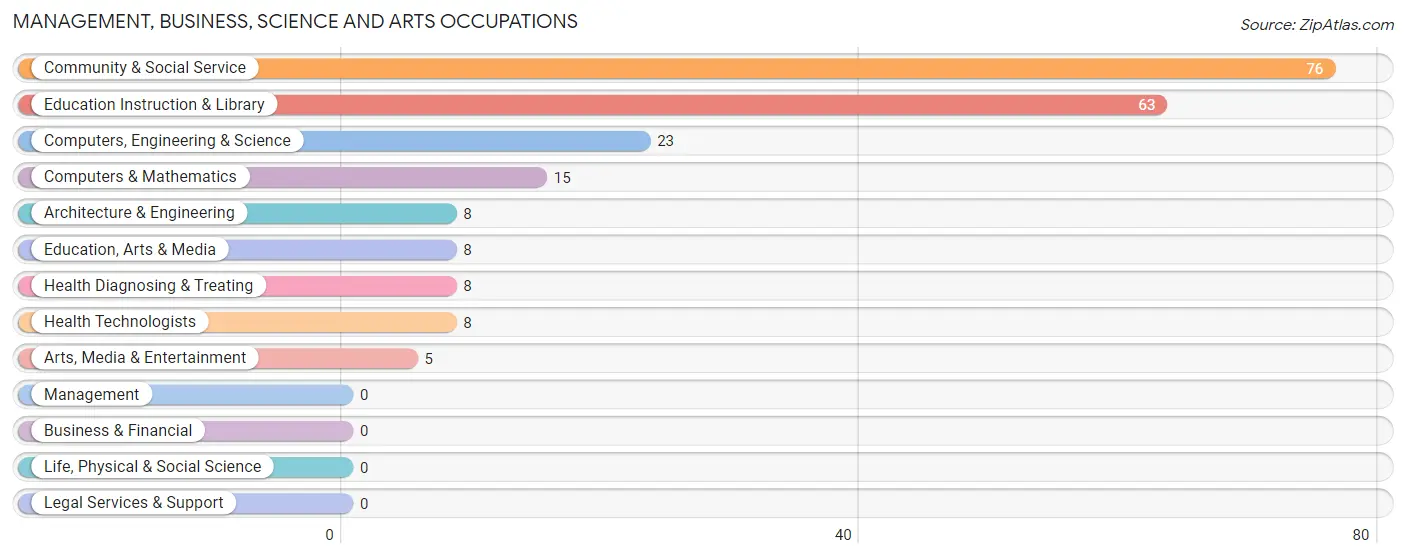
Management, Business, Science and Arts Occupations
The most common Management, Business, Science and Arts occupations in Many Farms are Community & Social Service (76 | 33.0%), Education Instruction & Library (63 | 27.4%), Computers, Engineering & Science (23 | 10.0%), Computers & Mathematics (15 | 6.5%), and Architecture & Engineering (8 | 3.5%).
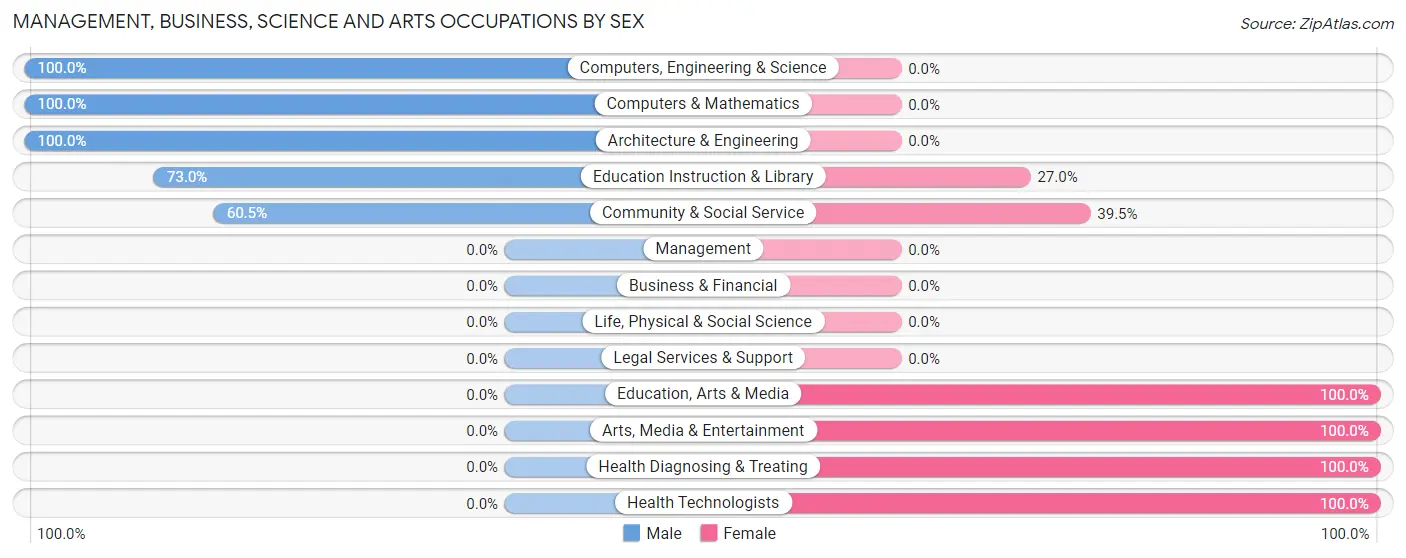
Management, Business, Science and Arts Occupations by Sex
Within the Management, Business, Science and Arts occupations in Many Farms, the most male-oriented occupations are Computers, Engineering & Science (100.0%), Computers & Mathematics (100.0%), and Architecture & Engineering (100.0%), while the most female-oriented occupations are Education, Arts & Media (100.0%), Arts, Media & Entertainment (100.0%), and Health Diagnosing & Treating (100.0%).
| Occupation | Male | Female |
| Management | 0 (0.0%) | 0 (0.0%) |
| Business & Financial | 0 (0.0%) | 0 (0.0%) |
| Computers, Engineering & Science | 23 (100.0%) | 0 (0.0%) |
| Computers & Mathematics | 15 (100.0%) | 0 (0.0%) |
| Architecture & Engineering | 8 (100.0%) | 0 (0.0%) |
| Life, Physical & Social Science | 0 (0.0%) | 0 (0.0%) |
| Community & Social Service | 46 (60.5%) | 30 (39.5%) |
| Education, Arts & Media | 0 (0.0%) | 8 (100.0%) |
| Legal Services & Support | 0 (0.0%) | 0 (0.0%) |
| Education Instruction & Library | 46 (73.0%) | 17 (27.0%) |
| Arts, Media & Entertainment | 0 (0.0%) | 5 (100.0%) |
| Health Diagnosing & Treating | 0 (0.0%) | 8 (100.0%) |
| Health Technologists | 0 (0.0%) | 8 (100.0%) |
| Total (Category) | 69 (64.5%) | 38 (35.5%) |
| Total (Overall) | 122 (53.0%) | 108 (47.0%) |
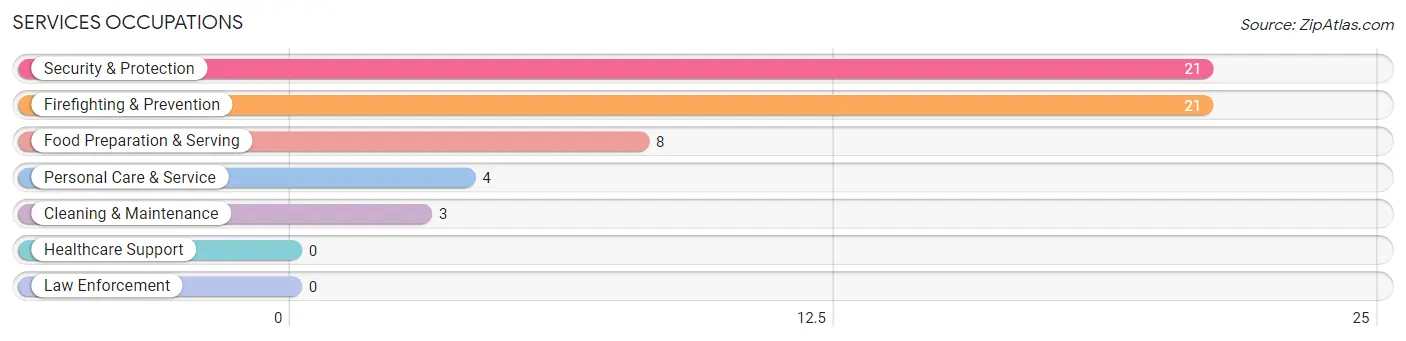
Services Occupations
The most common Services occupations in Many Farms are Security & Protection (21 | 9.1%), Firefighting & Prevention (21 | 9.1%), Food Preparation & Serving (8 | 3.5%), Personal Care & Service (4 | 1.7%), and Cleaning & Maintenance (3 | 1.3%).
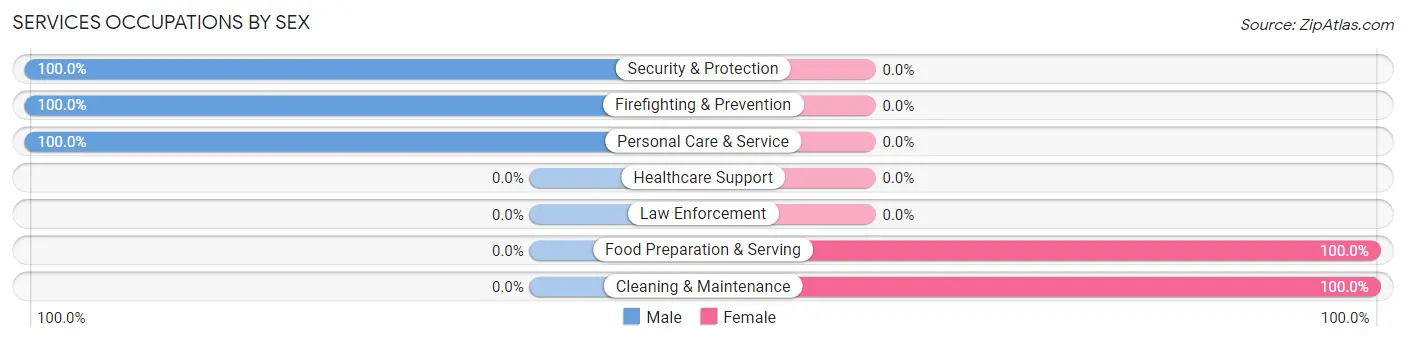
Services Occupations by Sex
Within the Services occupations in Many Farms, the most male-oriented occupations are Security & Protection (100.0%), Firefighting & Prevention (100.0%), and Personal Care & Service (100.0%), while the most female-oriented occupations are Food Preparation & Serving (100.0%), and Cleaning & Maintenance (100.0%).
| Occupation | Male | Female |
| Healthcare Support | 0 (0.0%) | 0 (0.0%) |
| Security & Protection | 21 (100.0%) | 0 (0.0%) |
| Firefighting & Prevention | 21 (100.0%) | 0 (0.0%) |
| Law Enforcement | 0 (0.0%) | 0 (0.0%) |
| Food Preparation & Serving | 0 (0.0%) | 8 (100.0%) |
| Cleaning & Maintenance | 0 (0.0%) | 3 (100.0%) |
| Personal Care & Service | 4 (100.0%) | 0 (0.0%) |
| Total (Category) | 25 (69.4%) | 11 (30.6%) |
| Total (Overall) | 122 (53.0%) | 108 (47.0%) |
Sales and Office Occupations
The most common Sales and Office occupations in Many Farms are Office & Administration (39 | 17.0%), and Sales & Related (13 | 5.7%).
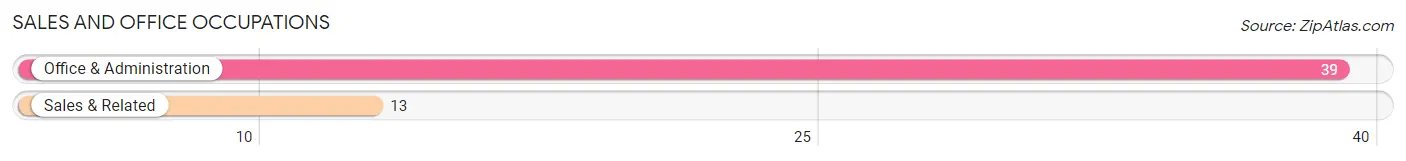
Sales and Office Occupations by Sex
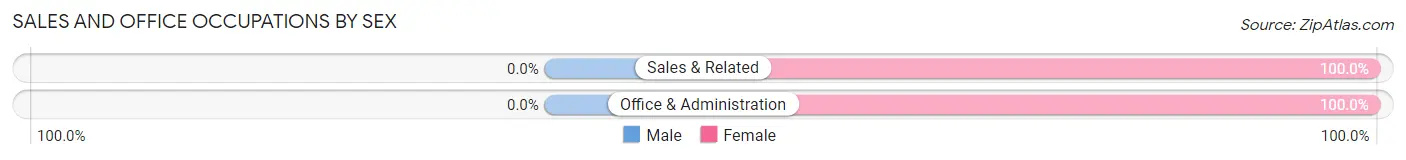
| Occupation | Male | Female |
| Sales & Related | 0 (0.0%) | 13 (100.0%) |
| Office & Administration | 0 (0.0%) | 39 (100.0%) |
| Total (Category) | 0 (0.0%) | 52 (100.0%) |
| Total (Overall) | 122 (53.0%) | 108 (47.0%) |
Natural Resources, Construction and Maintenance Occupations
The most common Natural Resources, Construction and Maintenance occupations in Many Farms are Construction & Extraction (11 | 4.8%), and Installation, Maintenance & Repair (9 | 3.9%).
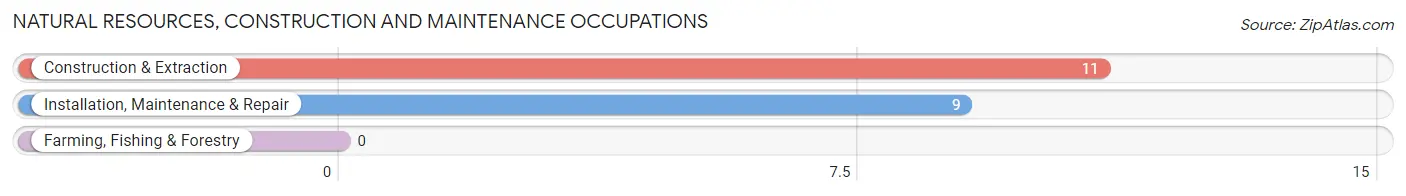
Natural Resources, Construction and Maintenance Occupations by Sex
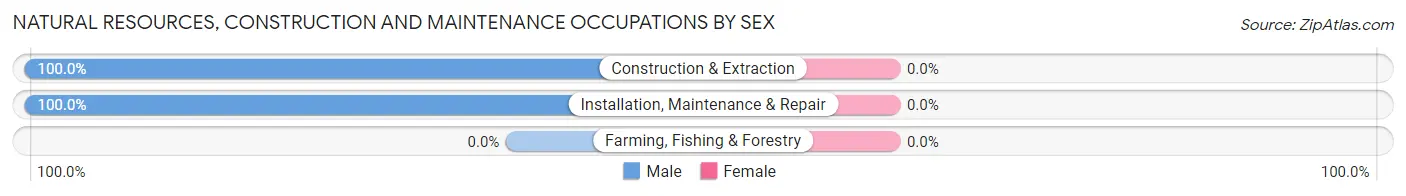
| Occupation | Male | Female |
| Farming, Fishing & Forestry | 0 (0.0%) | 0 (0.0%) |
| Construction & Extraction | 11 (100.0%) | 0 (0.0%) |
| Installation, Maintenance & Repair | 9 (100.0%) | 0 (0.0%) |
| Total (Category) | 20 (100.0%) | 0 (0.0%) |
| Total (Overall) | 122 (53.0%) | 108 (47.0%) |
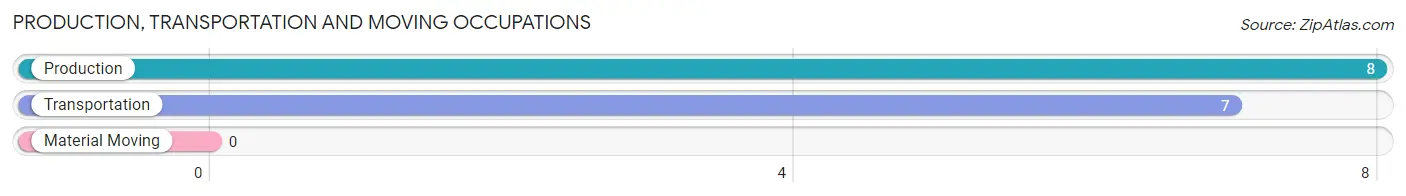
Production, Transportation and Moving Occupations
The most common Production, Transportation and Moving occupations in Many Farms are Production (8 | 3.5%), and Transportation (7 | 3.0%).
Production, Transportation and Moving Occupations by Sex
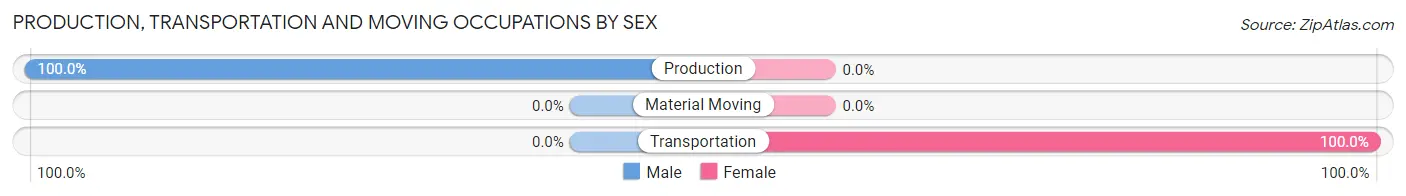
| Occupation | Male | Female |
| Production | 8 (100.0%) | 0 (0.0%) |
| Transportation | 0 (0.0%) | 7 (100.0%) |
| Material Moving | 0 (0.0%) | 0 (0.0%) |
| Total (Category) | 8 (53.3%) | 7 (46.7%) |
| Total (Overall) | 122 (53.0%) | 108 (47.0%) |
Employment Industries by Sex in Many Farms
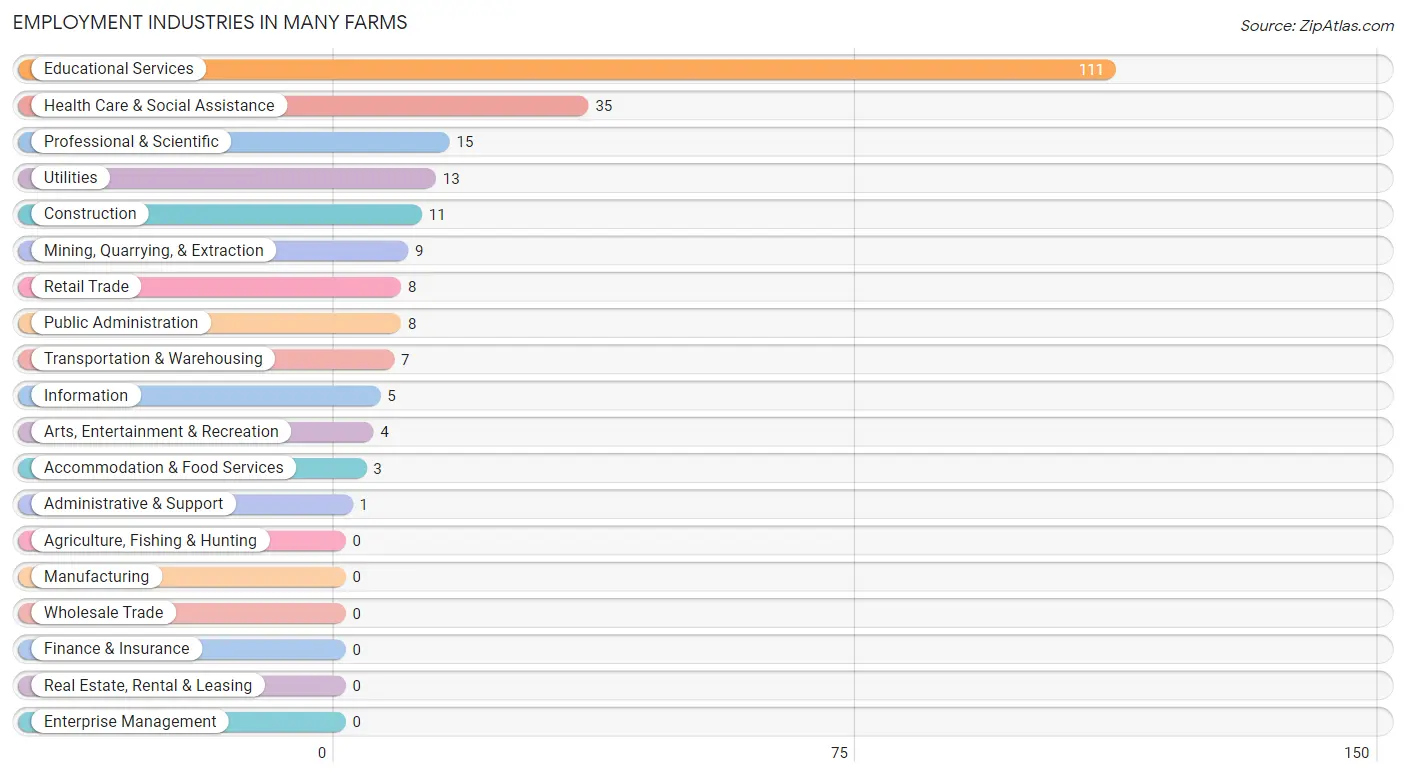
Employment Industries in Many Farms
The major employment industries in Many Farms include Educational Services (111 | 48.3%), Health Care & Social Assistance (35 | 15.2%), Professional & Scientific (15 | 6.5%), Utilities (13 | 5.7%), and Construction (11 | 4.8%).
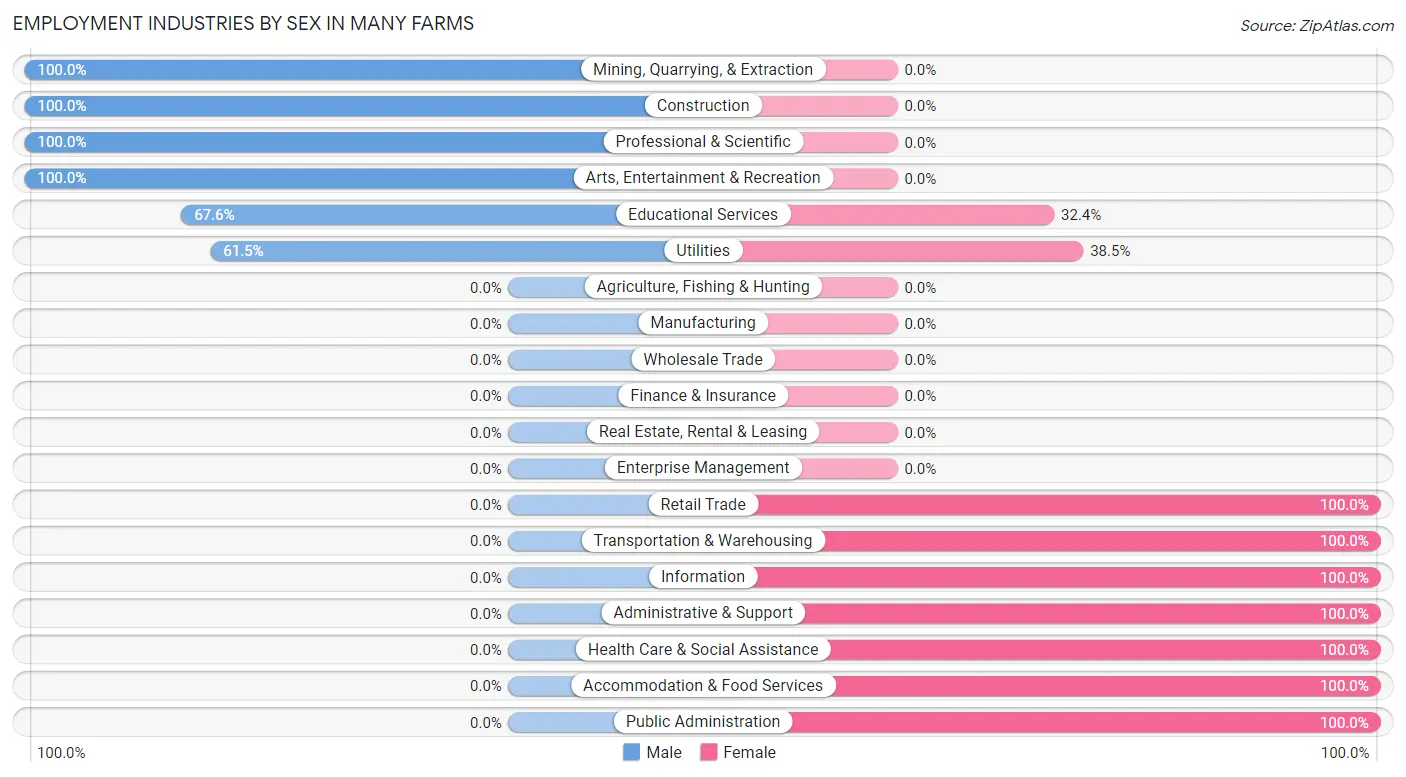
Employment Industries by Sex in Many Farms
The Many Farms industries that see more men than women are Mining, Quarrying, & Extraction (100.0%), Construction (100.0%), and Professional & Scientific (100.0%), whereas the industries that tend to have a higher number of women are Retail Trade (100.0%), Transportation & Warehousing (100.0%), and Information (100.0%).
| Industry | Male | Female |
| Agriculture, Fishing & Hunting | 0 (0.0%) | 0 (0.0%) |
| Mining, Quarrying, & Extraction | 9 (100.0%) | 0 (0.0%) |
| Construction | 11 (100.0%) | 0 (0.0%) |
| Manufacturing | 0 (0.0%) | 0 (0.0%) |
| Wholesale Trade | 0 (0.0%) | 0 (0.0%) |
| Retail Trade | 0 (0.0%) | 8 (100.0%) |
| Transportation & Warehousing | 0 (0.0%) | 7 (100.0%) |
| Utilities | 8 (61.5%) | 5 (38.5%) |
| Information | 0 (0.0%) | 5 (100.0%) |
| Finance & Insurance | 0 (0.0%) | 0 (0.0%) |
| Real Estate, Rental & Leasing | 0 (0.0%) | 0 (0.0%) |
| Professional & Scientific | 15 (100.0%) | 0 (0.0%) |
| Enterprise Management | 0 (0.0%) | 0 (0.0%) |
| Administrative & Support | 0 (0.0%) | 1 (100.0%) |
| Educational Services | 75 (67.6%) | 36 (32.4%) |
| Health Care & Social Assistance | 0 (0.0%) | 35 (100.0%) |
| Arts, Entertainment & Recreation | 4 (100.0%) | 0 (0.0%) |
| Accommodation & Food Services | 0 (0.0%) | 3 (100.0%) |
| Public Administration | 0 (0.0%) | 8 (100.0%) |
| Total | 122 (53.0%) | 108 (47.0%) |
Education in Many Farms
School Enrollment in Many Farms
The most common levels of schooling among the 126 students in Many Farms are high school (49 | 38.9%), college / undergraduate (37 | 29.4%), and elementary school (25 | 19.8%).
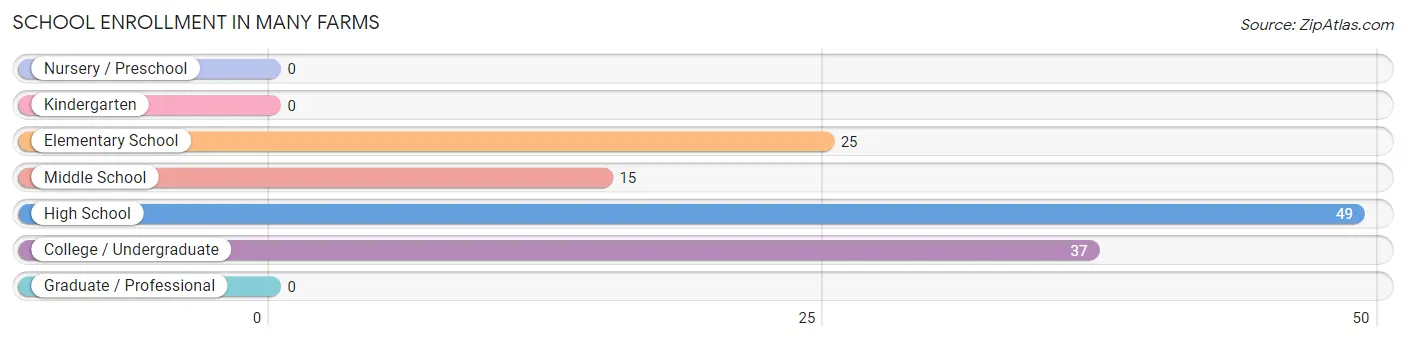
| School Level | # Students | % Students |
| Nursery / Preschool | 0 | 0.0% |
| Kindergarten | 0 | 0.0% |
| Elementary School | 25 | 19.8% |
| Middle School | 15 | 11.9% |
| High School | 49 | 38.9% |
| College / Undergraduate | 37 | 29.4% |
| Graduate / Professional | 0 | 0.0% |
| Total | 126 | 100.0% |
School Enrollment by Age by Funding Source in Many Farms
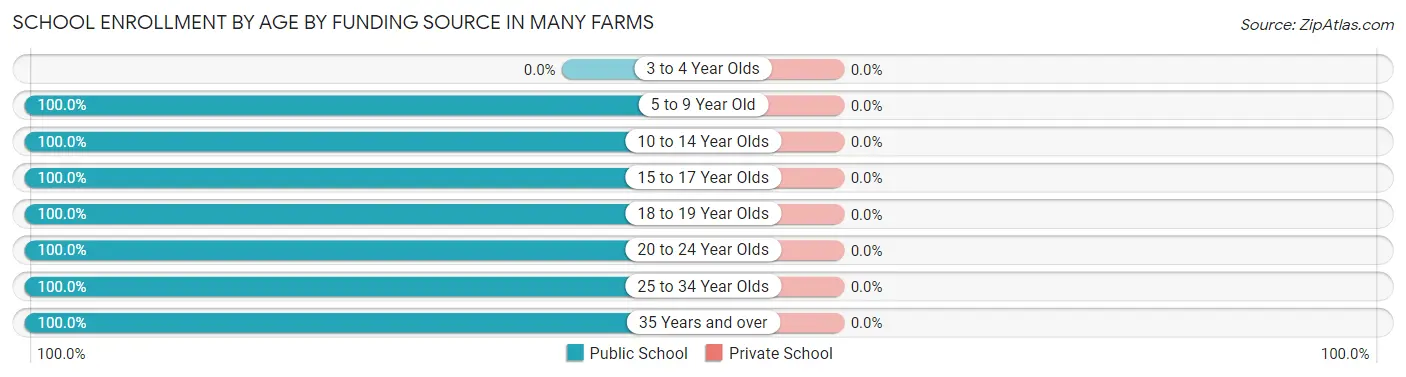
| Age Bracket | Public School | Private School |
| 3 to 4 Year Olds | 0 (0.0%) | 0 (0.0%) |
| 5 to 9 Year Old | 25 (100.0%) | 0 (0.0%) |
| 10 to 14 Year Olds | 15 (100.0%) | 0 (0.0%) |
| 15 to 17 Year Olds | 8 (100.0%) | 0 (0.0%) |
| 18 to 19 Year Olds | 10 (100.0%) | 0 (0.0%) |
| 20 to 24 Year Olds | 59 (100.0%) | 0 (0.0%) |
| 25 to 34 Year Olds | 1 (100.0%) | 0 (0.0%) |
| 35 Years and over | 8 (100.0%) | 0 (0.0%) |
| Total | 126 (100.0%) | 0 (0.0%) |
Educational Attainment by Field of Study in Many Farms
Education (57 | 52.3%), engineering (24 | 22.0%), computers & mathematics (15 | 13.8%), science & technology (8 | 7.3%), and bio, nature & agricultural (5 | 4.6%) are the most common fields of study among 109 individuals in Many Farms who have obtained a bachelor's degree or higher.
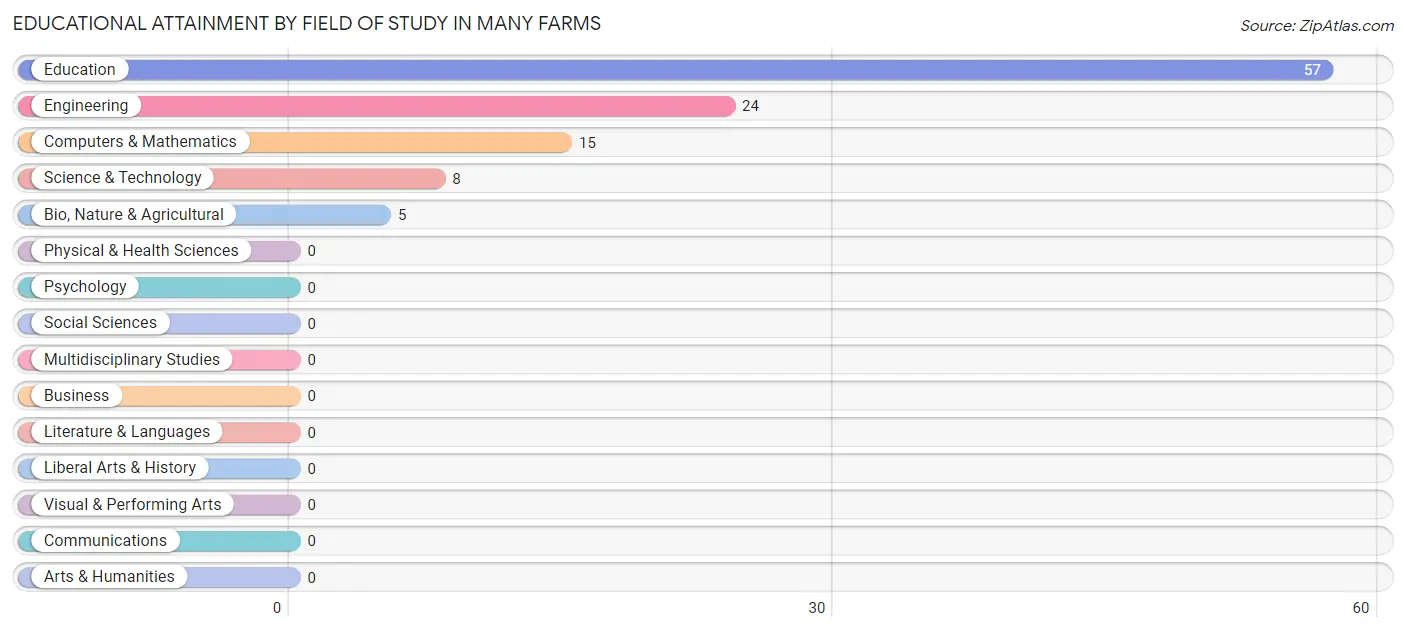
| Field of Study | # Graduates | % Graduates |
| Computers & Mathematics | 15 | 13.8% |
| Bio, Nature & Agricultural | 5 | 4.6% |
| Physical & Health Sciences | 0 | 0.0% |
| Psychology | 0 | 0.0% |
| Social Sciences | 0 | 0.0% |
| Engineering | 24 | 22.0% |
| Multidisciplinary Studies | 0 | 0.0% |
| Science & Technology | 8 | 7.3% |
| Business | 0 | 0.0% |
| Education | 57 | 52.3% |
| Literature & Languages | 0 | 0.0% |
| Liberal Arts & History | 0 | 0.0% |
| Visual & Performing Arts | 0 | 0.0% |
| Communications | 0 | 0.0% |
| Arts & Humanities | 0 | 0.0% |
| Total | 109 | 100.0% |
Transportation & Commute in Many Farms
Vehicle Availability by Sex in Many Farms
The most prevalent vehicle ownership categories in Many Farms are males with 1 vehicle (85, accounting for 69.7%) and females with 1 vehicle (44, making up 82.5%).
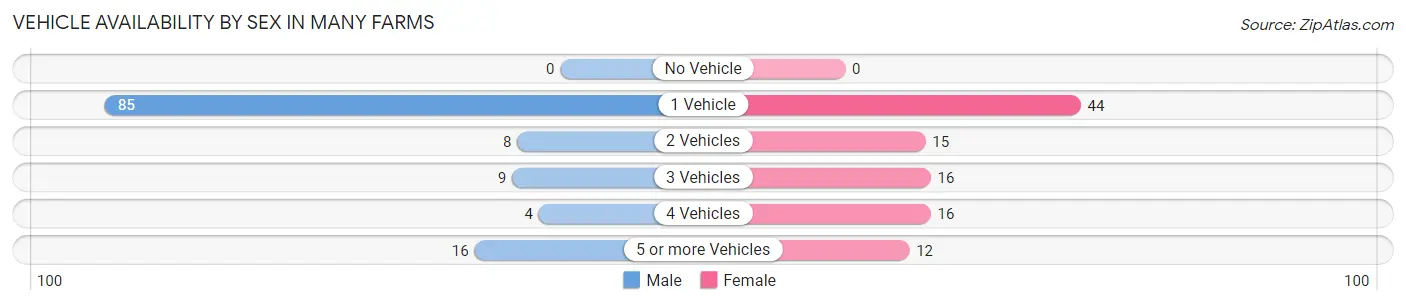
| Vehicles Available | Male | Female |
| No Vehicle | 0 (0.0%) | 0 (0.0%) |
| 1 Vehicle | 85 (69.7%) | 44 (42.7%) |
| 2 Vehicles | 8 (6.6%) | 15 (14.6%) |
| 3 Vehicles | 9 (7.4%) | 16 (15.5%) |
| 4 Vehicles | 4 (3.3%) | 16 (15.5%) |
| 5 or more Vehicles | 16 (13.1%) | 12 (11.7%) |
| Total | 122 (100.0%) | 103 (100.0%) |
Commute Time in Many Farms
The most frequently occuring commute durations in Many Farms are 5 to 9 minutes (109 commuters, 47.4%), 30 to 34 minutes (57 commuters, 24.8%), and 20 to 24 minutes (17 commuters, 7.4%).
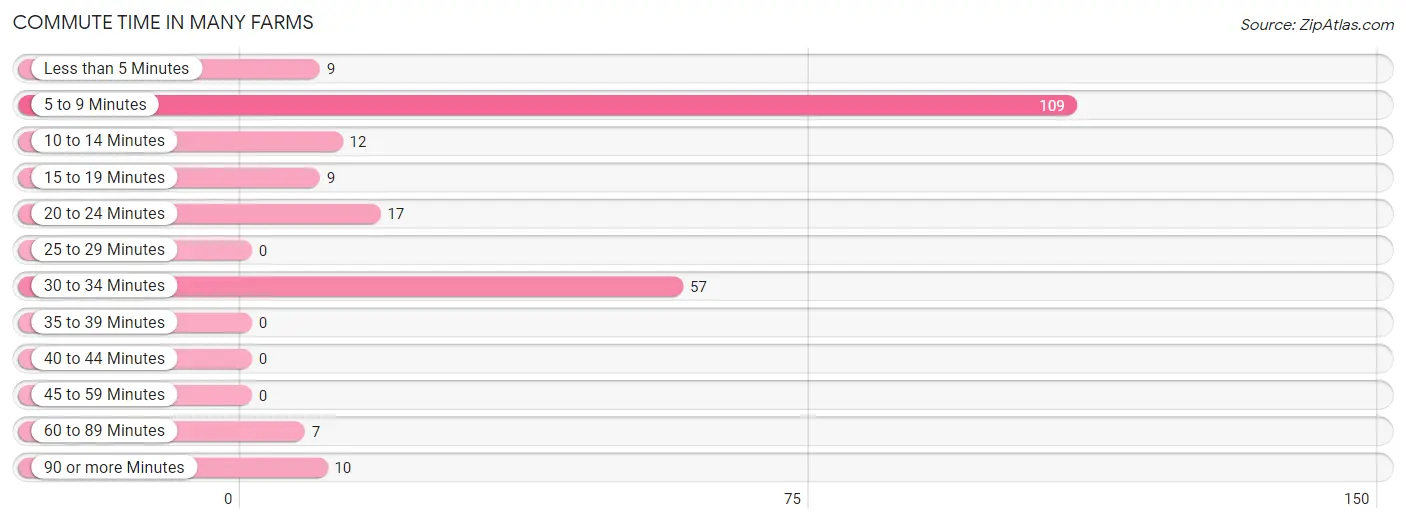
| Commute Time | # Commuters | % Commuters |
| Less than 5 Minutes | 9 | 3.9% |
| 5 to 9 Minutes | 109 | 47.4% |
| 10 to 14 Minutes | 12 | 5.2% |
| 15 to 19 Minutes | 9 | 3.9% |
| 20 to 24 Minutes | 17 | 7.4% |
| 25 to 29 Minutes | 0 | 0.0% |
| 30 to 34 Minutes | 57 | 24.8% |
| 35 to 39 Minutes | 0 | 0.0% |
| 40 to 44 Minutes | 0 | 0.0% |
| 45 to 59 Minutes | 0 | 0.0% |
| 60 to 89 Minutes | 7 | 3.0% |
| 90 or more Minutes | 10 | 4.3% |
Commute Time by Sex in Many Farms
The most common commute times in Many Farms are 5 to 9 minutes (54 commuters, 44.3%) for males and 5 to 9 minutes (55 commuters, 50.9%) for females.
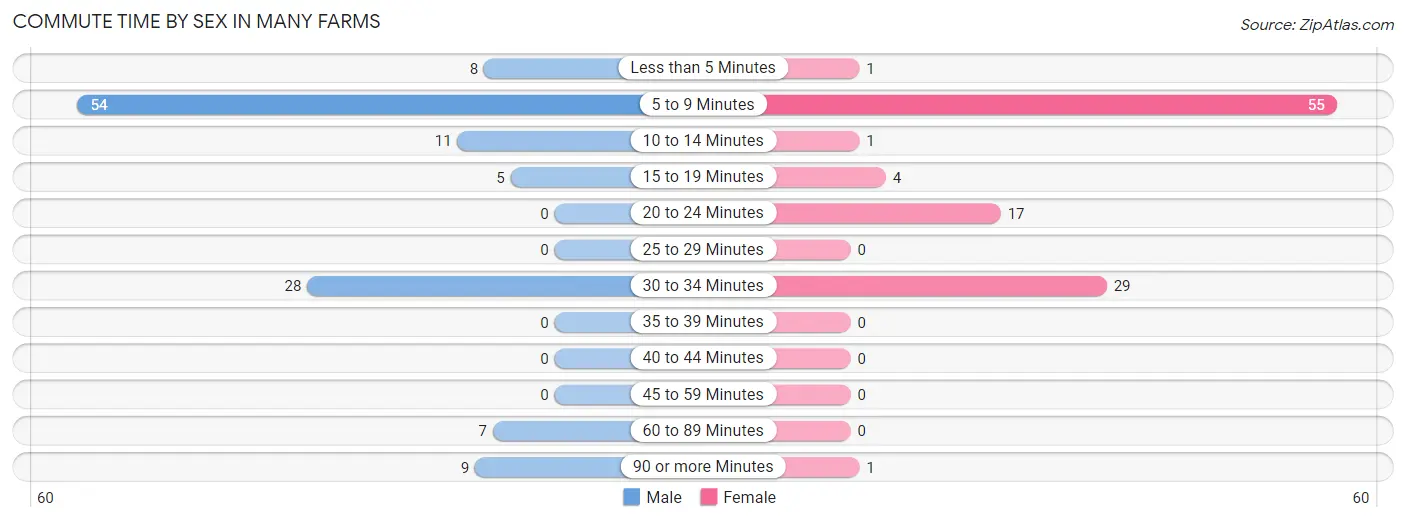
| Commute Time | Male | Female |
| Less than 5 Minutes | 8 (6.6%) | 1 (0.9%) |
| 5 to 9 Minutes | 54 (44.3%) | 55 (50.9%) |
| 10 to 14 Minutes | 11 (9.0%) | 1 (0.9%) |
| 15 to 19 Minutes | 5 (4.1%) | 4 (3.7%) |
| 20 to 24 Minutes | 0 (0.0%) | 17 (15.7%) |
| 25 to 29 Minutes | 0 (0.0%) | 0 (0.0%) |
| 30 to 34 Minutes | 28 (23.0%) | 29 (26.9%) |
| 35 to 39 Minutes | 0 (0.0%) | 0 (0.0%) |
| 40 to 44 Minutes | 0 (0.0%) | 0 (0.0%) |
| 45 to 59 Minutes | 0 (0.0%) | 0 (0.0%) |
| 60 to 89 Minutes | 7 (5.7%) | 0 (0.0%) |
| 90 or more Minutes | 9 (7.4%) | 1 (0.9%) |
Time of Departure to Work by Sex in Many Farms
The most frequent times of departure to work in Many Farms are 7:00 AM to 7:29 AM (71, 58.2%) for males and 7:30 AM to 7:59 AM (60, 55.6%) for females.
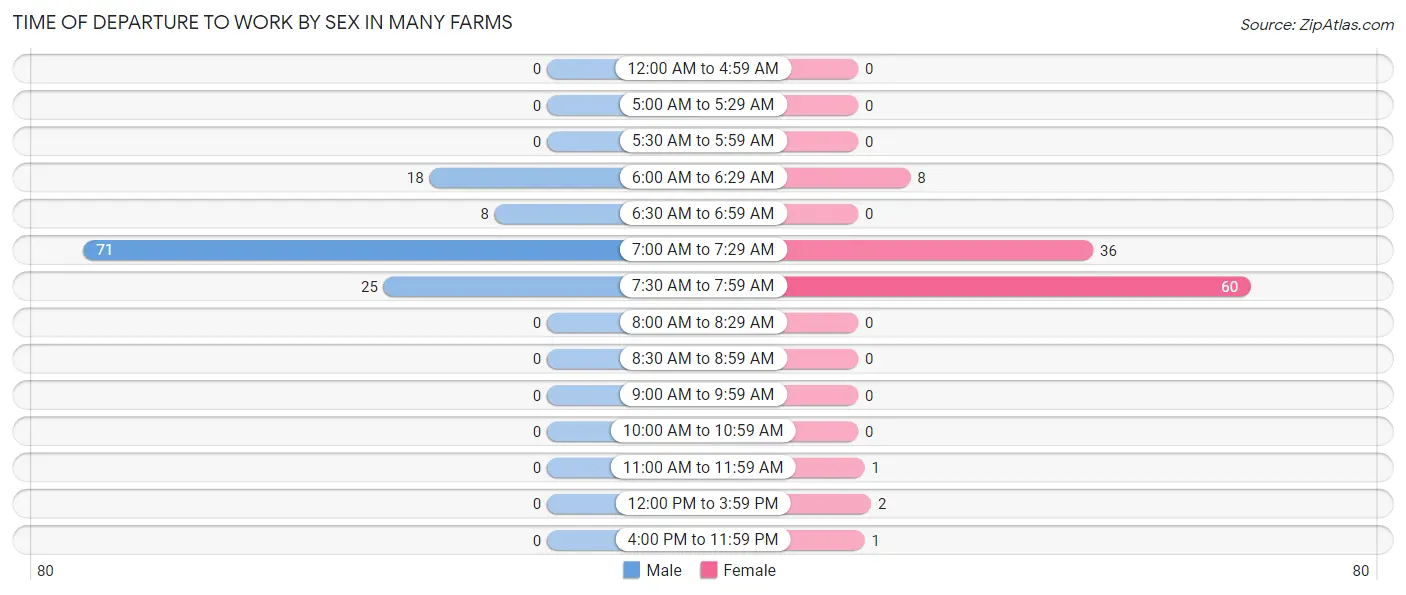
| Time of Departure | Male | Female |
| 12:00 AM to 4:59 AM | 0 (0.0%) | 0 (0.0%) |
| 5:00 AM to 5:29 AM | 0 (0.0%) | 0 (0.0%) |
| 5:30 AM to 5:59 AM | 0 (0.0%) | 0 (0.0%) |
| 6:00 AM to 6:29 AM | 18 (14.7%) | 8 (7.4%) |
| 6:30 AM to 6:59 AM | 8 (6.6%) | 0 (0.0%) |
| 7:00 AM to 7:29 AM | 71 (58.2%) | 36 (33.3%) |
| 7:30 AM to 7:59 AM | 25 (20.5%) | 60 (55.6%) |
| 8:00 AM to 8:29 AM | 0 (0.0%) | 0 (0.0%) |
| 8:30 AM to 8:59 AM | 0 (0.0%) | 0 (0.0%) |
| 9:00 AM to 9:59 AM | 0 (0.0%) | 0 (0.0%) |
| 10:00 AM to 10:59 AM | 0 (0.0%) | 0 (0.0%) |
| 11:00 AM to 11:59 AM | 0 (0.0%) | 1 (0.9%) |
| 12:00 PM to 3:59 PM | 0 (0.0%) | 2 (1.8%) |
| 4:00 PM to 11:59 PM | 0 (0.0%) | 1 (0.9%) |
| Total | 122 (100.0%) | 108 (100.0%) |
Housing Occupancy in Many Farms
Occupancy by Ownership in Many Farms
Of the total 271 dwellings in Many Farms, owner-occupied units account for 144 (53.1%), while renter-occupied units make up 127 (46.9%).
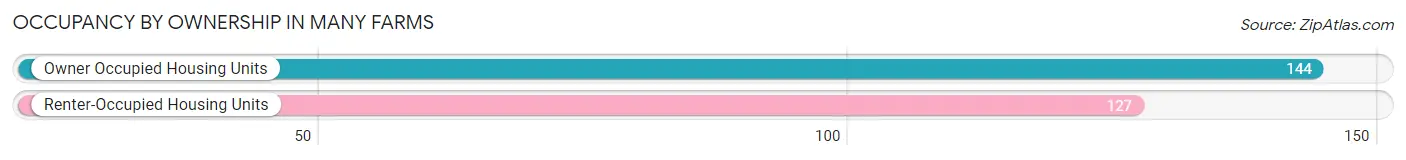
| Occupancy | # Housing Units | % Housing Units |
| Owner Occupied Housing Units | 144 | 53.1% |
| Renter-Occupied Housing Units | 127 | 46.9% |
| Total Occupied Housing Units | 271 | 100.0% |
Occupancy by Household Size in Many Farms
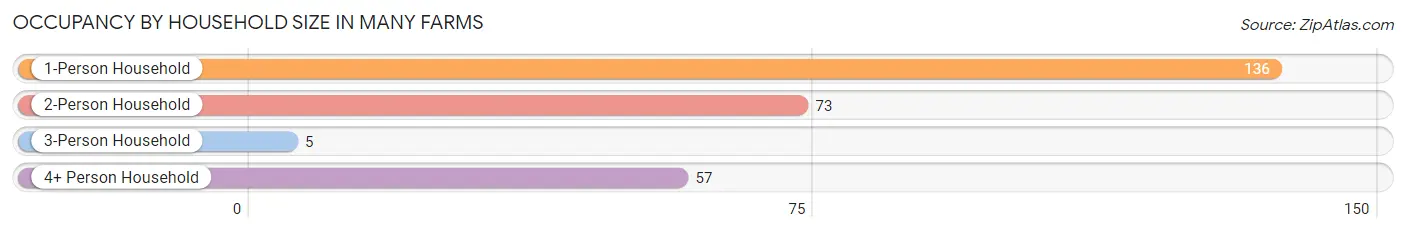
| Household Size | # Housing Units | % Housing Units |
| 1-Person Household | 136 | 50.2% |
| 2-Person Household | 73 | 26.9% |
| 3-Person Household | 5 | 1.8% |
| 4+ Person Household | 57 | 21.0% |
| Total Housing Units | 271 | 100.0% |
Occupancy by Ownership by Household Size in Many Farms
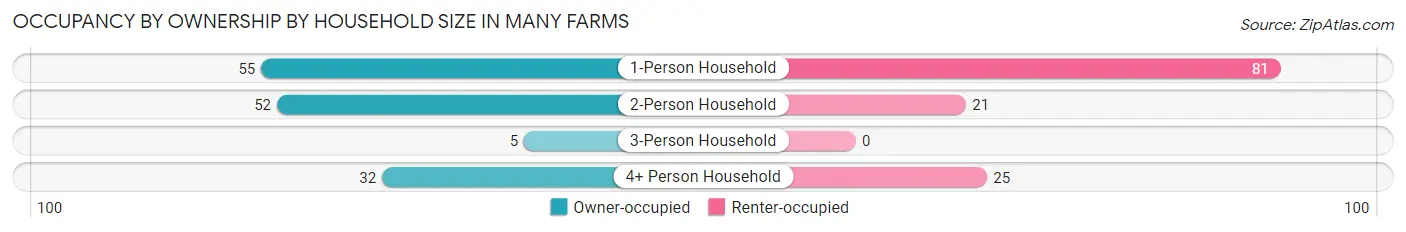
| Household Size | Owner-occupied | Renter-occupied |
| 1-Person Household | 55 (40.4%) | 81 (59.6%) |
| 2-Person Household | 52 (71.2%) | 21 (28.8%) |
| 3-Person Household | 5 (100.0%) | 0 (0.0%) |
| 4+ Person Household | 32 (56.1%) | 25 (43.9%) |
| Total Housing Units | 144 (53.1%) | 127 (46.9%) |
Occupancy by Educational Attainment in Many Farms
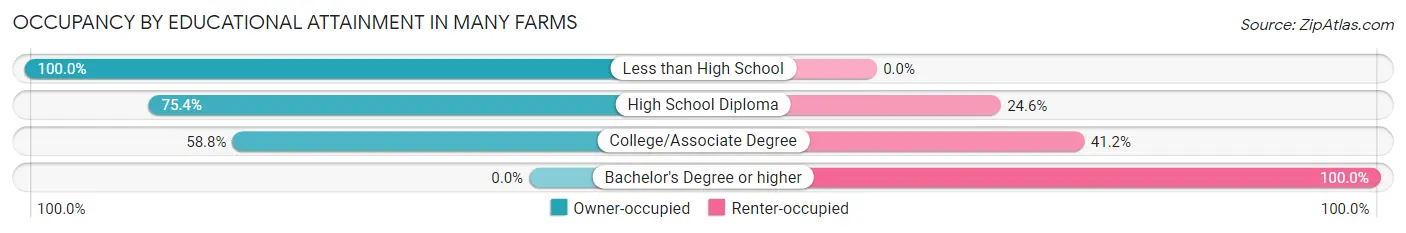
| Household Size | Owner-occupied | Renter-occupied |
| Less than High School | 48 (100.0%) | 0 (0.0%) |
| High School Diploma | 46 (75.4%) | 15 (24.6%) |
| College/Associate Degree | 50 (58.8%) | 35 (41.2%) |
| Bachelor's Degree or higher | 0 (0.0%) | 77 (100.0%) |
Occupancy by Age of Householder in Many Farms
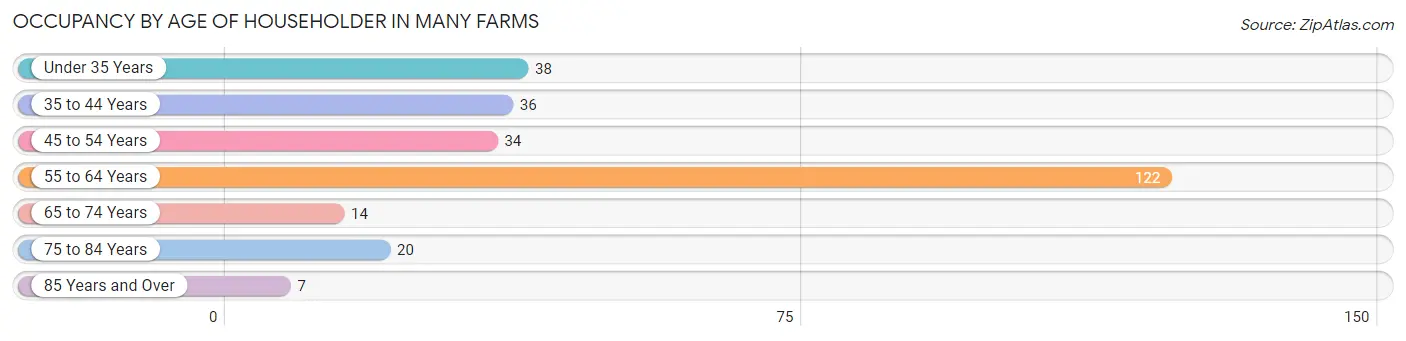
| Age Bracket | # Households | % Households |
| Under 35 Years | 38 | 14.0% |
| 35 to 44 Years | 36 | 13.3% |
| 45 to 54 Years | 34 | 12.6% |
| 55 to 64 Years | 122 | 45.0% |
| 65 to 74 Years | 14 | 5.2% |
| 75 to 84 Years | 20 | 7.4% |
| 85 Years and Over | 7 | 2.6% |
| Total | 271 | 100.0% |
Housing Finances in Many Farms
Median Income by Occupancy in Many Farms
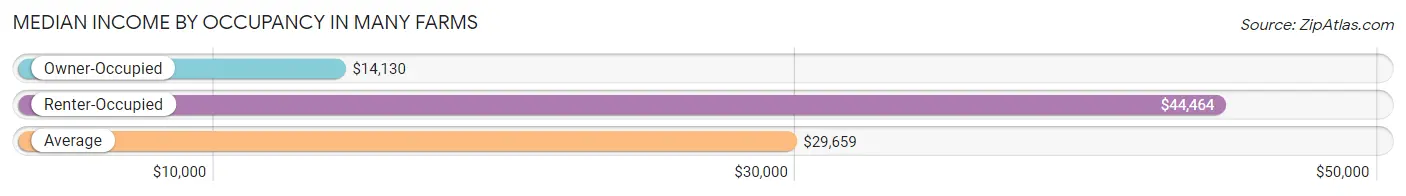
| Occupancy Type | # Households | Median Income |
| Owner-Occupied | 144 (53.1%) | $14,130 |
| Renter-Occupied | 127 (46.9%) | $44,464 |
| Average | 271 (100.0%) | $29,659 |
Occupancy by Householder Income Bracket in Many Farms
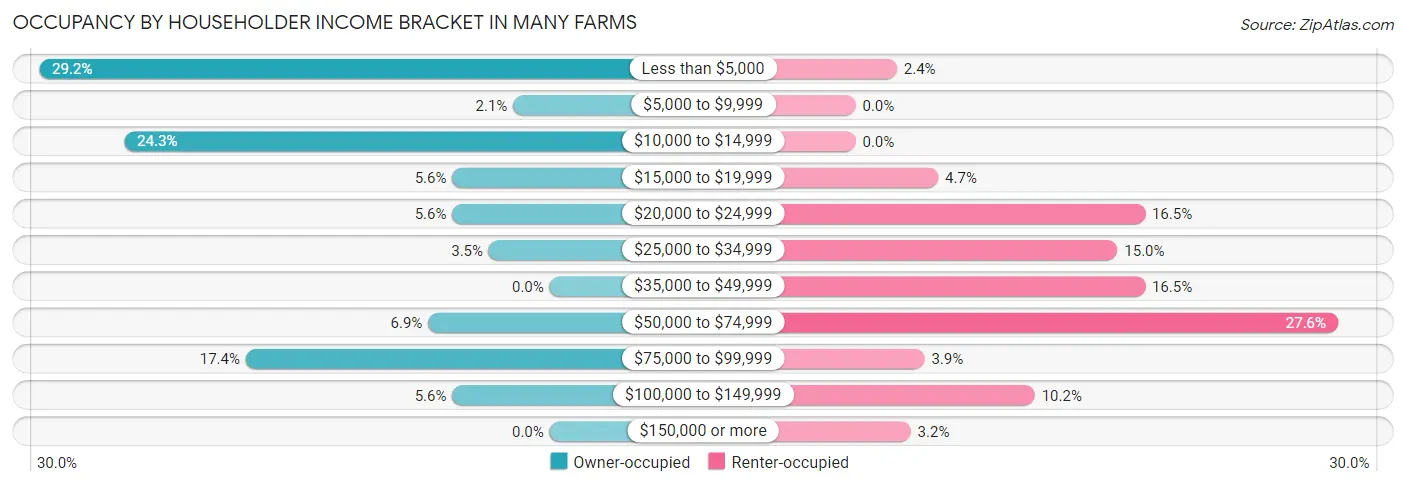
| Income Bracket | Owner-occupied | Renter-occupied |
| Less than $5,000 | 42 (29.2%) | 3 (2.4%) |
| $5,000 to $9,999 | 3 (2.1%) | 0 (0.0%) |
| $10,000 to $14,999 | 35 (24.3%) | 0 (0.0%) |
| $15,000 to $19,999 | 8 (5.6%) | 6 (4.7%) |
| $20,000 to $24,999 | 8 (5.6%) | 21 (16.5%) |
| $25,000 to $34,999 | 5 (3.5%) | 19 (15.0%) |
| $35,000 to $49,999 | 0 (0.0%) | 21 (16.5%) |
| $50,000 to $74,999 | 10 (6.9%) | 35 (27.6%) |
| $75,000 to $99,999 | 25 (17.4%) | 5 (3.9%) |
| $100,000 to $149,999 | 8 (5.6%) | 13 (10.2%) |
| $150,000 or more | 0 (0.0%) | 4 (3.2%) |
| Total | 144 (100.0%) | 127 (100.0%) |
Monthly Housing Cost Tiers in Many Farms
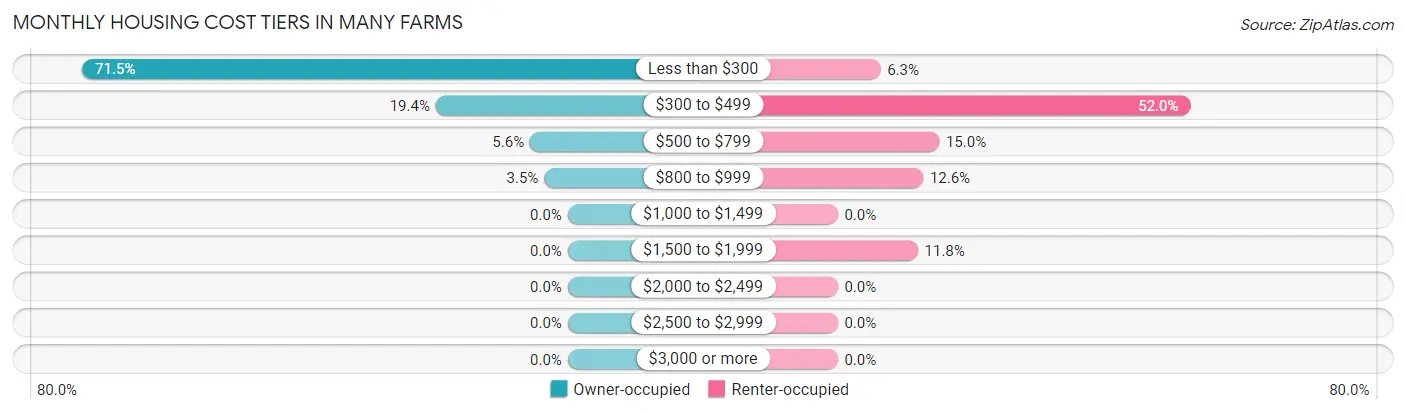
| Monthly Cost | Owner-occupied | Renter-occupied |
| Less than $300 | 103 (71.5%) | 8 (6.3%) |
| $300 to $499 | 28 (19.4%) | 66 (52.0%) |
| $500 to $799 | 8 (5.6%) | 19 (15.0%) |
| $800 to $999 | 5 (3.5%) | 16 (12.6%) |
| $1,000 to $1,499 | 0 (0.0%) | 0 (0.0%) |
| $1,500 to $1,999 | 0 (0.0%) | 15 (11.8%) |
| $2,000 to $2,499 | 0 (0.0%) | 0 (0.0%) |
| $2,500 to $2,999 | 0 (0.0%) | 0 (0.0%) |
| $3,000 or more | 0 (0.0%) | 0 (0.0%) |
| Total | 144 (100.0%) | 127 (100.0%) |
Physical Housing Characteristics in Many Farms
Housing Structures in Many Farms
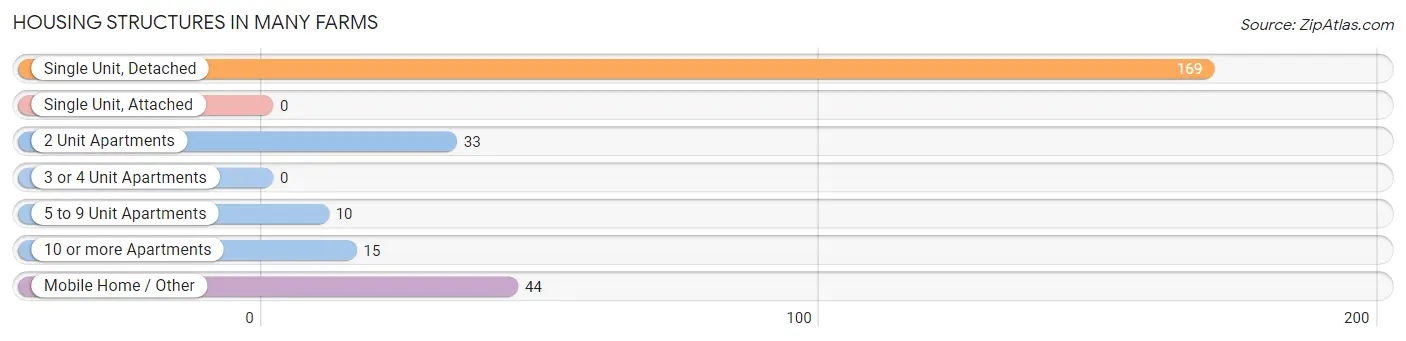
| Structure Type | # Housing Units | % Housing Units |
| Single Unit, Detached | 169 | 62.4% |
| Single Unit, Attached | 0 | 0.0% |
| 2 Unit Apartments | 33 | 12.2% |
| 3 or 4 Unit Apartments | 0 | 0.0% |
| 5 to 9 Unit Apartments | 10 | 3.7% |
| 10 or more Apartments | 15 | 5.5% |
| Mobile Home / Other | 44 | 16.2% |
| Total | 271 | 100.0% |
Housing Structures by Occupancy in Many Farms
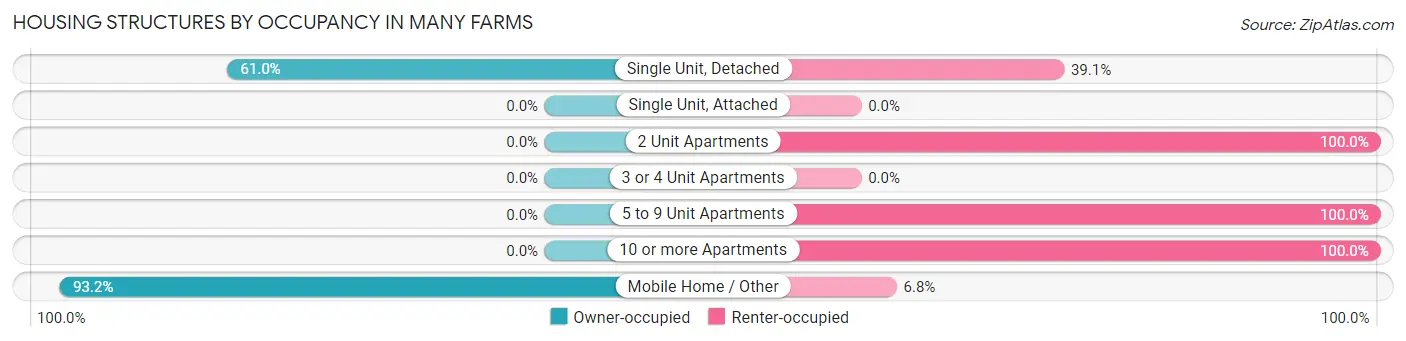
| Structure Type | Owner-occupied | Renter-occupied |
| Single Unit, Detached | 103 (61.0%) | 66 (39.1%) |
| Single Unit, Attached | 0 (0.0%) | 0 (0.0%) |
| 2 Unit Apartments | 0 (0.0%) | 33 (100.0%) |
| 3 or 4 Unit Apartments | 0 (0.0%) | 0 (0.0%) |
| 5 to 9 Unit Apartments | 0 (0.0%) | 10 (100.0%) |
| 10 or more Apartments | 0 (0.0%) | 15 (100.0%) |
| Mobile Home / Other | 41 (93.2%) | 3 (6.8%) |
| Total | 144 (53.1%) | 127 (46.9%) |
Housing Structures by Number of Rooms in Many Farms
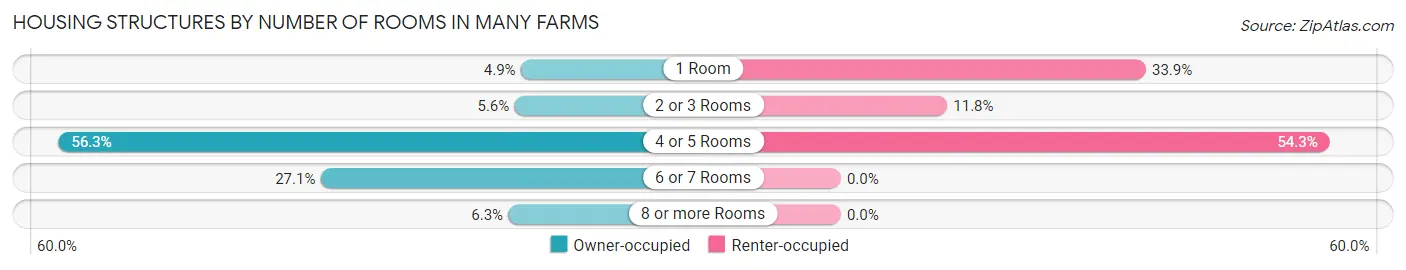
| Number of Rooms | Owner-occupied | Renter-occupied |
| 1 Room | 7 (4.9%) | 43 (33.9%) |
| 2 or 3 Rooms | 8 (5.6%) | 15 (11.8%) |
| 4 or 5 Rooms | 81 (56.2%) | 69 (54.3%) |
| 6 or 7 Rooms | 39 (27.1%) | 0 (0.0%) |
| 8 or more Rooms | 9 (6.2%) | 0 (0.0%) |
| Total | 144 (100.0%) | 127 (100.0%) |
Housing Structure by Heating Type in Many Farms
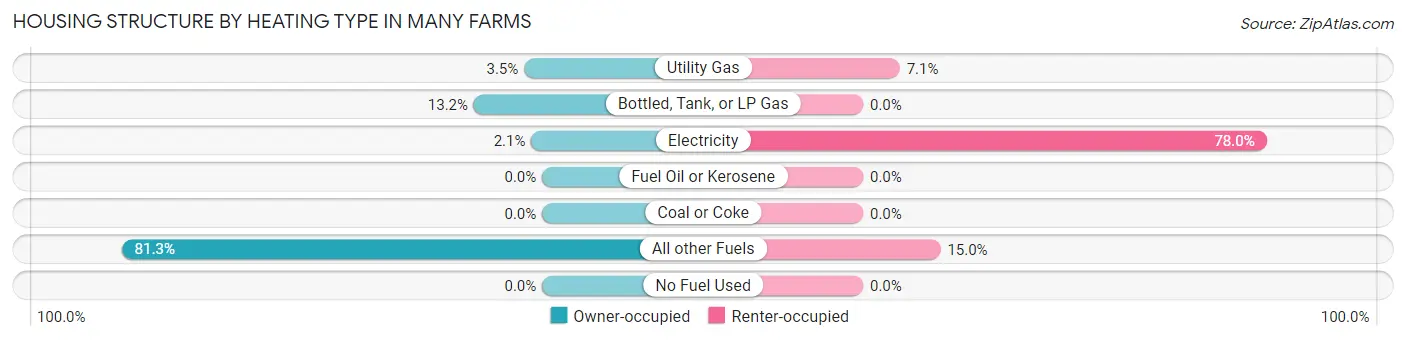
| Heating Type | Owner-occupied | Renter-occupied |
| Utility Gas | 5 (3.5%) | 9 (7.1%) |
| Bottled, Tank, or LP Gas | 19 (13.2%) | 0 (0.0%) |
| Electricity | 3 (2.1%) | 99 (77.9%) |
| Fuel Oil or Kerosene | 0 (0.0%) | 0 (0.0%) |
| Coal or Coke | 0 (0.0%) | 0 (0.0%) |
| All other Fuels | 117 (81.2%) | 19 (15.0%) |
| No Fuel Used | 0 (0.0%) | 0 (0.0%) |
| Total | 144 (100.0%) | 127 (100.0%) |
Household Vehicle Usage in Many Farms
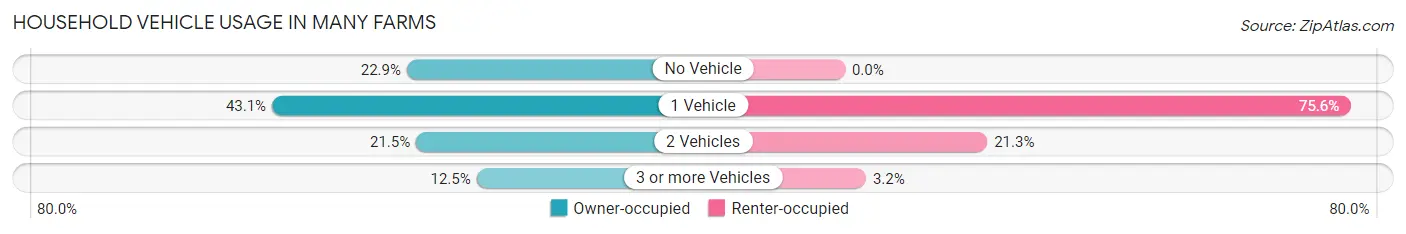
| Vehicles per Household | Owner-occupied | Renter-occupied |
| No Vehicle | 33 (22.9%) | 0 (0.0%) |
| 1 Vehicle | 62 (43.1%) | 96 (75.6%) |
| 2 Vehicles | 31 (21.5%) | 27 (21.3%) |
| 3 or more Vehicles | 18 (12.5%) | 4 (3.2%) |
| Total | 144 (100.0%) | 127 (100.0%) |
Real Estate & Mortgages in Many Farms
Real Estate and Mortgage Overview in Many Farms
| Characteristic | Without Mortgage | With Mortgage |
| Housing Units | 144 | 0 |
| Median Property Value | $42,200 | $0 |
| Median Household Income | $14,130 | $0 |
| Monthly Housing Costs | $200 | $0 |
| Real Estate Taxes | - | - |
Property Value by Mortgage Status in Many Farms
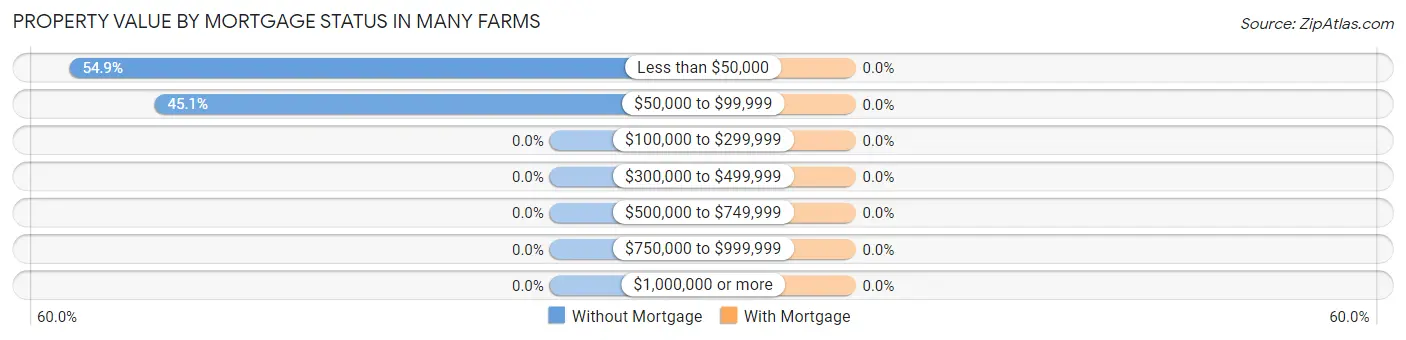
| Property Value | Without Mortgage | With Mortgage |
| Less than $50,000 | 79 (54.9%) | 0 (0.0%) |
| $50,000 to $99,999 | 65 (45.1%) | 0 (0.0%) |
| $100,000 to $299,999 | 0 (0.0%) | 0 (0.0%) |
| $300,000 to $499,999 | 0 (0.0%) | 0 (0.0%) |
| $500,000 to $749,999 | 0 (0.0%) | 0 (0.0%) |
| $750,000 to $999,999 | 0 (0.0%) | 0 (0.0%) |
| $1,000,000 or more | 0 (0.0%) | 0 (0.0%) |
| Total | 144 (100.0%) | 0 (0.0%) |
Household Income by Mortgage Status in Many Farms
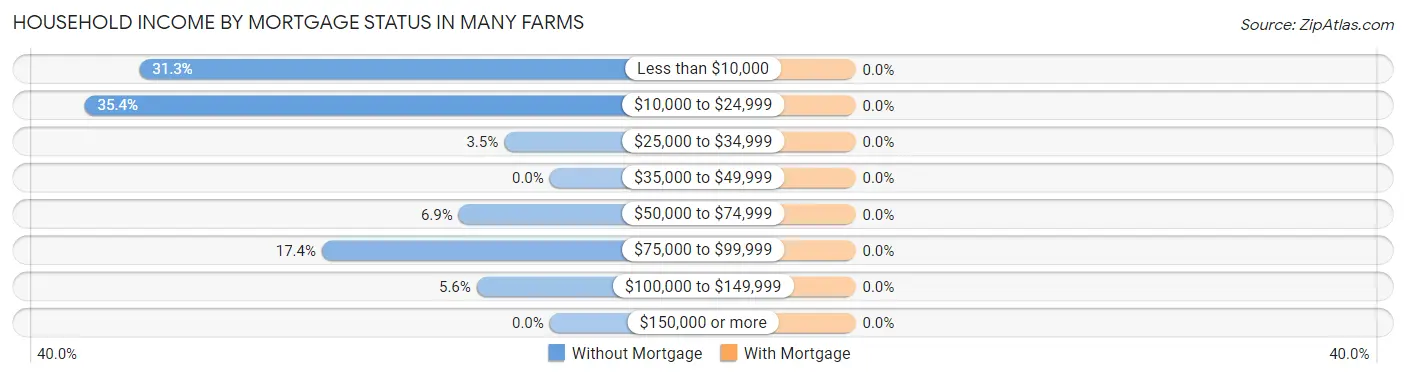
| Household Income | Without Mortgage | With Mortgage |
| Less than $10,000 | 45 (31.2%) | 0 (0.0%) |
| $10,000 to $24,999 | 51 (35.4%) | 0 (0.0%) |
| $25,000 to $34,999 | 5 (3.5%) | 0 (0.0%) |
| $35,000 to $49,999 | 0 (0.0%) | 0 (0.0%) |
| $50,000 to $74,999 | 10 (6.9%) | 0 (0.0%) |
| $75,000 to $99,999 | 25 (17.4%) | 0 (0.0%) |
| $100,000 to $149,999 | 8 (5.6%) | 0 (0.0%) |
| $150,000 or more | 0 (0.0%) | 0 (0.0%) |
| Total | 144 (100.0%) | 0 (0.0%) |
Property Value to Household Income Ratio in Many Farms
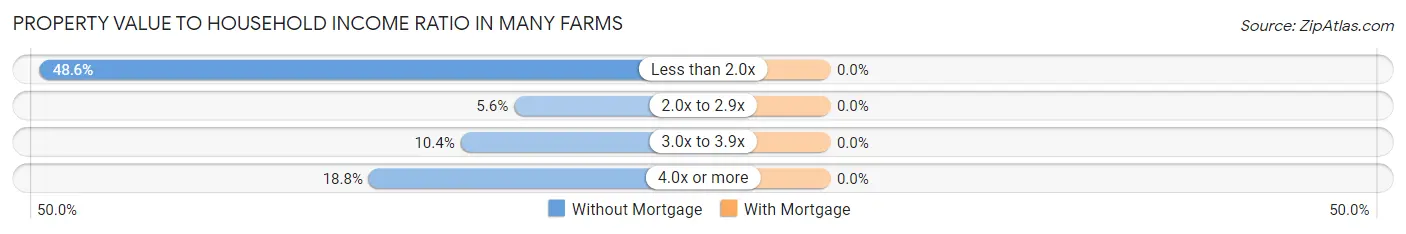
| Value-to-Income Ratio | Without Mortgage | With Mortgage |
| Less than 2.0x | 70 (48.6%) | 0 (0.0%) |
| 2.0x to 2.9x | 8 (5.6%) | 0 (0.0%) |
| 3.0x to 3.9x | 15 (10.4%) | 0 (0.0%) |
| 4.0x or more | 27 (18.8%) | 0 (0.0%) |
| Total | 144 (100.0%) | 0 (0.0%) |
Real Estate Taxes by Mortgage Status in Many Farms
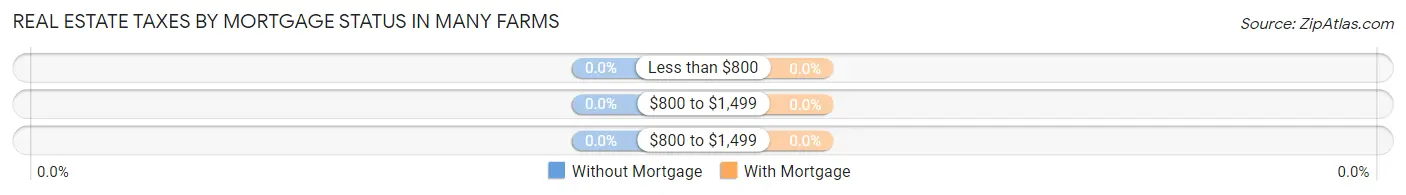
| Property Taxes | Without Mortgage | With Mortgage |
| Less than $800 | 0 (0.0%) | 0 (0.0%) |
| $800 to $1,499 | 0 (0.0%) | 0 (0.0%) |
| $800 to $1,499 | 0 (0.0%) | 0 (0.0%) |
| Total | 144 (100.0%) | 0 (0.0%) |
Health & Disability in Many Farms
Health Insurance Coverage by Age in Many Farms
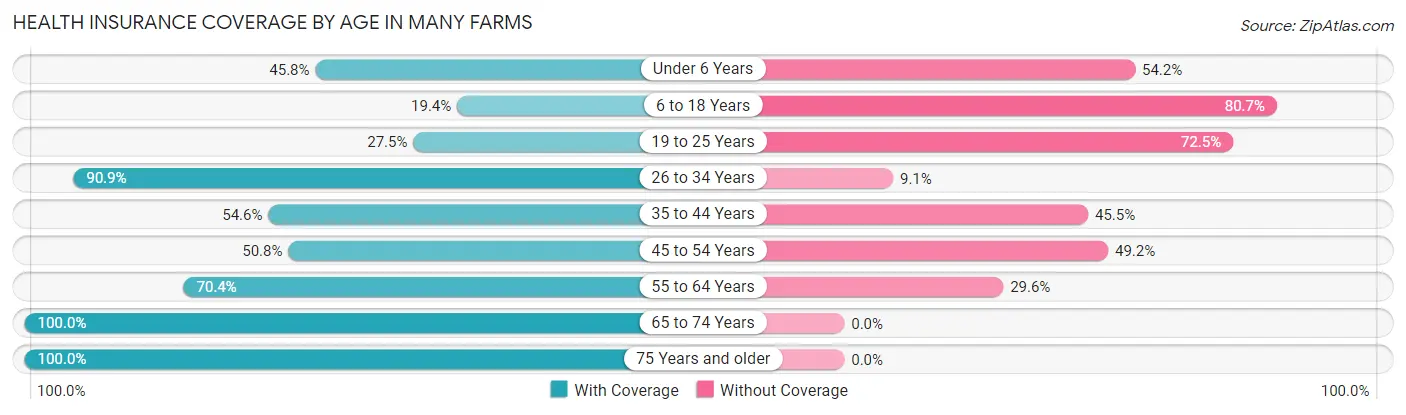
| Age Bracket | With Coverage | Without Coverage |
| Under 6 Years | 38 (45.8%) | 45 (54.2%) |
| 6 to 18 Years | 6 (19.4%) | 25 (80.6%) |
| 19 to 25 Years | 30 (27.5%) | 79 (72.5%) |
| 26 to 34 Years | 70 (90.9%) | 7 (9.1%) |
| 35 to 44 Years | 66 (54.5%) | 55 (45.5%) |
| 45 to 54 Years | 31 (50.8%) | 30 (49.2%) |
| 55 to 64 Years | 114 (70.4%) | 48 (29.6%) |
| 65 to 74 Years | 14 (100.0%) | 0 (0.0%) |
| 75 Years and older | 30 (100.0%) | 0 (0.0%) |
| Total | 399 (58.0%) | 289 (42.0%) |
Health Insurance Coverage by Citizenship Status in Many Farms
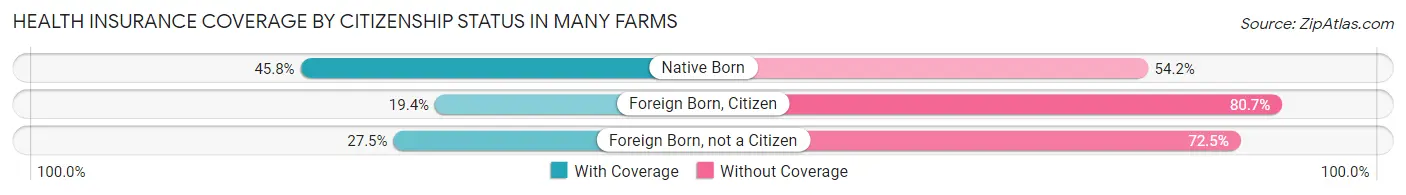
| Citizenship Status | With Coverage | Without Coverage |
| Native Born | 38 (45.8%) | 45 (54.2%) |
| Foreign Born, Citizen | 6 (19.4%) | 25 (80.6%) |
| Foreign Born, not a Citizen | 30 (27.5%) | 79 (72.5%) |
Health Insurance Coverage by Household Income in Many Farms
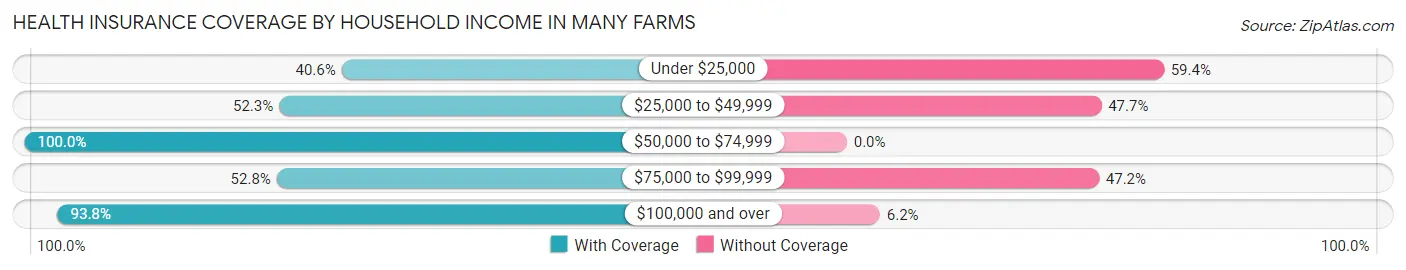
| Household Income | With Coverage | Without Coverage |
| Under $25,000 | 117 (40.6%) | 171 (59.4%) |
| $25,000 to $49,999 | 45 (52.3%) | 41 (47.7%) |
| $50,000 to $74,999 | 52 (100.0%) | 0 (0.0%) |
| $75,000 to $99,999 | 76 (52.8%) | 68 (47.2%) |
| $100,000 and over | 106 (93.8%) | 7 (6.2%) |
Public vs Private Health Insurance Coverage by Age in Many Farms
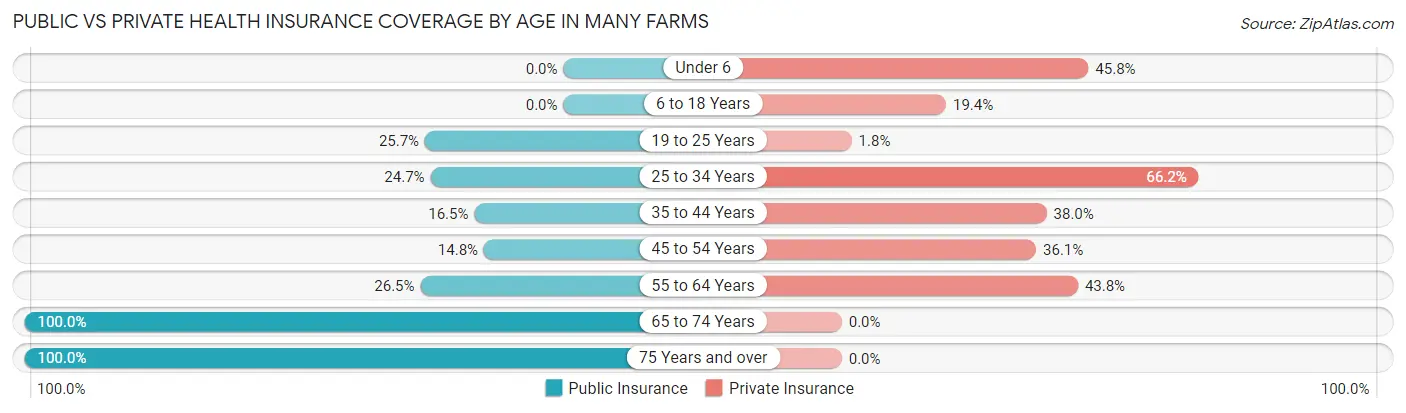
| Age Bracket | Public Insurance | Private Insurance |
| Under 6 | 0 (0.0%) | 38 (45.8%) |
| 6 to 18 Years | 0 (0.0%) | 6 (19.4%) |
| 19 to 25 Years | 28 (25.7%) | 2 (1.8%) |
| 25 to 34 Years | 19 (24.7%) | 51 (66.2%) |
| 35 to 44 Years | 20 (16.5%) | 46 (38.0%) |
| 45 to 54 Years | 9 (14.7%) | 22 (36.1%) |
| 55 to 64 Years | 43 (26.5%) | 71 (43.8%) |
| 65 to 74 Years | 14 (100.0%) | 0 (0.0%) |
| 75 Years and over | 30 (100.0%) | 0 (0.0%) |
| Total | 163 (23.7%) | 236 (34.3%) |
Disability Status by Sex by Age in Many Farms
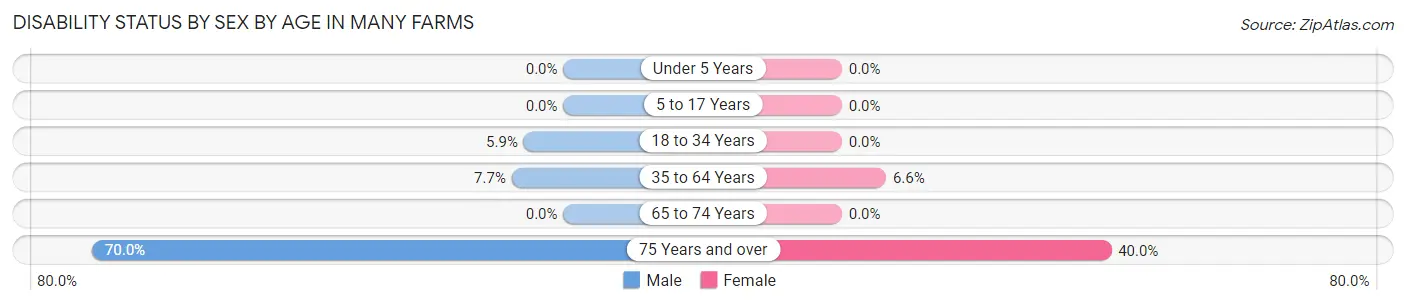
| Age Bracket | Male | Female |
| Under 5 Years | 0 (0.0%) | 0 (0.0%) |
| 5 to 17 Years | 0 (0.0%) | 0 (0.0%) |
| 18 to 34 Years | 7 (5.9%) | 0 (0.0%) |
| 35 to 64 Years | 17 (7.7%) | 8 (6.6%) |
| 65 to 74 Years | 0 (0.0%) | 0 (0.0%) |
| 75 Years and over | 14 (70.0%) | 4 (40.0%) |
Disability Class by Sex by Age in Many Farms
Disability Class: Hearing Difficulty
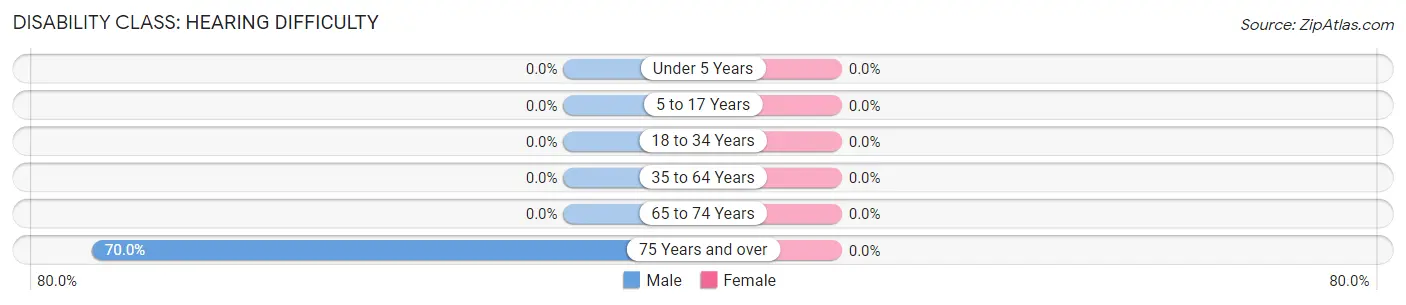
| Age Bracket | Male | Female |
| Under 5 Years | 0 (0.0%) | 0 (0.0%) |
| 5 to 17 Years | 0 (0.0%) | 0 (0.0%) |
| 18 to 34 Years | 0 (0.0%) | 0 (0.0%) |
| 35 to 64 Years | 0 (0.0%) | 0 (0.0%) |
| 65 to 74 Years | 0 (0.0%) | 0 (0.0%) |
| 75 Years and over | 14 (70.0%) | 0 (0.0%) |
Disability Class: Vision Difficulty
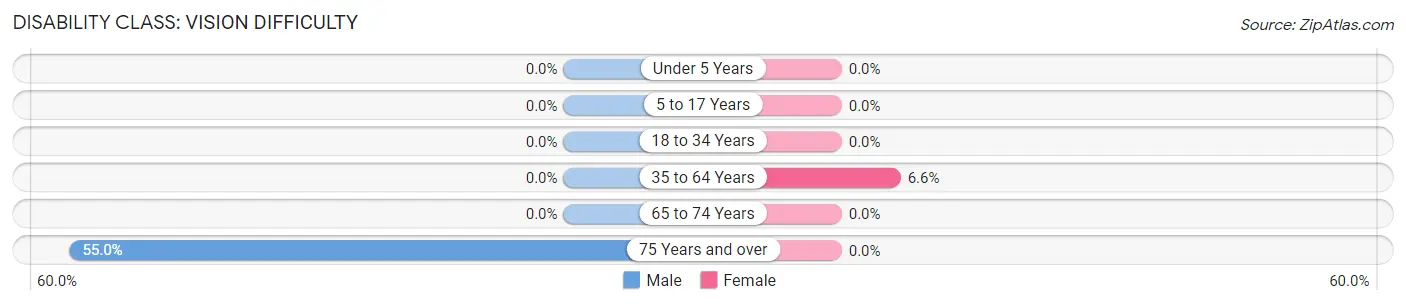
| Age Bracket | Male | Female |
| Under 5 Years | 0 (0.0%) | 0 (0.0%) |
| 5 to 17 Years | 0 (0.0%) | 0 (0.0%) |
| 18 to 34 Years | 0 (0.0%) | 0 (0.0%) |
| 35 to 64 Years | 0 (0.0%) | 8 (6.6%) |
| 65 to 74 Years | 0 (0.0%) | 0 (0.0%) |
| 75 Years and over | 11 (55.0%) | 0 (0.0%) |
Disability Class: Cognitive Difficulty
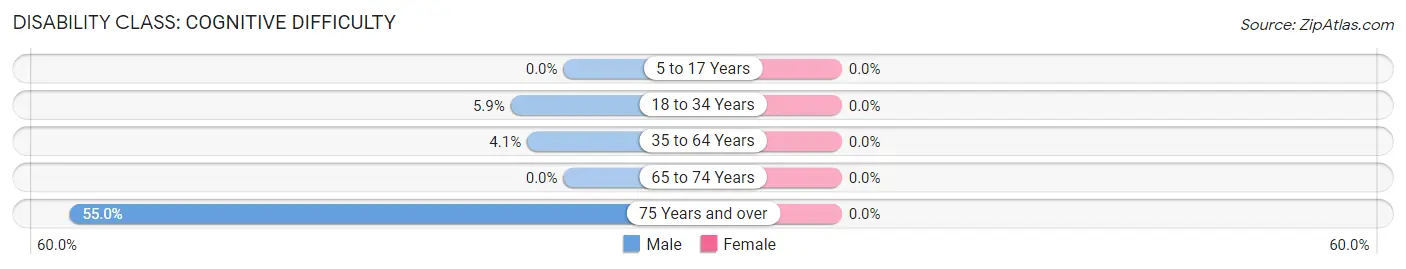
| Age Bracket | Male | Female |
| 5 to 17 Years | 0 (0.0%) | 0 (0.0%) |
| 18 to 34 Years | 7 (5.9%) | 0 (0.0%) |
| 35 to 64 Years | 9 (4.1%) | 0 (0.0%) |
| 65 to 74 Years | 0 (0.0%) | 0 (0.0%) |
| 75 Years and over | 11 (55.0%) | 0 (0.0%) |
Disability Class: Ambulatory Difficulty
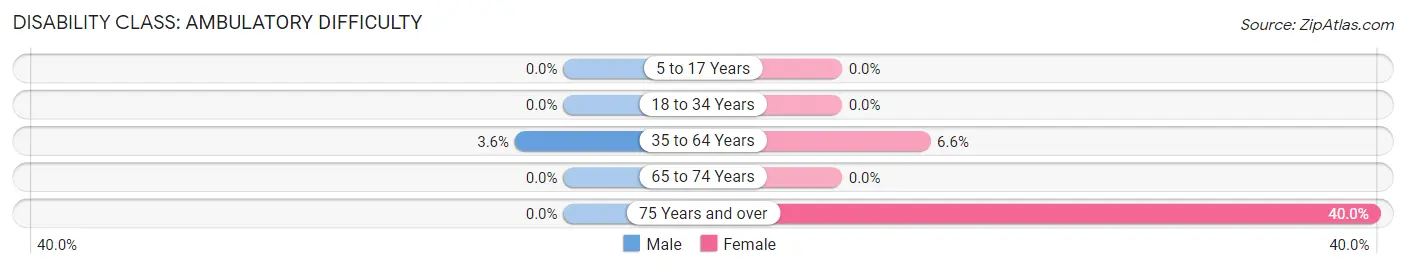
| Age Bracket | Male | Female |
| 5 to 17 Years | 0 (0.0%) | 0 (0.0%) |
| 18 to 34 Years | 0 (0.0%) | 0 (0.0%) |
| 35 to 64 Years | 8 (3.6%) | 8 (6.6%) |
| 65 to 74 Years | 0 (0.0%) | 0 (0.0%) |
| 75 Years and over | 0 (0.0%) | 4 (40.0%) |
Disability Class: Self-Care Difficulty
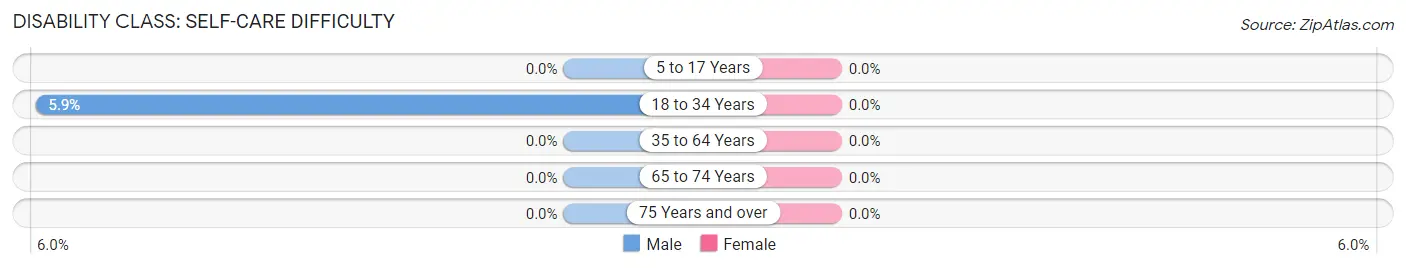
| Age Bracket | Male | Female |
| 5 to 17 Years | 0 (0.0%) | 0 (0.0%) |
| 18 to 34 Years | 7 (5.9%) | 0 (0.0%) |
| 35 to 64 Years | 0 (0.0%) | 0 (0.0%) |
| 65 to 74 Years | 0 (0.0%) | 0 (0.0%) |
| 75 Years and over | 0 (0.0%) | 0 (0.0%) |
Technology Access in Many Farms
Computing Device Access in Many Farms
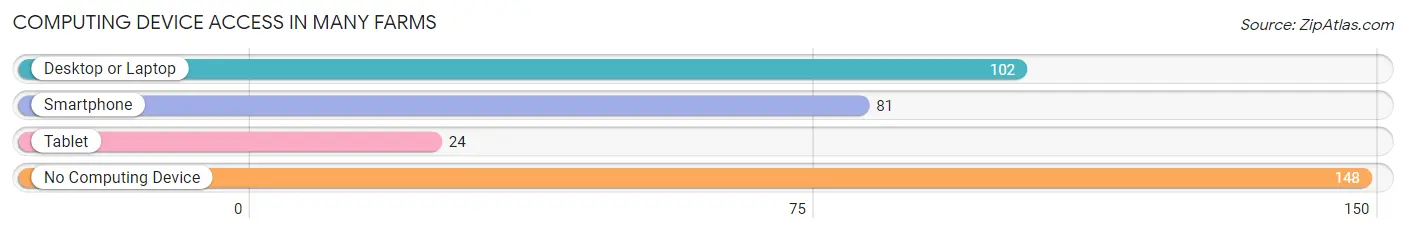
| Device Type | # Households | % Households |
| Desktop or Laptop | 102 | 37.6% |
| Smartphone | 81 | 29.9% |
| Tablet | 24 | 8.9% |
| No Computing Device | 148 | 54.6% |
| Total | 271 | 100.0% |
Internet Access in Many Farms
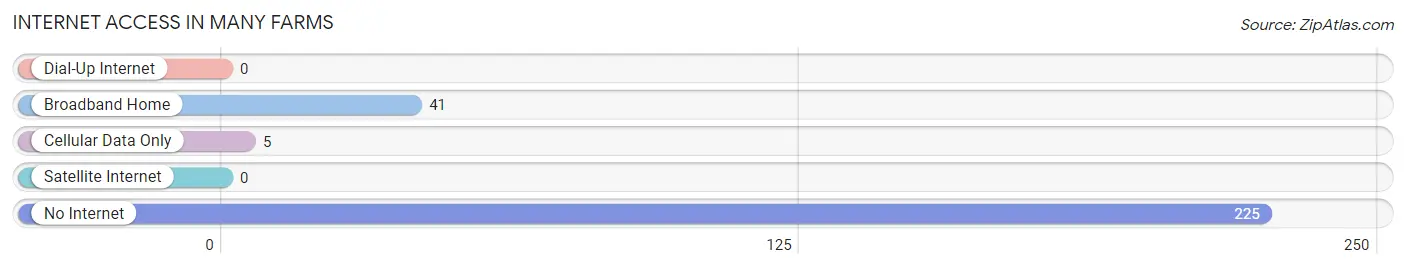
| Internet Type | # Households | % Households |
| Dial-Up Internet | 0 | 0.0% |
| Broadband Home | 41 | 15.1% |
| Cellular Data Only | 5 | 1.8% |
| Satellite Internet | 0 | 0.0% |
| No Internet | 225 | 83.0% |
| Total | 271 | 100.0% |
Many Farms Summary
Many Farms is a small unincorporated community located in Apache County, Arizona. It is situated in the Navajo Nation, approximately 20 miles east of Chinle, Arizona. The population of Many Farms was 1,092 at the 2010 census.
History
Many Farms was established in the late 19th century by Navajo families who were relocated from their traditional homelands in the Four Corners area. The name of the community is derived from the Navajo phrase “T’áá hwó’ ajít’éego” which translates to “many farms”. The community was originally a farming and ranching settlement, and the area was used for grazing sheep and cattle.
In the early 20th century, the Bureau of Indian Affairs (BIA) established a school in Many Farms. The school was initially a day school, but it was later expanded to include a boarding school. The school was operated by the BIA until the 1950s, when it was taken over by the Navajo Nation.
Geography
Many Farms is located in the Navajo Nation, in the northeastern corner of Apache County. It is situated at an elevation of 5,890 feet, and is surrounded by the Chuska Mountains to the east and the Defiance Plateau to the west. The community is located approximately 20 miles east of Chinle, Arizona, and is accessible via U.S. Route 191.
Economy
The economy of Many Farms is largely based on agriculture and ranching. The community is home to several farms and ranches, which produce a variety of crops, including corn, wheat, and hay. Livestock production is also an important part of the local economy, with sheep and cattle being the primary livestock raised in the area.
In addition to agriculture and ranching, Many Farms is home to several small businesses, including convenience stores, restaurants, and a gas station. The community also has a post office, a library, and a health clinic.
Demographics
As of the 2010 census, the population of Many Farms was 1,092. The racial makeup of the community was 97.3% Native American, 0.9% White, 0.3% Asian, and 0.5% from two or more races. The median household income was $20,938, and the median age was 28.7 years.
Conclusion
Many Farms is a small unincorporated community located in Apache County, Arizona. It is situated in the Navajo Nation, and has a population of 1,092. The economy of Many Farms is largely based on agriculture and ranching, and the community is home to several small businesses. The racial makeup of the community is predominantly Native American, and the median household income is $20,938.
Common Questions
What is Per Capita Income in Many Farms?
Per Capita income in Many Farms is $19,849.
What is the Median Household income in Many Farms?
Median Household Income in Many Farms is $29,659.
What is Income or Wage Gap in Many Farms?
Income or Wage Gap in Many Farms is 7.0%.
Women in Many Farms earn 93.0 cents for every dollar earned by a man.
What is Inequality or Gini Index in Many Farms?
Inequality or Gini Index in Many Farms is 0.50.
What is the Total Population of Many Farms?
Total Population of Many Farms is 693.
What is the Total Male Population of Many Farms?
Total Male Population of Many Farms is 461.
What is the Total Female Population of Many Farms?
Total Female Population of Many Farms is 232.
What is the Ratio of Males per 100 Females in Many Farms?
There are 198.71 Males per 100 Females in Many Farms.
What is the Ratio of Females per 100 Males in Many Farms?
There are 50.33 Females per 100 Males in Many Farms.
What is the Median Population Age in Many Farms?
Median Population Age in Many Farms is 37.2 Years.
What is the Average Family Size in Many Farms
Average Family Size in Many Farms is 4.4 People.
What is the Average Household Size in Many Farms
Average Household Size in Many Farms is 2.5 People.
How Large is the Labor Force in Many Farms?
There are 233 People in the Labor Forcein in Many Farms.
What is the Percentage of People in the Labor Force in Many Farms?
40.0% of People are in the Labor Force in Many Farms.
What is the Unemployment Rate in Many Farms?
Unemployment Rate in Many Farms is 1.3%.